Zip Codes with the Highest Percentage of Population Employed in Legal Services & Support in Pasadena, TX
RELATED REPORTS & OPTIONS
Legal Services & Support
Pasadena
Compare Zip Codes
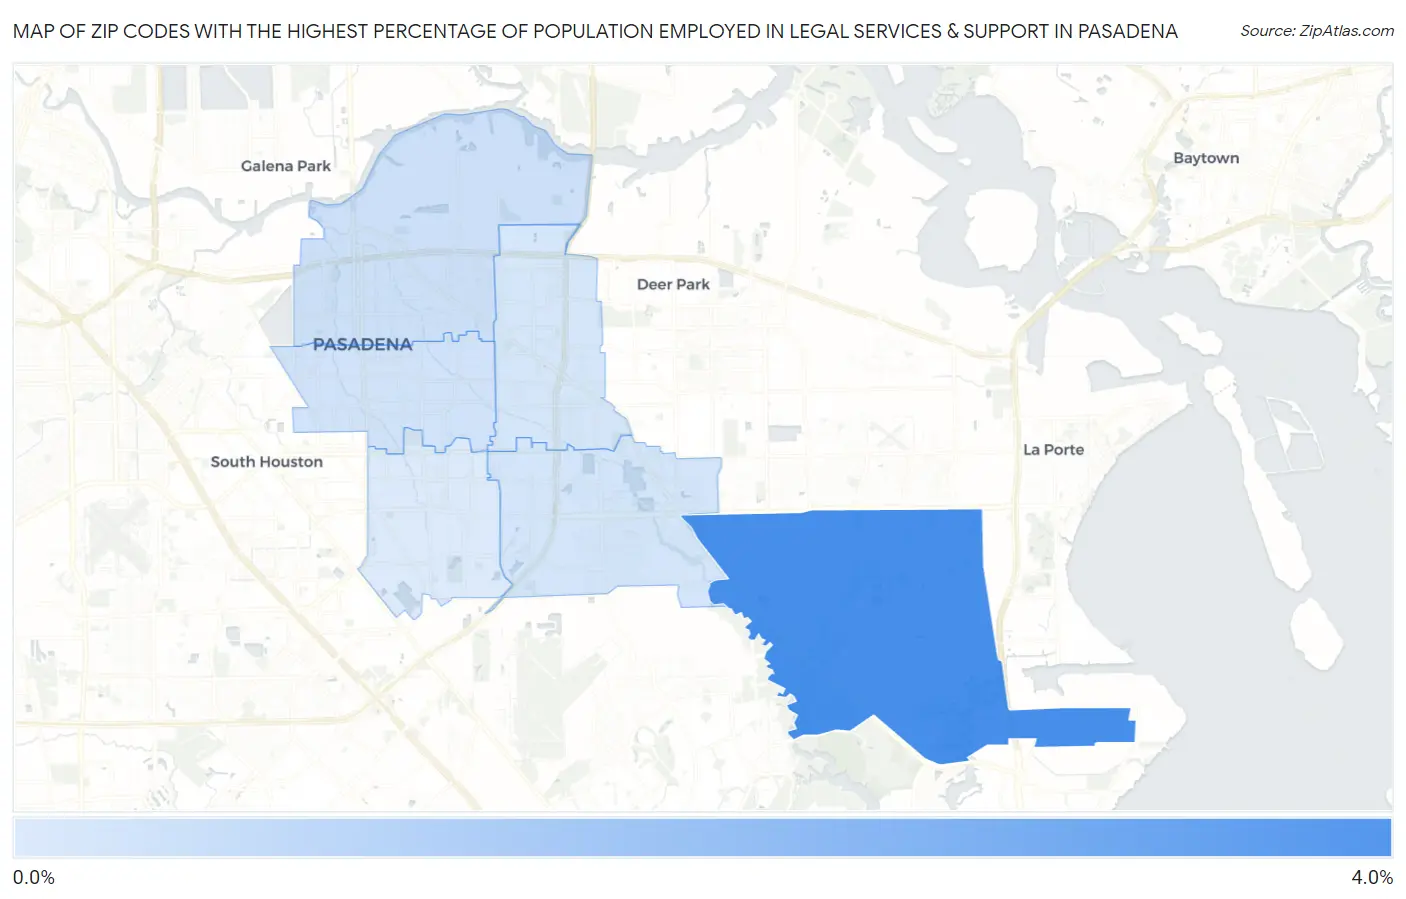
Map of Zip Codes with the Highest Percentage of Population Employed in Legal Services & Support in Pasadena
0.0%
4.0%
Zip Codes with the Highest Percentage of Population Employed in Legal Services & Support in Pasadena, TX
| Zip Code | % Employed | vs State | vs National | |
| 1. | 77507 | 3.8% | 1.0%(+2.84)#58 | 1.2%(+2.66)#1,205 |
| 2. | 77506 | 0.51% | 1.0%(-0.496)#734 | 1.2%(-0.672)#12,468 |
| 3. | 77502 | 0.40% | 1.0%(-0.609)#842 | 1.2%(-0.785)#13,844 |
| 4. | 77505 | 0.33% | 1.0%(-0.674)#899 | 1.2%(-0.850)#14,646 |
| 5. | 77503 | 0.30% | 1.0%(-0.710)#926 | 1.2%(-0.885)#15,061 |
| 6. | 77504 | 0.13% | 1.0%(-0.881)#1,051 | 1.2%(-1.06)#16,893 |
1
Common Questions
What are the Top 5 Zip Codes with the Highest Percentage of Population Employed in Legal Services & Support in Pasadena, TX?
Top 5 Zip Codes with the Highest Percentage of Population Employed in Legal Services & Support in Pasadena, TX are:
What zip code has the Highest Percentage of Population Employed in Legal Services & Support in Pasadena, TX?
77507 has the Highest Percentage of Population Employed in Legal Services & Support in Pasadena, TX with 3.8%.
What is the Percentage of Population Employed in Legal Services & Support in Pasadena, TX?
Percentage of Population Employed in Legal Services & Support in Pasadena is 0.38%.
What is the Percentage of Population Employed in Legal Services & Support in Texas?
Percentage of Population Employed in Legal Services & Support in Texas is 1.0%.
What is the Percentage of Population Employed in Legal Services & Support in the United States?
Percentage of Population Employed in Legal Services & Support in the United States is 1.2%.