Zip Codes with the Highest Percentage of Population Employed in Installation, Maintenance & Repair in Pasadena, TX
RELATED REPORTS & OPTIONS
Installation, Maintenance & Repair
Pasadena
Compare Zip Codes
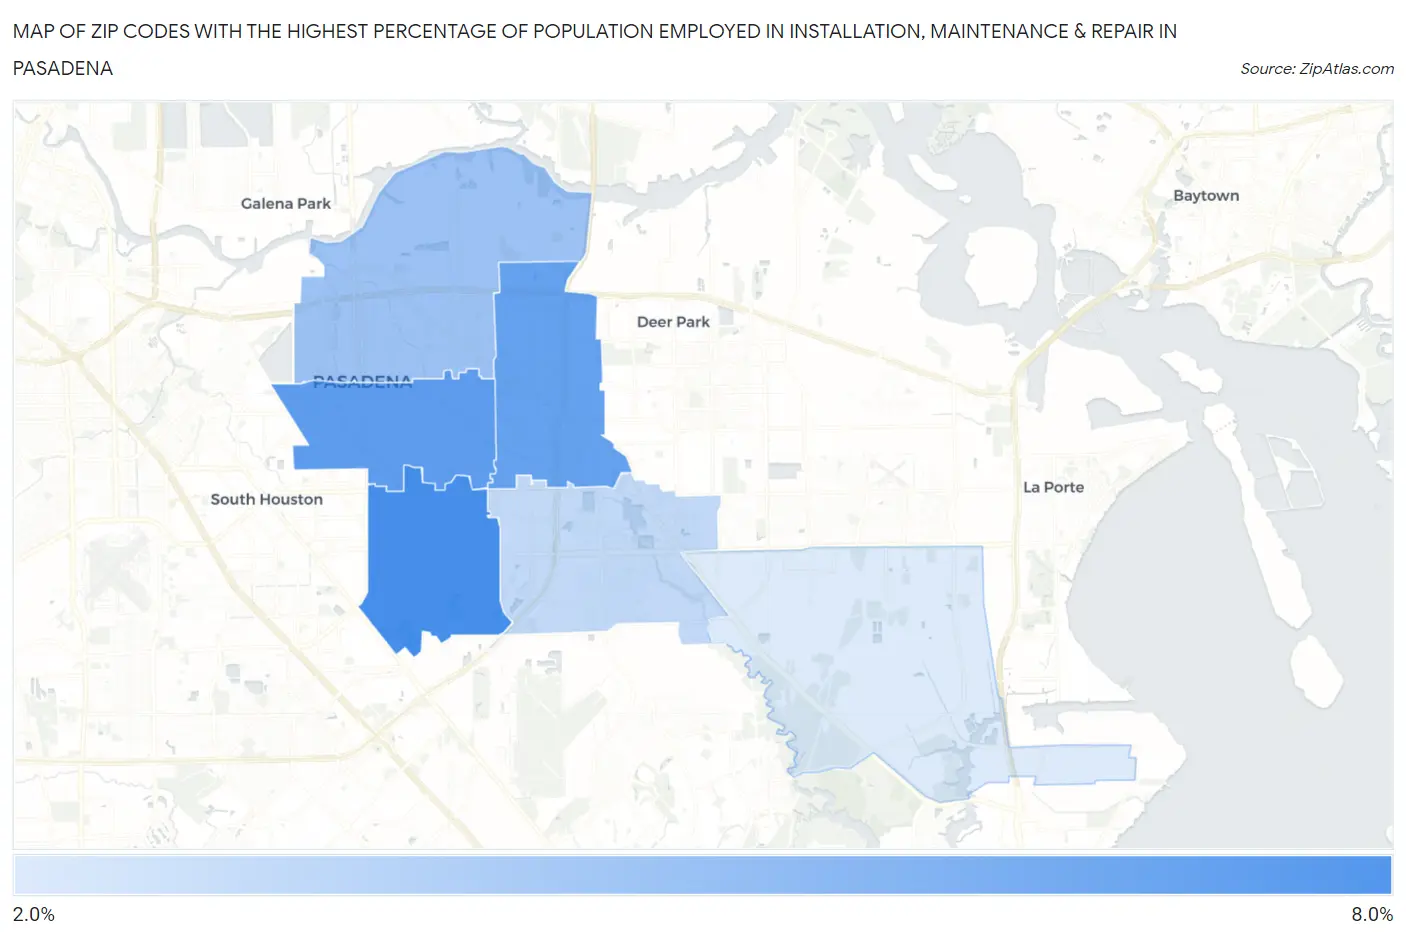
Map of Zip Codes with the Highest Percentage of Population Employed in Installation, Maintenance & Repair in Pasadena
0.0%
8.0%
Zip Codes with the Highest Percentage of Population Employed in Installation, Maintenance & Repair in Pasadena, TX
| Zip Code | % Employed | vs State | vs National | |
| 1. | 77504 | 7.8% | 3.4%(+4.37)#209 | 3.1%(+4.70)#3,558 |
| 2. | 77502 | 6.9% | 3.4%(+3.52)#270 | 3.1%(+3.85)#4,558 |
| 3. | 77503 | 6.6% | 3.4%(+3.24)#287 | 3.1%(+3.58)#4,985 |
| 4. | 77506 | 4.7% | 3.4%(+1.25)#607 | 3.1%(+1.59)#9,834 |
| 5. | 77505 | 3.4% | 3.4%(+0.020)#925 | 3.1%(+0.355)#14,983 |
| 6. | 77507 | 2.4% | 3.4%(-0.974)#1,223 | 3.1%(-0.638)#19,913 |
1
Common Questions
What are the Top 5 Zip Codes with the Highest Percentage of Population Employed in Installation, Maintenance & Repair in Pasadena, TX?
Top 5 Zip Codes with the Highest Percentage of Population Employed in Installation, Maintenance & Repair in Pasadena, TX are:
What zip code has the Highest Percentage of Population Employed in Installation, Maintenance & Repair in Pasadena, TX?
77504 has the Highest Percentage of Population Employed in Installation, Maintenance & Repair in Pasadena, TX with 7.8%.
What is the Percentage of Population Employed in Installation, Maintenance & Repair in Pasadena, TX?
Percentage of Population Employed in Installation, Maintenance & Repair in Pasadena is 5.7%.
What is the Percentage of Population Employed in Installation, Maintenance & Repair in Texas?
Percentage of Population Employed in Installation, Maintenance & Repair in Texas is 3.4%.
What is the Percentage of Population Employed in Installation, Maintenance & Repair in the United States?
Percentage of Population Employed in Installation, Maintenance & Repair in the United States is 3.1%.