Zip Codes with the Highest Percentage of Population with a Degree in Engineering in Pennsylvania
RELATED REPORTS & OPTIONS
Engineering
Pennsylvania
Compare Zip Codes
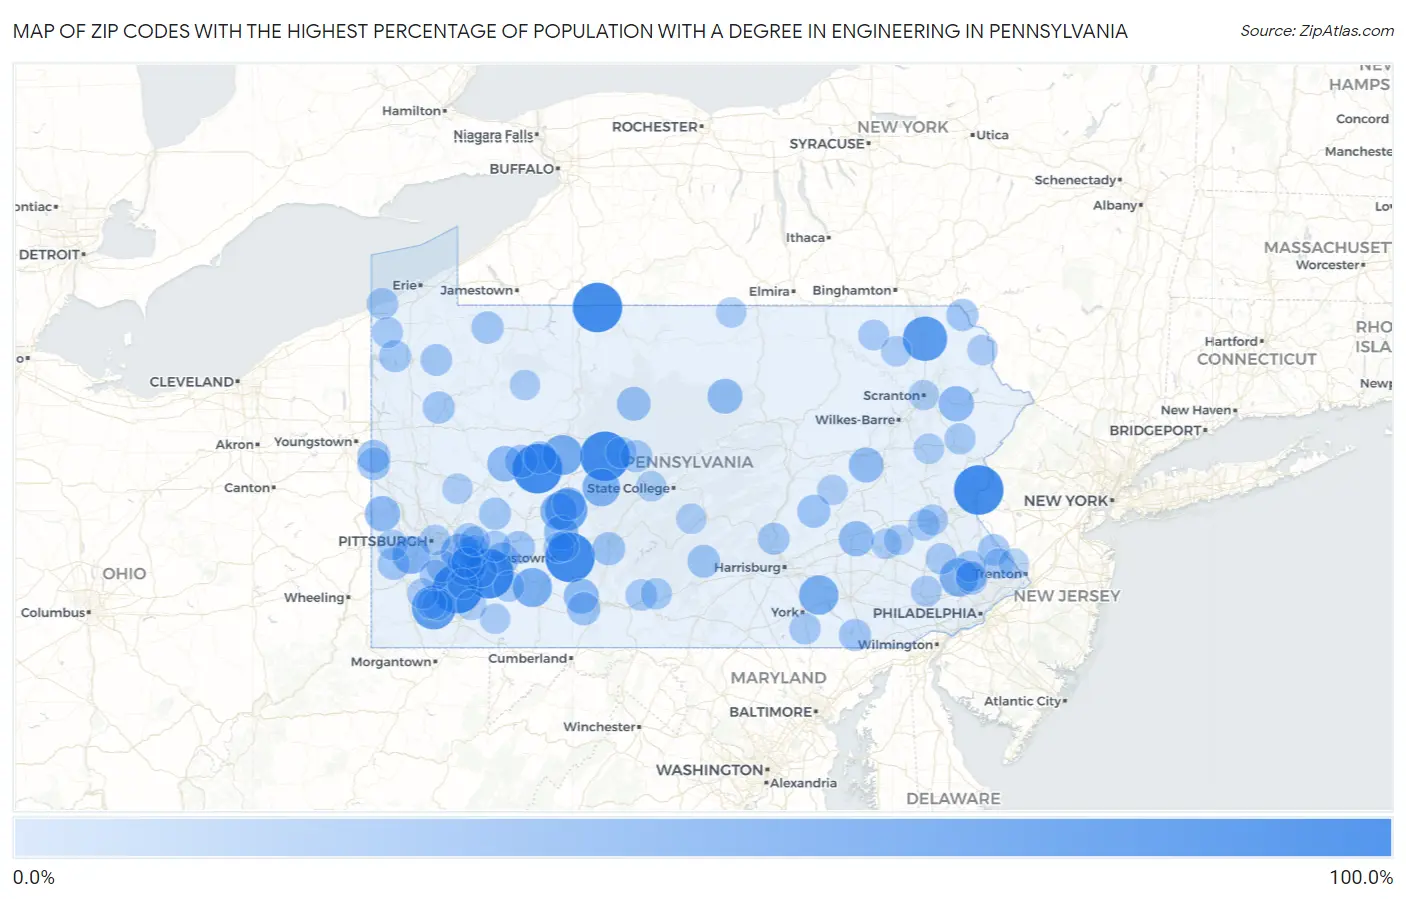
Map of Zip Codes with the Highest Percentage of Population with a Degree in Engineering in Pennsylvania
0.0%
100.0%
Zip Codes with the Highest Percentage of Population with a Degree in Engineering in Pennsylvania
| Zip Code | % Graduates | vs State | vs National | |
| 1. | 15951 | 100.0% | 6.7%(+93.3)#1 | 7.6%(+92.4)#7 |
| 2. | 16843 | 100.0% | 6.7%(+93.3)#2 | 7.6%(+92.4)#11 |
| 3. | 18063 | 100.0% | 6.7%(+93.3)#3 | 7.6%(+92.4)#16 |
| 4. | 16727 | 100.0% | 6.7%(+93.3)#4 | 7.6%(+92.4)#19 |
| 5. | 15492 | 100.0% | 6.7%(+93.3)#5 | 7.6%(+92.4)#27 |
| 6. | 15689 | 100.0% | 6.7%(+93.3)#6 | 7.6%(+92.4)#37 |
| 7. | 15780 | 100.0% | 6.7%(+93.3)#7 | 7.6%(+92.4)#38 |
| 8. | 18820 | 76.9% | 6.7%(+70.2)#8 | 7.6%(+69.3)#58 |
| 9. | 15450 | 74.2% | 6.7%(+67.5)#9 | 7.6%(+66.6)#63 |
| 10. | 15760 | 66.7% | 6.7%(+59.9)#10 | 7.6%(+59.0)#78 |
| 11. | 15863 | 57.1% | 6.7%(+50.4)#11 | 7.6%(+49.5)#99 |
| 12. | 17550 | 53.1% | 6.7%(+46.4)#12 | 7.6%(+45.5)#113 |
| 13. | 15544 | 52.3% | 6.7%(+45.5)#13 | 7.6%(+44.6)#119 |
| 14. | 15625 | 50.0% | 6.7%(+43.3)#14 | 7.6%(+42.4)#141 |
| 15. | 19490 | 48.3% | 6.7%(+41.5)#15 | 7.6%(+40.6)#149 |
| 16. | 15031 | 46.0% | 6.7%(+39.3)#16 | 7.6%(+38.4)#166 |
| 17. | 15615 | 45.9% | 6.7%(+39.2)#17 | 7.6%(+38.3)#167 |
| 18. | 16645 | 45.5% | 6.7%(+38.7)#18 | 7.6%(+37.8)#170 |
| 19. | 15710 | 42.5% | 6.7%(+35.8)#19 | 7.6%(+34.9)#195 |
| 20. | 15611 | 40.0% | 6.7%(+33.3)#20 | 7.6%(+32.4)#217 |
| 21. | 16253 | 36.4% | 6.7%(+29.6)#21 | 7.6%(+28.7)#258 |
| 22. | 18463 | 35.7% | 6.7%(+29.0)#22 | 7.6%(+28.1)#265 |
| 23. | 15077 | 35.3% | 6.7%(+28.6)#23 | 7.6%(+27.6)#268 |
| 24. | 19550 | 34.4% | 6.7%(+27.6)#24 | 7.6%(+26.7)#277 |
| 25. | 15559 | 33.6% | 6.7%(+26.8)#25 | 7.6%(+25.9)#288 |
| 26. | 18241 | 33.3% | 6.7%(+26.6)#26 | 7.6%(+25.7)#294 |
| 27. | 17739 | 33.3% | 6.7%(+26.6)#27 | 7.6%(+25.7)#308 |
| 28. | 15960 | 31.8% | 6.7%(+25.1)#28 | 7.6%(+24.2)#334 |
| 29. | 15832 | 28.6% | 6.7%(+21.8)#29 | 7.6%(+20.9)#412 |
| 30. | 15550 | 26.0% | 6.7%(+19.3)#30 | 7.6%(+18.4)#498 |
| 31. | 16665 | 25.9% | 6.7%(+19.1)#31 | 7.6%(+18.2)#509 |
| 32. | 15779 | 25.0% | 6.7%(+18.3)#32 | 7.6%(+17.4)#544 |
| 33. | 15778 | 25.0% | 6.7%(+18.3)#33 | 7.6%(+17.4)#550 |
| 34. | 17968 | 25.0% | 6.7%(+18.3)#34 | 7.6%(+17.4)#553 |
| 35. | 15738 | 25.0% | 6.7%(+18.3)#35 | 7.6%(+17.4)#559 |
| 36. | 16132 | 24.1% | 6.7%(+17.4)#36 | 7.6%(+16.5)#593 |
| 37. | 15661 | 23.5% | 6.7%(+16.8)#37 | 7.6%(+15.9)#624 |
| 38. | 16112 | 23.3% | 6.7%(+16.6)#38 | 7.6%(+15.7)#639 |
| 39. | 15764 | 23.1% | 6.7%(+16.3)#39 | 7.6%(+15.4)#651 |
| 40. | 17071 | 23.1% | 6.7%(+16.3)#40 | 7.6%(+15.4)#653 |
| 41. | 16436 | 22.2% | 6.7%(+15.5)#41 | 7.6%(+14.6)#705 |
| 42. | 15340 | 22.1% | 6.7%(+15.3)#42 | 7.6%(+14.4)#718 |
| 43. | 16342 | 21.6% | 6.7%(+14.9)#43 | 7.6%(+14.0)#743 |
| 44. | 18461 | 21.6% | 6.7%(+14.9)#44 | 7.6%(+14.0)#747 |
| 45. | 19437 | 21.5% | 6.7%(+14.7)#45 | 7.6%(+13.8)#763 |
| 46. | 17518 | 21.4% | 6.7%(+14.7)#46 | 7.6%(+13.8)#766 |
| 47. | 15616 | 21.2% | 6.7%(+14.5)#47 | 7.6%(+13.6)#793 |
| 48. | 15686 | 21.1% | 6.7%(+14.4)#48 | 7.6%(+13.5)#804 |
| 49. | 16858 | 21.0% | 6.7%(+14.2)#49 | 7.6%(+13.3)#816 |
| 50. | 16422 | 20.7% | 6.7%(+14.0)#50 | 7.6%(+13.0)#837 |
| 51. | 15623 | 20.5% | 6.7%(+13.7)#51 | 7.6%(+12.8)#860 |
| 52. | 17069 | 20.0% | 6.7%(+13.3)#52 | 7.6%(+12.4)#917 |
| 53. | 15088 | 19.6% | 6.7%(+12.8)#53 | 7.6%(+11.9)#958 |
| 54. | 16327 | 19.5% | 6.7%(+12.8)#54 | 7.6%(+11.9)#961 |
| 55. | 18913 | 19.5% | 6.7%(+12.8)#55 | 7.6%(+11.9)#965 |
| 56. | 16691 | 18.9% | 6.7%(+12.1)#56 | 7.6%(+11.2)#1,050 |
| 57. | 17342 | 18.4% | 6.7%(+11.7)#57 | 7.6%(+10.8)#1,106 |
| 58. | 15636 | 18.3% | 6.7%(+11.6)#58 | 7.6%(+10.7)#1,123 |
| 59. | 16430 | 18.2% | 6.7%(+11.4)#59 | 7.6%(+10.5)#1,140 |
| 60. | 17229 | 17.8% | 6.7%(+11.1)#60 | 7.6%(+10.1)#1,184 |
| 61. | 16881 | 17.8% | 6.7%(+11.0)#61 | 7.6%(+10.1)#1,189 |
| 62. | 18915 | 17.5% | 6.7%(+10.8)#62 | 7.6%(+9.87)#1,218 |
| 63. | 18074 | 17.3% | 6.7%(+10.6)#63 | 7.6%(+9.64)#1,259 |
| 64. | 18344 | 17.3% | 6.7%(+10.5)#64 | 7.6%(+9.62)#1,263 |
| 65. | 18031 | 16.8% | 6.7%(+10.1)#65 | 7.6%(+9.17)#1,345 |
| 66. | 15670 | 16.7% | 6.7%(+9.93)#66 | 7.6%(+9.02)#1,361 |
| 67. | 15668 | 16.6% | 6.7%(+9.88)#67 | 7.6%(+8.98)#1,387 |
| 68. | 16435 | 16.4% | 6.7%(+9.67)#68 | 7.6%(+8.76)#1,418 |
| 69. | 15687 | 16.2% | 6.7%(+9.49)#69 | 7.6%(+8.58)#1,454 |
| 70. | 18106 | 16.0% | 6.7%(+9.22)#70 | 7.6%(+8.31)#1,512 |
| 71. | 19436 | 15.7% | 6.7%(+8.99)#71 | 7.6%(+8.08)#1,552 |
| 72. | 15429 | 15.4% | 6.7%(+8.65)#72 | 7.6%(+7.74)#1,650 |
| 73. | 15909 | 15.4% | 6.7%(+8.61)#73 | 7.6%(+7.70)#1,666 |
| 74. | 15360 | 15.2% | 6.7%(+8.48)#74 | 7.6%(+7.57)#1,696 |
| 75. | 15067 | 15.2% | 6.7%(+8.47)#75 | 7.6%(+7.56)#1,700 |
| 76. | 19425 | 15.2% | 6.7%(+8.42)#76 | 7.6%(+7.51)#1,713 |
| 77. | 18946 | 15.0% | 6.7%(+8.30)#77 | 7.6%(+7.39)#1,740 |
| 78. | 18828 | 15.0% | 6.7%(+8.26)#78 | 7.6%(+7.35)#1,749 |
| 79. | 15019 | 14.9% | 6.7%(+8.18)#79 | 7.6%(+7.27)#1,764 |
| 80. | 15213 | 14.5% | 6.7%(+7.76)#80 | 7.6%(+6.85)#1,869 |
| 81. | 15479 | 14.4% | 6.7%(+7.63)#81 | 7.6%(+6.73)#1,904 |
| 82. | 15942 | 14.3% | 6.7%(+7.60)#82 | 7.6%(+6.69)#1,916 |
| 83. | 15691 | 14.3% | 6.7%(+7.55)#83 | 7.6%(+6.64)#1,938 |
| 84. | 15368 | 14.3% | 6.7%(+7.55)#84 | 7.6%(+6.64)#1,939 |
| 85. | 18624 | 14.3% | 6.7%(+7.55)#85 | 7.6%(+6.64)#1,940 |
| 86. | 18844 | 14.1% | 6.7%(+7.31)#86 | 7.6%(+6.40)#1,996 |
| 87. | 18469 | 14.0% | 6.7%(+7.31)#87 | 7.6%(+6.40)#1,997 |
| 88. | 16239 | 14.0% | 6.7%(+7.23)#88 | 7.6%(+6.32)#2,026 |
| 89. | 18977 | 13.9% | 6.7%(+7.20)#89 | 7.6%(+6.29)#2,043 |
| 90. | 16023 | 13.9% | 6.7%(+7.19)#90 | 7.6%(+6.28)#2,047 |
| 91. | 15455 | 13.9% | 6.7%(+7.15)#91 | 7.6%(+6.24)#2,062 |
| 92. | 19533 | 13.8% | 6.7%(+7.02)#92 | 7.6%(+6.11)#2,116 |
| 93. | 18503 | 13.8% | 6.7%(+7.01)#93 | 7.6%(+6.10)#2,118 |
| 94. | 19510 | 13.7% | 6.7%(+6.95)#94 | 7.6%(+6.05)#2,141 |
| 95. | 17004 | 13.7% | 6.7%(+6.94)#95 | 7.6%(+6.03)#2,144 |
| 96. | 16870 | 13.7% | 6.7%(+6.92)#96 | 7.6%(+6.01)#2,149 |
| 97. | 17834 | 13.7% | 6.7%(+6.92)#97 | 7.6%(+6.01)#2,152 |
| 98. | 15464 | 13.6% | 6.7%(+6.90)#98 | 7.6%(+5.99)#2,158 |
| 99. | 16942 | 13.5% | 6.7%(+6.78)#99 | 7.6%(+5.87)#2,208 |
| 100. | 15632 | 13.4% | 6.7%(+6.62)#100 | 7.6%(+5.71)#2,269 |
Common Questions
What are the Top 10 Zip Codes with the Highest Percentage of Population with a Degree in Engineering in Pennsylvania?
Top 10 Zip Codes with the Highest Percentage of Population with a Degree in Engineering in Pennsylvania are:
What zip code has the Highest Percentage of Population with a Degree in Engineering in Pennsylvania?
15951 has the Highest Percentage of Population with a Degree in Engineering in Pennsylvania with 100.0%.
What is the Percentage of Population with a Degree in Engineering in the State of Pennsylvania?
Percentage of Population with a Degree in Engineering in Pennsylvania is 6.7%.
What is the Percentage of Population with a Degree in Engineering in the United States?
Percentage of Population with a Degree in Engineering in the United States is 7.6%.