Zip Codes with the Highest Percentage of Population with a Degree in Computers and Mathematics in Dallas, TX

RELATED REPORTS & OPTIONS

Computers and Mathematics
Population
Families and Households
Female Fertility
Female Fertility (Unmarried)
Race (Community Size)
Race (Percentage)
Ancestry (Community Size)
AfghanAfricanAlaska NativeAlbanianAlsatianAmericanApacheArabArgentineanArmenianAssyrian / Chaldean / SyriacAustralianAustrianBahamianBangladeshiBarbadianBasqueBelgianBelizeanBhutaneseBlackfeetBolivianBrazilianBritishBritish West IndianBulgarianBurmeseCajunCambodianCanadianCape VerdeanCelticCentral AmericanCentral American IndianCherokeeChickasawChileanChippewaChoctawColombianComancheCosta RicanCreekCroatianCubanCypriotCzechCzechoslovakianDanishDominicanDutchDutch West IndianEastern EuropeanEcuadorianEgyptianEnglishEstonianEthiopianEuropeanFilipinoFinnishFrenchFrench CanadianGermanGhanaianGreekGuamanian / ChamorroGuatemalanGuyaneseHaitianHonduranHungarianIcelanderIndian (Asian)IndonesianIranianIraqiIrishIroquoisIsraeliItalianJamaicanJapaneseJordanianKenyanKoreanLaotianLatvianLebaneseLiberianLithuanianLuxembourgerMalaysianMalteseMexicanMexican American IndianMongolianMoroccanNative HawaiianNavajoNew ZealanderNicaraguanNigerianNorthern EuropeanNorwegianOkinawanOsagePakistaniPalestinianPanamanianParaguayanPennsylvania GermanPeruvianPolishPortuguesePotawatomiPuebloPuerto RicanRomanianRussianSalvadoranSamoanScandinavianScotch-IrishScottishSeminoleSenegaleseSerbianSierra LeoneanSiouxSlavicSlovakSloveneSomaliSouth AfricanSouth AmericanSouth American IndianSpaniardSpanishSpanish AmericanSpanish American IndianSri LankanSubsaharan AfricanSudaneseSwedishSwissSyrianThaiTohono O'OdhamTonganTrinidadian and TobagonianTurkishUgandanUkrainianUruguayanVenezuelanVietnameseWelshWest IndianYaquiYugoslavianZimbabwean
Ancestry (Percentage)
AfghanAfricanAlaska NativeAlbanianAlsatianAmericanApacheArabArgentineanArmenianAssyrian / Chaldean / SyriacAustralianAustrianBahamianBangladeshiBarbadianBasqueBelgianBelizeanBhutaneseBlackfeetBolivianBrazilianBritishBritish West IndianBulgarianBurmeseCajunCambodianCanadianCape VerdeanCelticCentral AmericanCentral American IndianCherokeeChickasawChileanChippewaChoctawColombianComancheCosta RicanCreekCroatianCubanCypriotCzechCzechoslovakianDanishDominicanDutchDutch West IndianEastern EuropeanEcuadorianEgyptianEnglishEstonianEthiopianEuropeanFilipinoFinnishFrenchFrench CanadianGermanGhanaianGreekGuamanian / ChamorroGuatemalanGuyaneseHaitianHonduranHungarianIcelanderIndian (Asian)IndonesianIranianIraqiIrishIroquoisIsraeliItalianJamaicanJapaneseJordanianKenyanKoreanLaotianLatvianLebaneseLiberianLithuanianLuxembourgerMalaysianMalteseMexicanMexican American IndianMongolianMoroccanNative HawaiianNavajoNew ZealanderNicaraguanNigerianNorthern EuropeanNorwegianOkinawanOsagePakistaniPalestinianPanamanianParaguayanPennsylvania GermanPeruvianPolishPortuguesePotawatomiPuebloPuerto RicanRomanianRussianSalvadoranSamoanScandinavianScotch-IrishScottishSeminoleSenegaleseSerbianSierra LeoneanSiouxSlavicSlovakSloveneSomaliSouth AfricanSouth AmericanSouth American IndianSpaniardSpanishSpanish AmericanSpanish American IndianSri LankanSubsaharan AfricanSudaneseSwedishSwissSyrianThaiTohono O'OdhamTonganTrinidadian and TobagonianTurkishUgandanUkrainianUruguayanVenezuelanVietnameseWelshWest IndianYaquiYugoslavianZimbabwean
Immigrant Origin (Total)
AfghanistanAfricaAlbaniaArgentinaArmeniaAsiaAustraliaAustriaBahamasBangladeshBelarusBelgiumBelizeBoliviaBosnia and HerzegovinaBrazilBulgariaBurma / MyanmarCambodiaCameroonCanadaCaribbeanCentral AmericaChileChinaColombiaCongoCosta RicaCroatiaCubaCzechoslovakiaDenmarkDominicaDominican RepublicEastern AfricaEastern AsiaEastern EuropeEcuadorEgyptEl SalvadorEnglandEritreaEthiopiaEuropeFijiFranceGermanyGhanaGreeceGuatemalaGuyanaHaitiHondurasHong KongHungaryIndiaIndonesiaIranIraqIrelandIsraelItalyJamaicaJapanJordanKazakhstanKenyaKoreaKuwaitLaosLatin AmericaLatviaLebanonLiberiaMalaysiaMexicoMiddle AfricaMoldovaMoroccoNepalNetherlandsNicaraguaNigeriaNorthern AfricaNorthern EuropeNorwayOceaniaPakistanPanamaPeruPhilippinesPolandPortugalRomaniaRussiaSaudi ArabiaScotlandSenegalSerbiaSierra LeoneSingaporeSomaliaSouth AfricaSouth AmericaSouth Central AsiaSouth Eastern AsiaSouthern EuropeSpainSri LankaSudanSwedenSwitzerlandSyriaTaiwanThailandTrinidad and TobagoTurkeyUgandaUkraineUruguayUzbekistanVenezuelaVietnamWest IndiesWestern AfricaWestern AsiaWestern EuropeYemenZaireZimbabwe
Immigrant Origin (Percentage)
AfghanistanAfricaAlbaniaArgentinaArmeniaAsiaAustraliaAustriaBahamasBangladeshBelarusBelgiumBelizeBoliviaBosnia and HerzegovinaBrazilBulgariaBurma / MyanmarCambodiaCameroonCanadaCaribbeanCentral AmericaChileChinaColombiaCongoCosta RicaCroatiaCubaCzechoslovakiaDenmarkDominicaDominican RepublicEastern AfricaEastern AsiaEastern EuropeEcuadorEgyptEl SalvadorEnglandEritreaEthiopiaEuropeFijiFranceGermanyGhanaGreeceGuatemalaGuyanaHaitiHondurasHong KongHungaryIndiaIndonesiaIranIraqIrelandIsraelItalyJamaicaJapanJordanKazakhstanKenyaKoreaKuwaitLaosLatin AmericaLatviaLebanonLiberiaMalaysiaMexicoMiddle AfricaMoldovaMoroccoNepalNetherlandsNicaraguaNigeriaNorthern AfricaNorthern EuropeNorwayOceaniaPakistanPanamaPeruPhilippinesPolandPortugalRomaniaRussiaSaudi ArabiaScotlandSenegalSerbiaSierra LeoneSingaporeSomaliaSouth AfricaSouth AmericaSouth Central AsiaSouth Eastern AsiaSouthern EuropeSpainSri LankaSudanSwedenSwitzerlandSyriaTaiwanThailandTrinidad and TobagoTurkeyUgandaUkraineUruguayUzbekistanVenezuelaVietnamWest IndiesWestern AfricaWestern AsiaWestern EuropeYemenZaireZimbabwe
Income
Income (Families)
Income (Households)
Poverty
Poverty (Families)
Unemployment
Employment Occupations
Employment Industries
Employer Class
Commute Time
Commute Means
School Enrollment
Education by Degree Field
Occupancy
Finances
Physical Characteristics
Dallas
Compare Zip Codes
Comparison Subject

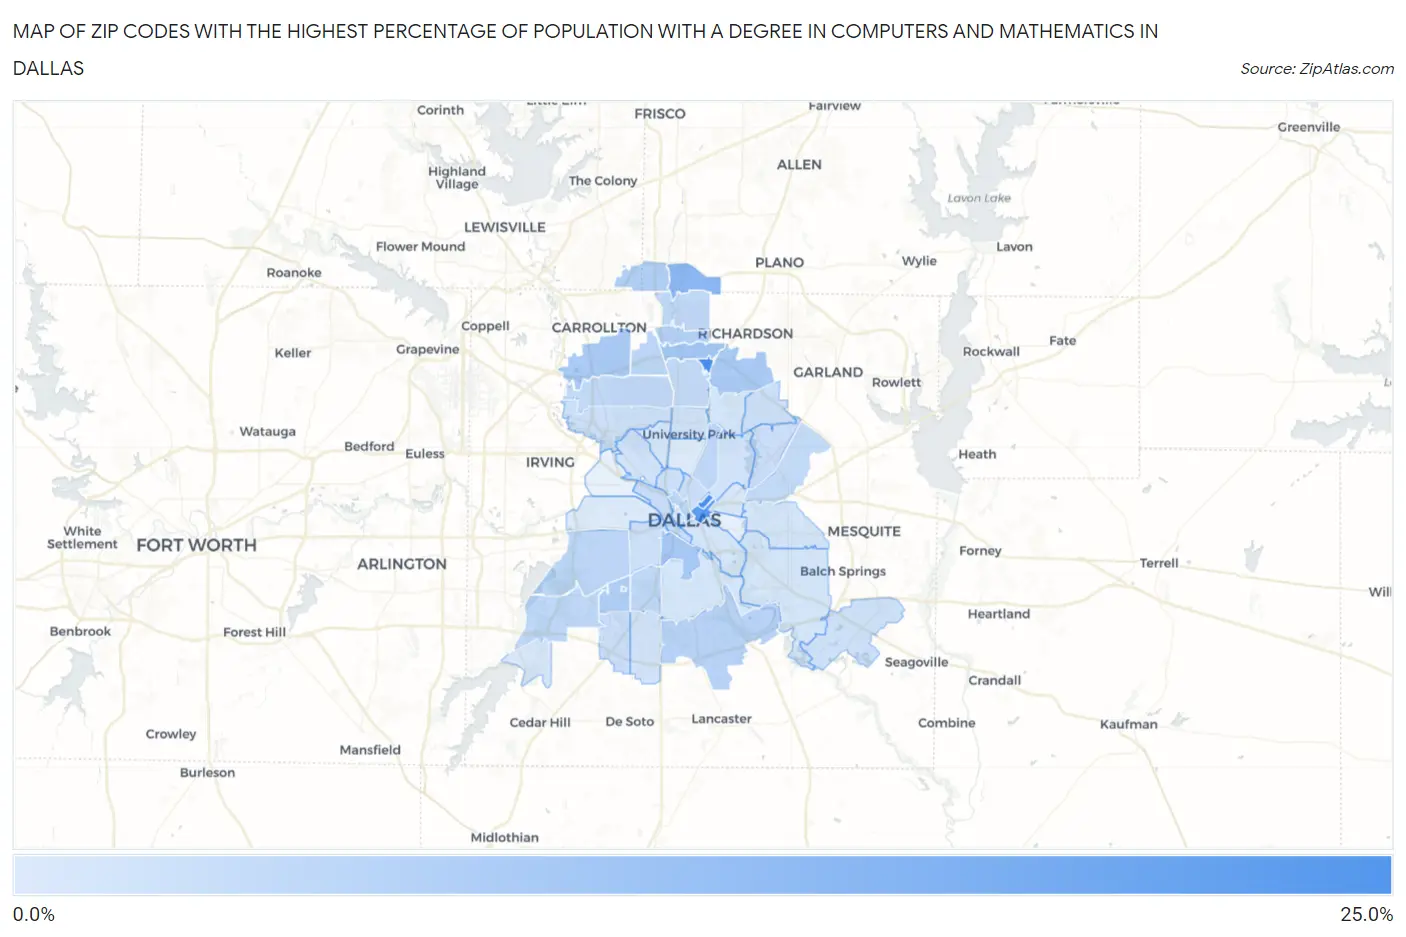
Map of Zip Codes with the Highest Percentage of Population with a Degree in Computers and Mathematics in Dallas

0.0%
25.0%
Zip Codes with the Highest Percentage of Population with a Degree in Computers and Mathematics in Dallas Map

Zip Codes with the Highest Percentage of Population with a Degree in Computers and Mathematics in Dallas, TX

Zip Code % Graduates vs State vs National
1.7525121.4%5.2%(+16.2)#244.9%(+16.5)#417
2.7524621.1%5.2%(+15.9)#254.9%(+16.2)#425
3.7522618.1%5.2%(+13.0)#304.9%(+13.2)#558
4.7525211.7%5.2%(+6.49)#824.9%(+6.77)#1,290
5.752408.5%5.2%(+3.32)#1684.9%(+3.60)#2,540
6.752038.2%5.2%(+3.07)#1794.9%(+3.35)#2,711
7.752437.9%5.2%(+2.67)#1984.9%(+2.96)#3,022
8.752347.7%5.2%(+2.54)#2094.9%(+2.82)#3,123
9.752336.8%5.2%(+1.61)#2794.9%(+1.89)#4,089
10.752876.5%5.2%(+1.35)#3084.9%(+1.63)#4,417
11.752546.1%5.2%(+0.920)#3524.9%(+1.20)#5,127
12.752415.8%5.2%(+0.625)#3924.9%(+0.909)#5,667
13.752015.8%5.2%(+0.591)#3994.9%(+0.875)#5,732
14.752445.3%5.2%(+0.148)#4624.9%(+0.432)#6,697
15.752115.3%5.2%(+0.142)#4644.9%(+0.426)#6,710
16.752065.1%5.2%(-0.114)#4944.9%(+0.170)#7,294
17.752364.9%5.2%(-0.249)#5214.9%(+0.035)#7,618
18.752244.9%5.2%(-0.271)#5234.9%(+0.013)#7,676
19.752484.7%5.2%(-0.462)#5544.9%(-0.178)#8,220
20.752294.7%5.2%(-0.502)#5654.9%(-0.218)#8,347
21.752284.5%5.2%(-0.643)#5904.9%(-0.359)#8,760
22.752304.5%5.2%(-0.726)#6074.9%(-0.442)#9,025
23.752073.9%5.2%(-1.33)#7204.9%(-1.04)#10,974
24.752043.6%5.2%(-1.61)#7754.9%(-1.33)#12,040
25.752373.5%5.2%(-1.65)#7814.9%(-1.37)#12,186
26.752183.5%5.2%(-1.65)#7824.9%(-1.37)#12,191
27.752203.4%5.2%(-1.76)#8134.9%(-1.48)#12,609
28.752193.4%5.2%(-1.83)#8204.9%(-1.54)#12,818
29.752383.3%5.2%(-1.88)#8314.9%(-1.59)#13,024
30.752083.2%5.2%(-1.93)#8364.9%(-1.65)#13,207
31.752532.9%5.2%(-2.24)#9004.9%(-1.96)#14,317
32.752252.8%5.2%(-2.36)#9204.9%(-2.08)#14,734
33.752352.8%5.2%(-2.36)#9224.9%(-2.08)#14,743
34.752322.7%5.2%(-2.51)#9534.9%(-2.23)#15,283
35.752142.6%5.2%(-2.57)#9594.9%(-2.28)#15,490
36.752272.4%5.2%(-2.77)#1,0084.9%(-2.49)#16,246
37.752022.3%5.2%(-2.86)#1,0204.9%(-2.58)#16,540
38.752172.3%5.2%(-2.90)#1,0324.9%(-2.62)#16,667
39.752312.3%5.2%(-2.92)#1,0394.9%(-2.63)#16,744
40.752152.2%5.2%(-3.00)#1,0544.9%(-2.72)#17,045
41.752092.2%5.2%(-3.01)#1,0574.9%(-2.72)#17,069
42.752162.1%5.2%(-3.08)#1,0744.9%(-2.79)#17,290
43.752491.9%5.2%(-3.28)#1,1114.9%(-3.00)#17,940
44.752231.9%5.2%(-3.29)#1,1144.9%(-3.00)#17,958
45.752051.4%5.2%(-3.74)#1,1784.9%(-3.45)#19,304
46.752121.3%5.2%(-3.85)#1,2064.9%(-3.57)#19,638

Common Questions

What are the Top 10 Zip Codes with the Highest Percentage of Population with a Degree in Computers and Mathematics in Dallas, TX?
Top 10 Zip Codes with the Highest Percentage of Population with a Degree in Computers and Mathematics in Dallas, TX are:
#1
21.4%
#2
21.1%
#3
18.1%
#4
11.7%
#5
8.5%
#6
8.2%
#7
7.9%
#8
7.7%
#9
6.8%
#10
6.5%
What zip code has the Highest Percentage of Population with a Degree in Computers and Mathematics in Dallas, TX?
75251 has the Highest Percentage of Population with a Degree in Computers and Mathematics in Dallas, TX with 21.4%.
What is the Percentage of Population with a Degree in Computers and Mathematics in Dallas, TX?
Percentage of Population with a Degree in Computers and Mathematics in Dallas is 4.8%.
What is the Percentage of Population with a Degree in Computers and Mathematics in Texas?
Percentage of Population with a Degree in Computers and Mathematics in Texas is 5.2%.
What is the Percentage of Population with a Degree in Computers and Mathematics in the United States?
Percentage of Population with a Degree in Computers and Mathematics in the United States is 4.9%.