West Salem, OH
West Salem Map
West Salem Overview
1,528
TOTAL POPULATION
841
MALE POPULATION
687
FEMALE POPULATION
122.42
MALES / 100 FEMALES
81.69
FEMALES / 100 MALES
41.0
MEDIAN AGE
2.7
AVG FAMILY SIZE
2.4
AVG HOUSEHOLD SIZE
$30,767
PER CAPITA INCOME
$79,500
AVG FAMILY INCOME
$61,563
AVG HOUSEHOLD INCOME
25.3%
WAGE / INCOME GAP [ % ]
74.7¢/ $1
WAGE / INCOME GAP [ $ ]
$12,606
FAMILY INCOME DEFICIT
0.43
INEQUALITY / GINI INDEX
774
LABOR FORCE [ PEOPLE ]
64.3%
PERCENT IN LABOR FORCE
2.5%
UNEMPLOYMENT RATE
West Salem Zip Codes
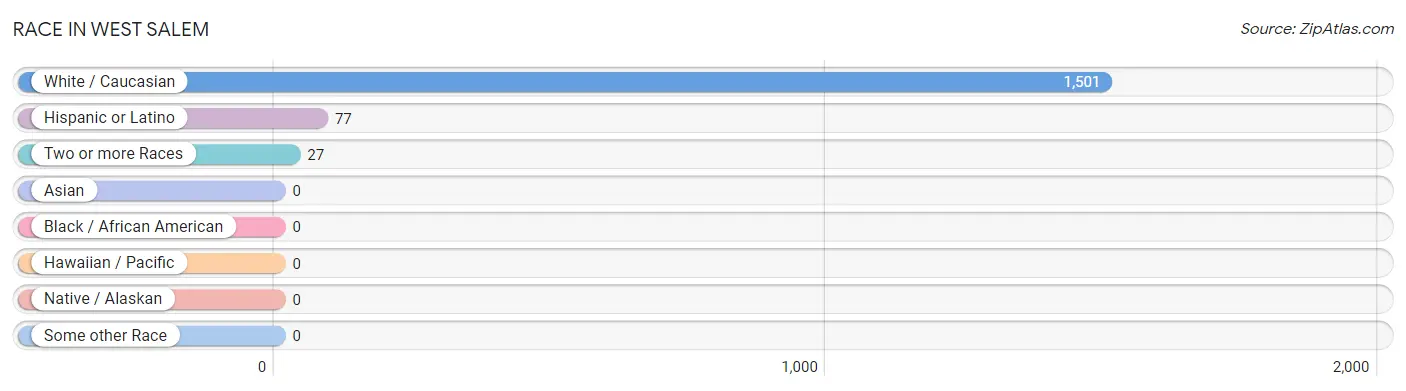
Race in West Salem
The most populous races in West Salem are White / Caucasian (1,501 | 98.2%), Hispanic or Latino (77 | 5.0%), and Two or more Races (27 | 1.8%).
| Race | # Population | % Population |
| Asian | 0 | 0.0% |
| Black / African American | 0 | 0.0% |
| Hawaiian / Pacific | 0 | 0.0% |
| Hispanic or Latino | 77 | 5.0% |
| Native / Alaskan | 0 | 0.0% |
| White / Caucasian | 1,501 | 98.2% |
| Two or more Races | 27 | 1.8% |
| Some other Race | 0 | 0.0% |
| Total | 1,528 | 100.0% |
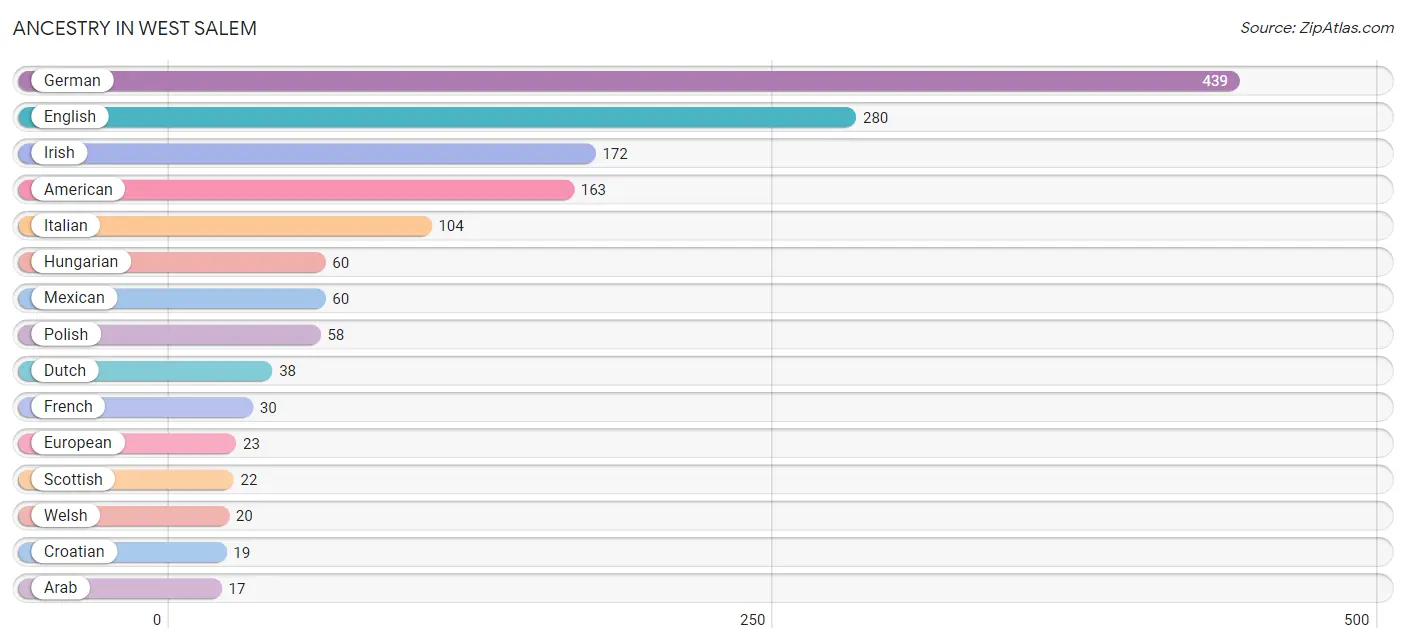
Ancestry in West Salem
The most populous ancestries reported in West Salem are German (439 | 28.7%), English (280 | 18.3%), Irish (172 | 11.3%), American (163 | 10.7%), and Italian (104 | 6.8%), together accounting for 75.8% of all West Salem residents.
| Ancestry | # Population | % Population |
| American | 163 | 10.7% |
| Arab | 17 | 1.1% |
| Cherokee | 5 | 0.3% |
| Choctaw | 2 | 0.1% |
| Croatian | 19 | 1.2% |
| Czech | 8 | 0.5% |
| Dutch | 38 | 2.5% |
| English | 280 | 18.3% |
| European | 23 | 1.5% |
| French | 30 | 2.0% |
| French Canadian | 3 | 0.2% |
| German | 439 | 28.7% |
| Hungarian | 60 | 3.9% |
| Irish | 172 | 11.3% |
| Italian | 104 | 6.8% |
| Mexican | 60 | 3.9% |
| Pennsylvania German | 4 | 0.3% |
| Polish | 58 | 3.8% |
| Puerto Rican | 17 | 1.1% |
| Romanian | 11 | 0.7% |
| Russian | 12 | 0.8% |
| Samoan | 2 | 0.1% |
| Scotch-Irish | 4 | 0.3% |
| Scottish | 22 | 1.4% |
| Swedish | 9 | 0.6% |
| Swiss | 10 | 0.6% |
| Welsh | 20 | 1.3% | View All 27 Rows |
Immigrants in West Salem

| Immigration Origin | # Population | % Population | View All 0 Rows |
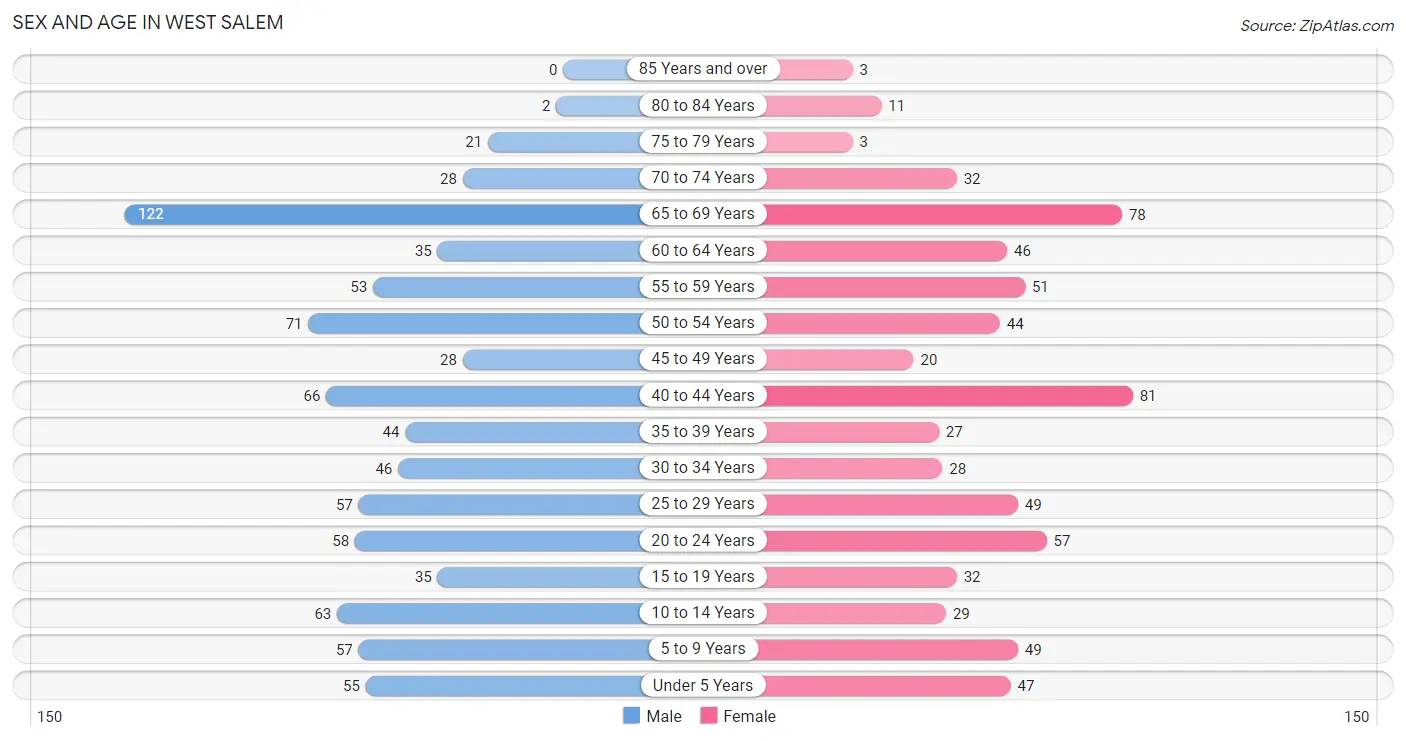
Sex and Age in West Salem
Sex and Age in West Salem
The most populous age groups in West Salem are 65 to 69 Years (122 | 14.5%) for men and 40 to 44 Years (81 | 11.8%) for women.
| Age Bracket | Male | Female |
| Under 5 Years | 55 (6.5%) | 47 (6.8%) |
| 5 to 9 Years | 57 (6.8%) | 49 (7.1%) |
| 10 to 14 Years | 63 (7.5%) | 29 (4.2%) |
| 15 to 19 Years | 35 (4.2%) | 32 (4.7%) |
| 20 to 24 Years | 58 (6.9%) | 57 (8.3%) |
| 25 to 29 Years | 57 (6.8%) | 49 (7.1%) |
| 30 to 34 Years | 46 (5.5%) | 28 (4.1%) |
| 35 to 39 Years | 44 (5.2%) | 27 (3.9%) |
| 40 to 44 Years | 66 (7.9%) | 81 (11.8%) |
| 45 to 49 Years | 28 (3.3%) | 20 (2.9%) |
| 50 to 54 Years | 71 (8.4%) | 44 (6.4%) |
| 55 to 59 Years | 53 (6.3%) | 51 (7.4%) |
| 60 to 64 Years | 35 (4.2%) | 46 (6.7%) |
| 65 to 69 Years | 122 (14.5%) | 78 (11.4%) |
| 70 to 74 Years | 28 (3.3%) | 32 (4.7%) |
| 75 to 79 Years | 21 (2.5%) | 3 (0.4%) |
| 80 to 84 Years | 2 (0.2%) | 11 (1.6%) |
| 85 Years and over | 0 (0.0%) | 3 (0.4%) |
| Total | 841 (100.0%) | 687 (100.0%) |
Families and Households in West Salem
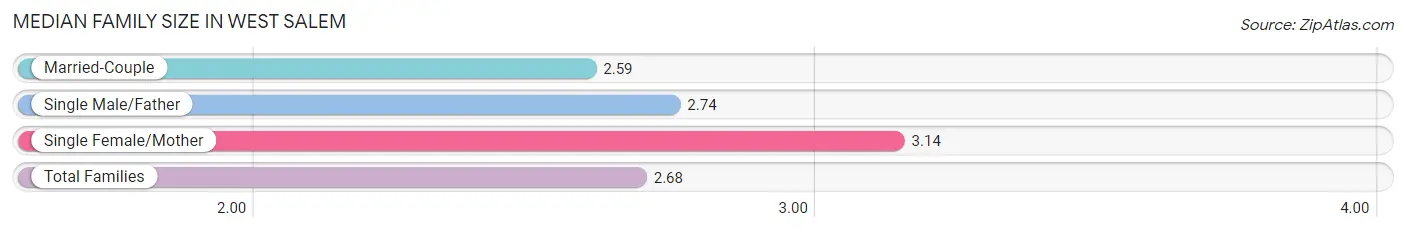
Median Family Size in West Salem
The median family size in West Salem is 2.68 persons per family, with single female/mother families (58 | 13.2%) accounting for the largest median family size of 3.14 persons per family. On the other hand, married-couple families (311 | 71.0%) represent the smallest median family size with 2.59 persons per family.
| Family Type | # Families | Family Size |
| Married-Couple | 311 (71.0%) | 2.59 |
| Single Male/Father | 69 (15.8%) | 2.74 |
| Single Female/Mother | 58 (13.2%) | 3.14 |
| Total Families | 438 (100.0%) | 2.68 |
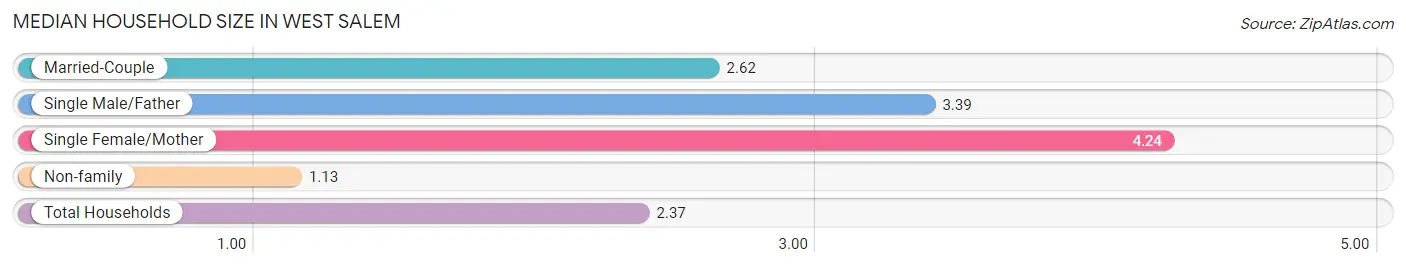
Median Household Size in West Salem
The median household size in West Salem is 2.37 persons per household, with single female/mother households (58 | 9.0%) accounting for the largest median household size of 4.24 persons per household. non-family households (207 | 32.1%) represent the smallest median household size with 1.13 persons per household.
| Household Type | # Households | Household Size |
| Married-Couple | 311 (48.2%) | 2.62 |
| Single Male/Father | 69 (10.7%) | 3.39 |
| Single Female/Mother | 58 (9.0%) | 4.24 |
| Non-family | 207 (32.1%) | 1.13 |
| Total Households | 645 (100.0%) | 2.37 |
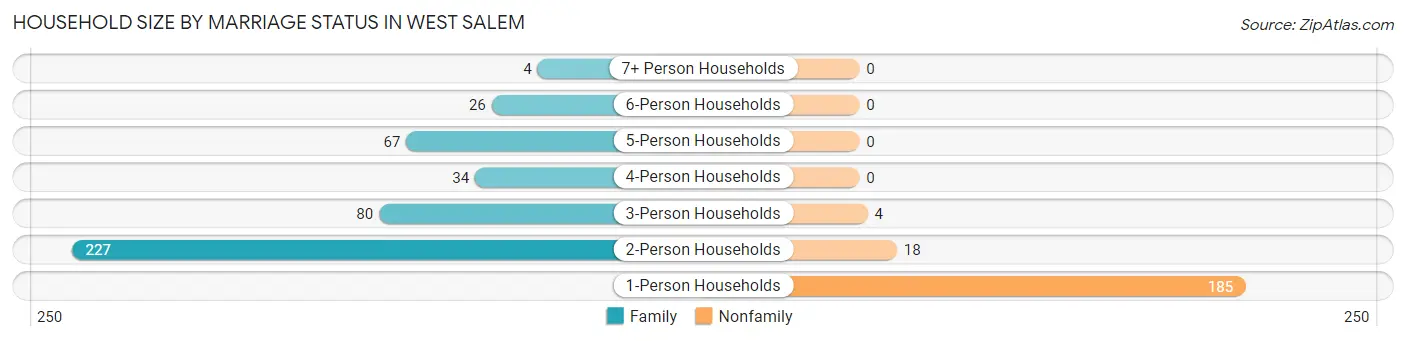
Household Size by Marriage Status in West Salem
Out of a total of 645 households in West Salem, 438 (67.9%) are family households, while 207 (32.1%) are nonfamily households. The most numerous type of family households are 2-person households, comprising 227, and the most common type of nonfamily households are 1-person households, comprising 185.
| Household Size | Family Households | Nonfamily Households |
| 1-Person Households | - | 185 (28.7%) |
| 2-Person Households | 227 (35.2%) | 18 (2.8%) |
| 3-Person Households | 80 (12.4%) | 4 (0.6%) |
| 4-Person Households | 34 (5.3%) | 0 (0.0%) |
| 5-Person Households | 67 (10.4%) | 0 (0.0%) |
| 6-Person Households | 26 (4.0%) | 0 (0.0%) |
| 7+ Person Households | 4 (0.6%) | 0 (0.0%) |
| Total | 438 (67.9%) | 207 (32.1%) |
Female Fertility in West Salem
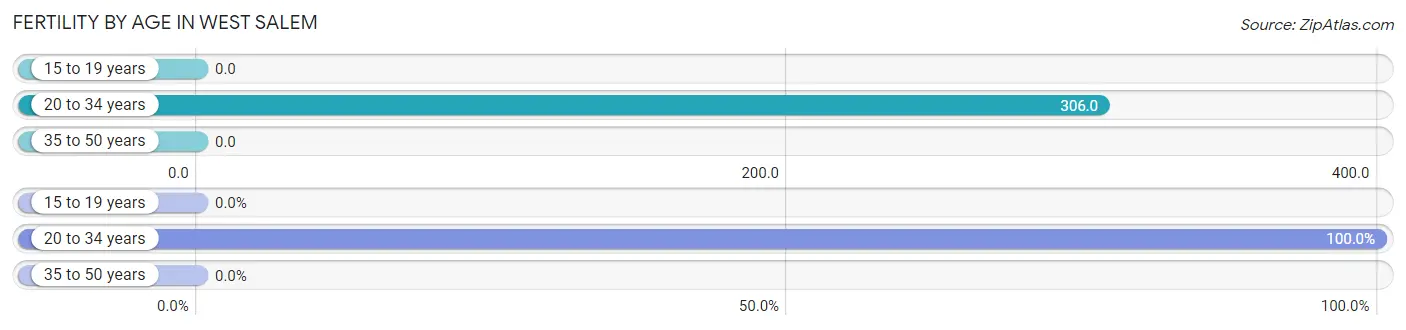
Fertility by Age in West Salem
Average fertility rate in West Salem is 139.0 births per 1,000 women. Women in the age bracket of 20 to 34 years have the highest fertility rate with 306.0 births per 1,000 women. Women in the age bracket of 20 to 34 years acount for 100.0% of all women with births.
| Age Bracket | Women with Births | Births / 1,000 Women |
| 15 to 19 years | 0 (0.0%) | 0.0 |
| 20 to 34 years | 41 (100.0%) | 306.0 |
| 35 to 50 years | 0 (0.0%) | 0.0 |
| Total | 41 (100.0%) | 139.0 |
Fertility by Age by Marriage Status in West Salem
34.1% of women with births (41) in West Salem are married. The highest percentage of unmarried women with births falls into 20 to 34 years age bracket with 65.8% of them unmarried at the time of birth, while the lowest percentage of unmarried women with births belong to 20 to 34 years age bracket with 65.8% of them unmarried.
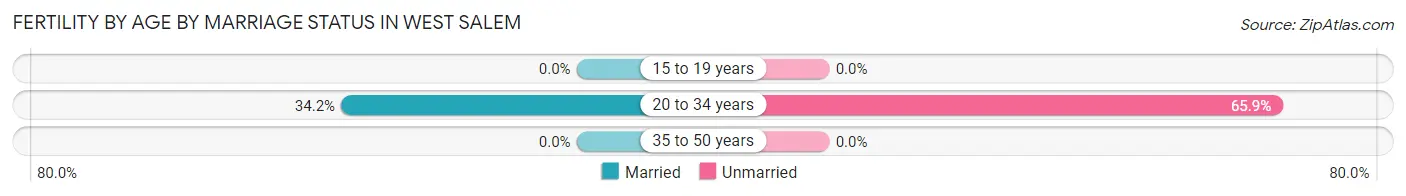
| Age Bracket | Married | Unmarried |
| 15 to 19 years | 0 (0.0%) | 0 (0.0%) |
| 20 to 34 years | 14 (34.2%) | 27 (65.8%) |
| 35 to 50 years | 0 (0.0%) | 0 (0.0%) |
| Total | 14 (34.2%) | 27 (65.8%) |
Fertility by Education in West Salem
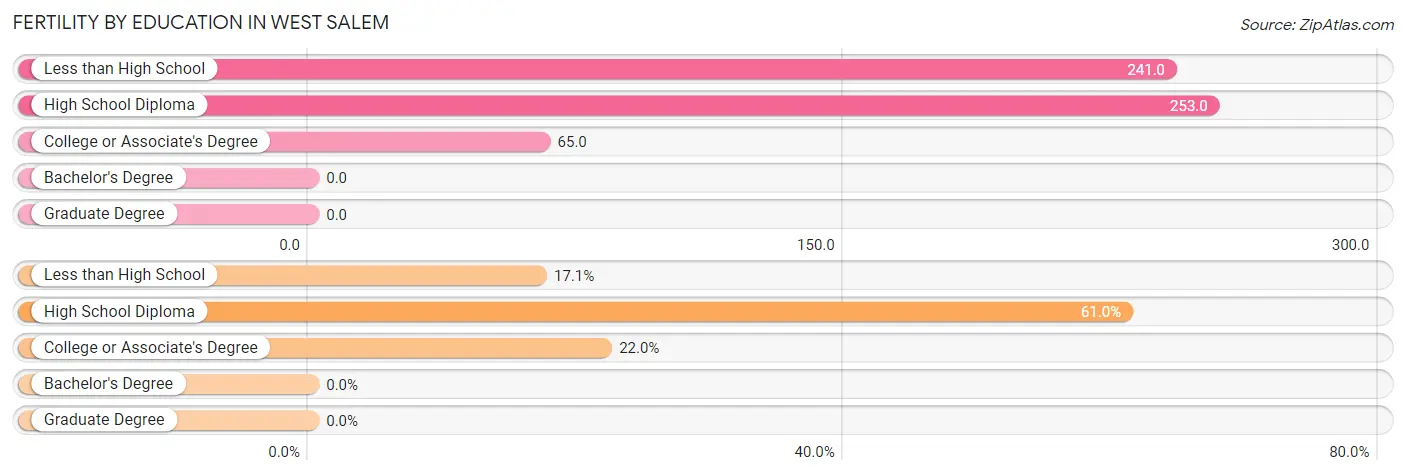
| Educational Attainment | Women with Births | Births / 1,000 Women |
| Less than High School | 7 (17.1%) | 241.0 |
| High School Diploma | 25 (61.0%) | 253.0 |
| College or Associate's Degree | 9 (22.0%) | 65.0 |
| Bachelor's Degree | 0 (0.0%) | 0.0 |
| Graduate Degree | 0 (0.0%) | 0.0 |
| Total | 41 (100.0%) | 139.0 |
Fertility by Education by Marriage Status in West Salem
65.8% of women with births in West Salem are unmarried. Women with the educational attainment of high school diploma are most likely to be married with 44.0% of them married at childbirth, while women with the educational attainment of less than high school are least likely to be married with 100.0% of them unmarried at childbirth.
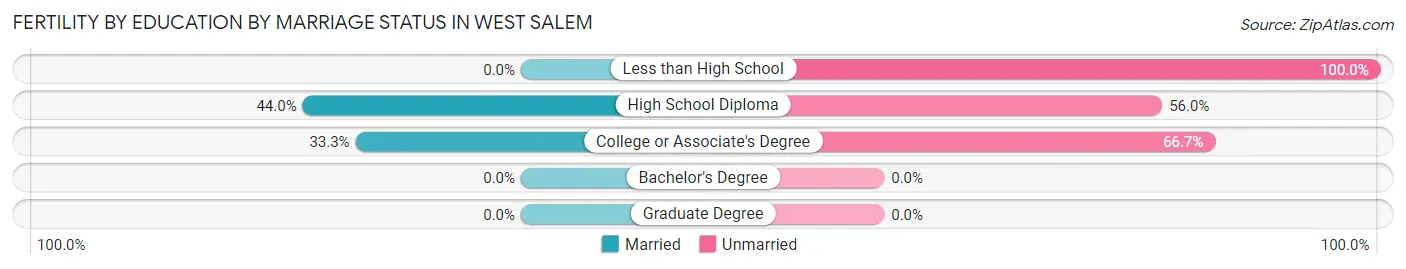
| Educational Attainment | Married | Unmarried |
| Less than High School | 0 (0.0%) | 7 (100.0%) |
| High School Diploma | 11 (44.0%) | 14 (56.0%) |
| College or Associate's Degree | 3 (33.3%) | 6 (66.7%) |
| Bachelor's Degree | 0 (0.0%) | 0 (0.0%) |
| Graduate Degree | 0 (0.0%) | 0 (0.0%) |
| Total | 14 (34.2%) | 27 (65.8%) |
Income in West Salem
Income Overview in West Salem
Per Capita Income in West Salem is $30,767, while median incomes of families and households are $79,500 and $61,563 respectively.
| Characteristic | Number | Measure |
| Per Capita Income | 1,528 | $30,767 |
| Median Family Income | 438 | $79,500 |
| Mean Family Income | 438 | $89,835 |
| Median Household Income | 645 | $61,563 |
| Mean Household Income | 645 | $73,504 |
| Income Deficit | 438 | $12,606 |
| Wage / Income Gap (%) | 1,528 | 25.28% |
| Wage / Income Gap ($) | 1,528 | 74.72¢ per $1 |
| Gini / Inequality Index | 1,528 | 0.43 |
Earnings by Sex in West Salem
Average Earnings in West Salem are $36,554, $43,550 for men and $32,542 for women, a difference of 25.3%.
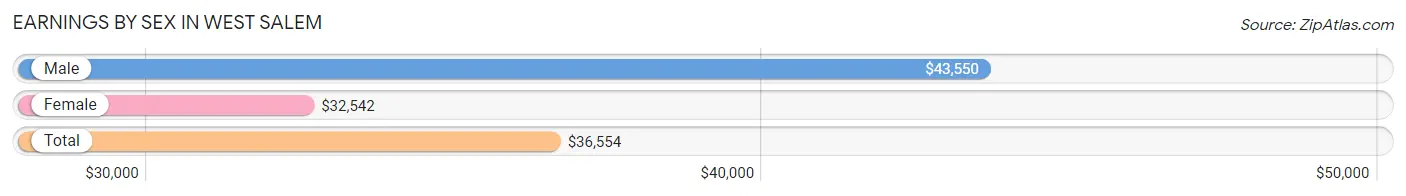
| Sex | Number | Average Earnings |
| Male | 523 (63.9%) | $43,550 |
| Female | 295 (36.1%) | $32,542 |
| Total | 818 (100.0%) | $36,554 |
Earnings by Sex by Income Bracket in West Salem
The most common earnings brackets in West Salem are $65,000 to $74,999 for men (94 | 18.0%) and $25,000 to $29,999 for women (33 | 11.2%).
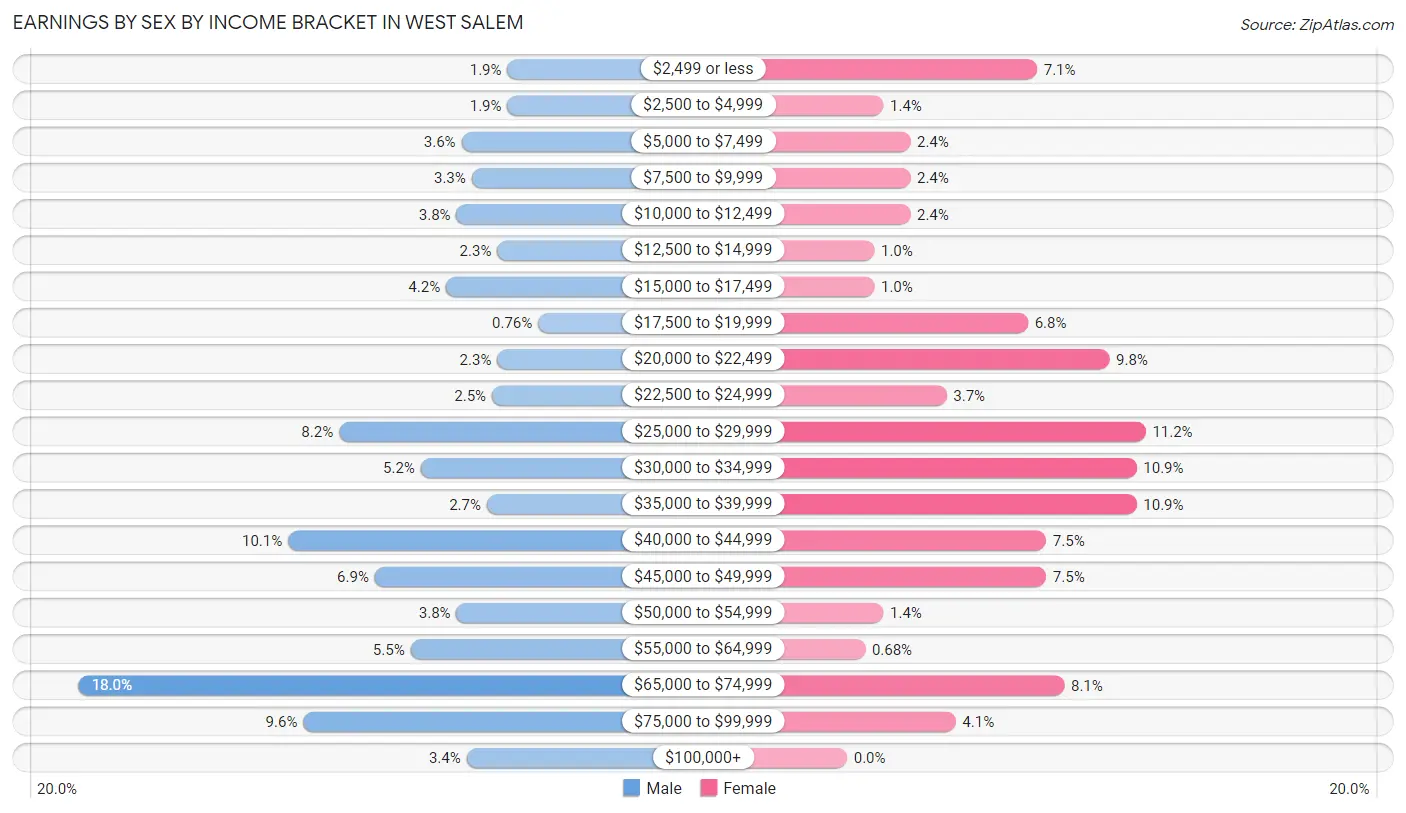
| Income | Male | Female |
| $2,499 or less | 10 (1.9%) | 21 (7.1%) |
| $2,500 to $4,999 | 10 (1.9%) | 4 (1.4%) |
| $5,000 to $7,499 | 19 (3.6%) | 7 (2.4%) |
| $7,500 to $9,999 | 17 (3.3%) | 7 (2.4%) |
| $10,000 to $12,499 | 20 (3.8%) | 7 (2.4%) |
| $12,500 to $14,999 | 12 (2.3%) | 3 (1.0%) |
| $15,000 to $17,499 | 22 (4.2%) | 3 (1.0%) |
| $17,500 to $19,999 | 4 (0.8%) | 20 (6.8%) |
| $20,000 to $22,499 | 12 (2.3%) | 29 (9.8%) |
| $22,500 to $24,999 | 13 (2.5%) | 11 (3.7%) |
| $25,000 to $29,999 | 43 (8.2%) | 33 (11.2%) |
| $30,000 to $34,999 | 27 (5.2%) | 32 (10.8%) |
| $35,000 to $39,999 | 14 (2.7%) | 32 (10.8%) |
| $40,000 to $44,999 | 53 (10.1%) | 22 (7.5%) |
| $45,000 to $49,999 | 36 (6.9%) | 22 (7.5%) |
| $50,000 to $54,999 | 20 (3.8%) | 4 (1.4%) |
| $55,000 to $64,999 | 29 (5.5%) | 2 (0.7%) |
| $65,000 to $74,999 | 94 (18.0%) | 24 (8.1%) |
| $75,000 to $99,999 | 50 (9.6%) | 12 (4.1%) |
| $100,000+ | 18 (3.4%) | 0 (0.0%) |
| Total | 523 (100.0%) | 295 (100.0%) |
Earnings by Sex by Educational Attainment in West Salem
Average earnings in West Salem are $46,852 for men and $34,250 for women, a difference of 26.9%. Men with an educational attainment of bachelor's degree enjoy the highest average annual earnings of $66,250, while those with college or associate's degree education earn the least with $42,857. Women with an educational attainment of high school diploma earn the most with the average annual earnings of $35,486, while those with college or associate's degree education have the smallest earnings of $33,009.
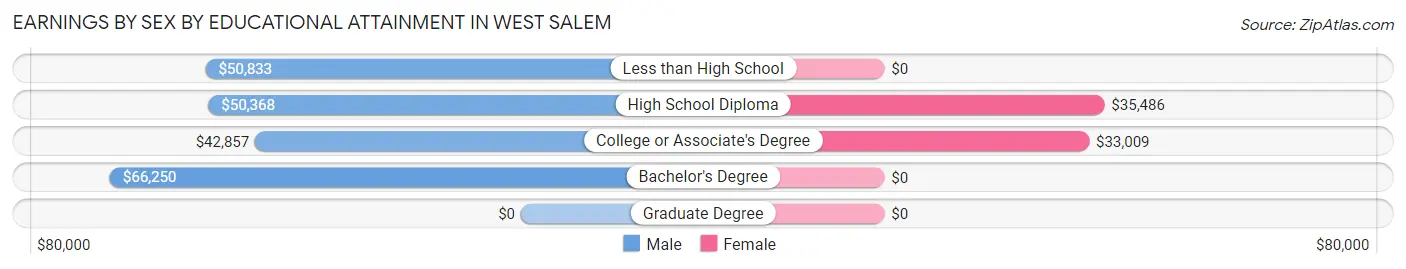
| Educational Attainment | Male Income | Female Income |
| Less than High School | $50,833 | $0 |
| High School Diploma | $50,368 | $35,486 |
| College or Associate's Degree | $42,857 | $33,009 |
| Bachelor's Degree | $66,250 | $0 |
| Graduate Degree | - | - |
| Total | $46,852 | $34,250 |
Family Income in West Salem
Family Income Brackets in West Salem
According to the West Salem family income data, there are 127 families falling into the $100,000 to $149,999 income range, which is the most common income bracket and makes up 29.0% of all families. Conversely, the $150,000 to $199,999 income bracket is the least frequent group with only 4 families (0.9%) belonging to this category.
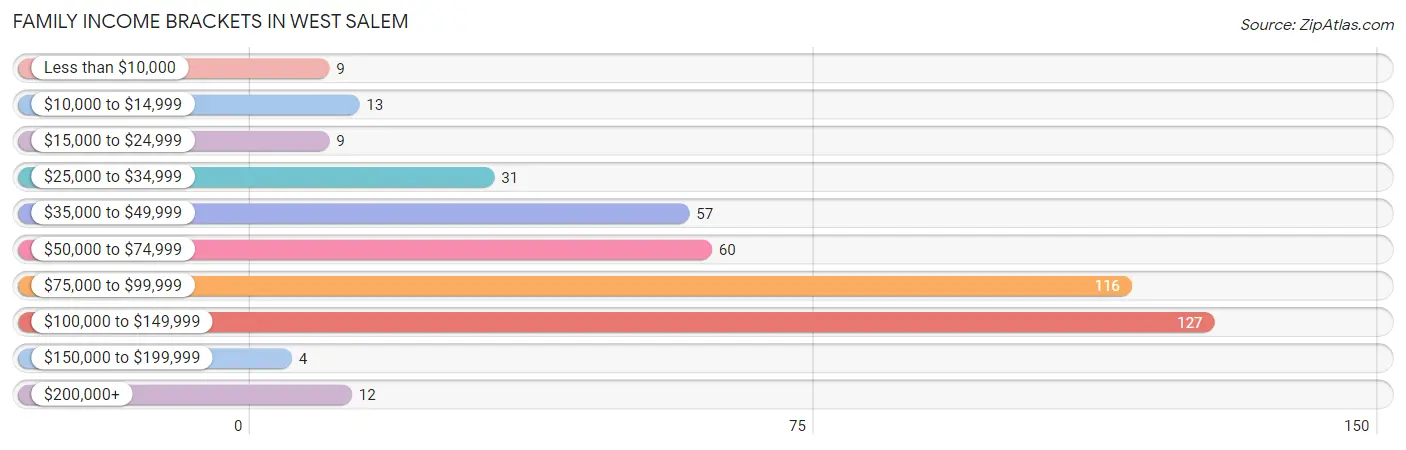
| Income Bracket | # Families | % Families |
| Less than $10,000 | 9 | 2.1% |
| $10,000 to $14,999 | 13 | 3.0% |
| $15,000 to $24,999 | 9 | 2.1% |
| $25,000 to $34,999 | 31 | 7.1% |
| $35,000 to $49,999 | 57 | 13.0% |
| $50,000 to $74,999 | 60 | 13.7% |
| $75,000 to $99,999 | 116 | 26.5% |
| $100,000 to $149,999 | 127 | 29.0% |
| $150,000 to $199,999 | 4 | 0.9% |
| $200,000+ | 12 | 2.7% |
Family Income by Famaliy Size in West Salem
2-person families (235 | 53.6%) account for the highest median family income in West Salem with $80,729 per family, while 2-person families (235 | 53.6%) have the highest median income of $40,364 per family member.
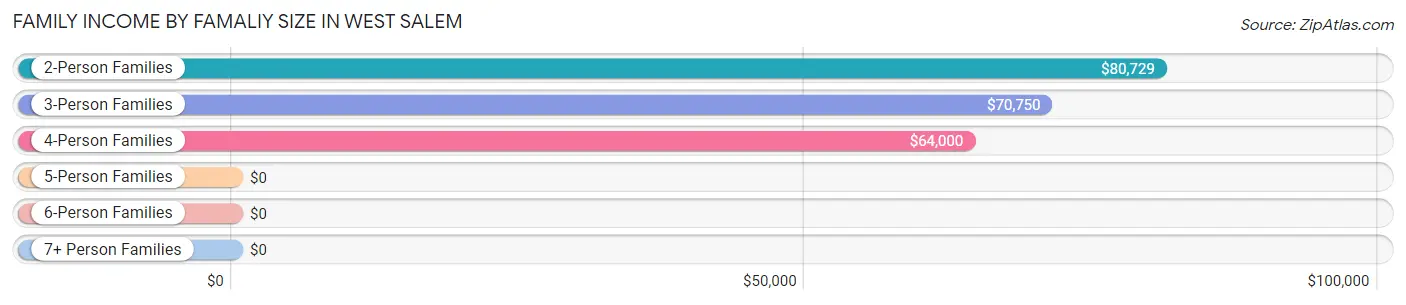
| Income Bracket | # Families | Median Income |
| 2-Person Families | 235 (53.6%) | $80,729 |
| 3-Person Families | 110 (25.1%) | $70,750 |
| 4-Person Families | 38 (8.7%) | $64,000 |
| 5-Person Families | 42 (9.6%) | $0 |
| 6-Person Families | 9 (2.1%) | $0 |
| 7+ Person Families | 4 (0.9%) | $0 |
| Total | 438 (100.0%) | $79,500 |
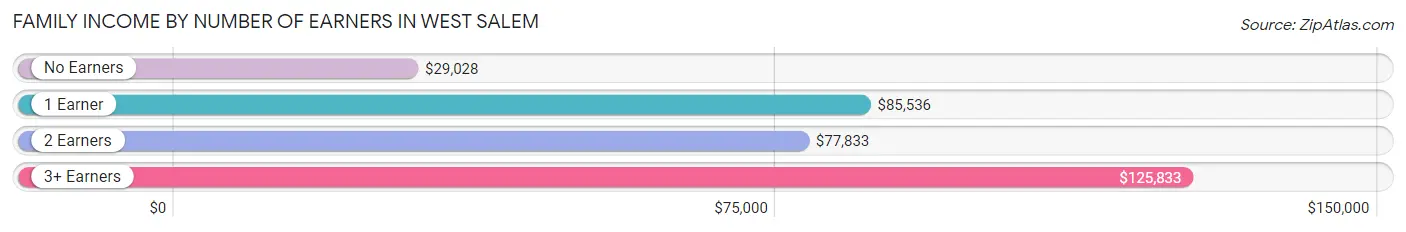
Family Income by Number of Earners in West Salem
The median family income in West Salem is $79,500, with families comprising 3+ earners (32) having the highest median family income of $125,833, while families with no earners (33) have the lowest median family income of $29,028, accounting for 7.3% and 7.5% of families, respectively.
| Number of Earners | # Families | Median Income |
| No Earners | 33 (7.5%) | $29,028 |
| 1 Earner | 169 (38.6%) | $85,536 |
| 2 Earners | 204 (46.6%) | $77,833 |
| 3+ Earners | 32 (7.3%) | $125,833 |
| Total | 438 (100.0%) | $79,500 |
Household Income in West Salem
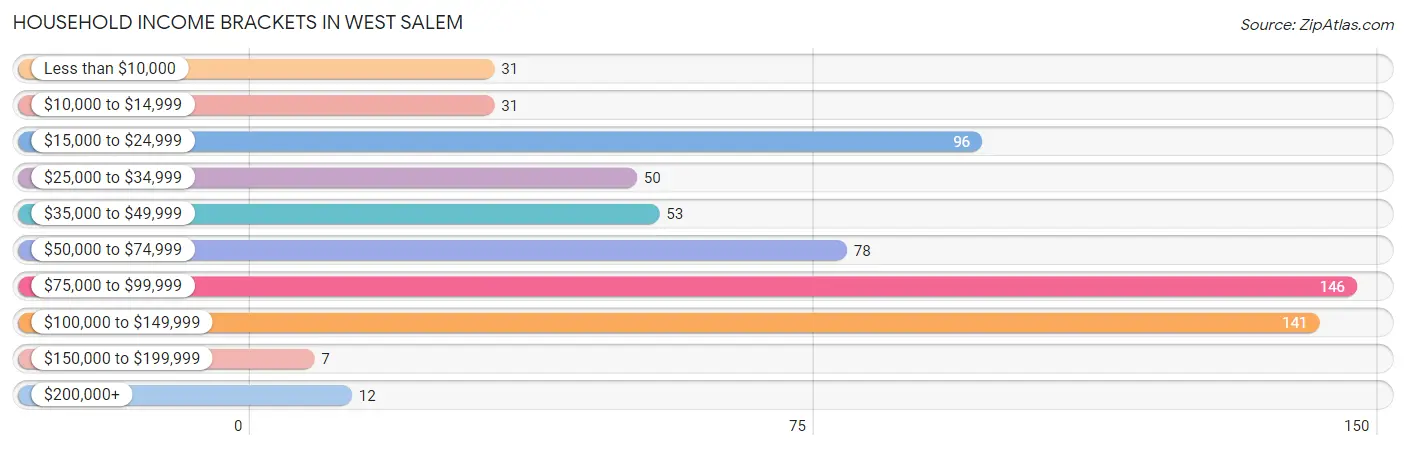
Household Income Brackets in West Salem
With 146 households falling in the category, the $75,000 to $99,999 income range is the most frequent in West Salem, accounting for 22.6% of all households. In contrast, only 7 households (1.1%) fall into the $150,000 to $199,999 income bracket, making it the least populous group.
| Income Bracket | # Households | % Households |
| Less than $10,000 | 31 | 4.8% |
| $10,000 to $14,999 | 31 | 4.8% |
| $15,000 to $24,999 | 96 | 14.9% |
| $25,000 to $34,999 | 50 | 7.8% |
| $35,000 to $49,999 | 53 | 8.2% |
| $50,000 to $74,999 | 78 | 12.1% |
| $75,000 to $99,999 | 146 | 22.6% |
| $100,000 to $149,999 | 141 | 21.9% |
| $150,000 to $199,999 | 7 | 1.1% |
| $200,000+ | 12 | 1.9% |
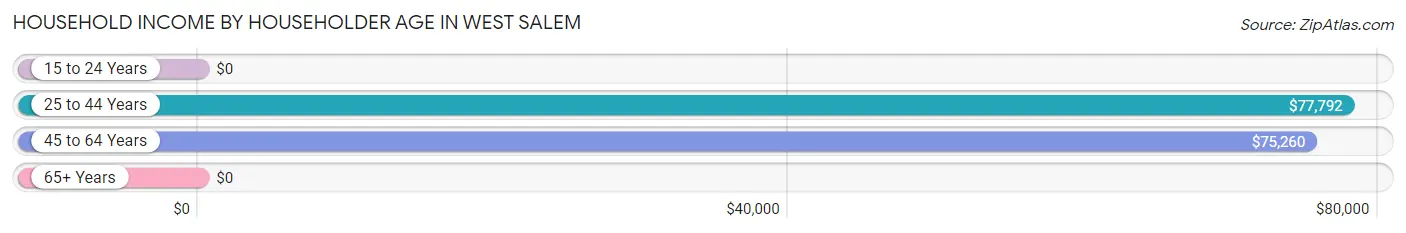
Household Income by Householder Age in West Salem
The median household income in West Salem is $61,563, with the highest median household income of $77,792 found in the 25 to 44 years age bracket for the primary householder. A total of 201 households (31.2%) fall into this category. Meanwhile, the 15 to 24 years age bracket for the primary householder has the lowest median household income of $0, with 15 households (2.3%) in this group.
| Income Bracket | # Households | Median Income |
| 15 to 24 Years | 15 (2.3%) | $0 |
| 25 to 44 Years | 201 (31.2%) | $77,792 |
| 45 to 64 Years | 227 (35.2%) | $75,260 |
| 65+ Years | 202 (31.3%) | $0 |
| Total | 645 (100.0%) | $61,563 |
Poverty in West Salem
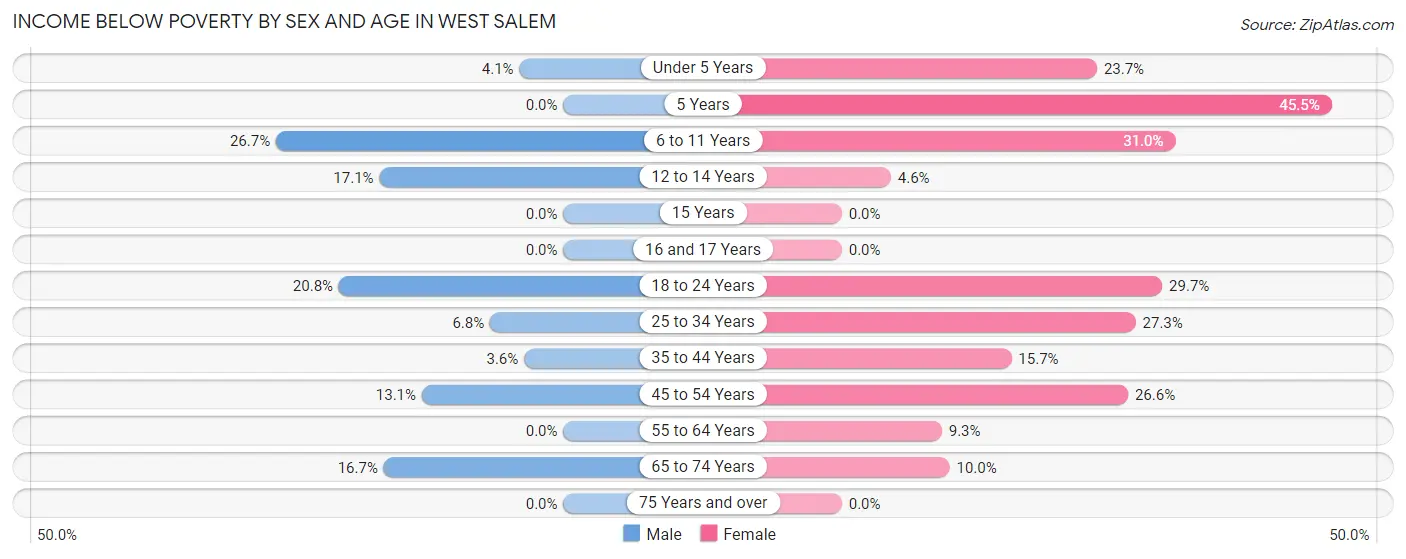
Income Below Poverty by Sex and Age in West Salem
With 10.3% poverty level for males and 18.5% for females among the residents of West Salem, 6 to 11 year old males and 5 year old females are the most vulnerable to poverty, with 12 males (26.7%) and 5 females (45.5%) in their respective age groups living below the poverty level.
| Age Bracket | Male | Female |
| Under 5 Years | 2 (4.1%) | 9 (23.7%) |
| 5 Years | 0 (0.0%) | 5 (45.5%) |
| 6 to 11 Years | 12 (26.7%) | 13 (30.9%) |
| 12 to 14 Years | 7 (17.1%) | 1 (4.5%) |
| 15 Years | 0 (0.0%) | 0 (0.0%) |
| 16 and 17 Years | 0 (0.0%) | 0 (0.0%) |
| 18 to 24 Years | 15 (20.8%) | 22 (29.7%) |
| 25 to 34 Years | 7 (6.8%) | 21 (27.3%) |
| 35 to 44 Years | 4 (3.6%) | 17 (15.7%) |
| 45 to 54 Years | 13 (13.1%) | 17 (26.6%) |
| 55 to 64 Years | 0 (0.0%) | 9 (9.3%) |
| 65 to 74 Years | 25 (16.7%) | 11 (10.0%) |
| 75 Years and over | 0 (0.0%) | 0 (0.0%) |
| Total | 85 (10.3%) | 125 (18.5%) |
Income Above Poverty by Sex and Age in West Salem
According to the poverty statistics in West Salem, males aged 5 years and females aged 15 years are the age groups that are most secure financially, with 100.0% of males and 100.0% of females in these age groups living above the poverty line.
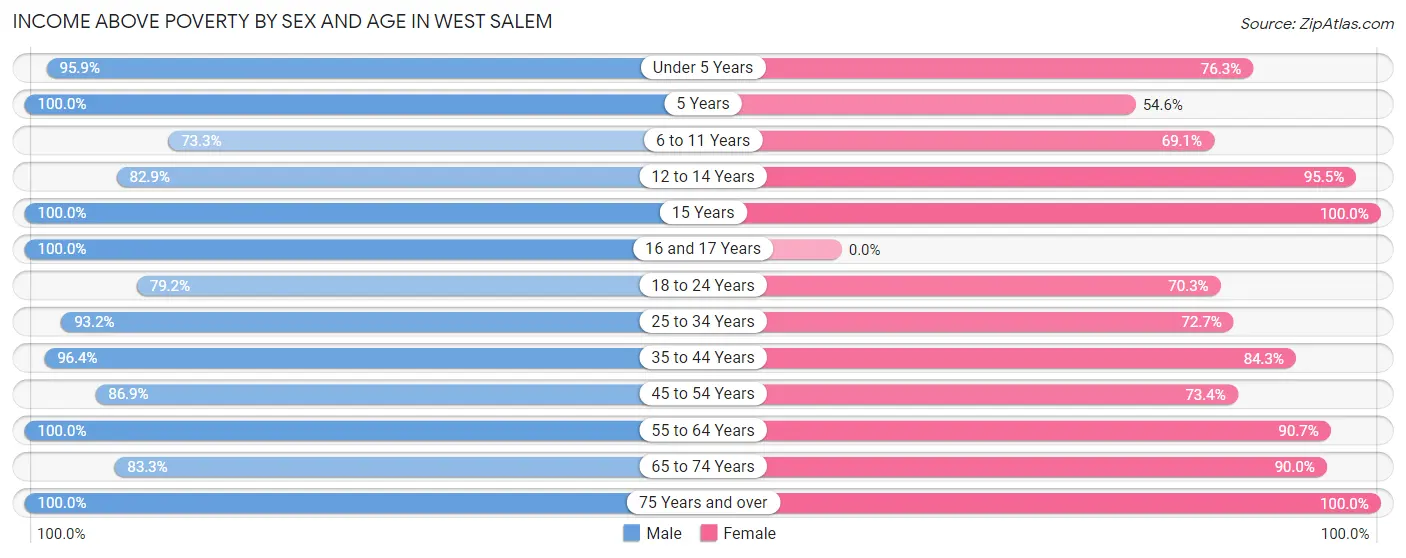
| Age Bracket | Male | Female |
| Under 5 Years | 47 (95.9%) | 29 (76.3%) |
| 5 Years | 21 (100.0%) | 6 (54.5%) |
| 6 to 11 Years | 33 (73.3%) | 29 (69.1%) |
| 12 to 14 Years | 34 (82.9%) | 21 (95.5%) |
| 15 Years | 10 (100.0%) | 15 (100.0%) |
| 16 and 17 Years | 11 (100.0%) | 0 (0.0%) |
| 18 to 24 Years | 57 (79.2%) | 52 (70.3%) |
| 25 to 34 Years | 96 (93.2%) | 56 (72.7%) |
| 35 to 44 Years | 106 (96.4%) | 91 (84.3%) |
| 45 to 54 Years | 86 (86.9%) | 47 (73.4%) |
| 55 to 64 Years | 88 (100.0%) | 88 (90.7%) |
| 65 to 74 Years | 125 (83.3%) | 99 (90.0%) |
| 75 Years and over | 23 (100.0%) | 17 (100.0%) |
| Total | 737 (89.7%) | 550 (81.5%) |
Income Below Poverty Among Married-Couple Families in West Salem
The poverty statistics for married-couple families in West Salem show that 4.5% or 14 of the total 311 families live below the poverty line. Families with 1 or 2 children have the highest poverty rate of 10.8%, comprising of 7 families. On the other hand, families with 3 or 4 children have the lowest poverty rate of 0.0%, which includes 0 families.
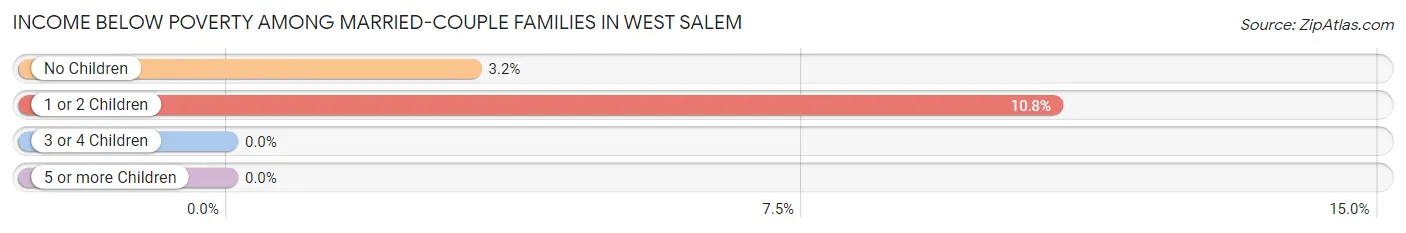
| Children | Above Poverty | Below Poverty |
| No Children | 213 (96.8%) | 7 (3.2%) |
| 1 or 2 Children | 58 (89.2%) | 7 (10.8%) |
| 3 or 4 Children | 22 (100.0%) | 0 (0.0%) |
| 5 or more Children | 4 (100.0%) | 0 (0.0%) |
| Total | 297 (95.5%) | 14 (4.5%) |
Income Below Poverty Among Single-Parent Households in West Salem
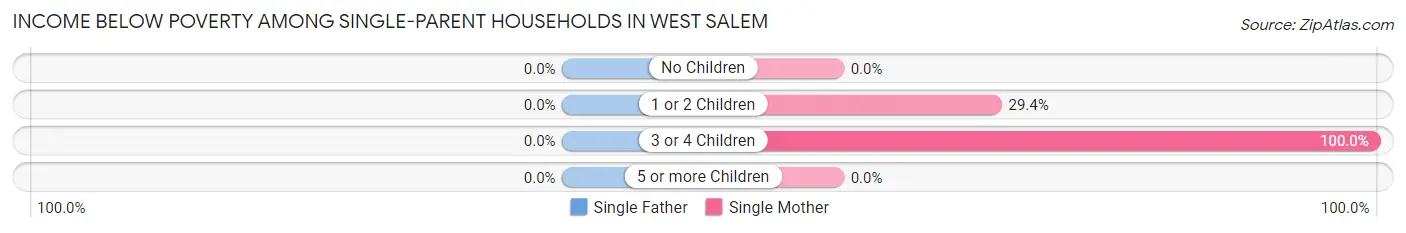
| Children | Single Father | Single Mother |
| No Children | 0 (0.0%) | 0 (0.0%) |
| 1 or 2 Children | 0 (0.0%) | 10 (29.4%) |
| 3 or 4 Children | 0 (0.0%) | 7 (100.0%) |
| 5 or more Children | 0 (0.0%) | 0 (0.0%) |
| Total | 0 (0.0%) | 17 (29.3%) |
Income Below Poverty Among Married-Couple vs Single-Parent Households in West Salem
The poverty data for West Salem shows that 14 of the married-couple family households (4.5%) and 17 of the single-parent households (13.4%) are living below the poverty level. Within the married-couple family households, those with 1 or 2 children have the highest poverty rate, with 7 households (10.8%) falling below the poverty line. Among the single-parent households, those with 3 or 4 children have the highest poverty rate, with 7 household (36.8%) living below poverty.
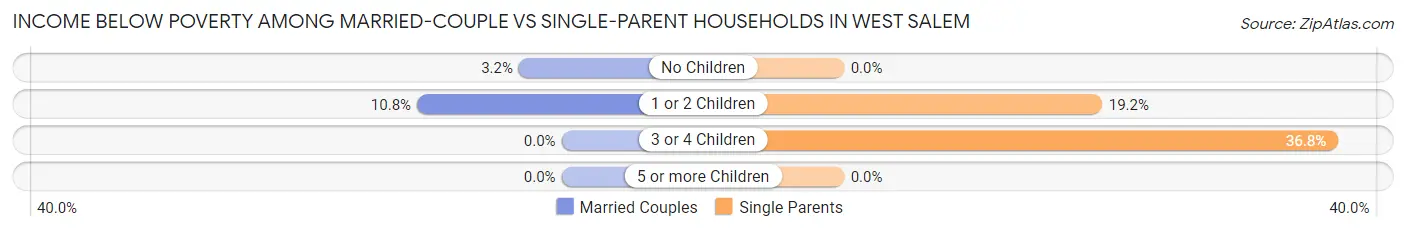
| Children | Married-Couple Families | Single-Parent Households |
| No Children | 7 (3.2%) | 0 (0.0%) |
| 1 or 2 Children | 7 (10.8%) | 10 (19.2%) |
| 3 or 4 Children | 0 (0.0%) | 7 (36.8%) |
| 5 or more Children | 0 (0.0%) | 0 (0.0%) |
| Total | 14 (4.5%) | 17 (13.4%) |
Employment Characteristics in West Salem
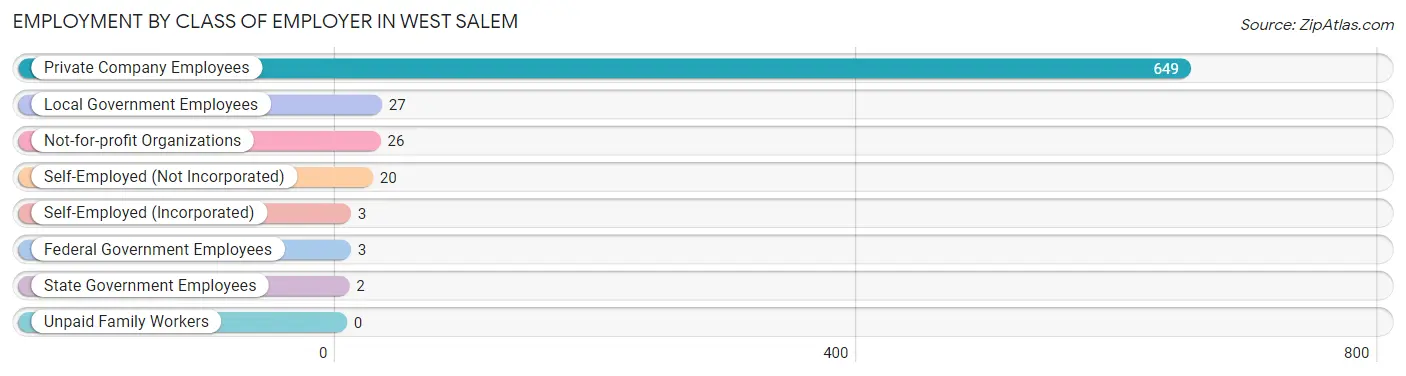
Employment by Class of Employer in West Salem
Among the 730 employed individuals in West Salem, private company employees (649 | 88.9%), local government employees (27 | 3.7%), and not-for-profit organizations (26 | 3.6%) make up the most common classes of employment.
| Employer Class | # Employees | % Employees |
| Private Company Employees | 649 | 88.9% |
| Self-Employed (Incorporated) | 3 | 0.4% |
| Self-Employed (Not Incorporated) | 20 | 2.7% |
| Not-for-profit Organizations | 26 | 3.6% |
| Local Government Employees | 27 | 3.7% |
| State Government Employees | 2 | 0.3% |
| Federal Government Employees | 3 | 0.4% |
| Unpaid Family Workers | 0 | 0.0% |
| Total | 730 | 100.0% |
Employment Status by Age in West Salem
According to the labor force statistics for West Salem, out of the total population over 16 years of age (1,203), 64.3% or 774 individuals are in the labor force, with 2.5% or 19 of them unemployed. The age group with the highest labor force participation rate is 30 to 34 years, with 91.9% or 68 individuals in the labor force. Within the labor force, the 60 to 64 years age range has the highest percentage of unemployed individuals, with 13.8% or 4 of them being unemployed.
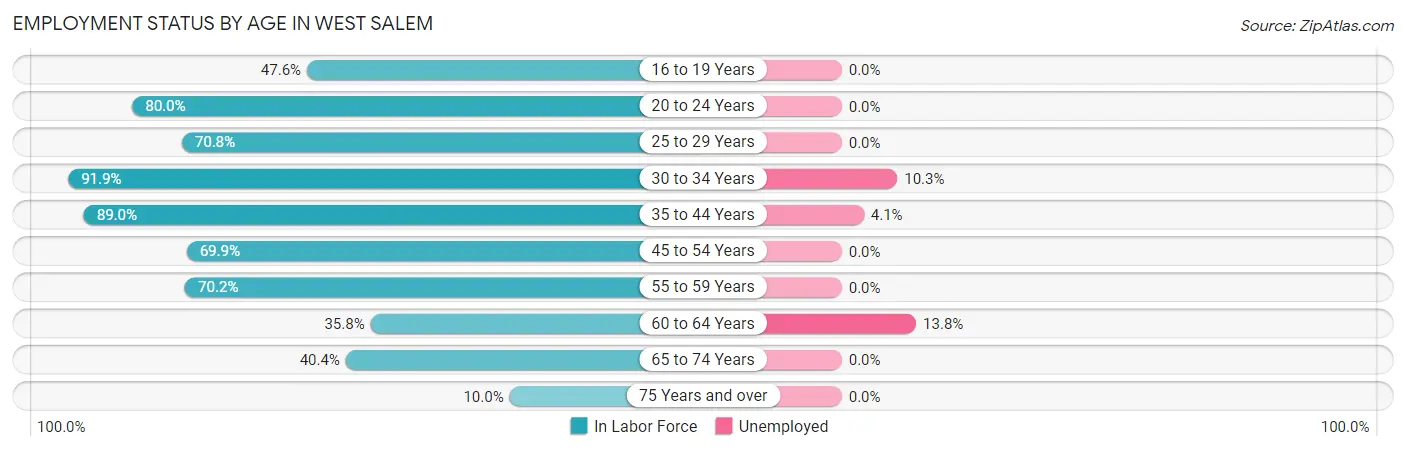
| Age Bracket | In Labor Force | Unemployed |
| 16 to 19 Years | 20 (47.6%) | 0 (0.0%) |
| 20 to 24 Years | 92 (80.0%) | 0 (0.0%) |
| 25 to 29 Years | 75 (70.8%) | 0 (0.0%) |
| 30 to 34 Years | 68 (91.9%) | 7 (10.3%) |
| 35 to 44 Years | 194 (89.0%) | 8 (4.1%) |
| 45 to 54 Years | 114 (69.9%) | 0 (0.0%) |
| 55 to 59 Years | 73 (70.2%) | 0 (0.0%) |
| 60 to 64 Years | 29 (35.8%) | 4 (13.8%) |
| 65 to 74 Years | 105 (40.4%) | 0 (0.0%) |
| 75 Years and over | 4 (10.0%) | 0 (0.0%) |
| Total | 774 (64.3%) | 19 (2.5%) |
Employment Status by Educational Attainment in West Salem
According to labor force statistics for West Salem, 74.1% of individuals (553) out of the total population between 25 and 64 years of age (746) are in the labor force, with 3.4% or 19 of them being unemployed. The group with the highest labor force participation rate are those with the educational attainment of college / associate degree, with 83.2% or 163 individuals in the labor force. Within the labor force, individuals with bachelor's degree or higher education have the highest percentage of unemployment, with 13.5% or 7 of them being unemployed.
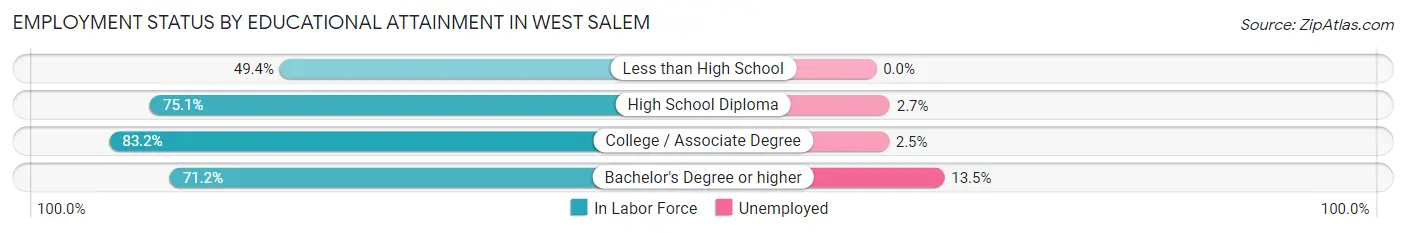
| Educational Attainment | In Labor Force | Unemployed |
| Less than High School | 39 (49.4%) | 0 (0.0%) |
| High School Diploma | 299 (75.1%) | 11 (2.7%) |
| College / Associate Degree | 163 (83.2%) | 5 (2.5%) |
| Bachelor's Degree or higher | 52 (71.2%) | 10 (13.5%) |
| Total | 553 (74.1%) | 25 (3.4%) |
Employment Occupations by Sex in West Salem
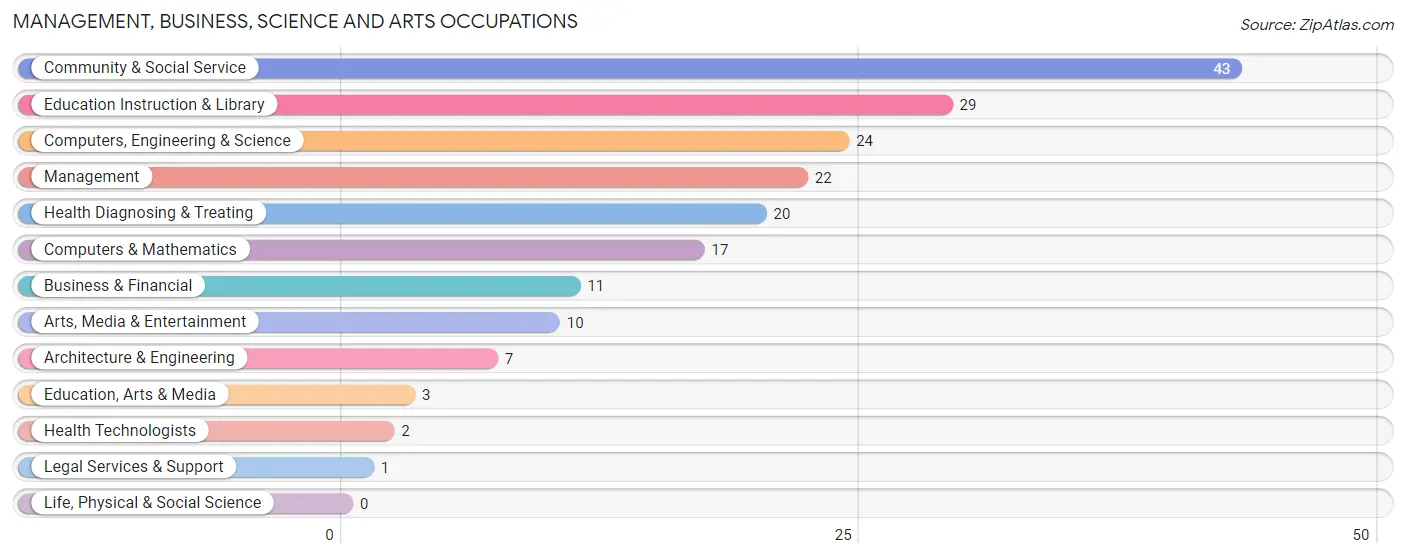
Management, Business, Science and Arts Occupations
The most common Management, Business, Science and Arts occupations in West Salem are Community & Social Service (43 | 5.7%), Education Instruction & Library (29 | 3.8%), Computers, Engineering & Science (24 | 3.2%), Management (22 | 2.9%), and Health Diagnosing & Treating (20 | 2.6%).
Management, Business, Science and Arts Occupations by Sex
Within the Management, Business, Science and Arts occupations in West Salem, the most male-oriented occupations are Architecture & Engineering (100.0%), Computers, Engineering & Science (83.3%), and Computers & Mathematics (76.5%), while the most female-oriented occupations are Education, Arts & Media (100.0%), Legal Services & Support (100.0%), and Arts, Media & Entertainment (100.0%).
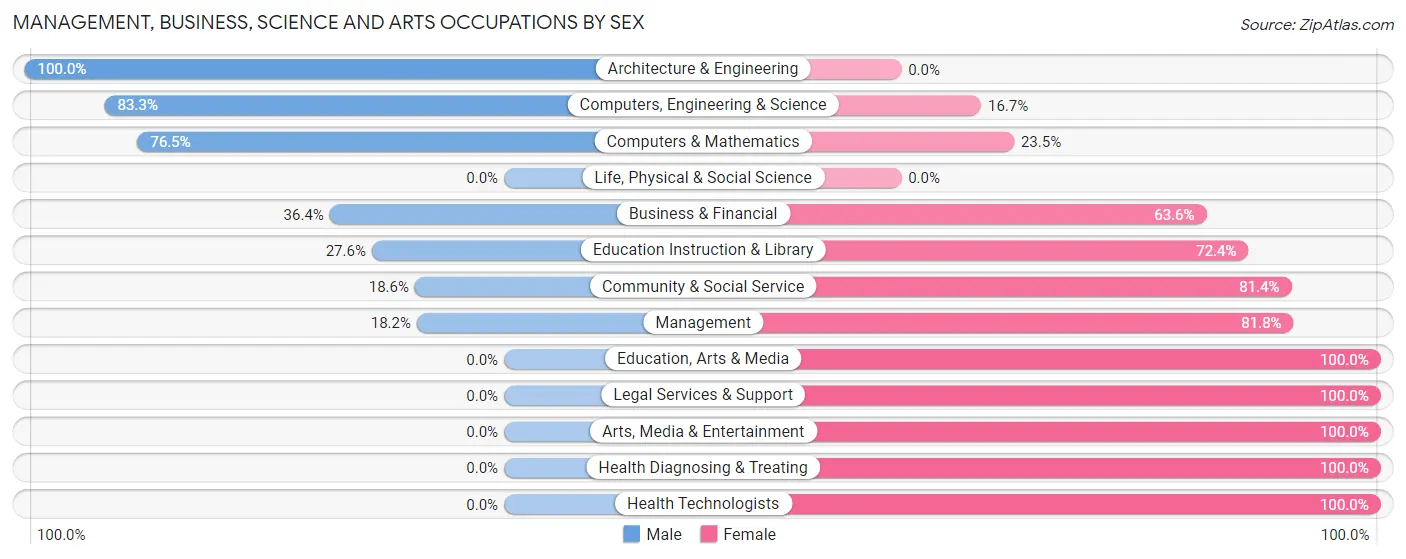
| Occupation | Male | Female |
| Management | 4 (18.2%) | 18 (81.8%) |
| Business & Financial | 4 (36.4%) | 7 (63.6%) |
| Computers, Engineering & Science | 20 (83.3%) | 4 (16.7%) |
| Computers & Mathematics | 13 (76.5%) | 4 (23.5%) |
| Architecture & Engineering | 7 (100.0%) | 0 (0.0%) |
| Life, Physical & Social Science | 0 (0.0%) | 0 (0.0%) |
| Community & Social Service | 8 (18.6%) | 35 (81.4%) |
| Education, Arts & Media | 0 (0.0%) | 3 (100.0%) |
| Legal Services & Support | 0 (0.0%) | 1 (100.0%) |
| Education Instruction & Library | 8 (27.6%) | 21 (72.4%) |
| Arts, Media & Entertainment | 0 (0.0%) | 10 (100.0%) |
| Health Diagnosing & Treating | 0 (0.0%) | 20 (100.0%) |
| Health Technologists | 0 (0.0%) | 2 (100.0%) |
| Total (Category) | 36 (30.0%) | 84 (70.0%) |
| Total (Overall) | 485 (64.2%) | 270 (35.8%) |
Services Occupations
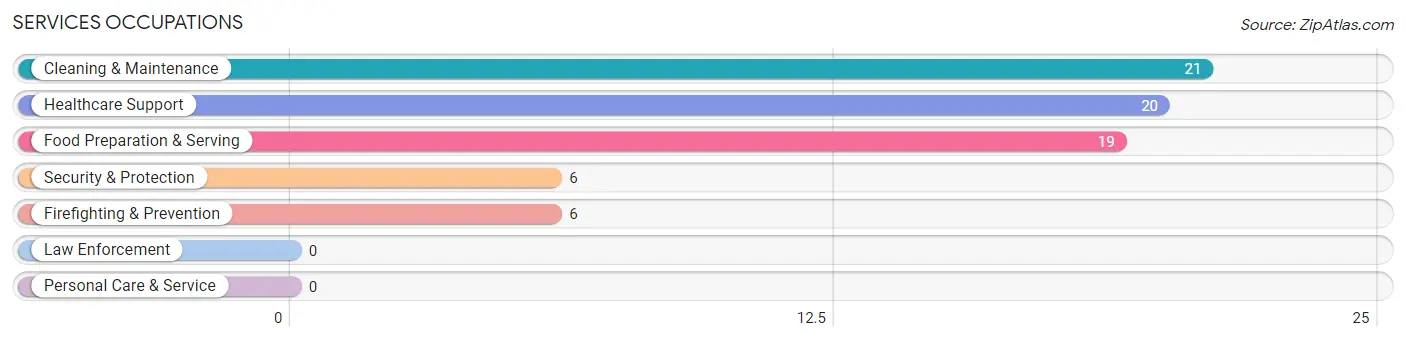
The most common Services occupations in West Salem are Cleaning & Maintenance (21 | 2.8%), Healthcare Support (20 | 2.6%), Food Preparation & Serving (19 | 2.5%), Security & Protection (6 | 0.8%), and Firefighting & Prevention (6 | 0.8%).
Services Occupations by Sex
Within the Services occupations in West Salem, the most male-oriented occupations are Security & Protection (100.0%), Firefighting & Prevention (100.0%), and Cleaning & Maintenance (57.1%), while the most female-oriented occupations are Healthcare Support (100.0%), Food Preparation & Serving (100.0%), and Cleaning & Maintenance (42.9%).
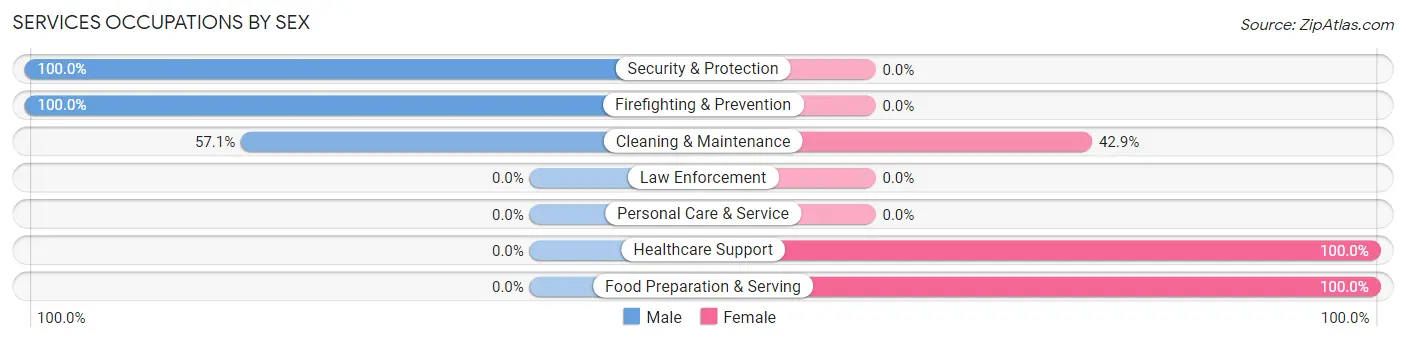
| Occupation | Male | Female |
| Healthcare Support | 0 (0.0%) | 20 (100.0%) |
| Security & Protection | 6 (100.0%) | 0 (0.0%) |
| Firefighting & Prevention | 6 (100.0%) | 0 (0.0%) |
| Law Enforcement | 0 (0.0%) | 0 (0.0%) |
| Food Preparation & Serving | 0 (0.0%) | 19 (100.0%) |
| Cleaning & Maintenance | 12 (57.1%) | 9 (42.9%) |
| Personal Care & Service | 0 (0.0%) | 0 (0.0%) |
| Total (Category) | 18 (27.3%) | 48 (72.7%) |
| Total (Overall) | 485 (64.2%) | 270 (35.8%) |
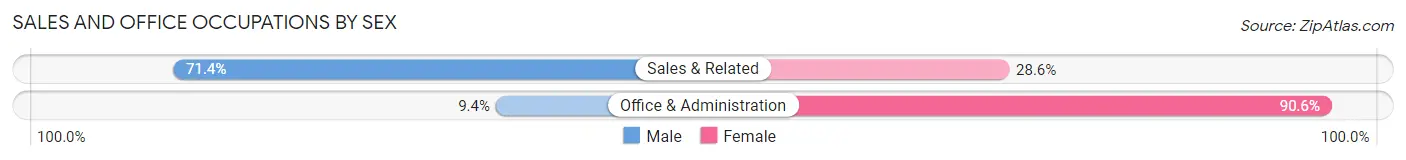
Sales and Office Occupations
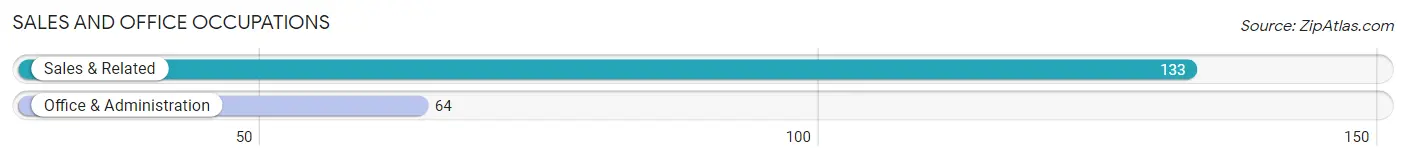
The most common Sales and Office occupations in West Salem are Sales & Related (133 | 17.6%), and Office & Administration (64 | 8.5%).
Sales and Office Occupations by Sex
| Occupation | Male | Female |
| Sales & Related | 95 (71.4%) | 38 (28.6%) |
| Office & Administration | 6 (9.4%) | 58 (90.6%) |
| Total (Category) | 101 (51.3%) | 96 (48.7%) |
| Total (Overall) | 485 (64.2%) | 270 (35.8%) |
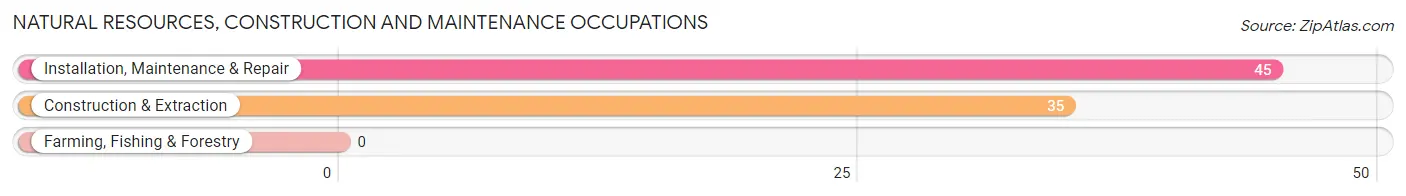
Natural Resources, Construction and Maintenance Occupations
The most common Natural Resources, Construction and Maintenance occupations in West Salem are Installation, Maintenance & Repair (45 | 6.0%), and Construction & Extraction (35 | 4.6%).
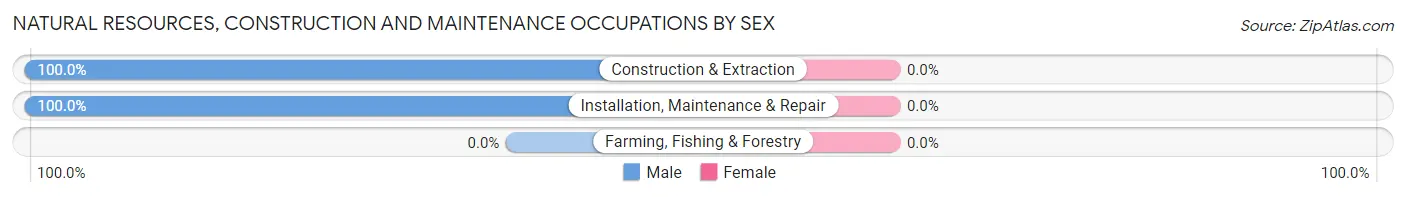
Natural Resources, Construction and Maintenance Occupations by Sex
| Occupation | Male | Female |
| Farming, Fishing & Forestry | 0 (0.0%) | 0 (0.0%) |
| Construction & Extraction | 35 (100.0%) | 0 (0.0%) |
| Installation, Maintenance & Repair | 45 (100.0%) | 0 (0.0%) |
| Total (Category) | 80 (100.0%) | 0 (0.0%) |
| Total (Overall) | 485 (64.2%) | 270 (35.8%) |
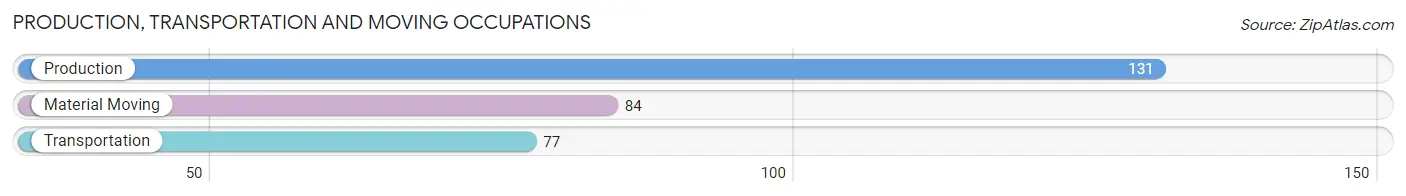
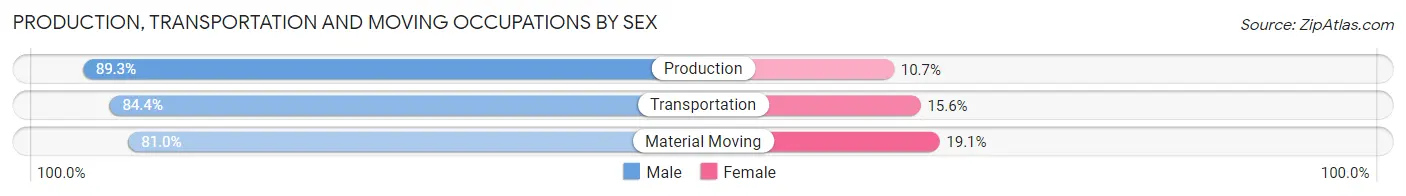
Production, Transportation and Moving Occupations
The most common Production, Transportation and Moving occupations in West Salem are Production (131 | 17.3%), Material Moving (84 | 11.1%), and Transportation (77 | 10.2%).
Production, Transportation and Moving Occupations by Sex
| Occupation | Male | Female |
| Production | 117 (89.3%) | 14 (10.7%) |
| Transportation | 65 (84.4%) | 12 (15.6%) |
| Material Moving | 68 (80.9%) | 16 (19.1%) |
| Total (Category) | 250 (85.6%) | 42 (14.4%) |
| Total (Overall) | 485 (64.2%) | 270 (35.8%) |
Employment Industries by Sex in West Salem
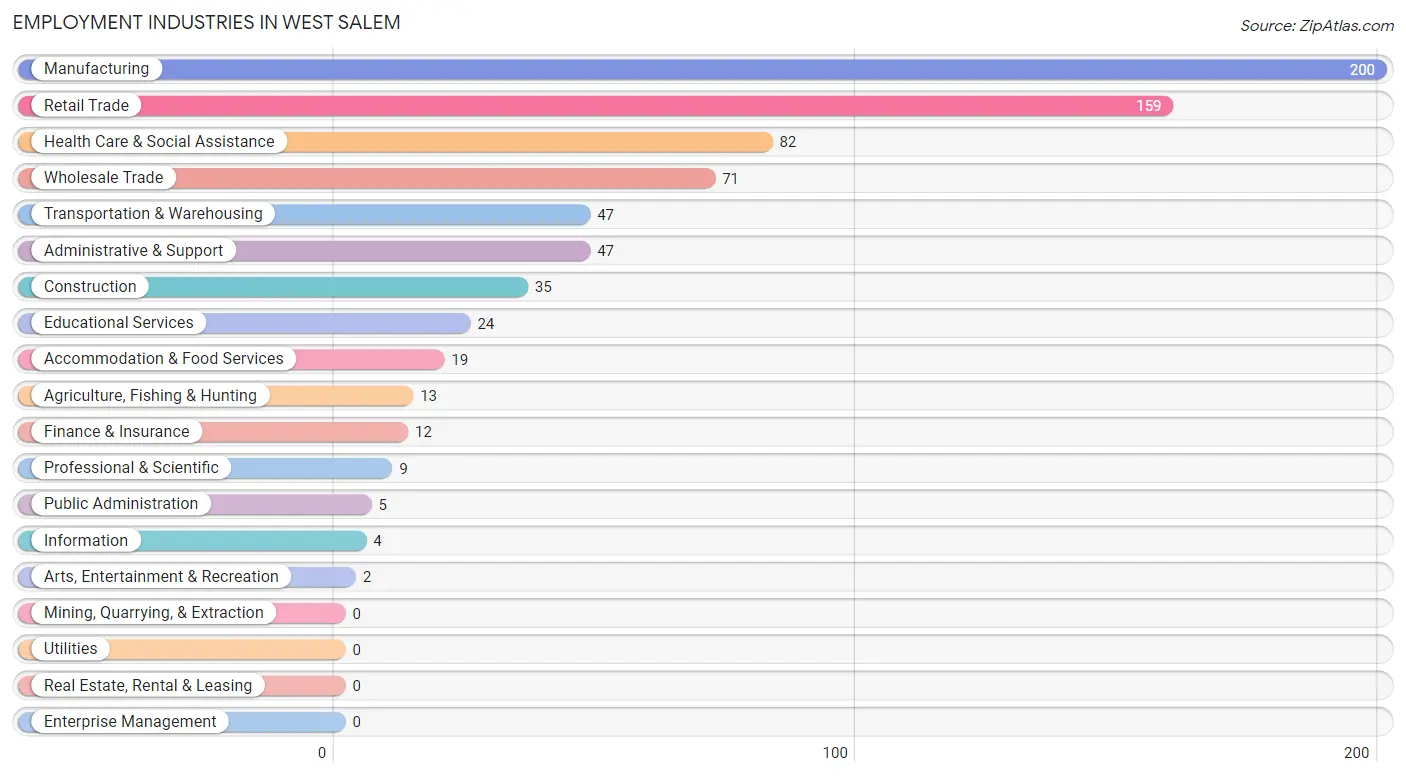
Employment Industries in West Salem
The major employment industries in West Salem include Manufacturing (200 | 26.5%), Retail Trade (159 | 21.1%), Health Care & Social Assistance (82 | 10.9%), Wholesale Trade (71 | 9.4%), and Transportation & Warehousing (47 | 6.2%).
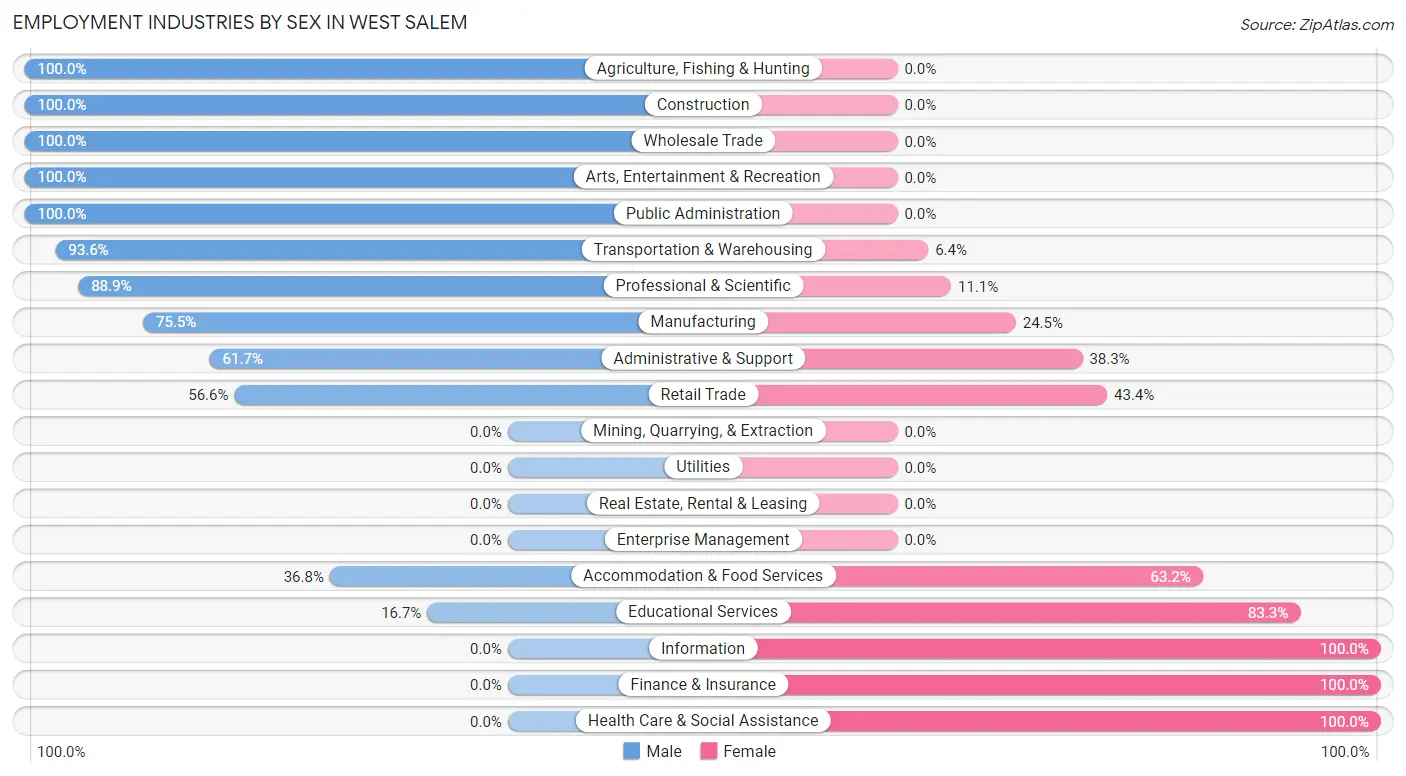
Employment Industries by Sex in West Salem
The West Salem industries that see more men than women are Agriculture, Fishing & Hunting (100.0%), Construction (100.0%), and Wholesale Trade (100.0%), whereas the industries that tend to have a higher number of women are Information (100.0%), Finance & Insurance (100.0%), and Health Care & Social Assistance (100.0%).
| Industry | Male | Female |
| Agriculture, Fishing & Hunting | 13 (100.0%) | 0 (0.0%) |
| Mining, Quarrying, & Extraction | 0 (0.0%) | 0 (0.0%) |
| Construction | 35 (100.0%) | 0 (0.0%) |
| Manufacturing | 151 (75.5%) | 49 (24.5%) |
| Wholesale Trade | 71 (100.0%) | 0 (0.0%) |
| Retail Trade | 90 (56.6%) | 69 (43.4%) |
| Transportation & Warehousing | 44 (93.6%) | 3 (6.4%) |
| Utilities | 0 (0.0%) | 0 (0.0%) |
| Information | 0 (0.0%) | 4 (100.0%) |
| Finance & Insurance | 0 (0.0%) | 12 (100.0%) |
| Real Estate, Rental & Leasing | 0 (0.0%) | 0 (0.0%) |
| Professional & Scientific | 8 (88.9%) | 1 (11.1%) |
| Enterprise Management | 0 (0.0%) | 0 (0.0%) |
| Administrative & Support | 29 (61.7%) | 18 (38.3%) |
| Educational Services | 4 (16.7%) | 20 (83.3%) |
| Health Care & Social Assistance | 0 (0.0%) | 82 (100.0%) |
| Arts, Entertainment & Recreation | 2 (100.0%) | 0 (0.0%) |
| Accommodation & Food Services | 7 (36.8%) | 12 (63.2%) |
| Public Administration | 5 (100.0%) | 0 (0.0%) |
| Total | 485 (64.2%) | 270 (35.8%) |
Education in West Salem
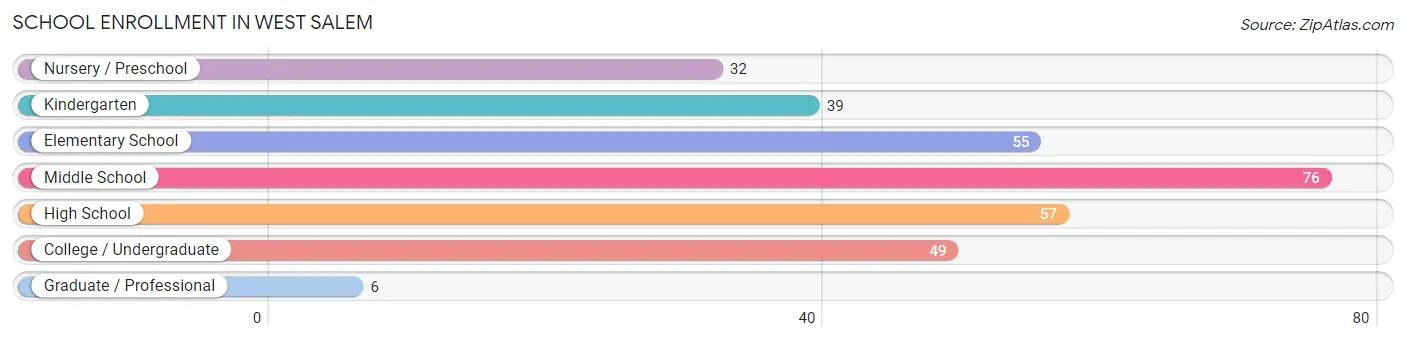
School Enrollment in West Salem
The most common levels of schooling among the 314 students in West Salem are middle school (76 | 24.2%), high school (57 | 18.1%), and elementary school (55 | 17.5%).
| School Level | # Students | % Students |
| Nursery / Preschool | 32 | 10.2% |
| Kindergarten | 39 | 12.4% |
| Elementary School | 55 | 17.5% |
| Middle School | 76 | 24.2% |
| High School | 57 | 18.1% |
| College / Undergraduate | 49 | 15.6% |
| Graduate / Professional | 6 | 1.9% |
| Total | 314 | 100.0% |
School Enrollment by Age by Funding Source in West Salem
Out of a total of 314 students who are enrolled in schools in West Salem, 46 (14.6%) attend a private institution, while the remaining 268 (85.4%) are enrolled in public schools. The age group of 25 to 34 year olds has the highest likelihood of being enrolled in private schools, with 11 (100.0% in the age bracket) enrolled. Conversely, the age group of 15 to 17 year olds has the lowest likelihood of being enrolled in a private school, with 36 (100.0% in the age bracket) attending a public institution.
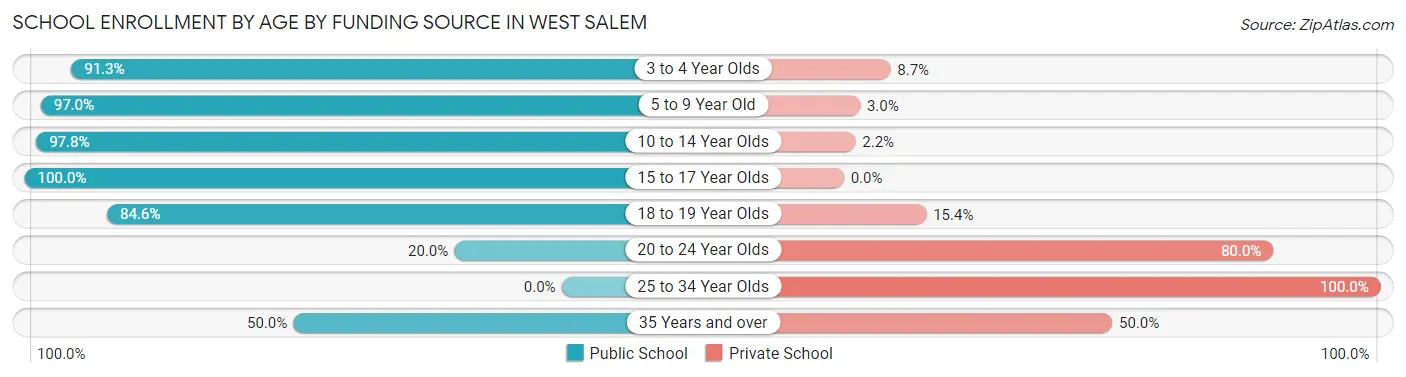
| Age Bracket | Public School | Private School |
| 3 to 4 Year Olds | 21 (91.3%) | 2 (8.7%) |
| 5 to 9 Year Old | 96 (97.0%) | 3 (3.0%) |
| 10 to 14 Year Olds | 90 (97.8%) | 2 (2.2%) |
| 15 to 17 Year Olds | 36 (100.0%) | 0 (0.0%) |
| 18 to 19 Year Olds | 11 (84.6%) | 2 (15.4%) |
| 20 to 24 Year Olds | 4 (20.0%) | 16 (80.0%) |
| 25 to 34 Year Olds | 0 (0.0%) | 11 (100.0%) |
| 35 Years and over | 10 (50.0%) | 10 (50.0%) |
| Total | 268 (85.4%) | 46 (14.6%) |
Educational Attainment by Field of Study in West Salem
Business (49 | 53.8%), science & technology (15 | 16.5%), bio, nature & agricultural (4 | 4.4%), social sciences (4 | 4.4%), and arts & humanities (4 | 4.4%) are the most common fields of study among 91 individuals in West Salem who have obtained a bachelor's degree or higher.
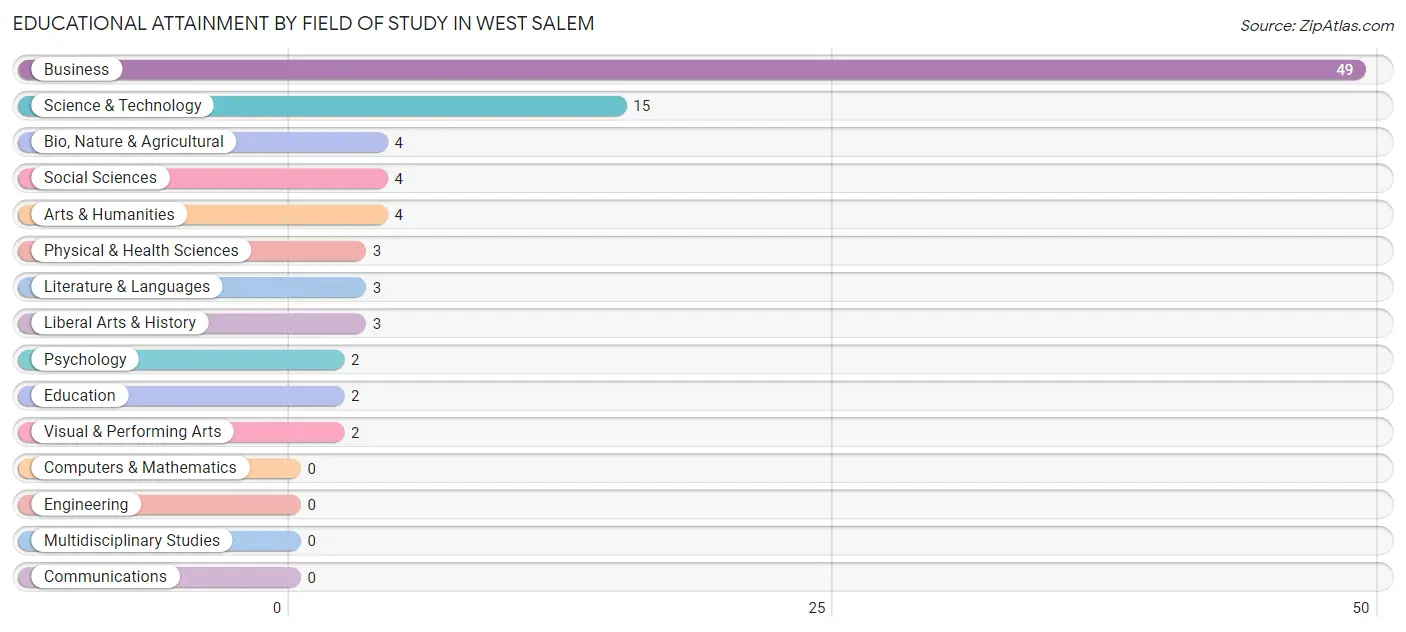
| Field of Study | # Graduates | % Graduates |
| Computers & Mathematics | 0 | 0.0% |
| Bio, Nature & Agricultural | 4 | 4.4% |
| Physical & Health Sciences | 3 | 3.3% |
| Psychology | 2 | 2.2% |
| Social Sciences | 4 | 4.4% |
| Engineering | 0 | 0.0% |
| Multidisciplinary Studies | 0 | 0.0% |
| Science & Technology | 15 | 16.5% |
| Business | 49 | 53.8% |
| Education | 2 | 2.2% |
| Literature & Languages | 3 | 3.3% |
| Liberal Arts & History | 3 | 3.3% |
| Visual & Performing Arts | 2 | 2.2% |
| Communications | 0 | 0.0% |
| Arts & Humanities | 4 | 4.4% |
| Total | 91 | 100.0% |
Transportation & Commute in West Salem
Vehicle Availability by Sex in West Salem
The most prevalent vehicle ownership categories in West Salem are males with 3 vehicles (165, accounting for 34.3%) and females with 3 vehicles (37, making up 66.3%).
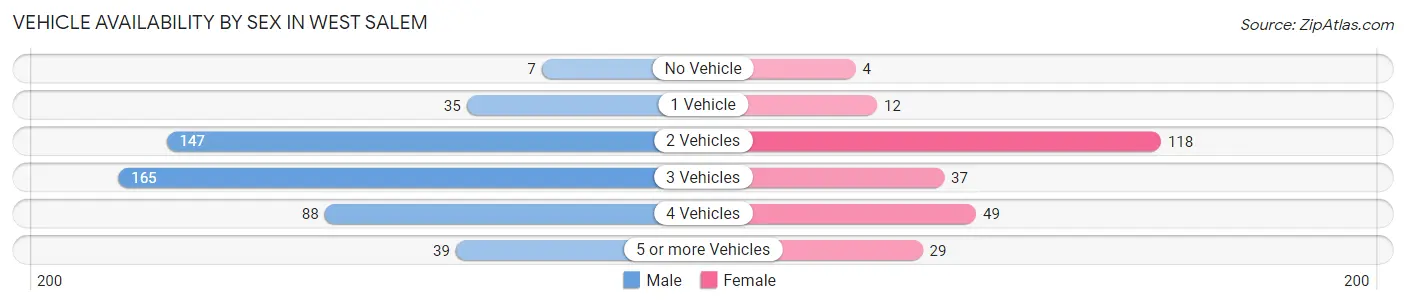
| Vehicles Available | Male | Female |
| No Vehicle | 7 (1.5%) | 4 (1.6%) |
| 1 Vehicle | 35 (7.3%) | 12 (4.8%) |
| 2 Vehicles | 147 (30.6%) | 118 (47.4%) |
| 3 Vehicles | 165 (34.3%) | 37 (14.9%) |
| 4 Vehicles | 88 (18.3%) | 49 (19.7%) |
| 5 or more Vehicles | 39 (8.1%) | 29 (11.7%) |
| Total | 481 (100.0%) | 249 (100.0%) |
Commute Time in West Salem
The most frequently occuring commute durations in West Salem are 30 to 34 minutes (108 commuters, 15.2%), 15 to 19 minutes (105 commuters, 14.8%), and 20 to 24 minutes (91 commuters, 12.8%).
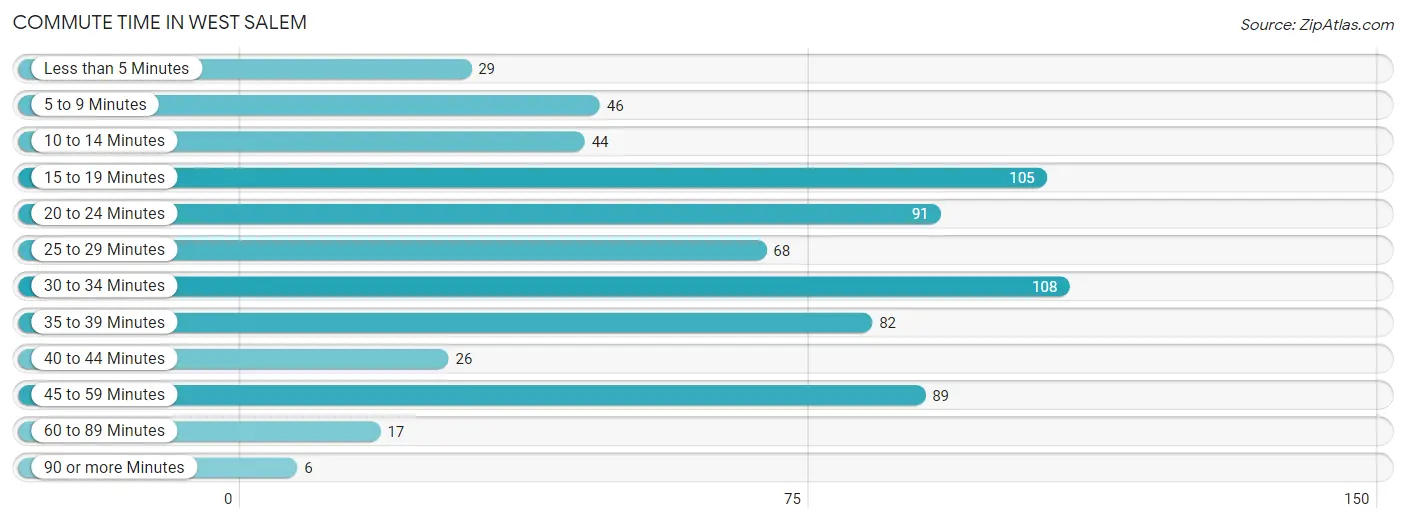
| Commute Time | # Commuters | % Commuters |
| Less than 5 Minutes | 29 | 4.1% |
| 5 to 9 Minutes | 46 | 6.5% |
| 10 to 14 Minutes | 44 | 6.2% |
| 15 to 19 Minutes | 105 | 14.8% |
| 20 to 24 Minutes | 91 | 12.8% |
| 25 to 29 Minutes | 68 | 9.6% |
| 30 to 34 Minutes | 108 | 15.2% |
| 35 to 39 Minutes | 82 | 11.5% |
| 40 to 44 Minutes | 26 | 3.7% |
| 45 to 59 Minutes | 89 | 12.5% |
| 60 to 89 Minutes | 17 | 2.4% |
| 90 or more Minutes | 6 | 0.8% |
Commute Time by Sex in West Salem
The most common commute times in West Salem are 35 to 39 minutes (72 commuters, 15.4%) for males and 15 to 19 minutes (63 commuters, 25.7%) for females.
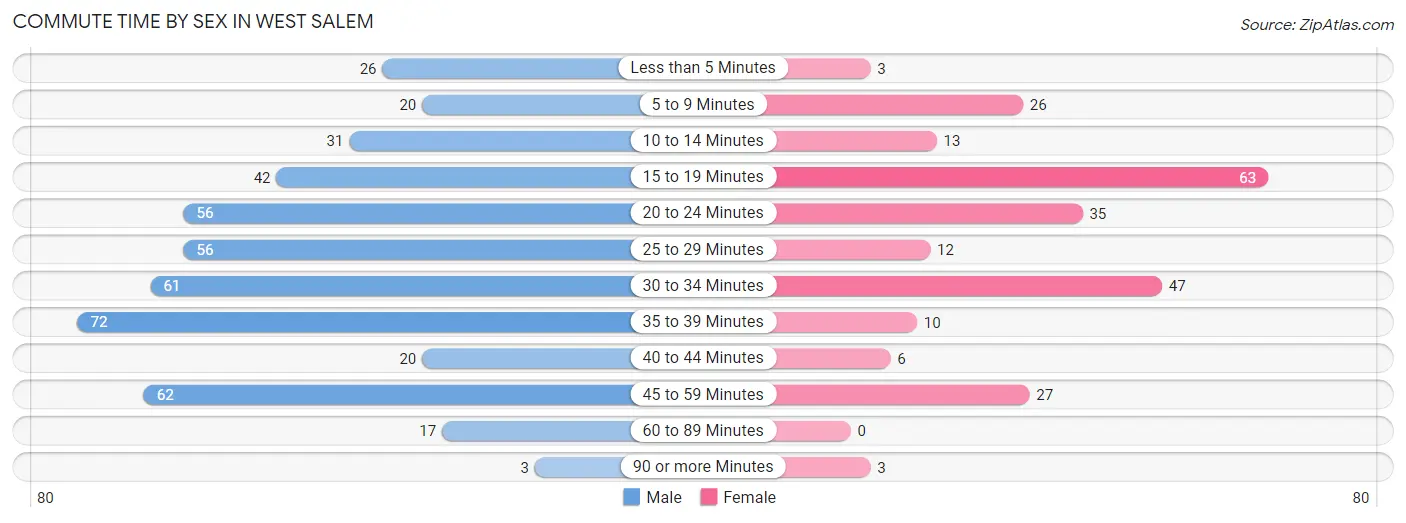
| Commute Time | Male | Female |
| Less than 5 Minutes | 26 (5.6%) | 3 (1.2%) |
| 5 to 9 Minutes | 20 (4.3%) | 26 (10.6%) |
| 10 to 14 Minutes | 31 (6.7%) | 13 (5.3%) |
| 15 to 19 Minutes | 42 (9.0%) | 63 (25.7%) |
| 20 to 24 Minutes | 56 (12.0%) | 35 (14.3%) |
| 25 to 29 Minutes | 56 (12.0%) | 12 (4.9%) |
| 30 to 34 Minutes | 61 (13.1%) | 47 (19.2%) |
| 35 to 39 Minutes | 72 (15.4%) | 10 (4.1%) |
| 40 to 44 Minutes | 20 (4.3%) | 6 (2.5%) |
| 45 to 59 Minutes | 62 (13.3%) | 27 (11.0%) |
| 60 to 89 Minutes | 17 (3.6%) | 0 (0.0%) |
| 90 or more Minutes | 3 (0.6%) | 3 (1.2%) |
Time of Departure to Work by Sex in West Salem
The most frequent times of departure to work in West Salem are 7:00 AM to 7:29 AM (114, 24.5%) for males and 12:00 PM to 3:59 PM (53, 21.6%) for females.
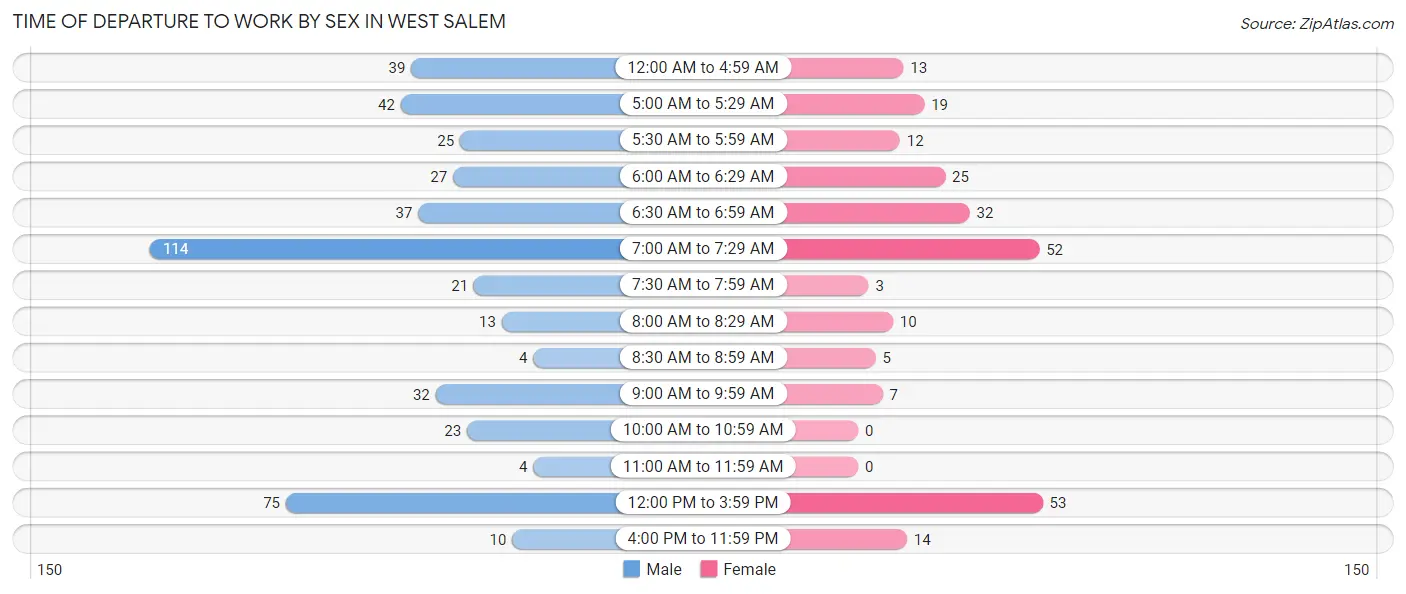
| Time of Departure | Male | Female |
| 12:00 AM to 4:59 AM | 39 (8.4%) | 13 (5.3%) |
| 5:00 AM to 5:29 AM | 42 (9.0%) | 19 (7.8%) |
| 5:30 AM to 5:59 AM | 25 (5.4%) | 12 (4.9%) |
| 6:00 AM to 6:29 AM | 27 (5.8%) | 25 (10.2%) |
| 6:30 AM to 6:59 AM | 37 (7.9%) | 32 (13.1%) |
| 7:00 AM to 7:29 AM | 114 (24.5%) | 52 (21.2%) |
| 7:30 AM to 7:59 AM | 21 (4.5%) | 3 (1.2%) |
| 8:00 AM to 8:29 AM | 13 (2.8%) | 10 (4.1%) |
| 8:30 AM to 8:59 AM | 4 (0.9%) | 5 (2.0%) |
| 9:00 AM to 9:59 AM | 32 (6.9%) | 7 (2.9%) |
| 10:00 AM to 10:59 AM | 23 (4.9%) | 0 (0.0%) |
| 11:00 AM to 11:59 AM | 4 (0.9%) | 0 (0.0%) |
| 12:00 PM to 3:59 PM | 75 (16.1%) | 53 (21.6%) |
| 4:00 PM to 11:59 PM | 10 (2.1%) | 14 (5.7%) |
| Total | 466 (100.0%) | 245 (100.0%) |
Housing Occupancy in West Salem
Occupancy by Ownership in West Salem
Of the total 645 dwellings in West Salem, owner-occupied units account for 530 (82.2%), while renter-occupied units make up 115 (17.8%).
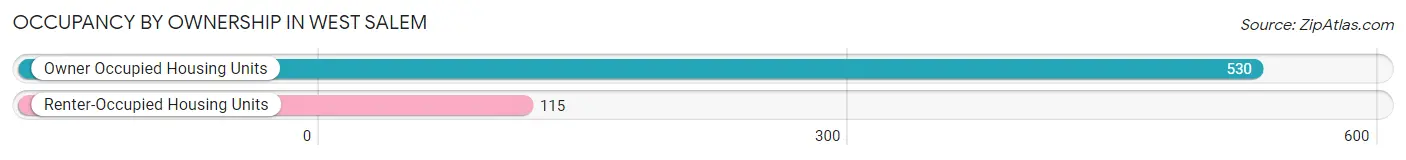
| Occupancy | # Housing Units | % Housing Units |
| Owner Occupied Housing Units | 530 | 82.2% |
| Renter-Occupied Housing Units | 115 | 17.8% |
| Total Occupied Housing Units | 645 | 100.0% |
Occupancy by Household Size in West Salem
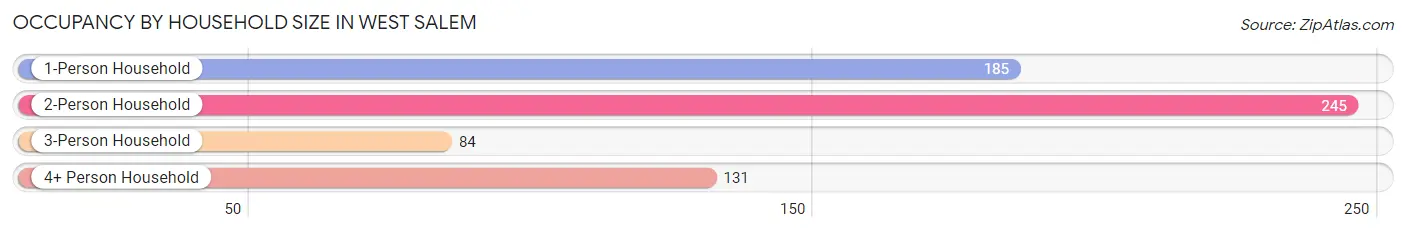
| Household Size | # Housing Units | % Housing Units |
| 1-Person Household | 185 | 28.7% |
| 2-Person Household | 245 | 38.0% |
| 3-Person Household | 84 | 13.0% |
| 4+ Person Household | 131 | 20.3% |
| Total Housing Units | 645 | 100.0% |
Occupancy by Ownership by Household Size in West Salem
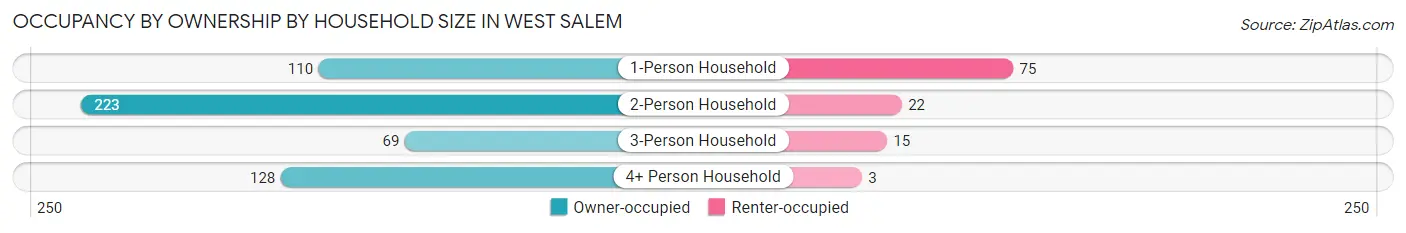
| Household Size | Owner-occupied | Renter-occupied |
| 1-Person Household | 110 (59.5%) | 75 (40.5%) |
| 2-Person Household | 223 (91.0%) | 22 (9.0%) |
| 3-Person Household | 69 (82.1%) | 15 (17.9%) |
| 4+ Person Household | 128 (97.7%) | 3 (2.3%) |
| Total Housing Units | 530 (82.2%) | 115 (17.8%) |
Occupancy by Educational Attainment in West Salem
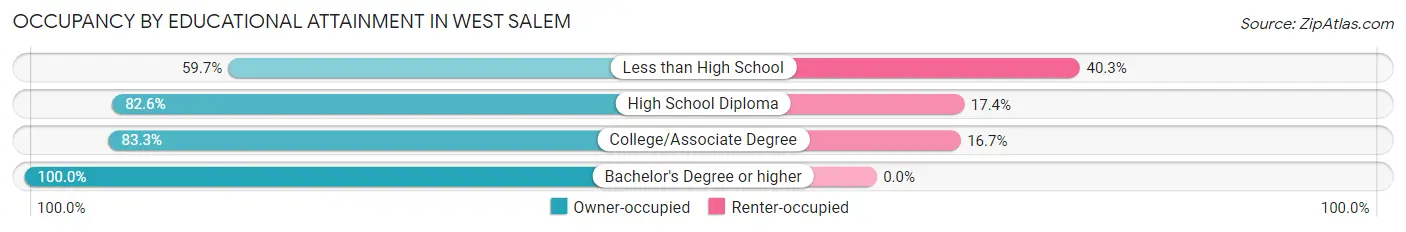
| Household Size | Owner-occupied | Renter-occupied |
| Less than High School | 37 (59.7%) | 25 (40.3%) |
| High School Diploma | 309 (82.6%) | 65 (17.4%) |
| College/Associate Degree | 125 (83.3%) | 25 (16.7%) |
| Bachelor's Degree or higher | 59 (100.0%) | 0 (0.0%) |
Occupancy by Age of Householder in West Salem
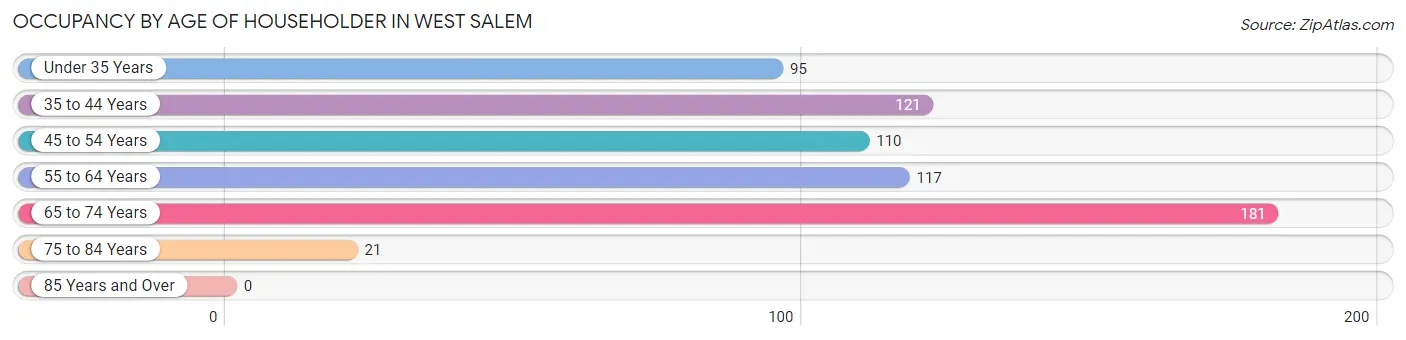
| Age Bracket | # Households | % Households |
| Under 35 Years | 95 | 14.7% |
| 35 to 44 Years | 121 | 18.8% |
| 45 to 54 Years | 110 | 17.1% |
| 55 to 64 Years | 117 | 18.1% |
| 65 to 74 Years | 181 | 28.1% |
| 75 to 84 Years | 21 | 3.3% |
| 85 Years and Over | 0 | 0.0% |
| Total | 645 | 100.0% |
Housing Finances in West Salem
Median Income by Occupancy in West Salem
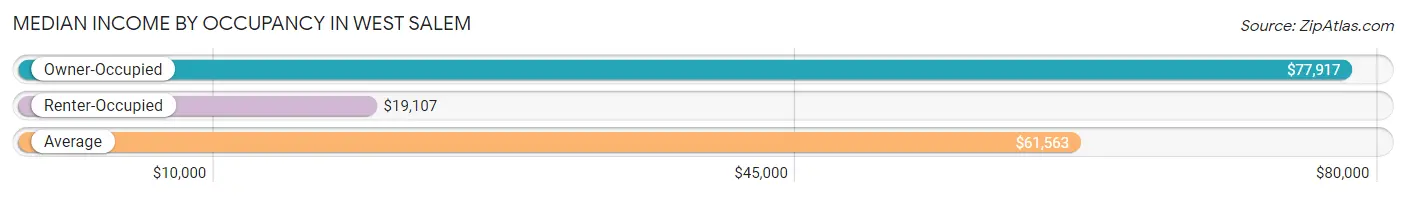
| Occupancy Type | # Households | Median Income |
| Owner-Occupied | 530 (82.2%) | $77,917 |
| Renter-Occupied | 115 (17.8%) | $19,107 |
| Average | 645 (100.0%) | $61,563 |
Occupancy by Householder Income Bracket in West Salem
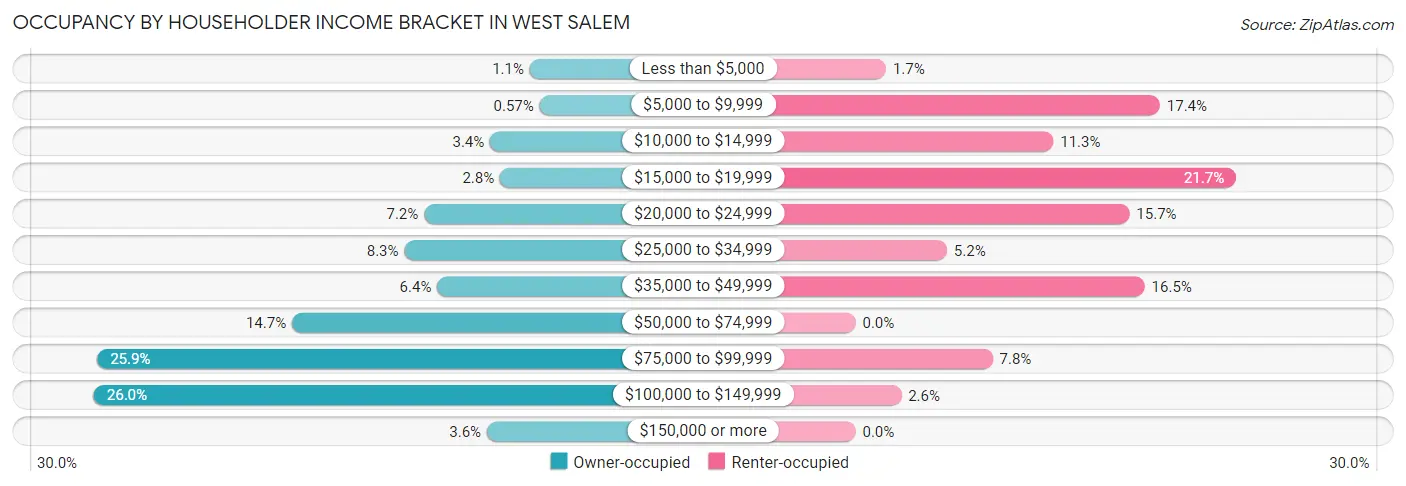
| Income Bracket | Owner-occupied | Renter-occupied |
| Less than $5,000 | 6 (1.1%) | 2 (1.7%) |
| $5,000 to $9,999 | 3 (0.6%) | 20 (17.4%) |
| $10,000 to $14,999 | 18 (3.4%) | 13 (11.3%) |
| $15,000 to $19,999 | 15 (2.8%) | 25 (21.7%) |
| $20,000 to $24,999 | 38 (7.2%) | 18 (15.7%) |
| $25,000 to $34,999 | 44 (8.3%) | 6 (5.2%) |
| $35,000 to $49,999 | 34 (6.4%) | 19 (16.5%) |
| $50,000 to $74,999 | 78 (14.7%) | 0 (0.0%) |
| $75,000 to $99,999 | 137 (25.9%) | 9 (7.8%) |
| $100,000 to $149,999 | 138 (26.0%) | 3 (2.6%) |
| $150,000 or more | 19 (3.6%) | 0 (0.0%) |
| Total | 530 (100.0%) | 115 (100.0%) |
Monthly Housing Cost Tiers in West Salem
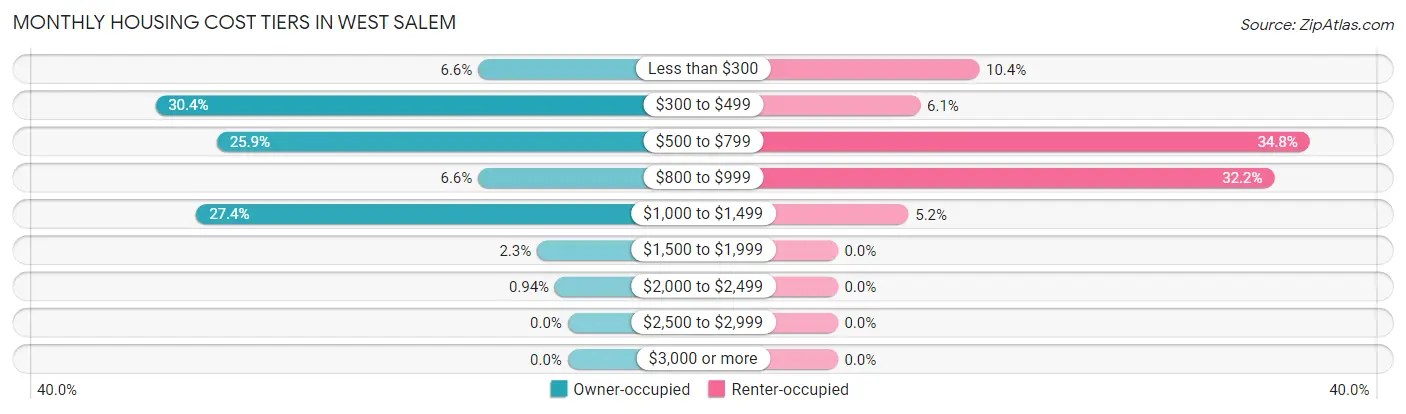
| Monthly Cost | Owner-occupied | Renter-occupied |
| Less than $300 | 35 (6.6%) | 12 (10.4%) |
| $300 to $499 | 161 (30.4%) | 7 (6.1%) |
| $500 to $799 | 137 (25.9%) | 40 (34.8%) |
| $800 to $999 | 35 (6.6%) | 37 (32.2%) |
| $1,000 to $1,499 | 145 (27.4%) | 6 (5.2%) |
| $1,500 to $1,999 | 12 (2.3%) | 0 (0.0%) |
| $2,000 to $2,499 | 5 (0.9%) | 0 (0.0%) |
| $2,500 to $2,999 | 0 (0.0%) | 0 (0.0%) |
| $3,000 or more | 0 (0.0%) | 0 (0.0%) |
| Total | 530 (100.0%) | 115 (100.0%) |
Physical Housing Characteristics in West Salem
Housing Structures in West Salem
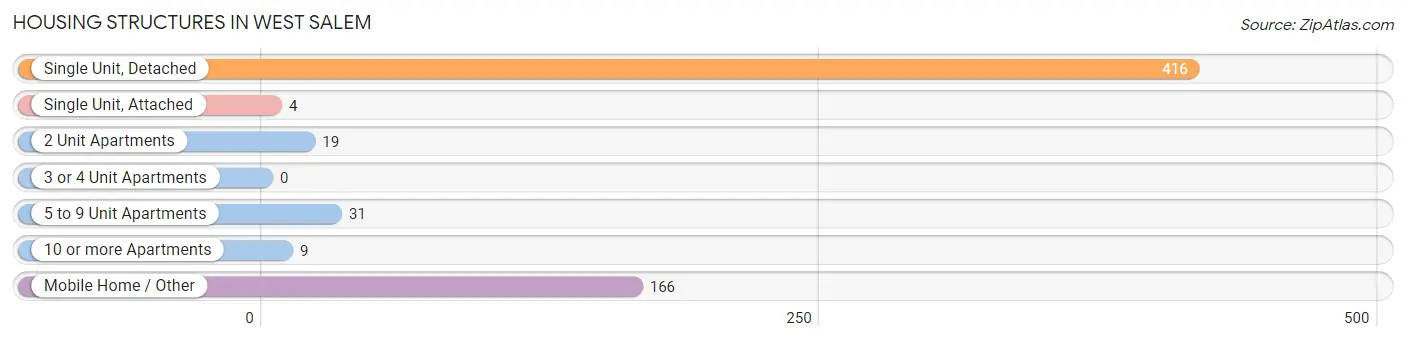
| Structure Type | # Housing Units | % Housing Units |
| Single Unit, Detached | 416 | 64.5% |
| Single Unit, Attached | 4 | 0.6% |
| 2 Unit Apartments | 19 | 2.9% |
| 3 or 4 Unit Apartments | 0 | 0.0% |
| 5 to 9 Unit Apartments | 31 | 4.8% |
| 10 or more Apartments | 9 | 1.4% |
| Mobile Home / Other | 166 | 25.7% |
| Total | 645 | 100.0% |
Housing Structures by Occupancy in West Salem
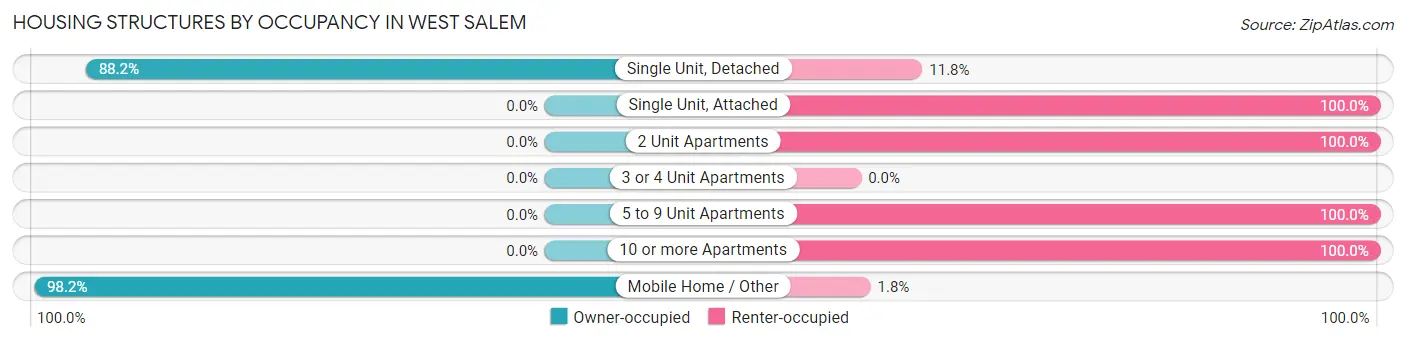
| Structure Type | Owner-occupied | Renter-occupied |
| Single Unit, Detached | 367 (88.2%) | 49 (11.8%) |
| Single Unit, Attached | 0 (0.0%) | 4 (100.0%) |
| 2 Unit Apartments | 0 (0.0%) | 19 (100.0%) |
| 3 or 4 Unit Apartments | 0 (0.0%) | 0 (0.0%) |
| 5 to 9 Unit Apartments | 0 (0.0%) | 31 (100.0%) |
| 10 or more Apartments | 0 (0.0%) | 9 (100.0%) |
| Mobile Home / Other | 163 (98.2%) | 3 (1.8%) |
| Total | 530 (82.2%) | 115 (17.8%) |
Housing Structures by Number of Rooms in West Salem
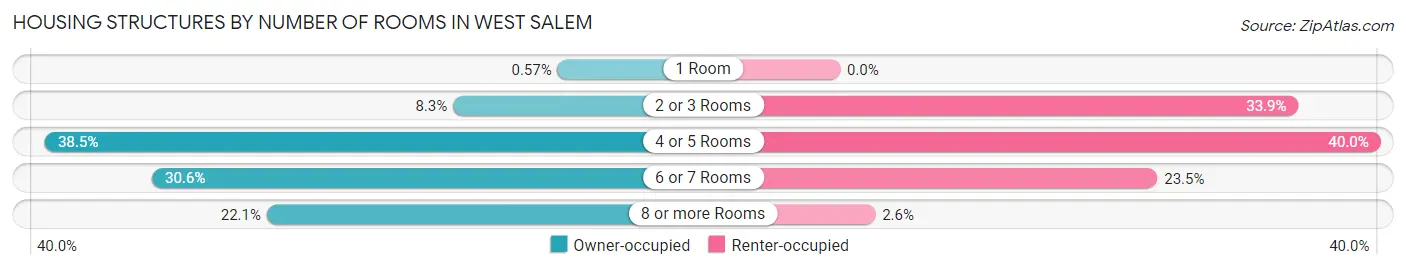
| Number of Rooms | Owner-occupied | Renter-occupied |
| 1 Room | 3 (0.6%) | 0 (0.0%) |
| 2 or 3 Rooms | 44 (8.3%) | 39 (33.9%) |
| 4 or 5 Rooms | 204 (38.5%) | 46 (40.0%) |
| 6 or 7 Rooms | 162 (30.6%) | 27 (23.5%) |
| 8 or more Rooms | 117 (22.1%) | 3 (2.6%) |
| Total | 530 (100.0%) | 115 (100.0%) |
Housing Structure by Heating Type in West Salem
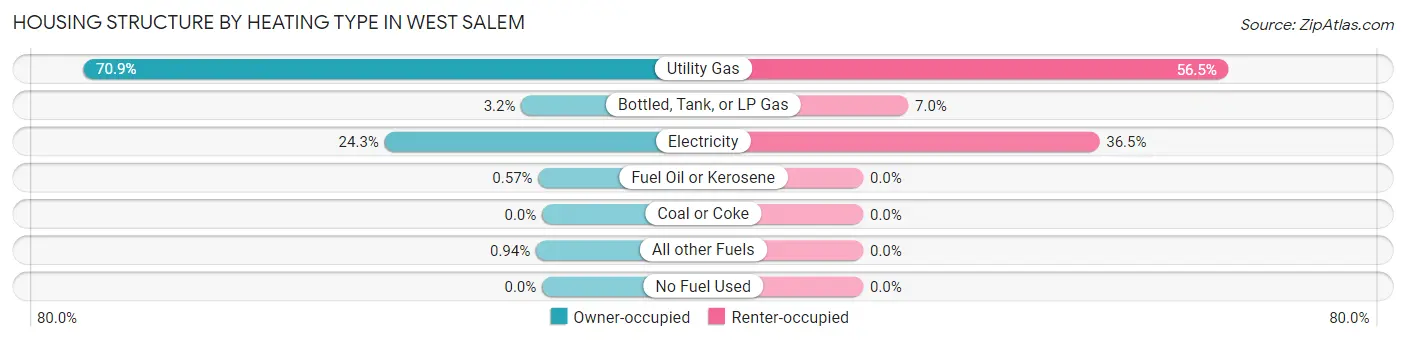
| Heating Type | Owner-occupied | Renter-occupied |
| Utility Gas | 376 (70.9%) | 65 (56.5%) |
| Bottled, Tank, or LP Gas | 17 (3.2%) | 8 (7.0%) |
| Electricity | 129 (24.3%) | 42 (36.5%) |
| Fuel Oil or Kerosene | 3 (0.6%) | 0 (0.0%) |
| Coal or Coke | 0 (0.0%) | 0 (0.0%) |
| All other Fuels | 5 (0.9%) | 0 (0.0%) |
| No Fuel Used | 0 (0.0%) | 0 (0.0%) |
| Total | 530 (100.0%) | 115 (100.0%) |
Household Vehicle Usage in West Salem
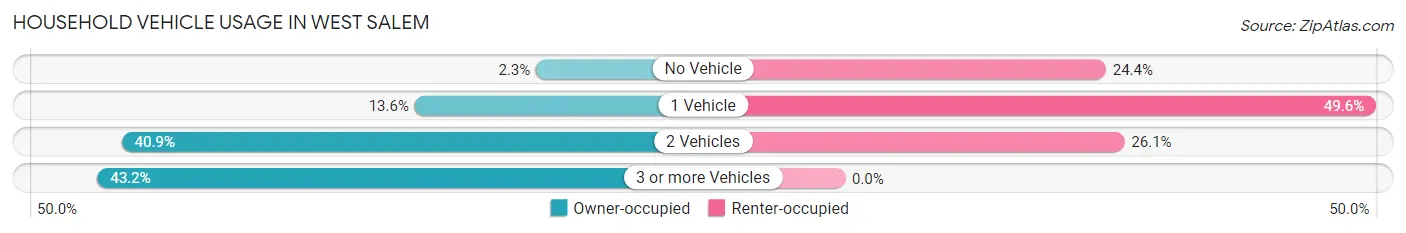
| Vehicles per Household | Owner-occupied | Renter-occupied |
| No Vehicle | 12 (2.3%) | 28 (24.3%) |
| 1 Vehicle | 72 (13.6%) | 57 (49.6%) |
| 2 Vehicles | 217 (40.9%) | 30 (26.1%) |
| 3 or more Vehicles | 229 (43.2%) | 0 (0.0%) |
| Total | 530 (100.0%) | 115 (100.0%) |
Real Estate & Mortgages in West Salem
Real Estate and Mortgage Overview in West Salem
| Characteristic | Without Mortgage | With Mortgage |
| Housing Units | 244 | 286 |
| Median Property Value | $17,400 | $136,600 |
| Median Household Income | $48,125 | $19 |
| Monthly Housing Costs | $388 | $0 |
| Real Estate Taxes | $971 | $15 |
Property Value by Mortgage Status in West Salem
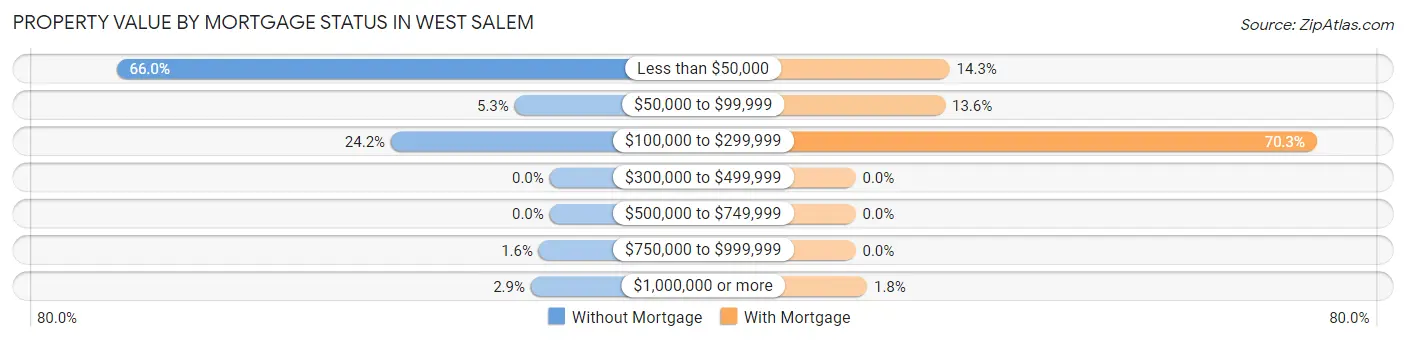
| Property Value | Without Mortgage | With Mortgage |
| Less than $50,000 | 161 (66.0%) | 41 (14.3%) |
| $50,000 to $99,999 | 13 (5.3%) | 39 (13.6%) |
| $100,000 to $299,999 | 59 (24.2%) | 201 (70.3%) |
| $300,000 to $499,999 | 0 (0.0%) | 0 (0.0%) |
| $500,000 to $749,999 | 0 (0.0%) | 0 (0.0%) |
| $750,000 to $999,999 | 4 (1.6%) | 0 (0.0%) |
| $1,000,000 or more | 7 (2.9%) | 5 (1.8%) |
| Total | 244 (100.0%) | 286 (100.0%) |
Household Income by Mortgage Status in West Salem
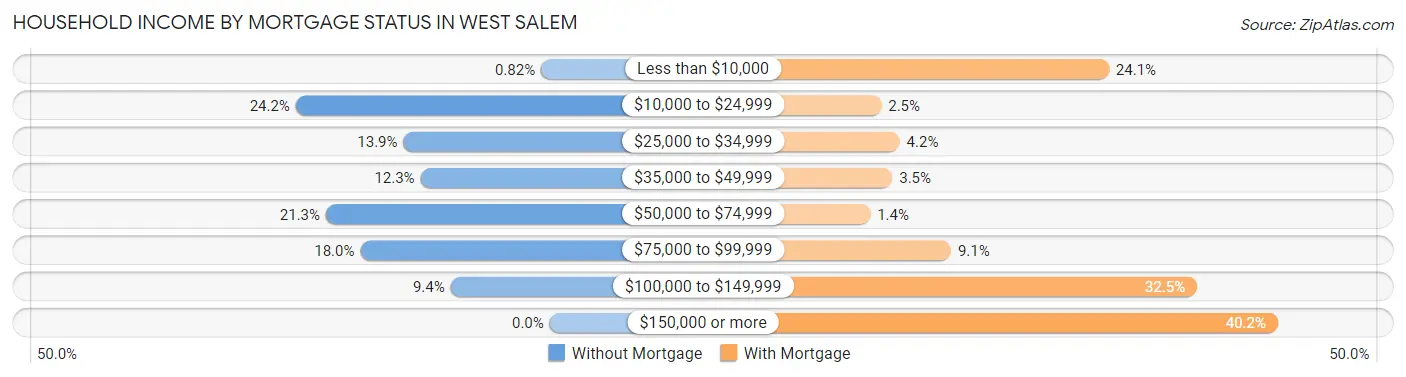
| Household Income | Without Mortgage | With Mortgage |
| Less than $10,000 | 2 (0.8%) | 69 (24.1%) |
| $10,000 to $24,999 | 59 (24.2%) | 7 (2.5%) |
| $25,000 to $34,999 | 34 (13.9%) | 12 (4.2%) |
| $35,000 to $49,999 | 30 (12.3%) | 10 (3.5%) |
| $50,000 to $74,999 | 52 (21.3%) | 4 (1.4%) |
| $75,000 to $99,999 | 44 (18.0%) | 26 (9.1%) |
| $100,000 to $149,999 | 23 (9.4%) | 93 (32.5%) |
| $150,000 or more | 0 (0.0%) | 115 (40.2%) |
| Total | 244 (100.0%) | 286 (100.0%) |
Property Value to Household Income Ratio in West Salem
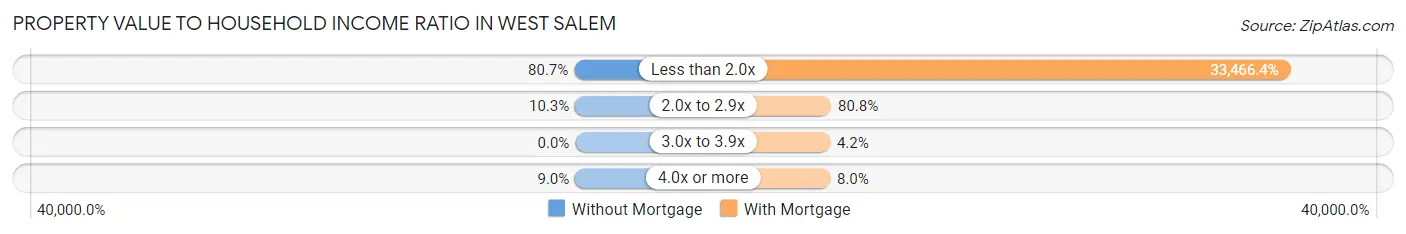
| Value-to-Income Ratio | Without Mortgage | With Mortgage |
| Less than 2.0x | 197 (80.7%) | 95,714 (33,466.4%) |
| 2.0x to 2.9x | 25 (10.2%) | 231 (80.8%) |
| 3.0x to 3.9x | 0 (0.0%) | 12 (4.2%) |
| 4.0x or more | 22 (9.0%) | 23 (8.0%) |
| Total | 244 (100.0%) | 286 (100.0%) |
Real Estate Taxes by Mortgage Status in West Salem
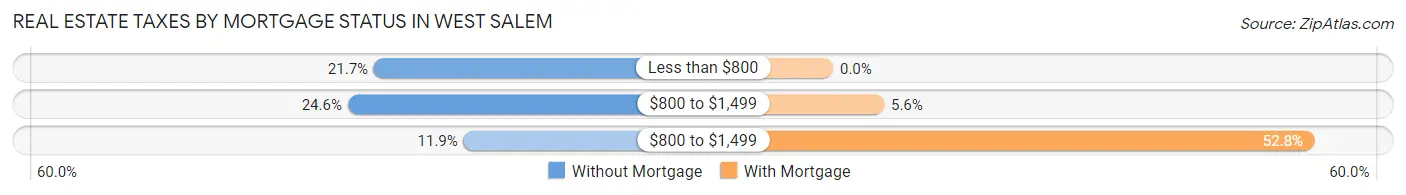
| Property Taxes | Without Mortgage | With Mortgage |
| Less than $800 | 53 (21.7%) | 0 (0.0%) |
| $800 to $1,499 | 60 (24.6%) | 16 (5.6%) |
| $800 to $1,499 | 29 (11.9%) | 151 (52.8%) |
| Total | 244 (100.0%) | 286 (100.0%) |
Health & Disability in West Salem
Health Insurance Coverage by Age in West Salem
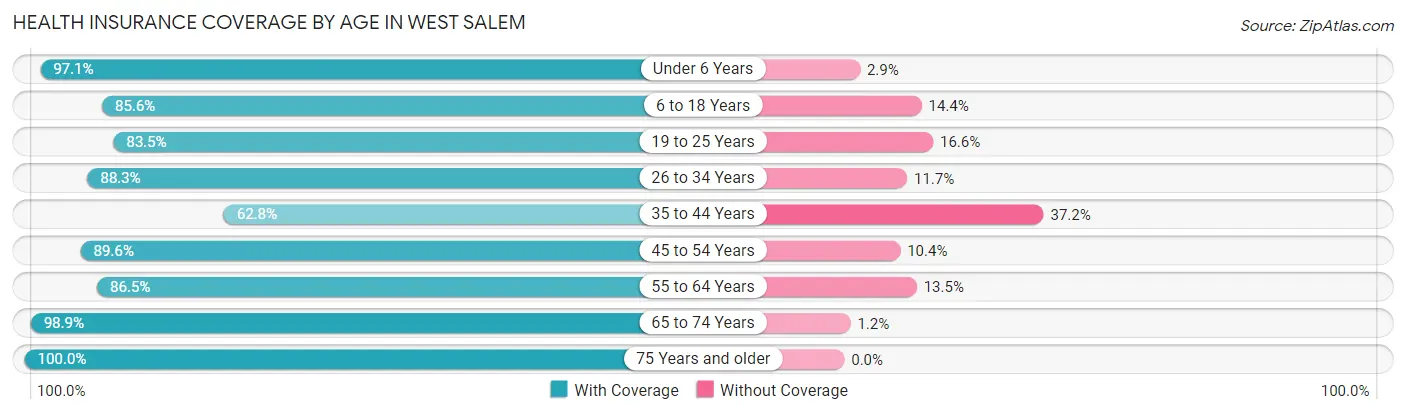
| Age Bracket | With Coverage | Without Coverage |
| Under 6 Years | 133 (97.1%) | 4 (2.9%) |
| 6 to 18 Years | 184 (85.6%) | 31 (14.4%) |
| 19 to 25 Years | 116 (83.5%) | 23 (16.6%) |
| 26 to 34 Years | 151 (88.3%) | 20 (11.7%) |
| 35 to 44 Years | 137 (62.8%) | 81 (37.2%) |
| 45 to 54 Years | 146 (89.6%) | 17 (10.4%) |
| 55 to 64 Years | 160 (86.5%) | 25 (13.5%) |
| 65 to 74 Years | 257 (98.9%) | 3 (1.1%) |
| 75 Years and older | 40 (100.0%) | 0 (0.0%) |
| Total | 1,324 (86.7%) | 204 (13.4%) |
Health Insurance Coverage by Citizenship Status in West Salem
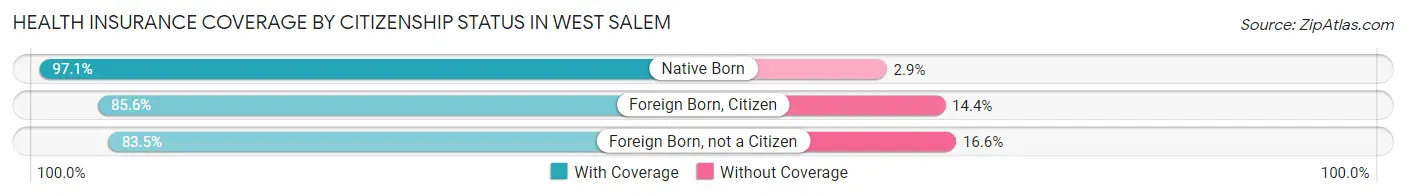
| Citizenship Status | With Coverage | Without Coverage |
| Native Born | 133 (97.1%) | 4 (2.9%) |
| Foreign Born, Citizen | 184 (85.6%) | 31 (14.4%) |
| Foreign Born, not a Citizen | 116 (83.5%) | 23 (16.6%) |
Health Insurance Coverage by Household Income in West Salem
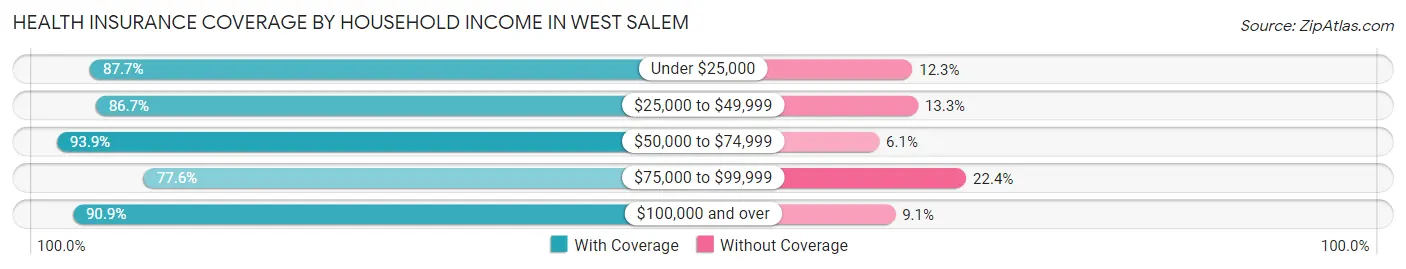
| Household Income | With Coverage | Without Coverage |
| Under $25,000 | 193 (87.7%) | 27 (12.3%) |
| $25,000 to $49,999 | 208 (86.7%) | 32 (13.3%) |
| $50,000 to $74,999 | 186 (93.9%) | 12 (6.1%) |
| $75,000 to $99,999 | 316 (77.6%) | 91 (22.4%) |
| $100,000 and over | 421 (90.9%) | 42 (9.1%) |
Public vs Private Health Insurance Coverage by Age in West Salem
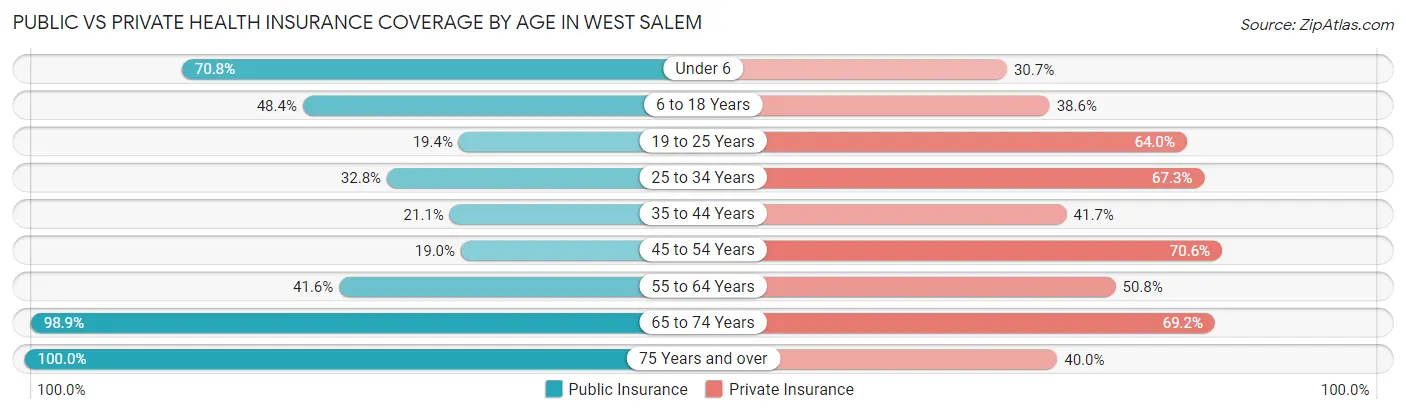
| Age Bracket | Public Insurance | Private Insurance |
| Under 6 | 97 (70.8%) | 42 (30.7%) |
| 6 to 18 Years | 104 (48.4%) | 83 (38.6%) |
| 19 to 25 Years | 27 (19.4%) | 89 (64.0%) |
| 25 to 34 Years | 56 (32.8%) | 115 (67.2%) |
| 35 to 44 Years | 46 (21.1%) | 91 (41.7%) |
| 45 to 54 Years | 31 (19.0%) | 115 (70.6%) |
| 55 to 64 Years | 77 (41.6%) | 94 (50.8%) |
| 65 to 74 Years | 257 (98.9%) | 180 (69.2%) |
| 75 Years and over | 40 (100.0%) | 16 (40.0%) |
| Total | 735 (48.1%) | 825 (54.0%) |
Disability Status by Sex by Age in West Salem
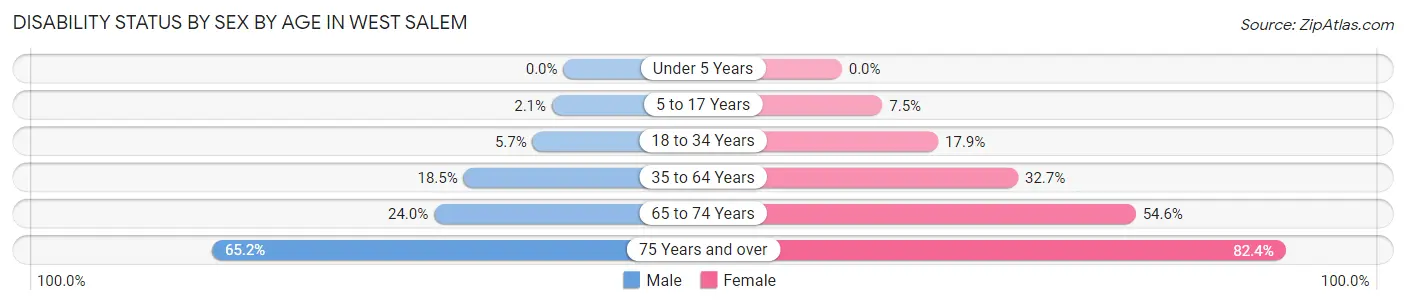
| Age Bracket | Male | Female |
| Under 5 Years | 0 (0.0%) | 0 (0.0%) |
| 5 to 17 Years | 3 (2.1%) | 7 (7.5%) |
| 18 to 34 Years | 10 (5.7%) | 27 (17.9%) |
| 35 to 64 Years | 55 (18.5%) | 88 (32.7%) |
| 65 to 74 Years | 36 (24.0%) | 60 (54.5%) |
| 75 Years and over | 15 (65.2%) | 14 (82.4%) |
Disability Class by Sex by Age in West Salem
Disability Class: Hearing Difficulty
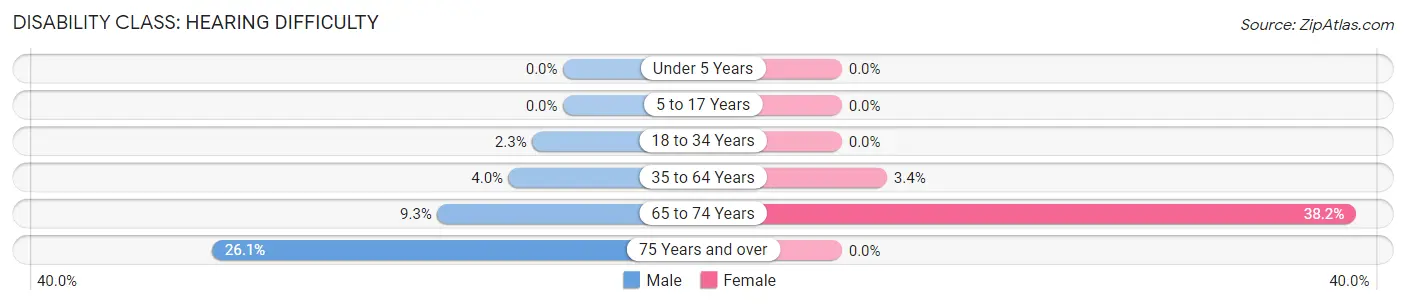
| Age Bracket | Male | Female |
| Under 5 Years | 0 (0.0%) | 0 (0.0%) |
| 5 to 17 Years | 0 (0.0%) | 0 (0.0%) |
| 18 to 34 Years | 4 (2.3%) | 0 (0.0%) |
| 35 to 64 Years | 12 (4.0%) | 9 (3.4%) |
| 65 to 74 Years | 14 (9.3%) | 42 (38.2%) |
| 75 Years and over | 6 (26.1%) | 0 (0.0%) |
Disability Class: Vision Difficulty
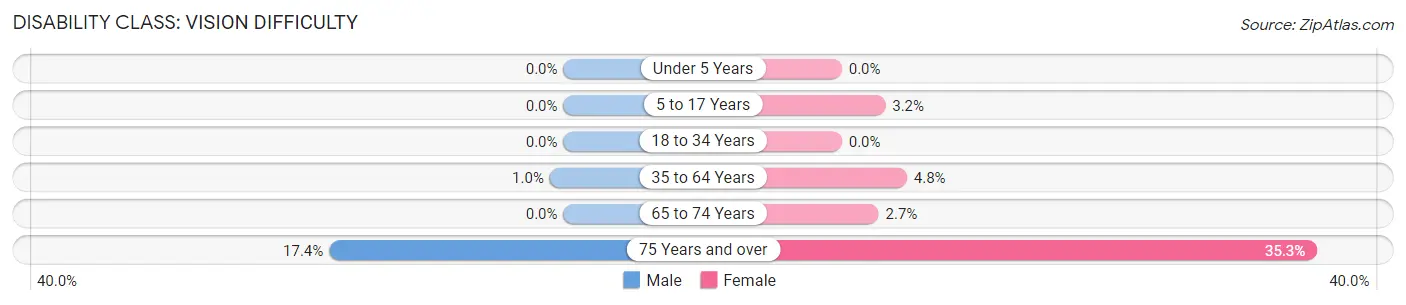
| Age Bracket | Male | Female |
| Under 5 Years | 0 (0.0%) | 0 (0.0%) |
| 5 to 17 Years | 0 (0.0%) | 3 (3.2%) |
| 18 to 34 Years | 0 (0.0%) | 0 (0.0%) |
| 35 to 64 Years | 3 (1.0%) | 13 (4.8%) |
| 65 to 74 Years | 0 (0.0%) | 3 (2.7%) |
| 75 Years and over | 4 (17.4%) | 6 (35.3%) |
Disability Class: Cognitive Difficulty
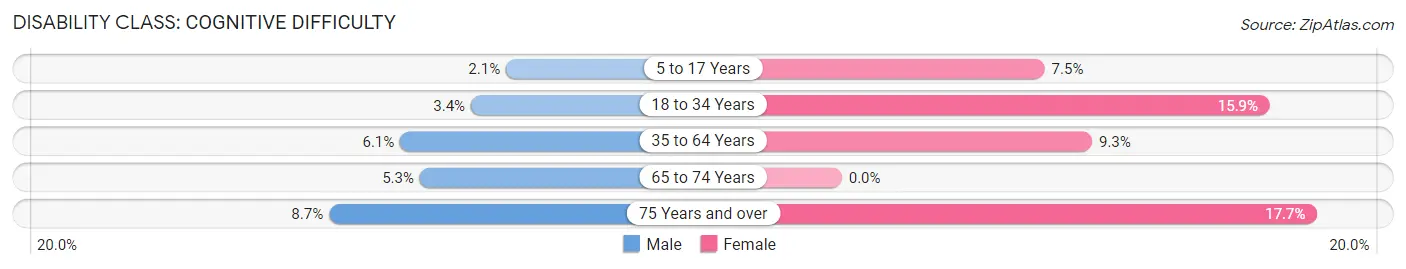
| Age Bracket | Male | Female |
| 5 to 17 Years | 3 (2.1%) | 7 (7.5%) |
| 18 to 34 Years | 6 (3.4%) | 24 (15.9%) |
| 35 to 64 Years | 18 (6.1%) | 25 (9.3%) |
| 65 to 74 Years | 8 (5.3%) | 0 (0.0%) |
| 75 Years and over | 2 (8.7%) | 3 (17.6%) |
Disability Class: Ambulatory Difficulty
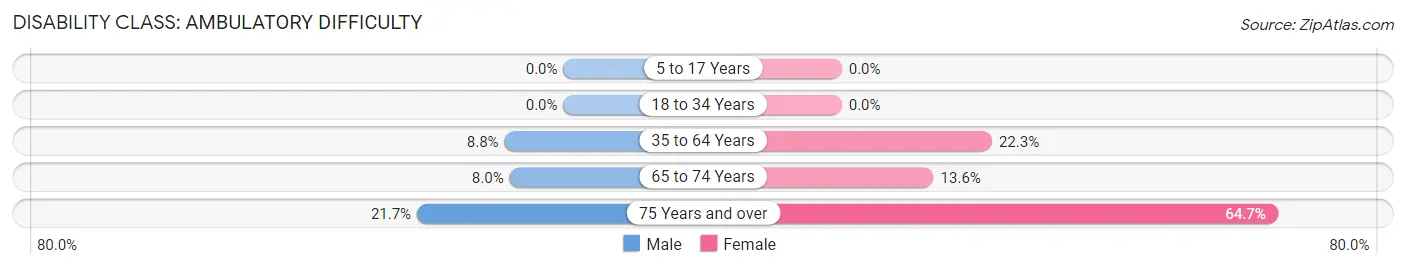
| Age Bracket | Male | Female |
| 5 to 17 Years | 0 (0.0%) | 0 (0.0%) |
| 18 to 34 Years | 0 (0.0%) | 0 (0.0%) |
| 35 to 64 Years | 26 (8.7%) | 60 (22.3%) |
| 65 to 74 Years | 12 (8.0%) | 15 (13.6%) |
| 75 Years and over | 5 (21.7%) | 11 (64.7%) |
Disability Class: Self-Care Difficulty
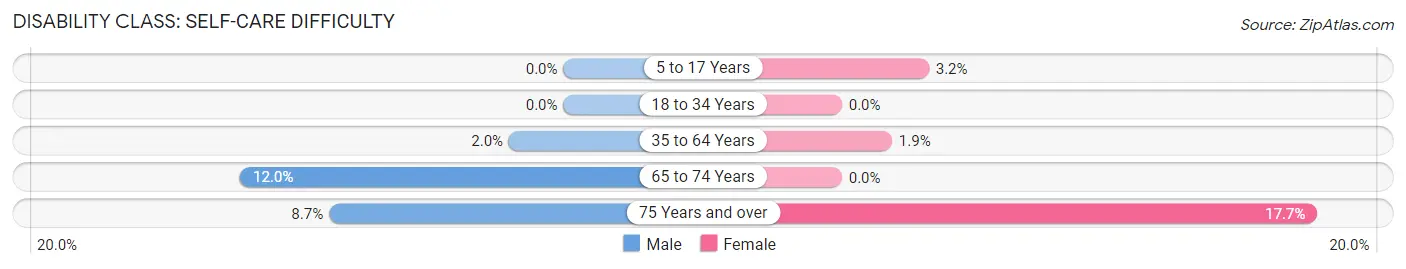
| Age Bracket | Male | Female |
| 5 to 17 Years | 0 (0.0%) | 3 (3.2%) |
| 18 to 34 Years | 0 (0.0%) | 0 (0.0%) |
| 35 to 64 Years | 6 (2.0%) | 5 (1.9%) |
| 65 to 74 Years | 18 (12.0%) | 0 (0.0%) |
| 75 Years and over | 2 (8.7%) | 3 (17.6%) |
Technology Access in West Salem
Computing Device Access in West Salem
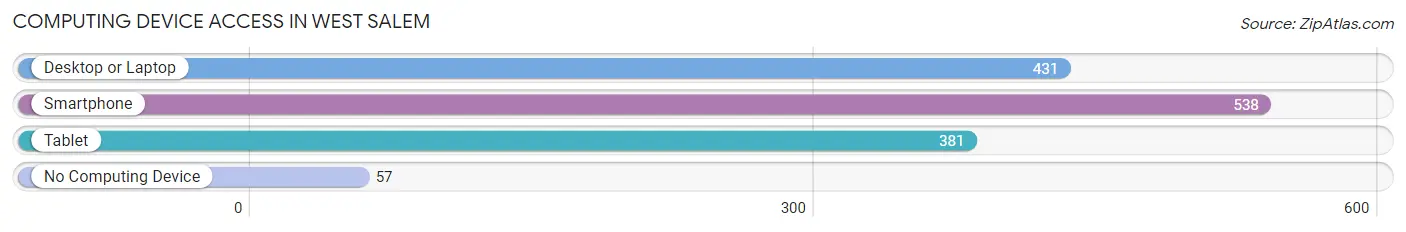
| Device Type | # Households | % Households |
| Desktop or Laptop | 431 | 66.8% |
| Smartphone | 538 | 83.4% |
| Tablet | 381 | 59.1% |
| No Computing Device | 57 | 8.8% |
| Total | 645 | 100.0% |
Internet Access in West Salem
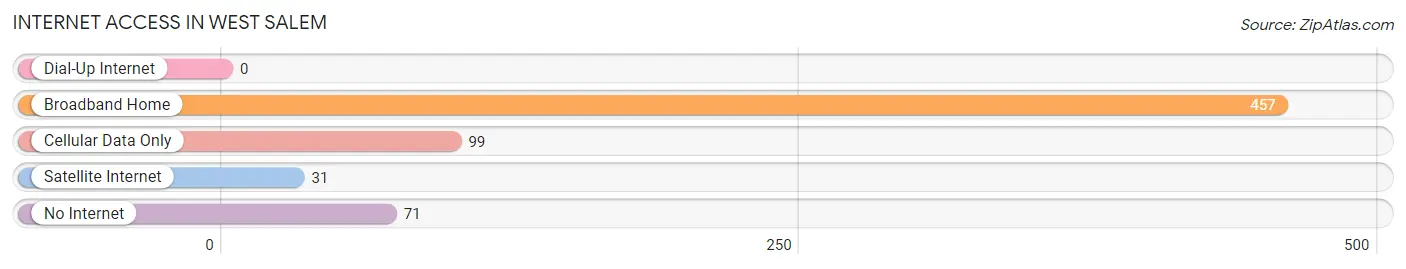
| Internet Type | # Households | % Households |
| Dial-Up Internet | 0 | 0.0% |
| Broadband Home | 457 | 70.9% |
| Cellular Data Only | 99 | 15.3% |
| Satellite Internet | 31 | 4.8% |
| No Internet | 71 | 11.0% |
| Total | 645 | 100.0% |
West Salem Summary
History
West Salem, Ohio is a small village located in Wayne County, Ohio. It is situated on the western edge of the county, near the border of Ashland County. The village was founded in 1817 by a group of settlers from Pennsylvania. The settlers were attracted to the area due to its fertile soil and abundant natural resources. The village was originally known as Westfield, but the name was changed to West Salem in 1820.
The village was an important stop on the Underground Railroad, as it was located near the border of Ohio and Pennsylvania. Many runaway slaves used the village as a safe haven on their journey to freedom. The village was also home to a number of abolitionists, including the prominent Quaker, John Rankin.
The village was incorporated in 1837 and has remained relatively unchanged since then. The population of West Salem has remained steady over the years, with a population of 1,845 in the 2010 census.
Geography
West Salem is located in Wayne County, Ohio, near the border of Ashland County. The village is situated on the western edge of the county, near the intersection of State Route 511 and State Route 545. The village is located approximately 25 miles south of Cleveland and 40 miles north of Akron.
The village is situated on a flat plain, with an elevation of 890 feet above sea level. The area is mostly rural, with a few small farms and businesses scattered throughout the village. The nearest major city is Wooster, which is located approximately 15 miles to the east.
Economy
The economy of West Salem is largely based on agriculture and small businesses. The village is home to a number of small businesses, including a grocery store, a hardware store, a pharmacy, and a few restaurants. The village also has a few small manufacturing businesses, including a furniture factory and a plastics factory.
The village is also home to a number of farms, which produce a variety of crops, including corn, soybeans, and wheat. The village is also home to a number of dairy farms, which produce milk and other dairy products.
Demographics
The population of West Salem was 1,845 in the 2010 census. The population is predominantly white, with a small minority population of African Americans, Hispanics, and Asians. The median household income in the village is $45,000, and the median age is 44.
The village is served by the West Salem Local School District, which consists of two elementary schools, one middle school, and one high school. The village is also home to a number of churches, including the West Salem United Methodist Church, the West Salem Presbyterian Church, and the West Salem Baptist Church.
Conclusion
West Salem, Ohio is a small village located in Wayne County, Ohio. It is situated on the western edge of the county, near the border of Ashland County. The village was founded in 1817 by a group of settlers from Pennsylvania and has remained relatively unchanged since then. The village is largely based on agriculture and small businesses, and the population is predominantly white, with a small minority population of African Americans, Hispanics, and Asians. The village is served by the West Salem Local School District and is home to a number of churches.
Common Questions
What is the Total Population of West Salem?
Total Population of West Salem is 1,528.
What is the Total Male Population of West Salem?
Total Male Population of West Salem is 841.
What is the Total Female Population of West Salem?
Total Female Population of West Salem is 687.
What is the Ratio of Males per 100 Females in West Salem?
There are 122.42 Males per 100 Females in West Salem.
What is the Ratio of Females per 100 Males in West Salem?
There are 81.69 Females per 100 Males in West Salem.
What is the Median Population Age in West Salem?
Median Population Age in West Salem is 41.0 Years.
What is the Average Family Size in West Salem
Average Family Size in West Salem is 2.7 People.
What is the Average Household Size in West Salem
Average Household Size in West Salem is 2.4 People.
What is Per Capita Income in West Salem?
Per Capita income in West Salem is $30,767.
What is the Median Family Income in West Salem?
Median Family Income in West Salem is $79,500.
What is the Median Household income in West Salem?
Median Household Income in West Salem is $61,563.
What is Income or Wage Gap in West Salem?
Income or Wage Gap in West Salem is 25.3%.
Women in West Salem earn 74.7 cents for every dollar earned by a man.
What is Family Income Deficit in West Salem?
Family Income Deficit in West Salem is $12,606.
Families that are below poverty line in West Salem earn $12,606 less on average than the poverty threshold level.
What is Inequality or Gini Index in West Salem?
Inequality or Gini Index in West Salem is 0.43.
How Large is the Labor Force in West Salem?
There are 774 People in the Labor Forcein in West Salem.
What is the Percentage of People in the Labor Force in West Salem?
64.3% of People are in the Labor Force in West Salem.
What is the Unemployment Rate in West Salem?
Unemployment Rate in West Salem is 2.5%.