Valley View, OH
Valley View Map
Valley View Overview
1,912
TOTAL POPULATION
969
MALE POPULATION
943
FEMALE POPULATION
102.76
MALES / 100 FEMALES
97.32
FEMALES / 100 MALES
53.8
MEDIAN AGE
2.9
AVG FAMILY SIZE
2.5
AVG HOUSEHOLD SIZE
$49,025
PER CAPITA INCOME
$113,462
AVG FAMILY INCOME
$93,352
AVG HOUSEHOLD INCOME
42.9%
WAGE / INCOME GAP [ % ]
57.1¢/ $1
WAGE / INCOME GAP [ $ ]
0.43
INEQUALITY / GINI INDEX
955
LABOR FORCE [ PEOPLE ]
57.9%
PERCENT IN LABOR FORCE
7.6%
UNEMPLOYMENT RATE
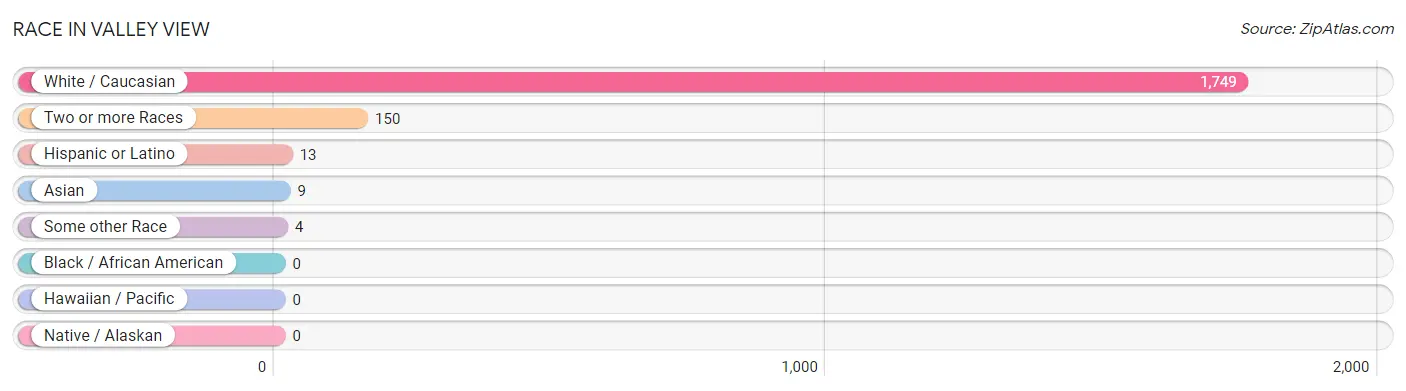
Race in Valley View
The most populous races in Valley View are White / Caucasian (1,749 | 91.5%), Two or more Races (150 | 7.9%), and Hispanic or Latino (13 | 0.7%).
| Race | # Population | % Population |
| Asian | 9 | 0.5% |
| Black / African American | 0 | 0.0% |
| Hawaiian / Pacific | 0 | 0.0% |
| Hispanic or Latino | 13 | 0.7% |
| Native / Alaskan | 0 | 0.0% |
| White / Caucasian | 1,749 | 91.5% |
| Two or more Races | 150 | 7.9% |
| Some other Race | 4 | 0.2% |
| Total | 1,912 | 100.0% |
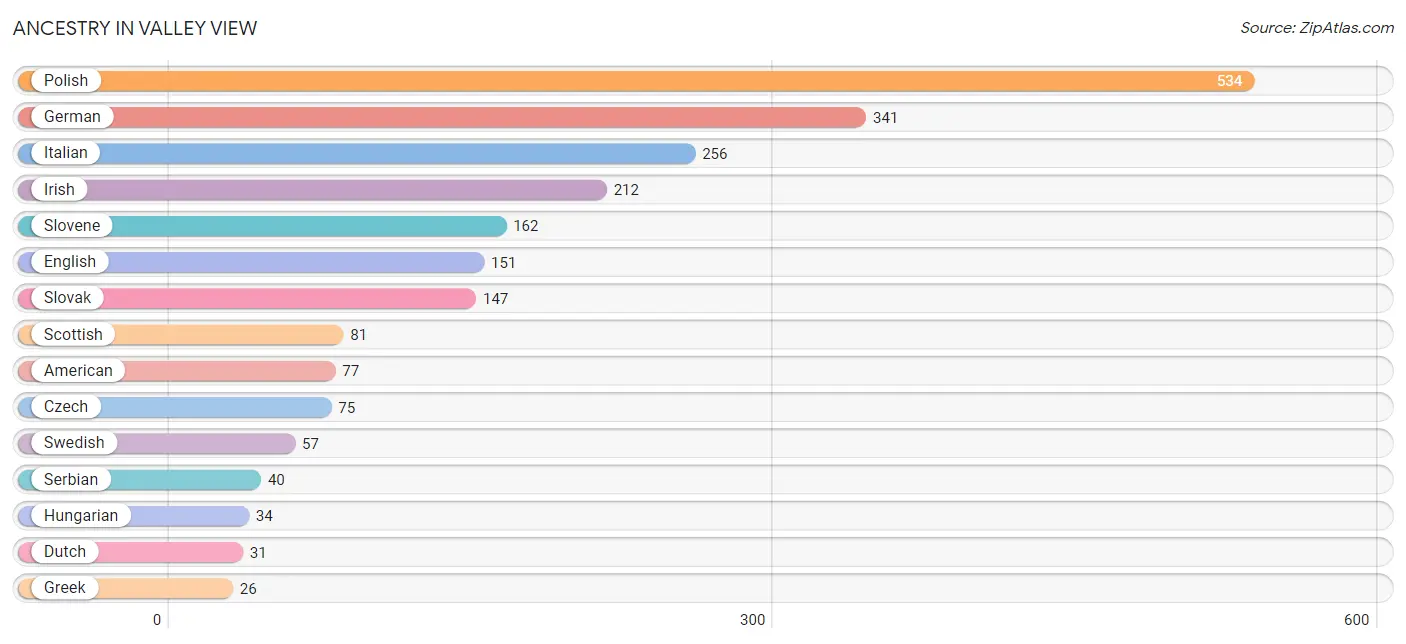
Ancestry in Valley View
The most populous ancestries reported in Valley View are Polish (534 | 27.9%), German (341 | 17.8%), Italian (256 | 13.4%), Irish (212 | 11.1%), and Slovene (162 | 8.5%), together accounting for 78.7% of all Valley View residents.
| Ancestry | # Population | % Population |
| American | 77 | 4.0% |
| Arab | 7 | 0.4% |
| British | 8 | 0.4% |
| Central American | 5 | 0.3% |
| Cherokee | 14 | 0.7% |
| Costa Rican | 5 | 0.3% |
| Czech | 75 | 3.9% |
| Czechoslovakian | 6 | 0.3% |
| Dutch | 31 | 1.6% |
| Eastern European | 5 | 0.3% |
| English | 151 | 7.9% |
| European | 10 | 0.5% |
| French | 11 | 0.6% |
| French Canadian | 12 | 0.6% |
| German | 341 | 17.8% |
| Greek | 26 | 1.4% |
| Hungarian | 34 | 1.8% |
| Indian (Asian) | 8 | 0.4% |
| Irish | 212 | 11.1% |
| Italian | 256 | 13.4% |
| Korean | 13 | 0.7% |
| Lebanese | 7 | 0.4% |
| Lithuanian | 4 | 0.2% |
| Mexican | 4 | 0.2% |
| Norwegian | 9 | 0.5% |
| Pakistani | 4 | 0.2% |
| Pennsylvania German | 10 | 0.5% |
| Polish | 534 | 27.9% |
| Puerto Rican | 4 | 0.2% |
| Romanian | 6 | 0.3% |
| Russian | 21 | 1.1% |
| Scotch-Irish | 5 | 0.3% |
| Scottish | 81 | 4.2% |
| Serbian | 40 | 2.1% |
| Slovak | 147 | 7.7% |
| Slovene | 162 | 8.5% |
| Sri Lankan | 1 | 0.1% |
| Swedish | 57 | 3.0% |
| Swiss | 7 | 0.4% |
| Ukrainian | 21 | 1.1% |
| Welsh | 11 | 0.6% |
| Yugoslavian | 2 | 0.1% | View All 42 Rows |
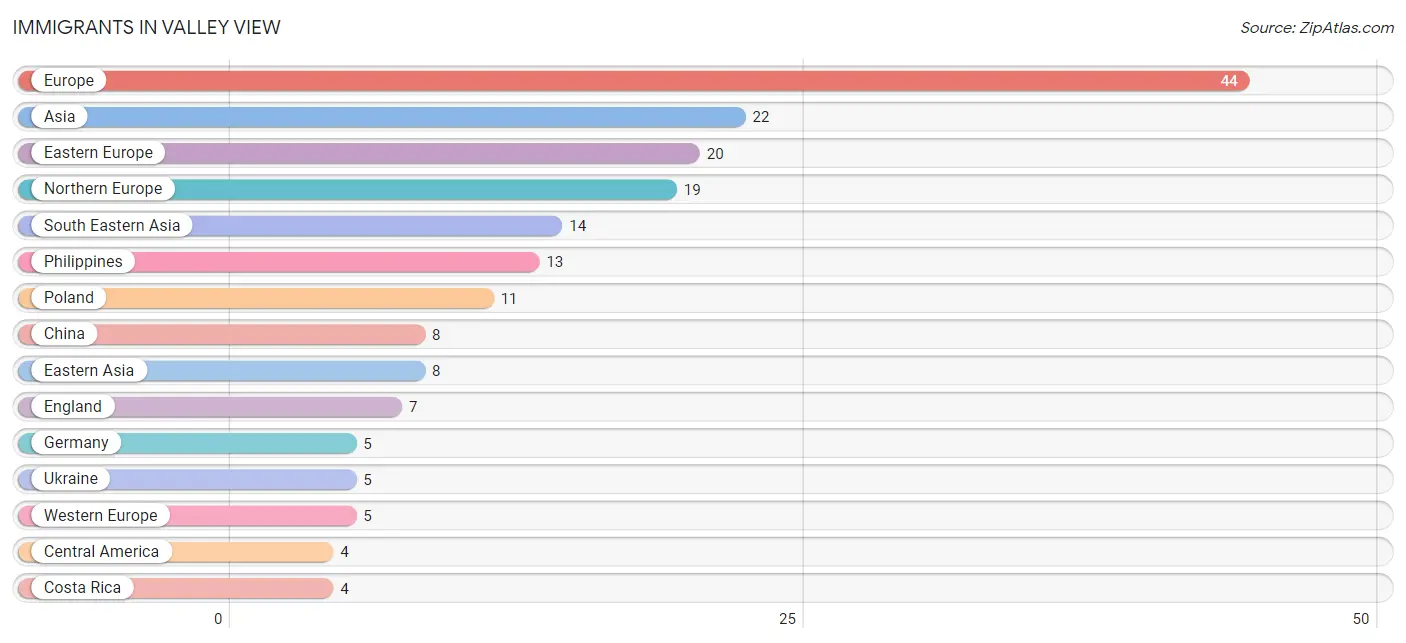
Immigrants in Valley View
The most numerous immigrant groups reported in Valley View came from Europe (44 | 2.3%), Asia (22 | 1.1%), Eastern Europe (20 | 1.1%), Northern Europe (19 | 1.0%), and South Eastern Asia (14 | 0.7%), together accounting for 6.2% of all Valley View residents.
| Immigration Origin | # Population | % Population |
| Asia | 22 | 1.1% |
| Canada | 3 | 0.2% |
| Central America | 4 | 0.2% |
| China | 8 | 0.4% |
| Costa Rica | 4 | 0.2% |
| Eastern Asia | 8 | 0.4% |
| Eastern Europe | 20 | 1.1% |
| England | 7 | 0.4% |
| Europe | 44 | 2.3% |
| Germany | 5 | 0.3% |
| Latin America | 4 | 0.2% |
| Northern Europe | 19 | 1.0% |
| Philippines | 13 | 0.7% |
| Poland | 11 | 0.6% |
| South Eastern Asia | 14 | 0.7% |
| Ukraine | 5 | 0.3% |
| Vietnam | 1 | 0.1% |
| Western Europe | 5 | 0.3% | View All 18 Rows |
Sex and Age in Valley View
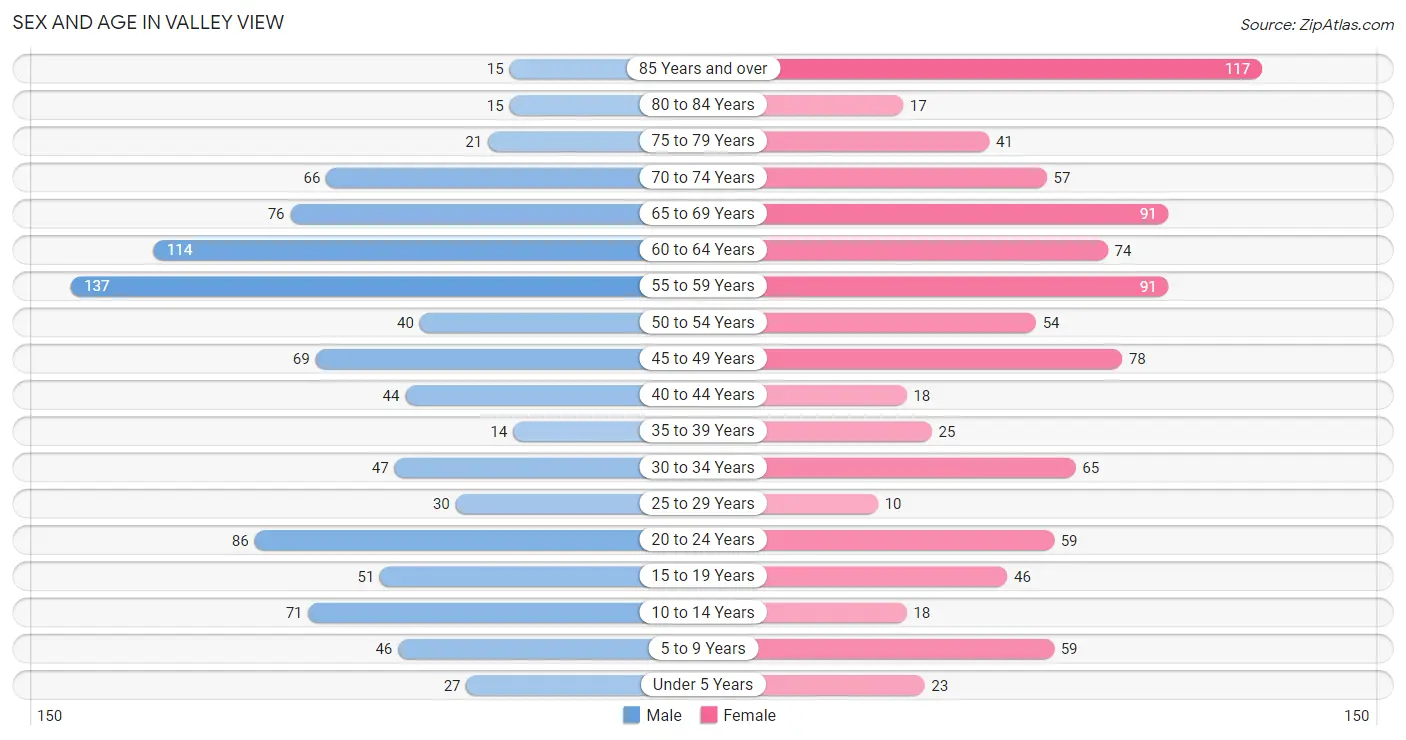
Sex and Age in Valley View
The most populous age groups in Valley View are 55 to 59 Years (137 | 14.1%) for men and 85 Years and over (117 | 12.4%) for women.
| Age Bracket | Male | Female |
| Under 5 Years | 27 (2.8%) | 23 (2.4%) |
| 5 to 9 Years | 46 (4.8%) | 59 (6.3%) |
| 10 to 14 Years | 71 (7.3%) | 18 (1.9%) |
| 15 to 19 Years | 51 (5.3%) | 46 (4.9%) |
| 20 to 24 Years | 86 (8.9%) | 59 (6.3%) |
| 25 to 29 Years | 30 (3.1%) | 10 (1.1%) |
| 30 to 34 Years | 47 (4.9%) | 65 (6.9%) |
| 35 to 39 Years | 14 (1.4%) | 25 (2.6%) |
| 40 to 44 Years | 44 (4.5%) | 18 (1.9%) |
| 45 to 49 Years | 69 (7.1%) | 78 (8.3%) |
| 50 to 54 Years | 40 (4.1%) | 54 (5.7%) |
| 55 to 59 Years | 137 (14.1%) | 91 (9.7%) |
| 60 to 64 Years | 114 (11.8%) | 74 (7.9%) |
| 65 to 69 Years | 76 (7.8%) | 91 (9.7%) |
| 70 to 74 Years | 66 (6.8%) | 57 (6.0%) |
| 75 to 79 Years | 21 (2.2%) | 41 (4.3%) |
| 80 to 84 Years | 15 (1.5%) | 17 (1.8%) |
| 85 Years and over | 15 (1.5%) | 117 (12.4%) |
| Total | 969 (100.0%) | 943 (100.0%) |
Families and Households in Valley View
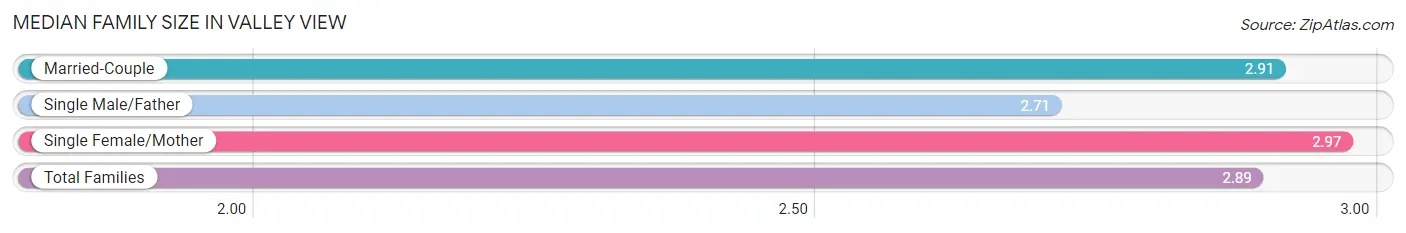
Median Family Size in Valley View
The median family size in Valley View is 2.89 persons per family, with single female/mother families (71 | 12.4%) accounting for the largest median family size of 2.97 persons per family. On the other hand, single male/father families (76 | 13.3%) represent the smallest median family size with 2.71 persons per family.
| Family Type | # Families | Family Size |
| Married-Couple | 425 (74.3%) | 2.91 |
| Single Male/Father | 76 (13.3%) | 2.71 |
| Single Female/Mother | 71 (12.4%) | 2.97 |
| Total Families | 572 (100.0%) | 2.89 |
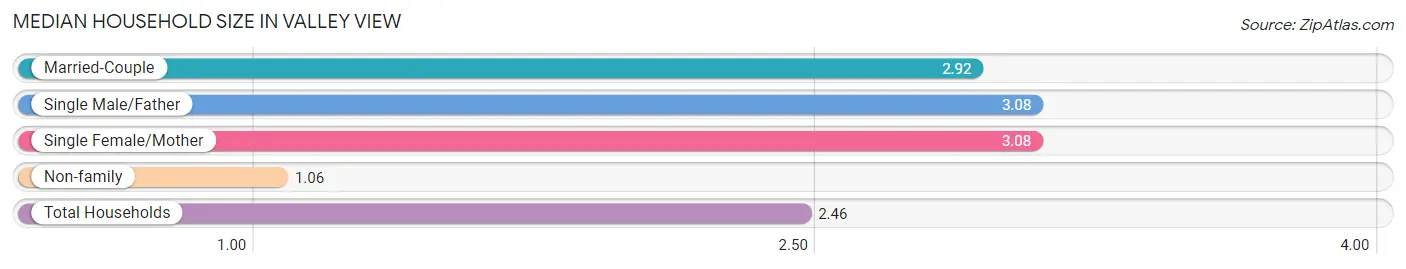
Median Household Size in Valley View
The median household size in Valley View is 2.46 persons per household, with single male/father households (76 | 9.8%) accounting for the largest median household size of 3.08 persons per household. non-family households (205 | 26.4%) represent the smallest median household size with 1.06 persons per household.
| Household Type | # Households | Household Size |
| Married-Couple | 425 (54.7%) | 2.92 |
| Single Male/Father | 76 (9.8%) | 3.08 |
| Single Female/Mother | 71 (9.1%) | 3.08 |
| Non-family | 205 (26.4%) | 1.06 |
| Total Households | 777 (100.0%) | 2.46 |
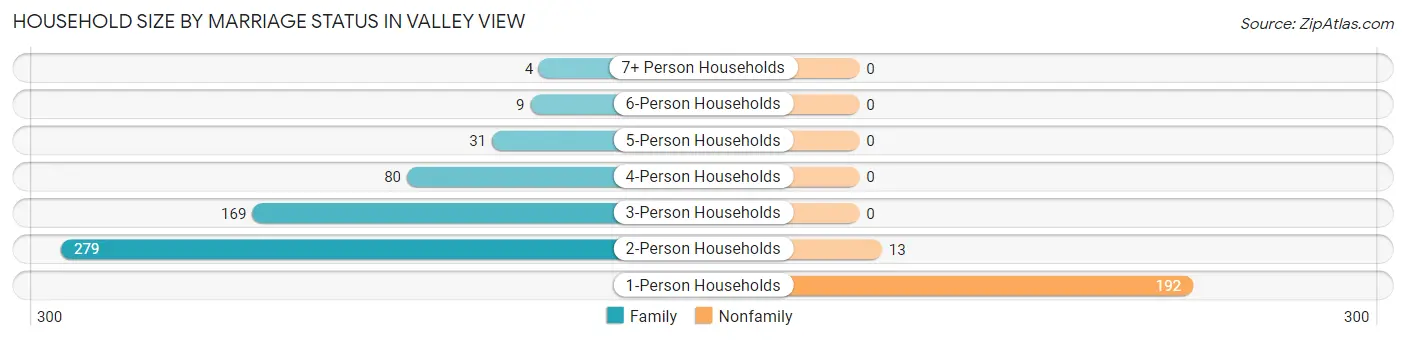
Household Size by Marriage Status in Valley View
Out of a total of 777 households in Valley View, 572 (73.6%) are family households, while 205 (26.4%) are nonfamily households. The most numerous type of family households are 2-person households, comprising 279, and the most common type of nonfamily households are 1-person households, comprising 192.
| Household Size | Family Households | Nonfamily Households |
| 1-Person Households | - | 192 (24.7%) |
| 2-Person Households | 279 (35.9%) | 13 (1.7%) |
| 3-Person Households | 169 (21.7%) | 0 (0.0%) |
| 4-Person Households | 80 (10.3%) | 0 (0.0%) |
| 5-Person Households | 31 (4.0%) | 0 (0.0%) |
| 6-Person Households | 9 (1.2%) | 0 (0.0%) |
| 7+ Person Households | 4 (0.5%) | 0 (0.0%) |
| Total | 572 (73.6%) | 205 (26.4%) |
Female Fertility in Valley View
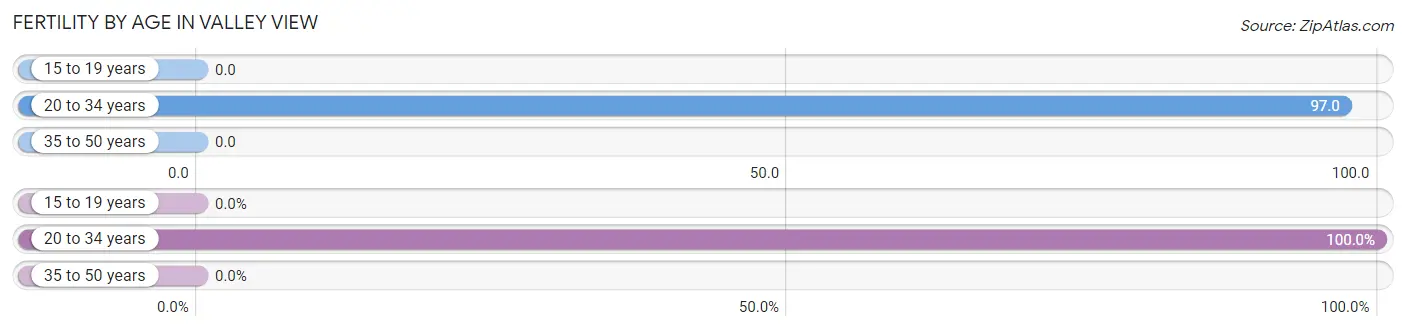
Fertility by Age in Valley View
Average fertility rate in Valley View is 40.0 births per 1,000 women. Women in the age bracket of 20 to 34 years have the highest fertility rate with 97.0 births per 1,000 women. Women in the age bracket of 20 to 34 years acount for 100.0% of all women with births.
| Age Bracket | Women with Births | Births / 1,000 Women |
| 15 to 19 years | 0 (0.0%) | 0.0 |
| 20 to 34 years | 13 (100.0%) | 97.0 |
| 35 to 50 years | 0 (0.0%) | 0.0 |
| Total | 13 (100.0%) | 40.0 |
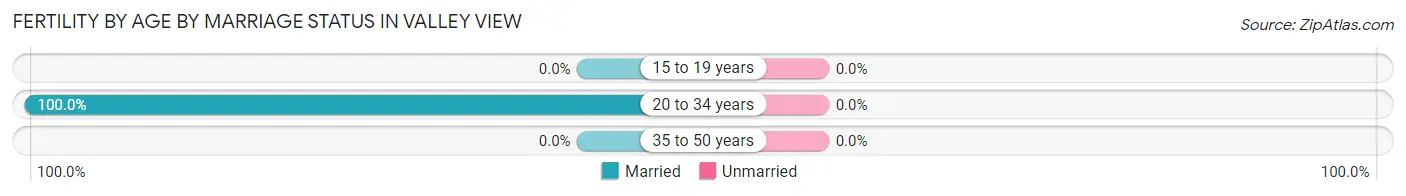
Fertility by Age by Marriage Status in Valley View
| Age Bracket | Married | Unmarried |
| 15 to 19 years | 0 (0.0%) | 0 (0.0%) |
| 20 to 34 years | 13 (100.0%) | 0 (0.0%) |
| 35 to 50 years | 0 (0.0%) | 0 (0.0%) |
| Total | 13 (100.0%) | 0 (0.0%) |
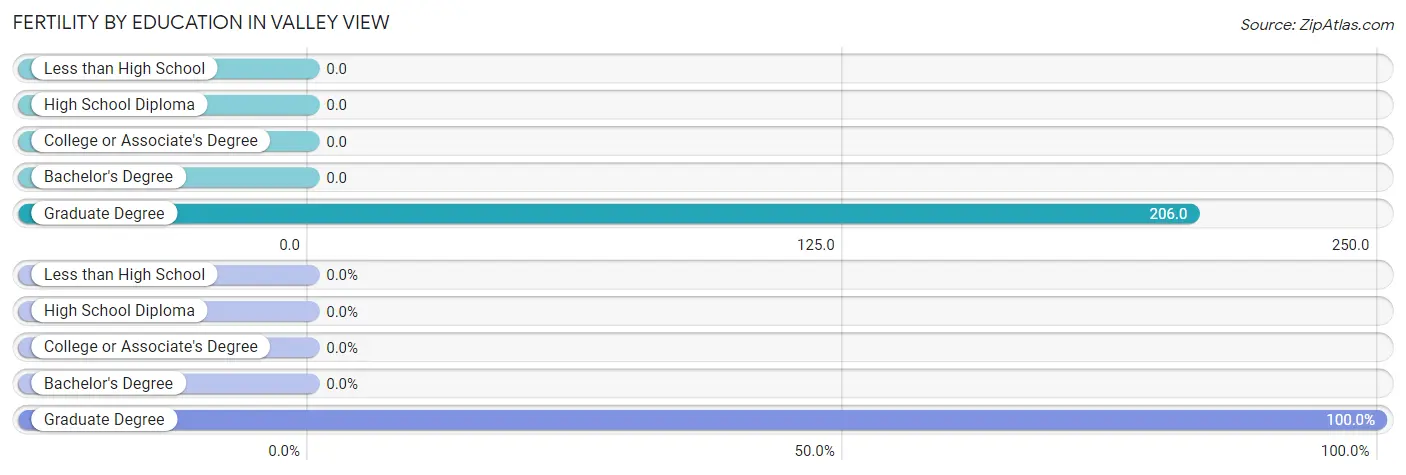
Fertility by Education in Valley View
| Educational Attainment | Women with Births | Births / 1,000 Women |
| Less than High School | 0 (0.0%) | 0.0 |
| High School Diploma | 0 (0.0%) | 0.0 |
| College or Associate's Degree | 0 (0.0%) | 0.0 |
| Bachelor's Degree | 0 (0.0%) | 0.0 |
| Graduate Degree | 13 (100.0%) | 206.0 |
| Total | 13 (100.0%) | 40.0 |
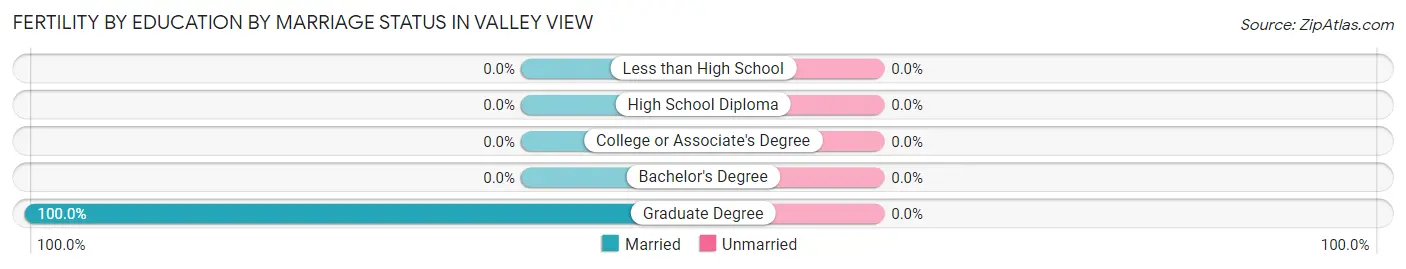
Fertility by Education by Marriage Status in Valley View
| Educational Attainment | Married | Unmarried |
| Less than High School | 0 (0.0%) | 0 (0.0%) |
| High School Diploma | 0 (0.0%) | 0 (0.0%) |
| College or Associate's Degree | 0 (0.0%) | 0 (0.0%) |
| Bachelor's Degree | 0 (0.0%) | 0 (0.0%) |
| Graduate Degree | 13 (100.0%) | 0 (0.0%) |
| Total | 13 (100.0%) | 0 (0.0%) |
Income in Valley View
Income Overview in Valley View
Per Capita Income in Valley View is $49,025, while median incomes of families and households are $113,462 and $93,352 respectively.
| Characteristic | Number | Measure |
| Per Capita Income | 1,912 | $49,025 |
| Median Family Income | 572 | $113,462 |
| Mean Family Income | 572 | $140,961 |
| Median Household Income | 777 | $93,352 |
| Mean Household Income | 777 | $117,523 |
| Income Deficit | 572 | $0 |
| Wage / Income Gap (%) | 1,912 | 42.88% |
| Wage / Income Gap ($) | 1,912 | 57.12¢ per $1 |
| Gini / Inequality Index | 1,912 | 0.43 |
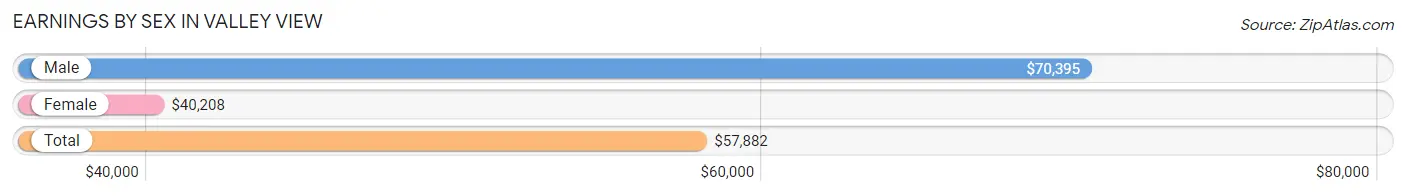
Earnings by Sex in Valley View
Average Earnings in Valley View are $57,882, $70,395 for men and $40,208 for women, a difference of 42.9%.
| Sex | Number | Average Earnings |
| Male | 558 (53.9%) | $70,395 |
| Female | 477 (46.1%) | $40,208 |
| Total | 1,035 (100.0%) | $57,882 |
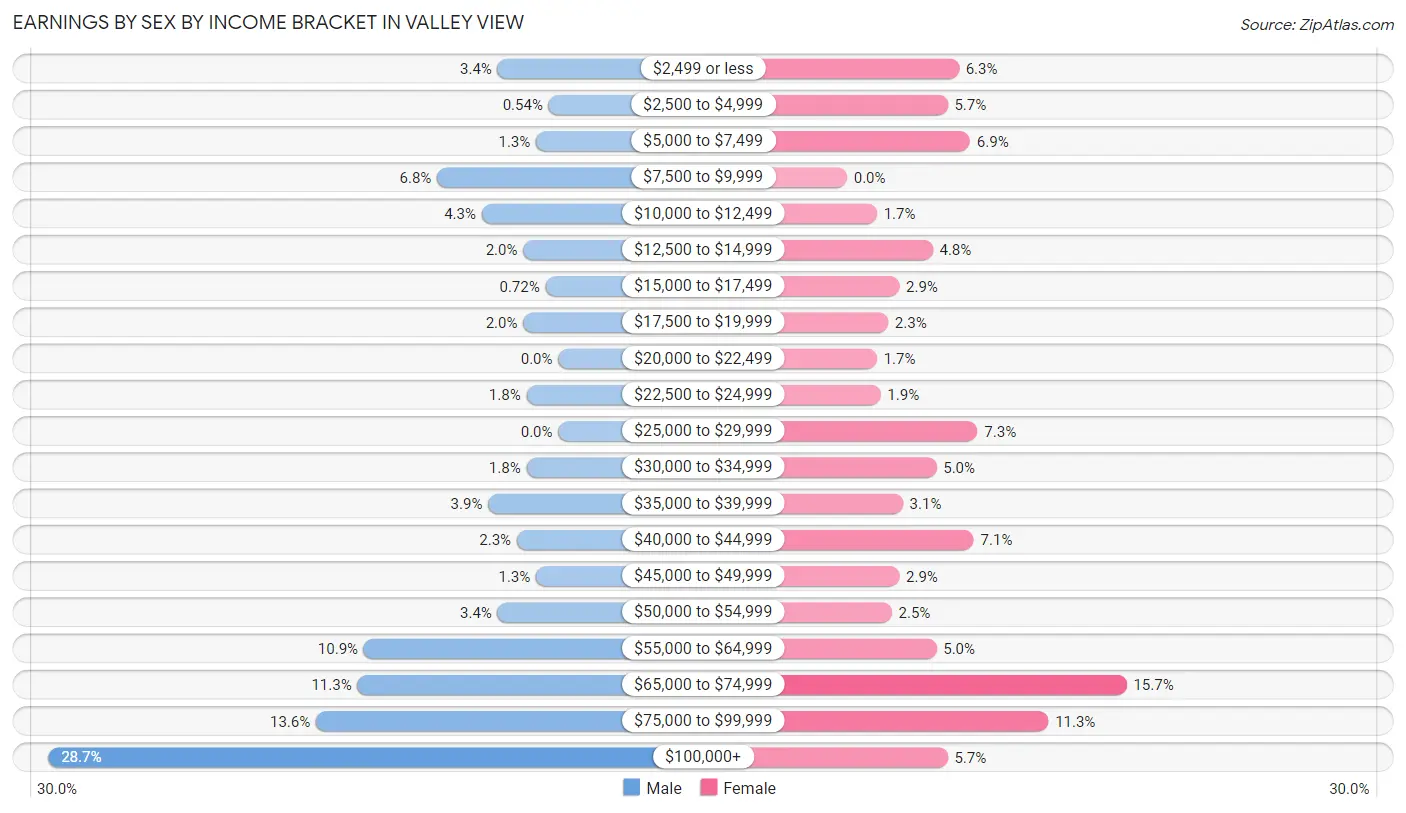
Earnings by Sex by Income Bracket in Valley View
The most common earnings brackets in Valley View are $100,000+ for men (160 | 28.7%) and $65,000 to $74,999 for women (75 | 15.7%).
| Income | Male | Female |
| $2,499 or less | 19 (3.4%) | 30 (6.3%) |
| $2,500 to $4,999 | 3 (0.5%) | 27 (5.7%) |
| $5,000 to $7,499 | 7 (1.3%) | 33 (6.9%) |
| $7,500 to $9,999 | 38 (6.8%) | 0 (0.0%) |
| $10,000 to $12,499 | 24 (4.3%) | 8 (1.7%) |
| $12,500 to $14,999 | 11 (2.0%) | 23 (4.8%) |
| $15,000 to $17,499 | 4 (0.7%) | 14 (2.9%) |
| $17,500 to $19,999 | 11 (2.0%) | 11 (2.3%) |
| $20,000 to $22,499 | 0 (0.0%) | 8 (1.7%) |
| $22,500 to $24,999 | 10 (1.8%) | 9 (1.9%) |
| $25,000 to $29,999 | 0 (0.0%) | 35 (7.3%) |
| $30,000 to $34,999 | 10 (1.8%) | 24 (5.0%) |
| $35,000 to $39,999 | 22 (3.9%) | 15 (3.1%) |
| $40,000 to $44,999 | 13 (2.3%) | 34 (7.1%) |
| $45,000 to $49,999 | 7 (1.3%) | 14 (2.9%) |
| $50,000 to $54,999 | 19 (3.4%) | 12 (2.5%) |
| $55,000 to $64,999 | 61 (10.9%) | 24 (5.0%) |
| $65,000 to $74,999 | 63 (11.3%) | 75 (15.7%) |
| $75,000 to $99,999 | 76 (13.6%) | 54 (11.3%) |
| $100,000+ | 160 (28.7%) | 27 (5.7%) |
| Total | 558 (100.0%) | 477 (100.0%) |
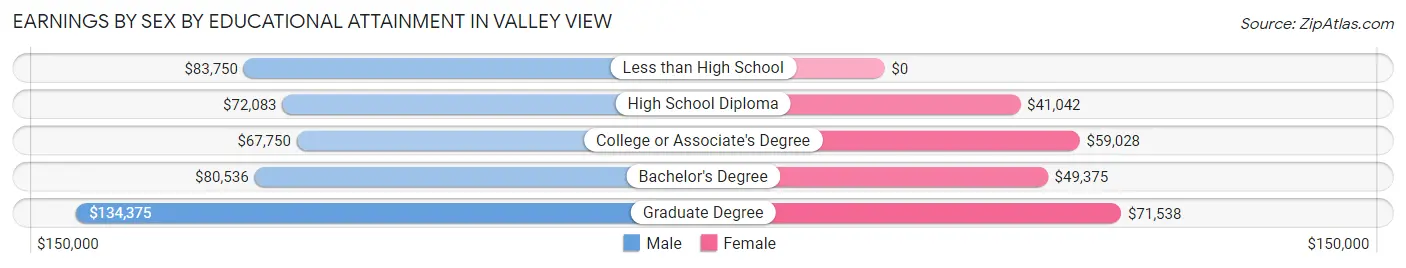
Earnings by Sex by Educational Attainment in Valley View
Average earnings in Valley View are $75,625 for men and $48,125 for women, a difference of 36.4%. Men with an educational attainment of graduate degree enjoy the highest average annual earnings of $134,375, while those with college or associate's degree education earn the least with $67,750. Women with an educational attainment of graduate degree earn the most with the average annual earnings of $71,538, while those with high school diploma education have the smallest earnings of $41,042.
| Educational Attainment | Male Income | Female Income |
| Less than High School | $83,750 | $0 |
| High School Diploma | $72,083 | $41,042 |
| College or Associate's Degree | $67,750 | $59,028 |
| Bachelor's Degree | $80,536 | $49,375 |
| Graduate Degree | $134,375 | $71,538 |
| Total | $75,625 | $48,125 |
Family Income in Valley View
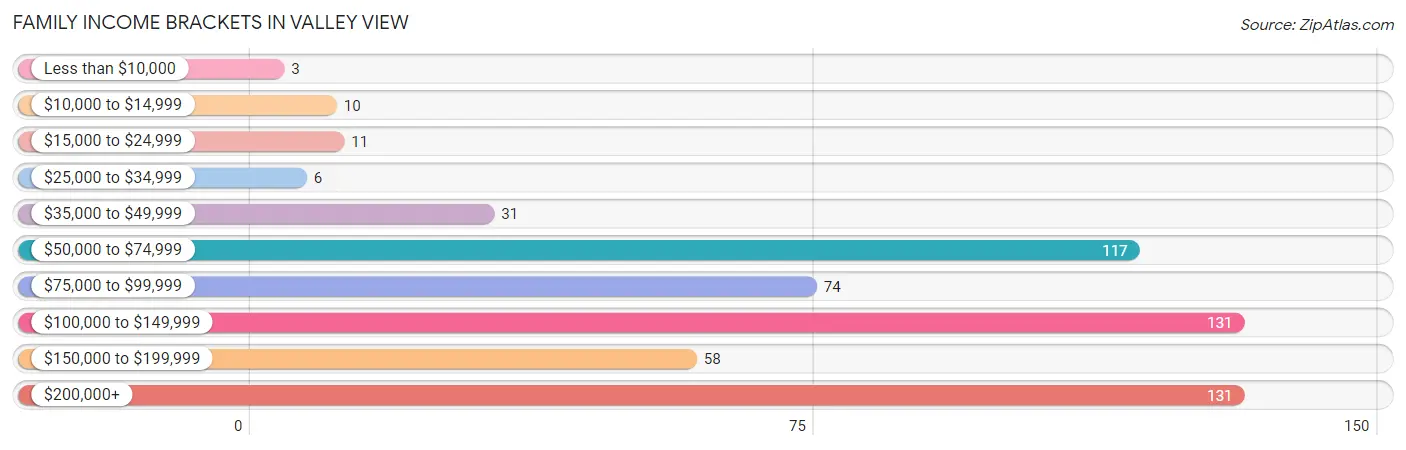
Family Income Brackets in Valley View
According to the Valley View family income data, there are 131 families falling into the $100,000 to $149,999 income range, which is the most common income bracket and makes up 22.9% of all families. Conversely, the less than $10,000 income bracket is the least frequent group with only 3 families (0.5%) belonging to this category.
| Income Bracket | # Families | % Families |
| Less than $10,000 | 3 | 0.5% |
| $10,000 to $14,999 | 10 | 1.7% |
| $15,000 to $24,999 | 11 | 1.9% |
| $25,000 to $34,999 | 6 | 1.0% |
| $35,000 to $49,999 | 31 | 5.4% |
| $50,000 to $74,999 | 117 | 20.5% |
| $75,000 to $99,999 | 74 | 12.9% |
| $100,000 to $149,999 | 131 | 22.9% |
| $150,000 to $199,999 | 58 | 10.1% |
| $200,000+ | 131 | 22.9% |
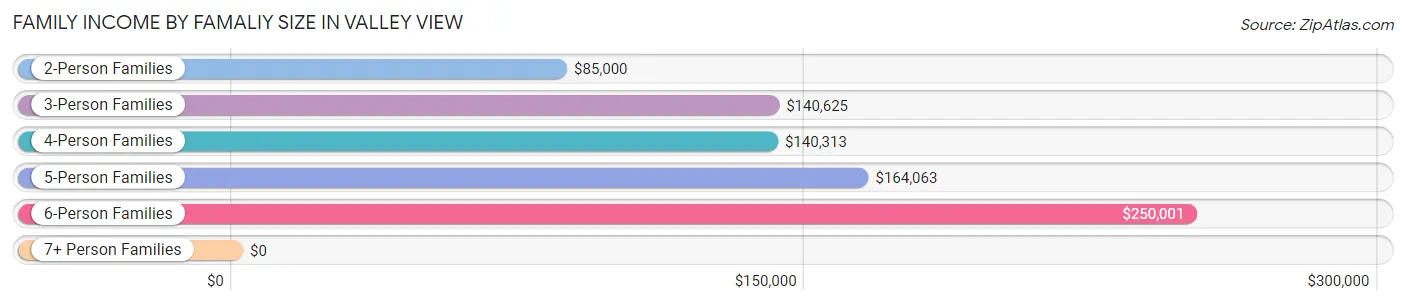
Family Income by Famaliy Size in Valley View
6-person families (9 | 1.6%) account for the highest median family income in Valley View with $250,001 per family, while 3-person families (166 | 29.0%) have the highest median income of $46,875 per family member.
| Income Bracket | # Families | Median Income |
| 2-Person Families | 294 (51.4%) | $85,000 |
| 3-Person Families | 166 (29.0%) | $140,625 |
| 4-Person Families | 80 (14.0%) | $140,313 |
| 5-Person Families | 19 (3.3%) | $164,063 |
| 6-Person Families | 9 (1.6%) | $250,001 |
| 7+ Person Families | 4 (0.7%) | $0 |
| Total | 572 (100.0%) | $113,462 |
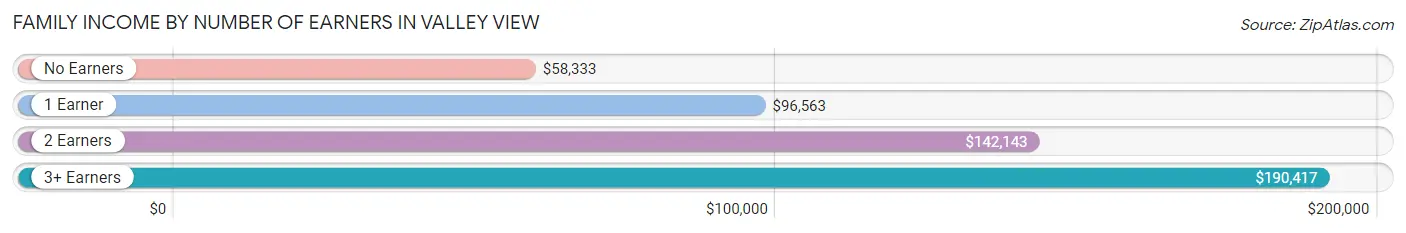
Family Income by Number of Earners in Valley View
The median family income in Valley View is $113,462, with families comprising 3+ earners (109) having the highest median family income of $190,417, while families with no earners (122) have the lowest median family income of $58,333, accounting for 19.1% and 21.3% of families, respectively.
| Number of Earners | # Families | Median Income |
| No Earners | 122 (21.3%) | $58,333 |
| 1 Earner | 143 (25.0%) | $96,563 |
| 2 Earners | 198 (34.6%) | $142,143 |
| 3+ Earners | 109 (19.1%) | $190,417 |
| Total | 572 (100.0%) | $113,462 |
Household Income in Valley View
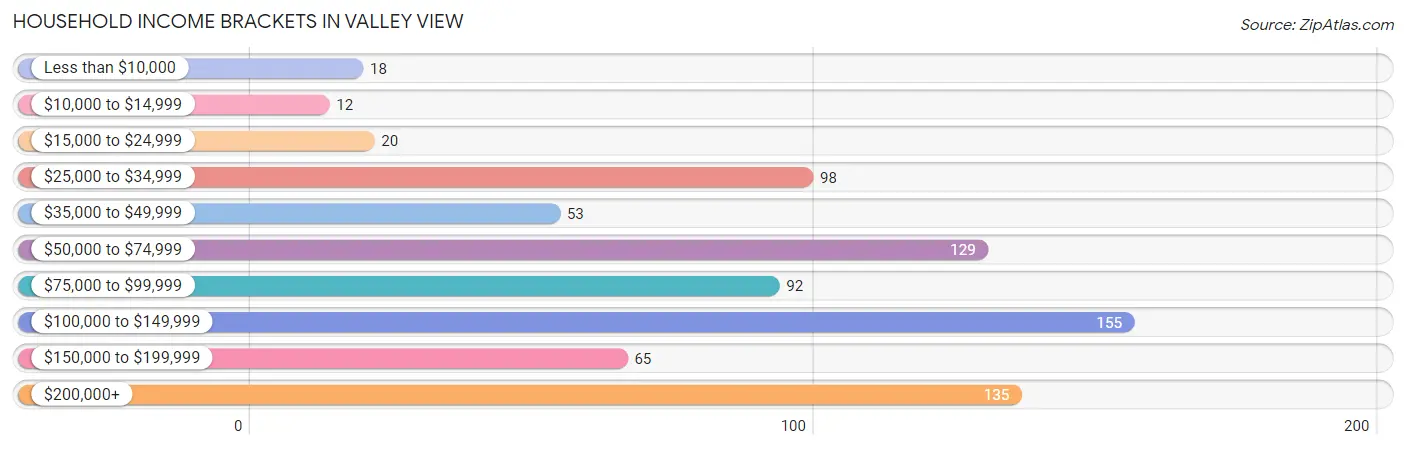
Household Income Brackets in Valley View
With 155 households falling in the category, the $100,000 to $149,999 income range is the most frequent in Valley View, accounting for 20.0% of all households. In contrast, only 12 households (1.5%) fall into the $10,000 to $14,999 income bracket, making it the least populous group.
| Income Bracket | # Households | % Households |
| Less than $10,000 | 18 | 2.3% |
| $10,000 to $14,999 | 12 | 1.5% |
| $15,000 to $24,999 | 20 | 2.6% |
| $25,000 to $34,999 | 98 | 12.6% |
| $35,000 to $49,999 | 53 | 6.8% |
| $50,000 to $74,999 | 129 | 16.6% |
| $75,000 to $99,999 | 92 | 11.8% |
| $100,000 to $149,999 | 155 | 19.9% |
| $150,000 to $199,999 | 65 | 8.4% |
| $200,000+ | 135 | 17.4% |
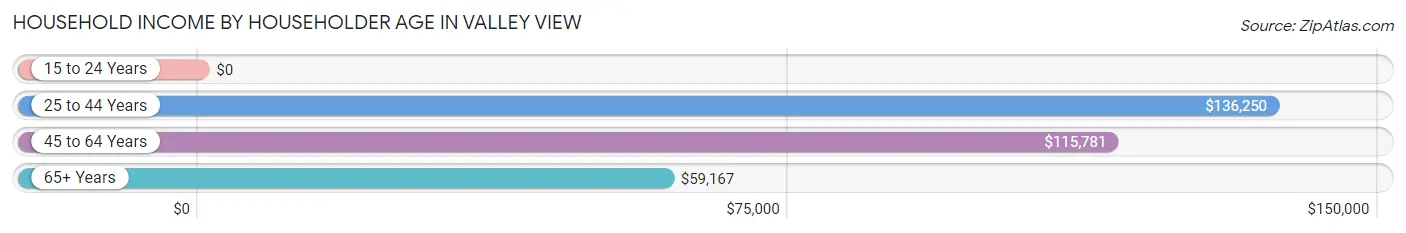
Household Income by Householder Age in Valley View
The median household income in Valley View is $93,352, with the highest median household income of $136,250 found in the 25 to 44 years age bracket for the primary householder. A total of 87 households (11.2%) fall into this category. Meanwhile, the 15 to 24 years age bracket for the primary householder has the lowest median household income of $0, with 7 households (0.9%) in this group.
| Income Bracket | # Households | Median Income |
| 15 to 24 Years | 7 (0.9%) | $0 |
| 25 to 44 Years | 87 (11.2%) | $136,250 |
| 45 to 64 Years | 355 (45.7%) | $115,781 |
| 65+ Years | 328 (42.2%) | $59,167 |
| Total | 777 (100.0%) | $93,352 |
Poverty in Valley View
Income Below Poverty by Sex and Age in Valley View
With 5.0% poverty level for males and 4.9% for females among the residents of Valley View, 5 year old males and 35 to 44 year old females are the most vulnerable to poverty, with 9 males (52.9%) and 5 females (11.6%) in their respective age groups living below the poverty level.
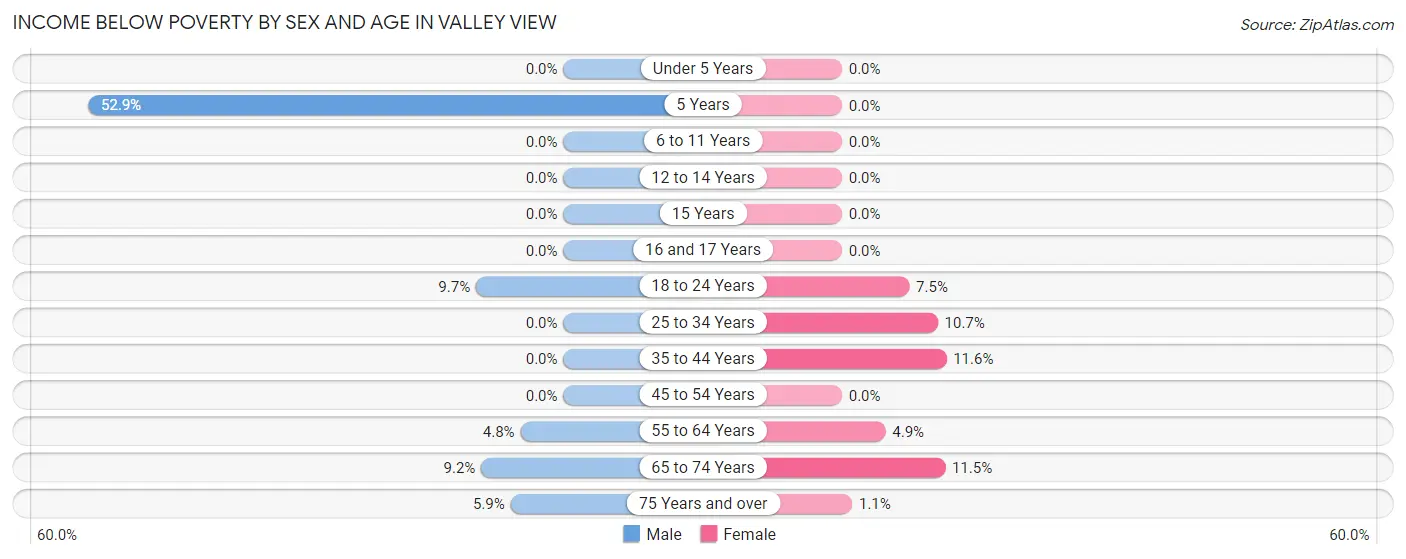
| Age Bracket | Male | Female |
| Under 5 Years | 0 (0.0%) | 0 (0.0%) |
| 5 Years | 9 (52.9%) | 0 (0.0%) |
| 6 to 11 Years | 0 (0.0%) | 0 (0.0%) |
| 12 to 14 Years | 0 (0.0%) | 0 (0.0%) |
| 15 Years | 0 (0.0%) | 0 (0.0%) |
| 16 and 17 Years | 0 (0.0%) | 0 (0.0%) |
| 18 to 24 Years | 11 (9.7%) | 6 (7.5%) |
| 25 to 34 Years | 0 (0.0%) | 8 (10.7%) |
| 35 to 44 Years | 0 (0.0%) | 5 (11.6%) |
| 45 to 54 Years | 0 (0.0%) | 0 (0.0%) |
| 55 to 64 Years | 12 (4.8%) | 8 (4.9%) |
| 65 to 74 Years | 13 (9.1%) | 17 (11.5%) |
| 75 Years and over | 3 (5.9%) | 2 (1.1%) |
| Total | 48 (5.0%) | 46 (4.9%) |
Income Above Poverty by Sex and Age in Valley View
According to the poverty statistics in Valley View, males aged under 5 years and females aged under 5 years are the age groups that are most secure financially, with 100.0% of males and 100.0% of females in these age groups living above the poverty line.
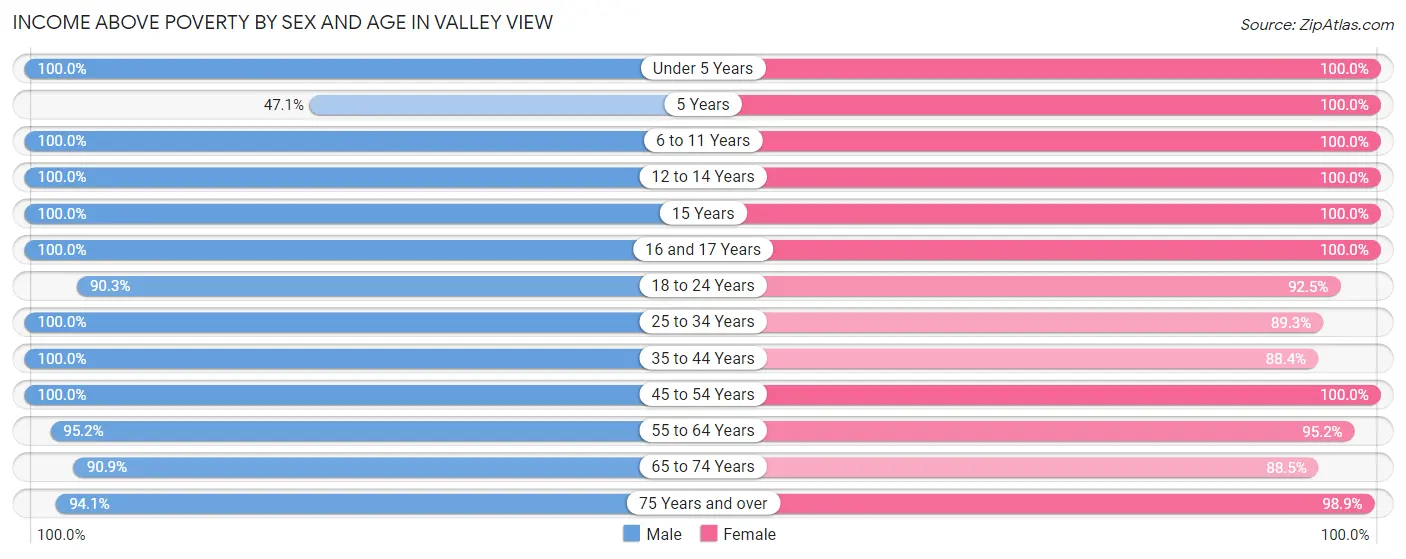
| Age Bracket | Male | Female |
| Under 5 Years | 26 (100.0%) | 21 (100.0%) |
| 5 Years | 8 (47.1%) | 11 (100.0%) |
| 6 to 11 Years | 53 (100.0%) | 51 (100.0%) |
| 12 to 14 Years | 47 (100.0%) | 15 (100.0%) |
| 15 Years | 15 (100.0%) | 3 (100.0%) |
| 16 and 17 Years | 9 (100.0%) | 22 (100.0%) |
| 18 to 24 Years | 102 (90.3%) | 74 (92.5%) |
| 25 to 34 Years | 77 (100.0%) | 67 (89.3%) |
| 35 to 44 Years | 58 (100.0%) | 38 (88.4%) |
| 45 to 54 Years | 109 (100.0%) | 132 (100.0%) |
| 55 to 64 Years | 239 (95.2%) | 157 (95.2%) |
| 65 to 74 Years | 129 (90.8%) | 131 (88.5%) |
| 75 Years and over | 48 (94.1%) | 173 (98.9%) |
| Total | 920 (95.0%) | 895 (95.1%) |
Income Below Poverty Among Married-Couple Families in Valley View
The poverty statistics for married-couple families in Valley View show that 3.8% or 16 of the total 425 families live below the poverty line. Families with no children have the highest poverty rate of 5.1%, comprising of 16 families. On the other hand, families with 1 or 2 children have the lowest poverty rate of 0.0%, which includes 0 families.
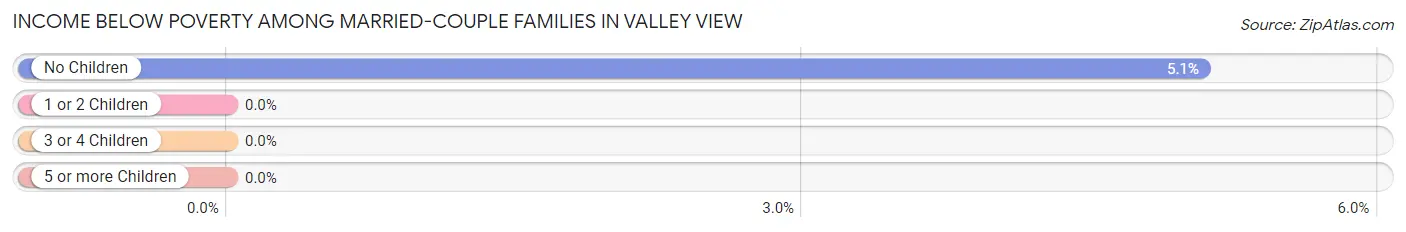
| Children | Above Poverty | Below Poverty |
| No Children | 299 (94.9%) | 16 (5.1%) |
| 1 or 2 Children | 99 (100.0%) | 0 (0.0%) |
| 3 or 4 Children | 11 (100.0%) | 0 (0.0%) |
| 5 or more Children | 0 (0.0%) | 0 (0.0%) |
| Total | 409 (96.2%) | 16 (3.8%) |
Income Below Poverty Among Single-Parent Households in Valley View
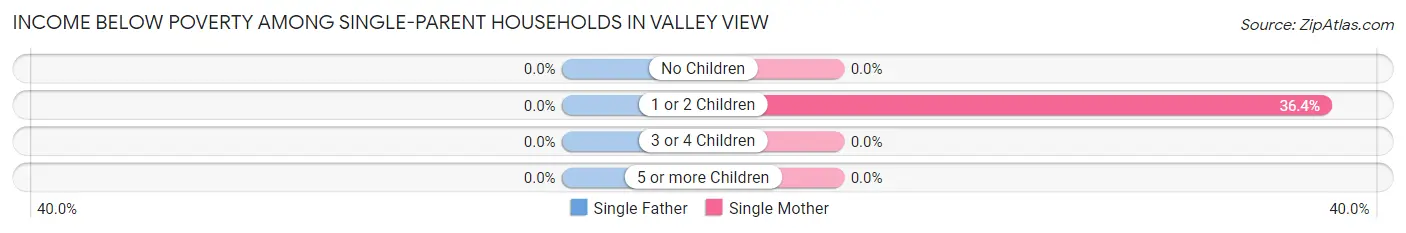
| Children | Single Father | Single Mother |
| No Children | 0 (0.0%) | 0 (0.0%) |
| 1 or 2 Children | 0 (0.0%) | 8 (36.4%) |
| 3 or 4 Children | 0 (0.0%) | 0 (0.0%) |
| 5 or more Children | 0 (0.0%) | 0 (0.0%) |
| Total | 0 (0.0%) | 8 (11.3%) |
Income Below Poverty Among Married-Couple vs Single-Parent Households in Valley View
The poverty data for Valley View shows that 16 of the married-couple family households (3.8%) and 8 of the single-parent households (5.4%) are living below the poverty level. Within the married-couple family households, those with no children have the highest poverty rate, with 16 households (5.1%) falling below the poverty line. Among the single-parent households, those with 1 or 2 children have the highest poverty rate, with 8 household (15.4%) living below poverty.
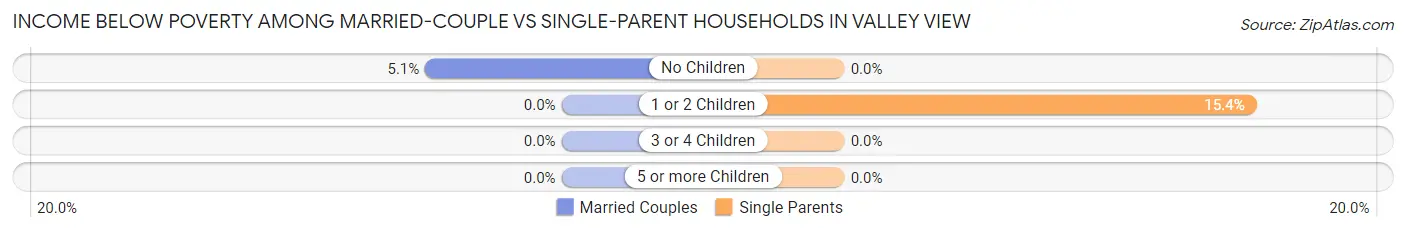
| Children | Married-Couple Families | Single-Parent Households |
| No Children | 16 (5.1%) | 0 (0.0%) |
| 1 or 2 Children | 0 (0.0%) | 8 (15.4%) |
| 3 or 4 Children | 0 (0.0%) | 0 (0.0%) |
| 5 or more Children | 0 (0.0%) | 0 (0.0%) |
| Total | 16 (3.8%) | 8 (5.4%) |
Employment Characteristics in Valley View
Employment by Class of Employer in Valley View
Among the 873 employed individuals in Valley View, private company employees (427 | 48.9%), local government employees (174 | 19.9%), and not-for-profit organizations (134 | 15.3%) make up the most common classes of employment.
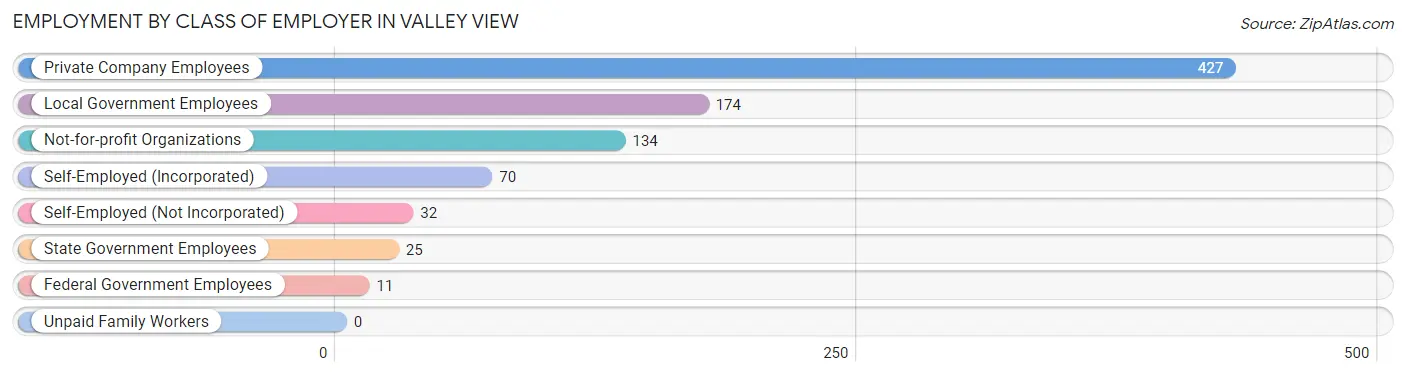
| Employer Class | # Employees | % Employees |
| Private Company Employees | 427 | 48.9% |
| Self-Employed (Incorporated) | 70 | 8.0% |
| Self-Employed (Not Incorporated) | 32 | 3.7% |
| Not-for-profit Organizations | 134 | 15.3% |
| Local Government Employees | 174 | 19.9% |
| State Government Employees | 25 | 2.9% |
| Federal Government Employees | 11 | 1.3% |
| Unpaid Family Workers | 0 | 0.0% |
| Total | 873 | 100.0% |
Employment Status by Age in Valley View
According to the labor force statistics for Valley View, out of the total population over 16 years of age (1,650), 57.9% or 955 individuals are in the labor force, with 7.6% or 73 of them unemployed. The age group with the highest labor force participation rate is 25 to 29 years, with 100.0% or 40 individuals in the labor force. Within the labor force, the 20 to 24 years age range has the highest percentage of unemployed individuals, with 42.7% or 47 of them being unemployed.
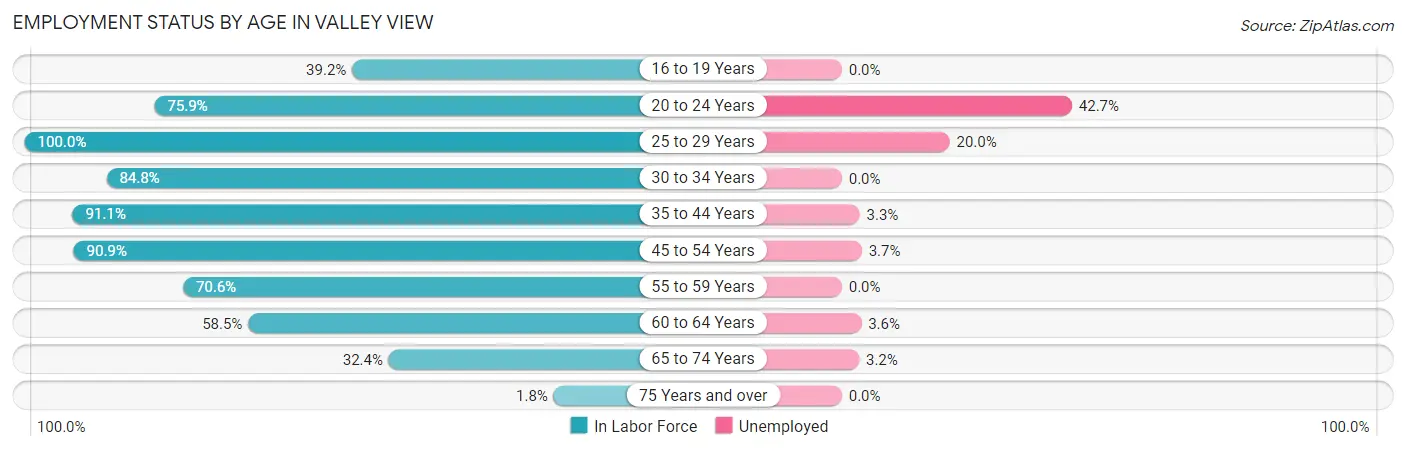
| Age Bracket | In Labor Force | Unemployed |
| 16 to 19 Years | 31 (39.2%) | 0 (0.0%) |
| 20 to 24 Years | 110 (75.9%) | 47 (42.7%) |
| 25 to 29 Years | 40 (100.0%) | 8 (20.0%) |
| 30 to 34 Years | 95 (84.8%) | 0 (0.0%) |
| 35 to 44 Years | 92 (91.1%) | 3 (3.3%) |
| 45 to 54 Years | 219 (90.9%) | 8 (3.7%) |
| 55 to 59 Years | 161 (70.6%) | 0 (0.0%) |
| 60 to 64 Years | 110 (58.5%) | 4 (3.6%) |
| 65 to 74 Years | 94 (32.4%) | 3 (3.2%) |
| 75 Years and over | 4 (1.8%) | 0 (0.0%) |
| Total | 955 (57.9%) | 73 (7.6%) |
Employment Status by Educational Attainment in Valley View
According to labor force statistics for Valley View, 78.8% of individuals (717) out of the total population between 25 and 64 years of age (910) are in the labor force, with 3.2% or 23 of them being unemployed. The group with the highest labor force participation rate are those with the educational attainment of bachelor's degree or higher, with 90.1% or 346 individuals in the labor force. Within the labor force, individuals with high school diploma education have the highest percentage of unemployment, with 7.0% or 13 of them being unemployed.
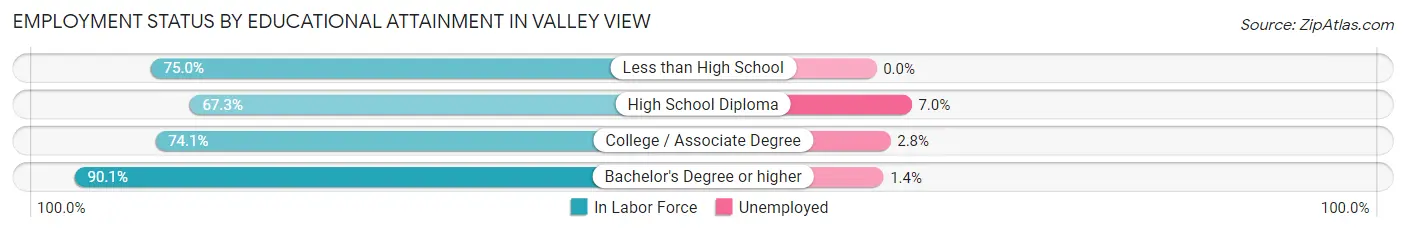
| Educational Attainment | In Labor Force | Unemployed |
| Less than High School | 9 (75.0%) | 0 (0.0%) |
| High School Diploma | 185 (67.3%) | 19 (7.0%) |
| College / Associate Degree | 177 (74.1%) | 7 (2.8%) |
| Bachelor's Degree or higher | 346 (90.1%) | 5 (1.4%) |
| Total | 717 (78.8%) | 29 (3.2%) |
Employment Occupations by Sex in Valley View
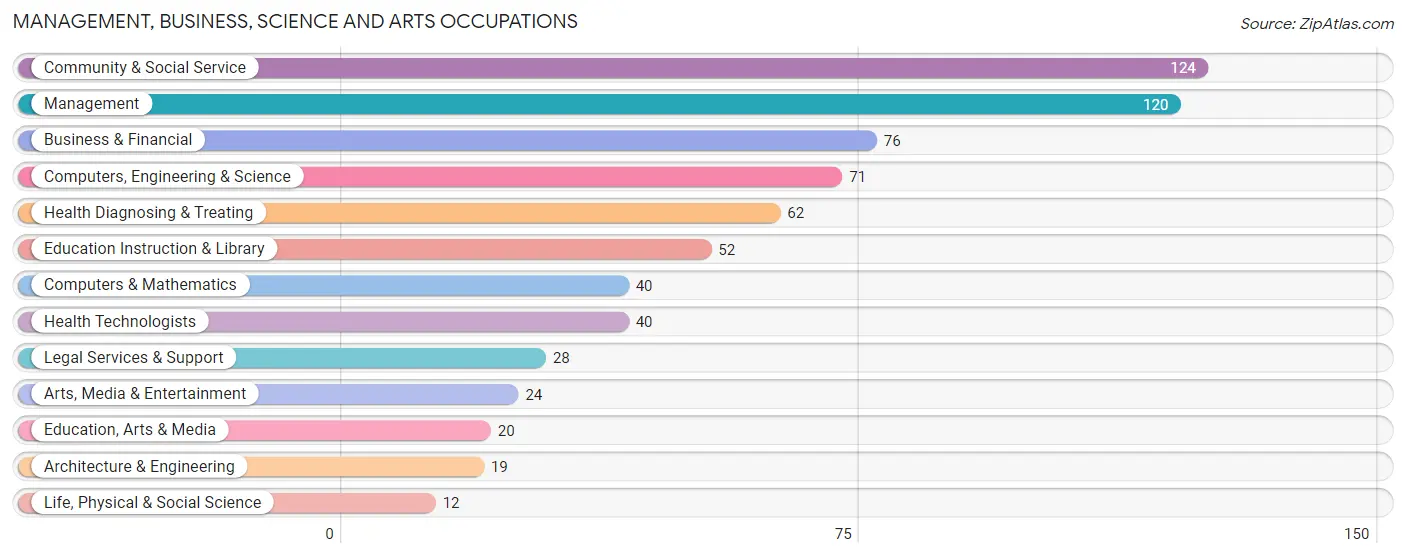
Management, Business, Science and Arts Occupations
The most common Management, Business, Science and Arts occupations in Valley View are Community & Social Service (124 | 14.0%), Management (120 | 13.6%), Business & Financial (76 | 8.6%), Computers, Engineering & Science (71 | 8.0%), and Health Diagnosing & Treating (62 | 7.0%).
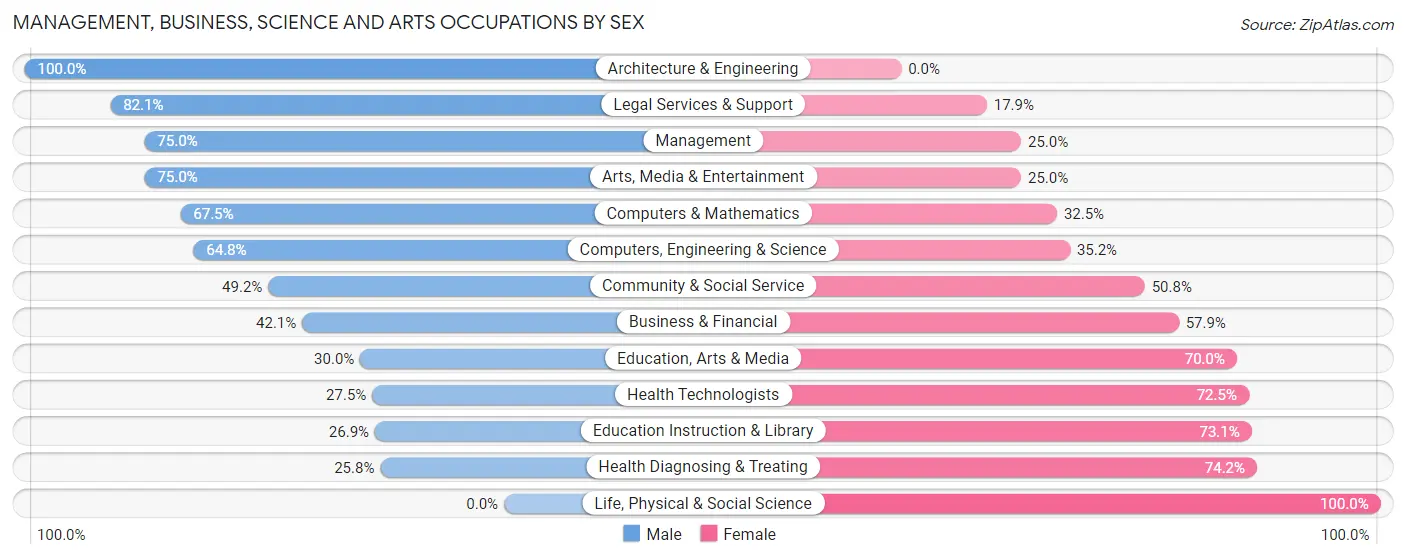
Management, Business, Science and Arts Occupations by Sex
Within the Management, Business, Science and Arts occupations in Valley View, the most male-oriented occupations are Architecture & Engineering (100.0%), Legal Services & Support (82.1%), and Management (75.0%), while the most female-oriented occupations are Life, Physical & Social Science (100.0%), Health Diagnosing & Treating (74.2%), and Education Instruction & Library (73.1%).
| Occupation | Male | Female |
| Management | 90 (75.0%) | 30 (25.0%) |
| Business & Financial | 32 (42.1%) | 44 (57.9%) |
| Computers, Engineering & Science | 46 (64.8%) | 25 (35.2%) |
| Computers & Mathematics | 27 (67.5%) | 13 (32.5%) |
| Architecture & Engineering | 19 (100.0%) | 0 (0.0%) |
| Life, Physical & Social Science | 0 (0.0%) | 12 (100.0%) |
| Community & Social Service | 61 (49.2%) | 63 (50.8%) |
| Education, Arts & Media | 6 (30.0%) | 14 (70.0%) |
| Legal Services & Support | 23 (82.1%) | 5 (17.9%) |
| Education Instruction & Library | 14 (26.9%) | 38 (73.1%) |
| Arts, Media & Entertainment | 18 (75.0%) | 6 (25.0%) |
| Health Diagnosing & Treating | 16 (25.8%) | 46 (74.2%) |
| Health Technologists | 11 (27.5%) | 29 (72.5%) |
| Total (Category) | 245 (54.1%) | 208 (45.9%) |
| Total (Overall) | 461 (52.2%) | 422 (47.8%) |
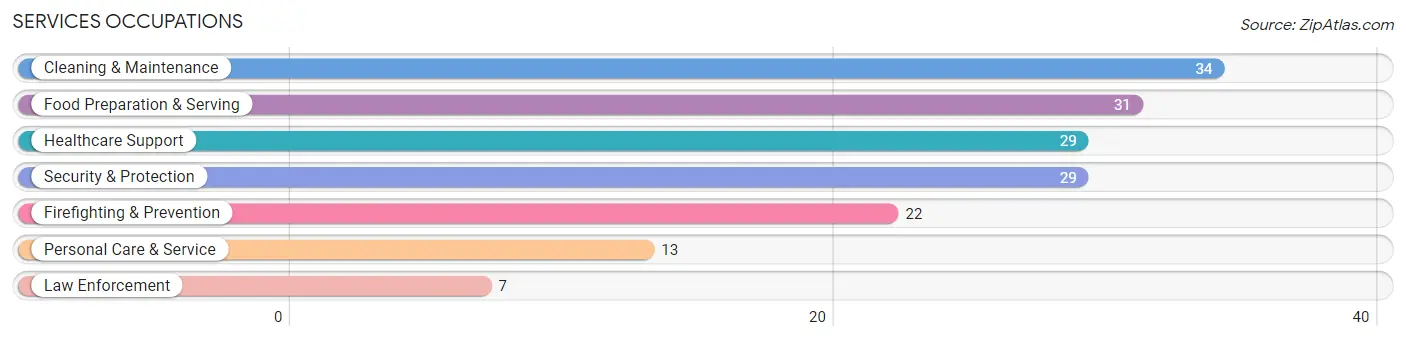
Services Occupations
The most common Services occupations in Valley View are Cleaning & Maintenance (34 | 3.8%), Food Preparation & Serving (31 | 3.5%), Healthcare Support (29 | 3.3%), Security & Protection (29 | 3.3%), and Firefighting & Prevention (22 | 2.5%).
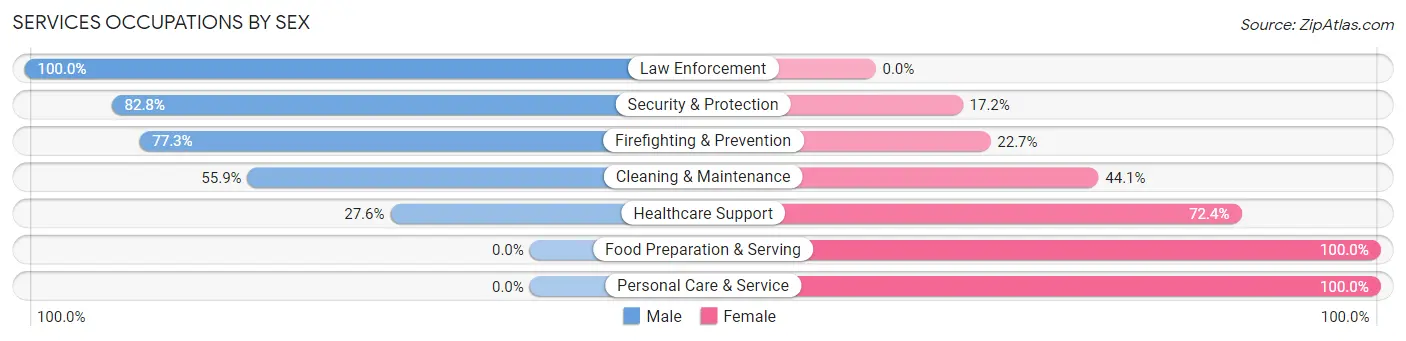
Services Occupations by Sex
Within the Services occupations in Valley View, the most male-oriented occupations are Law Enforcement (100.0%), Security & Protection (82.8%), and Firefighting & Prevention (77.3%), while the most female-oriented occupations are Food Preparation & Serving (100.0%), Personal Care & Service (100.0%), and Healthcare Support (72.4%).
| Occupation | Male | Female |
| Healthcare Support | 8 (27.6%) | 21 (72.4%) |
| Security & Protection | 24 (82.8%) | 5 (17.2%) |
| Firefighting & Prevention | 17 (77.3%) | 5 (22.7%) |
| Law Enforcement | 7 (100.0%) | 0 (0.0%) |
| Food Preparation & Serving | 0 (0.0%) | 31 (100.0%) |
| Cleaning & Maintenance | 19 (55.9%) | 15 (44.1%) |
| Personal Care & Service | 0 (0.0%) | 13 (100.0%) |
| Total (Category) | 51 (37.5%) | 85 (62.5%) |
| Total (Overall) | 461 (52.2%) | 422 (47.8%) |
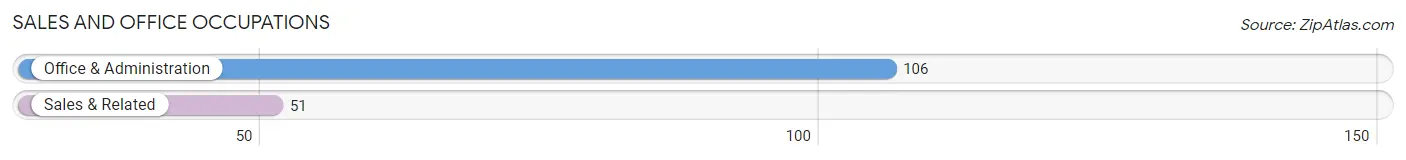
Sales and Office Occupations
The most common Sales and Office occupations in Valley View are Office & Administration (106 | 12.0%), and Sales & Related (51 | 5.8%).
Sales and Office Occupations by Sex
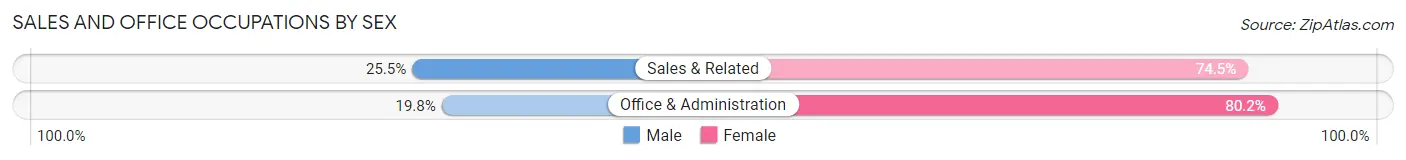
| Occupation | Male | Female |
| Sales & Related | 13 (25.5%) | 38 (74.5%) |
| Office & Administration | 21 (19.8%) | 85 (80.2%) |
| Total (Category) | 34 (21.7%) | 123 (78.3%) |
| Total (Overall) | 461 (52.2%) | 422 (47.8%) |
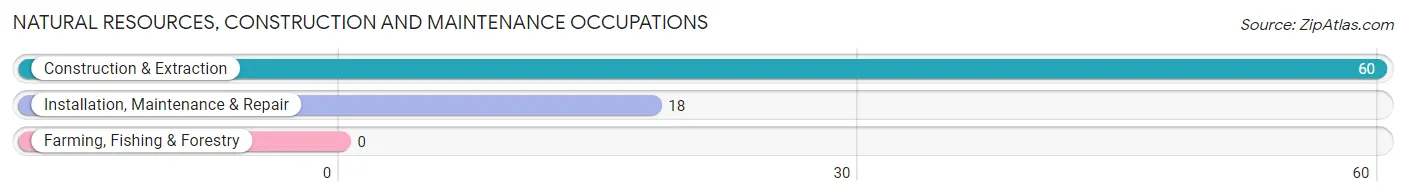
Natural Resources, Construction and Maintenance Occupations
The most common Natural Resources, Construction and Maintenance occupations in Valley View are Construction & Extraction (60 | 6.8%), and Installation, Maintenance & Repair (18 | 2.0%).
Natural Resources, Construction and Maintenance Occupations by Sex
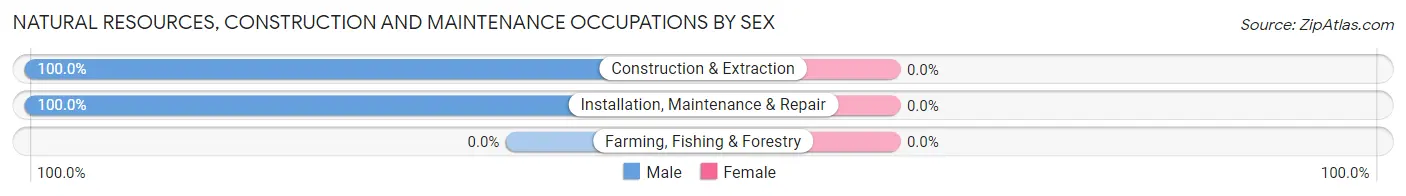
| Occupation | Male | Female |
| Farming, Fishing & Forestry | 0 (0.0%) | 0 (0.0%) |
| Construction & Extraction | 60 (100.0%) | 0 (0.0%) |
| Installation, Maintenance & Repair | 18 (100.0%) | 0 (0.0%) |
| Total (Category) | 78 (100.0%) | 0 (0.0%) |
| Total (Overall) | 461 (52.2%) | 422 (47.8%) |
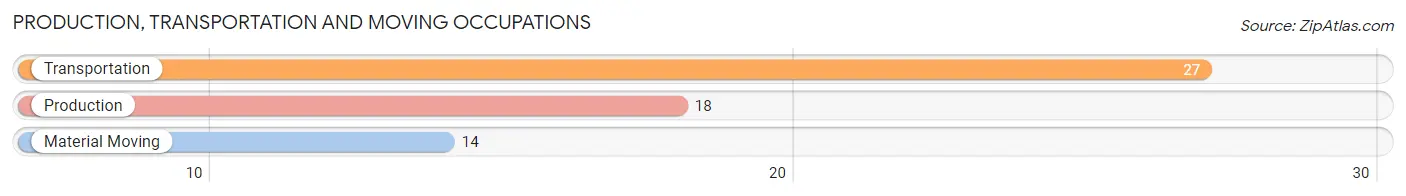
Production, Transportation and Moving Occupations
The most common Production, Transportation and Moving occupations in Valley View are Transportation (27 | 3.1%), Production (18 | 2.0%), and Material Moving (14 | 1.6%).
Production, Transportation and Moving Occupations by Sex
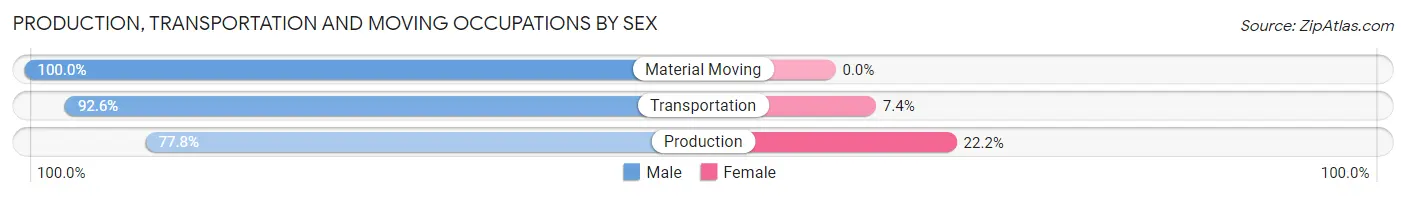
| Occupation | Male | Female |
| Production | 14 (77.8%) | 4 (22.2%) |
| Transportation | 25 (92.6%) | 2 (7.4%) |
| Material Moving | 14 (100.0%) | 0 (0.0%) |
| Total (Category) | 53 (89.8%) | 6 (10.2%) |
| Total (Overall) | 461 (52.2%) | 422 (47.8%) |
Employment Industries by Sex in Valley View
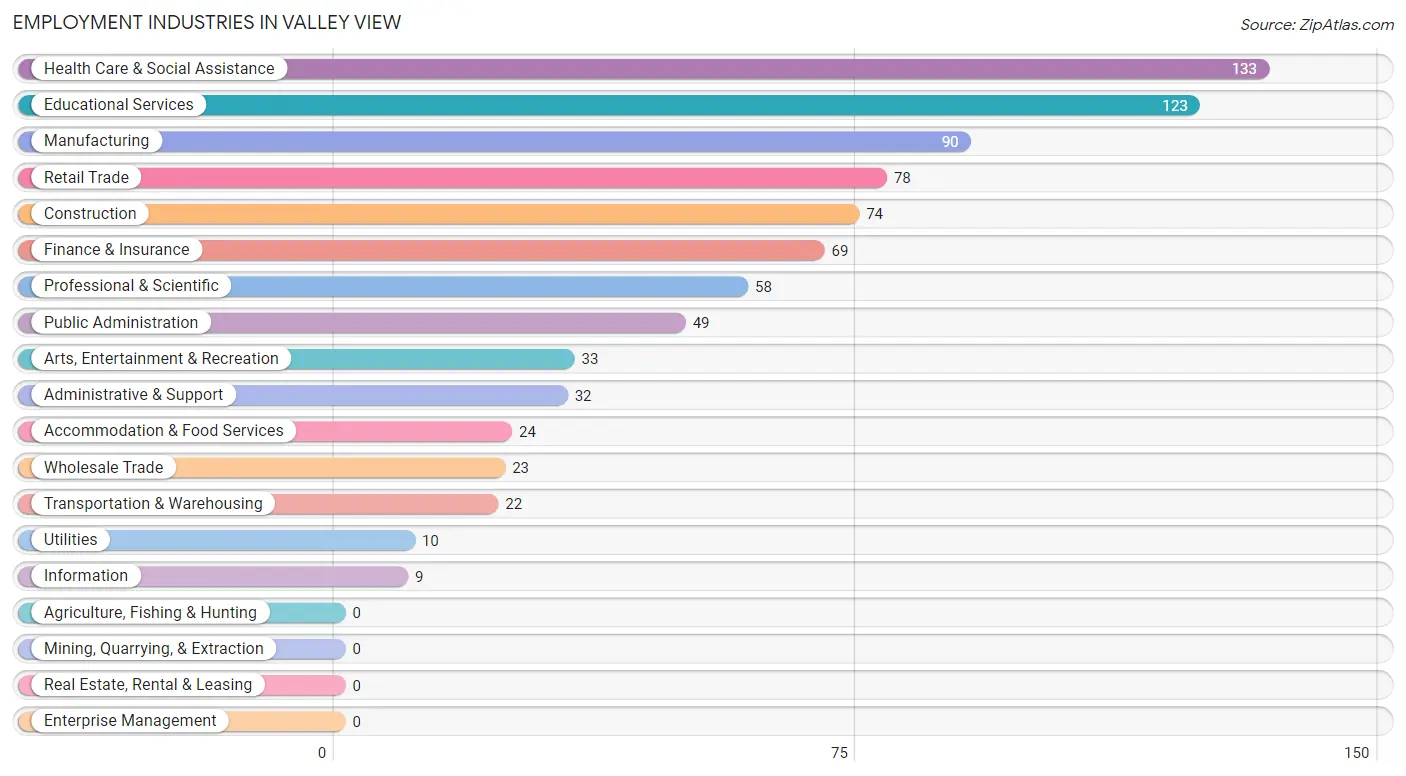
Employment Industries in Valley View
The major employment industries in Valley View include Health Care & Social Assistance (133 | 15.1%), Educational Services (123 | 13.9%), Manufacturing (90 | 10.2%), Retail Trade (78 | 8.8%), and Construction (74 | 8.4%).
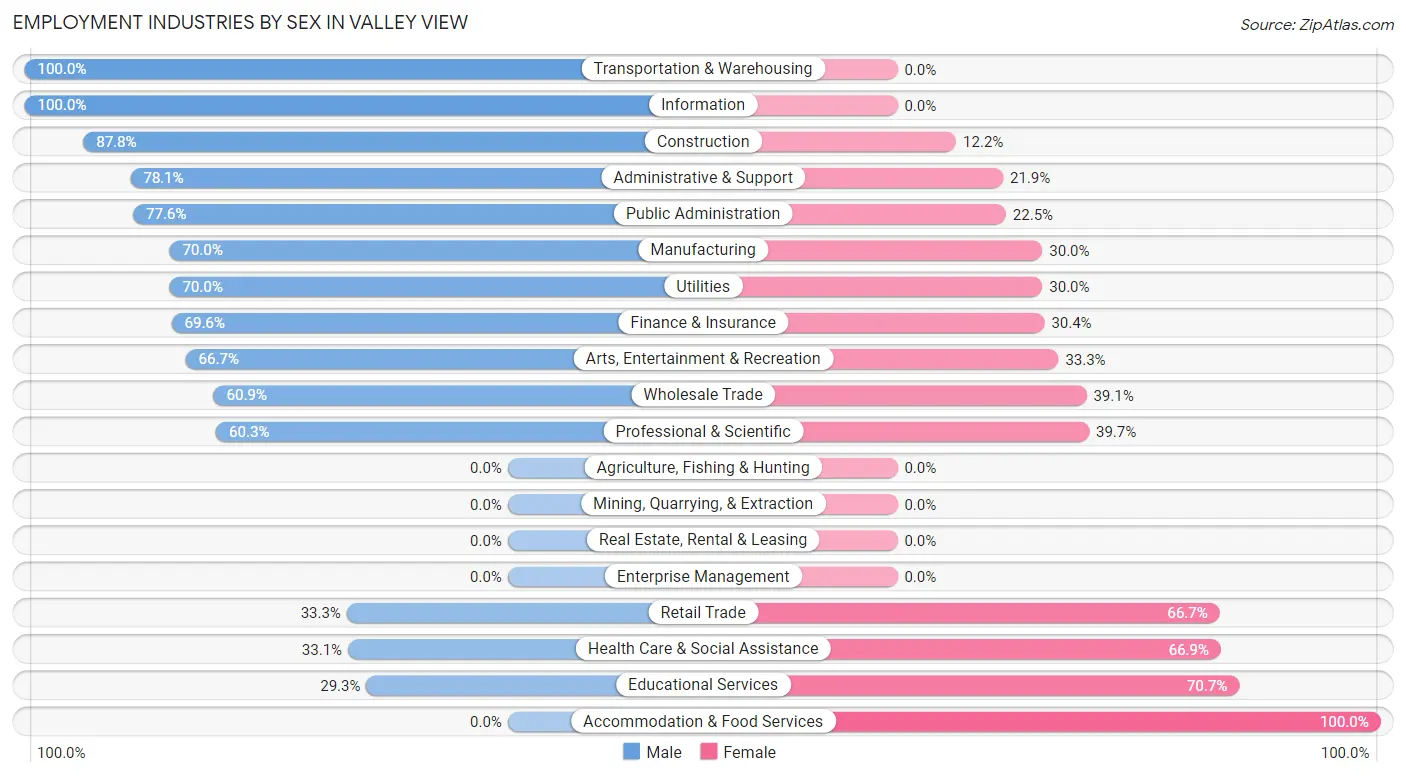
Employment Industries by Sex in Valley View
The Valley View industries that see more men than women are Transportation & Warehousing (100.0%), Information (100.0%), and Construction (87.8%), whereas the industries that tend to have a higher number of women are Accommodation & Food Services (100.0%), Educational Services (70.7%), and Health Care & Social Assistance (66.9%).
| Industry | Male | Female |
| Agriculture, Fishing & Hunting | 0 (0.0%) | 0 (0.0%) |
| Mining, Quarrying, & Extraction | 0 (0.0%) | 0 (0.0%) |
| Construction | 65 (87.8%) | 9 (12.2%) |
| Manufacturing | 63 (70.0%) | 27 (30.0%) |
| Wholesale Trade | 14 (60.9%) | 9 (39.1%) |
| Retail Trade | 26 (33.3%) | 52 (66.7%) |
| Transportation & Warehousing | 22 (100.0%) | 0 (0.0%) |
| Utilities | 7 (70.0%) | 3 (30.0%) |
| Information | 9 (100.0%) | 0 (0.0%) |
| Finance & Insurance | 48 (69.6%) | 21 (30.4%) |
| Real Estate, Rental & Leasing | 0 (0.0%) | 0 (0.0%) |
| Professional & Scientific | 35 (60.3%) | 23 (39.7%) |
| Enterprise Management | 0 (0.0%) | 0 (0.0%) |
| Administrative & Support | 25 (78.1%) | 7 (21.9%) |
| Educational Services | 36 (29.3%) | 87 (70.7%) |
| Health Care & Social Assistance | 44 (33.1%) | 89 (66.9%) |
| Arts, Entertainment & Recreation | 22 (66.7%) | 11 (33.3%) |
| Accommodation & Food Services | 0 (0.0%) | 24 (100.0%) |
| Public Administration | 38 (77.5%) | 11 (22.5%) |
| Total | 461 (52.2%) | 422 (47.8%) |
Education in Valley View
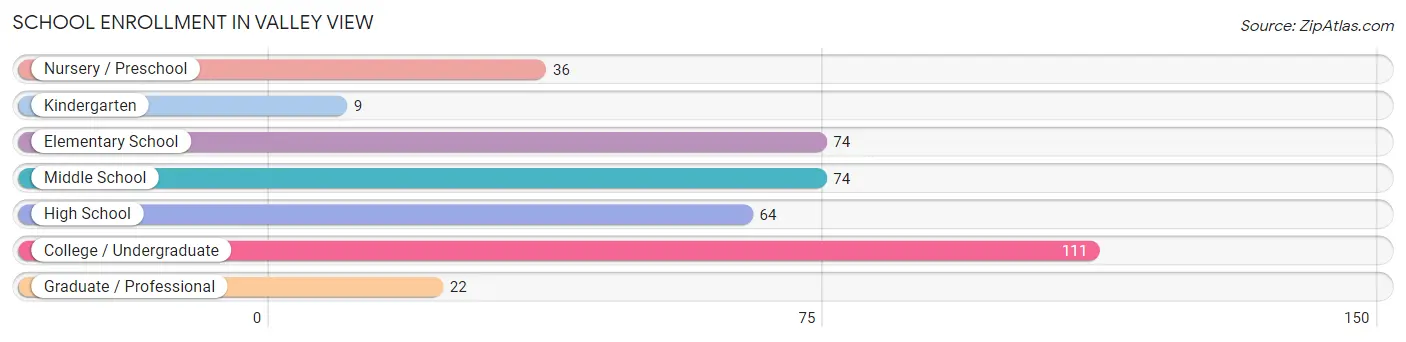
School Enrollment in Valley View
The most common levels of schooling among the 390 students in Valley View are college / undergraduate (111 | 28.5%), elementary school (74 | 19.0%), and middle school (74 | 19.0%).
| School Level | # Students | % Students |
| Nursery / Preschool | 36 | 9.2% |
| Kindergarten | 9 | 2.3% |
| Elementary School | 74 | 19.0% |
| Middle School | 74 | 19.0% |
| High School | 64 | 16.4% |
| College / Undergraduate | 111 | 28.5% |
| Graduate / Professional | 22 | 5.6% |
| Total | 390 | 100.0% |
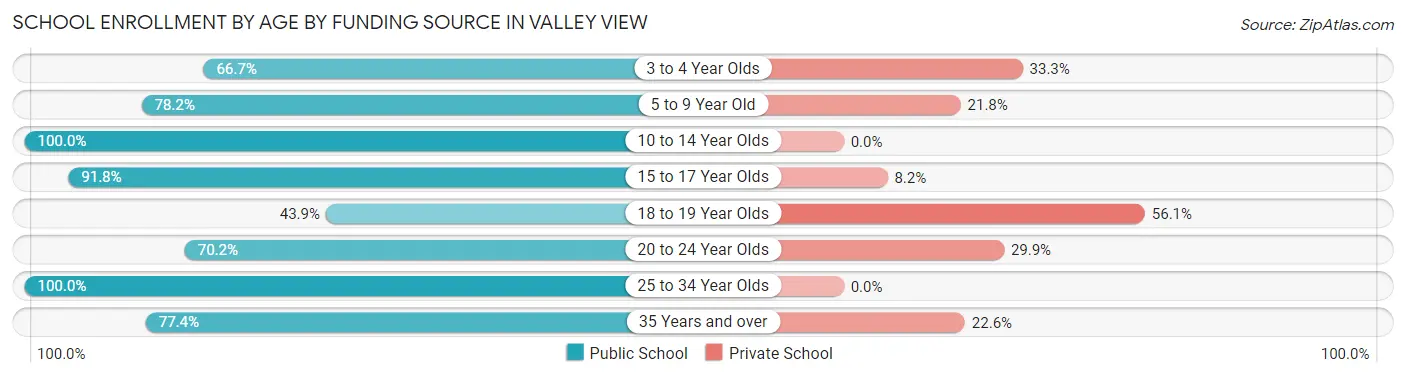
School Enrollment by Age by Funding Source in Valley View
Out of a total of 390 students who are enrolled in schools in Valley View, 80 (20.5%) attend a private institution, while the remaining 310 (79.5%) are enrolled in public schools. The age group of 18 to 19 year olds has the highest likelihood of being enrolled in private schools, with 23 (56.1% in the age bracket) enrolled. Conversely, the age group of 10 to 14 year olds has the lowest likelihood of being enrolled in a private school, with 86 (100.0% in the age bracket) attending a public institution.
| Age Bracket | Public School | Private School |
| 3 to 4 Year Olds | 8 (66.7%) | 4 (33.3%) |
| 5 to 9 Year Old | 79 (78.2%) | 22 (21.8%) |
| 10 to 14 Year Olds | 86 (100.0%) | 0 (0.0%) |
| 15 to 17 Year Olds | 45 (91.8%) | 4 (8.2%) |
| 18 to 19 Year Olds | 18 (43.9%) | 23 (56.1%) |
| 20 to 24 Year Olds | 47 (70.2%) | 20 (29.8%) |
| 25 to 34 Year Olds | 3 (100.0%) | 0 (0.0%) |
| 35 Years and over | 24 (77.4%) | 7 (22.6%) |
| Total | 310 (79.5%) | 80 (20.5%) |
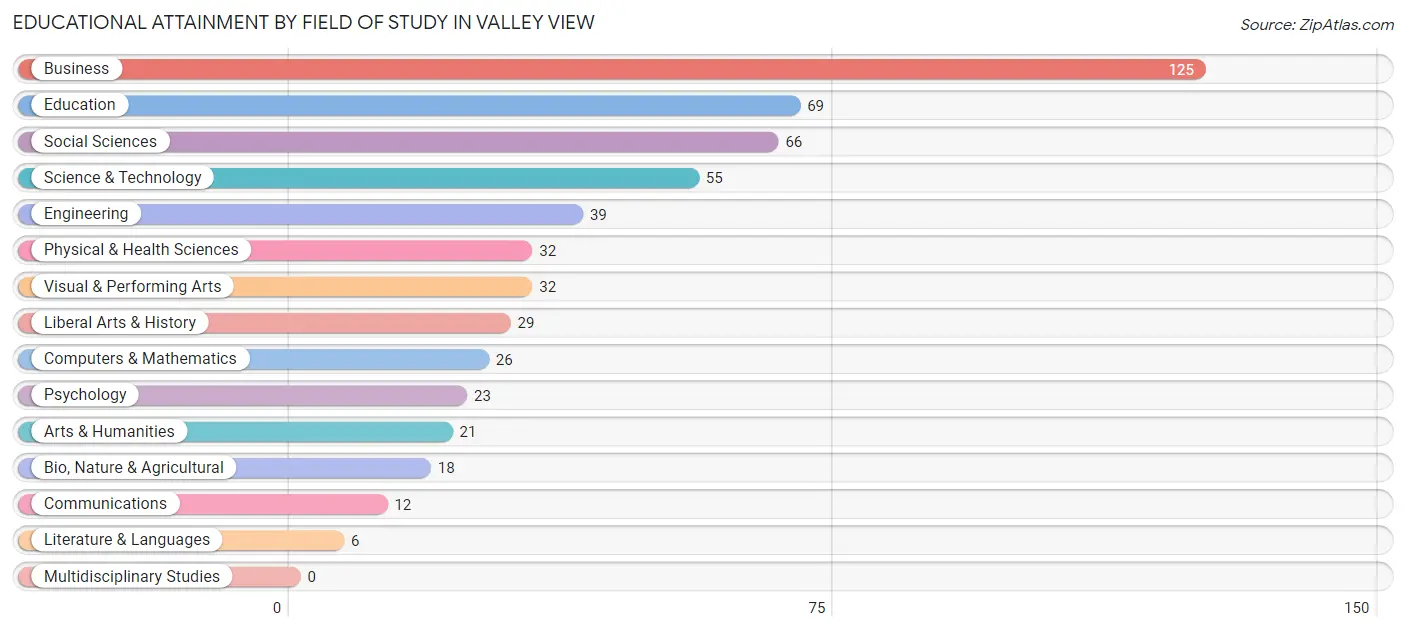
Educational Attainment by Field of Study in Valley View
Business (125 | 22.6%), education (69 | 12.5%), social sciences (66 | 11.9%), science & technology (55 | 10.0%), and engineering (39 | 7.0%) are the most common fields of study among 553 individuals in Valley View who have obtained a bachelor's degree or higher.
| Field of Study | # Graduates | % Graduates |
| Computers & Mathematics | 26 | 4.7% |
| Bio, Nature & Agricultural | 18 | 3.3% |
| Physical & Health Sciences | 32 | 5.8% |
| Psychology | 23 | 4.2% |
| Social Sciences | 66 | 11.9% |
| Engineering | 39 | 7.0% |
| Multidisciplinary Studies | 0 | 0.0% |
| Science & Technology | 55 | 10.0% |
| Business | 125 | 22.6% |
| Education | 69 | 12.5% |
| Literature & Languages | 6 | 1.1% |
| Liberal Arts & History | 29 | 5.2% |
| Visual & Performing Arts | 32 | 5.8% |
| Communications | 12 | 2.2% |
| Arts & Humanities | 21 | 3.8% |
| Total | 553 | 100.0% |
Transportation & Commute in Valley View
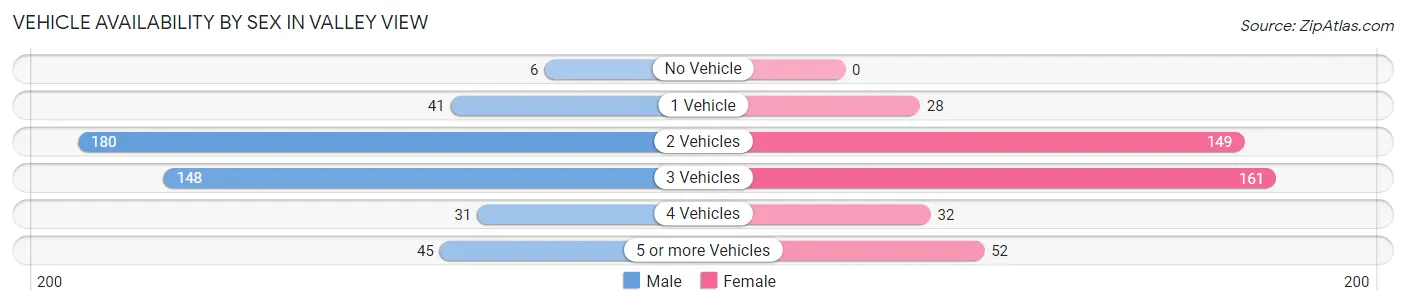
Vehicle Availability by Sex in Valley View
The most prevalent vehicle ownership categories in Valley View are males with 2 vehicles (180, accounting for 39.9%) and females with 2 vehicles (149, making up 42.6%).
| Vehicles Available | Male | Female |
| No Vehicle | 6 (1.3%) | 0 (0.0%) |
| 1 Vehicle | 41 (9.1%) | 28 (6.6%) |
| 2 Vehicles | 180 (39.9%) | 149 (35.3%) |
| 3 Vehicles | 148 (32.8%) | 161 (38.2%) |
| 4 Vehicles | 31 (6.9%) | 32 (7.6%) |
| 5 or more Vehicles | 45 (10.0%) | 52 (12.3%) |
| Total | 451 (100.0%) | 422 (100.0%) |
Commute Time in Valley View
The most frequently occuring commute durations in Valley View are 20 to 24 minutes (187 commuters, 24.8%), 15 to 19 minutes (105 commuters, 13.9%), and 30 to 34 minutes (104 commuters, 13.8%).
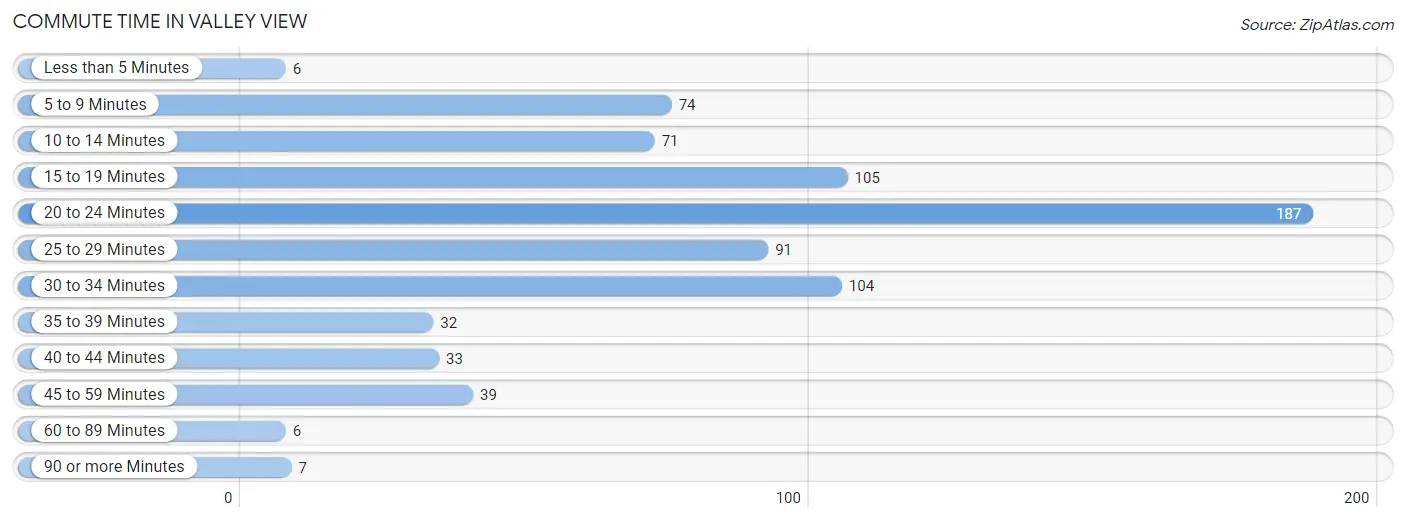
| Commute Time | # Commuters | % Commuters |
| Less than 5 Minutes | 6 | 0.8% |
| 5 to 9 Minutes | 74 | 9.8% |
| 10 to 14 Minutes | 71 | 9.4% |
| 15 to 19 Minutes | 105 | 13.9% |
| 20 to 24 Minutes | 187 | 24.8% |
| 25 to 29 Minutes | 91 | 12.0% |
| 30 to 34 Minutes | 104 | 13.8% |
| 35 to 39 Minutes | 32 | 4.2% |
| 40 to 44 Minutes | 33 | 4.4% |
| 45 to 59 Minutes | 39 | 5.2% |
| 60 to 89 Minutes | 6 | 0.8% |
| 90 or more Minutes | 7 | 0.9% |
Commute Time by Sex in Valley View
The most common commute times in Valley View are 20 to 24 minutes (99 commuters, 24.0%) for males and 20 to 24 minutes (88 commuters, 25.7%) for females.
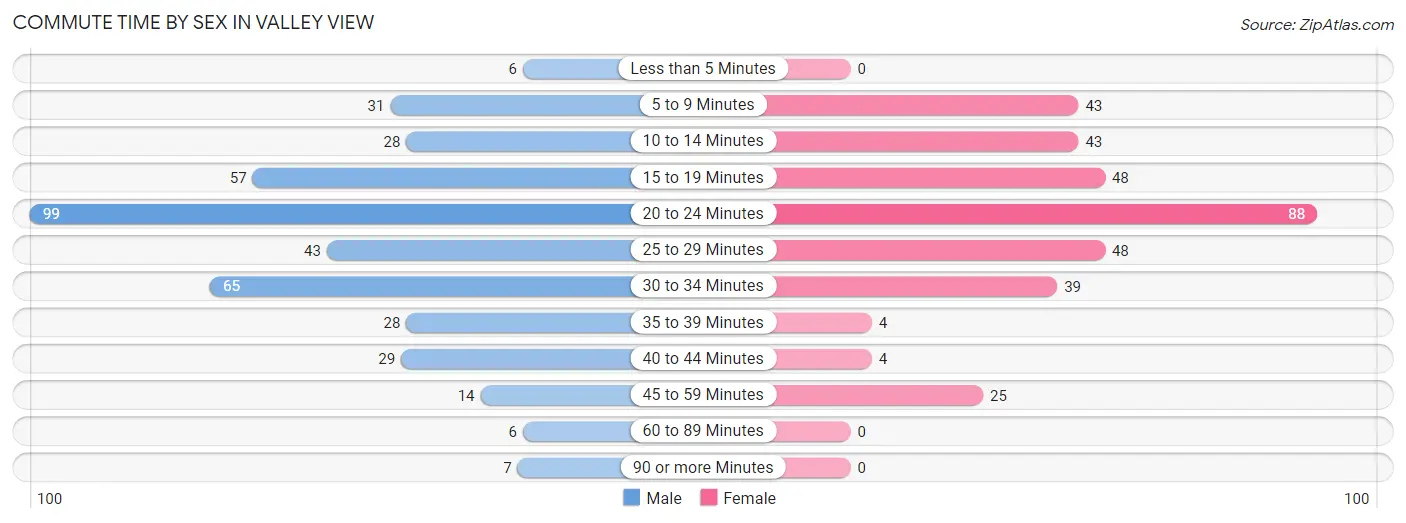
| Commute Time | Male | Female |
| Less than 5 Minutes | 6 (1.5%) | 0 (0.0%) |
| 5 to 9 Minutes | 31 (7.5%) | 43 (12.6%) |
| 10 to 14 Minutes | 28 (6.8%) | 43 (12.6%) |
| 15 to 19 Minutes | 57 (13.8%) | 48 (14.0%) |
| 20 to 24 Minutes | 99 (24.0%) | 88 (25.7%) |
| 25 to 29 Minutes | 43 (10.4%) | 48 (14.0%) |
| 30 to 34 Minutes | 65 (15.7%) | 39 (11.4%) |
| 35 to 39 Minutes | 28 (6.8%) | 4 (1.2%) |
| 40 to 44 Minutes | 29 (7.0%) | 4 (1.2%) |
| 45 to 59 Minutes | 14 (3.4%) | 25 (7.3%) |
| 60 to 89 Minutes | 6 (1.5%) | 0 (0.0%) |
| 90 or more Minutes | 7 (1.7%) | 0 (0.0%) |
Time of Departure to Work by Sex in Valley View
The most frequent times of departure to work in Valley View are 7:00 AM to 7:29 AM (98, 23.7%) for males and 7:00 AM to 7:29 AM (73, 21.3%) for females.
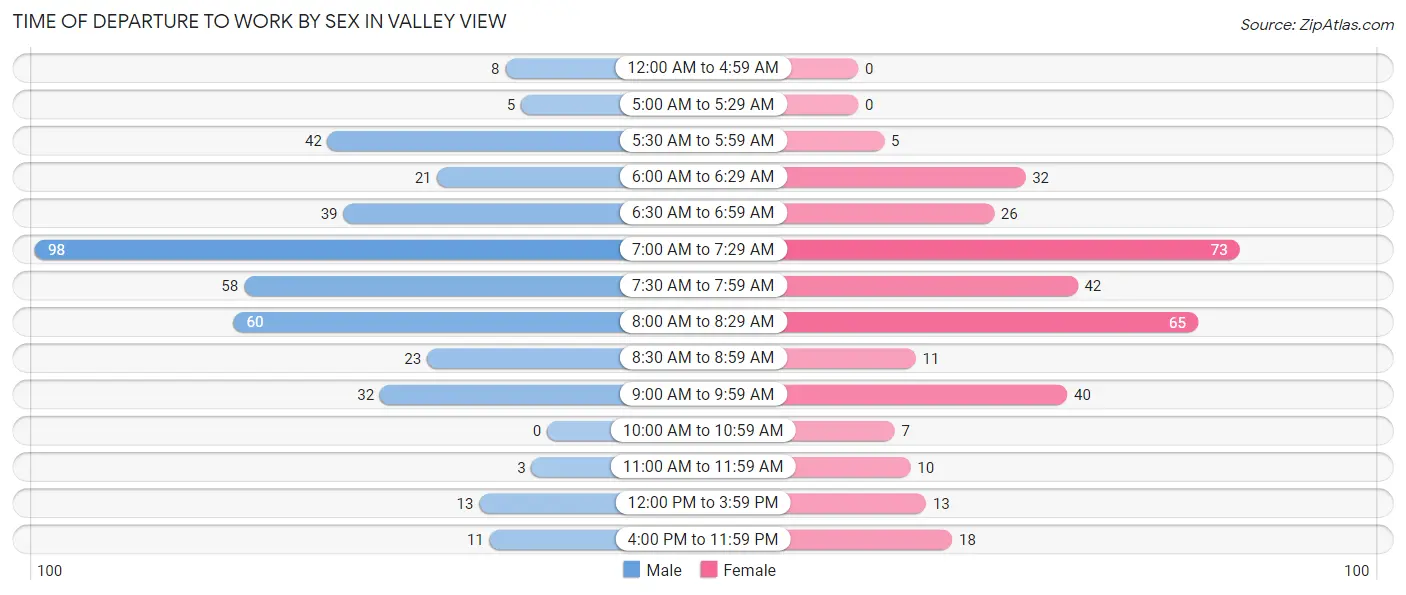
| Time of Departure | Male | Female |
| 12:00 AM to 4:59 AM | 8 (1.9%) | 0 (0.0%) |
| 5:00 AM to 5:29 AM | 5 (1.2%) | 0 (0.0%) |
| 5:30 AM to 5:59 AM | 42 (10.2%) | 5 (1.5%) |
| 6:00 AM to 6:29 AM | 21 (5.1%) | 32 (9.4%) |
| 6:30 AM to 6:59 AM | 39 (9.4%) | 26 (7.6%) |
| 7:00 AM to 7:29 AM | 98 (23.7%) | 73 (21.3%) |
| 7:30 AM to 7:59 AM | 58 (14.0%) | 42 (12.3%) |
| 8:00 AM to 8:29 AM | 60 (14.5%) | 65 (19.0%) |
| 8:30 AM to 8:59 AM | 23 (5.6%) | 11 (3.2%) |
| 9:00 AM to 9:59 AM | 32 (7.7%) | 40 (11.7%) |
| 10:00 AM to 10:59 AM | 0 (0.0%) | 7 (2.1%) |
| 11:00 AM to 11:59 AM | 3 (0.7%) | 10 (2.9%) |
| 12:00 PM to 3:59 PM | 13 (3.2%) | 13 (3.8%) |
| 4:00 PM to 11:59 PM | 11 (2.7%) | 18 (5.3%) |
| Total | 413 (100.0%) | 342 (100.0%) |
Housing Occupancy in Valley View
Occupancy by Ownership in Valley View
Of the total 777 dwellings in Valley View, owner-occupied units account for 719 (92.5%), while renter-occupied units make up 58 (7.5%).
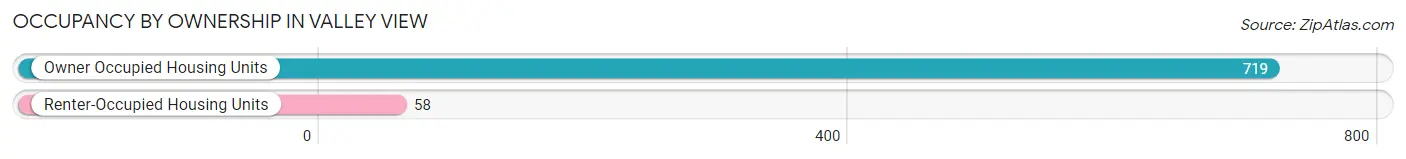
| Occupancy | # Housing Units | % Housing Units |
| Owner Occupied Housing Units | 719 | 92.5% |
| Renter-Occupied Housing Units | 58 | 7.5% |
| Total Occupied Housing Units | 777 | 100.0% |
Occupancy by Household Size in Valley View
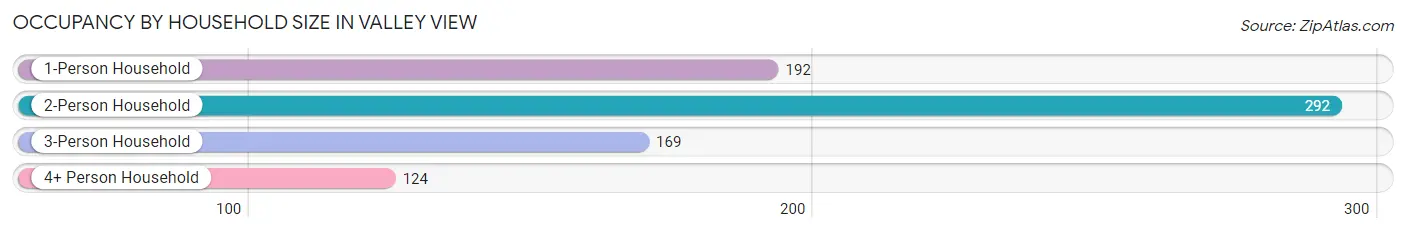
| Household Size | # Housing Units | % Housing Units |
| 1-Person Household | 192 | 24.7% |
| 2-Person Household | 292 | 37.6% |
| 3-Person Household | 169 | 21.7% |
| 4+ Person Household | 124 | 16.0% |
| Total Housing Units | 777 | 100.0% |
Occupancy by Ownership by Household Size in Valley View
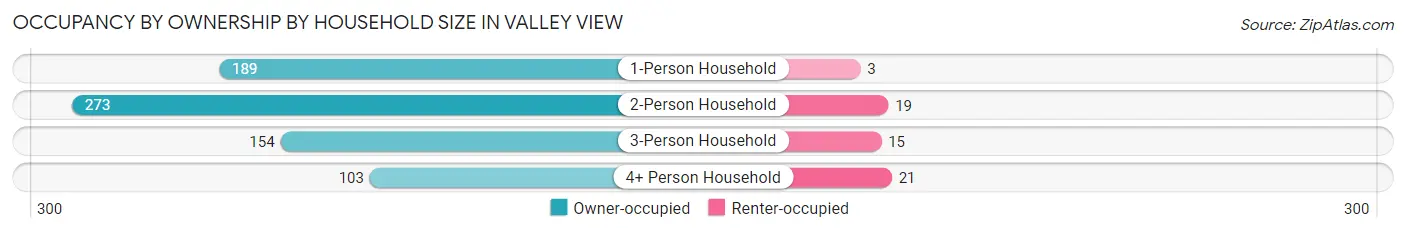
| Household Size | Owner-occupied | Renter-occupied |
| 1-Person Household | 189 (98.4%) | 3 (1.6%) |
| 2-Person Household | 273 (93.5%) | 19 (6.5%) |
| 3-Person Household | 154 (91.1%) | 15 (8.9%) |
| 4+ Person Household | 103 (83.1%) | 21 (16.9%) |
| Total Housing Units | 719 (92.5%) | 58 (7.5%) |
Occupancy by Educational Attainment in Valley View
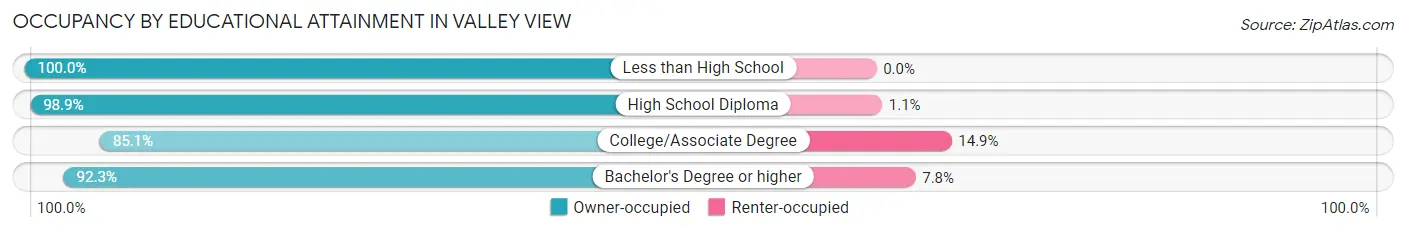
| Household Size | Owner-occupied | Renter-occupied |
| Less than High School | 9 (100.0%) | 0 (0.0%) |
| High School Diploma | 266 (98.9%) | 3 (1.1%) |
| College/Associate Degree | 194 (85.1%) | 34 (14.9%) |
| Bachelor's Degree or higher | 250 (92.2%) | 21 (7.7%) |
Occupancy by Age of Householder in Valley View
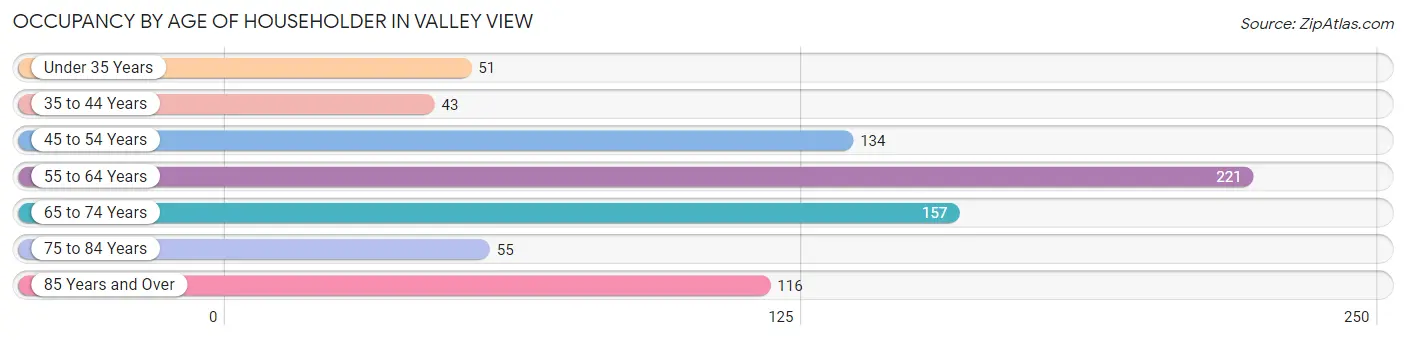
| Age Bracket | # Households | % Households |
| Under 35 Years | 51 | 6.6% |
| 35 to 44 Years | 43 | 5.5% |
| 45 to 54 Years | 134 | 17.2% |
| 55 to 64 Years | 221 | 28.4% |
| 65 to 74 Years | 157 | 20.2% |
| 75 to 84 Years | 55 | 7.1% |
| 85 Years and Over | 116 | 14.9% |
| Total | 777 | 100.0% |
Housing Finances in Valley View
Median Income by Occupancy in Valley View
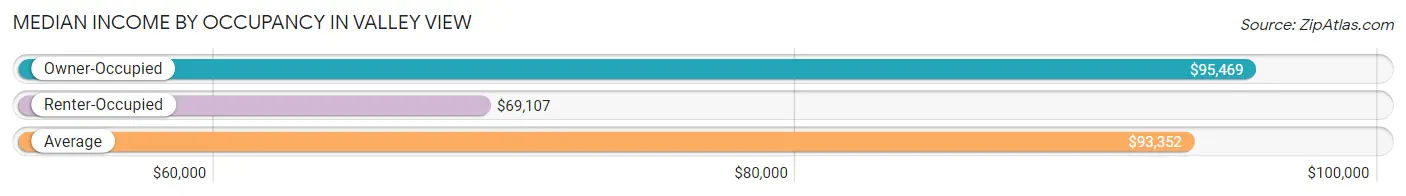
| Occupancy Type | # Households | Median Income |
| Owner-Occupied | 719 (92.5%) | $95,469 |
| Renter-Occupied | 58 (7.5%) | $69,107 |
| Average | 777 (100.0%) | $93,352 |
Occupancy by Householder Income Bracket in Valley View
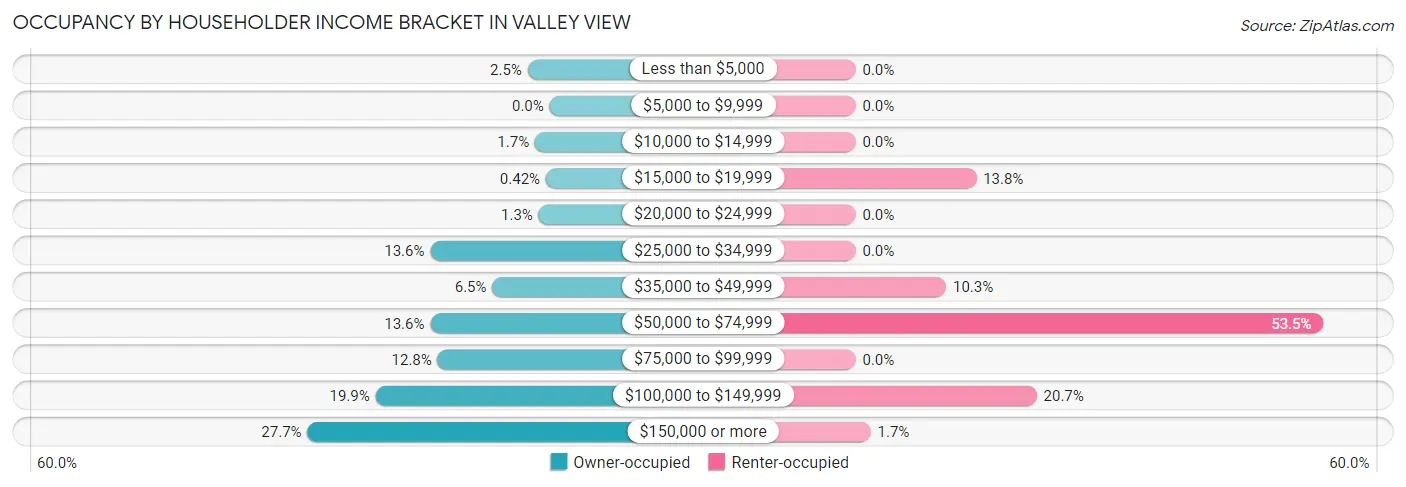
| Income Bracket | Owner-occupied | Renter-occupied |
| Less than $5,000 | 18 (2.5%) | 0 (0.0%) |
| $5,000 to $9,999 | 0 (0.0%) | 0 (0.0%) |
| $10,000 to $14,999 | 12 (1.7%) | 0 (0.0%) |
| $15,000 to $19,999 | 3 (0.4%) | 8 (13.8%) |
| $20,000 to $24,999 | 9 (1.3%) | 0 (0.0%) |
| $25,000 to $34,999 | 98 (13.6%) | 0 (0.0%) |
| $35,000 to $49,999 | 47 (6.5%) | 6 (10.3%) |
| $50,000 to $74,999 | 98 (13.6%) | 31 (53.4%) |
| $75,000 to $99,999 | 92 (12.8%) | 0 (0.0%) |
| $100,000 to $149,999 | 143 (19.9%) | 12 (20.7%) |
| $150,000 or more | 199 (27.7%) | 1 (1.7%) |
| Total | 719 (100.0%) | 58 (100.0%) |
Monthly Housing Cost Tiers in Valley View
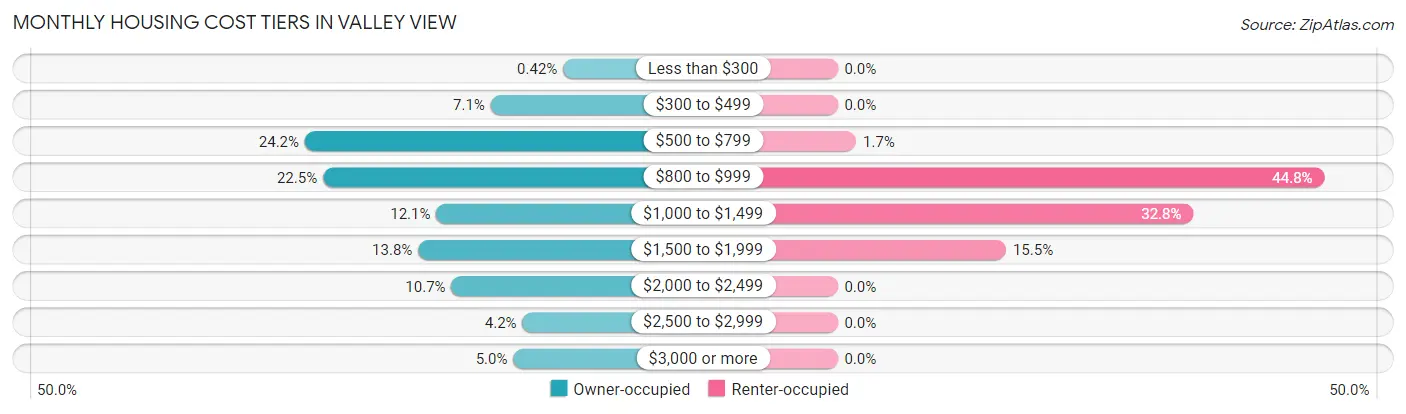
| Monthly Cost | Owner-occupied | Renter-occupied |
| Less than $300 | 3 (0.4%) | 0 (0.0%) |
| $300 to $499 | 51 (7.1%) | 0 (0.0%) |
| $500 to $799 | 174 (24.2%) | 1 (1.7%) |
| $800 to $999 | 162 (22.5%) | 26 (44.8%) |
| $1,000 to $1,499 | 87 (12.1%) | 19 (32.8%) |
| $1,500 to $1,999 | 99 (13.8%) | 9 (15.5%) |
| $2,000 to $2,499 | 77 (10.7%) | 0 (0.0%) |
| $2,500 to $2,999 | 30 (4.2%) | 0 (0.0%) |
| $3,000 or more | 36 (5.0%) | 0 (0.0%) |
| Total | 719 (100.0%) | 58 (100.0%) |
Physical Housing Characteristics in Valley View
Housing Structures in Valley View
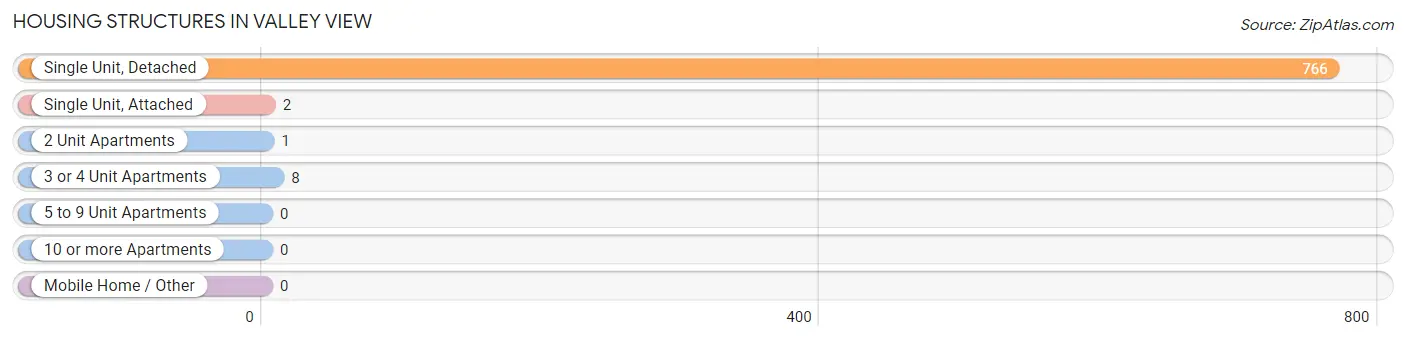
| Structure Type | # Housing Units | % Housing Units |
| Single Unit, Detached | 766 | 98.6% |
| Single Unit, Attached | 2 | 0.3% |
| 2 Unit Apartments | 1 | 0.1% |
| 3 or 4 Unit Apartments | 8 | 1.0% |
| 5 to 9 Unit Apartments | 0 | 0.0% |
| 10 or more Apartments | 0 | 0.0% |
| Mobile Home / Other | 0 | 0.0% |
| Total | 777 | 100.0% |
Housing Structures by Occupancy in Valley View
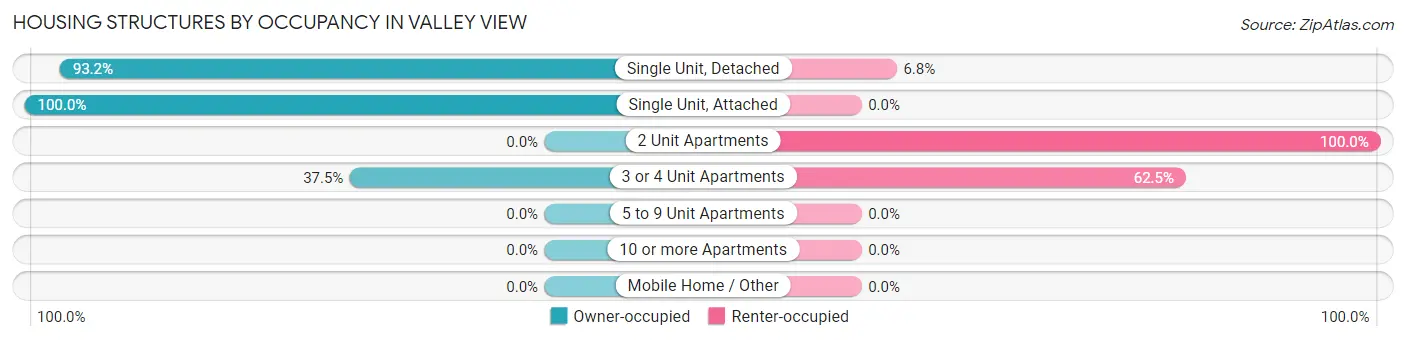
| Structure Type | Owner-occupied | Renter-occupied |
| Single Unit, Detached | 714 (93.2%) | 52 (6.8%) |
| Single Unit, Attached | 2 (100.0%) | 0 (0.0%) |
| 2 Unit Apartments | 0 (0.0%) | 1 (100.0%) |
| 3 or 4 Unit Apartments | 3 (37.5%) | 5 (62.5%) |
| 5 to 9 Unit Apartments | 0 (0.0%) | 0 (0.0%) |
| 10 or more Apartments | 0 (0.0%) | 0 (0.0%) |
| Mobile Home / Other | 0 (0.0%) | 0 (0.0%) |
| Total | 719 (92.5%) | 58 (7.5%) |
Housing Structures by Number of Rooms in Valley View
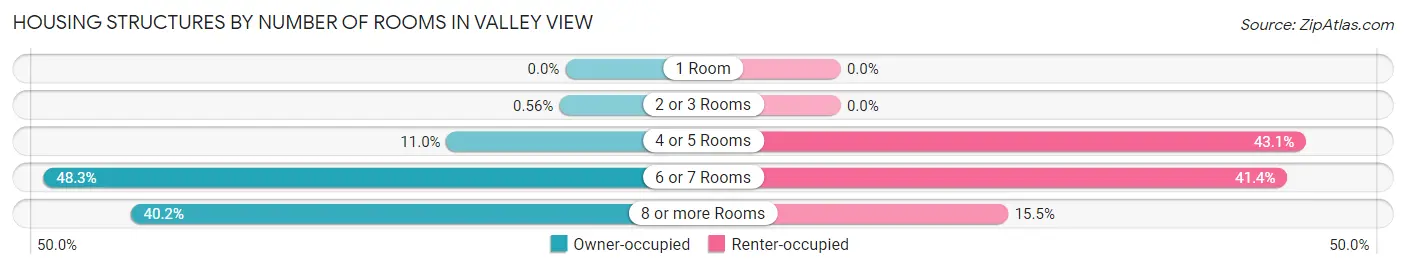
| Number of Rooms | Owner-occupied | Renter-occupied |
| 1 Room | 0 (0.0%) | 0 (0.0%) |
| 2 or 3 Rooms | 4 (0.6%) | 0 (0.0%) |
| 4 or 5 Rooms | 79 (11.0%) | 25 (43.1%) |
| 6 or 7 Rooms | 347 (48.3%) | 24 (41.4%) |
| 8 or more Rooms | 289 (40.2%) | 9 (15.5%) |
| Total | 719 (100.0%) | 58 (100.0%) |
Housing Structure by Heating Type in Valley View
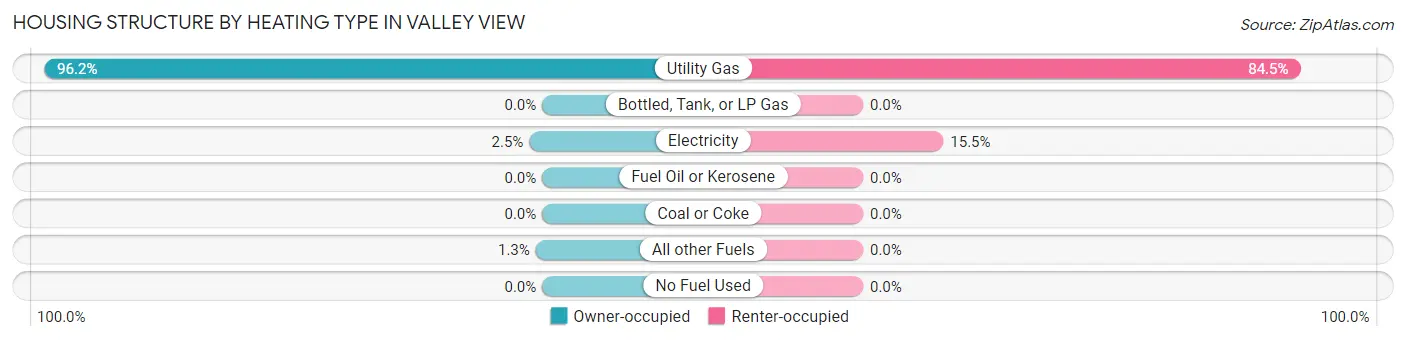
| Heating Type | Owner-occupied | Renter-occupied |
| Utility Gas | 692 (96.2%) | 49 (84.5%) |
| Bottled, Tank, or LP Gas | 0 (0.0%) | 0 (0.0%) |
| Electricity | 18 (2.5%) | 9 (15.5%) |
| Fuel Oil or Kerosene | 0 (0.0%) | 0 (0.0%) |
| Coal or Coke | 0 (0.0%) | 0 (0.0%) |
| All other Fuels | 9 (1.3%) | 0 (0.0%) |
| No Fuel Used | 0 (0.0%) | 0 (0.0%) |
| Total | 719 (100.0%) | 58 (100.0%) |
Household Vehicle Usage in Valley View
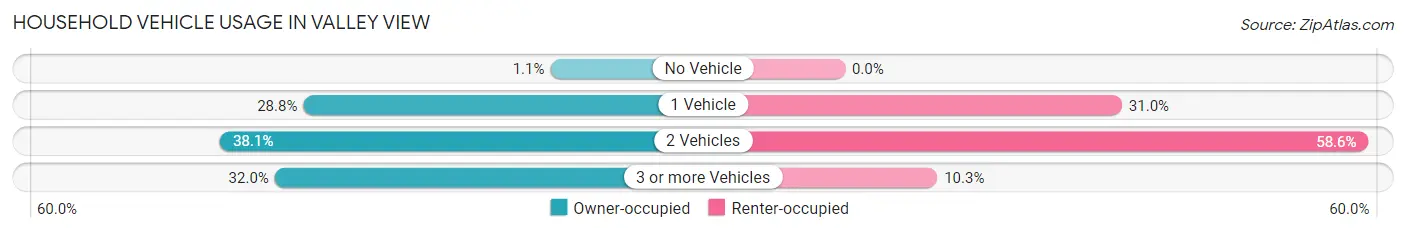
| Vehicles per Household | Owner-occupied | Renter-occupied |
| No Vehicle | 8 (1.1%) | 0 (0.0%) |
| 1 Vehicle | 207 (28.8%) | 18 (31.0%) |
| 2 Vehicles | 274 (38.1%) | 34 (58.6%) |
| 3 or more Vehicles | 230 (32.0%) | 6 (10.3%) |
| Total | 719 (100.0%) | 58 (100.0%) |
Real Estate & Mortgages in Valley View
Real Estate and Mortgage Overview in Valley View
| Characteristic | Without Mortgage | With Mortgage |
| Housing Units | 372 | 347 |
| Median Property Value | $200,000 | $305,600 |
| Median Household Income | $73,125 | $121 |
| Monthly Housing Costs | $738 | $36 |
| Real Estate Taxes | $3,096 | $0 |
Property Value by Mortgage Status in Valley View
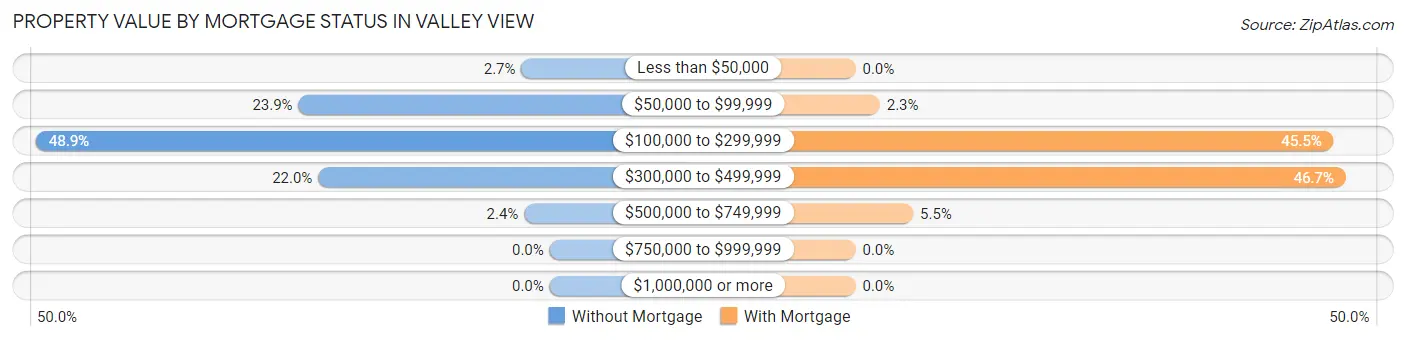
| Property Value | Without Mortgage | With Mortgage |
| Less than $50,000 | 10 (2.7%) | 0 (0.0%) |
| $50,000 to $99,999 | 89 (23.9%) | 8 (2.3%) |
| $100,000 to $299,999 | 182 (48.9%) | 158 (45.5%) |
| $300,000 to $499,999 | 82 (22.0%) | 162 (46.7%) |
| $500,000 to $749,999 | 9 (2.4%) | 19 (5.5%) |
| $750,000 to $999,999 | 0 (0.0%) | 0 (0.0%) |
| $1,000,000 or more | 0 (0.0%) | 0 (0.0%) |
| Total | 372 (100.0%) | 347 (100.0%) |
Household Income by Mortgage Status in Valley View
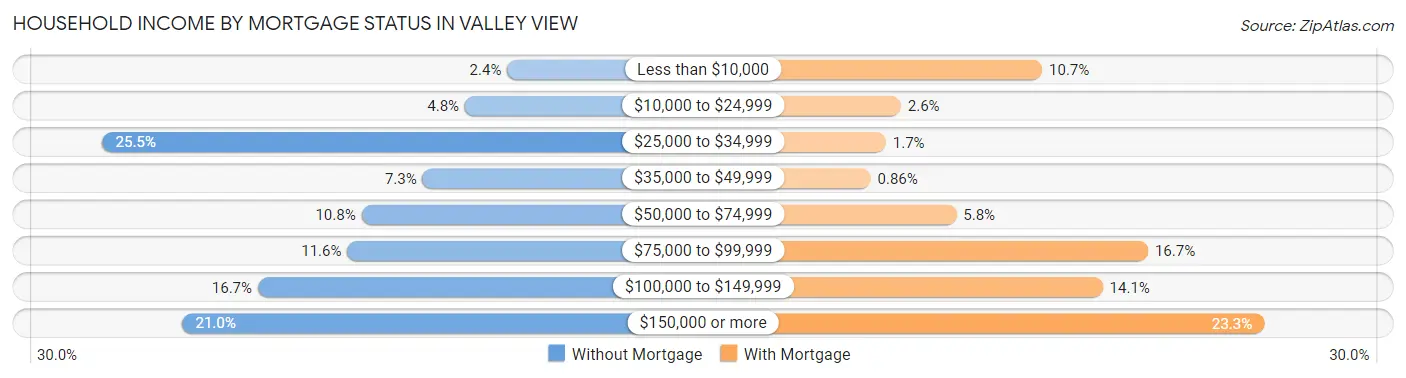
| Household Income | Without Mortgage | With Mortgage |
| Less than $10,000 | 9 (2.4%) | 37 (10.7%) |
| $10,000 to $24,999 | 18 (4.8%) | 9 (2.6%) |
| $25,000 to $34,999 | 95 (25.5%) | 6 (1.7%) |
| $35,000 to $49,999 | 27 (7.3%) | 3 (0.9%) |
| $50,000 to $74,999 | 40 (10.7%) | 20 (5.8%) |
| $75,000 to $99,999 | 43 (11.6%) | 58 (16.7%) |
| $100,000 to $149,999 | 62 (16.7%) | 49 (14.1%) |
| $150,000 or more | 78 (21.0%) | 81 (23.3%) |
| Total | 372 (100.0%) | 347 (100.0%) |
Property Value to Household Income Ratio in Valley View
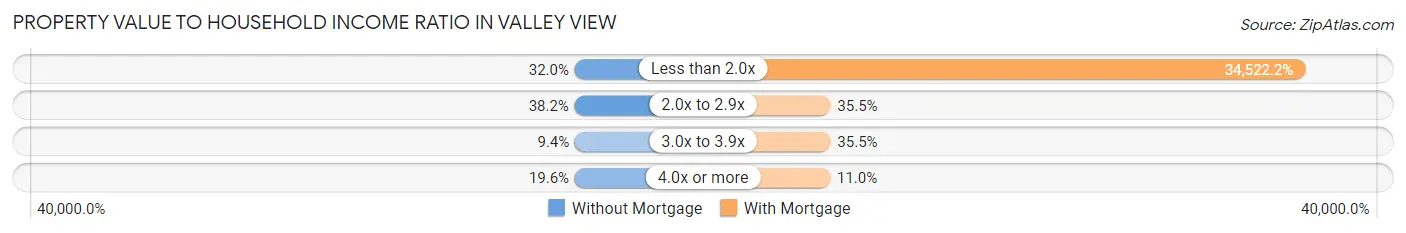
| Value-to-Income Ratio | Without Mortgage | With Mortgage |
| Less than 2.0x | 119 (32.0%) | 119,792 (34,522.2%) |
| 2.0x to 2.9x | 142 (38.2%) | 123 (35.4%) |
| 3.0x to 3.9x | 35 (9.4%) | 123 (35.4%) |
| 4.0x or more | 73 (19.6%) | 38 (11.0%) |
| Total | 372 (100.0%) | 347 (100.0%) |
Real Estate Taxes by Mortgage Status in Valley View
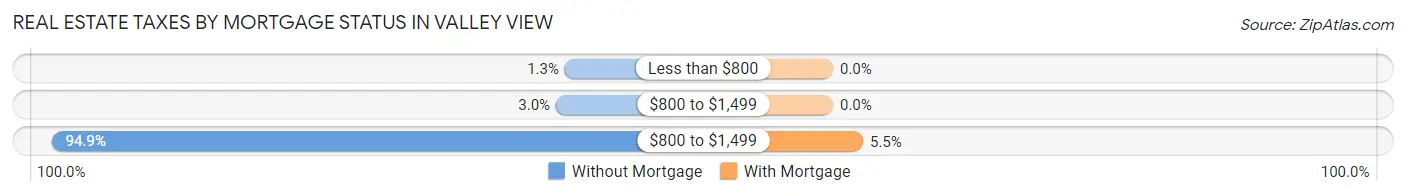
| Property Taxes | Without Mortgage | With Mortgage |
| Less than $800 | 5 (1.3%) | 0 (0.0%) |
| $800 to $1,499 | 11 (3.0%) | 0 (0.0%) |
| $800 to $1,499 | 353 (94.9%) | 19 (5.5%) |
| Total | 372 (100.0%) | 347 (100.0%) |
Health & Disability in Valley View
Health Insurance Coverage by Age in Valley View
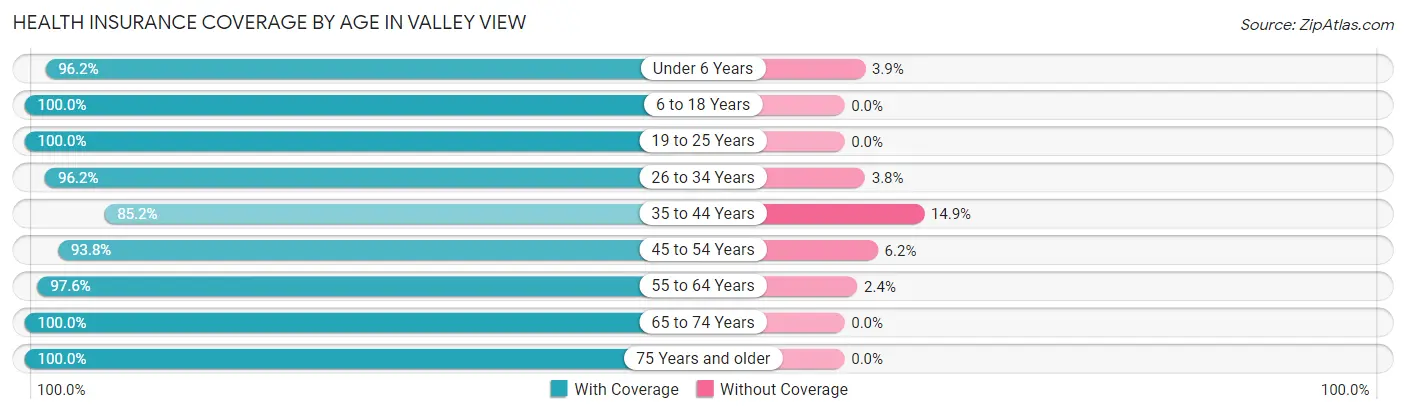
| Age Bracket | With Coverage | Without Coverage |
| Under 6 Years | 75 (96.2%) | 3 (3.8%) |
| 6 to 18 Years | 246 (100.0%) | 0 (0.0%) |
| 19 to 25 Years | 183 (100.0%) | 0 (0.0%) |
| 26 to 34 Years | 126 (96.2%) | 5 (3.8%) |
| 35 to 44 Years | 86 (85.2%) | 15 (14.8%) |
| 45 to 54 Years | 226 (93.8%) | 15 (6.2%) |
| 55 to 64 Years | 406 (97.6%) | 10 (2.4%) |
| 65 to 74 Years | 290 (100.0%) | 0 (0.0%) |
| 75 Years and older | 226 (100.0%) | 0 (0.0%) |
| Total | 1,864 (97.5%) | 48 (2.5%) |
Health Insurance Coverage by Citizenship Status in Valley View
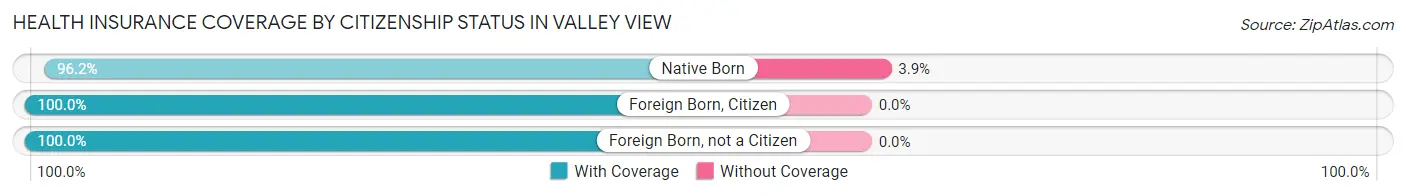
| Citizenship Status | With Coverage | Without Coverage |
| Native Born | 75 (96.2%) | 3 (3.8%) |
| Foreign Born, Citizen | 246 (100.0%) | 0 (0.0%) |
| Foreign Born, not a Citizen | 183 (100.0%) | 0 (0.0%) |
Health Insurance Coverage by Household Income in Valley View
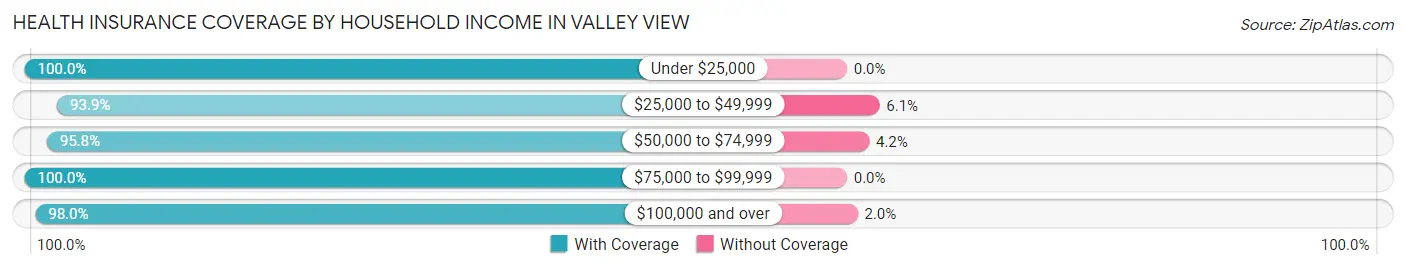
| Household Income | With Coverage | Without Coverage |
| Under $25,000 | 73 (100.0%) | 0 (0.0%) |
| $25,000 to $49,999 | 200 (93.9%) | 13 (6.1%) |
| $50,000 to $74,999 | 299 (95.8%) | 13 (4.2%) |
| $75,000 to $99,999 | 218 (100.0%) | 0 (0.0%) |
| $100,000 and over | 1,074 (98.0%) | 22 (2.0%) |
Public vs Private Health Insurance Coverage by Age in Valley View
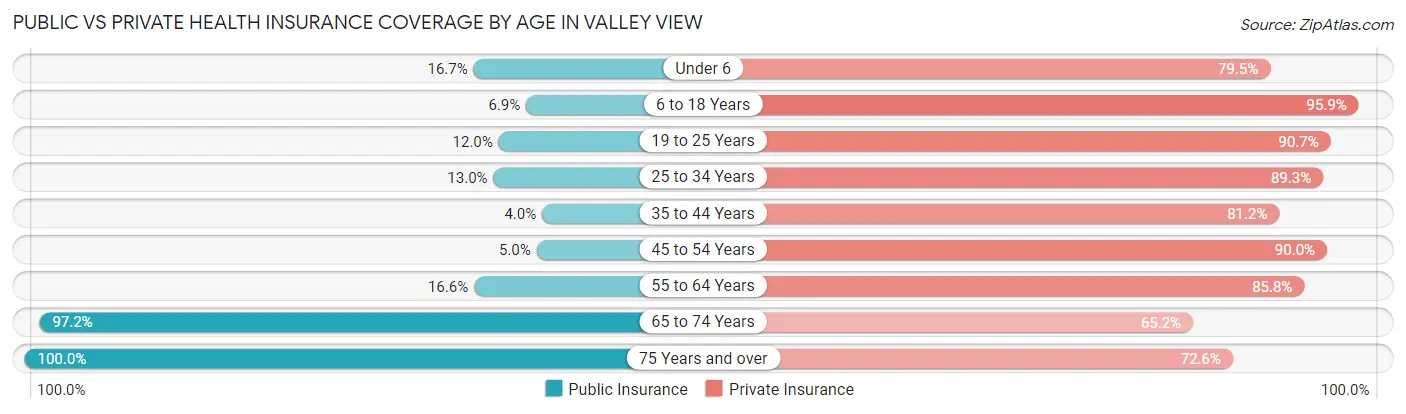
| Age Bracket | Public Insurance | Private Insurance |
| Under 6 | 13 (16.7%) | 62 (79.5%) |
| 6 to 18 Years | 17 (6.9%) | 236 (95.9%) |
| 19 to 25 Years | 22 (12.0%) | 166 (90.7%) |
| 25 to 34 Years | 17 (13.0%) | 117 (89.3%) |
| 35 to 44 Years | 4 (4.0%) | 82 (81.2%) |
| 45 to 54 Years | 12 (5.0%) | 217 (90.0%) |
| 55 to 64 Years | 69 (16.6%) | 357 (85.8%) |
| 65 to 74 Years | 282 (97.2%) | 189 (65.2%) |
| 75 Years and over | 226 (100.0%) | 164 (72.6%) |
| Total | 662 (34.6%) | 1,590 (83.2%) |
Disability Status by Sex by Age in Valley View
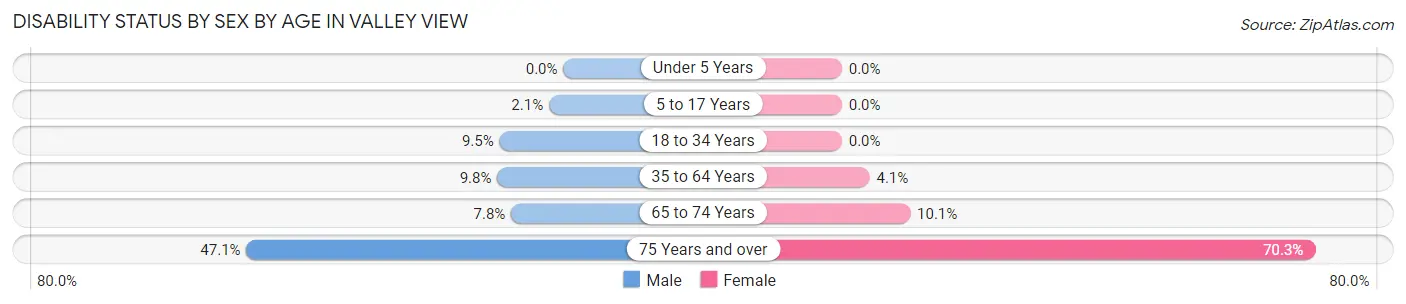
| Age Bracket | Male | Female |
| Under 5 Years | 0 (0.0%) | 0 (0.0%) |
| 5 to 17 Years | 3 (2.1%) | 0 (0.0%) |
| 18 to 34 Years | 18 (9.5%) | 0 (0.0%) |
| 35 to 64 Years | 41 (9.8%) | 14 (4.1%) |
| 65 to 74 Years | 11 (7.7%) | 15 (10.1%) |
| 75 Years and over | 24 (47.1%) | 123 (70.3%) |
Disability Class by Sex by Age in Valley View
Disability Class: Hearing Difficulty
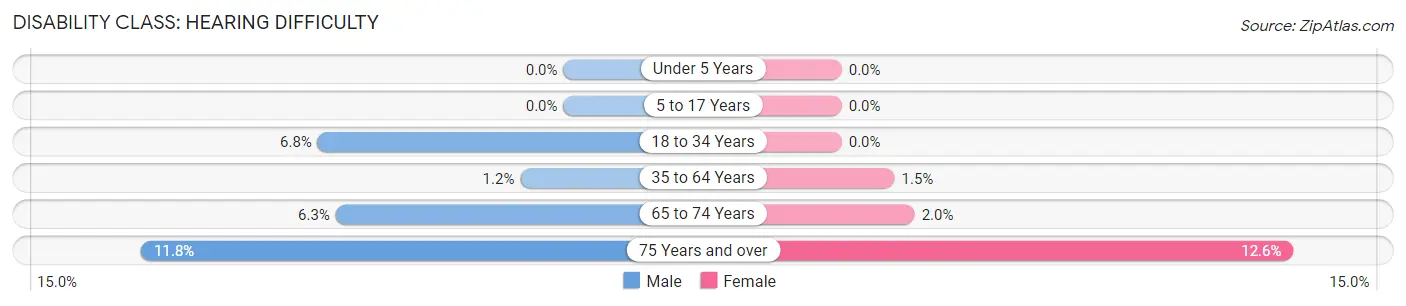
| Age Bracket | Male | Female |
| Under 5 Years | 0 (0.0%) | 0 (0.0%) |
| 5 to 17 Years | 0 (0.0%) | 0 (0.0%) |
| 18 to 34 Years | 13 (6.8%) | 0 (0.0%) |
| 35 to 64 Years | 5 (1.2%) | 5 (1.5%) |
| 65 to 74 Years | 9 (6.3%) | 3 (2.0%) |
| 75 Years and over | 6 (11.8%) | 22 (12.6%) |
Disability Class: Vision Difficulty
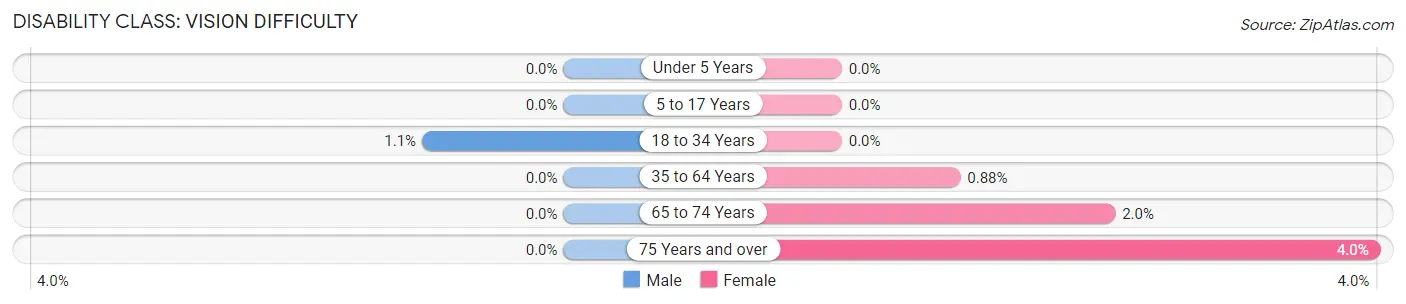
| Age Bracket | Male | Female |
| Under 5 Years | 0 (0.0%) | 0 (0.0%) |
| 5 to 17 Years | 0 (0.0%) | 0 (0.0%) |
| 18 to 34 Years | 2 (1.1%) | 0 (0.0%) |
| 35 to 64 Years | 0 (0.0%) | 3 (0.9%) |
| 65 to 74 Years | 0 (0.0%) | 3 (2.0%) |
| 75 Years and over | 0 (0.0%) | 7 (4.0%) |
Disability Class: Cognitive Difficulty
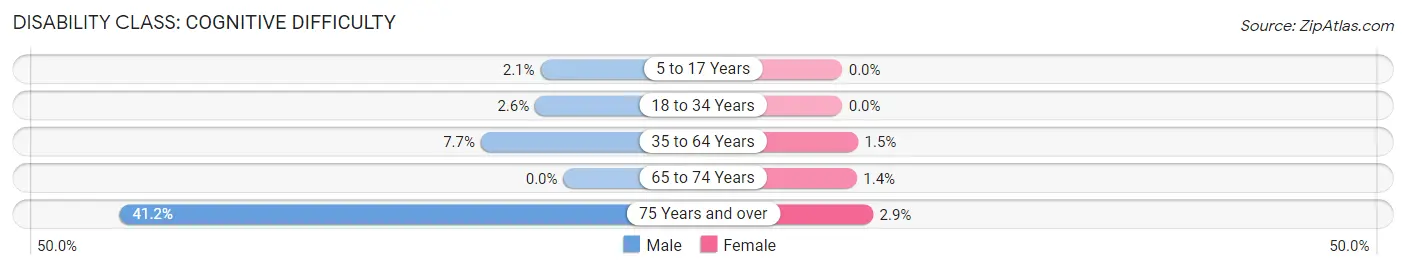
| Age Bracket | Male | Female |
| 5 to 17 Years | 3 (2.1%) | 0 (0.0%) |
| 18 to 34 Years | 5 (2.6%) | 0 (0.0%) |
| 35 to 64 Years | 32 (7.7%) | 5 (1.5%) |
| 65 to 74 Years | 0 (0.0%) | 2 (1.3%) |
| 75 Years and over | 21 (41.2%) | 5 (2.9%) |
Disability Class: Ambulatory Difficulty
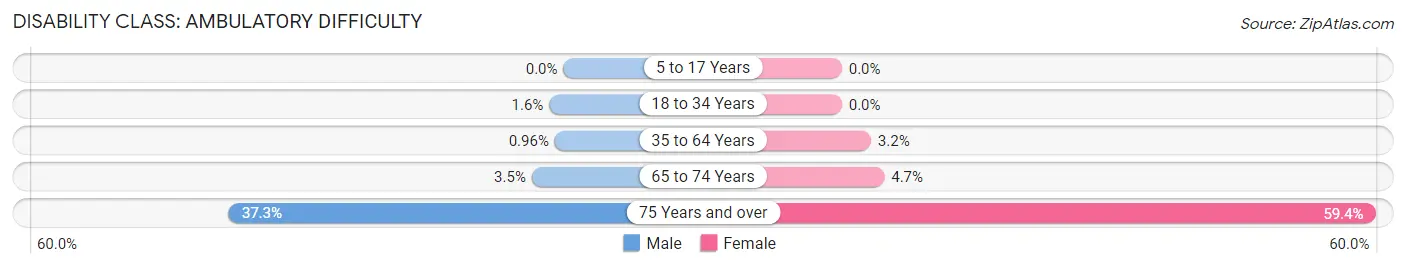
| Age Bracket | Male | Female |
| 5 to 17 Years | 0 (0.0%) | 0 (0.0%) |
| 18 to 34 Years | 3 (1.6%) | 0 (0.0%) |
| 35 to 64 Years | 4 (1.0%) | 11 (3.2%) |
| 65 to 74 Years | 5 (3.5%) | 7 (4.7%) |
| 75 Years and over | 19 (37.2%) | 104 (59.4%) |
Disability Class: Self-Care Difficulty
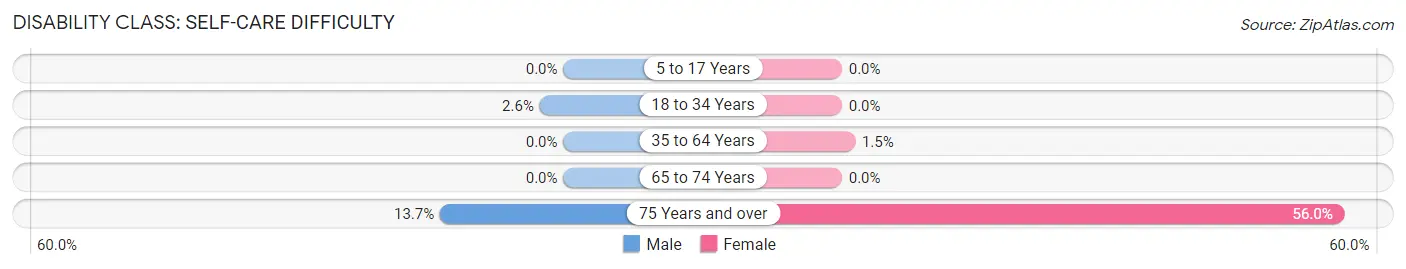
| Age Bracket | Male | Female |
| 5 to 17 Years | 0 (0.0%) | 0 (0.0%) |
| 18 to 34 Years | 5 (2.6%) | 0 (0.0%) |
| 35 to 64 Years | 0 (0.0%) | 5 (1.5%) |
| 65 to 74 Years | 0 (0.0%) | 0 (0.0%) |
| 75 Years and over | 7 (13.7%) | 98 (56.0%) |
Technology Access in Valley View
Computing Device Access in Valley View
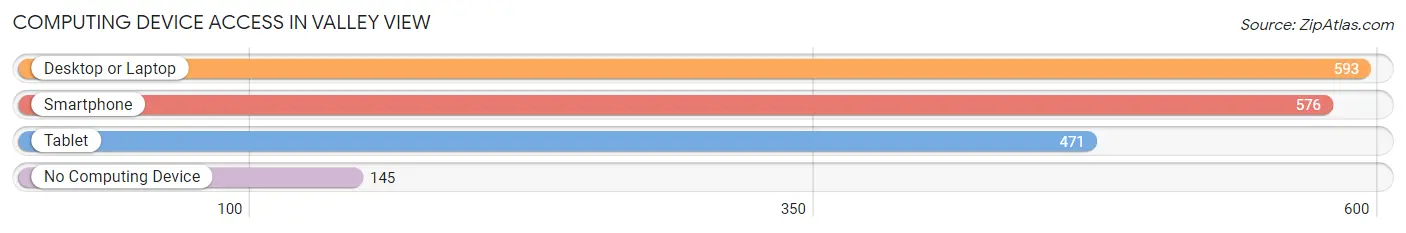
| Device Type | # Households | % Households |
| Desktop or Laptop | 593 | 76.3% |
| Smartphone | 576 | 74.1% |
| Tablet | 471 | 60.6% |
| No Computing Device | 145 | 18.7% |
| Total | 777 | 100.0% |
Internet Access in Valley View
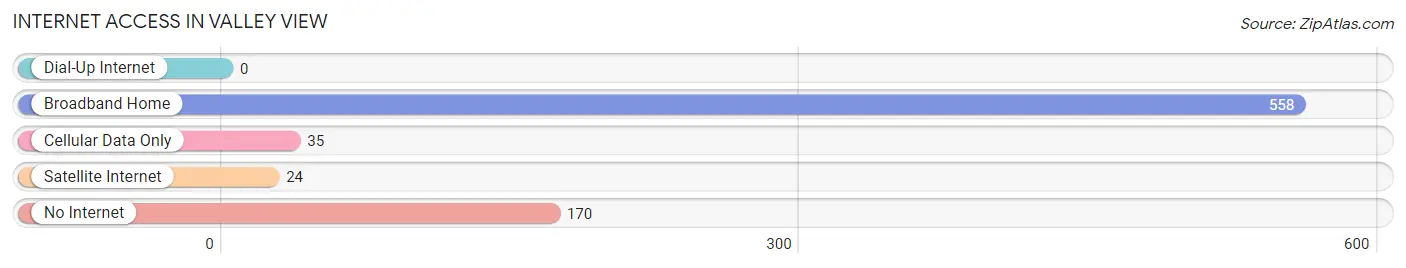
| Internet Type | # Households | % Households |
| Dial-Up Internet | 0 | 0.0% |
| Broadband Home | 558 | 71.8% |
| Cellular Data Only | 35 | 4.5% |
| Satellite Internet | 24 | 3.1% |
| No Internet | 170 | 21.9% |
| Total | 777 | 100.0% |
Valley View Summary
Valley View, Ohio is a small village located in Cuyahoga County, Ohio. It is situated approximately 10 miles south of Cleveland and is part of the Greater Cleveland Metropolitan Area. The village has a population of approximately 4,000 people and is a part of the Cleveland-Elyria-Mentor Metropolitan Statistical Area.
History
Valley View was founded in 1818 by a group of settlers from Connecticut. The village was originally known as “Valley View” due to its location in a valley between two hills. The village was incorporated in 1874 and was originally a farming community. In the late 19th century, the village began to grow and develop as a residential community.
Geography
Valley View is located in Cuyahoga County, Ohio. It is situated approximately 10 miles south of Cleveland and is part of the Greater Cleveland Metropolitan Area. The village is located in a valley between two hills and is bordered by the cities of Parma and Brooklyn Heights. The village is situated on the banks of the Cuyahoga River and is surrounded by the Cuyahoga Valley National Park.
Economy
Valley View’s economy is largely based on the service industry. The village is home to a variety of restaurants, retail stores, and other businesses. The village is also home to a number of manufacturing companies, including a steel mill and a plastics factory. The village is also home to a number of medical facilities, including a hospital and a nursing home.
Demographics
As of the 2010 census, the population of Valley View was 4,000. The racial makeup of the village was 94.2% White, 1.7% African American, 0.2% Native American, 0.7% Asian, 0.1% Pacific Islander, and 2.2% from other races. The median household income was $45,000 and the median family income was $50,000.
Valley View is a small village with a rich history and a diverse population. The village is home to a variety of businesses and is surrounded by the Cuyahoga Valley National Park. The village is a great place to live and work and offers a variety of amenities to its residents.
Common Questions
What is the Total Population of Valley View?
Total Population of Valley View is 1,912.
What is the Total Male Population of Valley View?
Total Male Population of Valley View is 969.
What is the Total Female Population of Valley View?
Total Female Population of Valley View is 943.
What is the Ratio of Males per 100 Females in Valley View?
There are 102.76 Males per 100 Females in Valley View.
What is the Ratio of Females per 100 Males in Valley View?
There are 97.32 Females per 100 Males in Valley View.
What is the Median Population Age in Valley View?
Median Population Age in Valley View is 53.8 Years.
What is the Average Family Size in Valley View
Average Family Size in Valley View is 2.9 People.
What is the Average Household Size in Valley View
Average Household Size in Valley View is 2.5 People.
What is Per Capita Income in Valley View?
Per Capita income in Valley View is $49,025.
What is the Median Family Income in Valley View?
Median Family Income in Valley View is $113,462.
What is the Median Household income in Valley View?
Median Household Income in Valley View is $93,352.
What is Income or Wage Gap in Valley View?
Income or Wage Gap in Valley View is 42.9%.
Women in Valley View earn 57.1 cents for every dollar earned by a man.
What is Inequality or Gini Index in Valley View?
Inequality or Gini Index in Valley View is 0.43.
How Large is the Labor Force in Valley View?
There are 955 People in the Labor Forcein in Valley View.
What is the Percentage of People in the Labor Force in Valley View?
57.9% of People are in the Labor Force in Valley View.
What is the Unemployment Rate in Valley View?
Unemployment Rate in Valley View is 7.6%.