St Paris, OH
St Paris Map
St Paris Overview
2,138
TOTAL POPULATION
1,029
MALE POPULATION
1,109
FEMALE POPULATION
92.79
MALES / 100 FEMALES
107.77
FEMALES / 100 MALES
34.5
MEDIAN AGE
3.3
AVG FAMILY SIZE
2.7
AVG HOUSEHOLD SIZE
$28,109
PER CAPITA INCOME
$83,563
AVG FAMILY INCOME
$62,500
AVG HOUSEHOLD INCOME
38.4%
WAGE / INCOME GAP [ % ]
61.6¢/ $1
WAGE / INCOME GAP [ $ ]
0.33
INEQUALITY / GINI INDEX
1,067
LABOR FORCE [ PEOPLE ]
64.8%
PERCENT IN LABOR FORCE
4.6%
UNEMPLOYMENT RATE
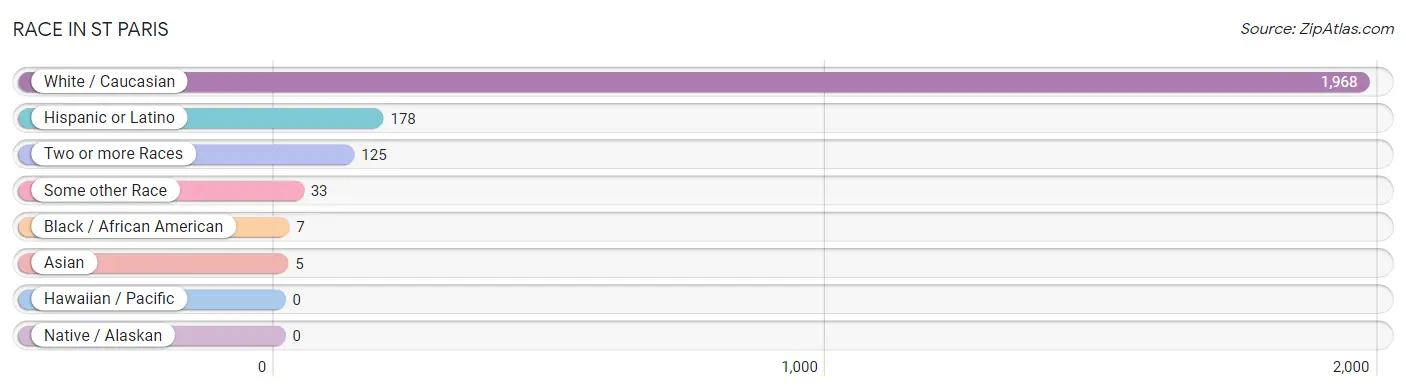
Race in St Paris
The most populous races in St Paris are White / Caucasian (1,968 | 92.0%), Hispanic or Latino (178 | 8.3%), and Two or more Races (125 | 5.9%).
| Race | # Population | % Population |
| Asian | 5 | 0.2% |
| Black / African American | 7 | 0.3% |
| Hawaiian / Pacific | 0 | 0.0% |
| Hispanic or Latino | 178 | 8.3% |
| Native / Alaskan | 0 | 0.0% |
| White / Caucasian | 1,968 | 92.0% |
| Two or more Races | 125 | 5.9% |
| Some other Race | 33 | 1.5% |
| Total | 2,138 | 100.0% |
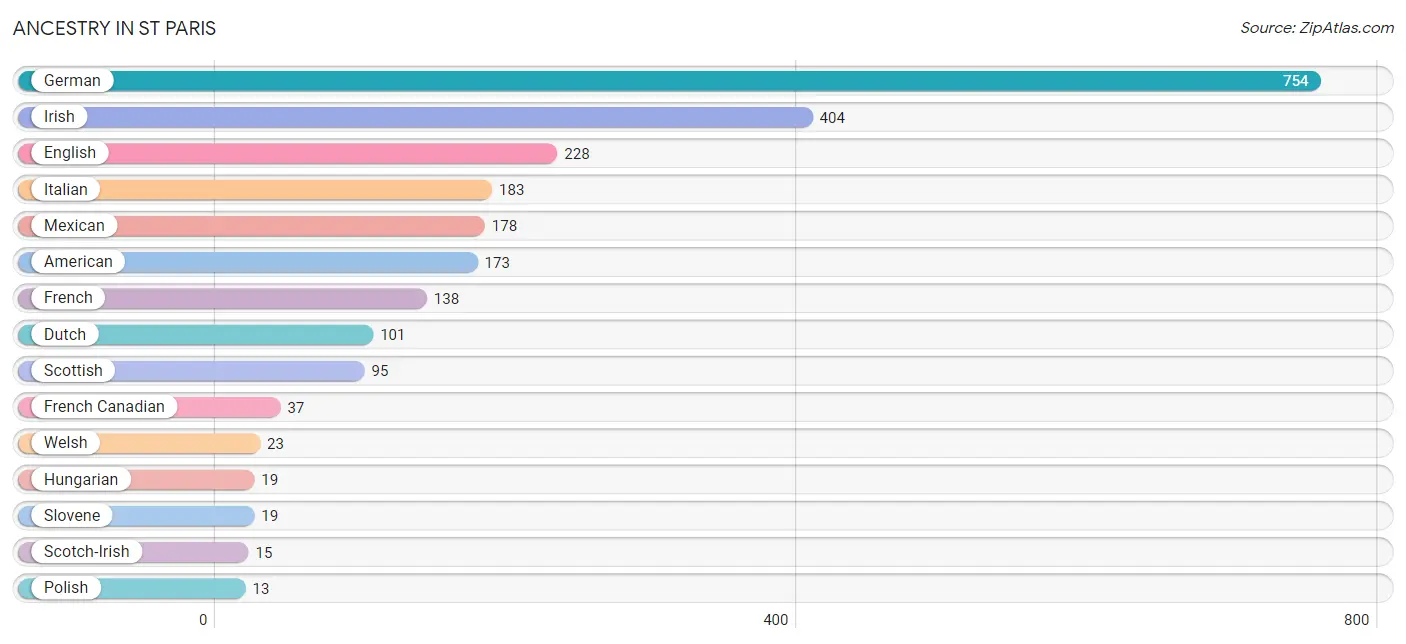
Ancestry in St Paris
The most populous ancestries reported in St Paris are German (754 | 35.3%), Irish (404 | 18.9%), English (228 | 10.7%), Italian (183 | 8.6%), and Mexican (178 | 8.3%), together accounting for 81.7% of all St Paris residents.
| Ancestry | # Population | % Population |
| American | 173 | 8.1% |
| Belgian | 5 | 0.2% |
| British | 4 | 0.2% |
| Dutch | 101 | 4.7% |
| English | 228 | 10.7% |
| European | 10 | 0.5% |
| French | 138 | 6.5% |
| French Canadian | 37 | 1.7% |
| German | 754 | 35.3% |
| Hungarian | 19 | 0.9% |
| Icelander | 2 | 0.1% |
| Indian (Asian) | 5 | 0.2% |
| Irish | 404 | 18.9% |
| Italian | 183 | 8.6% |
| Mexican | 178 | 8.3% |
| Northern European | 8 | 0.4% |
| Polish | 13 | 0.6% |
| Scotch-Irish | 15 | 0.7% |
| Scottish | 95 | 4.4% |
| Slovene | 19 | 0.9% |
| Welsh | 23 | 1.1% | View All 21 Rows |
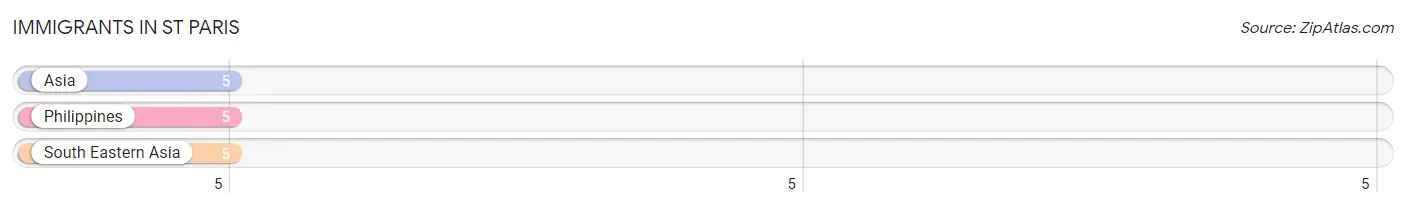
Immigrants in St Paris
The most numerous immigrant groups reported in St Paris came from Asia (5 | 0.2%), Philippines (5 | 0.2%), and South Eastern Asia (5 | 0.2%), together accounting for 0.7% of all St Paris residents.
| Immigration Origin | # Population | % Population |
| Asia | 5 | 0.2% |
| Philippines | 5 | 0.2% |
| South Eastern Asia | 5 | 0.2% | View All 3 Rows |
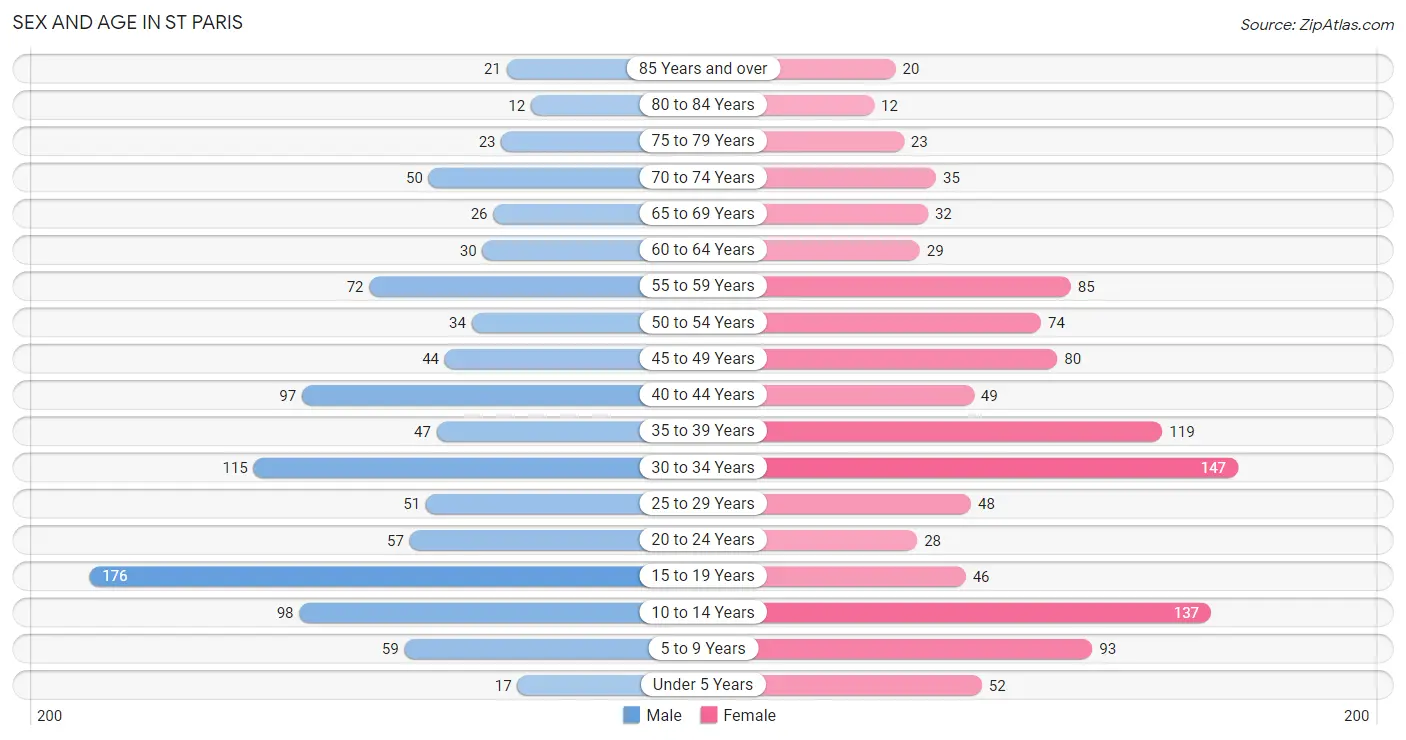
Sex and Age in St Paris
Sex and Age in St Paris
The most populous age groups in St Paris are 15 to 19 Years (176 | 17.1%) for men and 30 to 34 Years (147 | 13.3%) for women.
| Age Bracket | Male | Female |
| Under 5 Years | 17 (1.7%) | 52 (4.7%) |
| 5 to 9 Years | 59 (5.7%) | 93 (8.4%) |
| 10 to 14 Years | 98 (9.5%) | 137 (12.3%) |
| 15 to 19 Years | 176 (17.1%) | 46 (4.2%) |
| 20 to 24 Years | 57 (5.5%) | 28 (2.5%) |
| 25 to 29 Years | 51 (5.0%) | 48 (4.3%) |
| 30 to 34 Years | 115 (11.2%) | 147 (13.3%) |
| 35 to 39 Years | 47 (4.6%) | 119 (10.7%) |
| 40 to 44 Years | 97 (9.4%) | 49 (4.4%) |
| 45 to 49 Years | 44 (4.3%) | 80 (7.2%) |
| 50 to 54 Years | 34 (3.3%) | 74 (6.7%) |
| 55 to 59 Years | 72 (7.0%) | 85 (7.7%) |
| 60 to 64 Years | 30 (2.9%) | 29 (2.6%) |
| 65 to 69 Years | 26 (2.5%) | 32 (2.9%) |
| 70 to 74 Years | 50 (4.9%) | 35 (3.2%) |
| 75 to 79 Years | 23 (2.2%) | 23 (2.1%) |
| 80 to 84 Years | 12 (1.2%) | 12 (1.1%) |
| 85 Years and over | 21 (2.0%) | 20 (1.8%) |
| Total | 1,029 (100.0%) | 1,109 (100.0%) |
Families and Households in St Paris
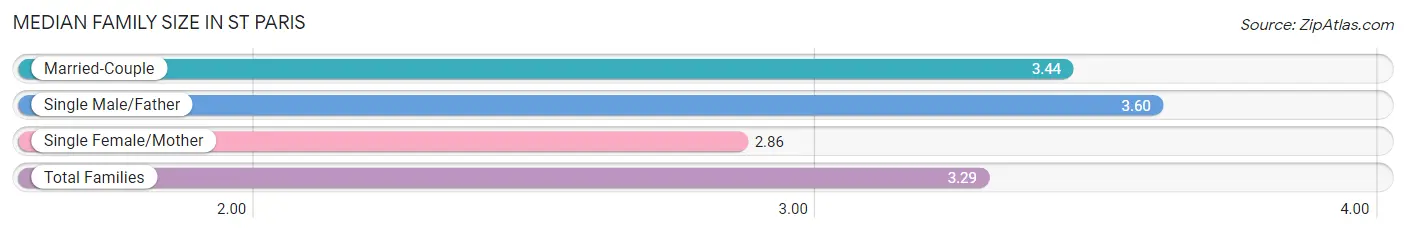
Median Family Size in St Paris
The median family size in St Paris is 3.29 persons per family, with single male/father families (15 | 2.6%) accounting for the largest median family size of 3.6 persons per family. On the other hand, single female/mother families (150 | 26.5%) represent the smallest median family size with 2.86 persons per family.
| Family Type | # Families | Family Size |
| Married-Couple | 402 (70.9%) | 3.44 |
| Single Male/Father | 15 (2.6%) | 3.60 |
| Single Female/Mother | 150 (26.5%) | 2.86 |
| Total Families | 567 (100.0%) | 3.29 |
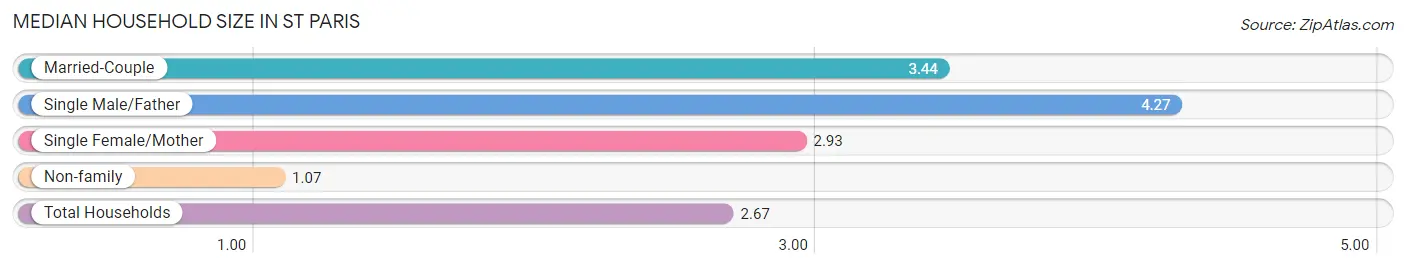
Median Household Size in St Paris
The median household size in St Paris is 2.67 persons per household, with single male/father households (15 | 1.9%) accounting for the largest median household size of 4.27 persons per household. non-family households (235 | 29.3%) represent the smallest median household size with 1.07 persons per household.
| Household Type | # Households | Household Size |
| Married-Couple | 402 (50.1%) | 3.44 |
| Single Male/Father | 15 (1.9%) | 4.27 |
| Single Female/Mother | 150 (18.7%) | 2.93 |
| Non-family | 235 (29.3%) | 1.07 |
| Total Households | 802 (100.0%) | 2.67 |
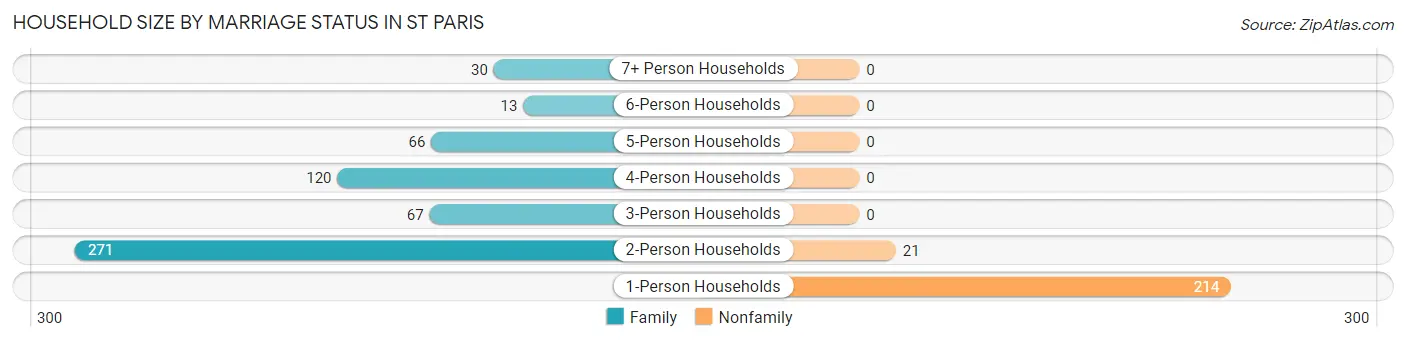
Household Size by Marriage Status in St Paris
Out of a total of 802 households in St Paris, 567 (70.7%) are family households, while 235 (29.3%) are nonfamily households. The most numerous type of family households are 2-person households, comprising 271, and the most common type of nonfamily households are 1-person households, comprising 214.
| Household Size | Family Households | Nonfamily Households |
| 1-Person Households | - | 214 (26.7%) |
| 2-Person Households | 271 (33.8%) | 21 (2.6%) |
| 3-Person Households | 67 (8.4%) | 0 (0.0%) |
| 4-Person Households | 120 (15.0%) | 0 (0.0%) |
| 5-Person Households | 66 (8.2%) | 0 (0.0%) |
| 6-Person Households | 13 (1.6%) | 0 (0.0%) |
| 7+ Person Households | 30 (3.7%) | 0 (0.0%) |
| Total | 567 (70.7%) | 235 (29.3%) |
Female Fertility in St Paris
Fertility by Age in St Paris
Average fertility rate in St Paris is 82.0 births per 1,000 women. Women in the age bracket of 20 to 34 years have the highest fertility rate with 161.0 births per 1,000 women. Women in the age bracket of 20 to 34 years acount for 80.0% of all women with births.
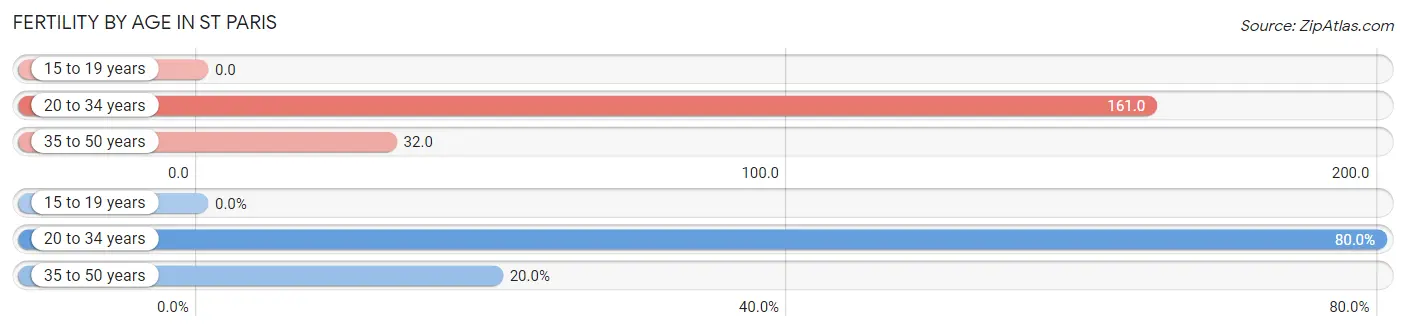
| Age Bracket | Women with Births | Births / 1,000 Women |
| 15 to 19 years | 0 (0.0%) | 0.0 |
| 20 to 34 years | 36 (80.0%) | 161.0 |
| 35 to 50 years | 9 (20.0%) | 32.0 |
| Total | 45 (100.0%) | 82.0 |
Fertility by Age by Marriage Status in St Paris
44.4% of women with births (45) in St Paris are married. The highest percentage of unmarried women with births falls into 20 to 34 years age bracket with 69.4% of them unmarried at the time of birth, while the lowest percentage of unmarried women with births belong to 35 to 50 years age bracket with 0.0% of them unmarried.
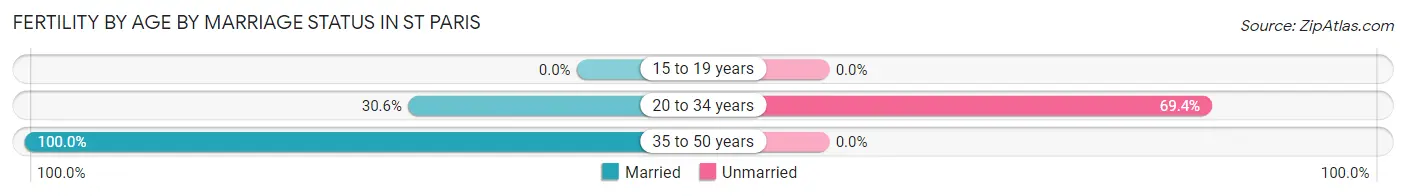
| Age Bracket | Married | Unmarried |
| 15 to 19 years | 0 (0.0%) | 0 (0.0%) |
| 20 to 34 years | 11 (30.6%) | 25 (69.4%) |
| 35 to 50 years | 9 (100.0%) | 0 (0.0%) |
| Total | 20 (44.4%) | 25 (55.6%) |
Fertility by Education in St Paris
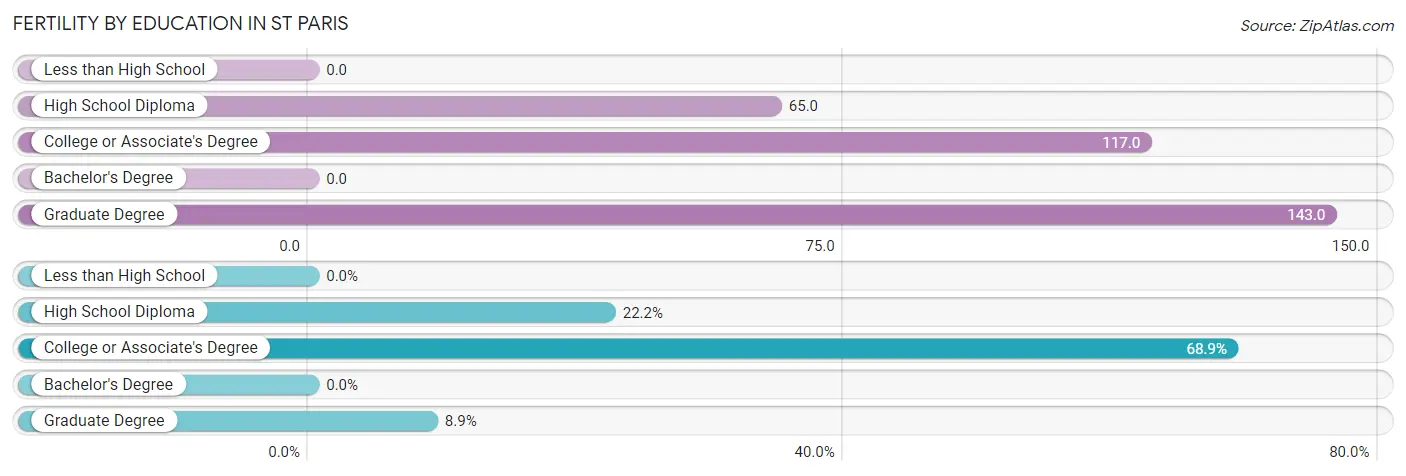
| Educational Attainment | Women with Births | Births / 1,000 Women |
| Less than High School | 0 (0.0%) | 0.0 |
| High School Diploma | 10 (22.2%) | 65.0 |
| College or Associate's Degree | 31 (68.9%) | 117.0 |
| Bachelor's Degree | 0 (0.0%) | 0.0 |
| Graduate Degree | 4 (8.9%) | 143.0 |
| Total | 45 (100.0%) | 82.0 |
Fertility by Education by Marriage Status in St Paris
55.6% of women with births in St Paris are unmarried. Women with the educational attainment of graduate degree are most likely to be married with 100.0% of them married at childbirth, while women with the educational attainment of high school diploma are least likely to be married with 100.0% of them unmarried at childbirth.
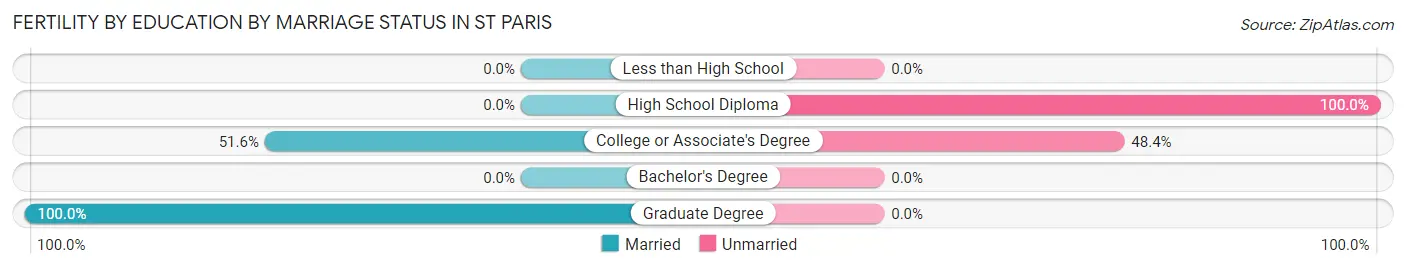
| Educational Attainment | Married | Unmarried |
| Less than High School | 0 (0.0%) | 0 (0.0%) |
| High School Diploma | 0 (0.0%) | 10 (100.0%) |
| College or Associate's Degree | 16 (51.6%) | 15 (48.4%) |
| Bachelor's Degree | 0 (0.0%) | 0 (0.0%) |
| Graduate Degree | 4 (100.0%) | 0 (0.0%) |
| Total | 20 (44.4%) | 25 (55.6%) |
Income in St Paris
Income Overview in St Paris
Per Capita Income in St Paris is $28,109, while median incomes of families and households are $83,563 and $62,500 respectively.
| Characteristic | Number | Measure |
| Per Capita Income | 2,138 | $28,109 |
| Median Family Income | 567 | $83,563 |
| Mean Family Income | 567 | $83,350 |
| Median Household Income | 802 | $62,500 |
| Mean Household Income | 802 | $71,627 |
| Income Deficit | 567 | $0 |
| Wage / Income Gap (%) | 2,138 | 38.41% |
| Wage / Income Gap ($) | 2,138 | 61.59¢ per $1 |
| Gini / Inequality Index | 2,138 | 0.33 |
Earnings by Sex in St Paris
Average Earnings in St Paris are $39,483, $51,250 for men and $31,567 for women, a difference of 38.4%.
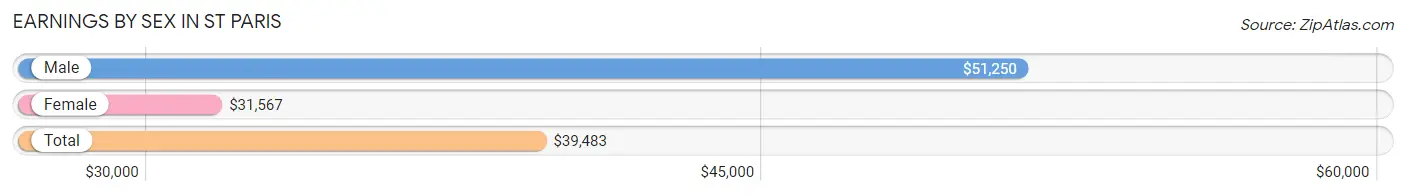
| Sex | Number | Average Earnings |
| Male | 583 (51.0%) | $51,250 |
| Female | 559 (48.9%) | $31,567 |
| Total | 1,142 (100.0%) | $39,483 |
Earnings by Sex by Income Bracket in St Paris
The most common earnings brackets in St Paris are $65,000 to $74,999 for men (92 | 15.8%) and $15,000 to $17,499 for women (84 | 15.0%).
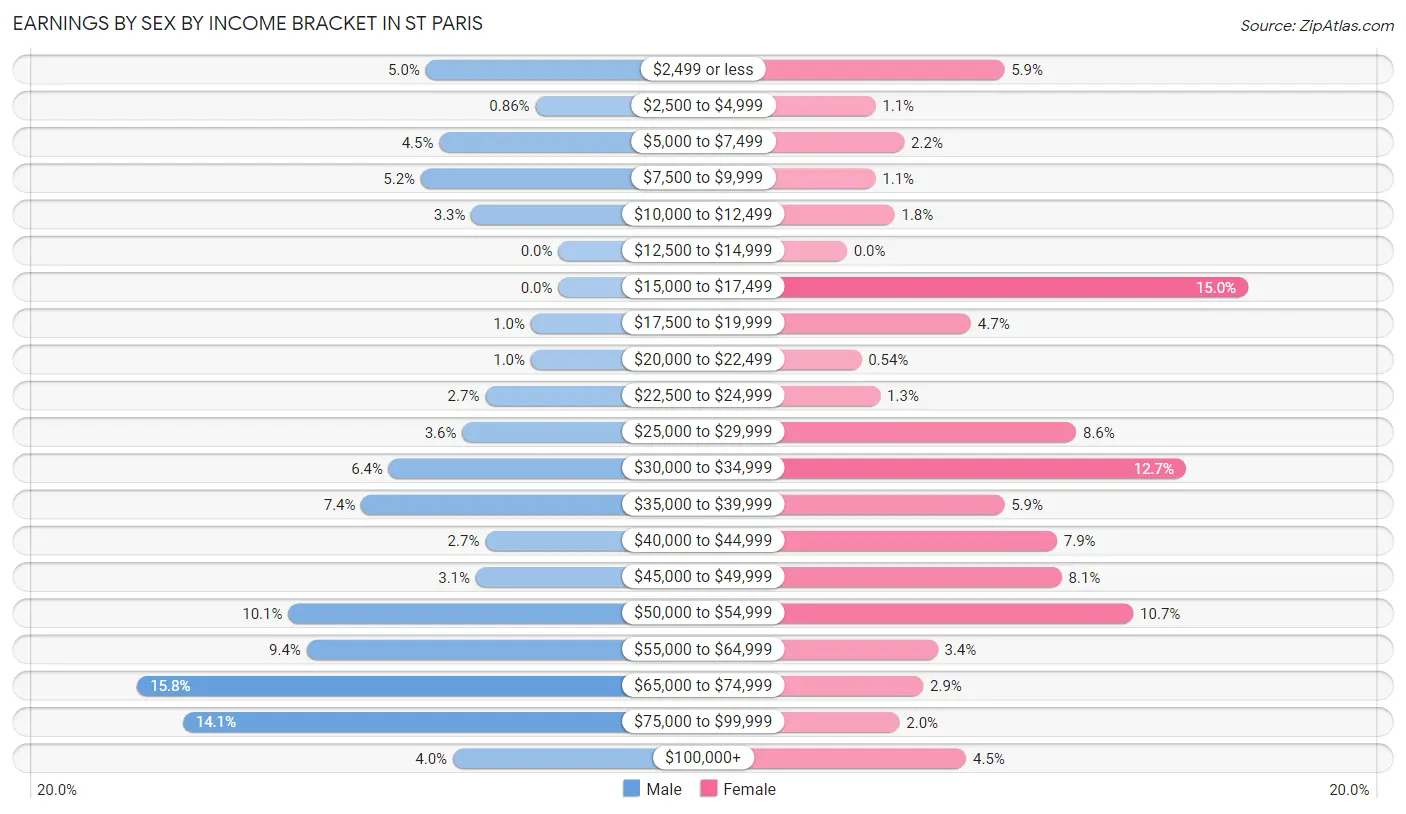
| Income | Male | Female |
| $2,499 or less | 29 (5.0%) | 33 (5.9%) |
| $2,500 to $4,999 | 5 (0.9%) | 6 (1.1%) |
| $5,000 to $7,499 | 26 (4.5%) | 12 (2.1%) |
| $7,500 to $9,999 | 30 (5.1%) | 6 (1.1%) |
| $10,000 to $12,499 | 19 (3.3%) | 10 (1.8%) |
| $12,500 to $14,999 | 0 (0.0%) | 0 (0.0%) |
| $15,000 to $17,499 | 0 (0.0%) | 84 (15.0%) |
| $17,500 to $19,999 | 6 (1.0%) | 26 (4.6%) |
| $20,000 to $22,499 | 6 (1.0%) | 3 (0.5%) |
| $22,500 to $24,999 | 16 (2.7%) | 7 (1.3%) |
| $25,000 to $29,999 | 21 (3.6%) | 48 (8.6%) |
| $30,000 to $34,999 | 37 (6.4%) | 71 (12.7%) |
| $35,000 to $39,999 | 43 (7.4%) | 33 (5.9%) |
| $40,000 to $44,999 | 16 (2.7%) | 44 (7.9%) |
| $45,000 to $49,999 | 18 (3.1%) | 45 (8.1%) |
| $50,000 to $54,999 | 59 (10.1%) | 60 (10.7%) |
| $55,000 to $64,999 | 55 (9.4%) | 19 (3.4%) |
| $65,000 to $74,999 | 92 (15.8%) | 16 (2.9%) |
| $75,000 to $99,999 | 82 (14.1%) | 11 (2.0%) |
| $100,000+ | 23 (4.0%) | 25 (4.5%) |
| Total | 583 (100.0%) | 559 (100.0%) |
Earnings by Sex by Educational Attainment in St Paris
Average earnings in St Paris are $57,688 for men and $32,165 for women, a difference of 44.2%. Men with an educational attainment of bachelor's degree enjoy the highest average annual earnings of $90,489, while those with high school diploma education earn the least with $50,163. Women with an educational attainment of college or associate's degree earn the most with the average annual earnings of $45,064, while those with less than high school education have the smallest earnings of $18,750.
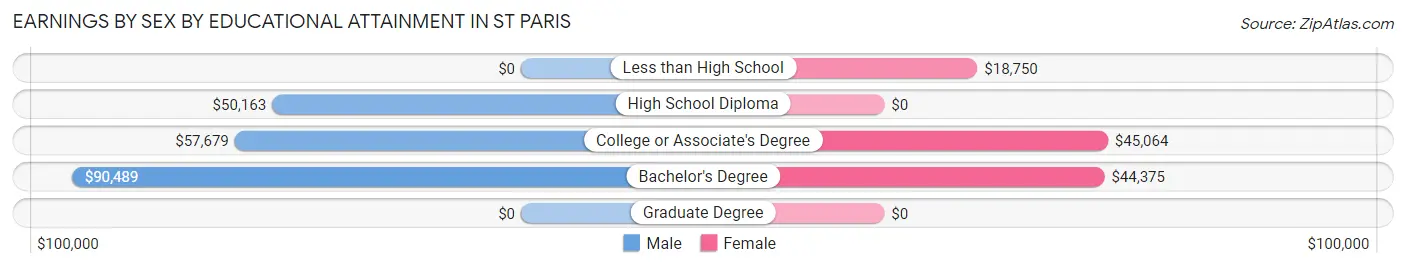
| Educational Attainment | Male Income | Female Income |
| Less than High School | - | - |
| High School Diploma | $50,163 | $0 |
| College or Associate's Degree | $57,679 | $45,064 |
| Bachelor's Degree | $90,489 | $44,375 |
| Graduate Degree | - | - |
| Total | $57,688 | $32,165 |
Family Income in St Paris
Family Income Brackets in St Paris
According to the St Paris family income data, there are 186 families falling into the $75,000 to $99,999 income range, which is the most common income bracket and makes up 32.8% of all families. Conversely, the $10,000 to $14,999 income bracket is the least frequent group with only 5 families (0.9%) belonging to this category.
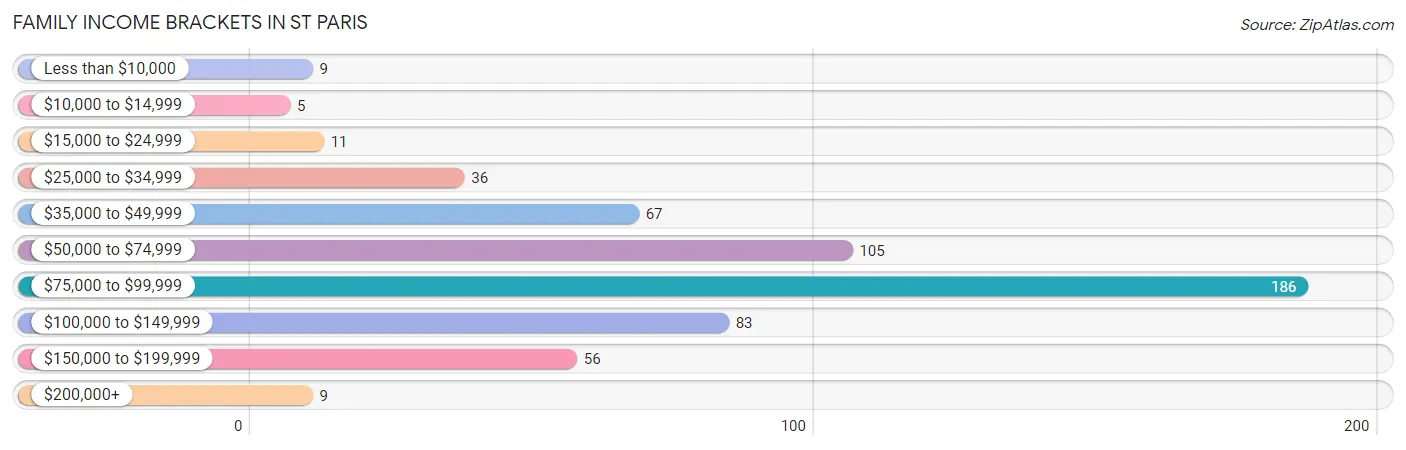
| Income Bracket | # Families | % Families |
| Less than $10,000 | 9 | 1.6% |
| $10,000 to $14,999 | 5 | 0.9% |
| $15,000 to $24,999 | 11 | 1.9% |
| $25,000 to $34,999 | 36 | 6.3% |
| $35,000 to $49,999 | 67 | 11.8% |
| $50,000 to $74,999 | 105 | 18.5% |
| $75,000 to $99,999 | 186 | 32.8% |
| $100,000 to $149,999 | 83 | 14.6% |
| $150,000 to $199,999 | 56 | 9.9% |
| $200,000+ | 9 | 1.6% |
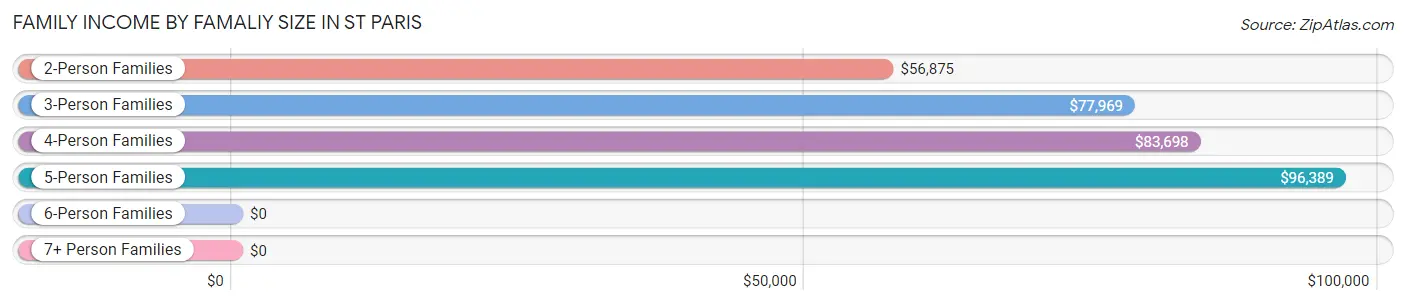
Family Income by Famaliy Size in St Paris
5-person families (74 | 13.1%) account for the highest median family income in St Paris with $96,389 per family, while 2-person families (271 | 47.8%) have the highest median income of $28,438 per family member.
| Income Bracket | # Families | Median Income |
| 2-Person Families | 271 (47.8%) | $56,875 |
| 3-Person Families | 67 (11.8%) | $77,969 |
| 4-Person Families | 125 (22.1%) | $83,698 |
| 5-Person Families | 74 (13.1%) | $96,389 |
| 6-Person Families | 0 (0.0%) | $0 |
| 7+ Person Families | 30 (5.3%) | $0 |
| Total | 567 (100.0%) | $83,563 |
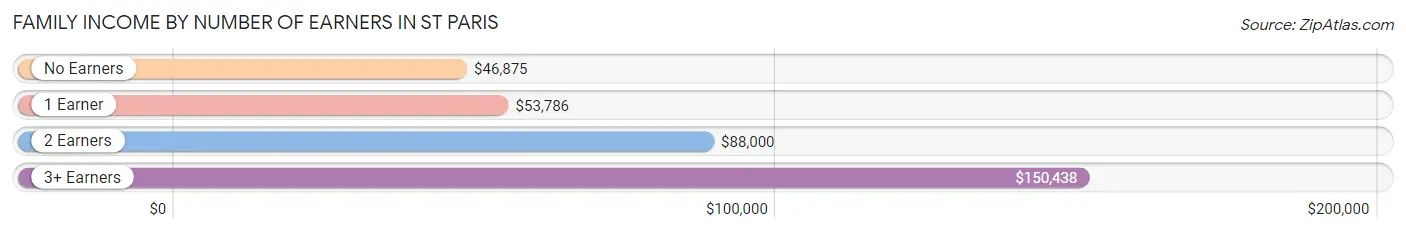
Family Income by Number of Earners in St Paris
The median family income in St Paris is $83,563, with families comprising 3+ earners (43) having the highest median family income of $150,438, while families with no earners (66) have the lowest median family income of $46,875, accounting for 7.6% and 11.6% of families, respectively.
| Number of Earners | # Families | Median Income |
| No Earners | 66 (11.6%) | $46,875 |
| 1 Earner | 172 (30.3%) | $53,786 |
| 2 Earners | 286 (50.4%) | $88,000 |
| 3+ Earners | 43 (7.6%) | $150,438 |
| Total | 567 (100.0%) | $83,563 |
Household Income in St Paris
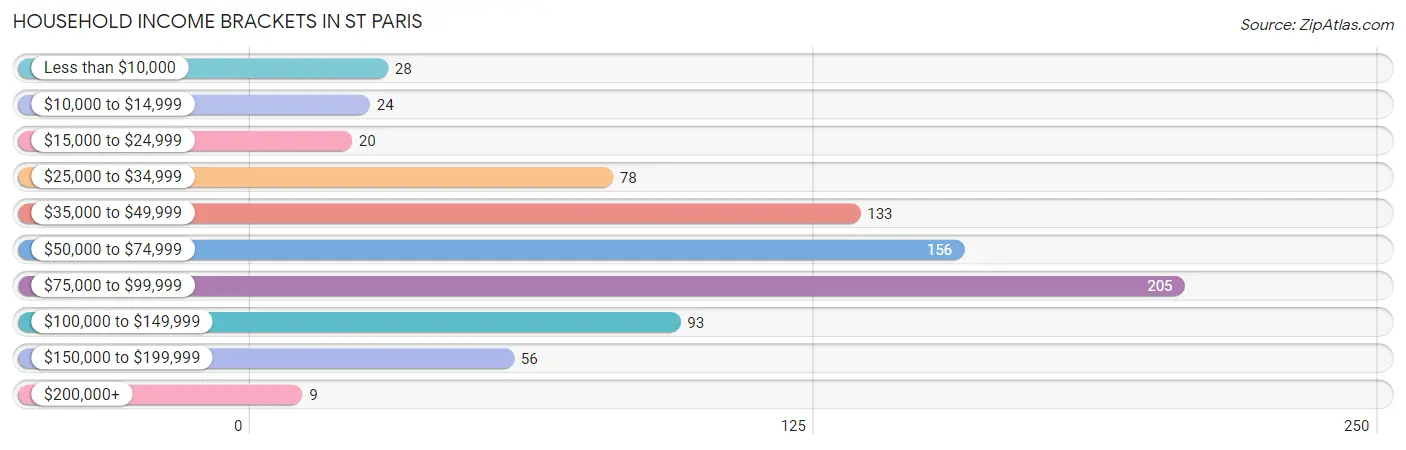
Household Income Brackets in St Paris
With 205 households falling in the category, the $75,000 to $99,999 income range is the most frequent in St Paris, accounting for 25.6% of all households. In contrast, only 9 households (1.1%) fall into the $200,000+ income bracket, making it the least populous group.
| Income Bracket | # Households | % Households |
| Less than $10,000 | 28 | 3.5% |
| $10,000 to $14,999 | 24 | 3.0% |
| $15,000 to $24,999 | 20 | 2.5% |
| $25,000 to $34,999 | 78 | 9.7% |
| $35,000 to $49,999 | 133 | 16.6% |
| $50,000 to $74,999 | 156 | 19.5% |
| $75,000 to $99,999 | 205 | 25.6% |
| $100,000 to $149,999 | 93 | 11.6% |
| $150,000 to $199,999 | 56 | 7.0% |
| $200,000+ | 9 | 1.1% |
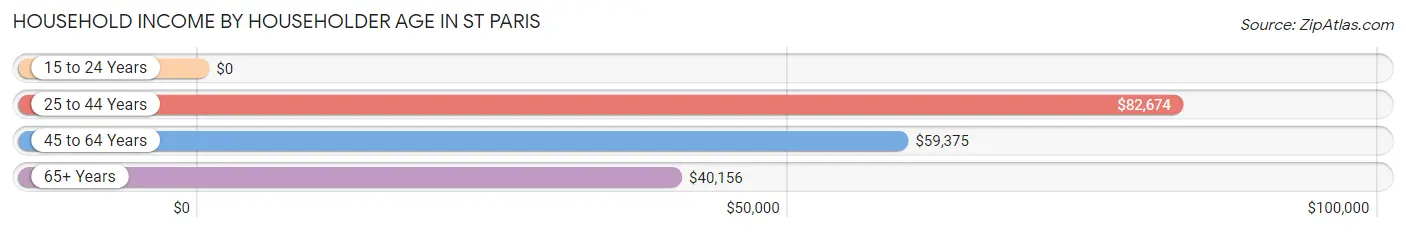
Household Income by Householder Age in St Paris
The median household income in St Paris is $62,500, with the highest median household income of $82,674 found in the 25 to 44 years age bracket for the primary householder. A total of 334 households (41.6%) fall into this category.
| Income Bracket | # Households | Median Income |
| 15 to 24 Years | 0 (0.0%) | $0 |
| 25 to 44 Years | 334 (41.6%) | $82,674 |
| 45 to 64 Years | 299 (37.3%) | $59,375 |
| 65+ Years | 169 (21.1%) | $40,156 |
| Total | 802 (100.0%) | $62,500 |
Poverty in St Paris
Income Below Poverty by Sex and Age in St Paris
With 4.3% poverty level for males and 6.9% for females among the residents of St Paris, 75 year old and over males and 16 and 17 year old females are the most vulnerable to poverty, with 17 males (30.4%) and 6 females (31.6%) in their respective age groups living below the poverty level.
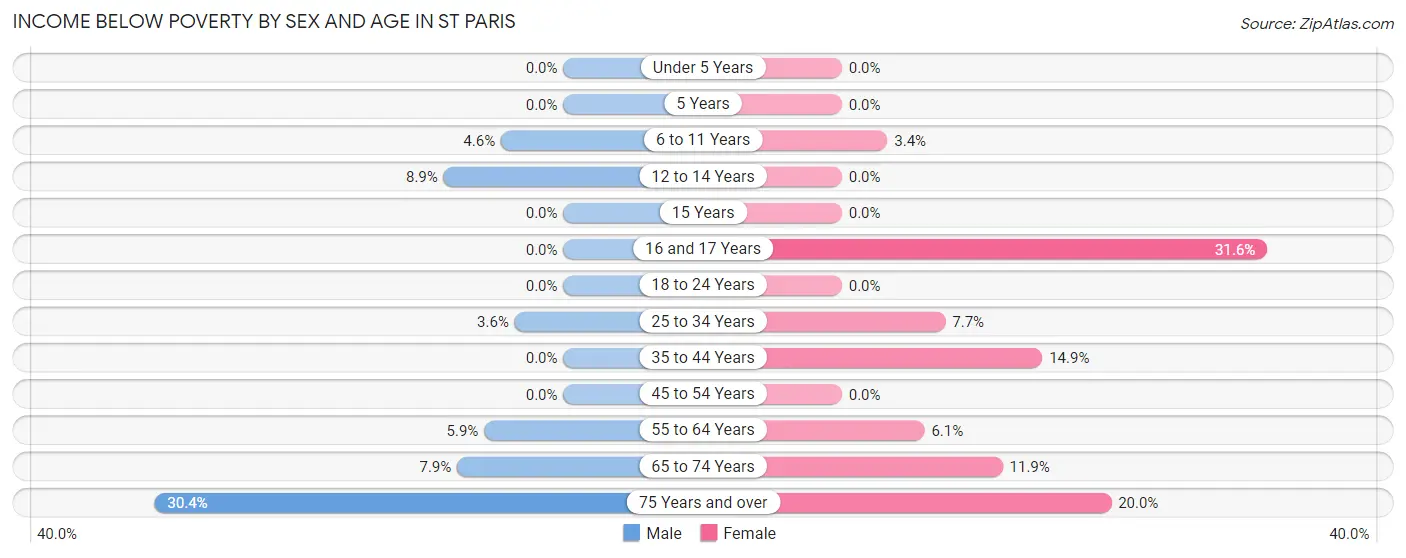
| Age Bracket | Male | Female |
| Under 5 Years | 0 (0.0%) | 0 (0.0%) |
| 5 Years | 0 (0.0%) | 0 (0.0%) |
| 6 to 11 Years | 5 (4.6%) | 5 (3.4%) |
| 12 to 14 Years | 4 (8.9%) | 0 (0.0%) |
| 15 Years | 0 (0.0%) | 0 (0.0%) |
| 16 and 17 Years | 0 (0.0%) | 6 (31.6%) |
| 18 to 24 Years | 0 (0.0%) | 0 (0.0%) |
| 25 to 34 Years | 6 (3.6%) | 15 (7.7%) |
| 35 to 44 Years | 0 (0.0%) | 25 (14.9%) |
| 45 to 54 Years | 0 (0.0%) | 0 (0.0%) |
| 55 to 64 Years | 6 (5.9%) | 7 (6.1%) |
| 65 to 74 Years | 6 (7.9%) | 8 (11.9%) |
| 75 Years and over | 17 (30.4%) | 11 (20.0%) |
| Total | 44 (4.3%) | 77 (6.9%) |
Income Above Poverty by Sex and Age in St Paris
According to the poverty statistics in St Paris, males aged under 5 years and females aged under 5 years are the age groups that are most secure financially, with 100.0% of males and 100.0% of females in these age groups living above the poverty line.
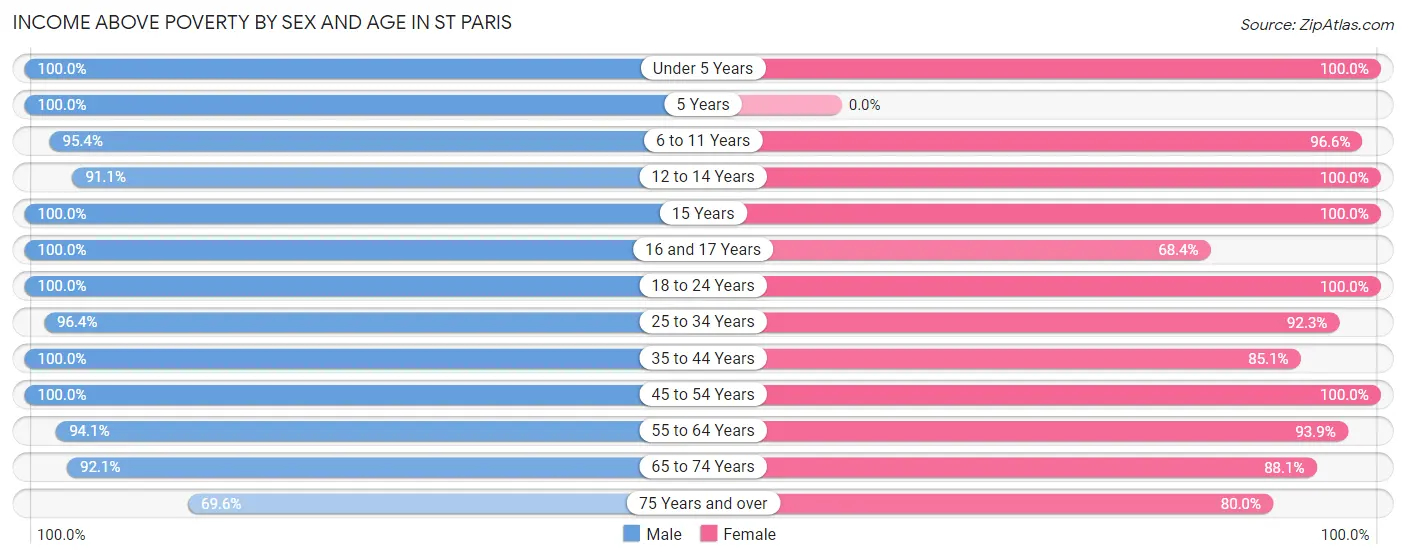
| Age Bracket | Male | Female |
| Under 5 Years | 17 (100.0%) | 52 (100.0%) |
| 5 Years | 4 (100.0%) | 0 (0.0%) |
| 6 to 11 Years | 103 (95.4%) | 143 (96.6%) |
| 12 to 14 Years | 41 (91.1%) | 82 (100.0%) |
| 15 Years | 23 (100.0%) | 13 (100.0%) |
| 16 and 17 Years | 107 (100.0%) | 13 (68.4%) |
| 18 to 24 Years | 103 (100.0%) | 42 (100.0%) |
| 25 to 34 Years | 160 (96.4%) | 180 (92.3%) |
| 35 to 44 Years | 144 (100.0%) | 143 (85.1%) |
| 45 to 54 Years | 78 (100.0%) | 154 (100.0%) |
| 55 to 64 Years | 96 (94.1%) | 107 (93.9%) |
| 65 to 74 Years | 70 (92.1%) | 59 (88.1%) |
| 75 Years and over | 39 (69.6%) | 44 (80.0%) |
| Total | 985 (95.7%) | 1,032 (93.1%) |
Income Below Poverty Among Married-Couple Families in St Paris
The poverty statistics for married-couple families in St Paris show that 3.5% or 14 of the total 402 families live below the poverty line. Families with no children have the highest poverty rate of 6.7%, comprising of 14 families. On the other hand, families with 1 or 2 children have the lowest poverty rate of 0.0%, which includes 0 families.
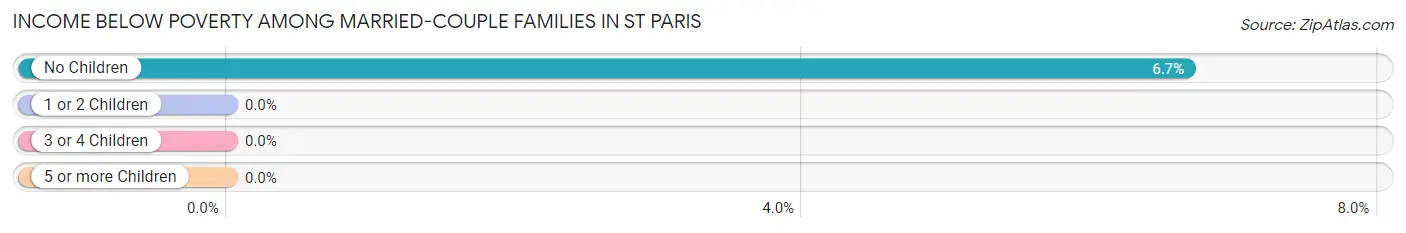
| Children | Above Poverty | Below Poverty |
| No Children | 196 (93.3%) | 14 (6.7%) |
| 1 or 2 Children | 134 (100.0%) | 0 (0.0%) |
| 3 or 4 Children | 35 (100.0%) | 0 (0.0%) |
| 5 or more Children | 23 (100.0%) | 0 (0.0%) |
| Total | 388 (96.5%) | 14 (3.5%) |
Income Below Poverty Among Single-Parent Households in St Paris
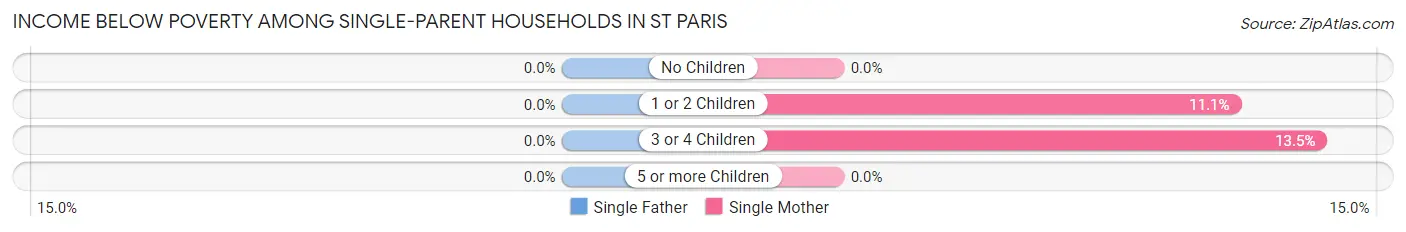
| Children | Single Father | Single Mother |
| No Children | 0 (0.0%) | 0 (0.0%) |
| 1 or 2 Children | 0 (0.0%) | 6 (11.1%) |
| 3 or 4 Children | 0 (0.0%) | 5 (13.5%) |
| 5 or more Children | 0 (0.0%) | 0 (0.0%) |
| Total | 0 (0.0%) | 11 (7.3%) |
Income Below Poverty Among Married-Couple vs Single-Parent Households in St Paris
The poverty data for St Paris shows that 14 of the married-couple family households (3.5%) and 11 of the single-parent households (6.7%) are living below the poverty level. Within the married-couple family households, those with no children have the highest poverty rate, with 14 households (6.7%) falling below the poverty line. Among the single-parent households, those with 3 or 4 children have the highest poverty rate, with 5 household (11.1%) living below poverty.
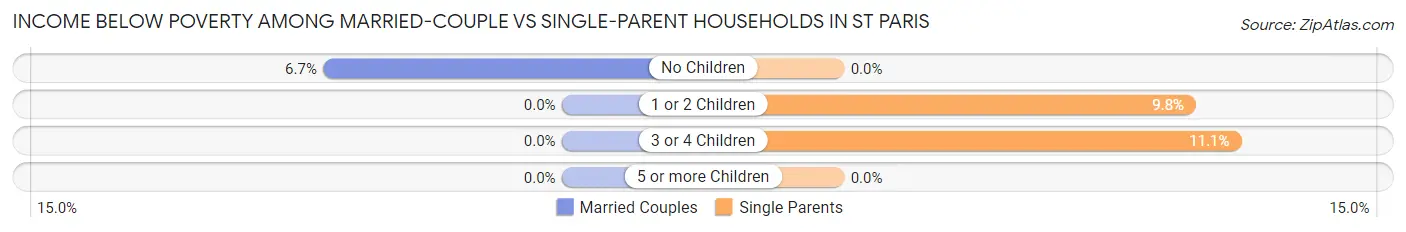
| Children | Married-Couple Families | Single-Parent Households |
| No Children | 14 (6.7%) | 0 (0.0%) |
| 1 or 2 Children | 0 (0.0%) | 6 (9.8%) |
| 3 or 4 Children | 0 (0.0%) | 5 (11.1%) |
| 5 or more Children | 0 (0.0%) | 0 (0.0%) |
| Total | 14 (3.5%) | 11 (6.7%) |
Employment Characteristics in St Paris
Employment by Class of Employer in St Paris
Among the 1,009 employed individuals in St Paris, private company employees (706 | 70.0%), local government employees (139 | 13.8%), and not-for-profit organizations (73 | 7.2%) make up the most common classes of employment.
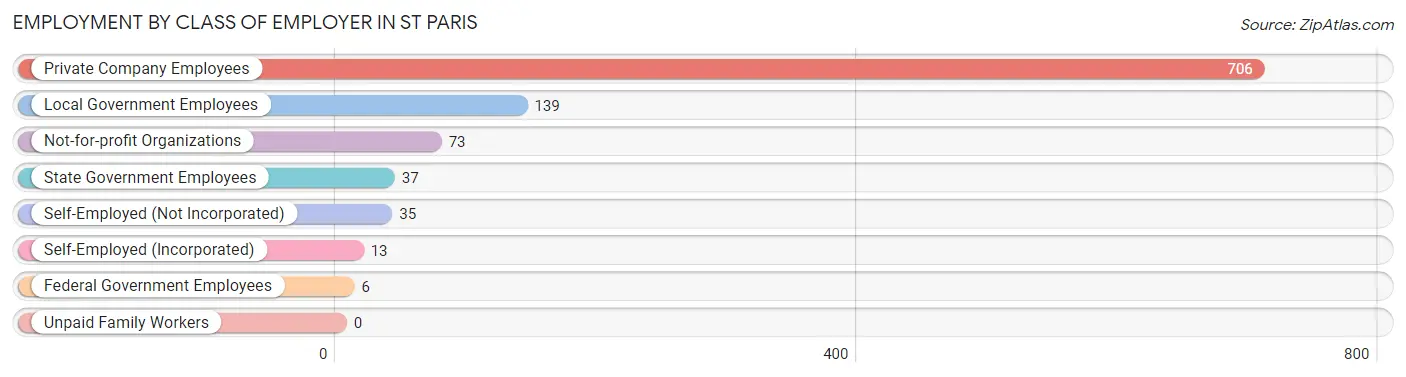
| Employer Class | # Employees | % Employees |
| Private Company Employees | 706 | 70.0% |
| Self-Employed (Incorporated) | 13 | 1.3% |
| Self-Employed (Not Incorporated) | 35 | 3.5% |
| Not-for-profit Organizations | 73 | 7.2% |
| Local Government Employees | 139 | 13.8% |
| State Government Employees | 37 | 3.7% |
| Federal Government Employees | 6 | 0.6% |
| Unpaid Family Workers | 0 | 0.0% |
| Total | 1,009 | 100.0% |
Employment Status by Age in St Paris
According to the labor force statistics for St Paris, out of the total population over 16 years of age (1,646), 64.8% or 1,067 individuals are in the labor force, with 4.6% or 49 of them unemployed. The age group with the highest labor force participation rate is 25 to 29 years, with 100.0% or 99 individuals in the labor force. Within the labor force, the 20 to 24 years age range has the highest percentage of unemployed individuals, with 32.9% or 23 of them being unemployed.
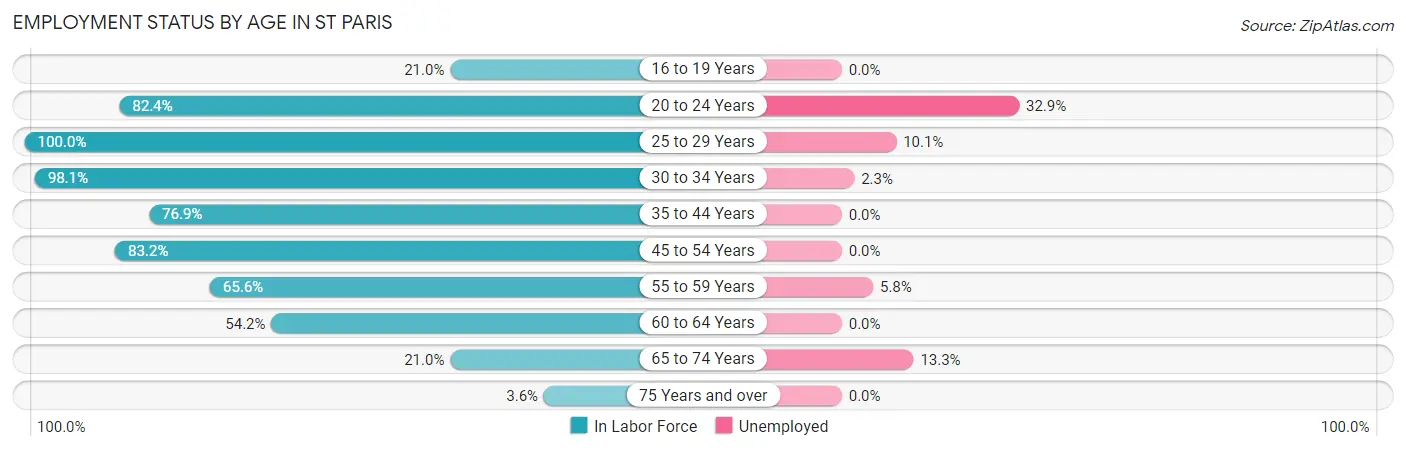
| Age Bracket | In Labor Force | Unemployed |
| 16 to 19 Years | 39 (21.0%) | 0 (0.0%) |
| 20 to 24 Years | 70 (82.4%) | 23 (32.9%) |
| 25 to 29 Years | 99 (100.0%) | 10 (10.1%) |
| 30 to 34 Years | 257 (98.1%) | 6 (2.3%) |
| 35 to 44 Years | 240 (76.9%) | 0 (0.0%) |
| 45 to 54 Years | 193 (83.2%) | 0 (0.0%) |
| 55 to 59 Years | 103 (65.6%) | 6 (5.8%) |
| 60 to 64 Years | 32 (54.2%) | 0 (0.0%) |
| 65 to 74 Years | 30 (21.0%) | 4 (13.3%) |
| 75 Years and over | 4 (3.6%) | 0 (0.0%) |
| Total | 1,067 (64.8%) | 49 (4.6%) |
Employment Status by Educational Attainment in St Paris
According to labor force statistics for St Paris, 82.4% of individuals (924) out of the total population between 25 and 64 years of age (1,121) are in the labor force, with 2.4% or 22 of them being unemployed. The group with the highest labor force participation rate are those with the educational attainment of bachelor's degree or higher, with 85.0% or 125 individuals in the labor force. Within the labor force, individuals with high school diploma education have the highest percentage of unemployment, with 4.5% or 16 of them being unemployed.
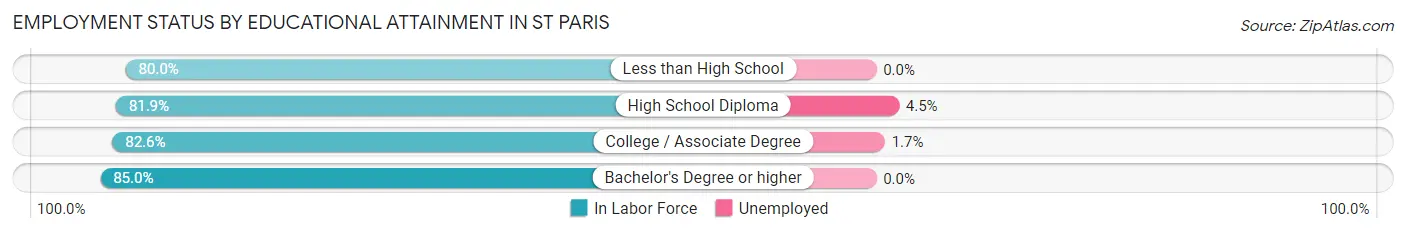
| Educational Attainment | In Labor Force | Unemployed |
| Less than High School | 84 (80.0%) | 0 (0.0%) |
| High School Diploma | 353 (81.9%) | 19 (4.5%) |
| College / Associate Degree | 362 (82.6%) | 7 (1.7%) |
| Bachelor's Degree or higher | 125 (85.0%) | 0 (0.0%) |
| Total | 924 (82.4%) | 27 (2.4%) |
Employment Occupations by Sex in St Paris
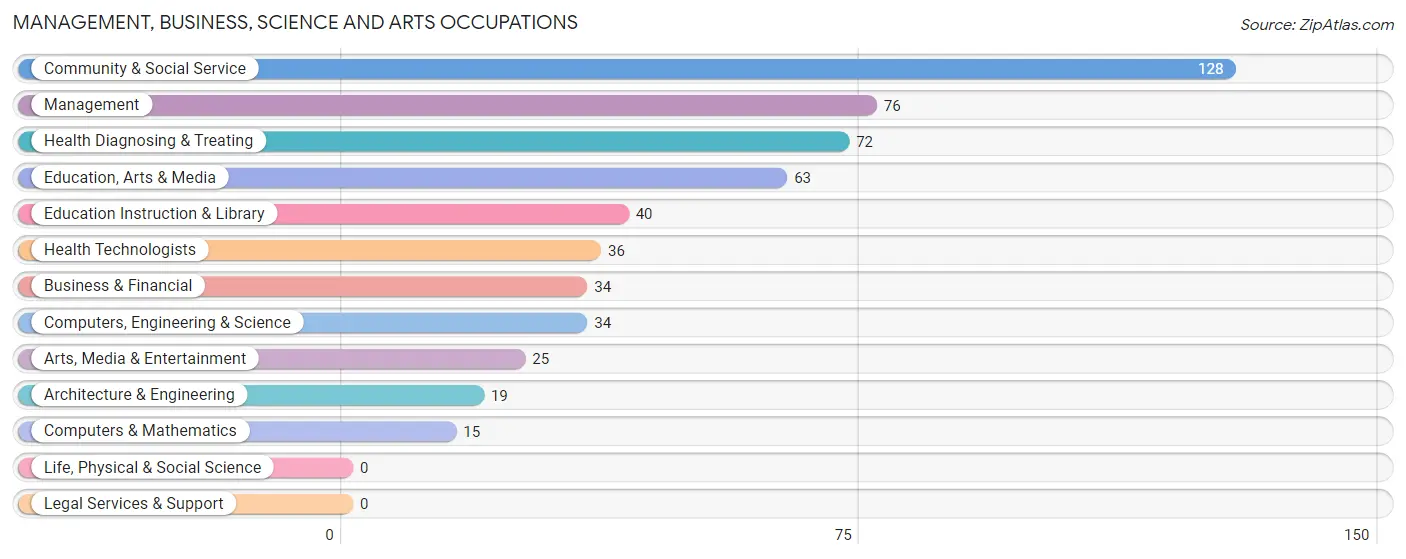
Management, Business, Science and Arts Occupations
The most common Management, Business, Science and Arts occupations in St Paris are Community & Social Service (128 | 12.6%), Management (76 | 7.5%), Health Diagnosing & Treating (72 | 7.1%), Education, Arts & Media (63 | 6.2%), and Education Instruction & Library (40 | 3.9%).
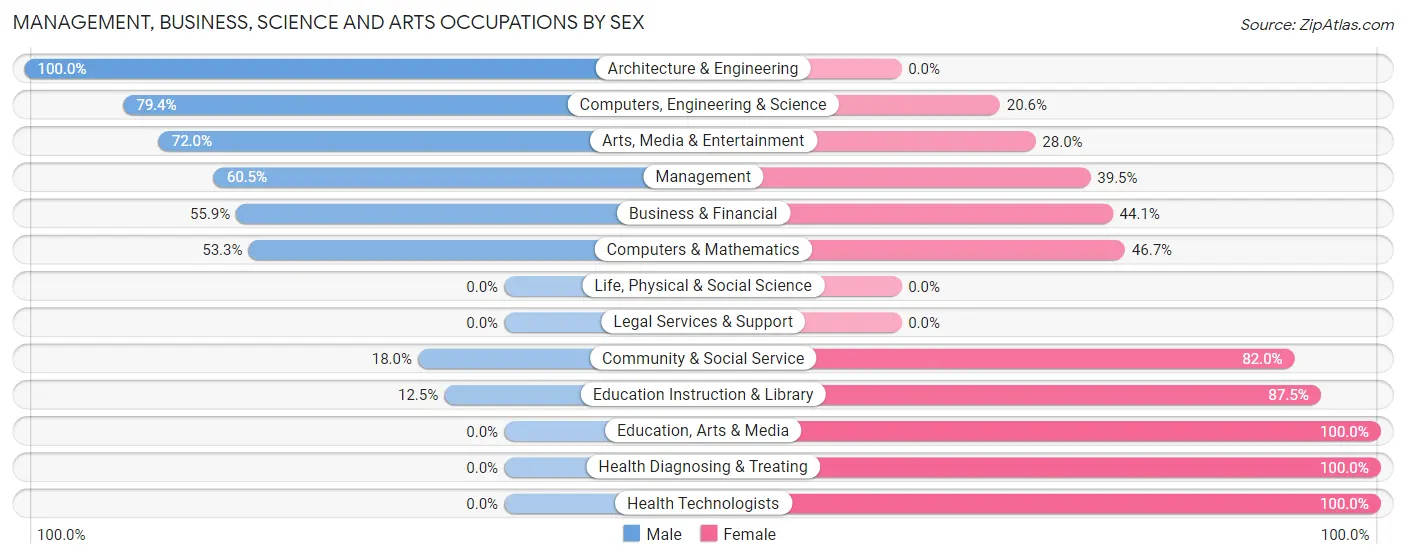
Management, Business, Science and Arts Occupations by Sex
Within the Management, Business, Science and Arts occupations in St Paris, the most male-oriented occupations are Architecture & Engineering (100.0%), Computers, Engineering & Science (79.4%), and Arts, Media & Entertainment (72.0%), while the most female-oriented occupations are Education, Arts & Media (100.0%), Health Diagnosing & Treating (100.0%), and Health Technologists (100.0%).
| Occupation | Male | Female |
| Management | 46 (60.5%) | 30 (39.5%) |
| Business & Financial | 19 (55.9%) | 15 (44.1%) |
| Computers, Engineering & Science | 27 (79.4%) | 7 (20.6%) |
| Computers & Mathematics | 8 (53.3%) | 7 (46.7%) |
| Architecture & Engineering | 19 (100.0%) | 0 (0.0%) |
| Life, Physical & Social Science | 0 (0.0%) | 0 (0.0%) |
| Community & Social Service | 23 (18.0%) | 105 (82.0%) |
| Education, Arts & Media | 0 (0.0%) | 63 (100.0%) |
| Legal Services & Support | 0 (0.0%) | 0 (0.0%) |
| Education Instruction & Library | 5 (12.5%) | 35 (87.5%) |
| Arts, Media & Entertainment | 18 (72.0%) | 7 (28.0%) |
| Health Diagnosing & Treating | 0 (0.0%) | 72 (100.0%) |
| Health Technologists | 0 (0.0%) | 36 (100.0%) |
| Total (Category) | 115 (33.4%) | 229 (66.6%) |
| Total (Overall) | 510 (50.1%) | 508 (49.9%) |
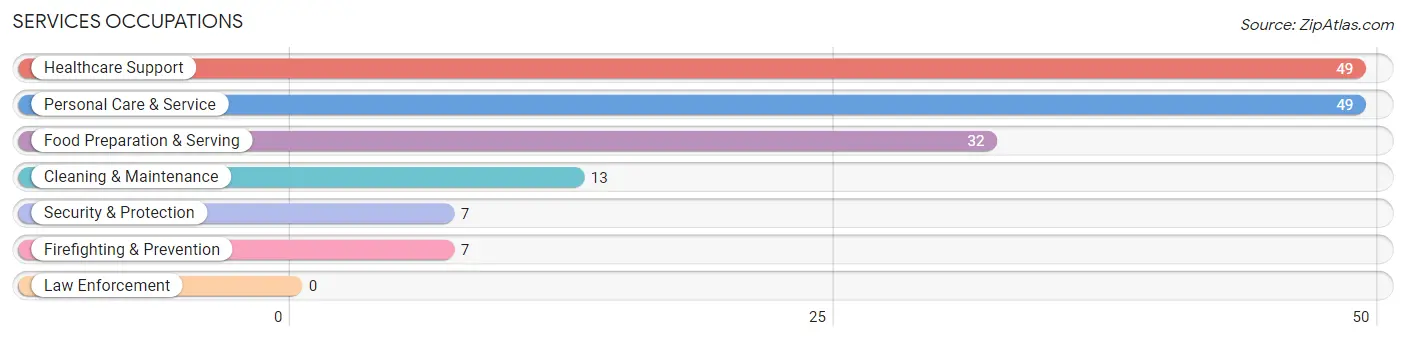
Services Occupations
The most common Services occupations in St Paris are Healthcare Support (49 | 4.8%), Personal Care & Service (49 | 4.8%), Food Preparation & Serving (32 | 3.1%), Cleaning & Maintenance (13 | 1.3%), and Security & Protection (7 | 0.7%).
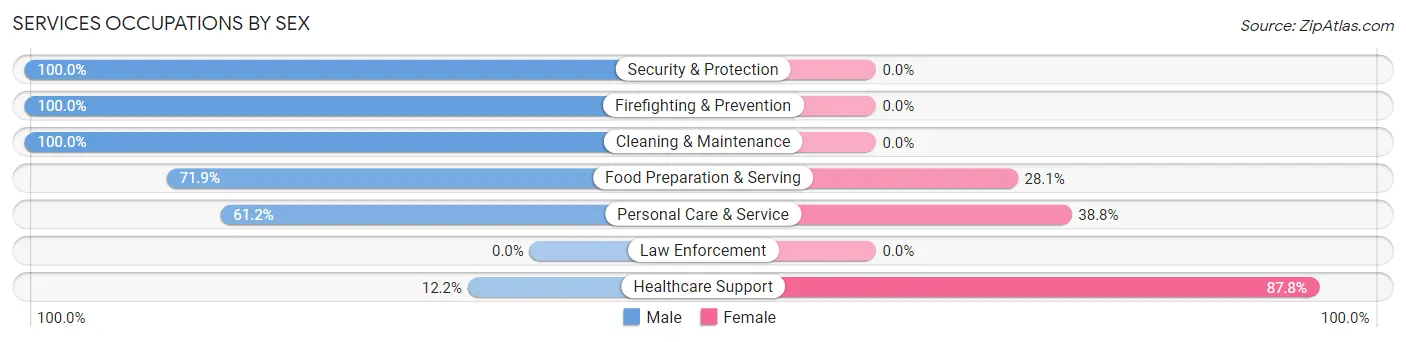
Services Occupations by Sex
Within the Services occupations in St Paris, the most male-oriented occupations are Security & Protection (100.0%), Firefighting & Prevention (100.0%), and Cleaning & Maintenance (100.0%), while the most female-oriented occupations are Healthcare Support (87.8%), Personal Care & Service (38.8%), and Food Preparation & Serving (28.1%).
| Occupation | Male | Female |
| Healthcare Support | 6 (12.2%) | 43 (87.8%) |
| Security & Protection | 7 (100.0%) | 0 (0.0%) |
| Firefighting & Prevention | 7 (100.0%) | 0 (0.0%) |
| Law Enforcement | 0 (0.0%) | 0 (0.0%) |
| Food Preparation & Serving | 23 (71.9%) | 9 (28.1%) |
| Cleaning & Maintenance | 13 (100.0%) | 0 (0.0%) |
| Personal Care & Service | 30 (61.2%) | 19 (38.8%) |
| Total (Category) | 79 (52.7%) | 71 (47.3%) |
| Total (Overall) | 510 (50.1%) | 508 (49.9%) |
Sales and Office Occupations
The most common Sales and Office occupations in St Paris are Office & Administration (78 | 7.7%), and Sales & Related (19 | 1.9%).

Sales and Office Occupations by Sex

| Occupation | Male | Female |
| Sales & Related | 8 (42.1%) | 11 (57.9%) |
| Office & Administration | 0 (0.0%) | 78 (100.0%) |
| Total (Category) | 8 (8.3%) | 89 (91.7%) |
| Total (Overall) | 510 (50.1%) | 508 (49.9%) |
Natural Resources, Construction and Maintenance Occupations
The most common Natural Resources, Construction and Maintenance occupations in St Paris are Construction & Extraction (24 | 2.4%), Installation, Maintenance & Repair (16 | 1.6%), and Farming, Fishing & Forestry (4 | 0.4%).

Natural Resources, Construction and Maintenance Occupations by Sex

| Occupation | Male | Female |
| Farming, Fishing & Forestry | 0 (0.0%) | 4 (100.0%) |
| Construction & Extraction | 24 (100.0%) | 0 (0.0%) |
| Installation, Maintenance & Repair | 16 (100.0%) | 0 (0.0%) |
| Total (Category) | 40 (90.9%) | 4 (9.1%) |
| Total (Overall) | 510 (50.1%) | 508 (49.9%) |
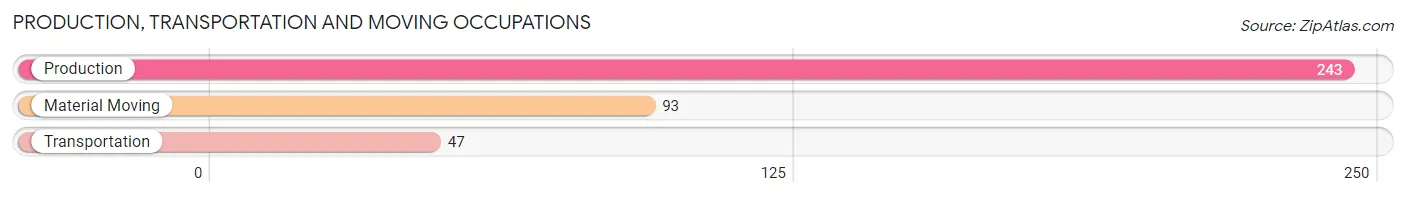
Production, Transportation and Moving Occupations
The most common Production, Transportation and Moving occupations in St Paris are Production (243 | 23.9%), Material Moving (93 | 9.1%), and Transportation (47 | 4.6%).
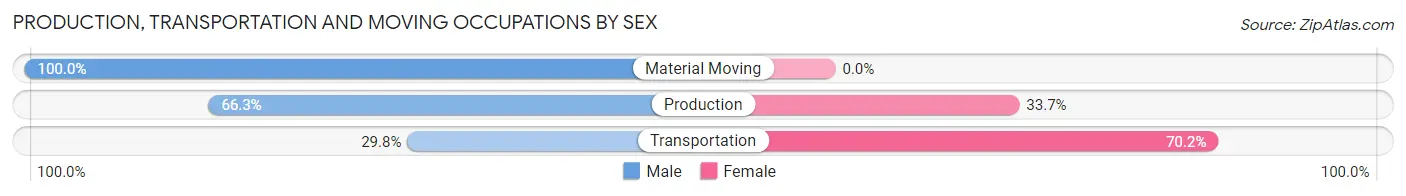
Production, Transportation and Moving Occupations by Sex
| Occupation | Male | Female |
| Production | 161 (66.3%) | 82 (33.7%) |
| Transportation | 14 (29.8%) | 33 (70.2%) |
| Material Moving | 93 (100.0%) | 0 (0.0%) |
| Total (Category) | 268 (70.0%) | 115 (30.0%) |
| Total (Overall) | 510 (50.1%) | 508 (49.9%) |
Employment Industries by Sex in St Paris
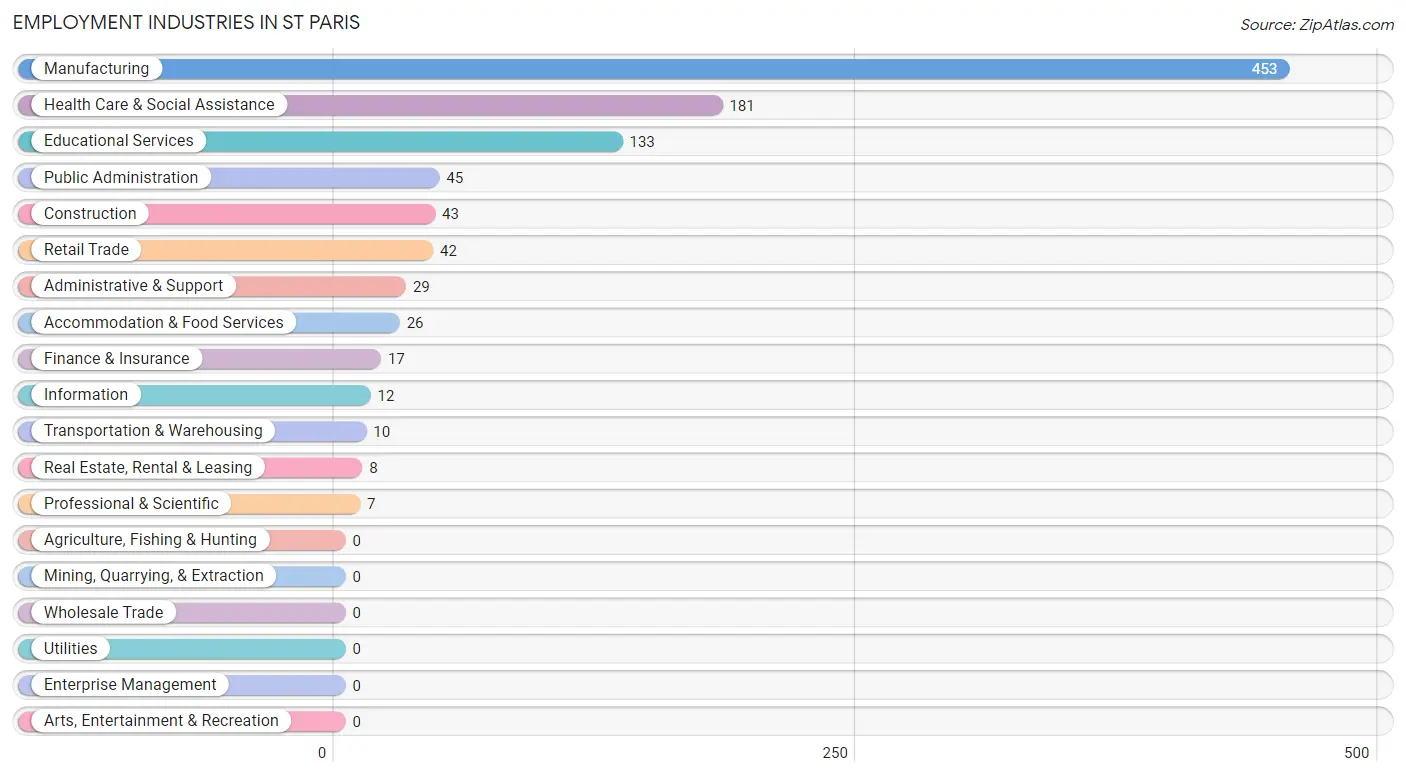
Employment Industries in St Paris
The major employment industries in St Paris include Manufacturing (453 | 44.5%), Health Care & Social Assistance (181 | 17.8%), Educational Services (133 | 13.1%), Public Administration (45 | 4.4%), and Construction (43 | 4.2%).
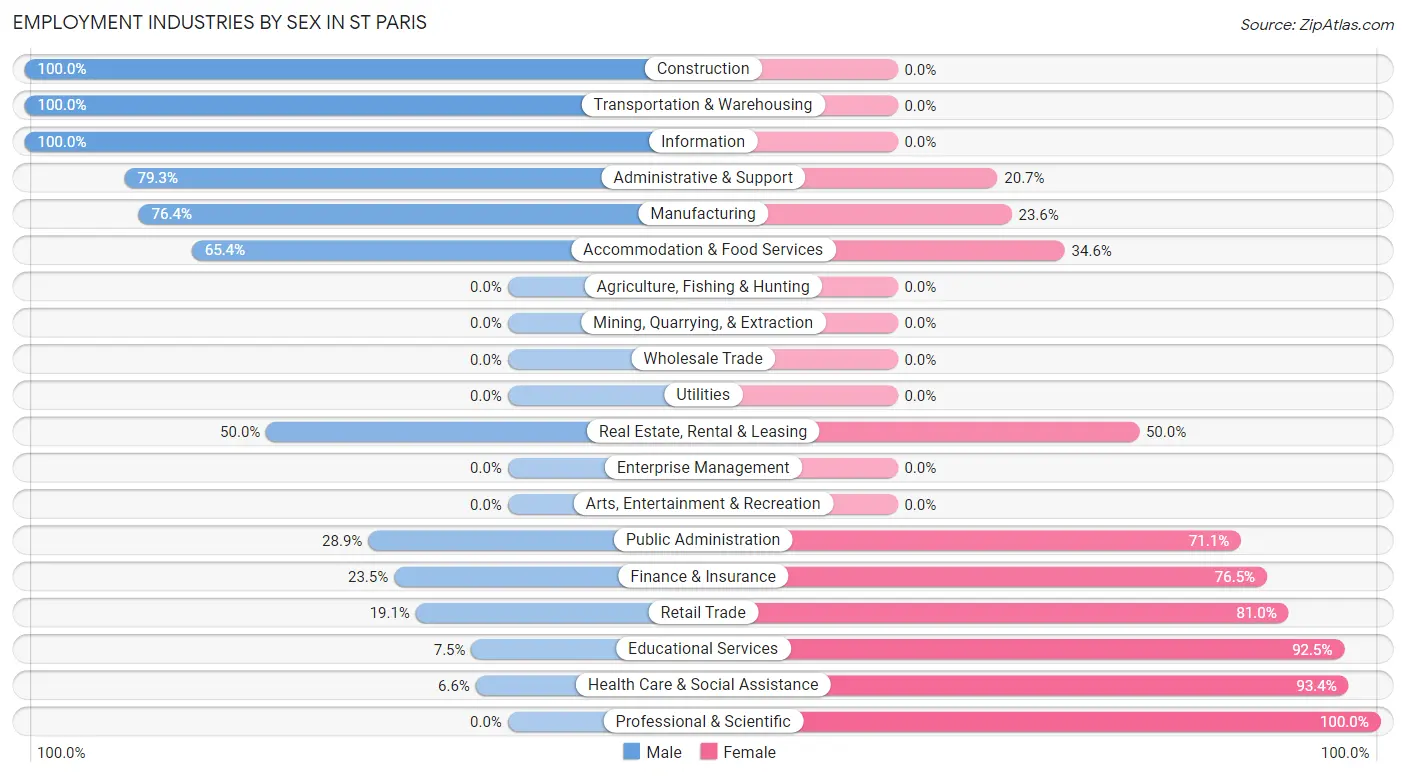
Employment Industries by Sex in St Paris
The St Paris industries that see more men than women are Construction (100.0%), Transportation & Warehousing (100.0%), and Information (100.0%), whereas the industries that tend to have a higher number of women are Professional & Scientific (100.0%), Health Care & Social Assistance (93.4%), and Educational Services (92.5%).
| Industry | Male | Female |
| Agriculture, Fishing & Hunting | 0 (0.0%) | 0 (0.0%) |
| Mining, Quarrying, & Extraction | 0 (0.0%) | 0 (0.0%) |
| Construction | 43 (100.0%) | 0 (0.0%) |
| Manufacturing | 346 (76.4%) | 107 (23.6%) |
| Wholesale Trade | 0 (0.0%) | 0 (0.0%) |
| Retail Trade | 8 (19.1%) | 34 (80.9%) |
| Transportation & Warehousing | 10 (100.0%) | 0 (0.0%) |
| Utilities | 0 (0.0%) | 0 (0.0%) |
| Information | 12 (100.0%) | 0 (0.0%) |
| Finance & Insurance | 4 (23.5%) | 13 (76.5%) |
| Real Estate, Rental & Leasing | 4 (50.0%) | 4 (50.0%) |
| Professional & Scientific | 0 (0.0%) | 7 (100.0%) |
| Enterprise Management | 0 (0.0%) | 0 (0.0%) |
| Administrative & Support | 23 (79.3%) | 6 (20.7%) |
| Educational Services | 10 (7.5%) | 123 (92.5%) |
| Health Care & Social Assistance | 12 (6.6%) | 169 (93.4%) |
| Arts, Entertainment & Recreation | 0 (0.0%) | 0 (0.0%) |
| Accommodation & Food Services | 17 (65.4%) | 9 (34.6%) |
| Public Administration | 13 (28.9%) | 32 (71.1%) |
| Total | 510 (50.1%) | 508 (49.9%) |
Education in St Paris
School Enrollment in St Paris
The most common levels of schooling among the 622 students in St Paris are high school (233 | 37.5%), middle school (174 | 28.0%), and elementary school (126 | 20.3%).
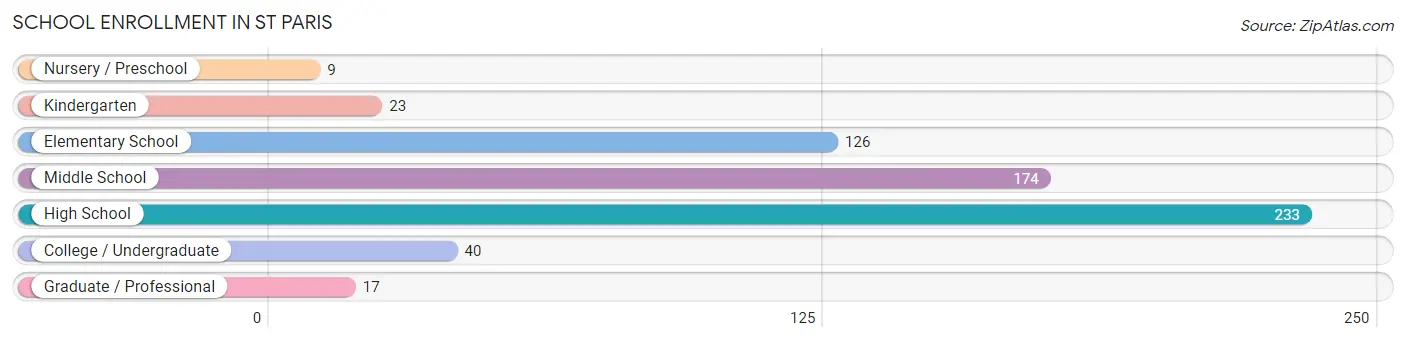
| School Level | # Students | % Students |
| Nursery / Preschool | 9 | 1.5% |
| Kindergarten | 23 | 3.7% |
| Elementary School | 126 | 20.3% |
| Middle School | 174 | 28.0% |
| High School | 233 | 37.5% |
| College / Undergraduate | 40 | 6.4% |
| Graduate / Professional | 17 | 2.7% |
| Total | 622 | 100.0% |
School Enrollment by Age by Funding Source in St Paris
Out of a total of 622 students who are enrolled in schools in St Paris, 104 (16.7%) attend a private institution, while the remaining 518 (83.3%) are enrolled in public schools. The age group of 5 to 9 year old has the highest likelihood of being enrolled in private schools, with 45 (29.6% in the age bracket) enrolled. Conversely, the age group of 18 to 19 year olds has the lowest likelihood of being enrolled in a private school, with 42 (100.0% in the age bracket) attending a public institution.
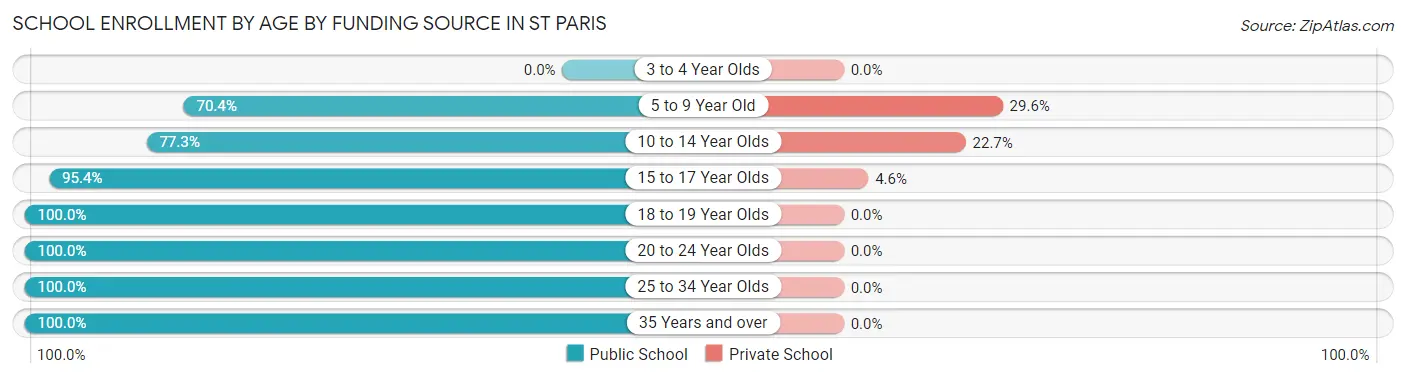
| Age Bracket | Public School | Private School |
| 3 to 4 Year Olds | 0 (0.0%) | 0 (0.0%) |
| 5 to 9 Year Old | 107 (70.4%) | 45 (29.6%) |
| 10 to 14 Year Olds | 177 (77.3%) | 52 (22.7%) |
| 15 to 17 Year Olds | 146 (95.4%) | 7 (4.6%) |
| 18 to 19 Year Olds | 42 (100.0%) | 0 (0.0%) |
| 20 to 24 Year Olds | 6 (100.0%) | 0 (0.0%) |
| 25 to 34 Year Olds | 7 (100.0%) | 0 (0.0%) |
| 35 Years and over | 33 (100.0%) | 0 (0.0%) |
| Total | 518 (83.3%) | 104 (16.7%) |
Educational Attainment by Field of Study in St Paris
Bio, nature & agricultural (51 | 22.8%), education (47 | 21.0%), business (33 | 14.7%), arts & humanities (21 | 9.4%), and science & technology (20 | 8.9%) are the most common fields of study among 224 individuals in St Paris who have obtained a bachelor's degree or higher.
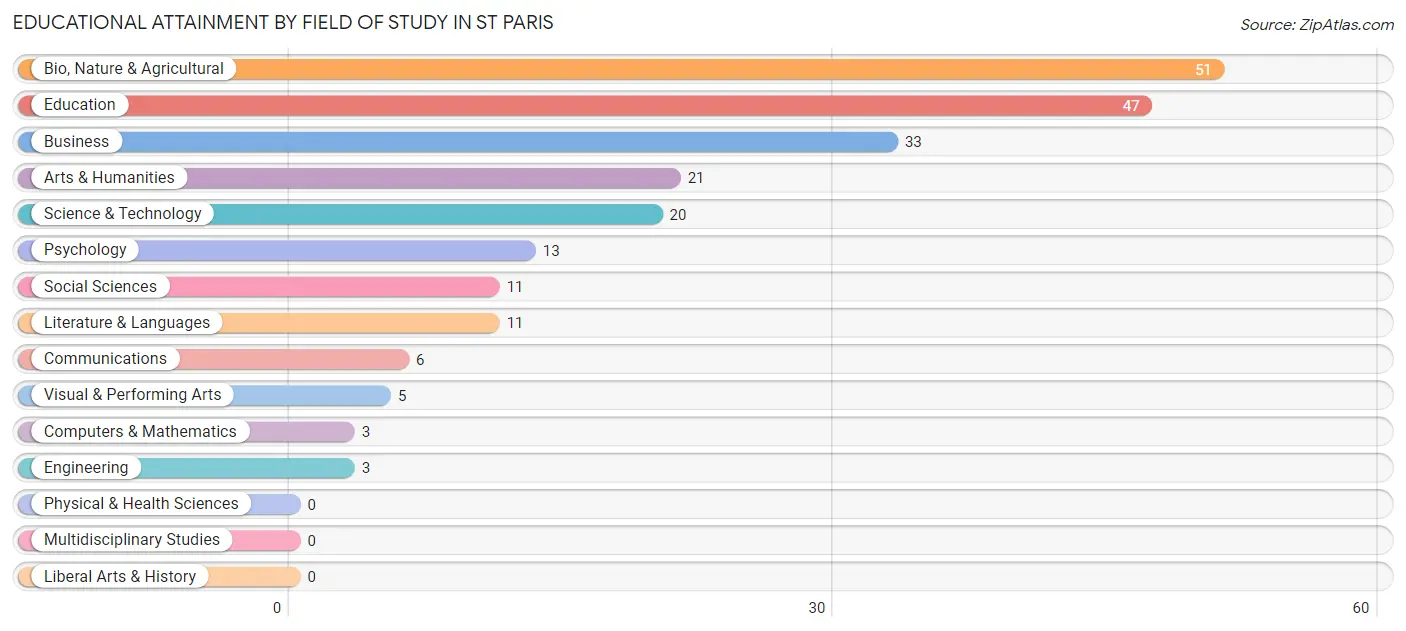
| Field of Study | # Graduates | % Graduates |
| Computers & Mathematics | 3 | 1.3% |
| Bio, Nature & Agricultural | 51 | 22.8% |
| Physical & Health Sciences | 0 | 0.0% |
| Psychology | 13 | 5.8% |
| Social Sciences | 11 | 4.9% |
| Engineering | 3 | 1.3% |
| Multidisciplinary Studies | 0 | 0.0% |
| Science & Technology | 20 | 8.9% |
| Business | 33 | 14.7% |
| Education | 47 | 21.0% |
| Literature & Languages | 11 | 4.9% |
| Liberal Arts & History | 0 | 0.0% |
| Visual & Performing Arts | 5 | 2.2% |
| Communications | 6 | 2.7% |
| Arts & Humanities | 21 | 9.4% |
| Total | 224 | 100.0% |
Transportation & Commute in St Paris
Vehicle Availability by Sex in St Paris
The most prevalent vehicle ownership categories in St Paris are males with 2 vehicles (223, accounting for 43.7%) and females with 2 vehicles (263, making up 44.7%).
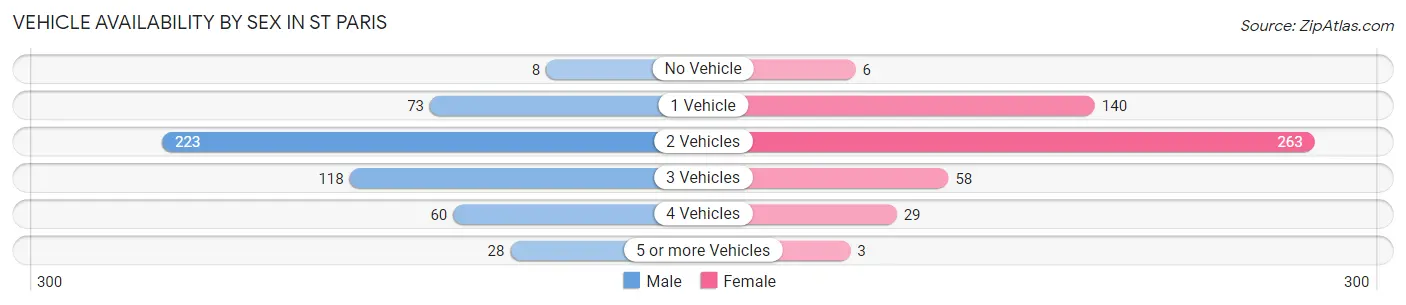
| Vehicles Available | Male | Female |
| No Vehicle | 8 (1.6%) | 6 (1.2%) |
| 1 Vehicle | 73 (14.3%) | 140 (28.1%) |
| 2 Vehicles | 223 (43.7%) | 263 (52.7%) |
| 3 Vehicles | 118 (23.1%) | 58 (11.6%) |
| 4 Vehicles | 60 (11.8%) | 29 (5.8%) |
| 5 or more Vehicles | 28 (5.5%) | 3 (0.6%) |
| Total | 510 (100.0%) | 499 (100.0%) |
Commute Time in St Paris
The most frequently occuring commute durations in St Paris are 5 to 9 minutes (189 commuters, 19.4%), 30 to 34 minutes (127 commuters, 13.0%), and 25 to 29 minutes (125 commuters, 12.8%).
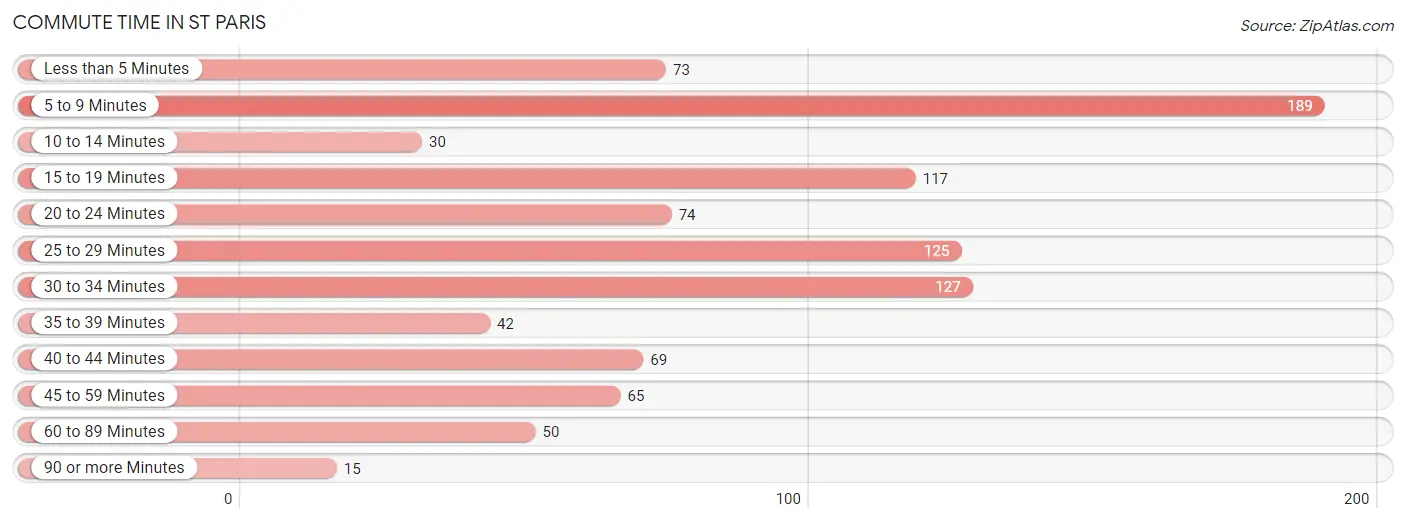
| Commute Time | # Commuters | % Commuters |
| Less than 5 Minutes | 73 | 7.5% |
| 5 to 9 Minutes | 189 | 19.4% |
| 10 to 14 Minutes | 30 | 3.1% |
| 15 to 19 Minutes | 117 | 12.0% |
| 20 to 24 Minutes | 74 | 7.6% |
| 25 to 29 Minutes | 125 | 12.8% |
| 30 to 34 Minutes | 127 | 13.0% |
| 35 to 39 Minutes | 42 | 4.3% |
| 40 to 44 Minutes | 69 | 7.1% |
| 45 to 59 Minutes | 65 | 6.7% |
| 60 to 89 Minutes | 50 | 5.1% |
| 90 or more Minutes | 15 | 1.5% |
Commute Time by Sex in St Paris
The most common commute times in St Paris are 5 to 9 minutes (106 commuters, 21.0%) for males and 30 to 34 minutes (90 commuters, 19.1%) for females.
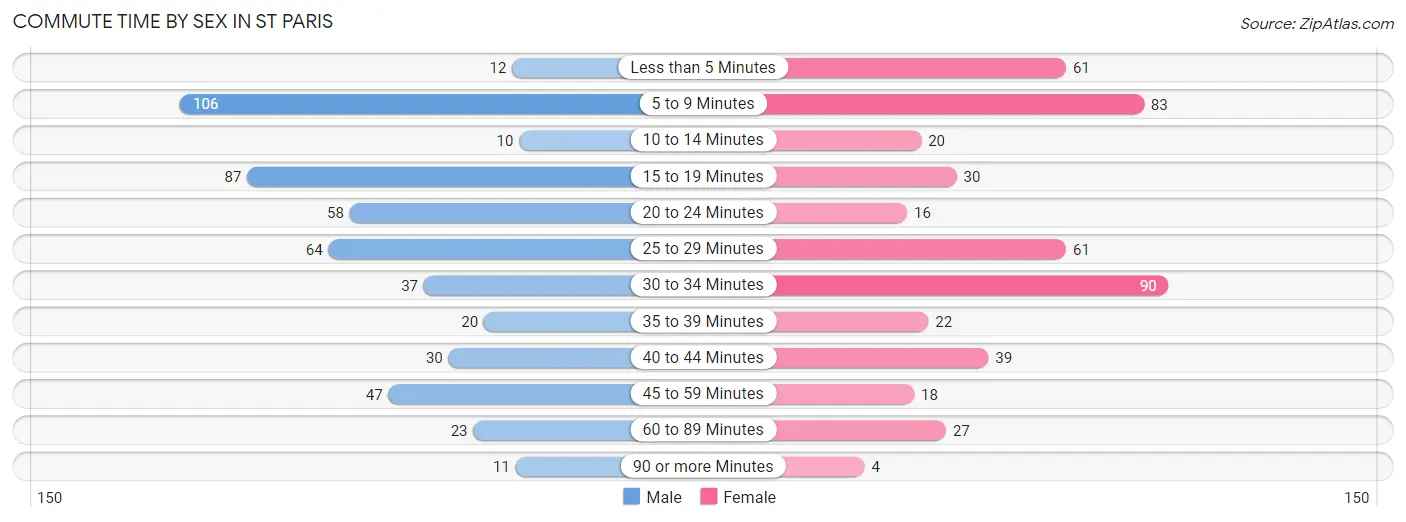
| Commute Time | Male | Female |
| Less than 5 Minutes | 12 (2.4%) | 61 (13.0%) |
| 5 to 9 Minutes | 106 (21.0%) | 83 (17.6%) |
| 10 to 14 Minutes | 10 (2.0%) | 20 (4.3%) |
| 15 to 19 Minutes | 87 (17.2%) | 30 (6.4%) |
| 20 to 24 Minutes | 58 (11.5%) | 16 (3.4%) |
| 25 to 29 Minutes | 64 (12.7%) | 61 (13.0%) |
| 30 to 34 Minutes | 37 (7.3%) | 90 (19.1%) |
| 35 to 39 Minutes | 20 (4.0%) | 22 (4.7%) |
| 40 to 44 Minutes | 30 (5.9%) | 39 (8.3%) |
| 45 to 59 Minutes | 47 (9.3%) | 18 (3.8%) |
| 60 to 89 Minutes | 23 (4.5%) | 27 (5.7%) |
| 90 or more Minutes | 11 (2.2%) | 4 (0.9%) |
Time of Departure to Work by Sex in St Paris
The most frequent times of departure to work in St Paris are 7:00 AM to 7:29 AM (120, 23.8%) for males and 7:00 AM to 7:29 AM (136, 28.9%) for females.
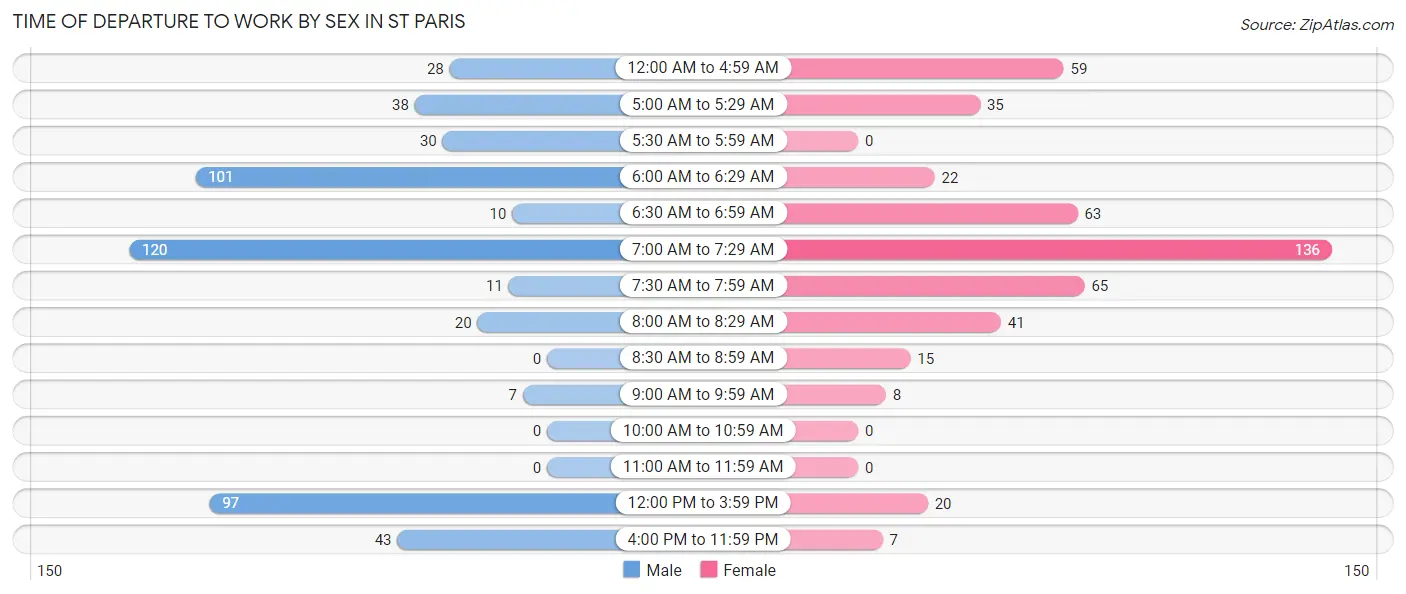
| Time of Departure | Male | Female |
| 12:00 AM to 4:59 AM | 28 (5.5%) | 59 (12.5%) |
| 5:00 AM to 5:29 AM | 38 (7.5%) | 35 (7.4%) |
| 5:30 AM to 5:59 AM | 30 (5.9%) | 0 (0.0%) |
| 6:00 AM to 6:29 AM | 101 (20.0%) | 22 (4.7%) |
| 6:30 AM to 6:59 AM | 10 (2.0%) | 63 (13.4%) |
| 7:00 AM to 7:29 AM | 120 (23.8%) | 136 (28.9%) |
| 7:30 AM to 7:59 AM | 11 (2.2%) | 65 (13.8%) |
| 8:00 AM to 8:29 AM | 20 (4.0%) | 41 (8.7%) |
| 8:30 AM to 8:59 AM | 0 (0.0%) | 15 (3.2%) |
| 9:00 AM to 9:59 AM | 7 (1.4%) | 8 (1.7%) |
| 10:00 AM to 10:59 AM | 0 (0.0%) | 0 (0.0%) |
| 11:00 AM to 11:59 AM | 0 (0.0%) | 0 (0.0%) |
| 12:00 PM to 3:59 PM | 97 (19.2%) | 20 (4.3%) |
| 4:00 PM to 11:59 PM | 43 (8.5%) | 7 (1.5%) |
| Total | 505 (100.0%) | 471 (100.0%) |
Housing Occupancy in St Paris
Occupancy by Ownership in St Paris
Of the total 802 dwellings in St Paris, owner-occupied units account for 569 (71.0%), while renter-occupied units make up 233 (29.0%).
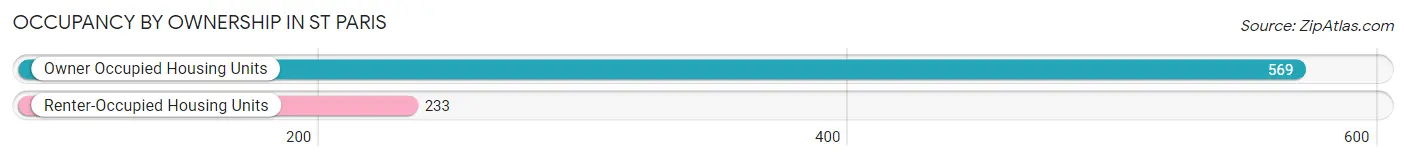
| Occupancy | # Housing Units | % Housing Units |
| Owner Occupied Housing Units | 569 | 71.0% |
| Renter-Occupied Housing Units | 233 | 29.0% |
| Total Occupied Housing Units | 802 | 100.0% |
Occupancy by Household Size in St Paris
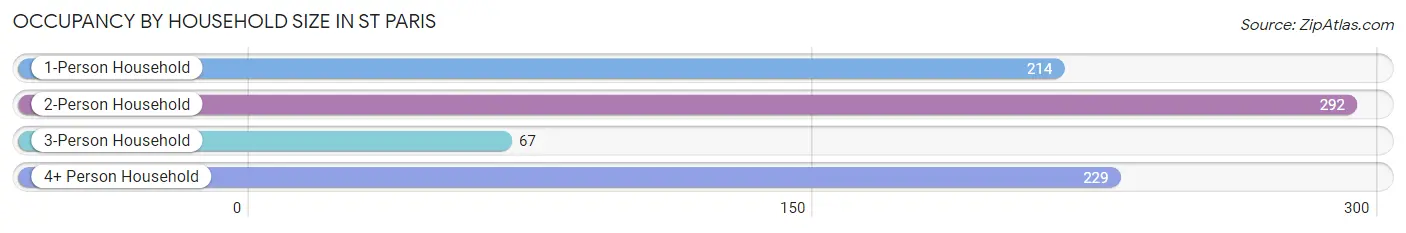
| Household Size | # Housing Units | % Housing Units |
| 1-Person Household | 214 | 26.7% |
| 2-Person Household | 292 | 36.4% |
| 3-Person Household | 67 | 8.4% |
| 4+ Person Household | 229 | 28.5% |
| Total Housing Units | 802 | 100.0% |
Occupancy by Ownership by Household Size in St Paris
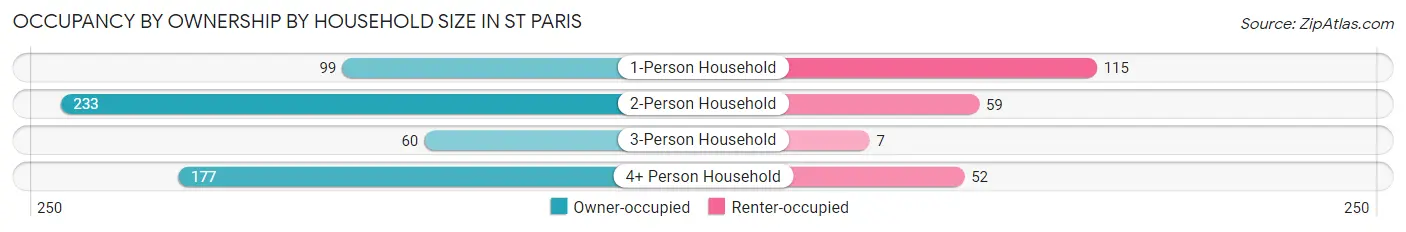
| Household Size | Owner-occupied | Renter-occupied |
| 1-Person Household | 99 (46.3%) | 115 (53.7%) |
| 2-Person Household | 233 (79.8%) | 59 (20.2%) |
| 3-Person Household | 60 (89.5%) | 7 (10.4%) |
| 4+ Person Household | 177 (77.3%) | 52 (22.7%) |
| Total Housing Units | 569 (71.0%) | 233 (29.0%) |
Occupancy by Educational Attainment in St Paris
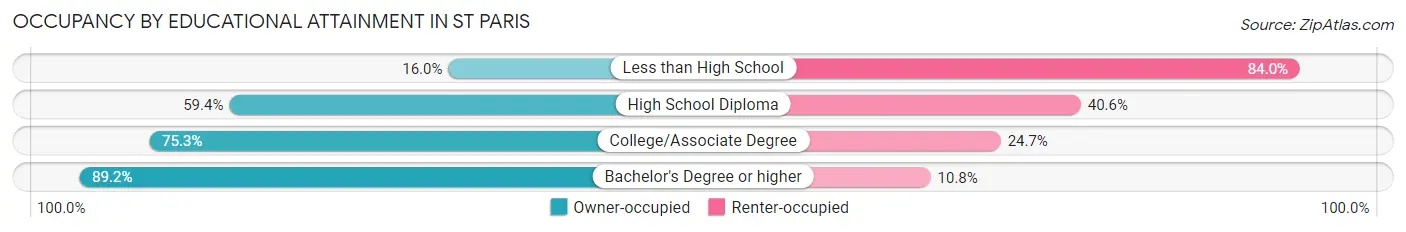
| Household Size | Owner-occupied | Renter-occupied |
| Less than High School | 4 (16.0%) | 21 (84.0%) |
| High School Diploma | 167 (59.4%) | 114 (40.6%) |
| College/Associate Degree | 241 (75.3%) | 79 (24.7%) |
| Bachelor's Degree or higher | 157 (89.2%) | 19 (10.8%) |
Occupancy by Age of Householder in St Paris
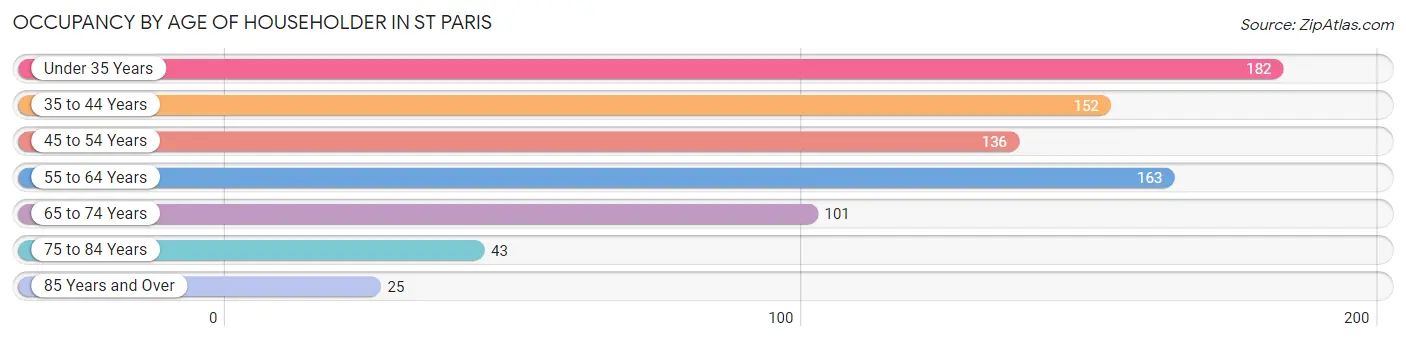
| Age Bracket | # Households | % Households |
| Under 35 Years | 182 | 22.7% |
| 35 to 44 Years | 152 | 19.0% |
| 45 to 54 Years | 136 | 17.0% |
| 55 to 64 Years | 163 | 20.3% |
| 65 to 74 Years | 101 | 12.6% |
| 75 to 84 Years | 43 | 5.4% |
| 85 Years and Over | 25 | 3.1% |
| Total | 802 | 100.0% |
Housing Finances in St Paris
Median Income by Occupancy in St Paris
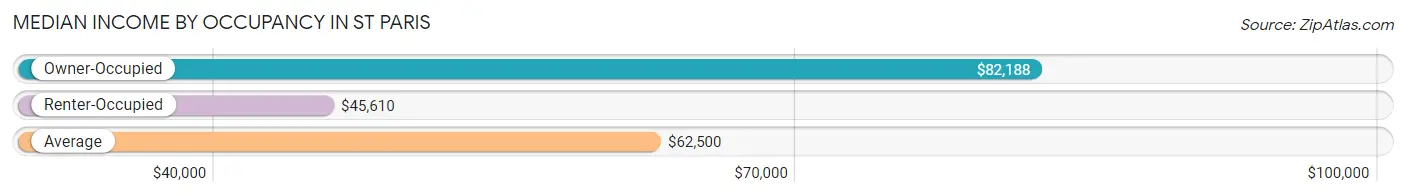
| Occupancy Type | # Households | Median Income |
| Owner-Occupied | 569 (71.0%) | $82,188 |
| Renter-Occupied | 233 (29.0%) | $45,610 |
| Average | 802 (100.0%) | $62,500 |
Occupancy by Householder Income Bracket in St Paris
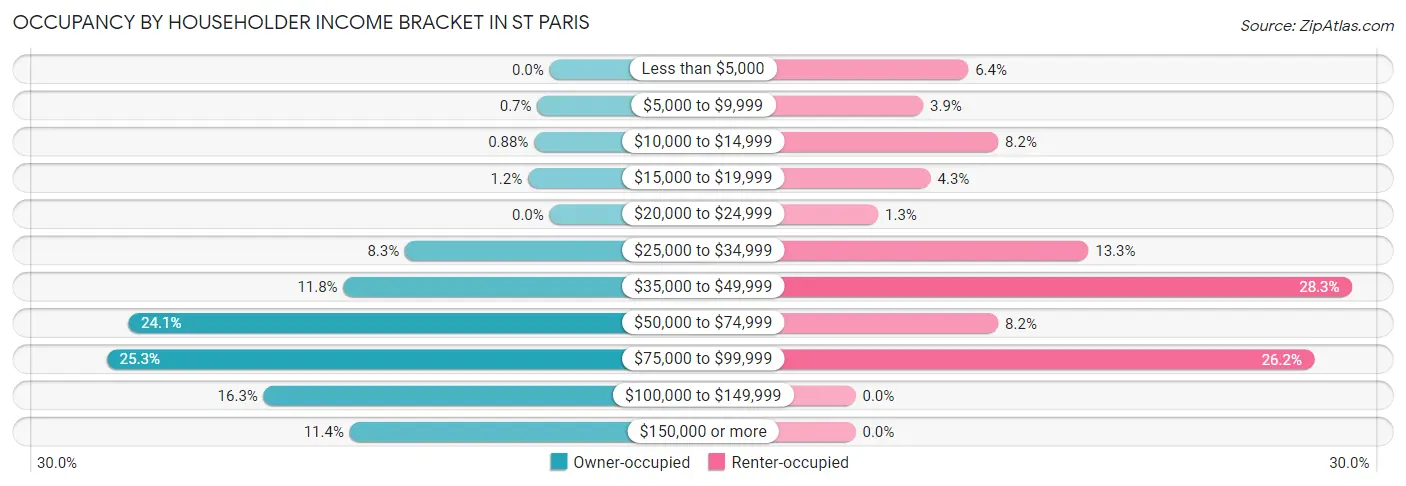
| Income Bracket | Owner-occupied | Renter-occupied |
| Less than $5,000 | 0 (0.0%) | 15 (6.4%) |
| $5,000 to $9,999 | 4 (0.7%) | 9 (3.9%) |
| $10,000 to $14,999 | 5 (0.9%) | 19 (8.2%) |
| $15,000 to $19,999 | 7 (1.2%) | 10 (4.3%) |
| $20,000 to $24,999 | 0 (0.0%) | 3 (1.3%) |
| $25,000 to $34,999 | 47 (8.3%) | 31 (13.3%) |
| $35,000 to $49,999 | 67 (11.8%) | 66 (28.3%) |
| $50,000 to $74,999 | 137 (24.1%) | 19 (8.2%) |
| $75,000 to $99,999 | 144 (25.3%) | 61 (26.2%) |
| $100,000 to $149,999 | 93 (16.3%) | 0 (0.0%) |
| $150,000 or more | 65 (11.4%) | 0 (0.0%) |
| Total | 569 (100.0%) | 233 (100.0%) |
Monthly Housing Cost Tiers in St Paris
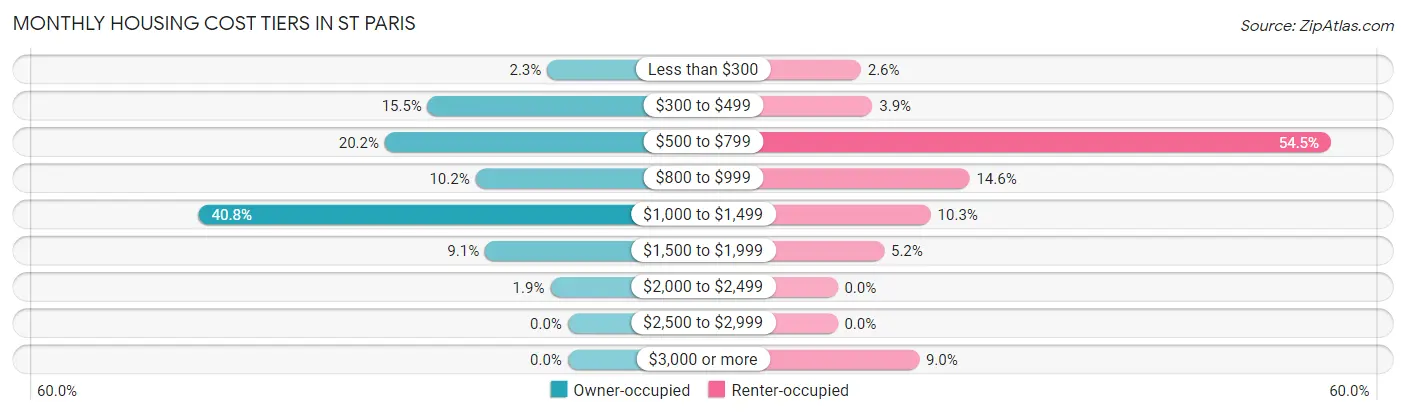
| Monthly Cost | Owner-occupied | Renter-occupied |
| Less than $300 | 13 (2.3%) | 6 (2.6%) |
| $300 to $499 | 88 (15.5%) | 9 (3.9%) |
| $500 to $799 | 115 (20.2%) | 127 (54.5%) |
| $800 to $999 | 58 (10.2%) | 34 (14.6%) |
| $1,000 to $1,499 | 232 (40.8%) | 24 (10.3%) |
| $1,500 to $1,999 | 52 (9.1%) | 12 (5.1%) |
| $2,000 to $2,499 | 11 (1.9%) | 0 (0.0%) |
| $2,500 to $2,999 | 0 (0.0%) | 0 (0.0%) |
| $3,000 or more | 0 (0.0%) | 21 (9.0%) |
| Total | 569 (100.0%) | 233 (100.0%) |
Physical Housing Characteristics in St Paris
Housing Structures in St Paris
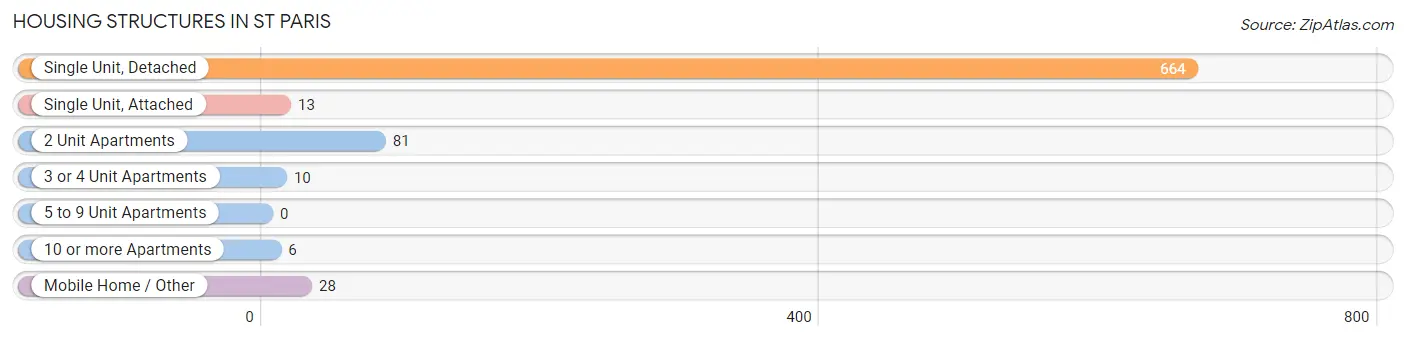
| Structure Type | # Housing Units | % Housing Units |
| Single Unit, Detached | 664 | 82.8% |
| Single Unit, Attached | 13 | 1.6% |
| 2 Unit Apartments | 81 | 10.1% |
| 3 or 4 Unit Apartments | 10 | 1.3% |
| 5 to 9 Unit Apartments | 0 | 0.0% |
| 10 or more Apartments | 6 | 0.7% |
| Mobile Home / Other | 28 | 3.5% |
| Total | 802 | 100.0% |
Housing Structures by Occupancy in St Paris
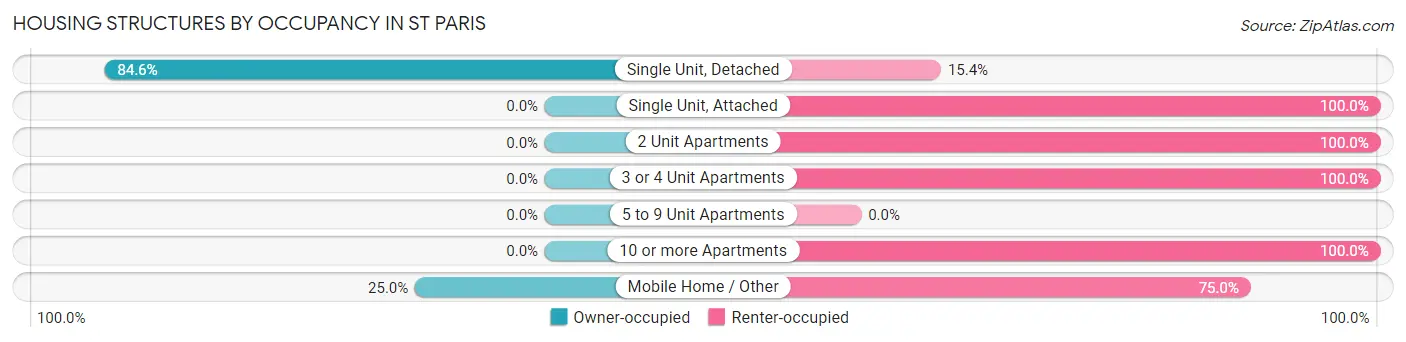
| Structure Type | Owner-occupied | Renter-occupied |
| Single Unit, Detached | 562 (84.6%) | 102 (15.4%) |
| Single Unit, Attached | 0 (0.0%) | 13 (100.0%) |
| 2 Unit Apartments | 0 (0.0%) | 81 (100.0%) |
| 3 or 4 Unit Apartments | 0 (0.0%) | 10 (100.0%) |
| 5 to 9 Unit Apartments | 0 (0.0%) | 0 (0.0%) |
| 10 or more Apartments | 0 (0.0%) | 6 (100.0%) |
| Mobile Home / Other | 7 (25.0%) | 21 (75.0%) |
| Total | 569 (71.0%) | 233 (29.0%) |
Housing Structures by Number of Rooms in St Paris
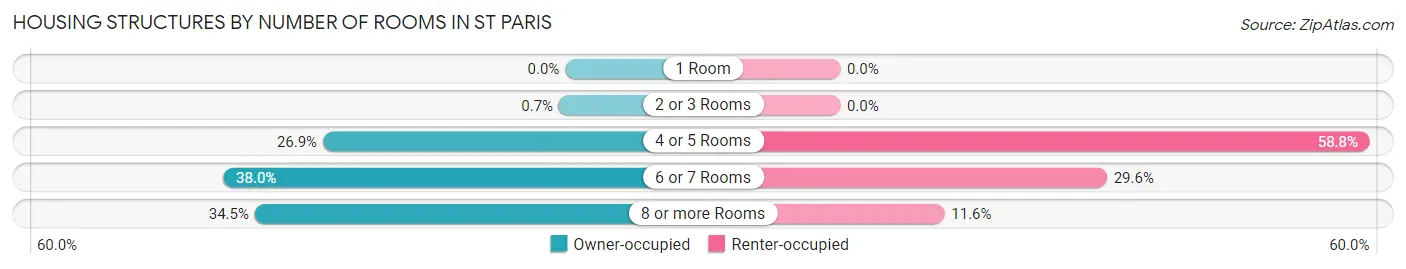
| Number of Rooms | Owner-occupied | Renter-occupied |
| 1 Room | 0 (0.0%) | 0 (0.0%) |
| 2 or 3 Rooms | 4 (0.7%) | 0 (0.0%) |
| 4 or 5 Rooms | 153 (26.9%) | 137 (58.8%) |
| 6 or 7 Rooms | 216 (38.0%) | 69 (29.6%) |
| 8 or more Rooms | 196 (34.4%) | 27 (11.6%) |
| Total | 569 (100.0%) | 233 (100.0%) |
Housing Structure by Heating Type in St Paris
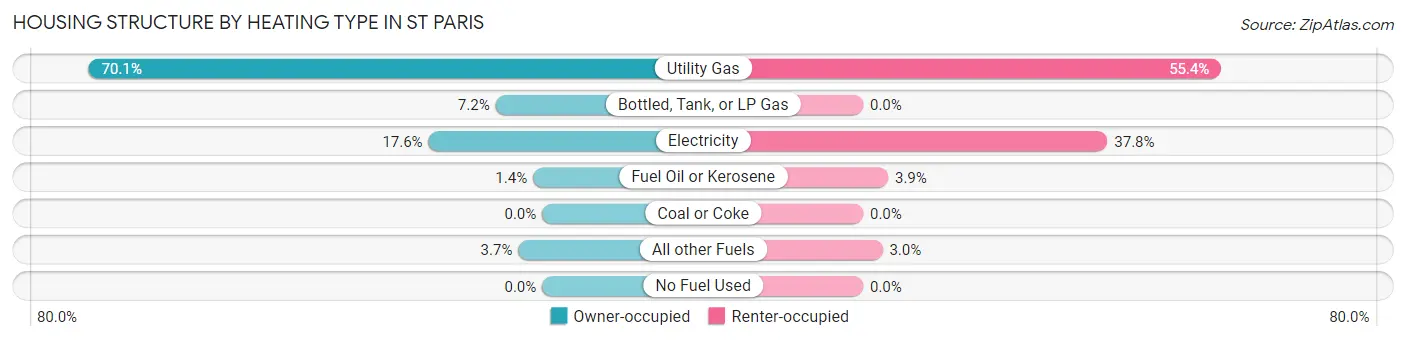
| Heating Type | Owner-occupied | Renter-occupied |
| Utility Gas | 399 (70.1%) | 129 (55.4%) |
| Bottled, Tank, or LP Gas | 41 (7.2%) | 0 (0.0%) |
| Electricity | 100 (17.6%) | 88 (37.8%) |
| Fuel Oil or Kerosene | 8 (1.4%) | 9 (3.9%) |
| Coal or Coke | 0 (0.0%) | 0 (0.0%) |
| All other Fuels | 21 (3.7%) | 7 (3.0%) |
| No Fuel Used | 0 (0.0%) | 0 (0.0%) |
| Total | 569 (100.0%) | 233 (100.0%) |
Household Vehicle Usage in St Paris
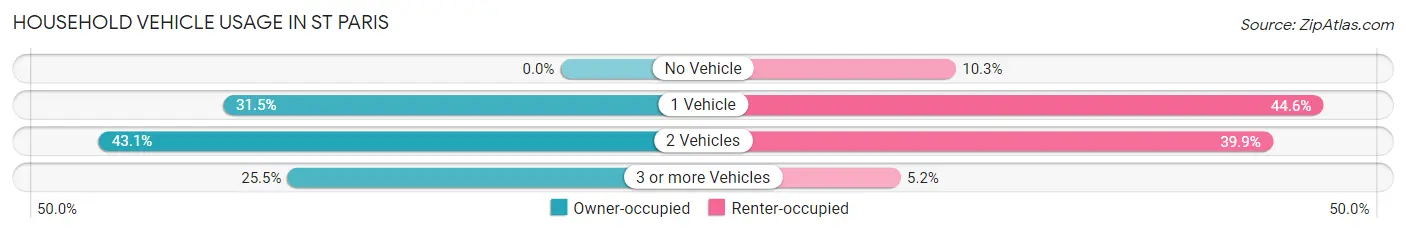
| Vehicles per Household | Owner-occupied | Renter-occupied |
| No Vehicle | 0 (0.0%) | 24 (10.3%) |
| 1 Vehicle | 179 (31.5%) | 104 (44.6%) |
| 2 Vehicles | 245 (43.1%) | 93 (39.9%) |
| 3 or more Vehicles | 145 (25.5%) | 12 (5.1%) |
| Total | 569 (100.0%) | 233 (100.0%) |
Real Estate & Mortgages in St Paris
Real Estate and Mortgage Overview in St Paris
| Characteristic | Without Mortgage | With Mortgage |
| Housing Units | 112 | 457 |
| Median Property Value | $152,100 | $128,100 |
| Median Household Income | $51,607 | $41 |
| Monthly Housing Costs | $388 | $0 |
| Real Estate Taxes | $1,417 | $16 |
Property Value by Mortgage Status in St Paris
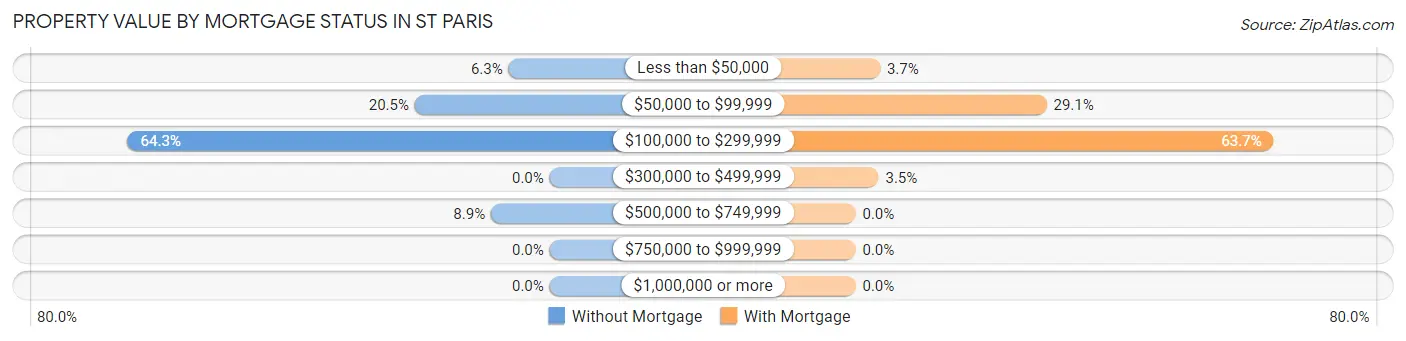
| Property Value | Without Mortgage | With Mortgage |
| Less than $50,000 | 7 (6.2%) | 17 (3.7%) |
| $50,000 to $99,999 | 23 (20.5%) | 133 (29.1%) |
| $100,000 to $299,999 | 72 (64.3%) | 291 (63.7%) |
| $300,000 to $499,999 | 0 (0.0%) | 16 (3.5%) |
| $500,000 to $749,999 | 10 (8.9%) | 0 (0.0%) |
| $750,000 to $999,999 | 0 (0.0%) | 0 (0.0%) |
| $1,000,000 or more | 0 (0.0%) | 0 (0.0%) |
| Total | 112 (100.0%) | 457 (100.0%) |
Household Income by Mortgage Status in St Paris
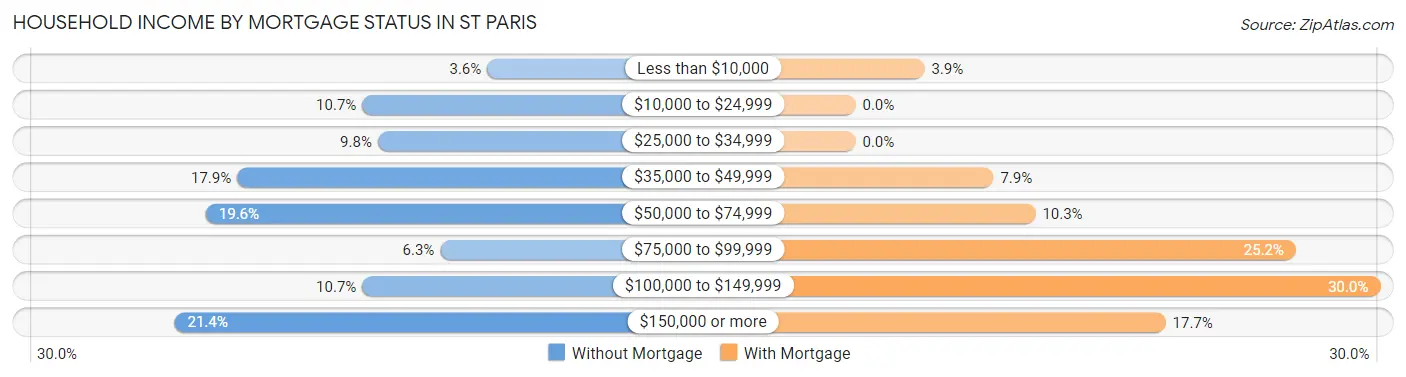
| Household Income | Without Mortgage | With Mortgage |
| Less than $10,000 | 4 (3.6%) | 18 (3.9%) |
| $10,000 to $24,999 | 12 (10.7%) | 0 (0.0%) |
| $25,000 to $34,999 | 11 (9.8%) | 0 (0.0%) |
| $35,000 to $49,999 | 20 (17.9%) | 36 (7.9%) |
| $50,000 to $74,999 | 22 (19.6%) | 47 (10.3%) |
| $75,000 to $99,999 | 7 (6.2%) | 115 (25.2%) |
| $100,000 to $149,999 | 12 (10.7%) | 137 (30.0%) |
| $150,000 or more | 24 (21.4%) | 81 (17.7%) |
| Total | 112 (100.0%) | 457 (100.0%) |
Property Value to Household Income Ratio in St Paris
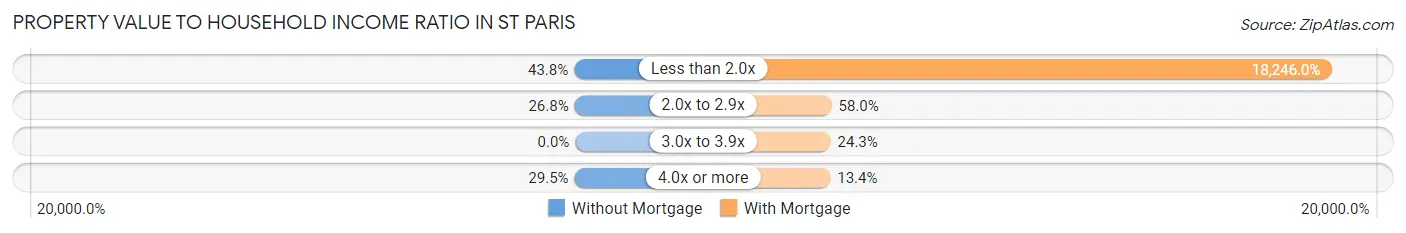
| Value-to-Income Ratio | Without Mortgage | With Mortgage |
| Less than 2.0x | 49 (43.8%) | 83,384 (18,245.9%) |
| 2.0x to 2.9x | 30 (26.8%) | 265 (58.0%) |
| 3.0x to 3.9x | 0 (0.0%) | 111 (24.3%) |
| 4.0x or more | 33 (29.5%) | 61 (13.4%) |
| Total | 112 (100.0%) | 457 (100.0%) |
Real Estate Taxes by Mortgage Status in St Paris
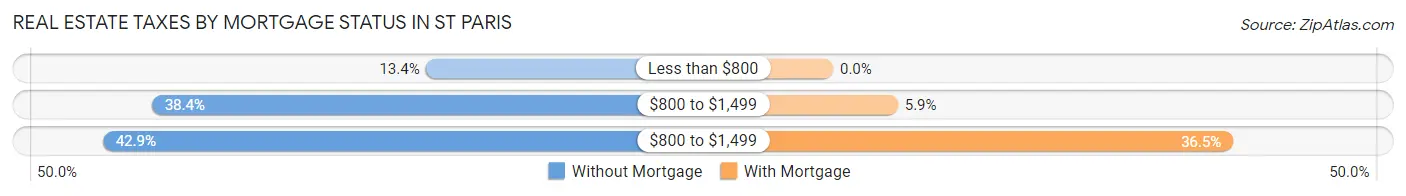
| Property Taxes | Without Mortgage | With Mortgage |
| Less than $800 | 15 (13.4%) | 0 (0.0%) |
| $800 to $1,499 | 43 (38.4%) | 27 (5.9%) |
| $800 to $1,499 | 48 (42.9%) | 167 (36.5%) |
| Total | 112 (100.0%) | 457 (100.0%) |
Health & Disability in St Paris
Health Insurance Coverage by Age in St Paris
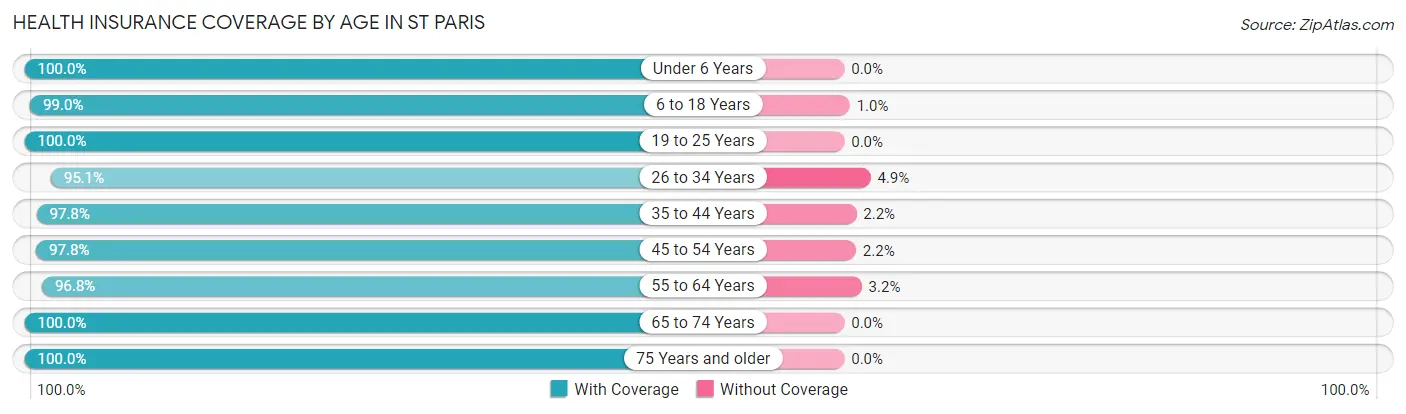
| Age Bracket | With Coverage | Without Coverage |
| Under 6 Years | 73 (100.0%) | 0 (0.0%) |
| 6 to 18 Years | 590 (99.0%) | 6 (1.0%) |
| 19 to 25 Years | 107 (100.0%) | 0 (0.0%) |
| 26 to 34 Years | 331 (95.1%) | 17 (4.9%) |
| 35 to 44 Years | 305 (97.8%) | 7 (2.2%) |
| 45 to 54 Years | 227 (97.8%) | 5 (2.2%) |
| 55 to 64 Years | 209 (96.8%) | 7 (3.2%) |
| 65 to 74 Years | 143 (100.0%) | 0 (0.0%) |
| 75 Years and older | 111 (100.0%) | 0 (0.0%) |
| Total | 2,096 (98.0%) | 42 (2.0%) |
Health Insurance Coverage by Citizenship Status in St Paris

| Citizenship Status | With Coverage | Without Coverage |
| Native Born | 73 (100.0%) | 0 (0.0%) |
| Foreign Born, Citizen | 590 (99.0%) | 6 (1.0%) |
| Foreign Born, not a Citizen | 107 (100.0%) | 0 (0.0%) |
Health Insurance Coverage by Household Income in St Paris
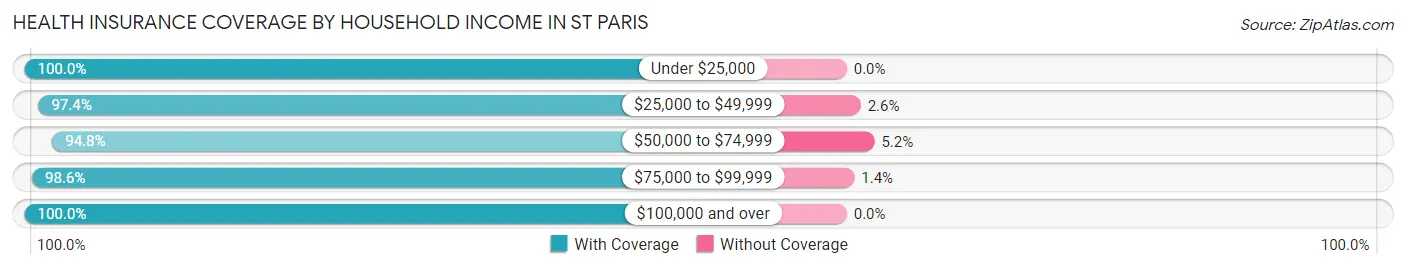
| Household Income | With Coverage | Without Coverage |
| Under $25,000 | 93 (100.0%) | 0 (0.0%) |
| $25,000 to $49,999 | 336 (97.4%) | 9 (2.6%) |
| $50,000 to $74,999 | 402 (94.8%) | 22 (5.2%) |
| $75,000 to $99,999 | 770 (98.6%) | 11 (1.4%) |
| $100,000 and over | 495 (100.0%) | 0 (0.0%) |
Public vs Private Health Insurance Coverage by Age in St Paris
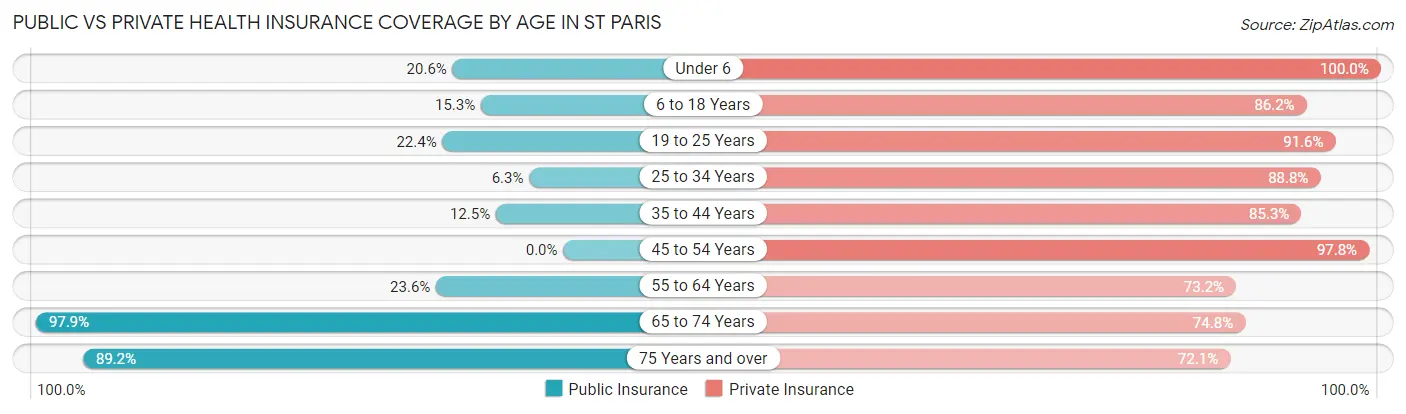
| Age Bracket | Public Insurance | Private Insurance |
| Under 6 | 15 (20.5%) | 73 (100.0%) |
| 6 to 18 Years | 91 (15.3%) | 514 (86.2%) |
| 19 to 25 Years | 24 (22.4%) | 98 (91.6%) |
| 25 to 34 Years | 22 (6.3%) | 309 (88.8%) |
| 35 to 44 Years | 39 (12.5%) | 266 (85.3%) |
| 45 to 54 Years | 0 (0.0%) | 227 (97.8%) |
| 55 to 64 Years | 51 (23.6%) | 158 (73.2%) |
| 65 to 74 Years | 140 (97.9%) | 107 (74.8%) |
| 75 Years and over | 99 (89.2%) | 80 (72.1%) |
| Total | 481 (22.5%) | 1,832 (85.7%) |
Disability Status by Sex by Age in St Paris
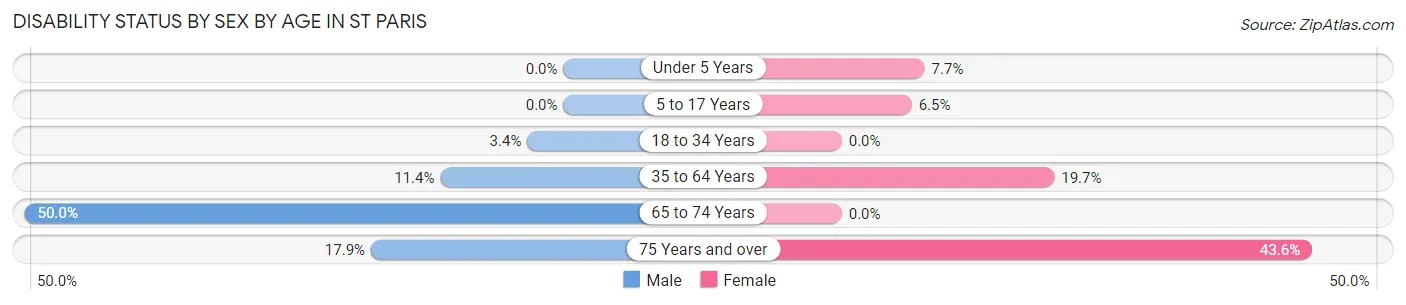
| Age Bracket | Male | Female |
| Under 5 Years | 0 (0.0%) | 4 (7.7%) |
| 5 to 17 Years | 0 (0.0%) | 17 (6.5%) |
| 18 to 34 Years | 9 (3.4%) | 0 (0.0%) |
| 35 to 64 Years | 37 (11.4%) | 86 (19.7%) |
| 65 to 74 Years | 38 (50.0%) | 0 (0.0%) |
| 75 Years and over | 10 (17.9%) | 24 (43.6%) |
Disability Class by Sex by Age in St Paris
Disability Class: Hearing Difficulty
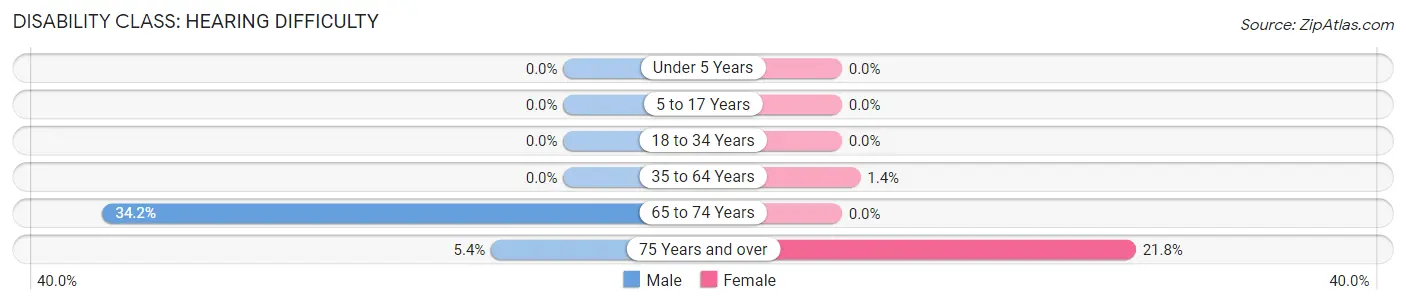
| Age Bracket | Male | Female |
| Under 5 Years | 0 (0.0%) | 0 (0.0%) |
| 5 to 17 Years | 0 (0.0%) | 0 (0.0%) |
| 18 to 34 Years | 0 (0.0%) | 0 (0.0%) |
| 35 to 64 Years | 0 (0.0%) | 6 (1.4%) |
| 65 to 74 Years | 26 (34.2%) | 0 (0.0%) |
| 75 Years and over | 3 (5.4%) | 12 (21.8%) |
Disability Class: Vision Difficulty
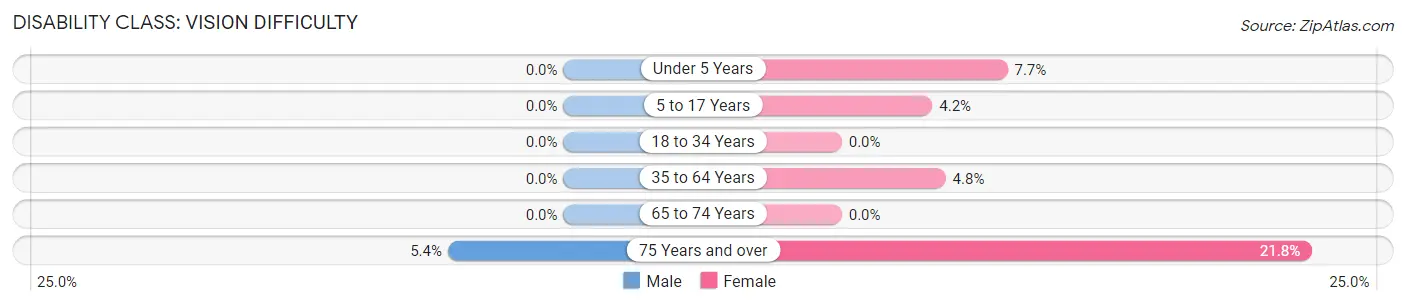
| Age Bracket | Male | Female |
| Under 5 Years | 0 (0.0%) | 4 (7.7%) |
| 5 to 17 Years | 0 (0.0%) | 11 (4.2%) |
| 18 to 34 Years | 0 (0.0%) | 0 (0.0%) |
| 35 to 64 Years | 0 (0.0%) | 21 (4.8%) |
| 65 to 74 Years | 0 (0.0%) | 0 (0.0%) |
| 75 Years and over | 3 (5.4%) | 12 (21.8%) |
Disability Class: Cognitive Difficulty
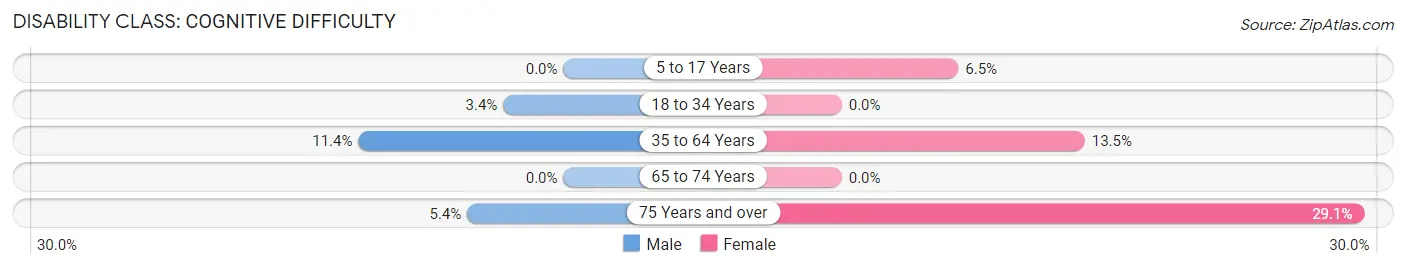
| Age Bracket | Male | Female |
| 5 to 17 Years | 0 (0.0%) | 17 (6.5%) |
| 18 to 34 Years | 9 (3.4%) | 0 (0.0%) |
| 35 to 64 Years | 37 (11.4%) | 59 (13.5%) |
| 65 to 74 Years | 0 (0.0%) | 0 (0.0%) |
| 75 Years and over | 3 (5.4%) | 16 (29.1%) |
Disability Class: Ambulatory Difficulty
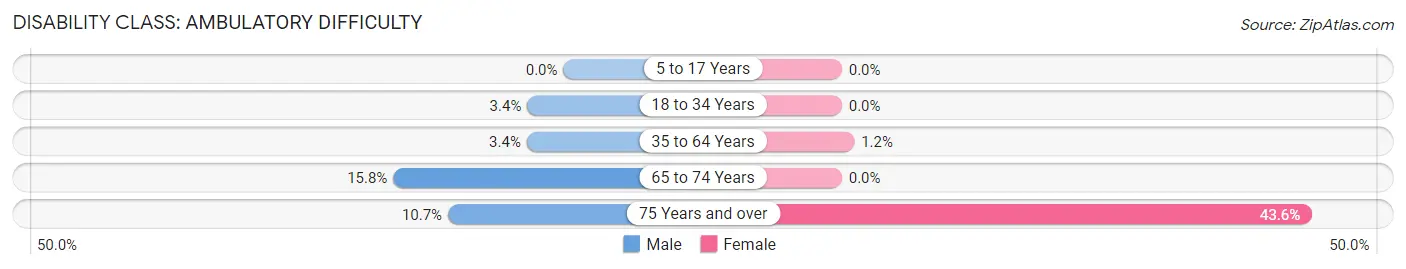
| Age Bracket | Male | Female |
| 5 to 17 Years | 0 (0.0%) | 0 (0.0%) |
| 18 to 34 Years | 9 (3.4%) | 0 (0.0%) |
| 35 to 64 Years | 11 (3.4%) | 5 (1.1%) |
| 65 to 74 Years | 12 (15.8%) | 0 (0.0%) |
| 75 Years and over | 6 (10.7%) | 24 (43.6%) |
Disability Class: Self-Care Difficulty
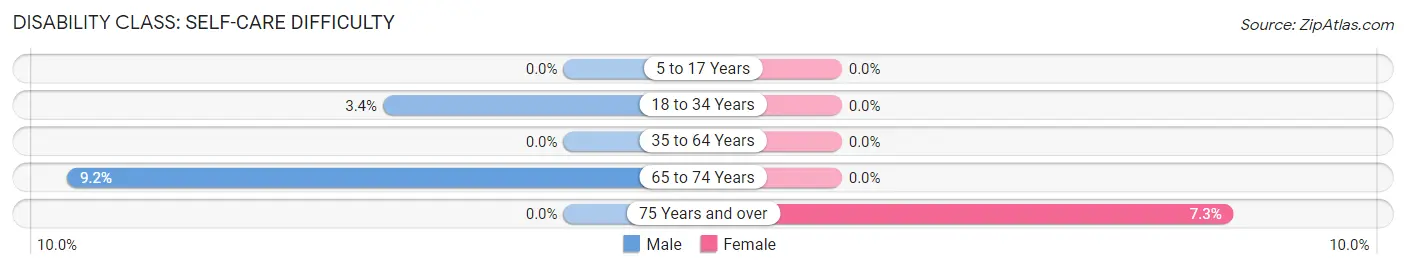
| Age Bracket | Male | Female |
| 5 to 17 Years | 0 (0.0%) | 0 (0.0%) |
| 18 to 34 Years | 9 (3.4%) | 0 (0.0%) |
| 35 to 64 Years | 0 (0.0%) | 0 (0.0%) |
| 65 to 74 Years | 7 (9.2%) | 0 (0.0%) |
| 75 Years and over | 0 (0.0%) | 4 (7.3%) |
Technology Access in St Paris
Computing Device Access in St Paris
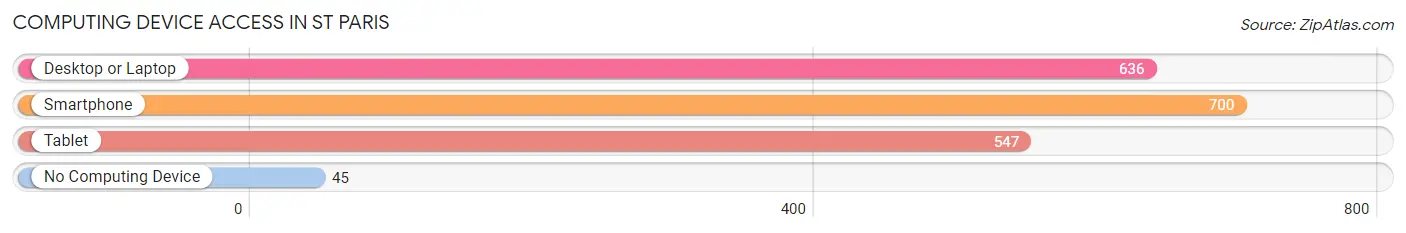
| Device Type | # Households | % Households |
| Desktop or Laptop | 636 | 79.3% |
| Smartphone | 700 | 87.3% |
| Tablet | 547 | 68.2% |
| No Computing Device | 45 | 5.6% |
| Total | 802 | 100.0% |
Internet Access in St Paris
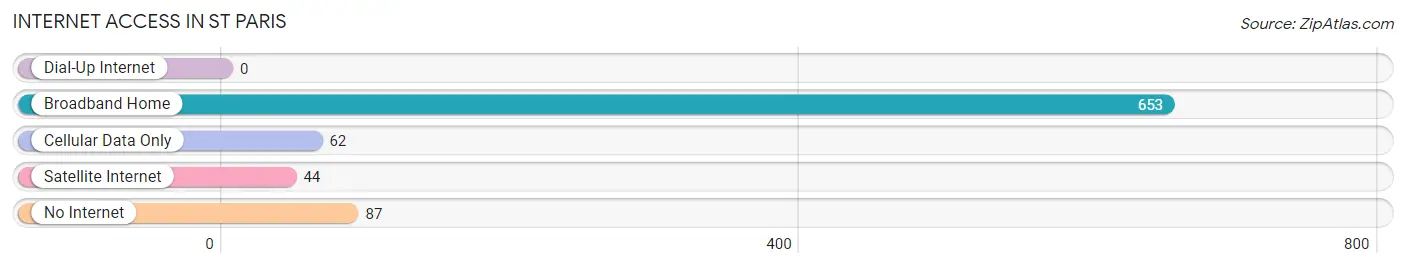
| Internet Type | # Households | % Households |
| Dial-Up Internet | 0 | 0.0% |
| Broadband Home | 653 | 81.4% |
| Cellular Data Only | 62 | 7.7% |
| Satellite Internet | 44 | 5.5% |
| No Internet | 87 | 10.8% |
| Total | 802 | 100.0% |
St Paris Summary
Paris is a small village located in the state of Ohio, United States. It is situated in the southeastern part of the state, in the county of Champaign. The village is located on the banks of the Mad River, and is part of the Dayton metropolitan area. The population of Paris was estimated to be 1,845 in the year 2020.
History
Paris was founded in 1805 by a group of settlers from Pennsylvania. The village was named after the city of Paris in France. The settlers were attracted to the area due to its fertile soil and abundant natural resources. The village was incorporated in 1817 and was the first village in Champaign County.
In the early 19th century, Paris was a thriving agricultural community. The village was home to several mills, including a grist mill, a saw mill, and a woolen mill. The village also had a blacksmith shop, a tannery, and a distillery.
In the late 19th century, the village began to experience a decline in population due to the decline of the agricultural industry. The village was also affected by the Great Depression and World War II.
Geography
Paris is located in the southeastern part of Ohio, in the county of Champaign. The village is situated on the banks of the Mad River, and is part of the Dayton metropolitan area. The village is located approximately 25 miles east of Dayton and 40 miles west of Columbus.
The village has a total area of 1.2 square miles, all of which is land. The village is located in a flat, open area with rolling hills. The climate in Paris is humid continental, with hot summers and cold winters.
Economy
The economy of Paris is largely based on agriculture and manufacturing. The village is home to several farms, which produce a variety of crops, including corn, soybeans, wheat, and hay. The village also has several manufacturing companies, which produce a variety of products, including furniture, automotive parts, and medical supplies.
The village also has several retail stores, restaurants, and other businesses. The village is home to several banks, a post office, and a library.
Demographics
The population of Paris was estimated to be 1,845 in the year 2020. The population is predominantly white, with a small percentage of African Americans and Hispanics. The median household income in the village is $45,000, and the median home value is $125,000.
The village has a high school, a middle school, and an elementary school. The village also has several churches, a library, and a community center.
Conclusion
Paris is a small village located in the southeastern part of Ohio, in the county of Champaign. The village was founded in 1805 and was the first village in Champaign County. The village has a population of 1,845 and is predominantly white. The economy of the village is largely based on agriculture and manufacturing. The village has a high school, a middle school, and an elementary school, as well as several churches, a library, and a community center.
Common Questions
What is the Total Population of St Paris?
Total Population of St Paris is 2,138.
What is the Total Male Population of St Paris?
Total Male Population of St Paris is 1,029.
What is the Total Female Population of St Paris?
Total Female Population of St Paris is 1,109.
What is the Ratio of Males per 100 Females in St Paris?
There are 92.79 Males per 100 Females in St Paris.
What is the Ratio of Females per 100 Males in St Paris?
There are 107.77 Females per 100 Males in St Paris.
What is the Median Population Age in St Paris?
Median Population Age in St Paris is 34.5 Years.
What is the Average Family Size in St Paris
Average Family Size in St Paris is 3.3 People.
What is the Average Household Size in St Paris
Average Household Size in St Paris is 2.7 People.
What is Per Capita Income in St Paris?
Per Capita income in St Paris is $28,109.
What is the Median Family Income in St Paris?
Median Family Income in St Paris is $83,563.
What is the Median Household income in St Paris?
Median Household Income in St Paris is $62,500.
What is Income or Wage Gap in St Paris?
Income or Wage Gap in St Paris is 38.4%.
Women in St Paris earn 61.6 cents for every dollar earned by a man.
What is Inequality or Gini Index in St Paris?
Inequality or Gini Index in St Paris is 0.33.
How Large is the Labor Force in St Paris?
There are 1,067 People in the Labor Forcein in St Paris.
What is the Percentage of People in the Labor Force in St Paris?
64.8% of People are in the Labor Force in St Paris.
What is the Unemployment Rate in St Paris?
Unemployment Rate in St Paris is 4.6%.