South Point, OH
South Point Map
South Point Overview
3,000
TOTAL POPULATION
1,340
MALE POPULATION
1,660
FEMALE POPULATION
80.72
MALES / 100 FEMALES
123.88
FEMALES / 100 MALES
42.7
MEDIAN AGE
3.0
AVG FAMILY SIZE
2.4
AVG HOUSEHOLD SIZE
$39,687
PER CAPITA INCOME
$94,107
AVG FAMILY INCOME
$76,344
AVG HOUSEHOLD INCOME
16.3%
WAGE / INCOME GAP [ % ]
83.7¢/ $1
WAGE / INCOME GAP [ $ ]
0.44
INEQUALITY / GINI INDEX
1,666
LABOR FORCE [ PEOPLE ]
67.9%
PERCENT IN LABOR FORCE
3.5%
UNEMPLOYMENT RATE
South Point Zip Codes
South Point Area Codes
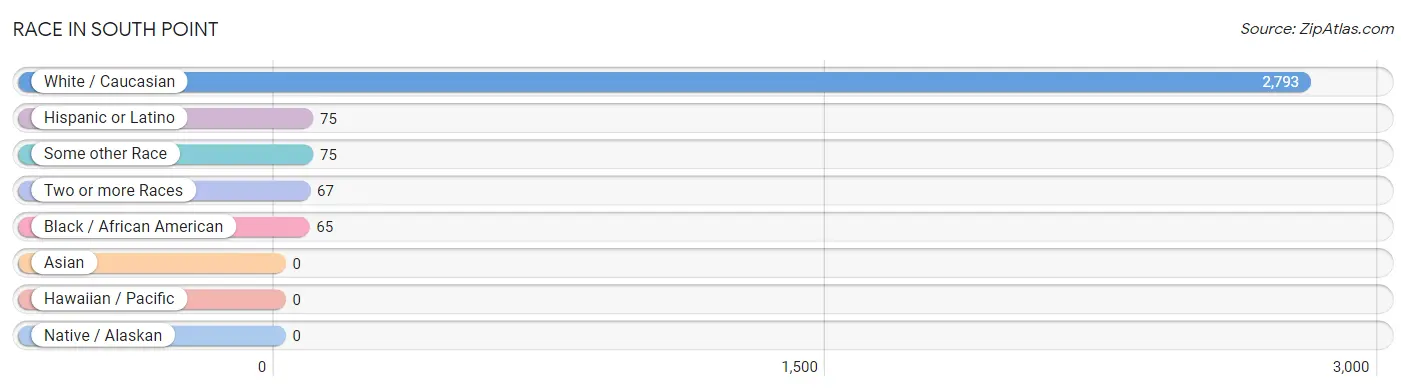
Race in South Point
The most populous races in South Point are White / Caucasian (2,793 | 93.1%), Hispanic or Latino (75 | 2.5%), and Some other Race (75 | 2.5%).
| Race | # Population | % Population |
| Asian | 0 | 0.0% |
| Black / African American | 65 | 2.2% |
| Hawaiian / Pacific | 0 | 0.0% |
| Hispanic or Latino | 75 | 2.5% |
| Native / Alaskan | 0 | 0.0% |
| White / Caucasian | 2,793 | 93.1% |
| Two or more Races | 67 | 2.2% |
| Some other Race | 75 | 2.5% |
| Total | 3,000 | 100.0% |
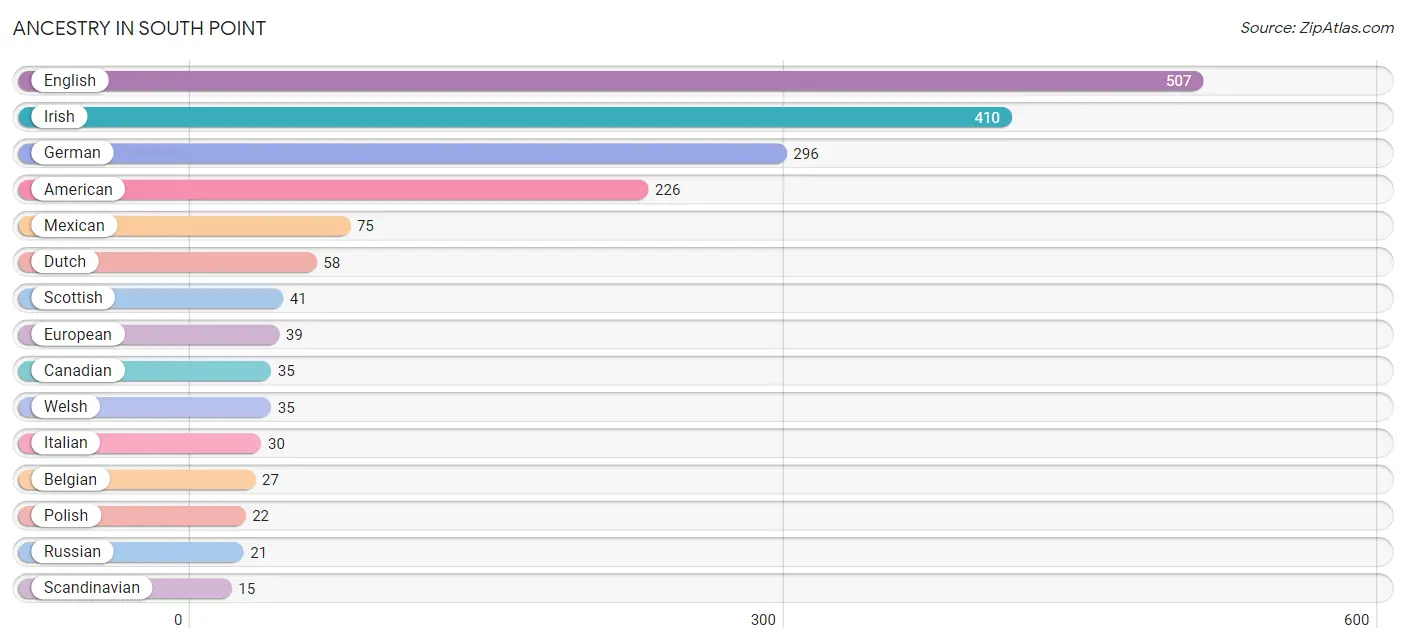
Ancestry in South Point
The most populous ancestries reported in South Point are English (507 | 16.9%), Irish (410 | 13.7%), German (296 | 9.9%), American (226 | 7.5%), and Mexican (75 | 2.5%), together accounting for 50.5% of all South Point residents.
| Ancestry | # Population | % Population |
| African | 10 | 0.3% |
| American | 226 | 7.5% |
| Belgian | 27 | 0.9% |
| British | 9 | 0.3% |
| Canadian | 35 | 1.2% |
| Cherokee | 14 | 0.5% |
| Czech | 7 | 0.2% |
| Dutch | 58 | 1.9% |
| English | 507 | 16.9% |
| European | 39 | 1.3% |
| German | 296 | 9.9% |
| Irish | 410 | 13.7% |
| Italian | 30 | 1.0% |
| Mexican | 75 | 2.5% |
| Polish | 22 | 0.7% |
| Russian | 21 | 0.7% |
| Scandinavian | 15 | 0.5% |
| Scottish | 41 | 1.4% |
| Subsaharan African | 10 | 0.3% |
| Welsh | 35 | 1.2% | View All 20 Rows |
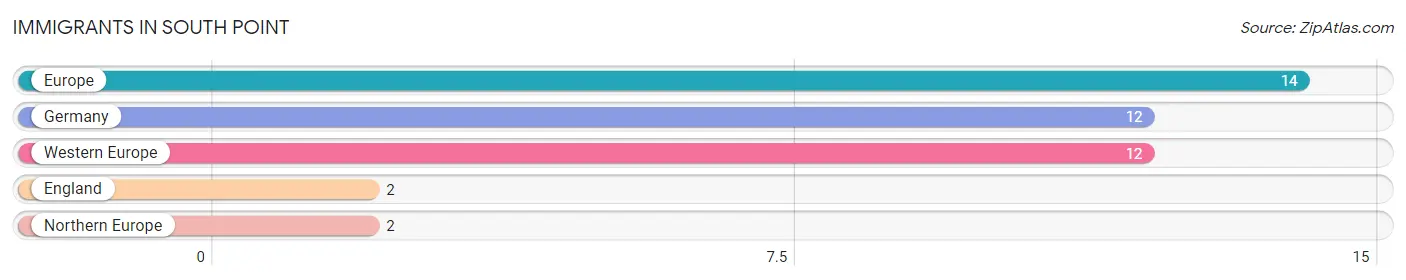
Immigrants in South Point
The most numerous immigrant groups reported in South Point came from Europe (14 | 0.5%), Germany (12 | 0.4%), Western Europe (12 | 0.4%), England (2 | 0.1%), and Northern Europe (2 | 0.1%), together accounting for 1.4% of all South Point residents.
| Immigration Origin | # Population | % Population |
| England | 2 | 0.1% |
| Europe | 14 | 0.5% |
| Germany | 12 | 0.4% |
| Northern Europe | 2 | 0.1% |
| Western Europe | 12 | 0.4% | View All 5 Rows |
Sex and Age in South Point
Sex and Age in South Point
The most populous age groups in South Point are 45 to 49 Years (195 | 14.5%) for men and 5 to 9 Years (187 | 11.3%) for women.
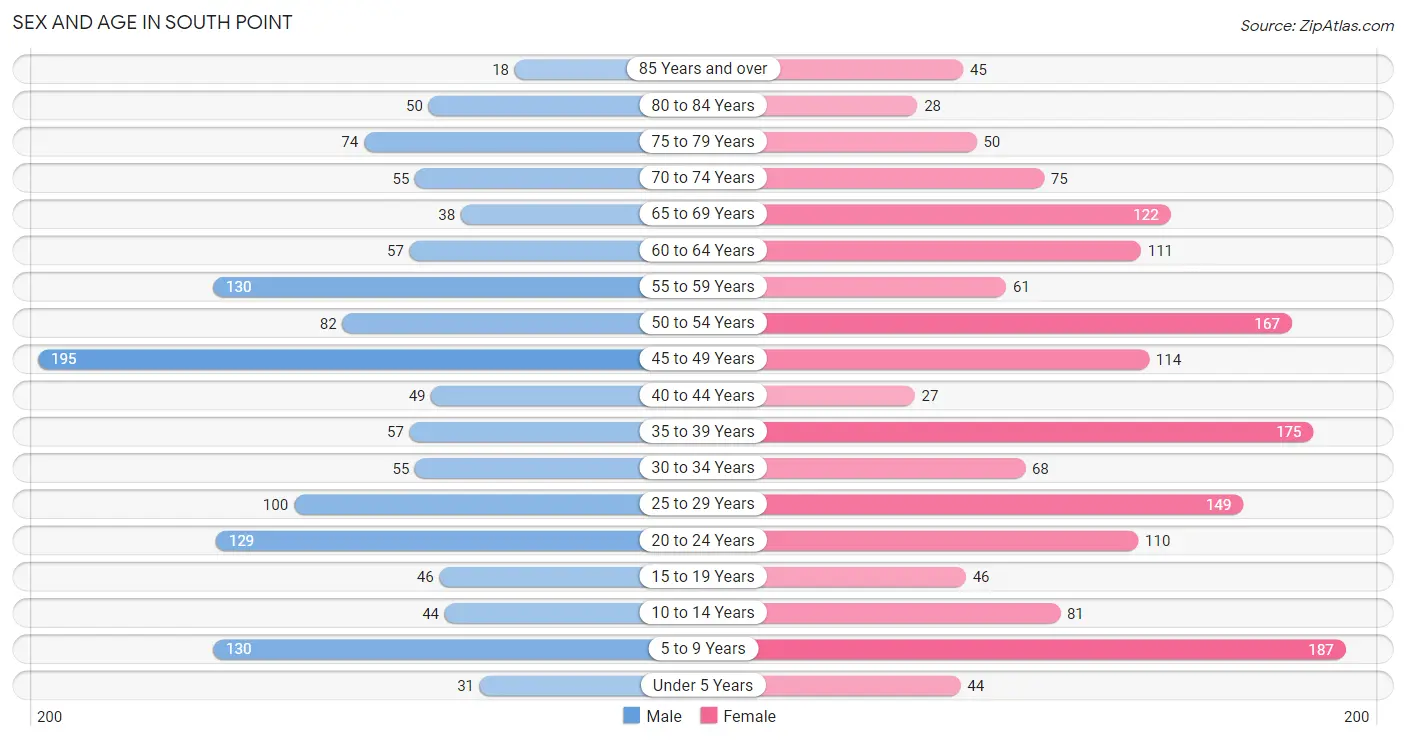
| Age Bracket | Male | Female |
| Under 5 Years | 31 (2.3%) | 44 (2.6%) |
| 5 to 9 Years | 130 (9.7%) | 187 (11.3%) |
| 10 to 14 Years | 44 (3.3%) | 81 (4.9%) |
| 15 to 19 Years | 46 (3.4%) | 46 (2.8%) |
| 20 to 24 Years | 129 (9.6%) | 110 (6.6%) |
| 25 to 29 Years | 100 (7.5%) | 149 (9.0%) |
| 30 to 34 Years | 55 (4.1%) | 68 (4.1%) |
| 35 to 39 Years | 57 (4.3%) | 175 (10.5%) |
| 40 to 44 Years | 49 (3.7%) | 27 (1.6%) |
| 45 to 49 Years | 195 (14.5%) | 114 (6.9%) |
| 50 to 54 Years | 82 (6.1%) | 167 (10.1%) |
| 55 to 59 Years | 130 (9.7%) | 61 (3.7%) |
| 60 to 64 Years | 57 (4.3%) | 111 (6.7%) |
| 65 to 69 Years | 38 (2.8%) | 122 (7.3%) |
| 70 to 74 Years | 55 (4.1%) | 75 (4.5%) |
| 75 to 79 Years | 74 (5.5%) | 50 (3.0%) |
| 80 to 84 Years | 50 (3.7%) | 28 (1.7%) |
| 85 Years and over | 18 (1.3%) | 45 (2.7%) |
| Total | 1,340 (100.0%) | 1,660 (100.0%) |
Families and Households in South Point
Median Family Size in South Point
The median family size in South Point is 2.95 persons per family, with single male/father families (73 | 9.4%) accounting for the largest median family size of 3.33 persons per family. On the other hand, married-couple families (514 | 66.4%) represent the smallest median family size with 2.84 persons per family.
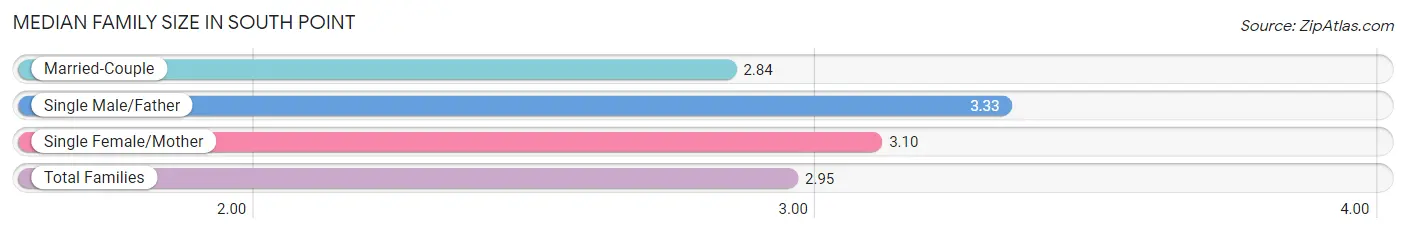
| Family Type | # Families | Family Size |
| Married-Couple | 514 (66.4%) | 2.84 |
| Single Male/Father | 73 (9.4%) | 3.33 |
| Single Female/Mother | 187 (24.2%) | 3.10 |
| Total Families | 774 (100.0%) | 2.95 |
Median Household Size in South Point
The median household size in South Point is 2.35 persons per household, with single male/father households (73 | 5.7%) accounting for the largest median household size of 3.71 persons per household. non-family households (503 | 39.4%) represent the smallest median household size with 1.22 persons per household.
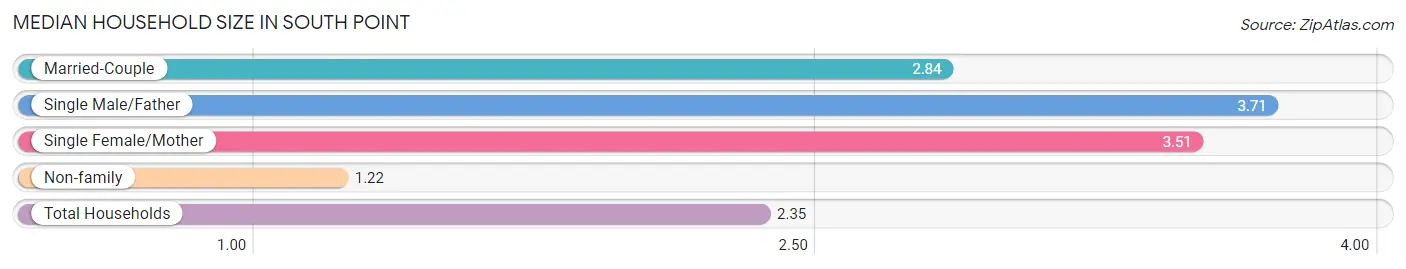
| Household Type | # Households | Household Size |
| Married-Couple | 514 (40.3%) | 2.84 |
| Single Male/Father | 73 (5.7%) | 3.71 |
| Single Female/Mother | 187 (14.6%) | 3.51 |
| Non-family | 503 (39.4%) | 1.22 |
| Total Households | 1,277 (100.0%) | 2.35 |
Household Size by Marriage Status in South Point
Out of a total of 1,277 households in South Point, 774 (60.6%) are family households, while 503 (39.4%) are nonfamily households. The most numerous type of family households are 2-person households, comprising 342, and the most common type of nonfamily households are 1-person households, comprising 379.
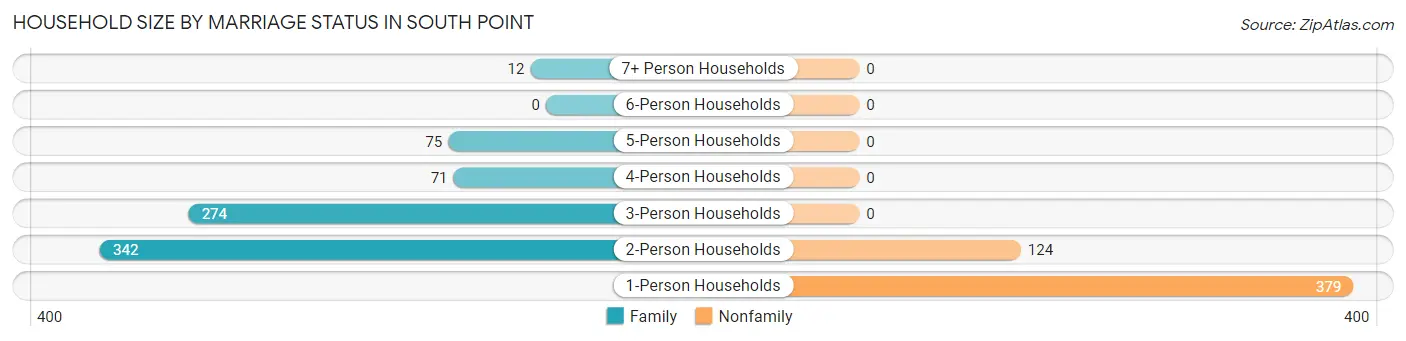
| Household Size | Family Households | Nonfamily Households |
| 1-Person Households | - | 379 (29.7%) |
| 2-Person Households | 342 (26.8%) | 124 (9.7%) |
| 3-Person Households | 274 (21.5%) | 0 (0.0%) |
| 4-Person Households | 71 (5.6%) | 0 (0.0%) |
| 5-Person Households | 75 (5.9%) | 0 (0.0%) |
| 6-Person Households | 0 (0.0%) | 0 (0.0%) |
| 7+ Person Households | 12 (0.9%) | 0 (0.0%) |
| Total | 774 (60.6%) | 503 (39.4%) |
Female Fertility in South Point
Fertility by Age in South Point
| Age Bracket | Women with Births | Births / 1,000 Women |
| 15 to 19 years | 0 (0.0%) | 0.0 |
| 20 to 34 years | 0 (0.0%) | 0.0 |
| 35 to 50 years | 0 (0.0%) | 0.0 |
| Total | 0 (0.0%) | 0.0 |
Fertility by Age by Marriage Status in South Point
| Age Bracket | Married | Unmarried |
| 15 to 19 years | 0 (0.0%) | 0 (0.0%) |
| 20 to 34 years | 0 (0.0%) | 0 (0.0%) |
| 35 to 50 years | 0 (0.0%) | 0 (0.0%) |
| Total | 0 (0.0%) | 0 (0.0%) |
Fertility by Education in South Point
| Educational Attainment | Women with Births | Births / 1,000 Women |
| Less than High School | 0 (0.0%) | 0.0 |
| High School Diploma | 0 (0.0%) | 0.0 |
| College or Associate's Degree | 0 (0.0%) | 0.0 |
| Bachelor's Degree | 0 (0.0%) | 0.0 |
| Graduate Degree | 0 (0.0%) | 0.0 |
| Total | 0 (0.0%) | 0.0 |
Fertility by Education by Marriage Status in South Point
| Educational Attainment | Married | Unmarried |
| Less than High School | 0 (0.0%) | 0 (0.0%) |
| High School Diploma | 0 (0.0%) | 0 (0.0%) |
| College or Associate's Degree | 0 (0.0%) | 0 (0.0%) |
| Bachelor's Degree | 0 (0.0%) | 0 (0.0%) |
| Graduate Degree | 0 (0.0%) | 0 (0.0%) |
| Total | 0 (0.0%) | 0 (0.0%) |
Income in South Point
Income Overview in South Point
Per Capita Income in South Point is $39,687, while median incomes of families and households are $94,107 and $76,344 respectively.
| Characteristic | Number | Measure |
| Per Capita Income | 3,000 | $39,687 |
| Median Family Income | 774 | $94,107 |
| Mean Family Income | 774 | $116,675 |
| Median Household Income | 1,277 | $76,344 |
| Mean Household Income | 1,277 | $92,800 |
| Income Deficit | 774 | $0 |
| Wage / Income Gap (%) | 3,000 | 16.28% |
| Wage / Income Gap ($) | 3,000 | 83.72¢ per $1 |
| Gini / Inequality Index | 3,000 | 0.44 |
Earnings by Sex in South Point
Average Earnings in South Point are $45,116, $47,181 for men and $39,500 for women, a difference of 16.3%.
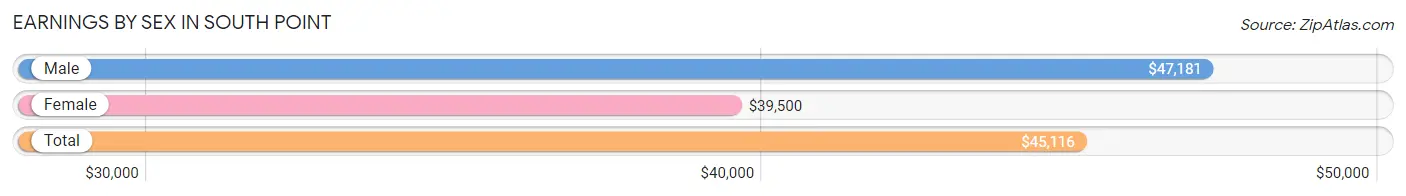
| Sex | Number | Average Earnings |
| Male | 806 (48.8%) | $47,181 |
| Female | 844 (51.1%) | $39,500 |
| Total | 1,650 (100.0%) | $45,116 |
Earnings by Sex by Income Bracket in South Point
The most common earnings brackets in South Point are $75,000 to $99,999 for men (149 | 18.5%) and $65,000 to $74,999 for women (118 | 14.0%).
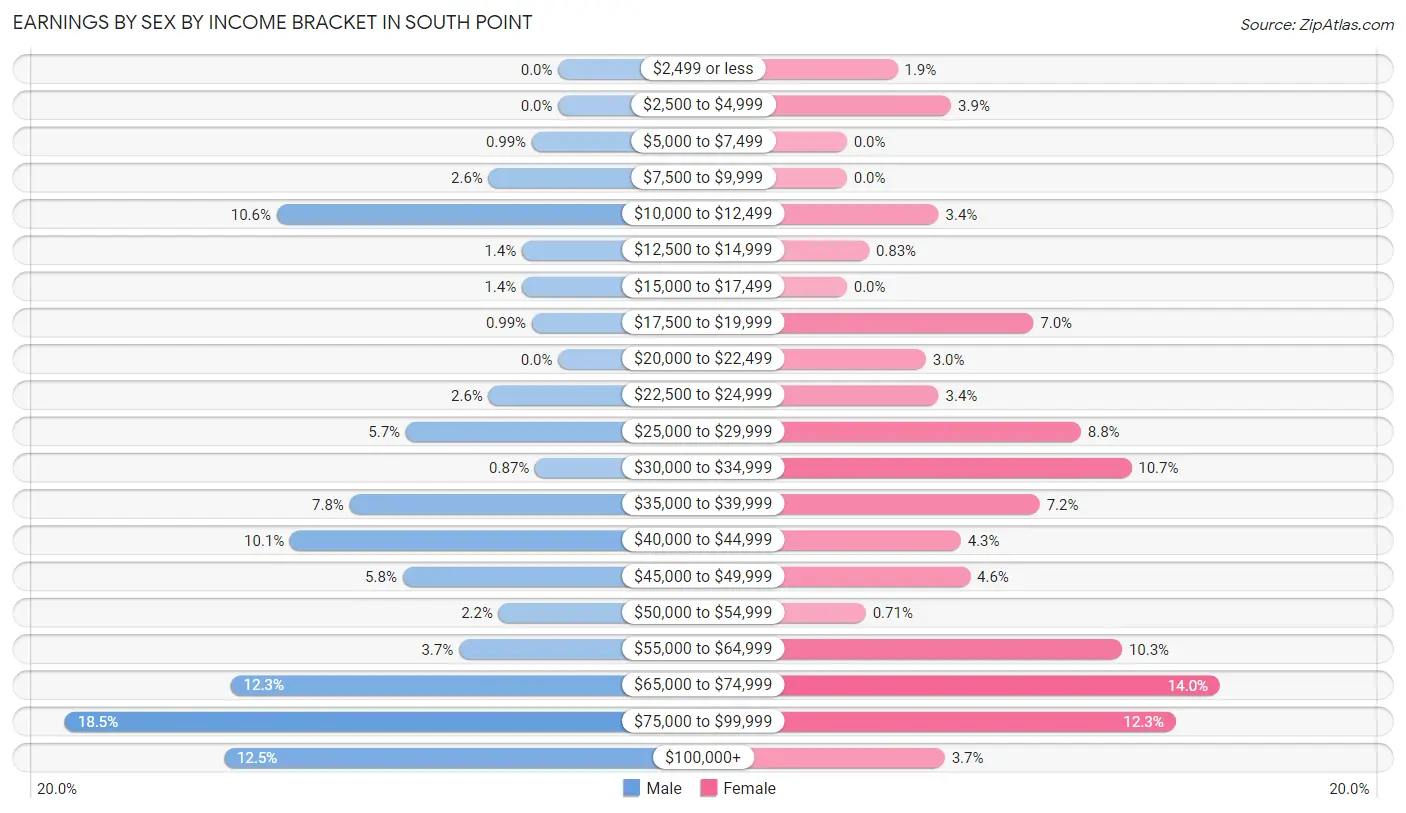
| Income | Male | Female |
| $2,499 or less | 0 (0.0%) | 16 (1.9%) |
| $2,500 to $4,999 | 0 (0.0%) | 33 (3.9%) |
| $5,000 to $7,499 | 8 (1.0%) | 0 (0.0%) |
| $7,500 to $9,999 | 21 (2.6%) | 0 (0.0%) |
| $10,000 to $12,499 | 85 (10.5%) | 29 (3.4%) |
| $12,500 to $14,999 | 11 (1.4%) | 7 (0.8%) |
| $15,000 to $17,499 | 11 (1.4%) | 0 (0.0%) |
| $17,500 to $19,999 | 8 (1.0%) | 59 (7.0%) |
| $20,000 to $22,499 | 0 (0.0%) | 25 (3.0%) |
| $22,500 to $24,999 | 21 (2.6%) | 29 (3.4%) |
| $25,000 to $29,999 | 46 (5.7%) | 74 (8.8%) |
| $30,000 to $34,999 | 7 (0.9%) | 90 (10.7%) |
| $35,000 to $39,999 | 63 (7.8%) | 61 (7.2%) |
| $40,000 to $44,999 | 81 (10.1%) | 36 (4.3%) |
| $45,000 to $49,999 | 47 (5.8%) | 39 (4.6%) |
| $50,000 to $54,999 | 18 (2.2%) | 6 (0.7%) |
| $55,000 to $64,999 | 30 (3.7%) | 87 (10.3%) |
| $65,000 to $74,999 | 99 (12.3%) | 118 (14.0%) |
| $75,000 to $99,999 | 149 (18.5%) | 104 (12.3%) |
| $100,000+ | 101 (12.5%) | 31 (3.7%) |
| Total | 806 (100.0%) | 844 (100.0%) |
Earnings by Sex by Educational Attainment in South Point
Average earnings in South Point are $67,847 for men and $45,673 for women, a difference of 32.7%. Men with an educational attainment of bachelor's degree enjoy the highest average annual earnings of $90,305, while those with college or associate's degree education earn the least with $45,433. Women with an educational attainment of bachelor's degree earn the most with the average annual earnings of $69,980, while those with high school diploma education have the smallest earnings of $21,350.
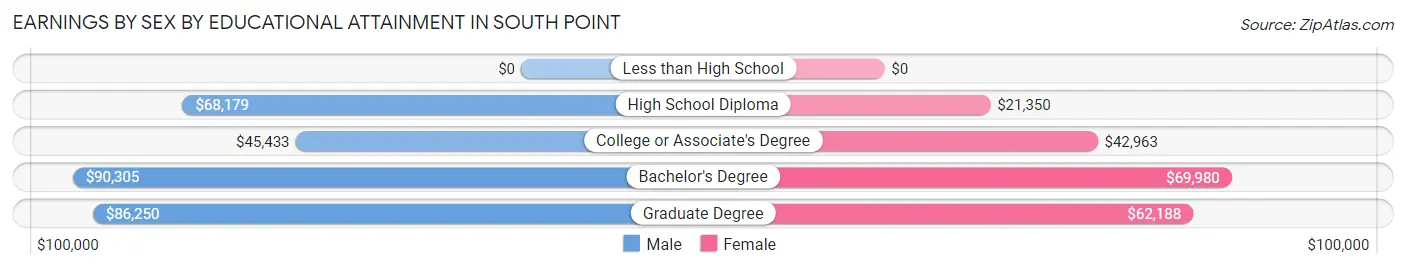
| Educational Attainment | Male Income | Female Income |
| Less than High School | - | - |
| High School Diploma | $68,179 | $21,350 |
| College or Associate's Degree | $45,433 | $42,963 |
| Bachelor's Degree | $90,305 | $69,980 |
| Graduate Degree | $86,250 | $62,188 |
| Total | $67,847 | $45,673 |
Family Income in South Point
Family Income Brackets in South Point
According to the South Point family income data, there are 184 families falling into the $100,000 to $149,999 income range, which is the most common income bracket and makes up 23.8% of all families.
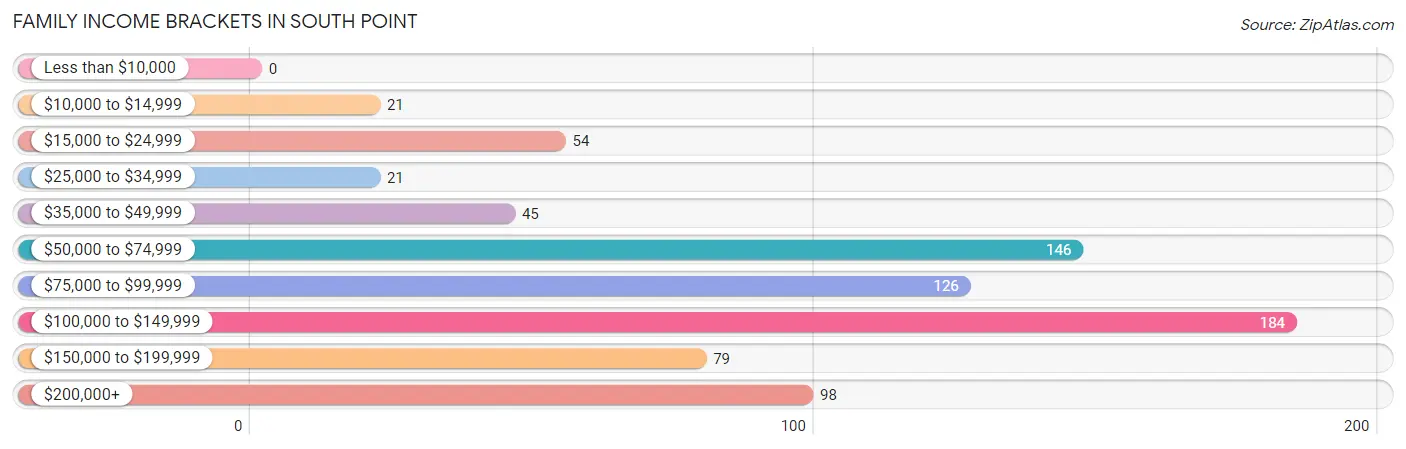
| Income Bracket | # Families | % Families |
| Less than $10,000 | 0 | 0.0% |
| $10,000 to $14,999 | 21 | 2.7% |
| $15,000 to $24,999 | 54 | 7.0% |
| $25,000 to $34,999 | 21 | 2.7% |
| $35,000 to $49,999 | 45 | 5.8% |
| $50,000 to $74,999 | 146 | 18.9% |
| $75,000 to $99,999 | 126 | 16.3% |
| $100,000 to $149,999 | 184 | 23.8% |
| $150,000 to $199,999 | 79 | 10.2% |
| $200,000+ | 98 | 12.7% |
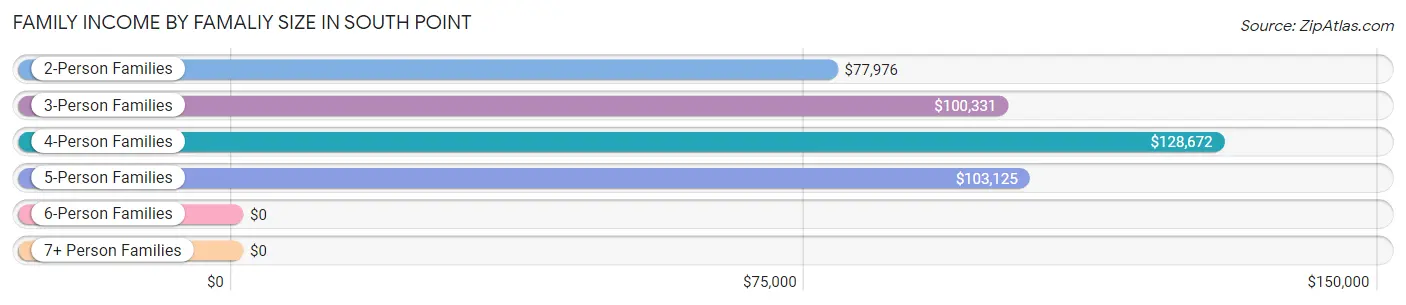
Family Income by Famaliy Size in South Point
4-person families (75 | 9.7%) account for the highest median family income in South Point with $128,672 per family, while 2-person families (396 | 51.2%) have the highest median income of $38,988 per family member.
| Income Bracket | # Families | Median Income |
| 2-Person Families | 396 (51.2%) | $77,976 |
| 3-Person Families | 237 (30.6%) | $100,331 |
| 4-Person Families | 75 (9.7%) | $128,672 |
| 5-Person Families | 54 (7.0%) | $103,125 |
| 6-Person Families | 0 (0.0%) | $0 |
| 7+ Person Families | 12 (1.5%) | $0 |
| Total | 774 (100.0%) | $94,107 |
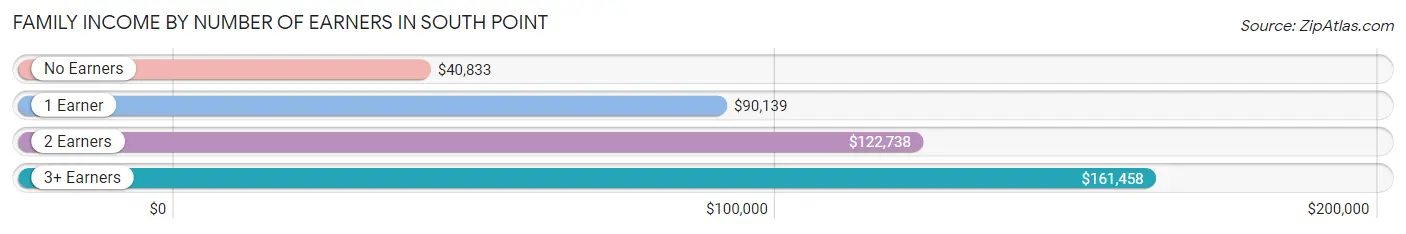
Family Income by Number of Earners in South Point
The median family income in South Point is $94,107, with families comprising 3+ earners (29) having the highest median family income of $161,458, while families with no earners (150) have the lowest median family income of $40,833, accounting for 3.7% and 19.4% of families, respectively.
| Number of Earners | # Families | Median Income |
| No Earners | 150 (19.4%) | $40,833 |
| 1 Earner | 237 (30.6%) | $90,139 |
| 2 Earners | 358 (46.3%) | $122,738 |
| 3+ Earners | 29 (3.7%) | $161,458 |
| Total | 774 (100.0%) | $94,107 |
Household Income in South Point
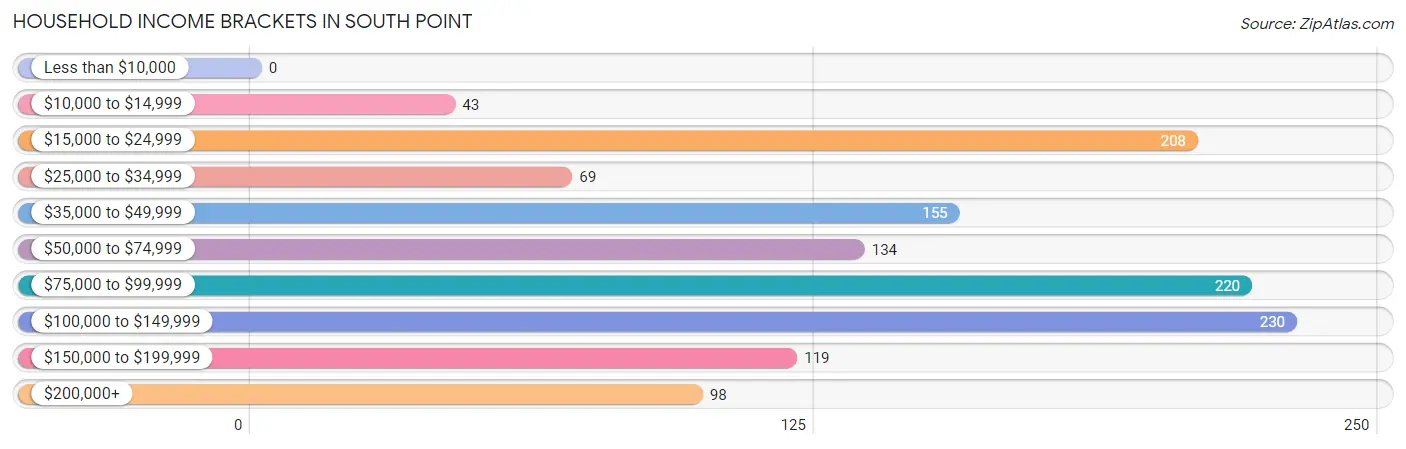
Household Income Brackets in South Point
With 230 households falling in the category, the $100,000 to $149,999 income range is the most frequent in South Point, accounting for 18.0% of all households.
| Income Bracket | # Households | % Households |
| Less than $10,000 | 0 | 0.0% |
| $10,000 to $14,999 | 43 | 3.4% |
| $15,000 to $24,999 | 208 | 16.3% |
| $25,000 to $34,999 | 69 | 5.4% |
| $35,000 to $49,999 | 155 | 12.1% |
| $50,000 to $74,999 | 134 | 10.5% |
| $75,000 to $99,999 | 220 | 17.2% |
| $100,000 to $149,999 | 230 | 18.0% |
| $150,000 to $199,999 | 119 | 9.3% |
| $200,000+ | 98 | 7.7% |
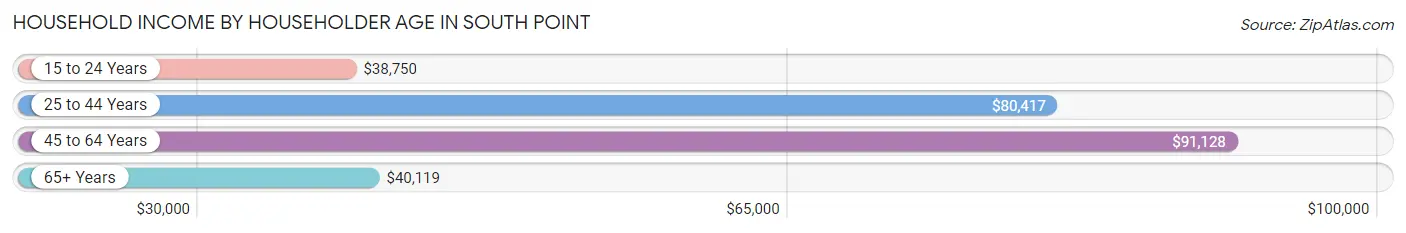
Household Income by Householder Age in South Point
The median household income in South Point is $76,344, with the highest median household income of $91,128 found in the 45 to 64 years age bracket for the primary householder. A total of 535 households (41.9%) fall into this category. Meanwhile, the 15 to 24 years age bracket for the primary householder has the lowest median household income of $38,750, with 32 households (2.5%) in this group.
| Income Bracket | # Households | Median Income |
| 15 to 24 Years | 32 (2.5%) | $38,750 |
| 25 to 44 Years | 340 (26.6%) | $80,417 |
| 45 to 64 Years | 535 (41.9%) | $91,128 |
| 65+ Years | 370 (29.0%) | $40,119 |
| Total | 1,277 (100.0%) | $76,344 |
Poverty in South Point
Income Below Poverty by Sex and Age in South Point
With 11.5% poverty level for males and 11.6% for females among the residents of South Point, 12 to 14 year old males and 15 year old females are the most vulnerable to poverty, with 12 males (27.3%) and 10 females (100.0%) in their respective age groups living below the poverty level.
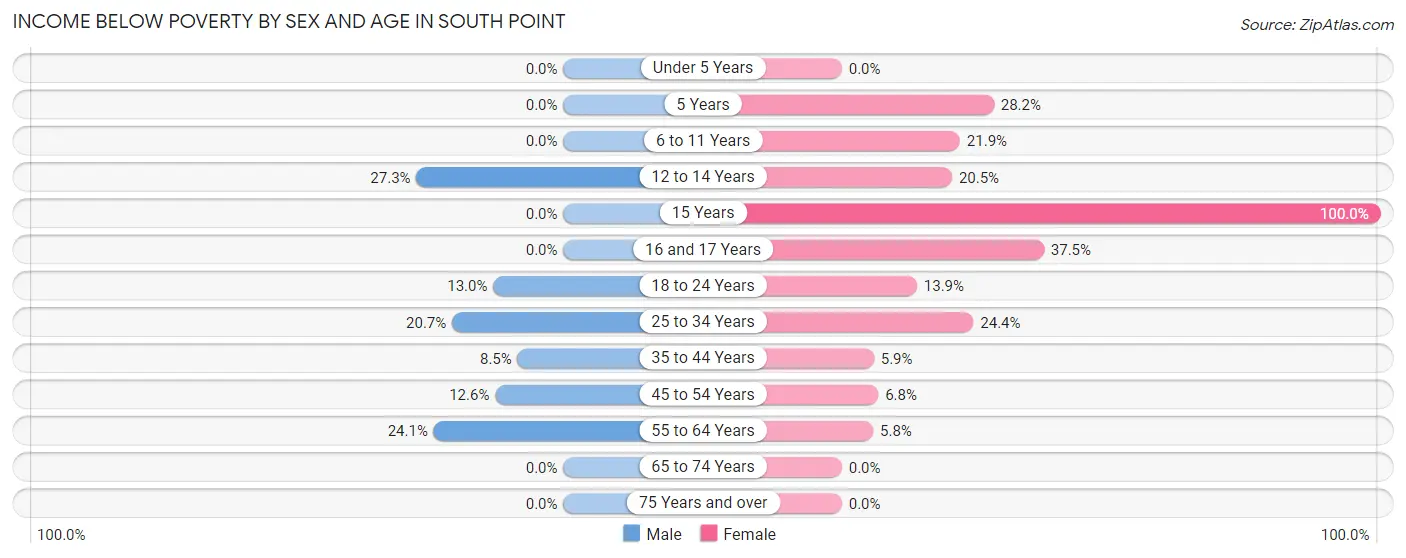
| Age Bracket | Male | Female |
| Under 5 Years | 0 (0.0%) | 0 (0.0%) |
| 5 Years | 0 (0.0%) | 22 (28.2%) |
| 6 to 11 Years | 0 (0.0%) | 32 (21.9%) |
| 12 to 14 Years | 12 (27.3%) | 9 (20.4%) |
| 15 Years | 0 (0.0%) | 10 (100.0%) |
| 16 and 17 Years | 0 (0.0%) | 9 (37.5%) |
| 18 to 24 Years | 19 (13.0%) | 17 (13.9%) |
| 25 to 34 Years | 32 (20.6%) | 53 (24.4%) |
| 35 to 44 Years | 9 (8.5%) | 12 (5.9%) |
| 45 to 54 Years | 35 (12.6%) | 19 (6.8%) |
| 55 to 64 Years | 45 (24.1%) | 10 (5.8%) |
| 65 to 74 Years | 0 (0.0%) | 0 (0.0%) |
| 75 Years and over | 0 (0.0%) | 0 (0.0%) |
| Total | 152 (11.5%) | 193 (11.6%) |
Income Above Poverty by Sex and Age in South Point
According to the poverty statistics in South Point, males aged under 5 years and females aged under 5 years are the age groups that are most secure financially, with 100.0% of males and 100.0% of females in these age groups living above the poverty line.
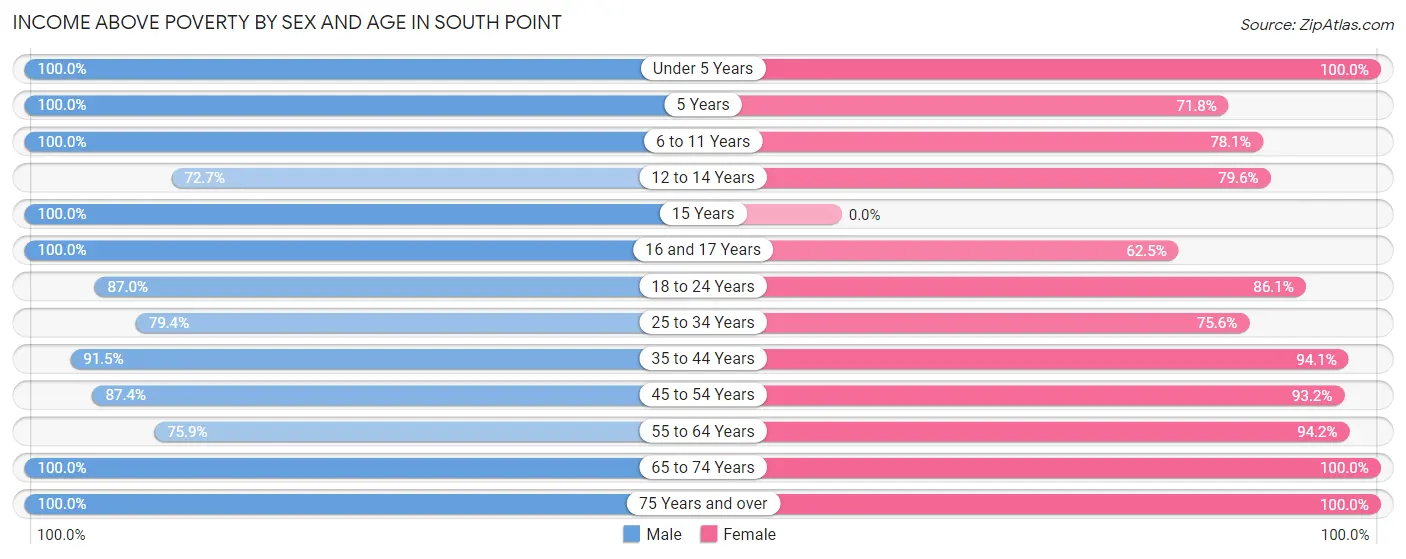
| Age Bracket | Male | Female |
| Under 5 Years | 11 (100.0%) | 44 (100.0%) |
| 5 Years | 46 (100.0%) | 56 (71.8%) |
| 6 to 11 Years | 84 (100.0%) | 114 (78.1%) |
| 12 to 14 Years | 32 (72.7%) | 35 (79.5%) |
| 15 Years | 20 (100.0%) | 0 (0.0%) |
| 16 and 17 Years | 9 (100.0%) | 15 (62.5%) |
| 18 to 24 Years | 127 (87.0%) | 105 (86.1%) |
| 25 to 34 Years | 123 (79.3%) | 164 (75.6%) |
| 35 to 44 Years | 97 (91.5%) | 190 (94.1%) |
| 45 to 54 Years | 242 (87.4%) | 262 (93.2%) |
| 55 to 64 Years | 142 (75.9%) | 162 (94.2%) |
| 65 to 74 Years | 93 (100.0%) | 197 (100.0%) |
| 75 Years and over | 142 (100.0%) | 123 (100.0%) |
| Total | 1,168 (88.5%) | 1,467 (88.4%) |
Income Below Poverty Among Married-Couple Families in South Point
The poverty statistics for married-couple families in South Point show that 1.9% or 10 of the total 514 families live below the poverty line. Families with no children have the highest poverty rate of 2.9%, comprising of 10 families. On the other hand, families with 1 or 2 children have the lowest poverty rate of 0.0%, which includes 0 families.
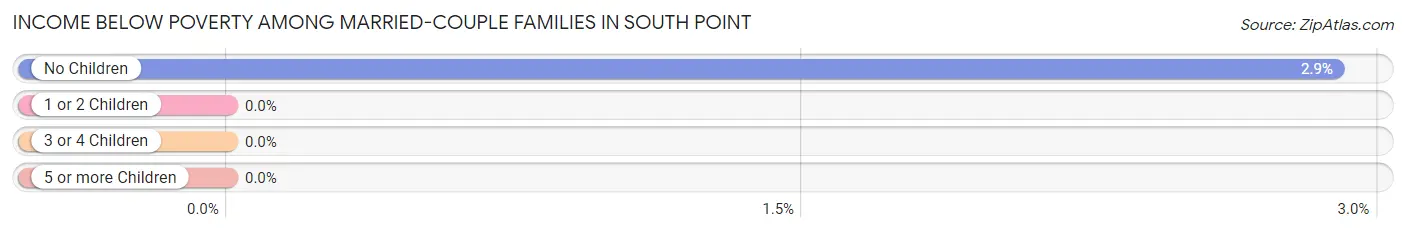
| Children | Above Poverty | Below Poverty |
| No Children | 336 (97.1%) | 10 (2.9%) |
| 1 or 2 Children | 157 (100.0%) | 0 (0.0%) |
| 3 or 4 Children | 11 (100.0%) | 0 (0.0%) |
| 5 or more Children | 0 (0.0%) | 0 (0.0%) |
| Total | 504 (98.1%) | 10 (1.9%) |
Income Below Poverty Among Single-Parent Households in South Point
According to the poverty data in South Point, 12.3% or 9 single-father households and 29.9% or 56 single-mother households are living below the poverty line. Among single-father households, those with 1 or 2 children have the highest poverty rate, with 9 households (20.9%) experiencing poverty. Likewise, among single-mother households, those with 1 or 2 children have the highest poverty rate, with 47 households (31.3%) falling below the poverty line.
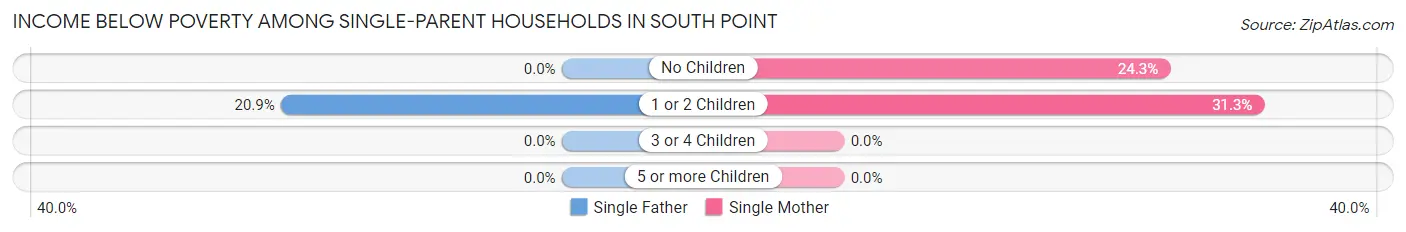
| Children | Single Father | Single Mother |
| No Children | 0 (0.0%) | 9 (24.3%) |
| 1 or 2 Children | 9 (20.9%) | 47 (31.3%) |
| 3 or 4 Children | 0 (0.0%) | 0 (0.0%) |
| 5 or more Children | 0 (0.0%) | 0 (0.0%) |
| Total | 9 (12.3%) | 56 (29.9%) |
Income Below Poverty Among Married-Couple vs Single-Parent Households in South Point
The poverty data for South Point shows that 10 of the married-couple family households (1.9%) and 65 of the single-parent households (25.0%) are living below the poverty level. Within the married-couple family households, those with no children have the highest poverty rate, with 10 households (2.9%) falling below the poverty line. Among the single-parent households, those with 1 or 2 children have the highest poverty rate, with 56 household (29.0%) living below poverty.
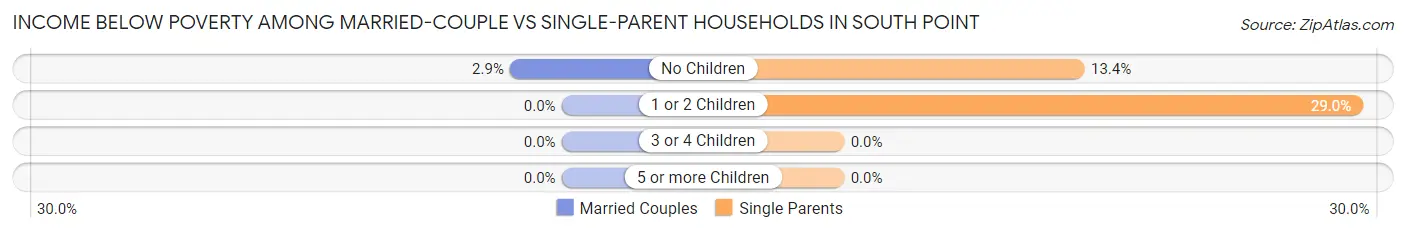
| Children | Married-Couple Families | Single-Parent Households |
| No Children | 10 (2.9%) | 9 (13.4%) |
| 1 or 2 Children | 0 (0.0%) | 56 (29.0%) |
| 3 or 4 Children | 0 (0.0%) | 0 (0.0%) |
| 5 or more Children | 0 (0.0%) | 0 (0.0%) |
| Total | 10 (1.9%) | 65 (25.0%) |
Employment Characteristics in South Point
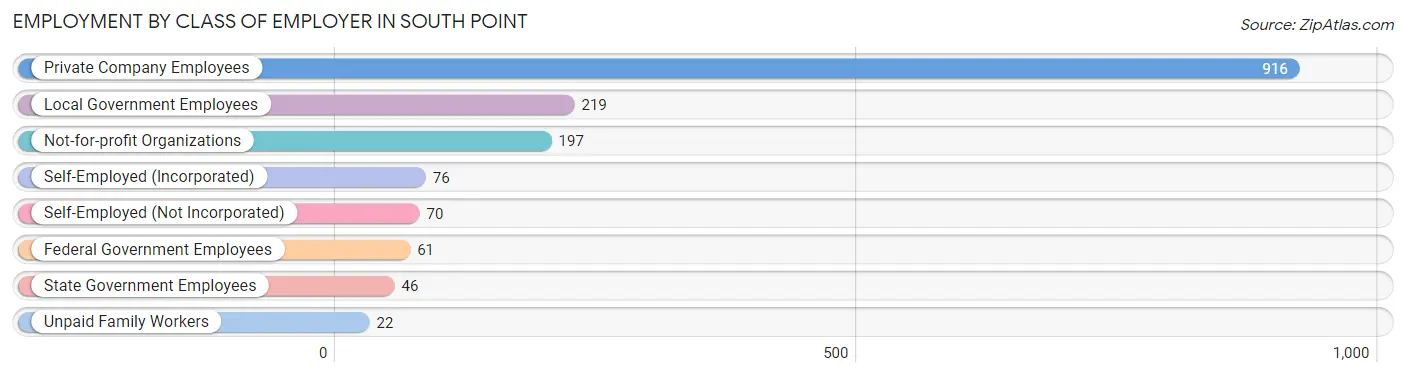
Employment by Class of Employer in South Point
Among the 1,607 employed individuals in South Point, private company employees (916 | 57.0%), local government employees (219 | 13.6%), and not-for-profit organizations (197 | 12.3%) make up the most common classes of employment.
| Employer Class | # Employees | % Employees |
| Private Company Employees | 916 | 57.0% |
| Self-Employed (Incorporated) | 76 | 4.7% |
| Self-Employed (Not Incorporated) | 70 | 4.4% |
| Not-for-profit Organizations | 197 | 12.3% |
| Local Government Employees | 219 | 13.6% |
| State Government Employees | 46 | 2.9% |
| Federal Government Employees | 61 | 3.8% |
| Unpaid Family Workers | 22 | 1.4% |
| Total | 1,607 | 100.0% |
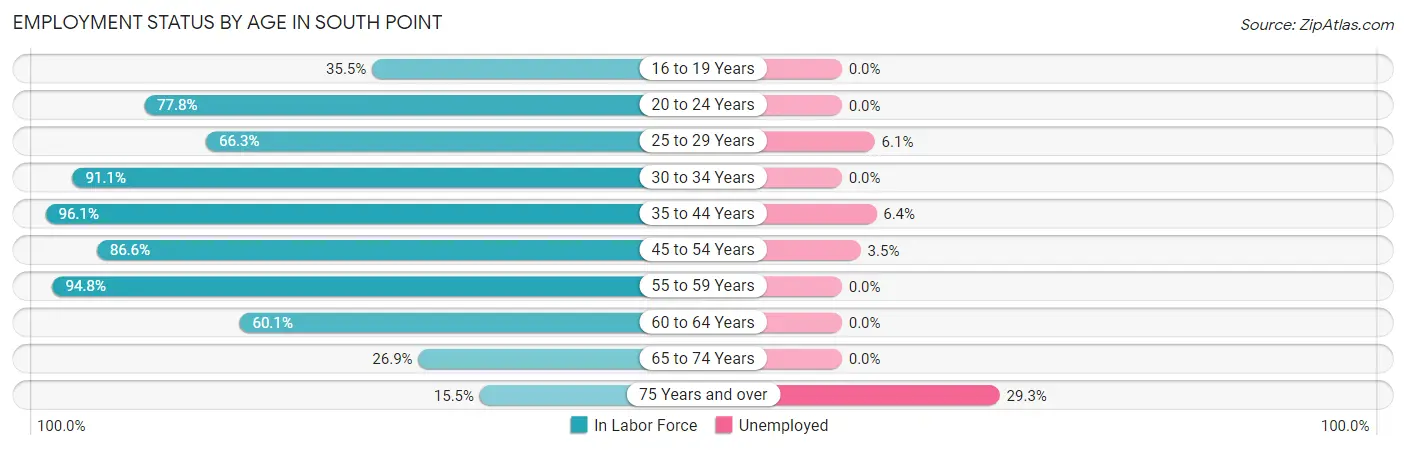
Employment Status by Age in South Point
According to the labor force statistics for South Point, out of the total population over 16 years of age (2,453), 67.9% or 1,666 individuals are in the labor force, with 3.5% or 58 of them unemployed. The age group with the highest labor force participation rate is 35 to 44 years, with 96.1% or 296 individuals in the labor force. Within the labor force, the 75 years and over age range has the highest percentage of unemployed individuals, with 29.3% or 12 of them being unemployed.
| Age Bracket | In Labor Force | Unemployed |
| 16 to 19 Years | 22 (35.5%) | 0 (0.0%) |
| 20 to 24 Years | 186 (77.8%) | 0 (0.0%) |
| 25 to 29 Years | 165 (66.3%) | 10 (6.1%) |
| 30 to 34 Years | 112 (91.1%) | 0 (0.0%) |
| 35 to 44 Years | 296 (96.1%) | 19 (6.4%) |
| 45 to 54 Years | 483 (86.6%) | 17 (3.5%) |
| 55 to 59 Years | 181 (94.8%) | 0 (0.0%) |
| 60 to 64 Years | 101 (60.1%) | 0 (0.0%) |
| 65 to 74 Years | 78 (26.9%) | 0 (0.0%) |
| 75 Years and over | 41 (15.5%) | 12 (29.3%) |
| Total | 1,666 (67.9%) | 58 (3.5%) |
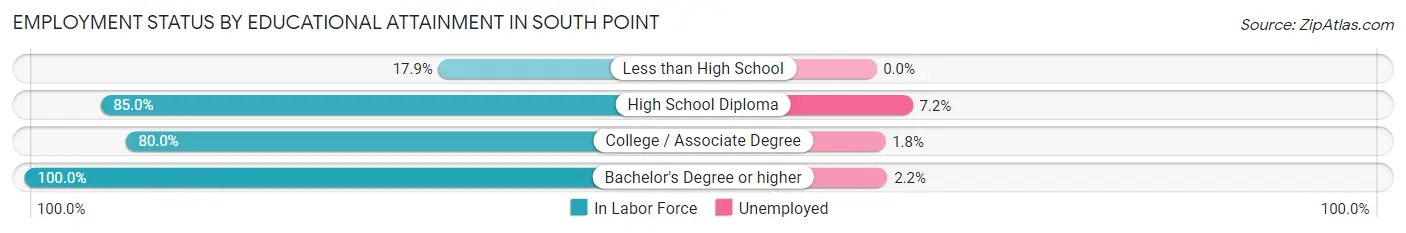
Employment Status by Educational Attainment in South Point
According to labor force statistics for South Point, 83.8% of individuals (1,338) out of the total population between 25 and 64 years of age (1,597) are in the labor force, with 3.4% or 45 of them being unemployed. The group with the highest labor force participation rate are those with the educational attainment of bachelor's degree or higher, with 100.0% or 453 individuals in the labor force. Within the labor force, individuals with high school diploma education have the highest percentage of unemployment, with 7.2% or 27 of them being unemployed.
| Educational Attainment | In Labor Force | Unemployed |
| Less than High School | 15 (17.9%) | 0 (0.0%) |
| High School Diploma | 373 (85.0%) | 32 (7.2%) |
| College / Associate Degree | 497 (80.0%) | 11 (1.8%) |
| Bachelor's Degree or higher | 453 (100.0%) | 10 (2.2%) |
| Total | 1,338 (83.8%) | 54 (3.4%) |
Employment Occupations by Sex in South Point
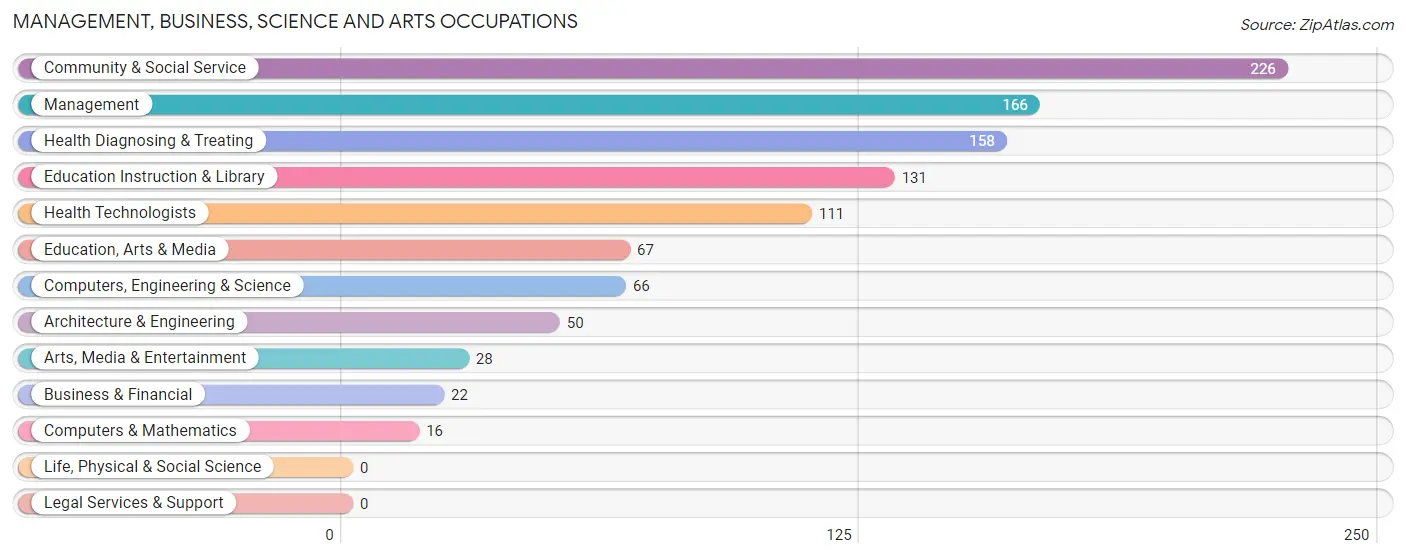
Management, Business, Science and Arts Occupations
The most common Management, Business, Science and Arts occupations in South Point are Community & Social Service (226 | 14.1%), Management (166 | 10.3%), Health Diagnosing & Treating (158 | 9.8%), Education Instruction & Library (131 | 8.2%), and Health Technologists (111 | 6.9%).
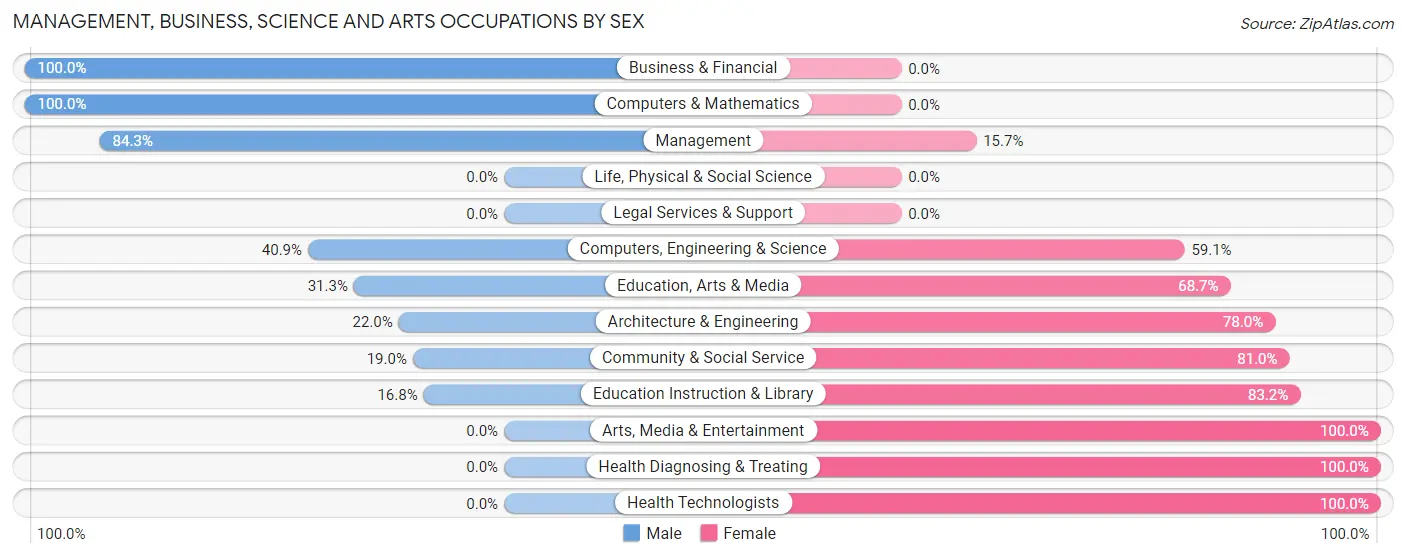
Management, Business, Science and Arts Occupations by Sex
Within the Management, Business, Science and Arts occupations in South Point, the most male-oriented occupations are Business & Financial (100.0%), Computers & Mathematics (100.0%), and Management (84.3%), while the most female-oriented occupations are Arts, Media & Entertainment (100.0%), Health Diagnosing & Treating (100.0%), and Health Technologists (100.0%).
| Occupation | Male | Female |
| Management | 140 (84.3%) | 26 (15.7%) |
| Business & Financial | 22 (100.0%) | 0 (0.0%) |
| Computers, Engineering & Science | 27 (40.9%) | 39 (59.1%) |
| Computers & Mathematics | 16 (100.0%) | 0 (0.0%) |
| Architecture & Engineering | 11 (22.0%) | 39 (78.0%) |
| Life, Physical & Social Science | 0 (0.0%) | 0 (0.0%) |
| Community & Social Service | 43 (19.0%) | 183 (81.0%) |
| Education, Arts & Media | 21 (31.3%) | 46 (68.7%) |
| Legal Services & Support | 0 (0.0%) | 0 (0.0%) |
| Education Instruction & Library | 22 (16.8%) | 109 (83.2%) |
| Arts, Media & Entertainment | 0 (0.0%) | 28 (100.0%) |
| Health Diagnosing & Treating | 0 (0.0%) | 158 (100.0%) |
| Health Technologists | 0 (0.0%) | 111 (100.0%) |
| Total (Category) | 232 (36.4%) | 406 (63.6%) |
| Total (Overall) | 789 (49.1%) | 818 (50.9%) |
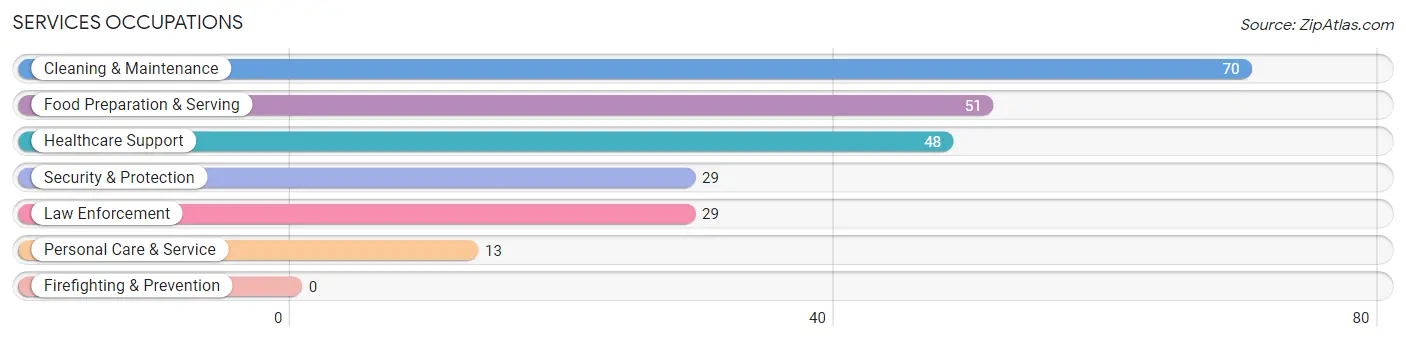
Services Occupations
The most common Services occupations in South Point are Cleaning & Maintenance (70 | 4.4%), Food Preparation & Serving (51 | 3.2%), Healthcare Support (48 | 3.0%), Security & Protection (29 | 1.8%), and Law Enforcement (29 | 1.8%).
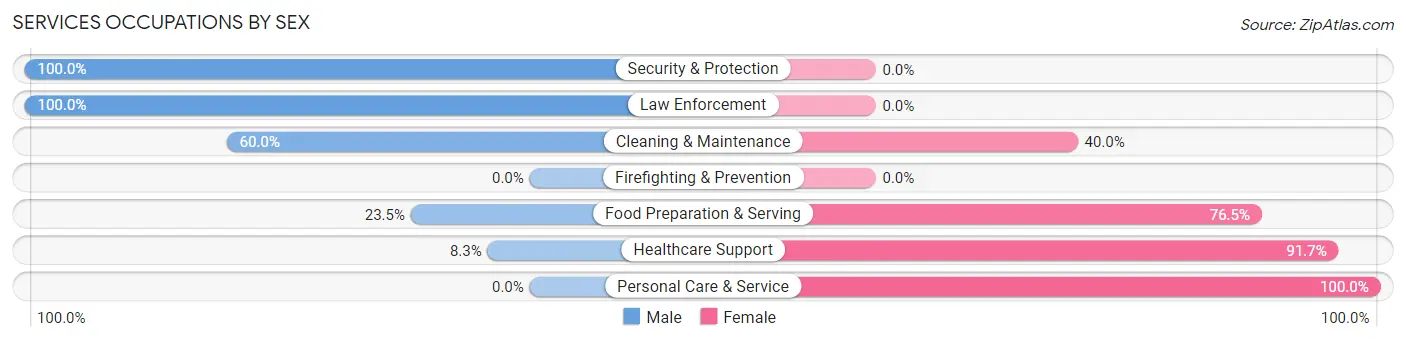
Services Occupations by Sex
Within the Services occupations in South Point, the most male-oriented occupations are Security & Protection (100.0%), Law Enforcement (100.0%), and Cleaning & Maintenance (60.0%), while the most female-oriented occupations are Personal Care & Service (100.0%), Healthcare Support (91.7%), and Food Preparation & Serving (76.5%).
| Occupation | Male | Female |
| Healthcare Support | 4 (8.3%) | 44 (91.7%) |
| Security & Protection | 29 (100.0%) | 0 (0.0%) |
| Firefighting & Prevention | 0 (0.0%) | 0 (0.0%) |
| Law Enforcement | 29 (100.0%) | 0 (0.0%) |
| Food Preparation & Serving | 12 (23.5%) | 39 (76.5%) |
| Cleaning & Maintenance | 42 (60.0%) | 28 (40.0%) |
| Personal Care & Service | 0 (0.0%) | 13 (100.0%) |
| Total (Category) | 87 (41.2%) | 124 (58.8%) |
| Total (Overall) | 789 (49.1%) | 818 (50.9%) |
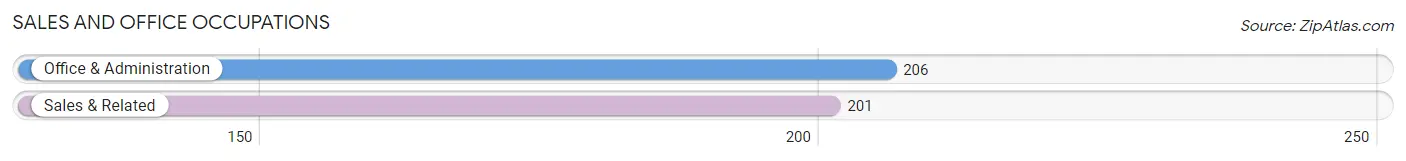
Sales and Office Occupations
The most common Sales and Office occupations in South Point are Office & Administration (206 | 12.8%), and Sales & Related (201 | 12.5%).
Sales and Office Occupations by Sex
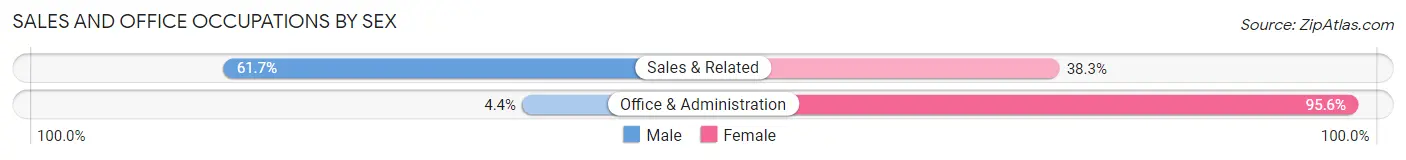
| Occupation | Male | Female |
| Sales & Related | 124 (61.7%) | 77 (38.3%) |
| Office & Administration | 9 (4.4%) | 197 (95.6%) |
| Total (Category) | 133 (32.7%) | 274 (67.3%) |
| Total (Overall) | 789 (49.1%) | 818 (50.9%) |
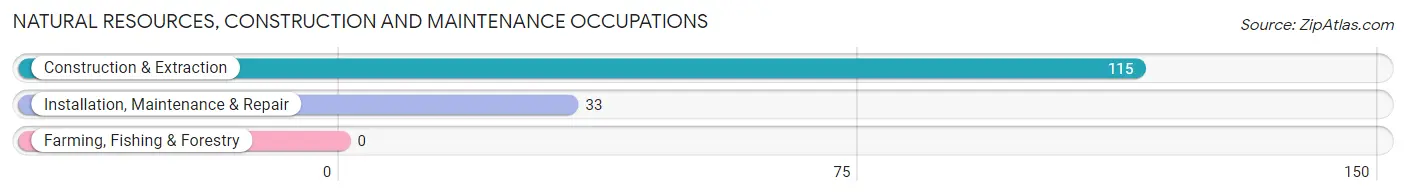
Natural Resources, Construction and Maintenance Occupations
The most common Natural Resources, Construction and Maintenance occupations in South Point are Construction & Extraction (115 | 7.2%), and Installation, Maintenance & Repair (33 | 2.1%).
Natural Resources, Construction and Maintenance Occupations by Sex
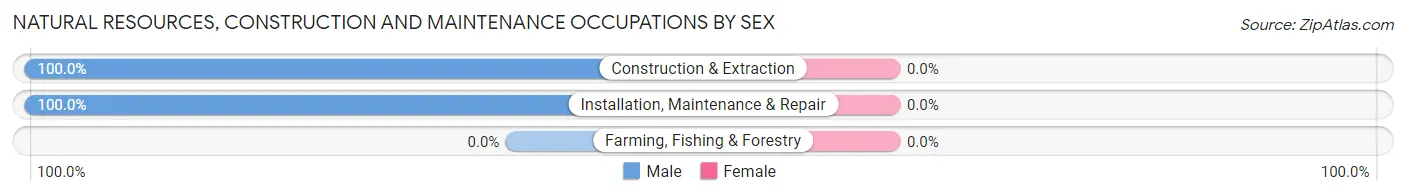
| Occupation | Male | Female |
| Farming, Fishing & Forestry | 0 (0.0%) | 0 (0.0%) |
| Construction & Extraction | 115 (100.0%) | 0 (0.0%) |
| Installation, Maintenance & Repair | 33 (100.0%) | 0 (0.0%) |
| Total (Category) | 148 (100.0%) | 0 (0.0%) |
| Total (Overall) | 789 (49.1%) | 818 (50.9%) |
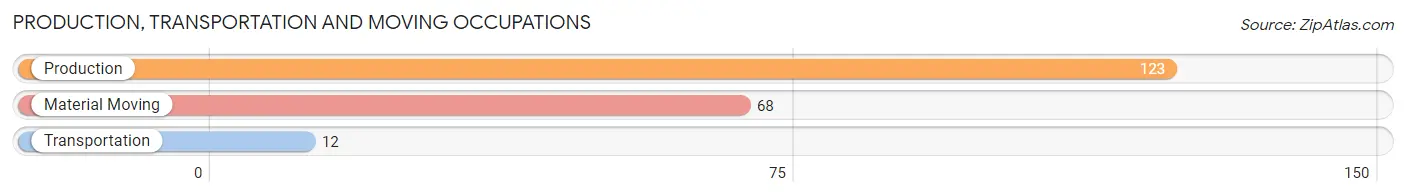
Production, Transportation and Moving Occupations
The most common Production, Transportation and Moving occupations in South Point are Production (123 | 7.6%), Material Moving (68 | 4.2%), and Transportation (12 | 0.7%).
Production, Transportation and Moving Occupations by Sex
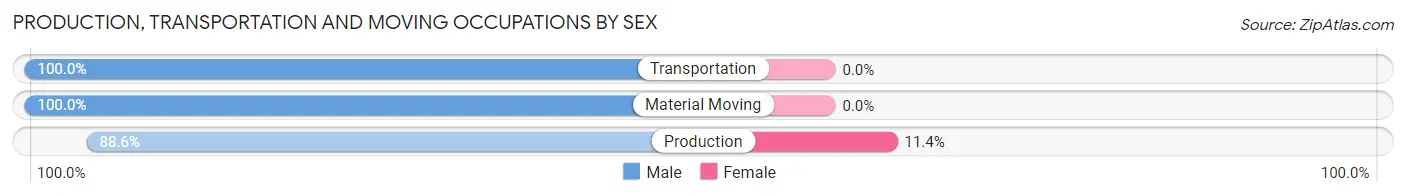
| Occupation | Male | Female |
| Production | 109 (88.6%) | 14 (11.4%) |
| Transportation | 12 (100.0%) | 0 (0.0%) |
| Material Moving | 68 (100.0%) | 0 (0.0%) |
| Total (Category) | 189 (93.1%) | 14 (6.9%) |
| Total (Overall) | 789 (49.1%) | 818 (50.9%) |
Employment Industries by Sex in South Point
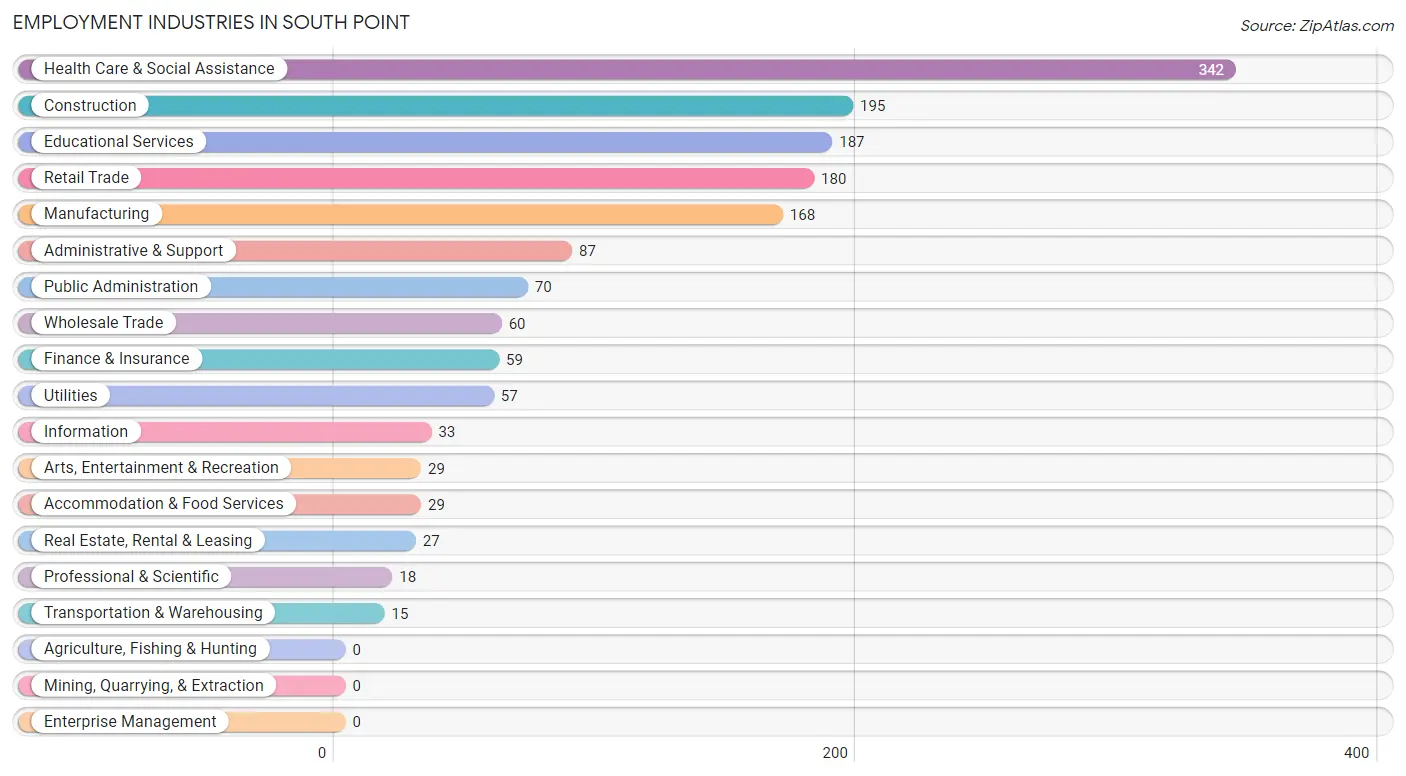
Employment Industries in South Point
The major employment industries in South Point include Health Care & Social Assistance (342 | 21.3%), Construction (195 | 12.1%), Educational Services (187 | 11.6%), Retail Trade (180 | 11.2%), and Manufacturing (168 | 10.4%).
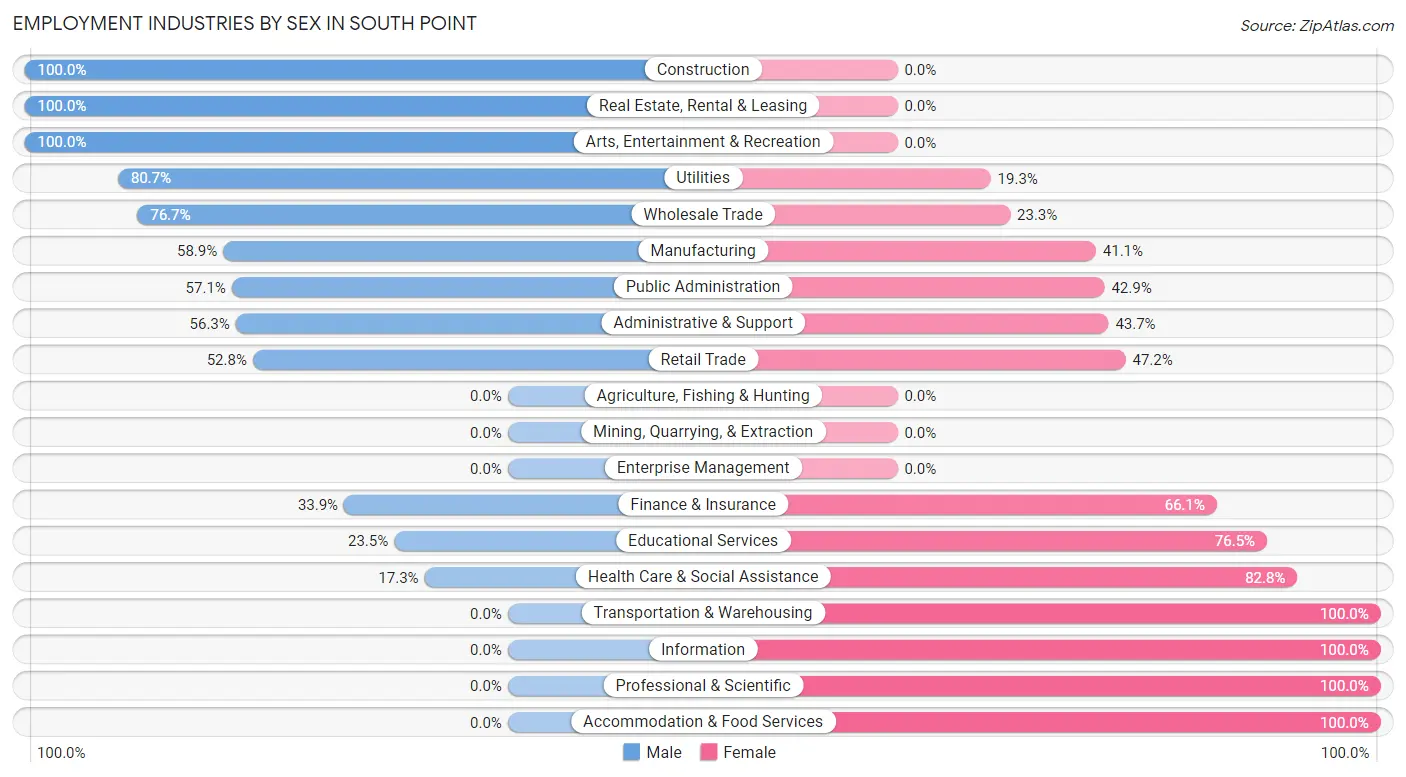
Employment Industries by Sex in South Point
The South Point industries that see more men than women are Construction (100.0%), Real Estate, Rental & Leasing (100.0%), and Arts, Entertainment & Recreation (100.0%), whereas the industries that tend to have a higher number of women are Transportation & Warehousing (100.0%), Information (100.0%), and Professional & Scientific (100.0%).
| Industry | Male | Female |
| Agriculture, Fishing & Hunting | 0 (0.0%) | 0 (0.0%) |
| Mining, Quarrying, & Extraction | 0 (0.0%) | 0 (0.0%) |
| Construction | 195 (100.0%) | 0 (0.0%) |
| Manufacturing | 99 (58.9%) | 69 (41.1%) |
| Wholesale Trade | 46 (76.7%) | 14 (23.3%) |
| Retail Trade | 95 (52.8%) | 85 (47.2%) |
| Transportation & Warehousing | 0 (0.0%) | 15 (100.0%) |
| Utilities | 46 (80.7%) | 11 (19.3%) |
| Information | 0 (0.0%) | 33 (100.0%) |
| Finance & Insurance | 20 (33.9%) | 39 (66.1%) |
| Real Estate, Rental & Leasing | 27 (100.0%) | 0 (0.0%) |
| Professional & Scientific | 0 (0.0%) | 18 (100.0%) |
| Enterprise Management | 0 (0.0%) | 0 (0.0%) |
| Administrative & Support | 49 (56.3%) | 38 (43.7%) |
| Educational Services | 44 (23.5%) | 143 (76.5%) |
| Health Care & Social Assistance | 59 (17.2%) | 283 (82.8%) |
| Arts, Entertainment & Recreation | 29 (100.0%) | 0 (0.0%) |
| Accommodation & Food Services | 0 (0.0%) | 29 (100.0%) |
| Public Administration | 40 (57.1%) | 30 (42.9%) |
| Total | 789 (49.1%) | 818 (50.9%) |
Education in South Point
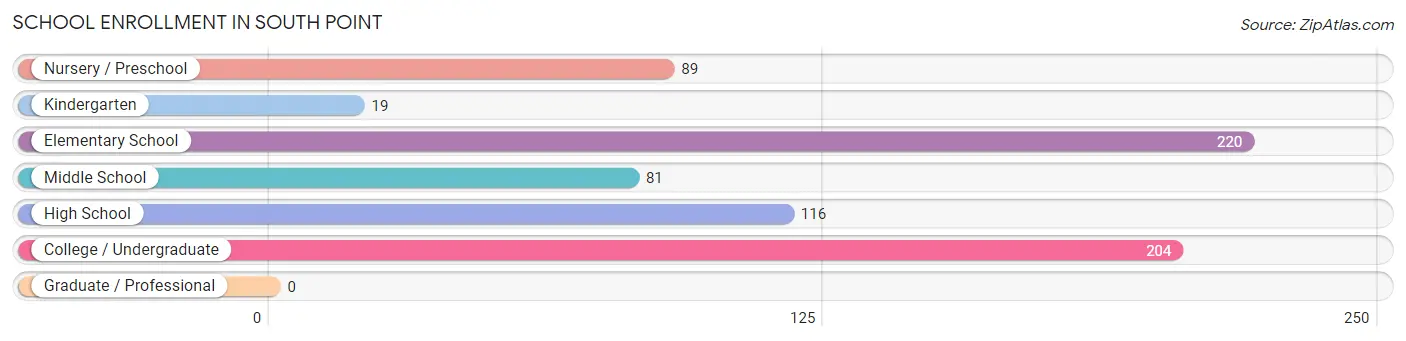
School Enrollment in South Point
The most common levels of schooling among the 729 students in South Point are elementary school (220 | 30.2%), college / undergraduate (204 | 28.0%), and high school (116 | 15.9%).
| School Level | # Students | % Students |
| Nursery / Preschool | 89 | 12.2% |
| Kindergarten | 19 | 2.6% |
| Elementary School | 220 | 30.2% |
| Middle School | 81 | 11.1% |
| High School | 116 | 15.9% |
| College / Undergraduate | 204 | 28.0% |
| Graduate / Professional | 0 | 0.0% |
| Total | 729 | 100.0% |
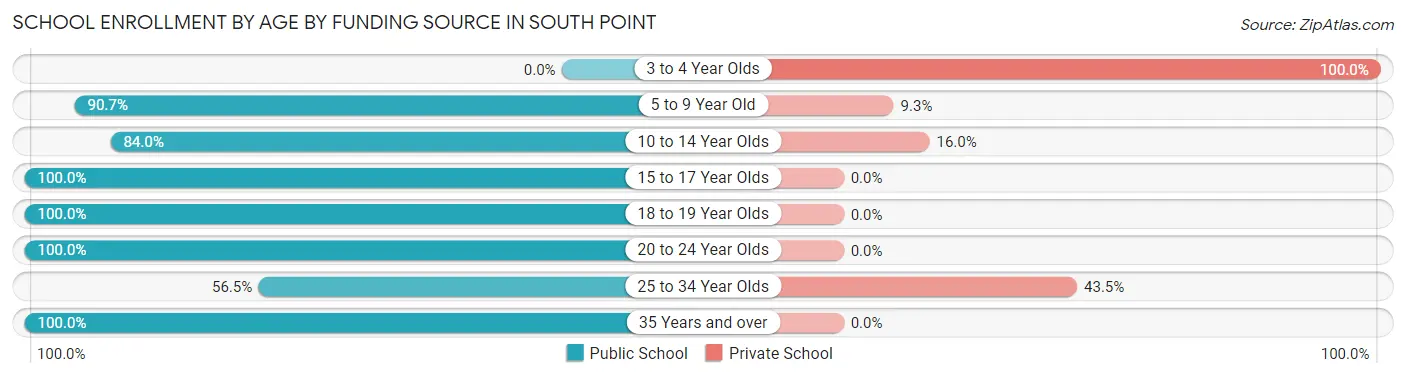
School Enrollment by Age by Funding Source in South Point
Out of a total of 729 students who are enrolled in schools in South Point, 68 (9.3%) attend a private institution, while the remaining 661 (90.7%) are enrolled in public schools. The age group of 3 to 4 year olds has the highest likelihood of being enrolled in private schools, with 11 (100.0% in the age bracket) enrolled. Conversely, the age group of 15 to 17 year olds has the lowest likelihood of being enrolled in a private school, with 63 (100.0% in the age bracket) attending a public institution.
| Age Bracket | Public School | Private School |
| 3 to 4 Year Olds | 0 (0.0%) | 11 (100.0%) |
| 5 to 9 Year Old | 263 (90.7%) | 27 (9.3%) |
| 10 to 14 Year Olds | 105 (84.0%) | 20 (16.0%) |
| 15 to 17 Year Olds | 63 (100.0%) | 0 (0.0%) |
| 18 to 19 Year Olds | 16 (100.0%) | 0 (0.0%) |
| 20 to 24 Year Olds | 77 (100.0%) | 0 (0.0%) |
| 25 to 34 Year Olds | 13 (56.5%) | 10 (43.5%) |
| 35 Years and over | 124 (100.0%) | 0 (0.0%) |
| Total | 661 (90.7%) | 68 (9.3%) |
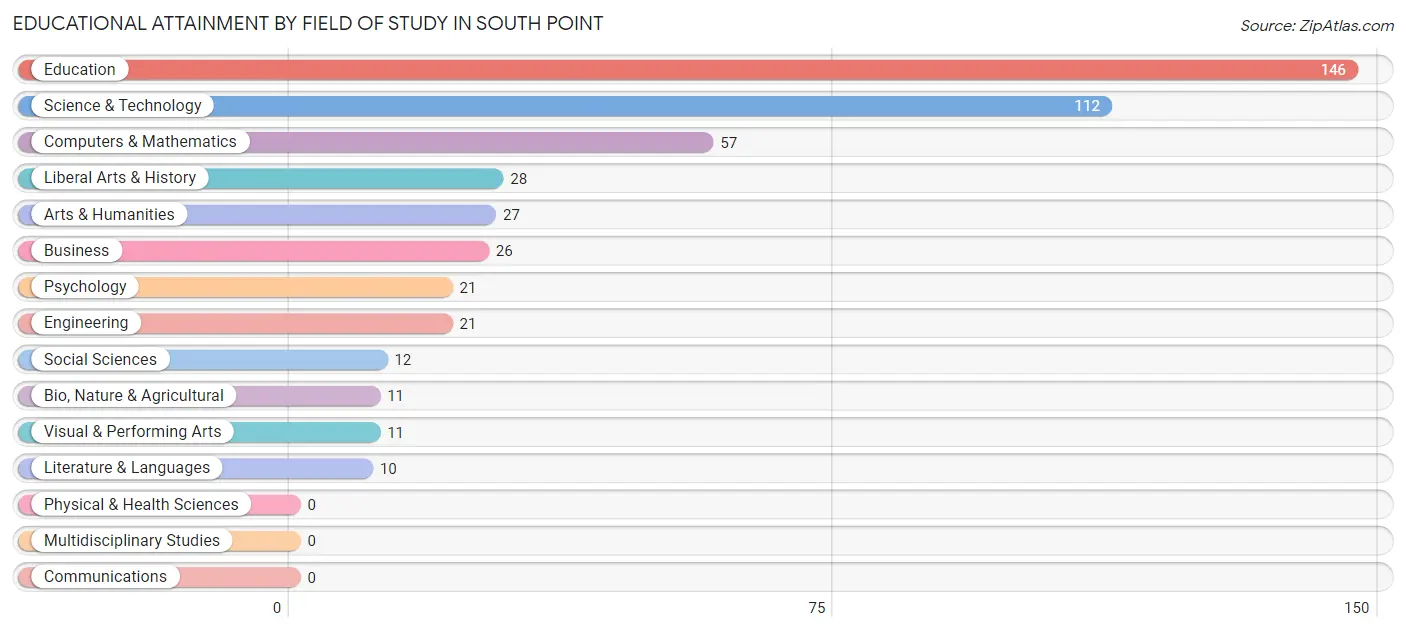
Educational Attainment by Field of Study in South Point
Education (146 | 30.3%), science & technology (112 | 23.2%), computers & mathematics (57 | 11.8%), liberal arts & history (28 | 5.8%), and arts & humanities (27 | 5.6%) are the most common fields of study among 482 individuals in South Point who have obtained a bachelor's degree or higher.
| Field of Study | # Graduates | % Graduates |
| Computers & Mathematics | 57 | 11.8% |
| Bio, Nature & Agricultural | 11 | 2.3% |
| Physical & Health Sciences | 0 | 0.0% |
| Psychology | 21 | 4.4% |
| Social Sciences | 12 | 2.5% |
| Engineering | 21 | 4.4% |
| Multidisciplinary Studies | 0 | 0.0% |
| Science & Technology | 112 | 23.2% |
| Business | 26 | 5.4% |
| Education | 146 | 30.3% |
| Literature & Languages | 10 | 2.1% |
| Liberal Arts & History | 28 | 5.8% |
| Visual & Performing Arts | 11 | 2.3% |
| Communications | 0 | 0.0% |
| Arts & Humanities | 27 | 5.6% |
| Total | 482 | 100.0% |
Transportation & Commute in South Point
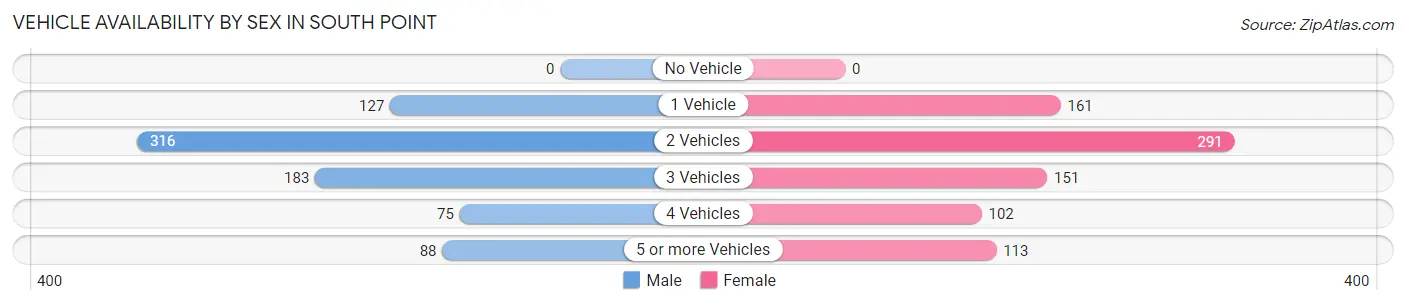
Vehicle Availability by Sex in South Point
The most prevalent vehicle ownership categories in South Point are males with 2 vehicles (316, accounting for 40.1%) and females with 2 vehicles (291, making up 38.6%).
| Vehicles Available | Male | Female |
| No Vehicle | 0 (0.0%) | 0 (0.0%) |
| 1 Vehicle | 127 (16.1%) | 161 (19.7%) |
| 2 Vehicles | 316 (40.1%) | 291 (35.6%) |
| 3 Vehicles | 183 (23.2%) | 151 (18.5%) |
| 4 Vehicles | 75 (9.5%) | 102 (12.5%) |
| 5 or more Vehicles | 88 (11.2%) | 113 (13.8%) |
| Total | 789 (100.0%) | 818 (100.0%) |
Commute Time in South Point
The most frequently occuring commute durations in South Point are 20 to 24 minutes (292 commuters, 19.8%), 15 to 19 minutes (278 commuters, 18.9%), and 5 to 9 minutes (208 commuters, 14.1%).
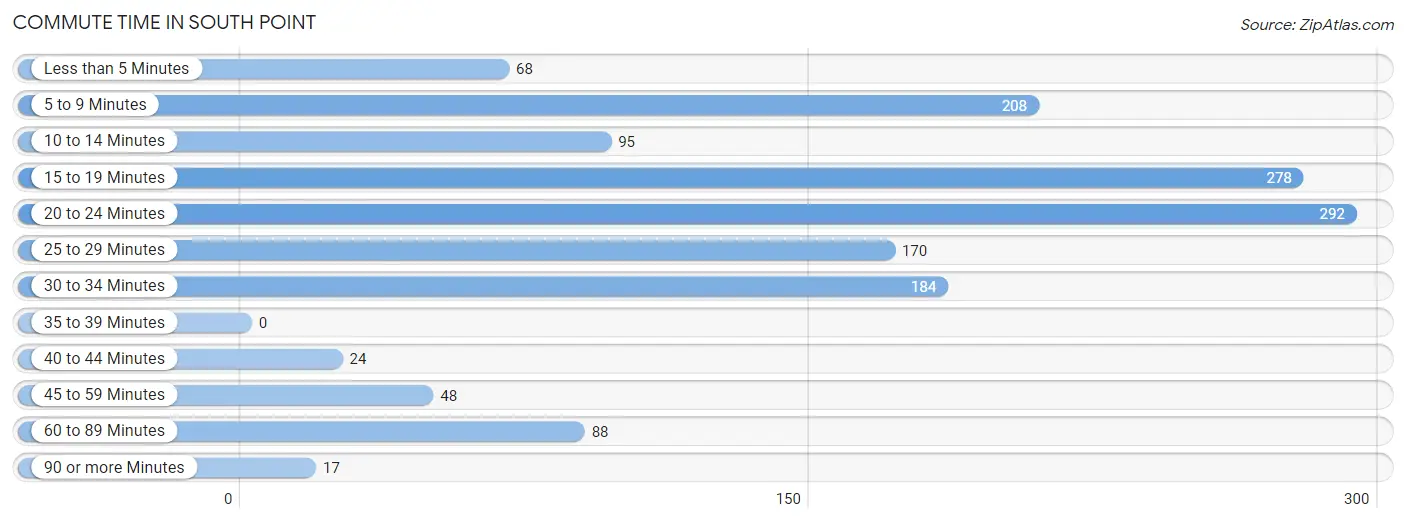
| Commute Time | # Commuters | % Commuters |
| Less than 5 Minutes | 68 | 4.6% |
| 5 to 9 Minutes | 208 | 14.1% |
| 10 to 14 Minutes | 95 | 6.5% |
| 15 to 19 Minutes | 278 | 18.9% |
| 20 to 24 Minutes | 292 | 19.8% |
| 25 to 29 Minutes | 170 | 11.6% |
| 30 to 34 Minutes | 184 | 12.5% |
| 35 to 39 Minutes | 0 | 0.0% |
| 40 to 44 Minutes | 24 | 1.6% |
| 45 to 59 Minutes | 48 | 3.3% |
| 60 to 89 Minutes | 88 | 6.0% |
| 90 or more Minutes | 17 | 1.1% |
Commute Time by Sex in South Point
The most common commute times in South Point are 20 to 24 minutes (158 commuters, 22.3%) for males and 15 to 19 minutes (172 commuters, 22.5%) for females.
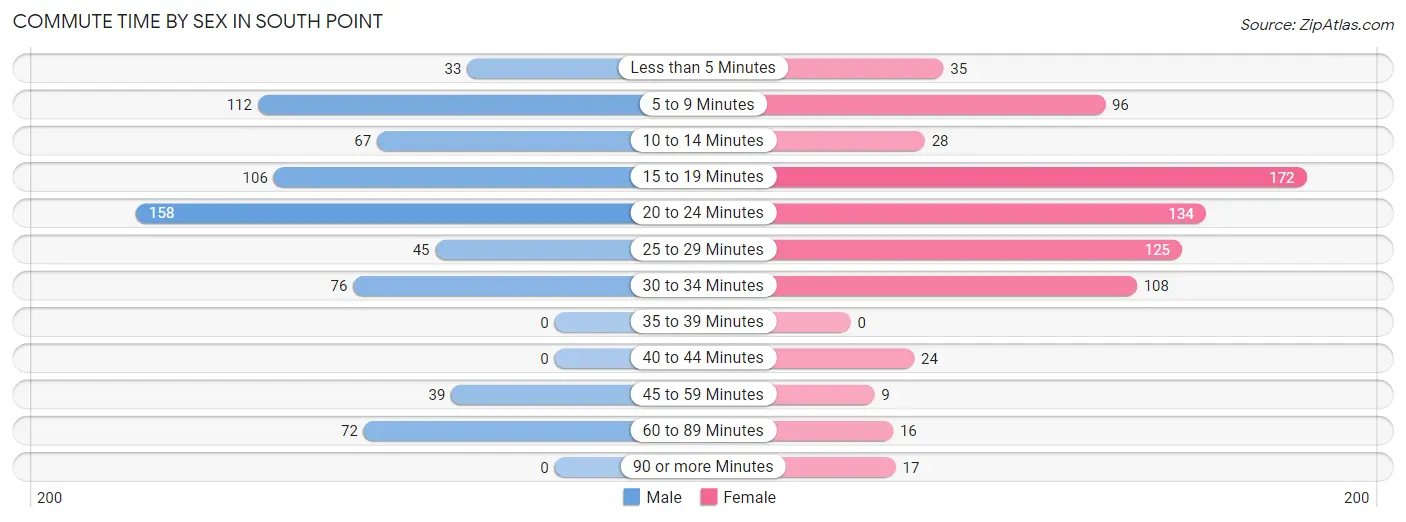
| Commute Time | Male | Female |
| Less than 5 Minutes | 33 (4.7%) | 35 (4.6%) |
| 5 to 9 Minutes | 112 (15.8%) | 96 (12.6%) |
| 10 to 14 Minutes | 67 (9.5%) | 28 (3.7%) |
| 15 to 19 Minutes | 106 (15.0%) | 172 (22.5%) |
| 20 to 24 Minutes | 158 (22.3%) | 134 (17.5%) |
| 25 to 29 Minutes | 45 (6.4%) | 125 (16.4%) |
| 30 to 34 Minutes | 76 (10.7%) | 108 (14.1%) |
| 35 to 39 Minutes | 0 (0.0%) | 0 (0.0%) |
| 40 to 44 Minutes | 0 (0.0%) | 24 (3.1%) |
| 45 to 59 Minutes | 39 (5.5%) | 9 (1.2%) |
| 60 to 89 Minutes | 72 (10.2%) | 16 (2.1%) |
| 90 or more Minutes | 0 (0.0%) | 17 (2.2%) |
Time of Departure to Work by Sex in South Point
The most frequent times of departure to work in South Point are 6:30 AM to 6:59 AM (136, 19.2%) for males and 7:00 AM to 7:29 AM (200, 26.2%) for females.
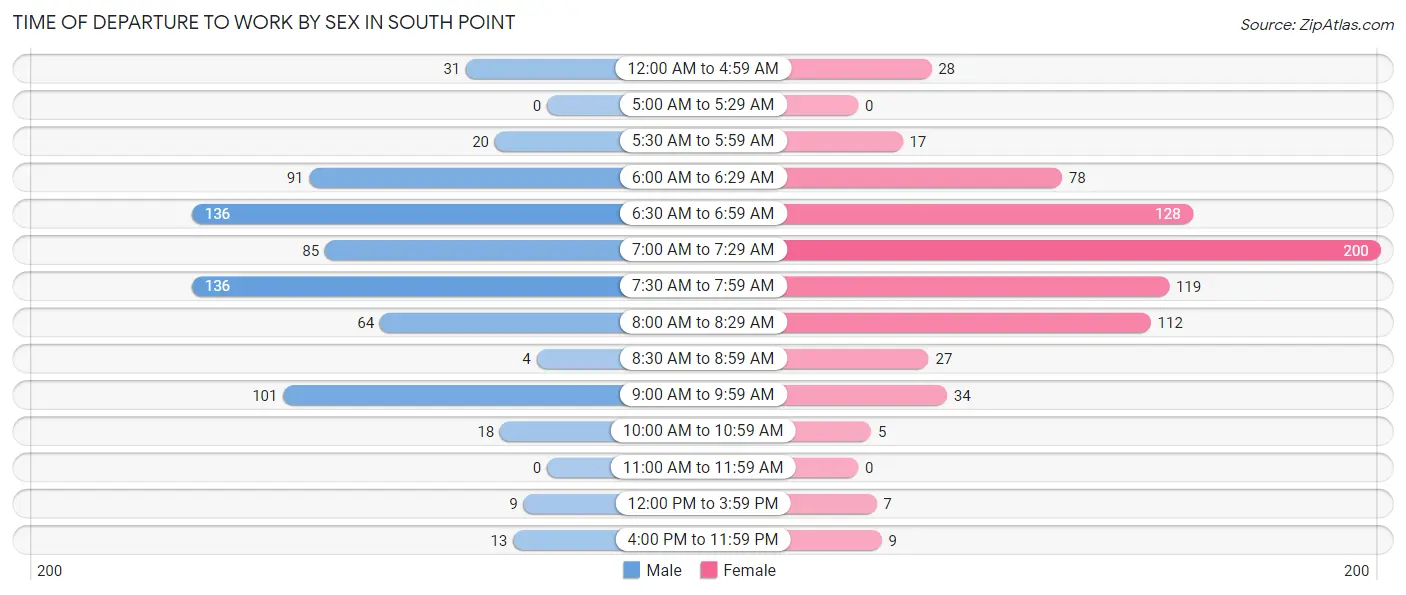
| Time of Departure | Male | Female |
| 12:00 AM to 4:59 AM | 31 (4.4%) | 28 (3.7%) |
| 5:00 AM to 5:29 AM | 0 (0.0%) | 0 (0.0%) |
| 5:30 AM to 5:59 AM | 20 (2.8%) | 17 (2.2%) |
| 6:00 AM to 6:29 AM | 91 (12.9%) | 78 (10.2%) |
| 6:30 AM to 6:59 AM | 136 (19.2%) | 128 (16.8%) |
| 7:00 AM to 7:29 AM | 85 (12.0%) | 200 (26.2%) |
| 7:30 AM to 7:59 AM | 136 (19.2%) | 119 (15.6%) |
| 8:00 AM to 8:29 AM | 64 (9.0%) | 112 (14.7%) |
| 8:30 AM to 8:59 AM | 4 (0.6%) | 27 (3.5%) |
| 9:00 AM to 9:59 AM | 101 (14.3%) | 34 (4.4%) |
| 10:00 AM to 10:59 AM | 18 (2.5%) | 5 (0.6%) |
| 11:00 AM to 11:59 AM | 0 (0.0%) | 0 (0.0%) |
| 12:00 PM to 3:59 PM | 9 (1.3%) | 7 (0.9%) |
| 4:00 PM to 11:59 PM | 13 (1.8%) | 9 (1.2%) |
| Total | 708 (100.0%) | 764 (100.0%) |
Housing Occupancy in South Point
Occupancy by Ownership in South Point
Of the total 1,277 dwellings in South Point, owner-occupied units account for 1,050 (82.2%), while renter-occupied units make up 227 (17.8%).
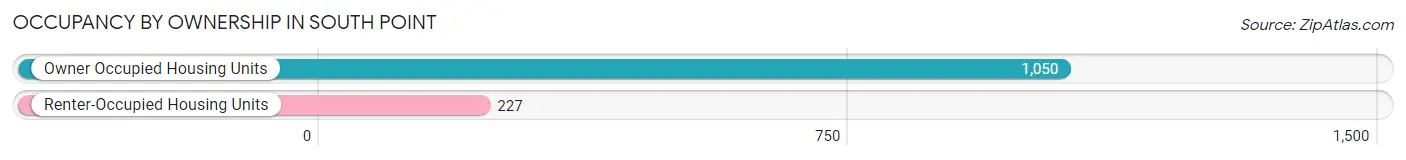
| Occupancy | # Housing Units | % Housing Units |
| Owner Occupied Housing Units | 1,050 | 82.2% |
| Renter-Occupied Housing Units | 227 | 17.8% |
| Total Occupied Housing Units | 1,277 | 100.0% |
Occupancy by Household Size in South Point
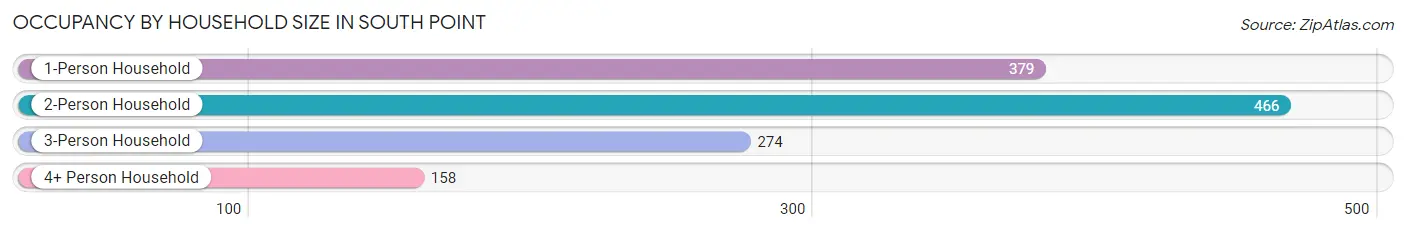
| Household Size | # Housing Units | % Housing Units |
| 1-Person Household | 379 | 29.7% |
| 2-Person Household | 466 | 36.5% |
| 3-Person Household | 274 | 21.5% |
| 4+ Person Household | 158 | 12.4% |
| Total Housing Units | 1,277 | 100.0% |
Occupancy by Ownership by Household Size in South Point
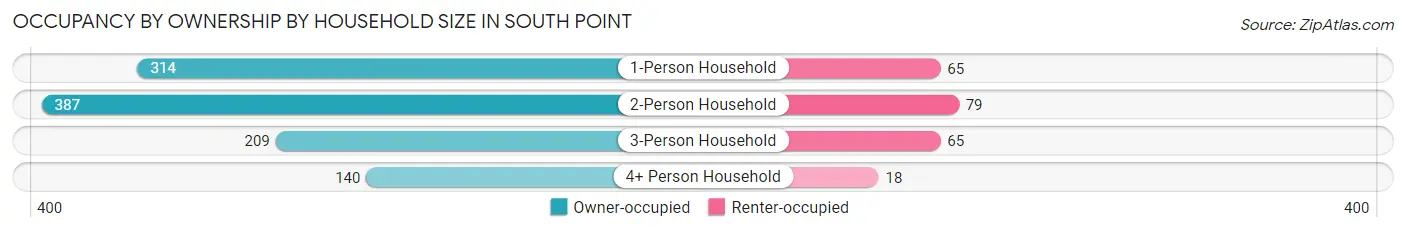
| Household Size | Owner-occupied | Renter-occupied |
| 1-Person Household | 314 (82.9%) | 65 (17.2%) |
| 2-Person Household | 387 (83.1%) | 79 (17.0%) |
| 3-Person Household | 209 (76.3%) | 65 (23.7%) |
| 4+ Person Household | 140 (88.6%) | 18 (11.4%) |
| Total Housing Units | 1,050 (82.2%) | 227 (17.8%) |
Occupancy by Educational Attainment in South Point
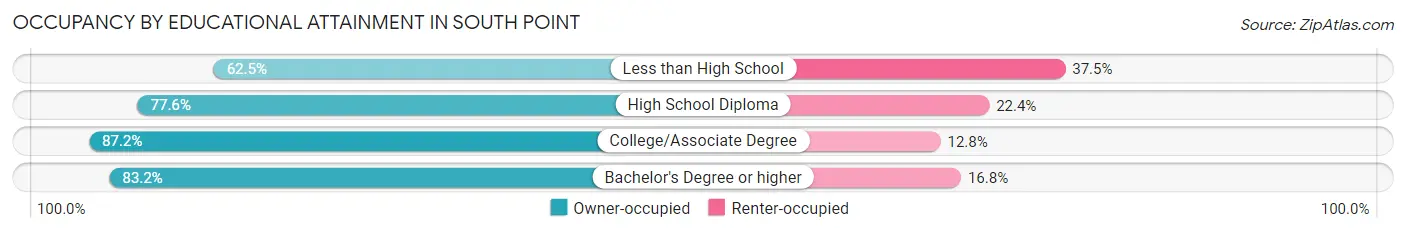
| Household Size | Owner-occupied | Renter-occupied |
| Less than High School | 15 (62.5%) | 9 (37.5%) |
| High School Diploma | 360 (77.6%) | 104 (22.4%) |
| College/Associate Degree | 403 (87.2%) | 59 (12.8%) |
| Bachelor's Degree or higher | 272 (83.2%) | 55 (16.8%) |
Occupancy by Age of Householder in South Point
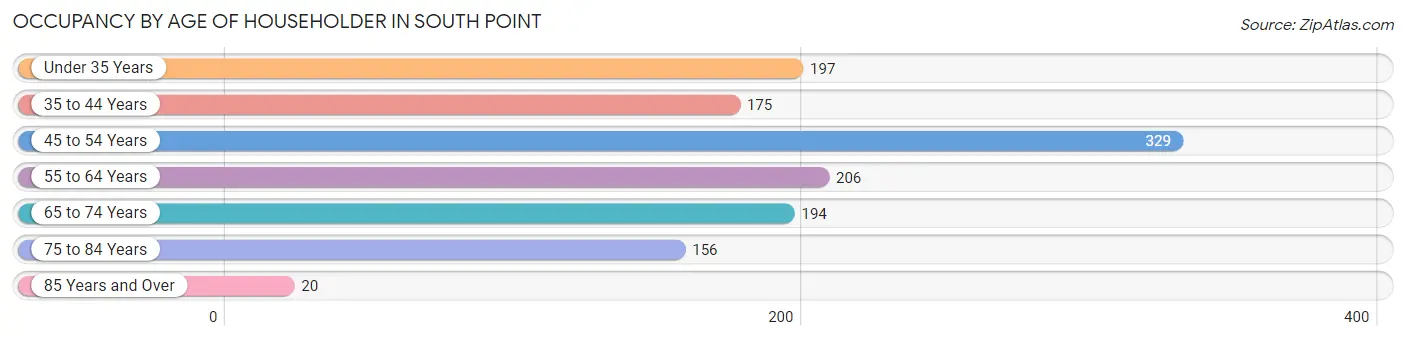
| Age Bracket | # Households | % Households |
| Under 35 Years | 197 | 15.4% |
| 35 to 44 Years | 175 | 13.7% |
| 45 to 54 Years | 329 | 25.8% |
| 55 to 64 Years | 206 | 16.1% |
| 65 to 74 Years | 194 | 15.2% |
| 75 to 84 Years | 156 | 12.2% |
| 85 Years and Over | 20 | 1.6% |
| Total | 1,277 | 100.0% |
Housing Finances in South Point
Median Income by Occupancy in South Point
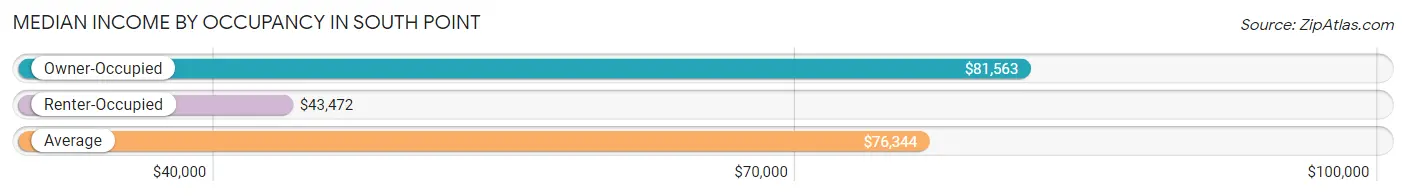
| Occupancy Type | # Households | Median Income |
| Owner-Occupied | 1,050 (82.2%) | $81,563 |
| Renter-Occupied | 227 (17.8%) | $43,472 |
| Average | 1,277 (100.0%) | $76,344 |
Occupancy by Householder Income Bracket in South Point
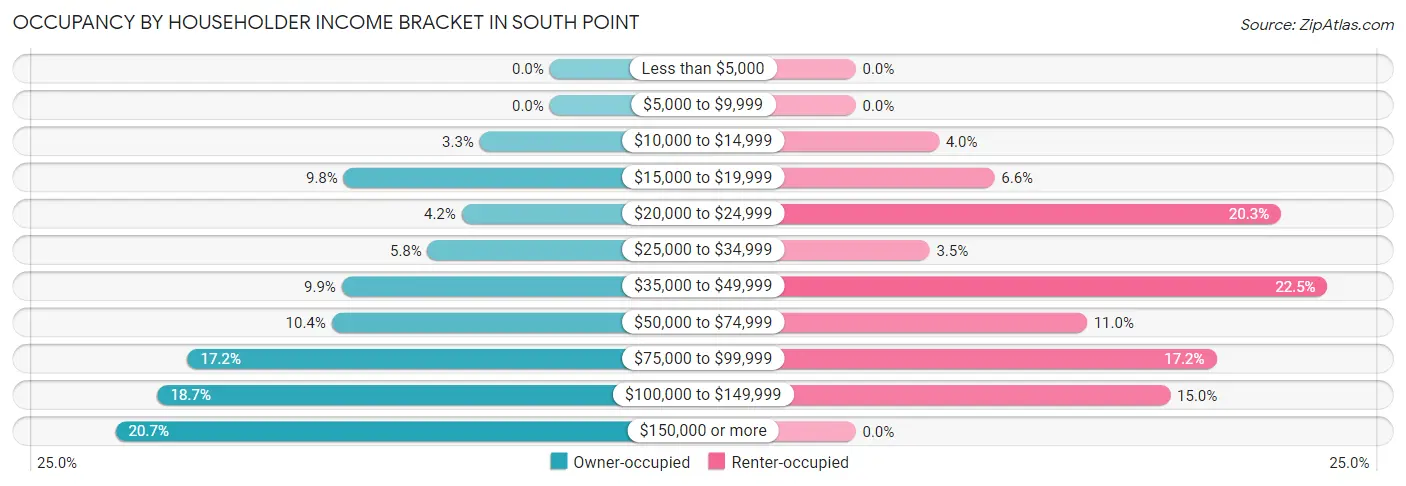
| Income Bracket | Owner-occupied | Renter-occupied |
| Less than $5,000 | 0 (0.0%) | 0 (0.0%) |
| $5,000 to $9,999 | 0 (0.0%) | 0 (0.0%) |
| $10,000 to $14,999 | 35 (3.3%) | 9 (4.0%) |
| $15,000 to $19,999 | 103 (9.8%) | 15 (6.6%) |
| $20,000 to $24,999 | 44 (4.2%) | 46 (20.3%) |
| $25,000 to $34,999 | 61 (5.8%) | 8 (3.5%) |
| $35,000 to $49,999 | 104 (9.9%) | 51 (22.5%) |
| $50,000 to $74,999 | 109 (10.4%) | 25 (11.0%) |
| $75,000 to $99,999 | 181 (17.2%) | 39 (17.2%) |
| $100,000 to $149,999 | 196 (18.7%) | 34 (15.0%) |
| $150,000 or more | 217 (20.7%) | 0 (0.0%) |
| Total | 1,050 (100.0%) | 227 (100.0%) |
Monthly Housing Cost Tiers in South Point
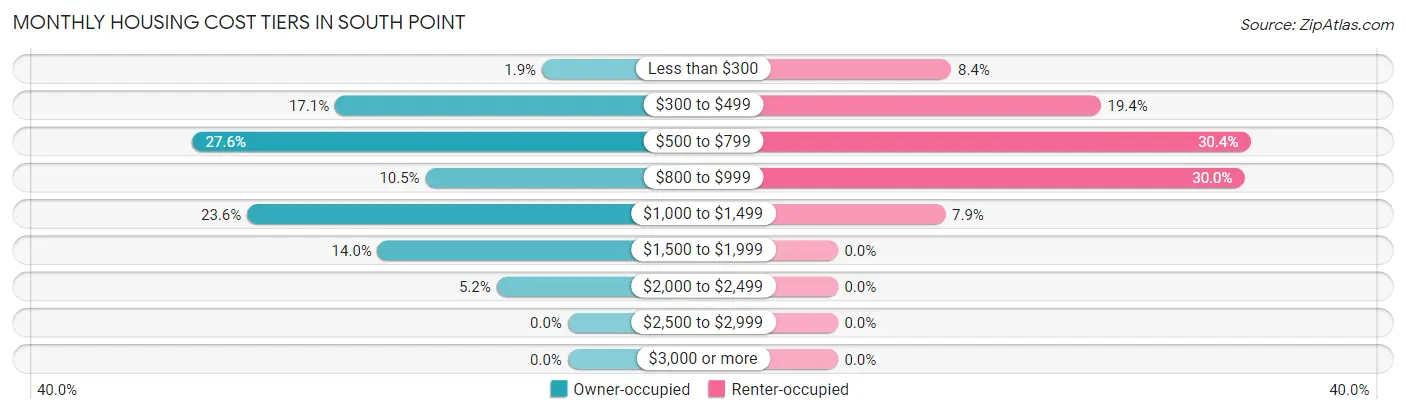
| Monthly Cost | Owner-occupied | Renter-occupied |
| Less than $300 | 20 (1.9%) | 19 (8.4%) |
| $300 to $499 | 180 (17.1%) | 44 (19.4%) |
| $500 to $799 | 290 (27.6%) | 69 (30.4%) |
| $800 to $999 | 110 (10.5%) | 68 (30.0%) |
| $1,000 to $1,499 | 248 (23.6%) | 18 (7.9%) |
| $1,500 to $1,999 | 147 (14.0%) | 0 (0.0%) |
| $2,000 to $2,499 | 55 (5.2%) | 0 (0.0%) |
| $2,500 to $2,999 | 0 (0.0%) | 0 (0.0%) |
| $3,000 or more | 0 (0.0%) | 0 (0.0%) |
| Total | 1,050 (100.0%) | 227 (100.0%) |
Physical Housing Characteristics in South Point
Housing Structures in South Point
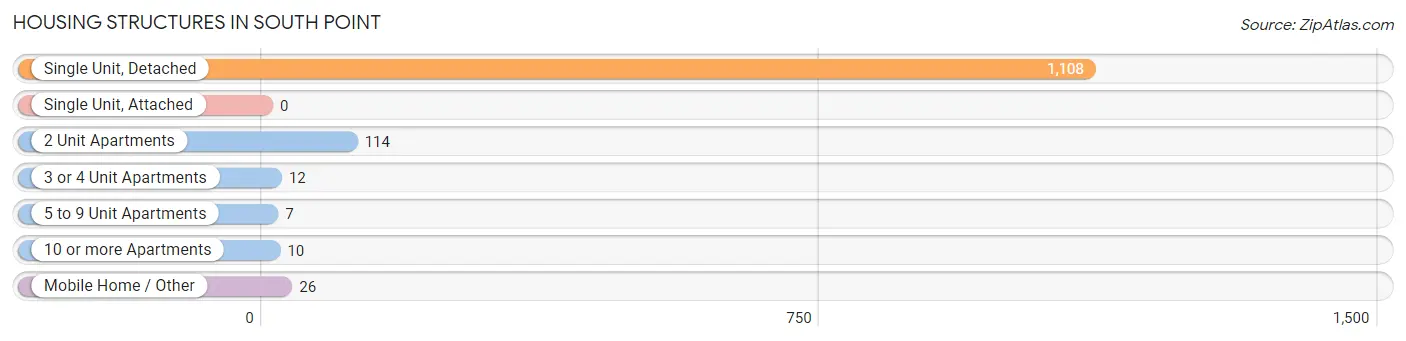
| Structure Type | # Housing Units | % Housing Units |
| Single Unit, Detached | 1,108 | 86.8% |
| Single Unit, Attached | 0 | 0.0% |
| 2 Unit Apartments | 114 | 8.9% |
| 3 or 4 Unit Apartments | 12 | 0.9% |
| 5 to 9 Unit Apartments | 7 | 0.5% |
| 10 or more Apartments | 10 | 0.8% |
| Mobile Home / Other | 26 | 2.0% |
| Total | 1,277 | 100.0% |
Housing Structures by Occupancy in South Point
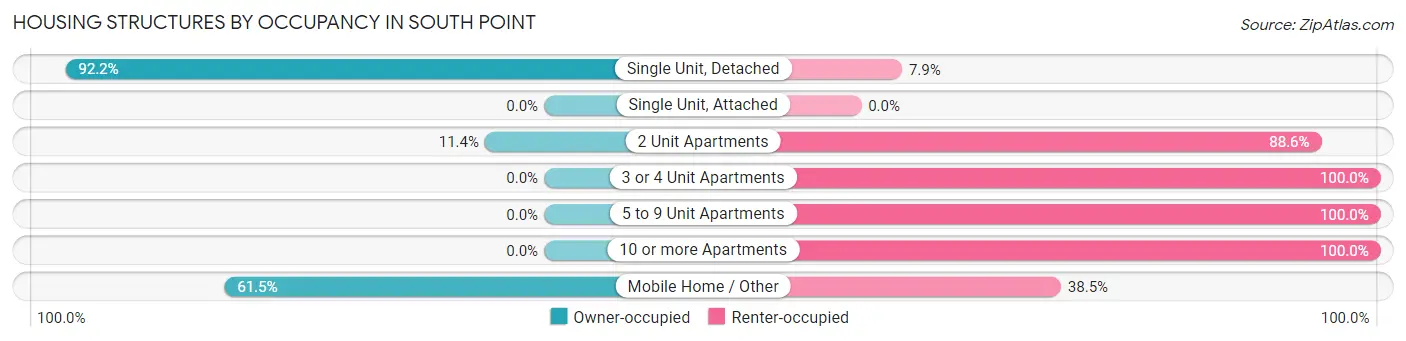
| Structure Type | Owner-occupied | Renter-occupied |
| Single Unit, Detached | 1,021 (92.1%) | 87 (7.9%) |
| Single Unit, Attached | 0 (0.0%) | 0 (0.0%) |
| 2 Unit Apartments | 13 (11.4%) | 101 (88.6%) |
| 3 or 4 Unit Apartments | 0 (0.0%) | 12 (100.0%) |
| 5 to 9 Unit Apartments | 0 (0.0%) | 7 (100.0%) |
| 10 or more Apartments | 0 (0.0%) | 10 (100.0%) |
| Mobile Home / Other | 16 (61.5%) | 10 (38.5%) |
| Total | 1,050 (82.2%) | 227 (17.8%) |
Housing Structures by Number of Rooms in South Point
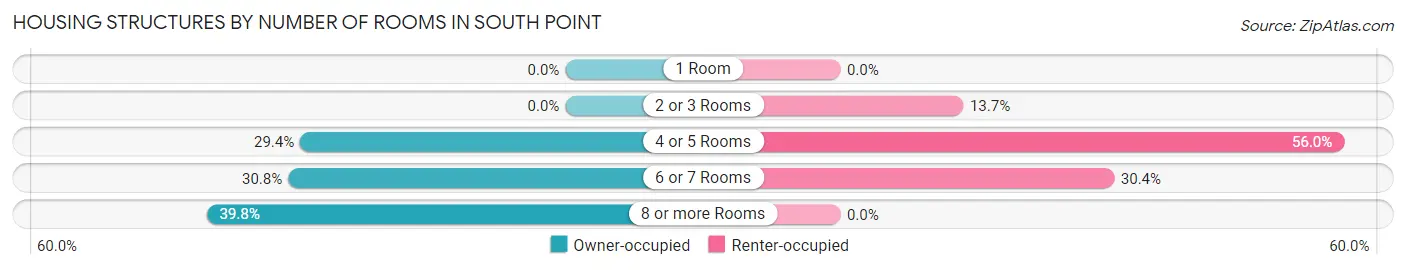
| Number of Rooms | Owner-occupied | Renter-occupied |
| 1 Room | 0 (0.0%) | 0 (0.0%) |
| 2 or 3 Rooms | 0 (0.0%) | 31 (13.7%) |
| 4 or 5 Rooms | 309 (29.4%) | 127 (55.9%) |
| 6 or 7 Rooms | 323 (30.8%) | 69 (30.4%) |
| 8 or more Rooms | 418 (39.8%) | 0 (0.0%) |
| Total | 1,050 (100.0%) | 227 (100.0%) |
Housing Structure by Heating Type in South Point
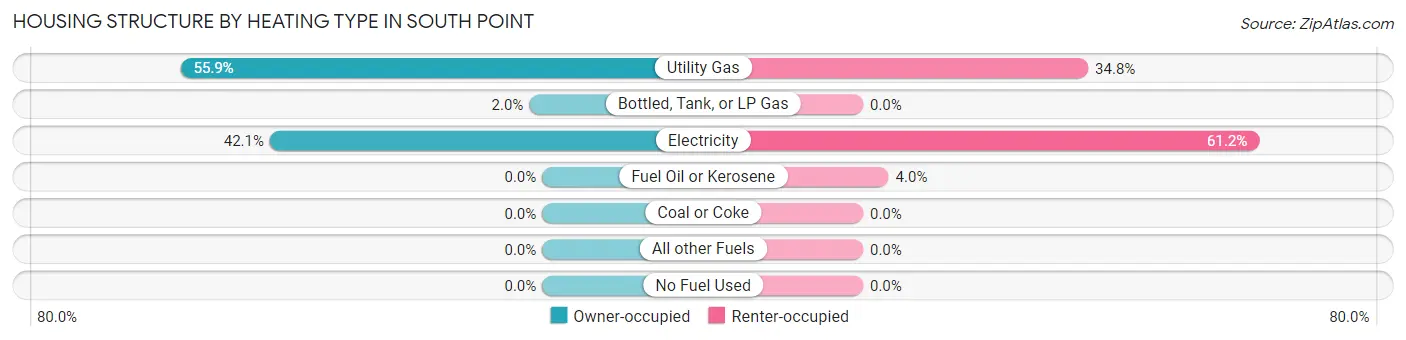
| Heating Type | Owner-occupied | Renter-occupied |
| Utility Gas | 587 (55.9%) | 79 (34.8%) |
| Bottled, Tank, or LP Gas | 21 (2.0%) | 0 (0.0%) |
| Electricity | 442 (42.1%) | 139 (61.2%) |
| Fuel Oil or Kerosene | 0 (0.0%) | 9 (4.0%) |
| Coal or Coke | 0 (0.0%) | 0 (0.0%) |
| All other Fuels | 0 (0.0%) | 0 (0.0%) |
| No Fuel Used | 0 (0.0%) | 0 (0.0%) |
| Total | 1,050 (100.0%) | 227 (100.0%) |
Household Vehicle Usage in South Point
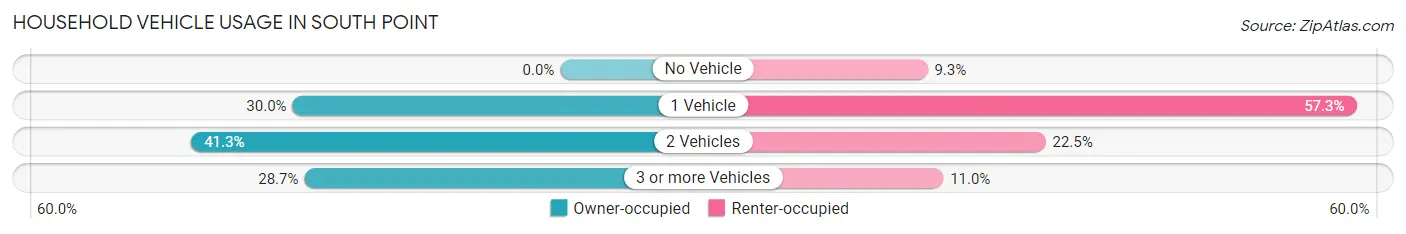
| Vehicles per Household | Owner-occupied | Renter-occupied |
| No Vehicle | 0 (0.0%) | 21 (9.2%) |
| 1 Vehicle | 315 (30.0%) | 130 (57.3%) |
| 2 Vehicles | 434 (41.3%) | 51 (22.5%) |
| 3 or more Vehicles | 301 (28.7%) | 25 (11.0%) |
| Total | 1,050 (100.0%) | 227 (100.0%) |
Real Estate & Mortgages in South Point
Real Estate and Mortgage Overview in South Point
| Characteristic | Without Mortgage | With Mortgage |
| Housing Units | 390 | 660 |
| Median Property Value | $158,900 | $166,400 |
| Median Household Income | $50,833 | $176 |
| Monthly Housing Costs | $513 | $0 |
| Real Estate Taxes | $1,280 | $0 |
Property Value by Mortgage Status in South Point
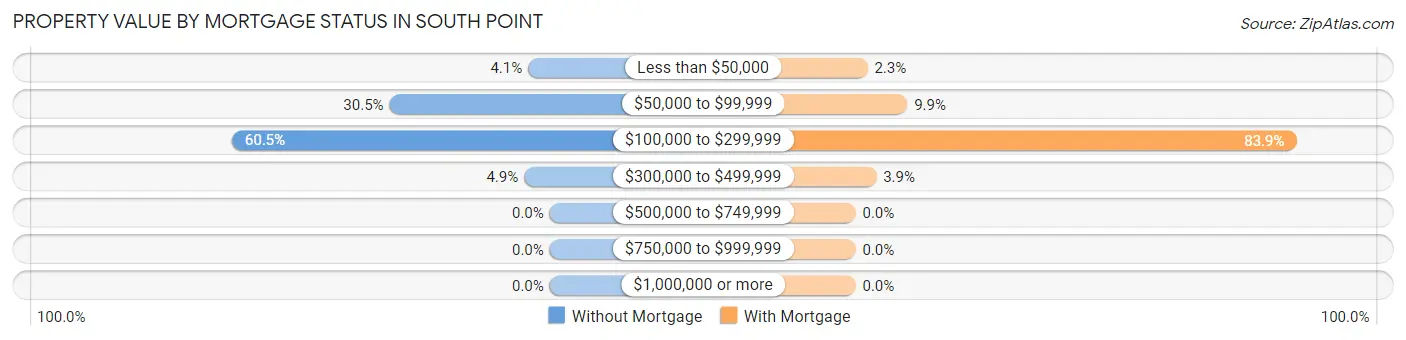
| Property Value | Without Mortgage | With Mortgage |
| Less than $50,000 | 16 (4.1%) | 15 (2.3%) |
| $50,000 to $99,999 | 119 (30.5%) | 65 (9.9%) |
| $100,000 to $299,999 | 236 (60.5%) | 554 (83.9%) |
| $300,000 to $499,999 | 19 (4.9%) | 26 (3.9%) |
| $500,000 to $749,999 | 0 (0.0%) | 0 (0.0%) |
| $750,000 to $999,999 | 0 (0.0%) | 0 (0.0%) |
| $1,000,000 or more | 0 (0.0%) | 0 (0.0%) |
| Total | 390 (100.0%) | 660 (100.0%) |
Household Income by Mortgage Status in South Point
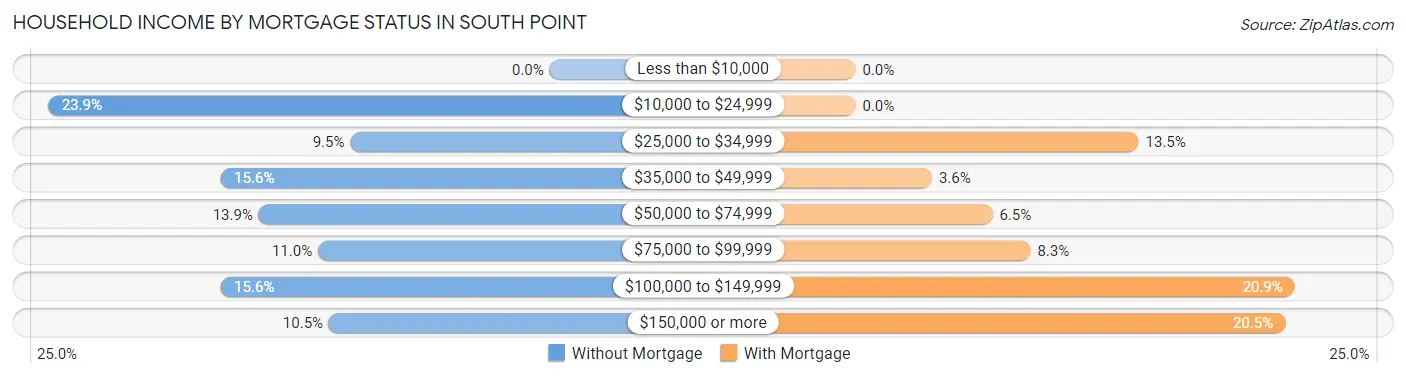
| Household Income | Without Mortgage | With Mortgage |
| Less than $10,000 | 0 (0.0%) | 0 (0.0%) |
| $10,000 to $24,999 | 93 (23.8%) | 0 (0.0%) |
| $25,000 to $34,999 | 37 (9.5%) | 89 (13.5%) |
| $35,000 to $49,999 | 61 (15.6%) | 24 (3.6%) |
| $50,000 to $74,999 | 54 (13.9%) | 43 (6.5%) |
| $75,000 to $99,999 | 43 (11.0%) | 55 (8.3%) |
| $100,000 to $149,999 | 61 (15.6%) | 138 (20.9%) |
| $150,000 or more | 41 (10.5%) | 135 (20.4%) |
| Total | 390 (100.0%) | 660 (100.0%) |
Property Value to Household Income Ratio in South Point
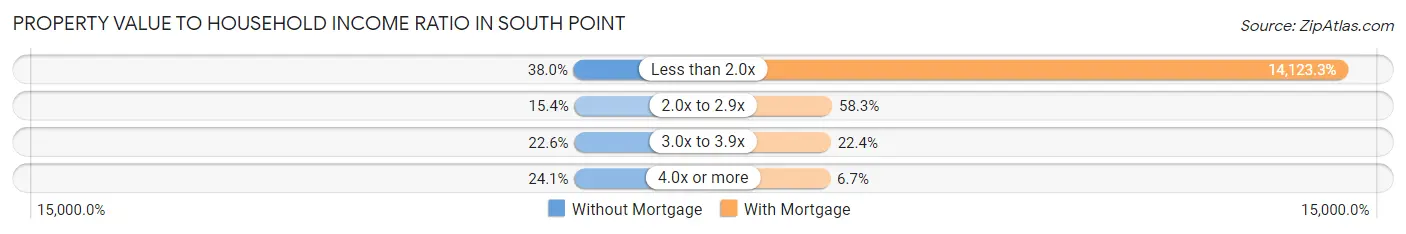
| Value-to-Income Ratio | Without Mortgage | With Mortgage |
| Less than 2.0x | 148 (38.0%) | 93,214 (14,123.3%) |
| 2.0x to 2.9x | 60 (15.4%) | 385 (58.3%) |
| 3.0x to 3.9x | 88 (22.6%) | 148 (22.4%) |
| 4.0x or more | 94 (24.1%) | 44 (6.7%) |
| Total | 390 (100.0%) | 660 (100.0%) |
Real Estate Taxes by Mortgage Status in South Point
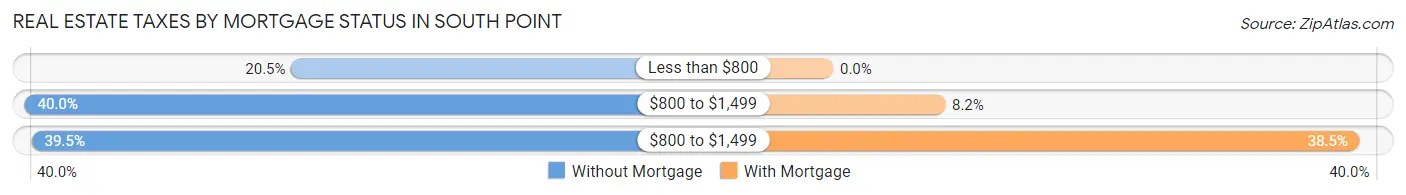
| Property Taxes | Without Mortgage | With Mortgage |
| Less than $800 | 80 (20.5%) | 0 (0.0%) |
| $800 to $1,499 | 156 (40.0%) | 54 (8.2%) |
| $800 to $1,499 | 154 (39.5%) | 254 (38.5%) |
| Total | 390 (100.0%) | 660 (100.0%) |
Health & Disability in South Point
Health Insurance Coverage by Age in South Point
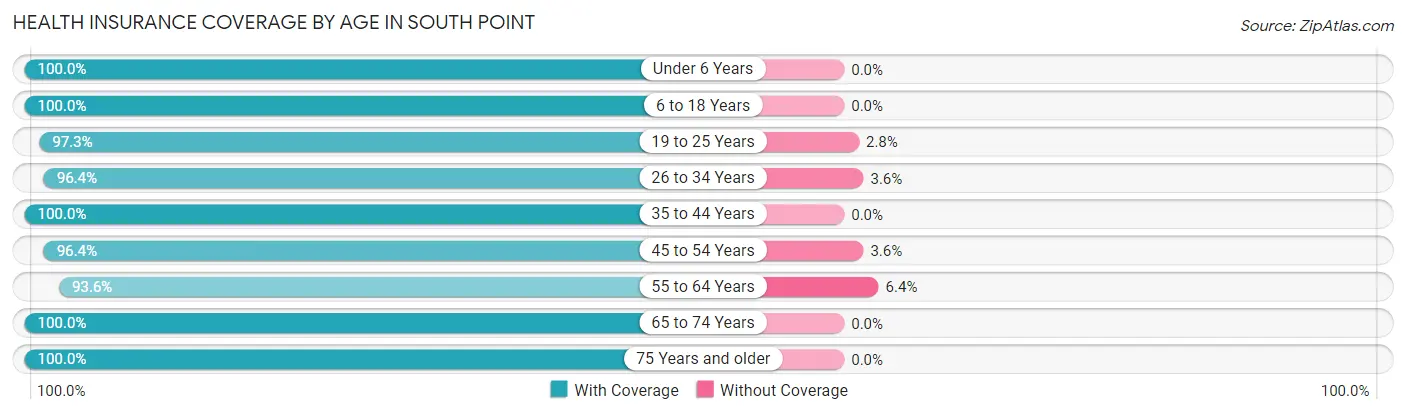
| Age Bracket | With Coverage | Without Coverage |
| Under 6 Years | 199 (100.0%) | 0 (0.0%) |
| 6 to 18 Years | 388 (100.0%) | 0 (0.0%) |
| 19 to 25 Years | 318 (97.3%) | 9 (2.8%) |
| 26 to 34 Years | 295 (96.4%) | 11 (3.6%) |
| 35 to 44 Years | 308 (100.0%) | 0 (0.0%) |
| 45 to 54 Years | 538 (96.4%) | 20 (3.6%) |
| 55 to 64 Years | 336 (93.6%) | 23 (6.4%) |
| 65 to 74 Years | 290 (100.0%) | 0 (0.0%) |
| 75 Years and older | 265 (100.0%) | 0 (0.0%) |
| Total | 2,937 (97.9%) | 63 (2.1%) |
Health Insurance Coverage by Citizenship Status in South Point
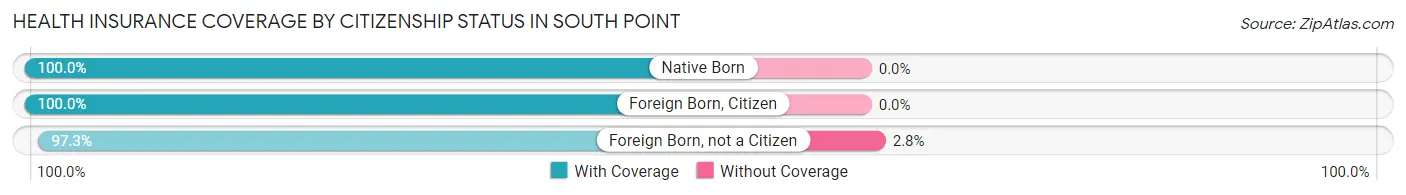
| Citizenship Status | With Coverage | Without Coverage |
| Native Born | 199 (100.0%) | 0 (0.0%) |
| Foreign Born, Citizen | 388 (100.0%) | 0 (0.0%) |
| Foreign Born, not a Citizen | 318 (97.3%) | 9 (2.8%) |
Health Insurance Coverage by Household Income in South Point
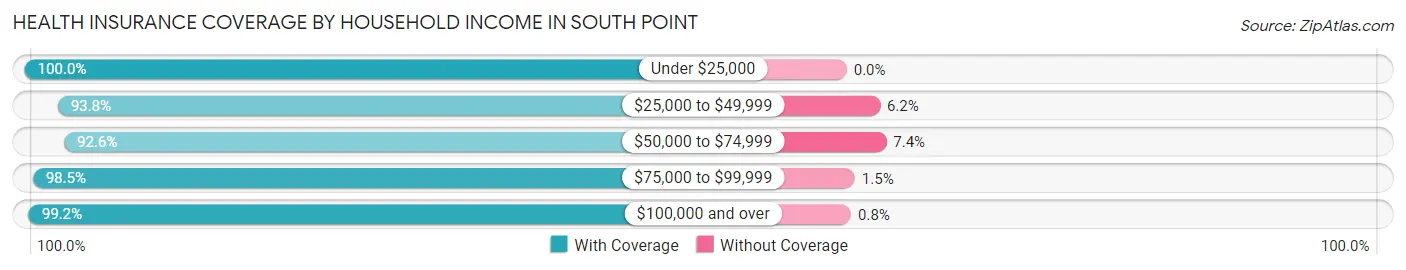
| Household Income | With Coverage | Without Coverage |
| Under $25,000 | 400 (100.0%) | 0 (0.0%) |
| $25,000 to $49,999 | 317 (93.8%) | 21 (6.2%) |
| $50,000 to $74,999 | 275 (92.6%) | 22 (7.4%) |
| $75,000 to $99,999 | 585 (98.5%) | 9 (1.5%) |
| $100,000 and over | 1,360 (99.2%) | 11 (0.8%) |
Public vs Private Health Insurance Coverage by Age in South Point
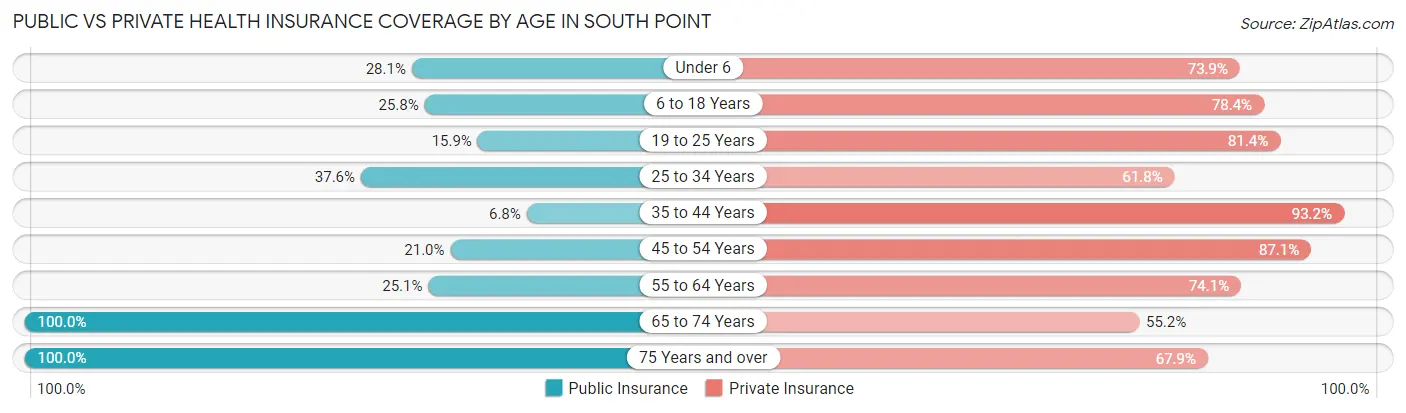
| Age Bracket | Public Insurance | Private Insurance |
| Under 6 | 56 (28.1%) | 147 (73.9%) |
| 6 to 18 Years | 100 (25.8%) | 304 (78.3%) |
| 19 to 25 Years | 52 (15.9%) | 266 (81.4%) |
| 25 to 34 Years | 115 (37.6%) | 189 (61.8%) |
| 35 to 44 Years | 21 (6.8%) | 287 (93.2%) |
| 45 to 54 Years | 117 (21.0%) | 486 (87.1%) |
| 55 to 64 Years | 90 (25.1%) | 266 (74.1%) |
| 65 to 74 Years | 290 (100.0%) | 160 (55.2%) |
| 75 Years and over | 265 (100.0%) | 180 (67.9%) |
| Total | 1,106 (36.9%) | 2,285 (76.2%) |
Disability Status by Sex by Age in South Point
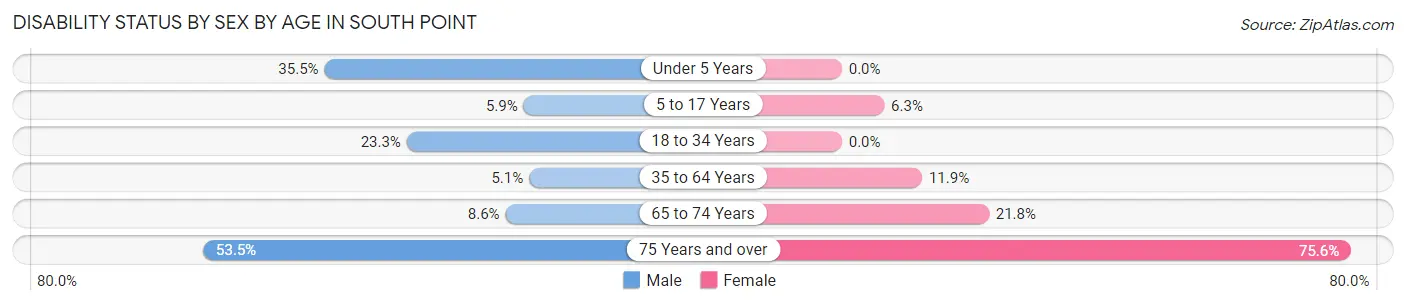
| Age Bracket | Male | Female |
| Under 5 Years | 11 (35.5%) | 0 (0.0%) |
| 5 to 17 Years | 12 (5.9%) | 19 (6.3%) |
| 18 to 34 Years | 70 (23.3%) | 0 (0.0%) |
| 35 to 64 Years | 29 (5.1%) | 78 (11.9%) |
| 65 to 74 Years | 8 (8.6%) | 43 (21.8%) |
| 75 Years and over | 76 (53.5%) | 93 (75.6%) |
Disability Class by Sex by Age in South Point
Disability Class: Hearing Difficulty
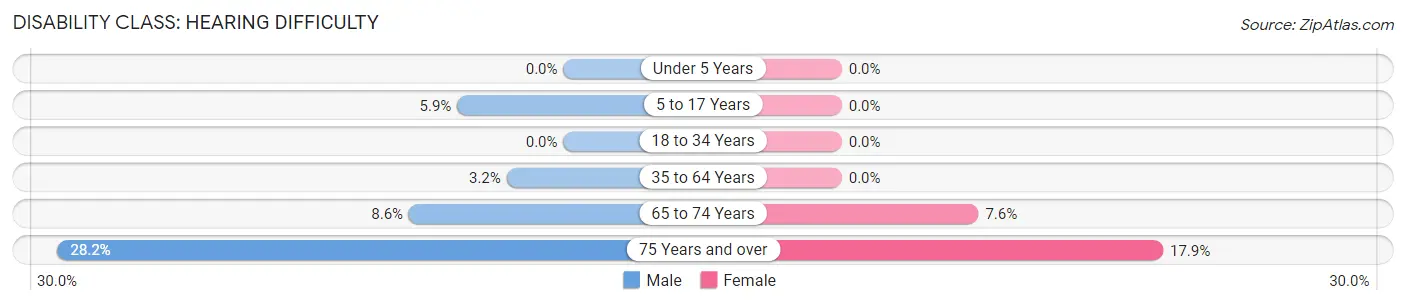
| Age Bracket | Male | Female |
| Under 5 Years | 0 (0.0%) | 0 (0.0%) |
| 5 to 17 Years | 12 (5.9%) | 0 (0.0%) |
| 18 to 34 Years | 0 (0.0%) | 0 (0.0%) |
| 35 to 64 Years | 18 (3.2%) | 0 (0.0%) |
| 65 to 74 Years | 8 (8.6%) | 15 (7.6%) |
| 75 Years and over | 40 (28.2%) | 22 (17.9%) |
Disability Class: Vision Difficulty
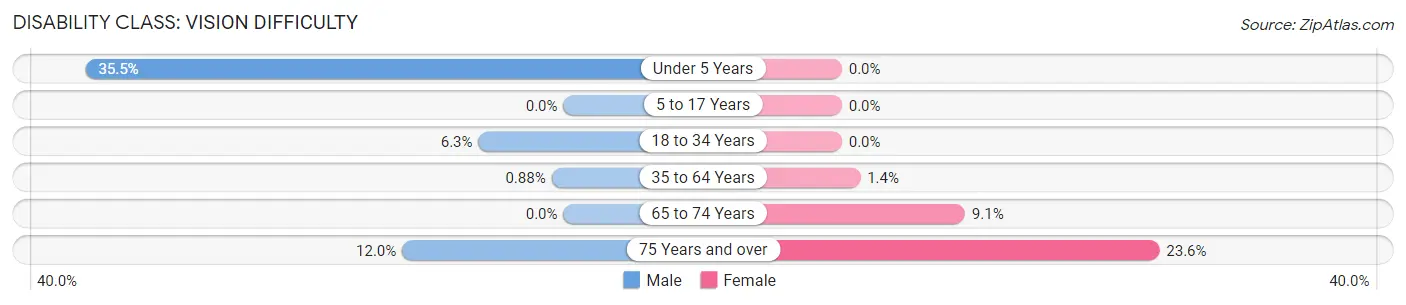
| Age Bracket | Male | Female |
| Under 5 Years | 11 (35.5%) | 0 (0.0%) |
| 5 to 17 Years | 0 (0.0%) | 0 (0.0%) |
| 18 to 34 Years | 19 (6.3%) | 0 (0.0%) |
| 35 to 64 Years | 5 (0.9%) | 9 (1.4%) |
| 65 to 74 Years | 0 (0.0%) | 18 (9.1%) |
| 75 Years and over | 17 (12.0%) | 29 (23.6%) |
Disability Class: Cognitive Difficulty
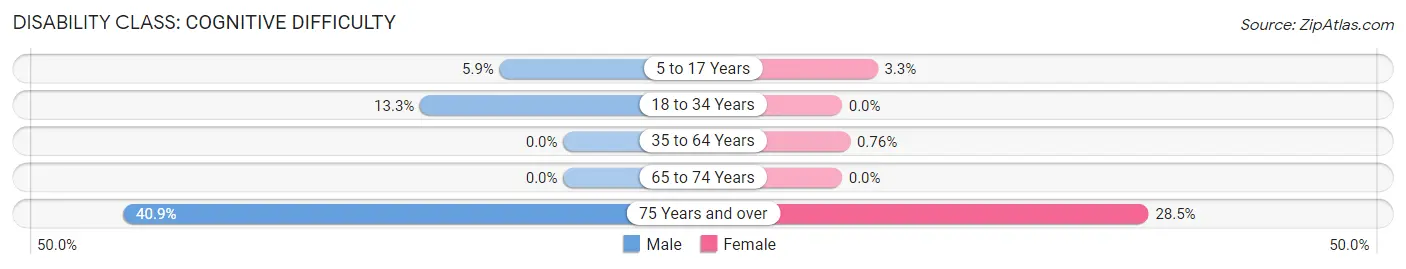
| Age Bracket | Male | Female |
| 5 to 17 Years | 12 (5.9%) | 10 (3.3%) |
| 18 to 34 Years | 40 (13.3%) | 0 (0.0%) |
| 35 to 64 Years | 0 (0.0%) | 5 (0.8%) |
| 65 to 74 Years | 0 (0.0%) | 0 (0.0%) |
| 75 Years and over | 58 (40.8%) | 35 (28.5%) |
Disability Class: Ambulatory Difficulty
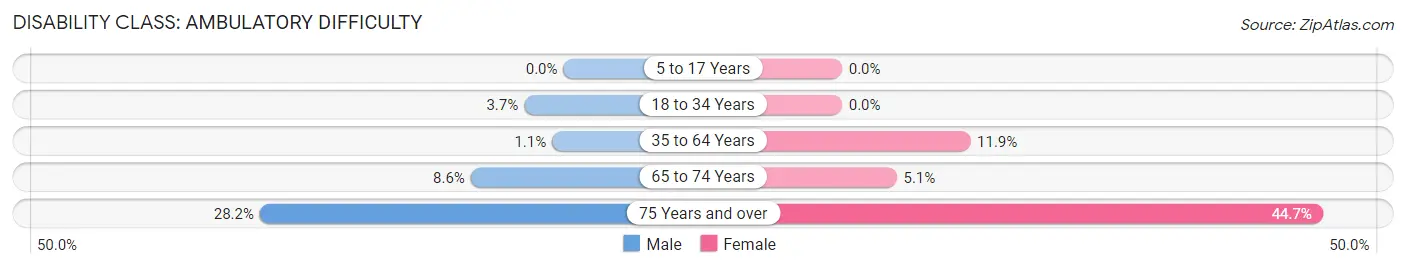
| Age Bracket | Male | Female |
| 5 to 17 Years | 0 (0.0%) | 0 (0.0%) |
| 18 to 34 Years | 11 (3.6%) | 0 (0.0%) |
| 35 to 64 Years | 6 (1.1%) | 78 (11.9%) |
| 65 to 74 Years | 8 (8.6%) | 10 (5.1%) |
| 75 Years and over | 40 (28.2%) | 55 (44.7%) |
Disability Class: Self-Care Difficulty
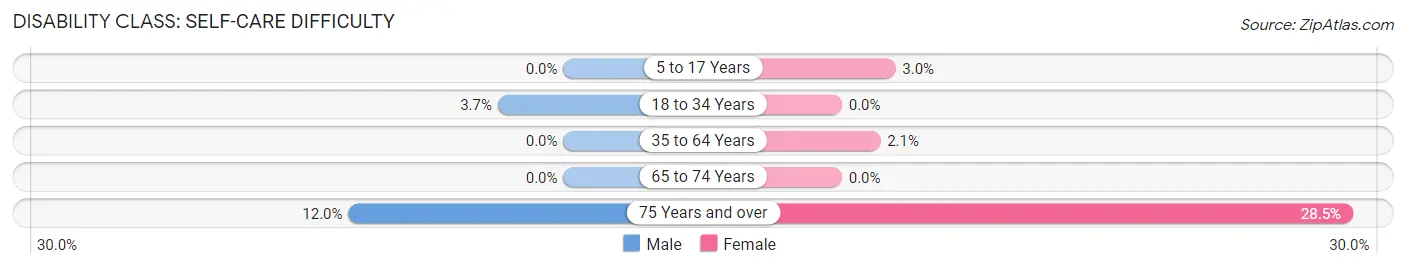
| Age Bracket | Male | Female |
| 5 to 17 Years | 0 (0.0%) | 9 (3.0%) |
| 18 to 34 Years | 11 (3.6%) | 0 (0.0%) |
| 35 to 64 Years | 0 (0.0%) | 14 (2.1%) |
| 65 to 74 Years | 0 (0.0%) | 0 (0.0%) |
| 75 Years and over | 17 (12.0%) | 35 (28.5%) |
Technology Access in South Point
Computing Device Access in South Point
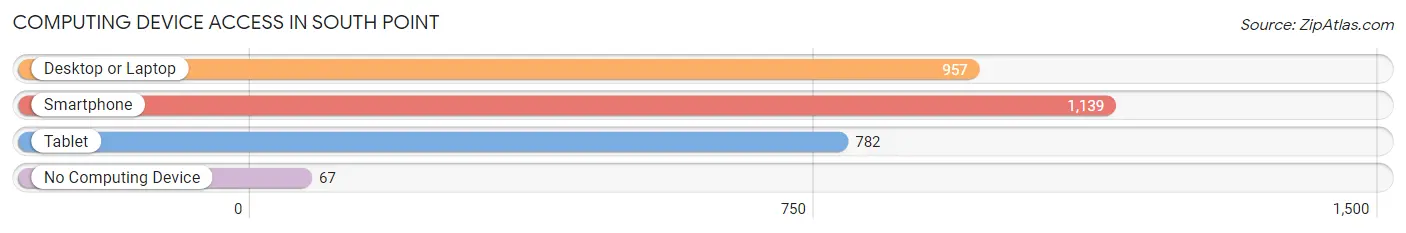
| Device Type | # Households | % Households |
| Desktop or Laptop | 957 | 74.9% |
| Smartphone | 1,139 | 89.2% |
| Tablet | 782 | 61.2% |
| No Computing Device | 67 | 5.2% |
| Total | 1,277 | 100.0% |
Internet Access in South Point
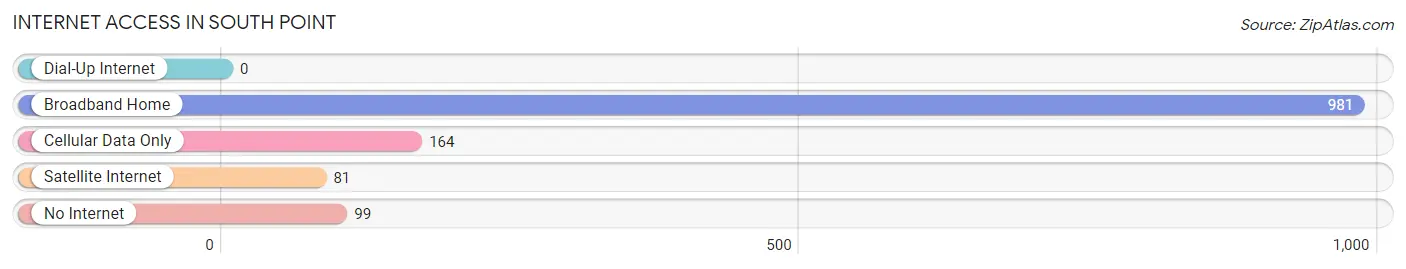
| Internet Type | # Households | % Households |
| Dial-Up Internet | 0 | 0.0% |
| Broadband Home | 981 | 76.8% |
| Cellular Data Only | 164 | 12.8% |
| Satellite Internet | 81 | 6.3% |
| No Internet | 99 | 7.7% |
| Total | 1,277 | 100.0% |
South Point Summary
South Point is a village located in Lawrence County, Ohio, United States. The population was 3,744 at the 2010 census. It is located along the Ohio River at the mouth of the Big Sandy River.
History
South Point was founded in 1817 by William and John Hildreth, who purchased the land from the United States government. The village was originally known as Hildrethtown, but was later changed to South Point due to its location at the southernmost point of Lawrence County.
The village was incorporated in 1867 and has since grown to become the largest village in Lawrence County. South Point is home to a variety of businesses, including a steel mill, a coal mine, and a variety of other industries.
Geography
South Point is located at 38 30 25 North 82 37 17 West 38 506944 82 621389
According to the United States Census Bureau, the village has a total area of 2.2 square miles (5.7 km2), all land.
Economy
South Point is home to a variety of businesses, including a steel mill, a coal mine, and a variety of other industries. The village is also home to a number of retail stores, restaurants, and other services.
The village is served by the Lawrence County Port Authority, which operates a port facility on the Ohio River. The port is used for shipping and receiving goods, as well as for recreational activities.
Demographics
As of the census of 2010, there were 3,744 people, 1,541 households, and 1,039 families residing in the village. The population density was 1,711.8 people per square mile (661.2/km2). There were 1,717 housing units at an average density of 776.3 per square mile (300.2/km2). The racial makeup of the village was 97.2% White, 0.7% African American, 0.2% Native American, 0.3% Asian, 0.2% from other races, and 1.5% from two or more races. Hispanic or Latino of any race were 0.7% of the population.
There were 1,541 households, out of which 28.2% had children under the age of 18 living with them, 48.2% were married couples living together, 14.2% had a female householder with no husband present, and 33.2% were non-families. 29.2% of all households were made up of individuals, and 14.2% had someone living alone who was 65 years of age or older. The average household size was 2.41 and the average family size was 2.94.
In the village, the population was spread out, with 23.2% under the age of 18, 8.2% from 18 to 24, 25.7% from 25 to 44, 25.2% from 45 to 64, and 17.7% who were 65 years of age or older. The median age was 40 years. For every 100 females, there were 87.2 males. For every 100 females age 18 and over, there were 83.2 males.
The median income for a household in the village was $30,938, and the median income for a family was $37,917. Males had a median income of $31,964 versus $21,917 for females. The per capita income for the village was $16,945. About 11.2% of families and 14.2% of the population were below the poverty line, including 19.2% of those under age 18 and 8.2% of those age 65 or over.
Common Questions
What is the Total Population of South Point?
Total Population of South Point is 3,000.
What is the Total Male Population of South Point?
Total Male Population of South Point is 1,340.
What is the Total Female Population of South Point?
Total Female Population of South Point is 1,660.
What is the Ratio of Males per 100 Females in South Point?
There are 80.72 Males per 100 Females in South Point.
What is the Ratio of Females per 100 Males in South Point?
There are 123.88 Females per 100 Males in South Point.
What is the Median Population Age in South Point?
Median Population Age in South Point is 42.7 Years.
What is the Average Family Size in South Point
Average Family Size in South Point is 3.0 People.
What is the Average Household Size in South Point
Average Household Size in South Point is 2.4 People.
What is Per Capita Income in South Point?
Per Capita income in South Point is $39,687.
What is the Median Family Income in South Point?
Median Family Income in South Point is $94,107.
What is the Median Household income in South Point?
Median Household Income in South Point is $76,344.
What is Income or Wage Gap in South Point?
Income or Wage Gap in South Point is 16.3%.
Women in South Point earn 83.7 cents for every dollar earned by a man.
What is Inequality or Gini Index in South Point?
Inequality or Gini Index in South Point is 0.44.
How Large is the Labor Force in South Point?
There are 1,666 People in the Labor Forcein in South Point.
What is the Percentage of People in the Labor Force in South Point?
67.9% of People are in the Labor Force in South Point.
What is the Unemployment Rate in South Point?
Unemployment Rate in South Point is 3.5%.