South Canal, OH
South Canal Map
South Canal Overview
1,013
TOTAL POPULATION
494
MALE POPULATION
519
FEMALE POPULATION
95.18
MALES / 100 FEMALES
105.06
FEMALES / 100 MALES
56.3
MEDIAN AGE
2.4
AVG FAMILY SIZE
2.1
AVG HOUSEHOLD SIZE
$33,319
PER CAPITA INCOME
$60,897
AVG FAMILY INCOME
$59,760
AVG HOUSEHOLD INCOME
27.2%
WAGE / INCOME GAP [ % ]
72.8¢/ $1
WAGE / INCOME GAP [ $ ]
0.35
INEQUALITY / GINI INDEX
479
LABOR FORCE [ PEOPLE ]
53.6%
PERCENT IN LABOR FORCE
2.5%
UNEMPLOYMENT RATE
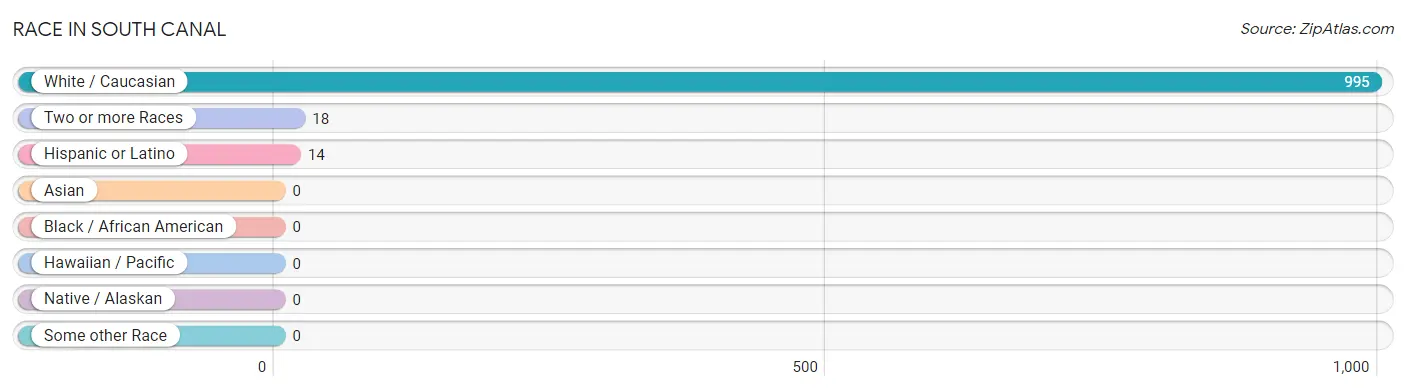
Race in South Canal
The most populous races in South Canal are White / Caucasian (995 | 98.2%), Two or more Races (18 | 1.8%), and Hispanic or Latino (14 | 1.4%).
| Race | # Population | % Population |
| Asian | 0 | 0.0% |
| Black / African American | 0 | 0.0% |
| Hawaiian / Pacific | 0 | 0.0% |
| Hispanic or Latino | 14 | 1.4% |
| Native / Alaskan | 0 | 0.0% |
| White / Caucasian | 995 | 98.2% |
| Two or more Races | 18 | 1.8% |
| Some other Race | 0 | 0.0% |
| Total | 1,013 | 100.0% |
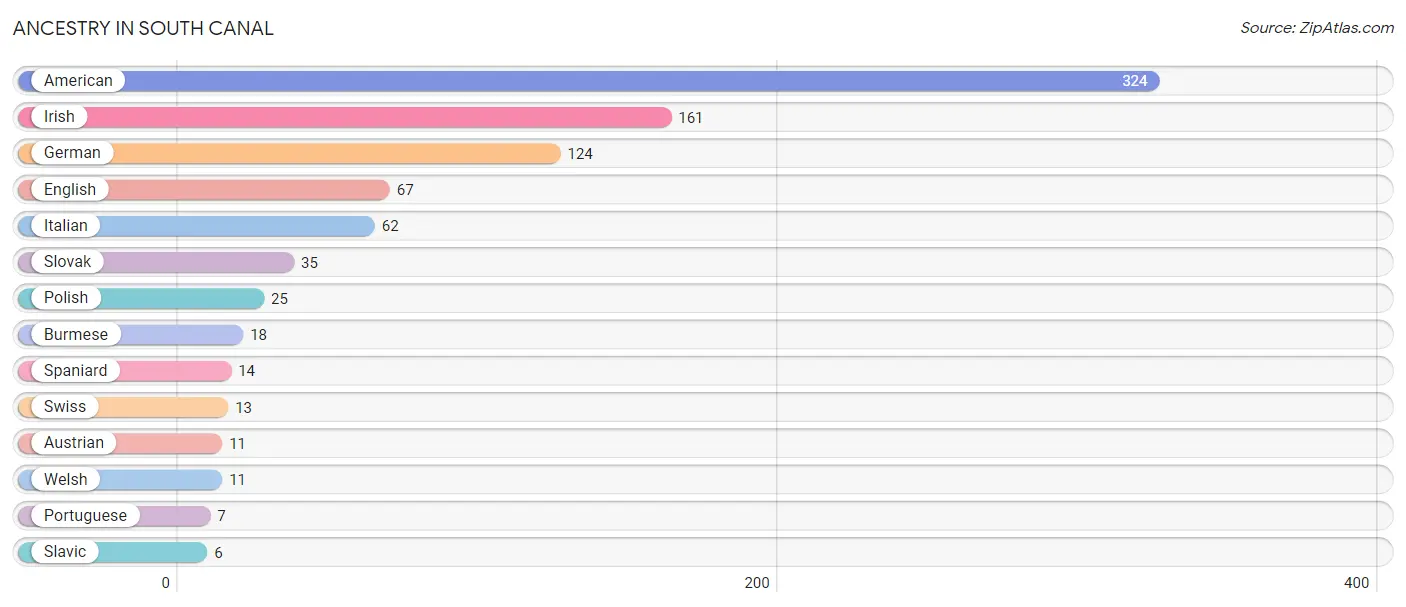
Ancestry in South Canal
The most populous ancestries reported in South Canal are American (324 | 32.0%), Irish (161 | 15.9%), German (124 | 12.2%), English (67 | 6.6%), and Italian (62 | 6.1%), together accounting for 72.8% of all South Canal residents.
| Ancestry | # Population | % Population |
| American | 324 | 32.0% |
| Austrian | 11 | 1.1% |
| Burmese | 18 | 1.8% |
| English | 67 | 6.6% |
| German | 124 | 12.2% |
| Irish | 161 | 15.9% |
| Italian | 62 | 6.1% |
| Polish | 25 | 2.5% |
| Portuguese | 7 | 0.7% |
| Slavic | 6 | 0.6% |
| Slovak | 35 | 3.5% |
| Spaniard | 14 | 1.4% |
| Swiss | 13 | 1.3% |
| Welsh | 11 | 1.1% | View All 14 Rows |
Immigrants in South Canal

| Immigration Origin | # Population | % Population | View All 0 Rows |
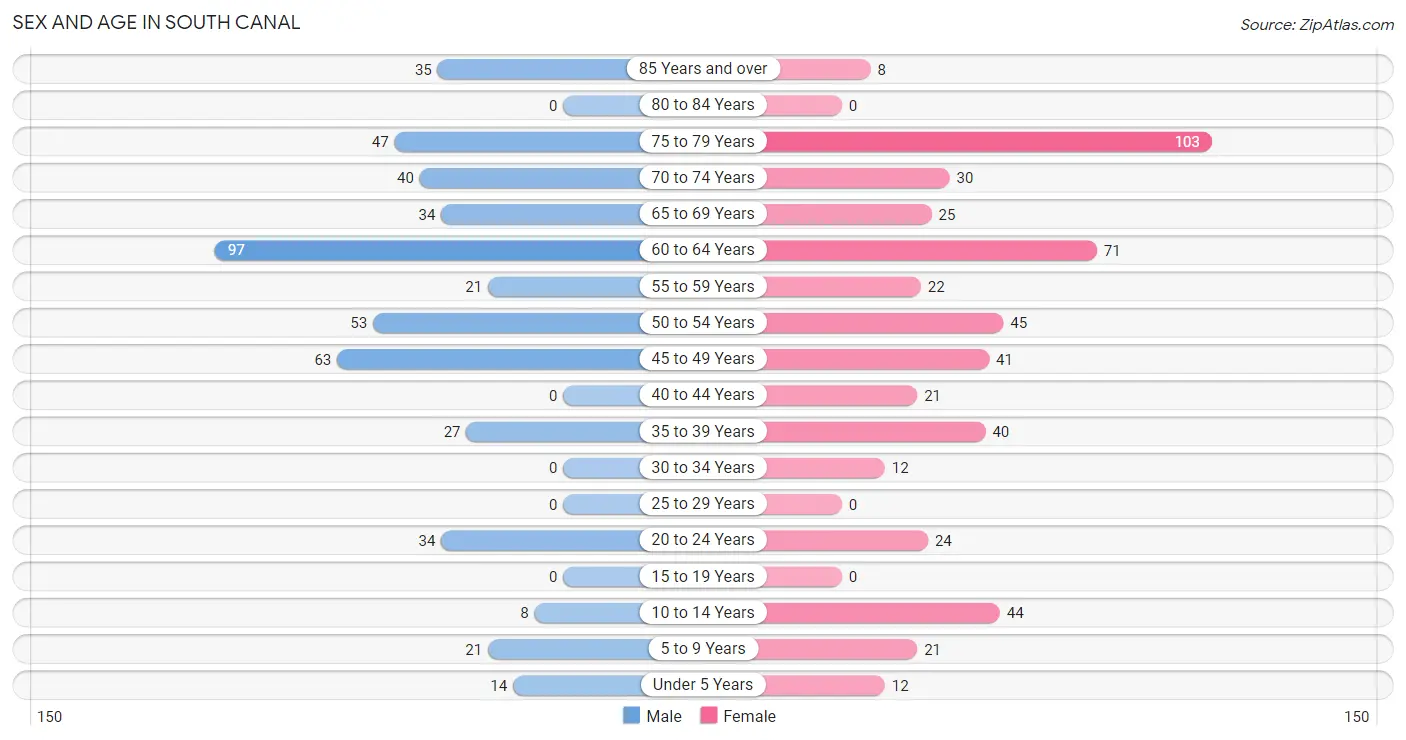
Sex and Age in South Canal
Sex and Age in South Canal
The most populous age groups in South Canal are 60 to 64 Years (97 | 19.6%) for men and 75 to 79 Years (103 | 19.9%) for women.
| Age Bracket | Male | Female |
| Under 5 Years | 14 (2.8%) | 12 (2.3%) |
| 5 to 9 Years | 21 (4.3%) | 21 (4.1%) |
| 10 to 14 Years | 8 (1.6%) | 44 (8.5%) |
| 15 to 19 Years | 0 (0.0%) | 0 (0.0%) |
| 20 to 24 Years | 34 (6.9%) | 24 (4.6%) |
| 25 to 29 Years | 0 (0.0%) | 0 (0.0%) |
| 30 to 34 Years | 0 (0.0%) | 12 (2.3%) |
| 35 to 39 Years | 27 (5.5%) | 40 (7.7%) |
| 40 to 44 Years | 0 (0.0%) | 21 (4.1%) |
| 45 to 49 Years | 63 (12.8%) | 41 (7.9%) |
| 50 to 54 Years | 53 (10.7%) | 45 (8.7%) |
| 55 to 59 Years | 21 (4.3%) | 22 (4.2%) |
| 60 to 64 Years | 97 (19.6%) | 71 (13.7%) |
| 65 to 69 Years | 34 (6.9%) | 25 (4.8%) |
| 70 to 74 Years | 40 (8.1%) | 30 (5.8%) |
| 75 to 79 Years | 47 (9.5%) | 103 (19.9%) |
| 80 to 84 Years | 0 (0.0%) | 0 (0.0%) |
| 85 Years and over | 35 (7.1%) | 8 (1.5%) |
| Total | 494 (100.0%) | 519 (100.0%) |
Families and Households in South Canal
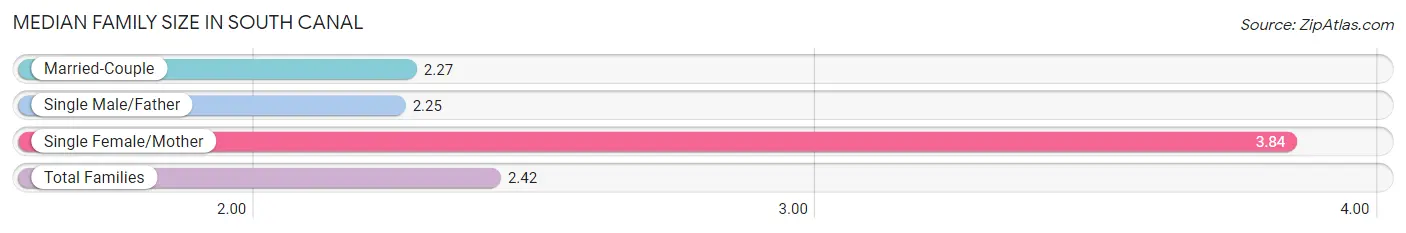
Median Family Size in South Canal
The median family size in South Canal is 2.42 persons per family, with single female/mother families (31 | 9.4%) accounting for the largest median family size of 3.84 persons per family. On the other hand, single male/father families (8 | 2.4%) represent the smallest median family size with 2.25 persons per family.
| Family Type | # Families | Family Size |
| Married-Couple | 290 (88.1%) | 2.27 |
| Single Male/Father | 8 (2.4%) | 2.25 |
| Single Female/Mother | 31 (9.4%) | 3.84 |
| Total Families | 329 (100.0%) | 2.42 |
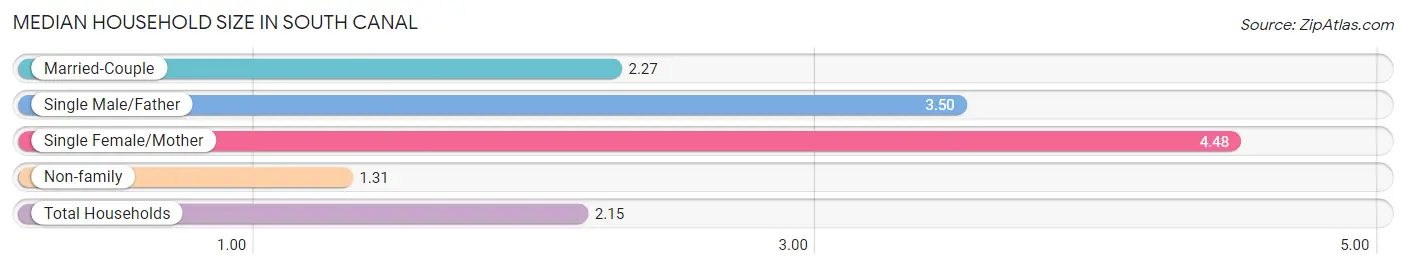
Median Household Size in South Canal
The median household size in South Canal is 2.15 persons per household, with single female/mother households (31 | 6.6%) accounting for the largest median household size of 4.48 persons per household. non-family households (143 | 30.3%) represent the smallest median household size with 1.31 persons per household.
| Household Type | # Households | Household Size |
| Married-Couple | 290 (61.4%) | 2.27 |
| Single Male/Father | 8 (1.7%) | 3.50 |
| Single Female/Mother | 31 (6.6%) | 4.48 |
| Non-family | 143 (30.3%) | 1.31 |
| Total Households | 472 (100.0%) | 2.15 |
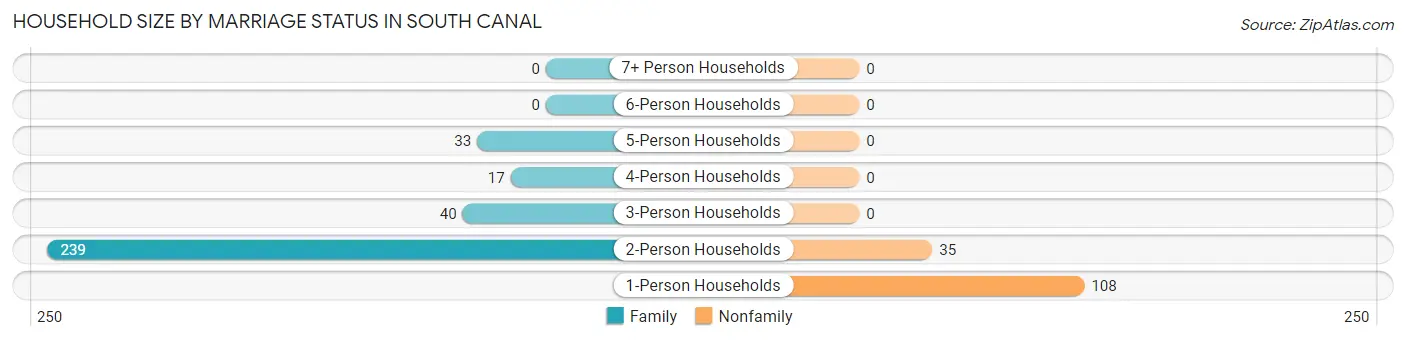
Household Size by Marriage Status in South Canal
Out of a total of 472 households in South Canal, 329 (69.7%) are family households, while 143 (30.3%) are nonfamily households. The most numerous type of family households are 2-person households, comprising 239, and the most common type of nonfamily households are 1-person households, comprising 108.
| Household Size | Family Households | Nonfamily Households |
| 1-Person Households | - | 108 (22.9%) |
| 2-Person Households | 239 (50.6%) | 35 (7.4%) |
| 3-Person Households | 40 (8.5%) | 0 (0.0%) |
| 4-Person Households | 17 (3.6%) | 0 (0.0%) |
| 5-Person Households | 33 (7.0%) | 0 (0.0%) |
| 6-Person Households | 0 (0.0%) | 0 (0.0%) |
| 7+ Person Households | 0 (0.0%) | 0 (0.0%) |
| Total | 329 (69.7%) | 143 (30.3%) |
Female Fertility in South Canal
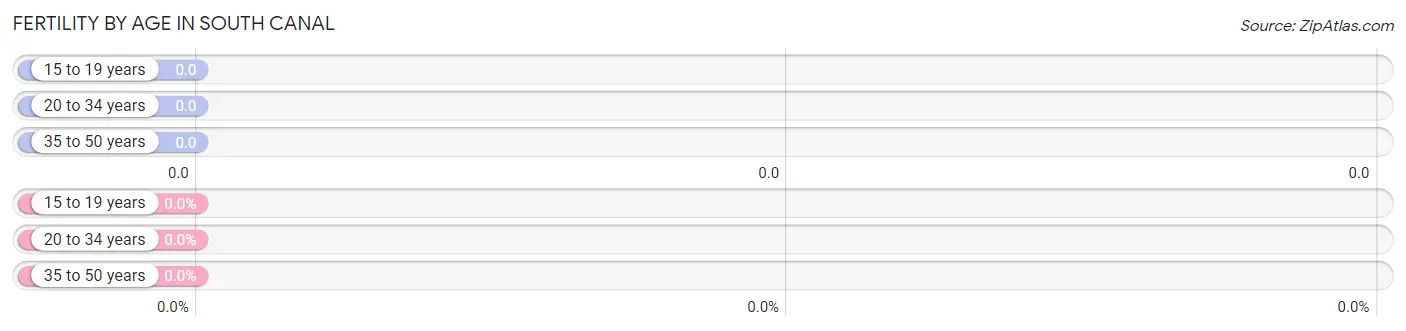
Fertility by Age in South Canal
| Age Bracket | Women with Births | Births / 1,000 Women |
| 15 to 19 years | 0 (0.0%) | 0.0 |
| 20 to 34 years | 0 (0.0%) | 0.0 |
| 35 to 50 years | 0 (0.0%) | 0.0 |
| Total | 0 (0.0%) | 0.0 |
Fertility by Age by Marriage Status in South Canal
| Age Bracket | Married | Unmarried |
| 15 to 19 years | 0 (0.0%) | 0 (0.0%) |
| 20 to 34 years | 0 (0.0%) | 0 (0.0%) |
| 35 to 50 years | 0 (0.0%) | 0 (0.0%) |
| Total | 0 (0.0%) | 0 (0.0%) |
Fertility by Education in South Canal
| Educational Attainment | Women with Births | Births / 1,000 Women |
| Less than High School | 0 (0.0%) | 0.0 |
| High School Diploma | 0 (0.0%) | 0.0 |
| College or Associate's Degree | 0 (0.0%) | 0.0 |
| Bachelor's Degree | 0 (0.0%) | 0.0 |
| Graduate Degree | 0 (0.0%) | 0.0 |
| Total | 0 (0.0%) | 0.0 |
Fertility by Education by Marriage Status in South Canal
| Educational Attainment | Married | Unmarried |
| Less than High School | 0 (0.0%) | 0 (0.0%) |
| High School Diploma | 0 (0.0%) | 0 (0.0%) |
| College or Associate's Degree | 0 (0.0%) | 0 (0.0%) |
| Bachelor's Degree | 0 (0.0%) | 0 (0.0%) |
| Graduate Degree | 0 (0.0%) | 0 (0.0%) |
| Total | 0 (0.0%) | 0 (0.0%) |
Income in South Canal
Income Overview in South Canal
Per Capita Income in South Canal is $33,319, while median incomes of families and households are $60,897 and $59,760 respectively.
| Characteristic | Number | Measure |
| Per Capita Income | 1,013 | $33,319 |
| Median Family Income | 329 | $60,897 |
| Mean Family Income | 329 | $79,966 |
| Median Household Income | 472 | $59,760 |
| Mean Household Income | 472 | $71,728 |
| Income Deficit | 329 | $0 |
| Wage / Income Gap (%) | 1,013 | 27.22% |
| Wage / Income Gap ($) | 1,013 | 72.78¢ per $1 |
| Gini / Inequality Index | 1,013 | 0.35 |
Earnings by Sex in South Canal
Average Earnings in South Canal are $38,036, $41,136 for men and $29,940 for women, a difference of 27.2%.
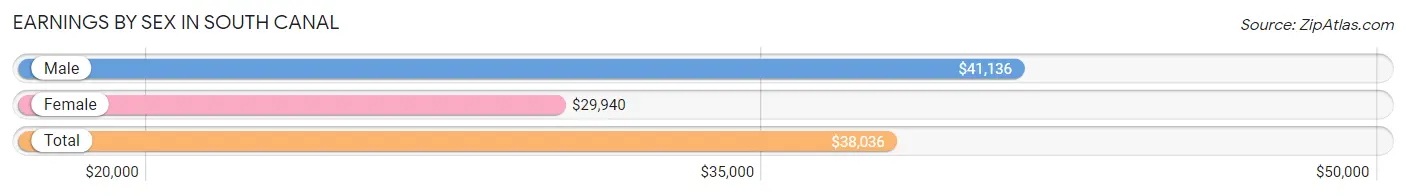
| Sex | Number | Average Earnings |
| Male | 284 (57.4%) | $41,136 |
| Female | 211 (42.6%) | $29,940 |
| Total | 495 (100.0%) | $38,036 |
Earnings by Sex by Income Bracket in South Canal
The most common earnings brackets in South Canal are $55,000 to $64,999 for men (52 | 18.3%) and $40,000 to $44,999 for women (41 | 19.4%).
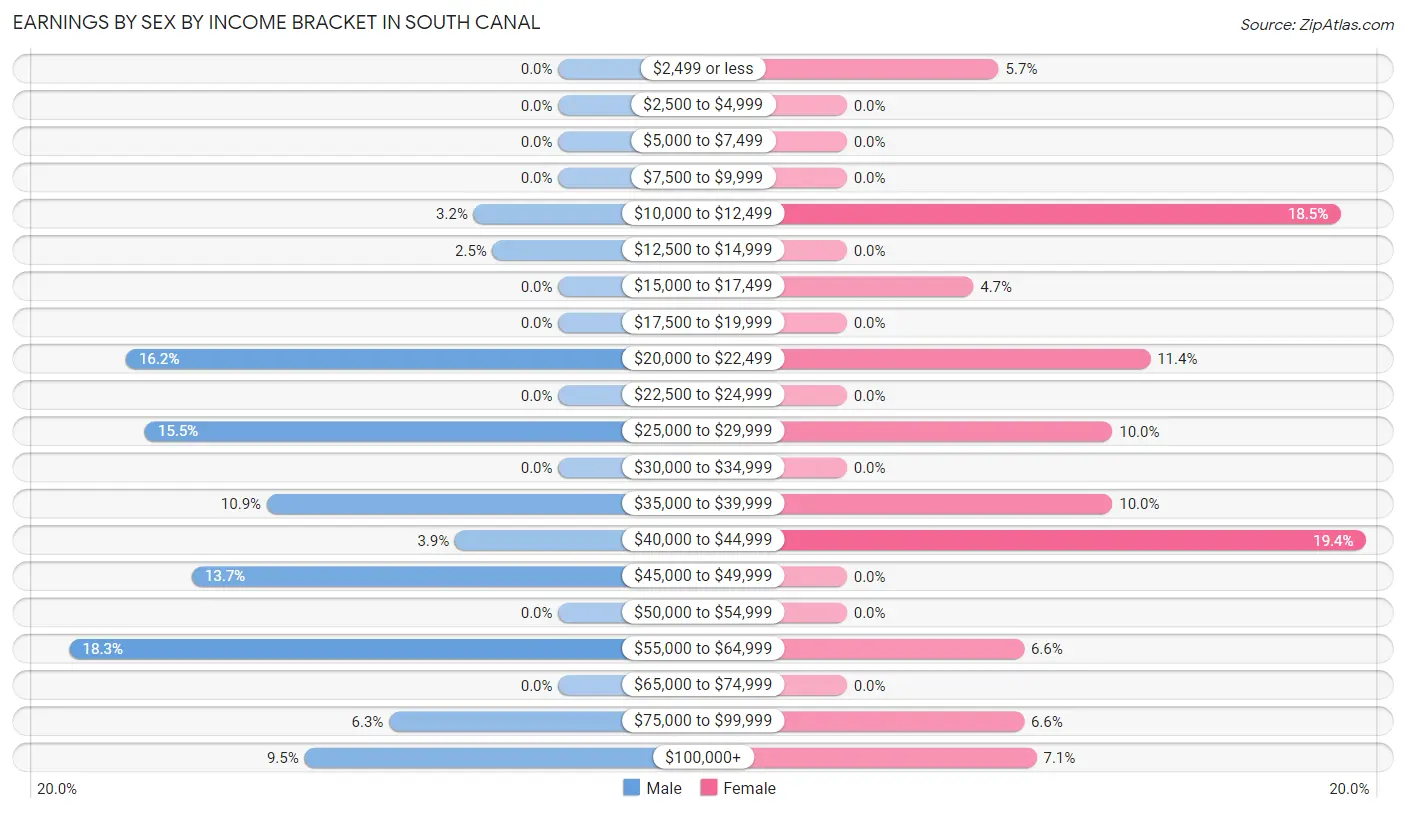
| Income | Male | Female |
| $2,499 or less | 0 (0.0%) | 12 (5.7%) |
| $2,500 to $4,999 | 0 (0.0%) | 0 (0.0%) |
| $5,000 to $7,499 | 0 (0.0%) | 0 (0.0%) |
| $7,500 to $9,999 | 0 (0.0%) | 0 (0.0%) |
| $10,000 to $12,499 | 9 (3.2%) | 39 (18.5%) |
| $12,500 to $14,999 | 7 (2.5%) | 0 (0.0%) |
| $15,000 to $17,499 | 0 (0.0%) | 10 (4.7%) |
| $17,500 to $19,999 | 0 (0.0%) | 0 (0.0%) |
| $20,000 to $22,499 | 46 (16.2%) | 24 (11.4%) |
| $22,500 to $24,999 | 0 (0.0%) | 0 (0.0%) |
| $25,000 to $29,999 | 44 (15.5%) | 21 (10.0%) |
| $30,000 to $34,999 | 0 (0.0%) | 0 (0.0%) |
| $35,000 to $39,999 | 31 (10.9%) | 21 (10.0%) |
| $40,000 to $44,999 | 11 (3.9%) | 41 (19.4%) |
| $45,000 to $49,999 | 39 (13.7%) | 0 (0.0%) |
| $50,000 to $54,999 | 0 (0.0%) | 0 (0.0%) |
| $55,000 to $64,999 | 52 (18.3%) | 14 (6.6%) |
| $65,000 to $74,999 | 0 (0.0%) | 0 (0.0%) |
| $75,000 to $99,999 | 18 (6.3%) | 14 (6.6%) |
| $100,000+ | 27 (9.5%) | 15 (7.1%) |
| Total | 284 (100.0%) | 211 (100.0%) |
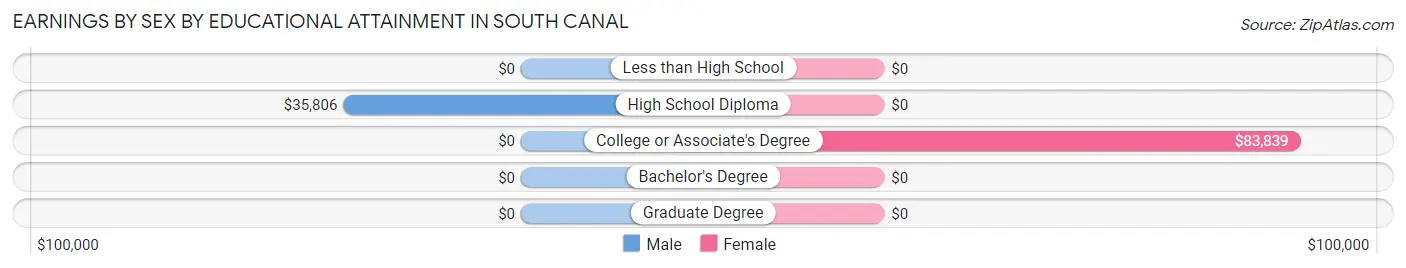
Earnings by Sex by Educational Attainment in South Canal
Average earnings in South Canal are $45,705 for men and $38,869 for women, a difference of 15.0%. Men with an educational attainment of high school diploma enjoy the highest average annual earnings of $35,806, while those with high school diploma education earn the least with $35,806. Women with an educational attainment of college or associate's degree earn the most with the average annual earnings of $83,839, while those with college or associate's degree education have the smallest earnings of $83,839.
| Educational Attainment | Male Income | Female Income |
| Less than High School | - | - |
| High School Diploma | $35,806 | $0 |
| College or Associate's Degree | - | - |
| Bachelor's Degree | - | - |
| Graduate Degree | - | - |
| Total | $45,705 | $38,869 |
Family Income in South Canal
Family Income Brackets in South Canal
According to the South Canal family income data, there are 159 families falling into the $50,000 to $74,999 income range, which is the most common income bracket and makes up 48.3% of all families.
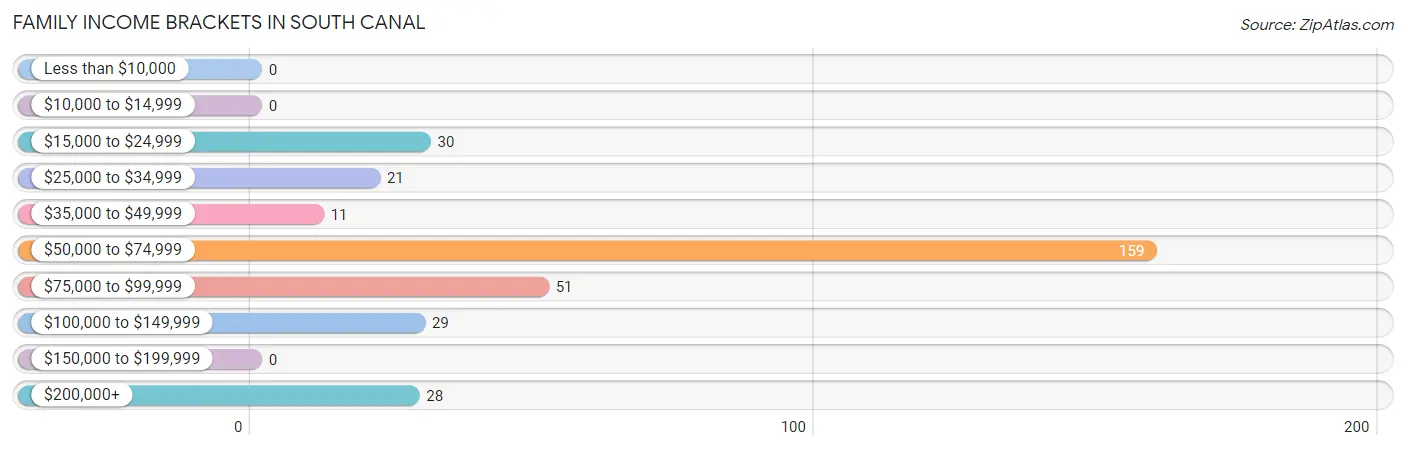
| Income Bracket | # Families | % Families |
| Less than $10,000 | 0 | 0.0% |
| $10,000 to $14,999 | 0 | 0.0% |
| $15,000 to $24,999 | 30 | 9.1% |
| $25,000 to $34,999 | 21 | 6.4% |
| $35,000 to $49,999 | 11 | 3.3% |
| $50,000 to $74,999 | 159 | 48.3% |
| $75,000 to $99,999 | 51 | 15.5% |
| $100,000 to $149,999 | 29 | 8.8% |
| $150,000 to $199,999 | 0 | 0.0% |
| $200,000+ | 28 | 8.5% |
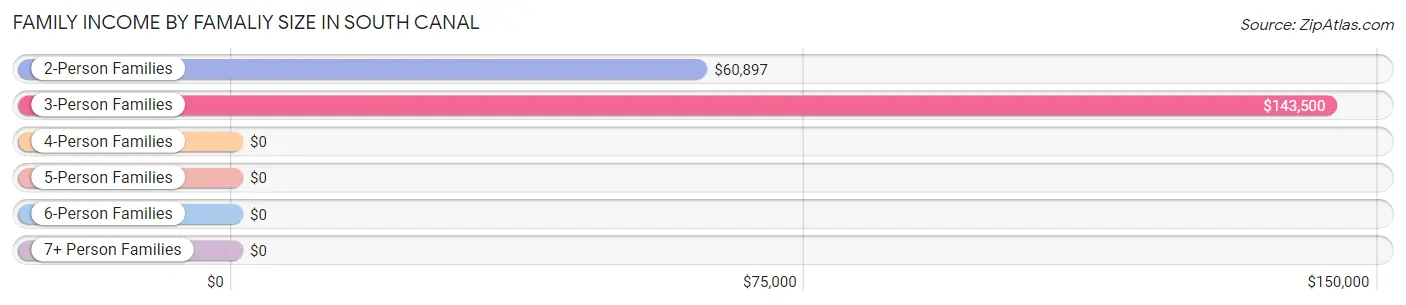
Family Income by Famaliy Size in South Canal
3-person families (32 | 9.7%) account for the highest median family income in South Canal with $143,500 per family, while 3-person families (32 | 9.7%) have the highest median income of $47,833 per family member.
| Income Bracket | # Families | Median Income |
| 2-Person Families | 247 (75.1%) | $60,897 |
| 3-Person Families | 32 (9.7%) | $143,500 |
| 4-Person Families | 38 (11.6%) | $0 |
| 5-Person Families | 12 (3.6%) | $0 |
| 6-Person Families | 0 (0.0%) | $0 |
| 7+ Person Families | 0 (0.0%) | $0 |
| Total | 329 (100.0%) | $60,897 |
Family Income by Number of Earners in South Canal
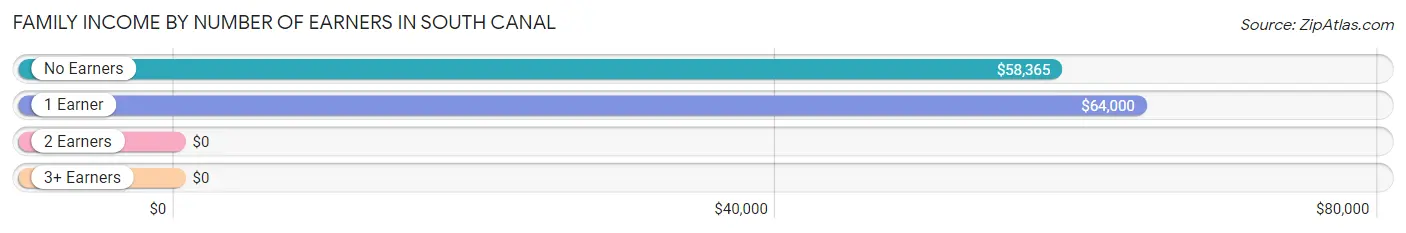
| Number of Earners | # Families | Median Income |
| No Earners | 119 (36.2%) | $58,365 |
| 1 Earner | 80 (24.3%) | $64,000 |
| 2 Earners | 130 (39.5%) | $0 |
| 3+ Earners | 0 (0.0%) | $0 |
| Total | 329 (100.0%) | $60,897 |
Household Income in South Canal
Household Income Brackets in South Canal
With 159 households falling in the category, the $50,000 to $74,999 income range is the most frequent in South Canal, accounting for 33.7% of all households.
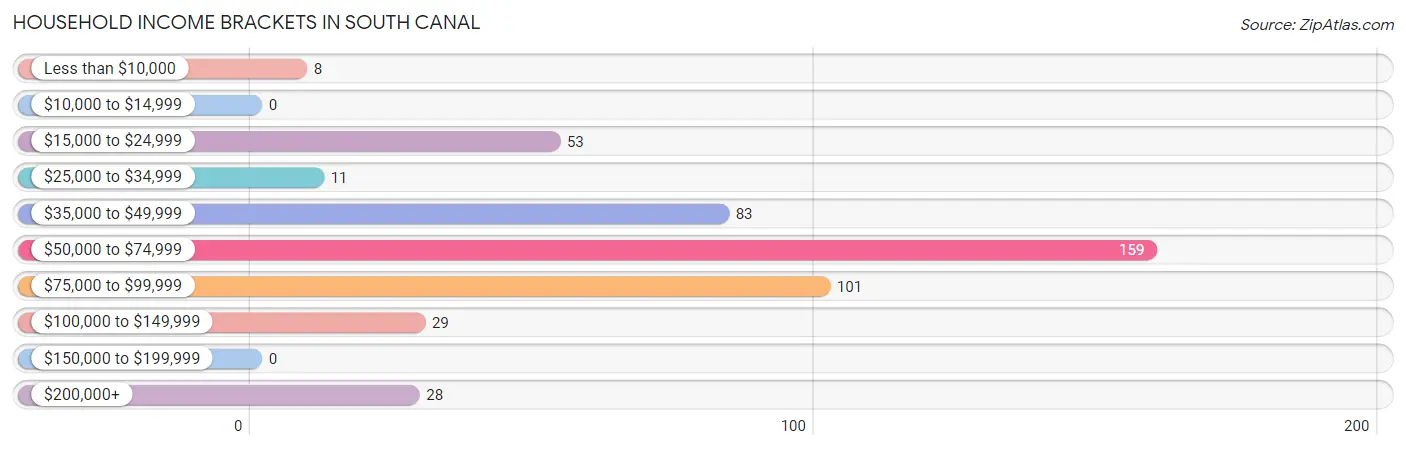
| Income Bracket | # Households | % Households |
| Less than $10,000 | 8 | 1.7% |
| $10,000 to $14,999 | 0 | 0.0% |
| $15,000 to $24,999 | 53 | 11.2% |
| $25,000 to $34,999 | 11 | 2.3% |
| $35,000 to $49,999 | 83 | 17.6% |
| $50,000 to $74,999 | 159 | 33.7% |
| $75,000 to $99,999 | 101 | 21.4% |
| $100,000 to $149,999 | 29 | 6.1% |
| $150,000 to $199,999 | 0 | 0.0% |
| $200,000+ | 28 | 5.9% |
Household Income by Householder Age in South Canal
The median household income in South Canal is $59,760, with the highest median household income of $86,071 found in the 25 to 44 years age bracket for the primary householder. A total of 38 households (8.1%) fall into this category. Meanwhile, the 15 to 24 years age bracket for the primary householder has the lowest median household income of $0, with 24 households (5.1%) in this group.
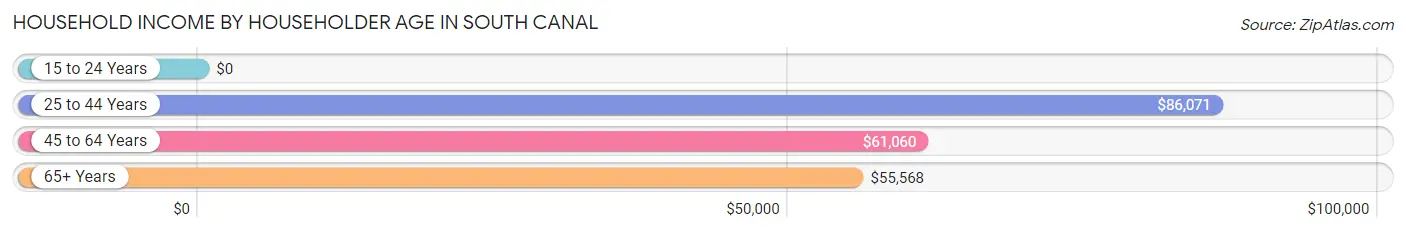
| Income Bracket | # Households | Median Income |
| 15 to 24 Years | 24 (5.1%) | $0 |
| 25 to 44 Years | 38 (8.1%) | $86,071 |
| 45 to 64 Years | 221 (46.8%) | $61,060 |
| 65+ Years | 189 (40.0%) | $55,568 |
| Total | 472 (100.0%) | $59,760 |
Poverty in South Canal
Income Below Poverty by Sex and Age in South Canal
With 2.2% poverty level for males and 22.4% for females among the residents of South Canal, 6 to 11 year old males and 6 to 11 year old females are the most vulnerable to poverty, with 11 males (52.4%) and 21 females (100.0%) in their respective age groups living below the poverty level.
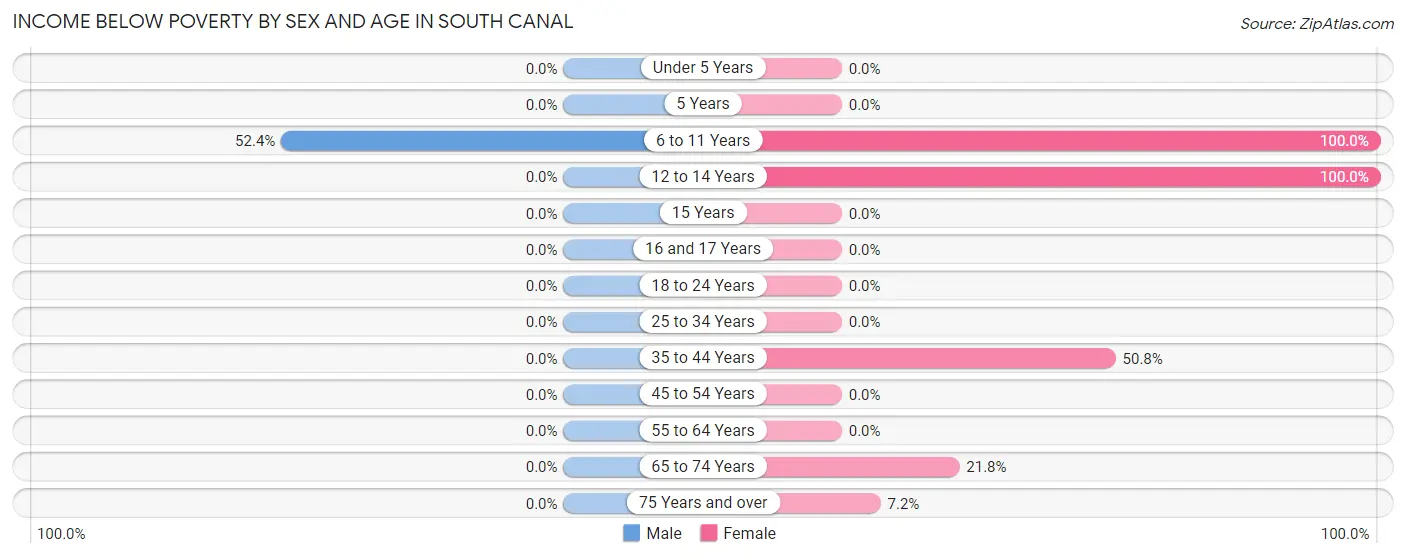
| Age Bracket | Male | Female |
| Under 5 Years | 0 (0.0%) | 0 (0.0%) |
| 5 Years | 0 (0.0%) | 0 (0.0%) |
| 6 to 11 Years | 11 (52.4%) | 21 (100.0%) |
| 12 to 14 Years | 0 (0.0%) | 44 (100.0%) |
| 15 Years | 0 (0.0%) | 0 (0.0%) |
| 16 and 17 Years | 0 (0.0%) | 0 (0.0%) |
| 18 to 24 Years | 0 (0.0%) | 0 (0.0%) |
| 25 to 34 Years | 0 (0.0%) | 0 (0.0%) |
| 35 to 44 Years | 0 (0.0%) | 31 (50.8%) |
| 45 to 54 Years | 0 (0.0%) | 0 (0.0%) |
| 55 to 64 Years | 0 (0.0%) | 0 (0.0%) |
| 65 to 74 Years | 0 (0.0%) | 12 (21.8%) |
| 75 Years and over | 0 (0.0%) | 8 (7.2%) |
| Total | 11 (2.2%) | 116 (22.4%) |
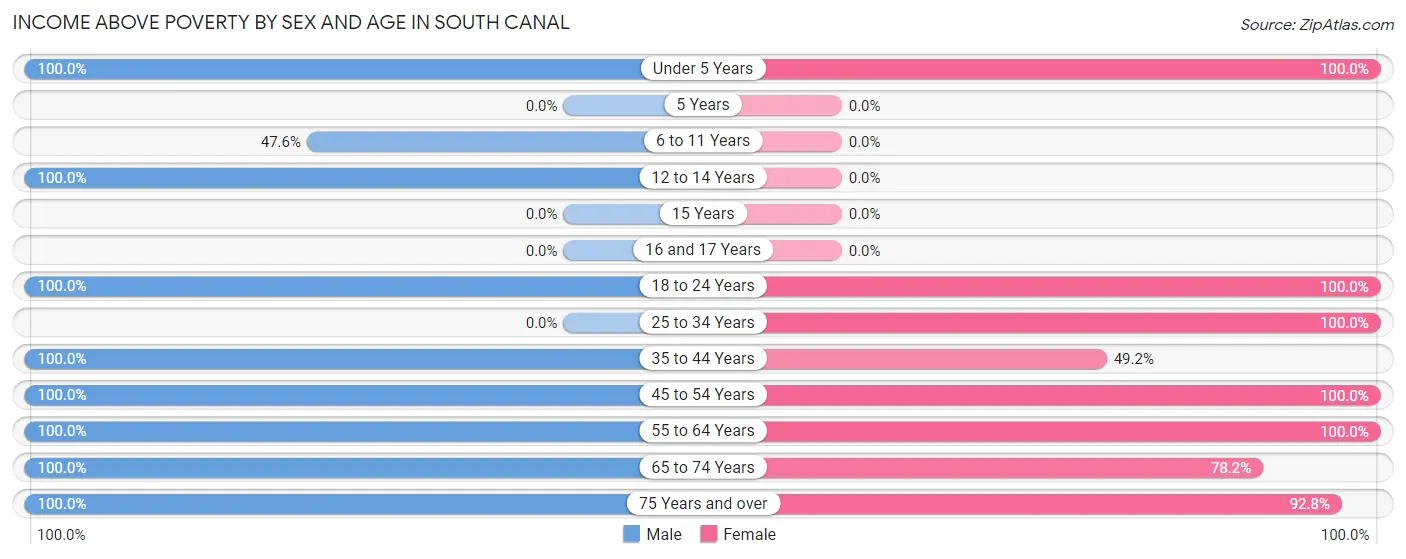
Income Above Poverty by Sex and Age in South Canal
According to the poverty statistics in South Canal, males aged under 5 years and females aged under 5 years are the age groups that are most secure financially, with 100.0% of males and 100.0% of females in these age groups living above the poverty line.
| Age Bracket | Male | Female |
| Under 5 Years | 14 (100.0%) | 12 (100.0%) |
| 5 Years | 0 (0.0%) | 0 (0.0%) |
| 6 to 11 Years | 10 (47.6%) | 0 (0.0%) |
| 12 to 14 Years | 8 (100.0%) | 0 (0.0%) |
| 15 Years | 0 (0.0%) | 0 (0.0%) |
| 16 and 17 Years | 0 (0.0%) | 0 (0.0%) |
| 18 to 24 Years | 34 (100.0%) | 24 (100.0%) |
| 25 to 34 Years | 0 (0.0%) | 12 (100.0%) |
| 35 to 44 Years | 27 (100.0%) | 30 (49.2%) |
| 45 to 54 Years | 116 (100.0%) | 86 (100.0%) |
| 55 to 64 Years | 118 (100.0%) | 93 (100.0%) |
| 65 to 74 Years | 74 (100.0%) | 43 (78.2%) |
| 75 Years and over | 82 (100.0%) | 103 (92.8%) |
| Total | 483 (97.8%) | 403 (77.6%) |
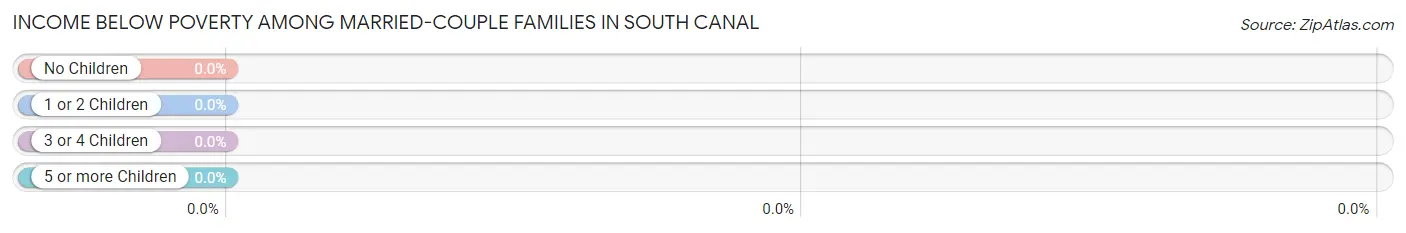
Income Below Poverty Among Married-Couple Families in South Canal
| Children | Above Poverty | Below Poverty |
| No Children | 261 (100.0%) | 0 (0.0%) |
| 1 or 2 Children | 29 (100.0%) | 0 (0.0%) |
| 3 or 4 Children | 0 (0.0%) | 0 (0.0%) |
| 5 or more Children | 0 (0.0%) | 0 (0.0%) |
| Total | 290 (100.0%) | 0 (0.0%) |
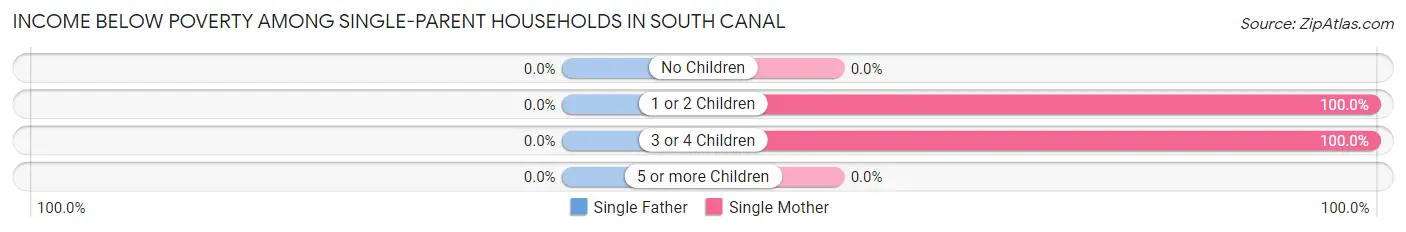
Income Below Poverty Among Single-Parent Households in South Canal
| Children | Single Father | Single Mother |
| No Children | 0 (0.0%) | 0 (0.0%) |
| 1 or 2 Children | 0 (0.0%) | 10 (100.0%) |
| 3 or 4 Children | 0 (0.0%) | 21 (100.0%) |
| 5 or more Children | 0 (0.0%) | 0 (0.0%) |
| Total | 0 (0.0%) | 31 (100.0%) |
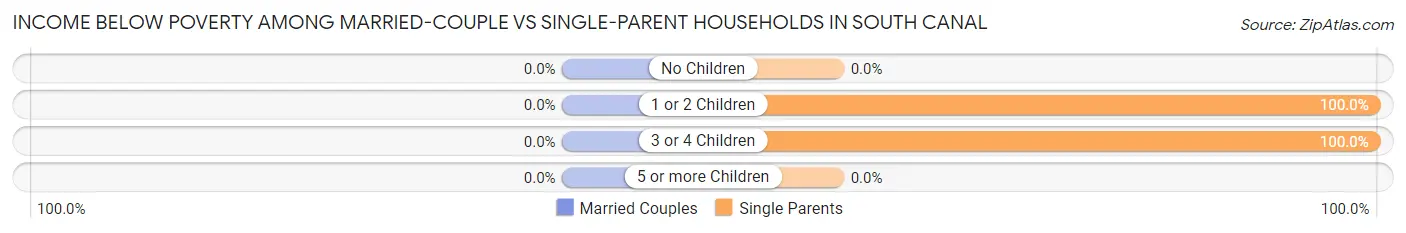
Income Below Poverty Among Married-Couple vs Single-Parent Households in South Canal
| Children | Married-Couple Families | Single-Parent Households |
| No Children | 0 (0.0%) | 0 (0.0%) |
| 1 or 2 Children | 0 (0.0%) | 10 (100.0%) |
| 3 or 4 Children | 0 (0.0%) | 21 (100.0%) |
| 5 or more Children | 0 (0.0%) | 0 (0.0%) |
| Total | 0 (0.0%) | 31 (79.5%) |
Employment Characteristics in South Canal
Employment by Class of Employer in South Canal
Among the 467 employed individuals in South Canal, private company employees (406 | 86.9%), federal government employees (41 | 8.8%), and self-employed (not incorporated) (13 | 2.8%) make up the most common classes of employment.
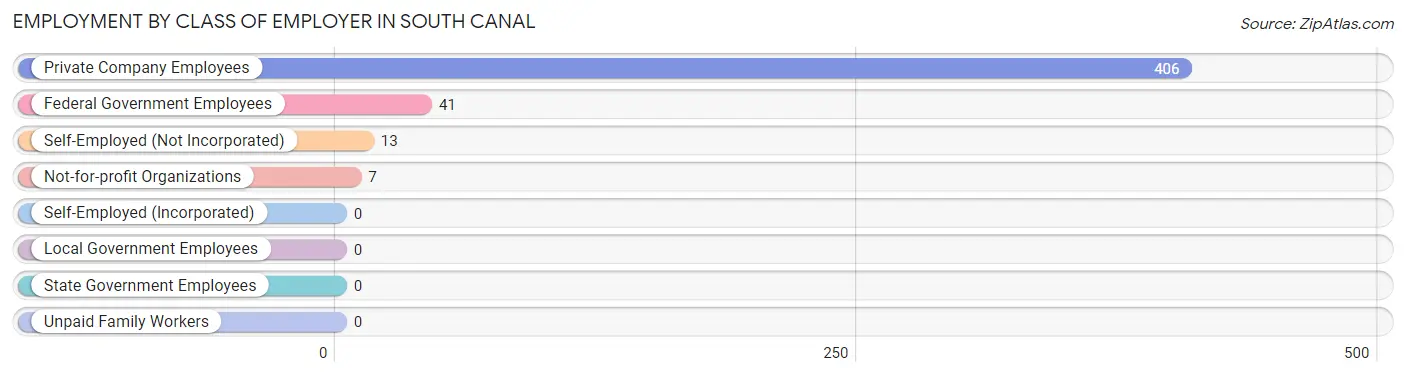
| Employer Class | # Employees | % Employees |
| Private Company Employees | 406 | 86.9% |
| Self-Employed (Incorporated) | 0 | 0.0% |
| Self-Employed (Not Incorporated) | 13 | 2.8% |
| Not-for-profit Organizations | 7 | 1.5% |
| Local Government Employees | 0 | 0.0% |
| State Government Employees | 0 | 0.0% |
| Federal Government Employees | 41 | 8.8% |
| Unpaid Family Workers | 0 | 0.0% |
| Total | 467 | 100.0% |
Employment Status by Age in South Canal
According to the labor force statistics for South Canal, out of the total population over 16 years of age (893), 53.6% or 479 individuals are in the labor force, with 2.5% or 12 of them unemployed. The age group with the highest labor force participation rate is 20 to 24 years, with 100.0% or 58 individuals in the labor force. Within the labor force, the 35 to 44 years age range has the highest percentage of unemployed individuals, with 13.6% or 12 of them being unemployed.
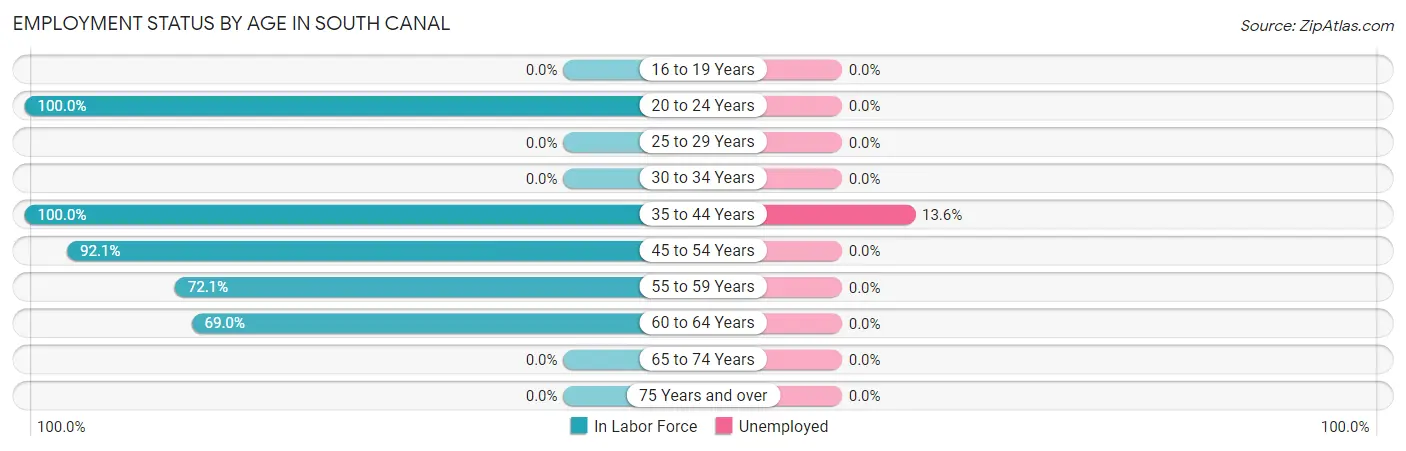
| Age Bracket | In Labor Force | Unemployed |
| 16 to 19 Years | 0 (0.0%) | 0 (0.0%) |
| 20 to 24 Years | 58 (100.0%) | 0 (0.0%) |
| 25 to 29 Years | 0 (0.0%) | 0 (0.0%) |
| 30 to 34 Years | 0 (0.0%) | 0 (0.0%) |
| 35 to 44 Years | 88 (100.0%) | 12 (13.6%) |
| 45 to 54 Years | 186 (92.1%) | 0 (0.0%) |
| 55 to 59 Years | 31 (72.1%) | 0 (0.0%) |
| 60 to 64 Years | 116 (69.0%) | 0 (0.0%) |
| 65 to 74 Years | 0 (0.0%) | 0 (0.0%) |
| 75 Years and over | 0 (0.0%) | 0 (0.0%) |
| Total | 479 (53.6%) | 12 (2.5%) |
Employment Status by Educational Attainment in South Canal
According to labor force statistics for South Canal, 82.1% of individuals (421) out of the total population between 25 and 64 years of age (513) are in the labor force, with 2.9% or 12 of them being unemployed. The group with the highest labor force participation rate are those with the educational attainment of bachelor's degree or higher, with 100.0% or 69 individuals in the labor force. Within the labor force, individuals with high school diploma education have the highest percentage of unemployment, with 5.9% or 12 of them being unemployed.
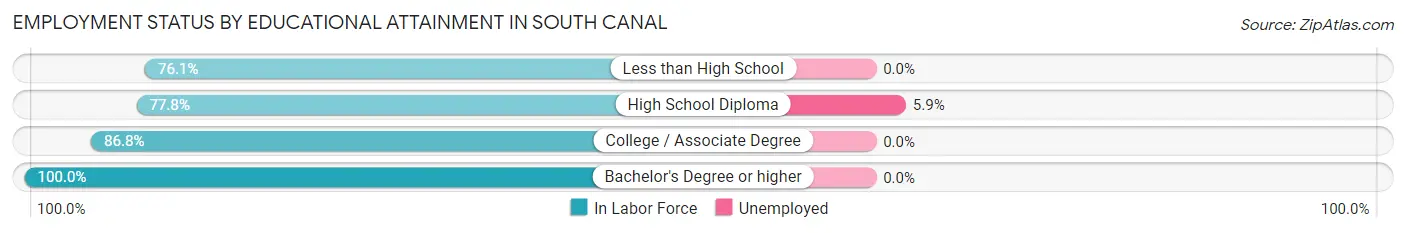
| Educational Attainment | In Labor Force | Unemployed |
| Less than High School | 70 (76.1%) | 0 (0.0%) |
| High School Diploma | 203 (77.8%) | 15 (5.9%) |
| College / Associate Degree | 79 (86.8%) | 0 (0.0%) |
| Bachelor's Degree or higher | 69 (100.0%) | 0 (0.0%) |
| Total | 421 (82.1%) | 15 (2.9%) |
Employment Occupations by Sex in South Canal
Management, Business, Science and Arts Occupations
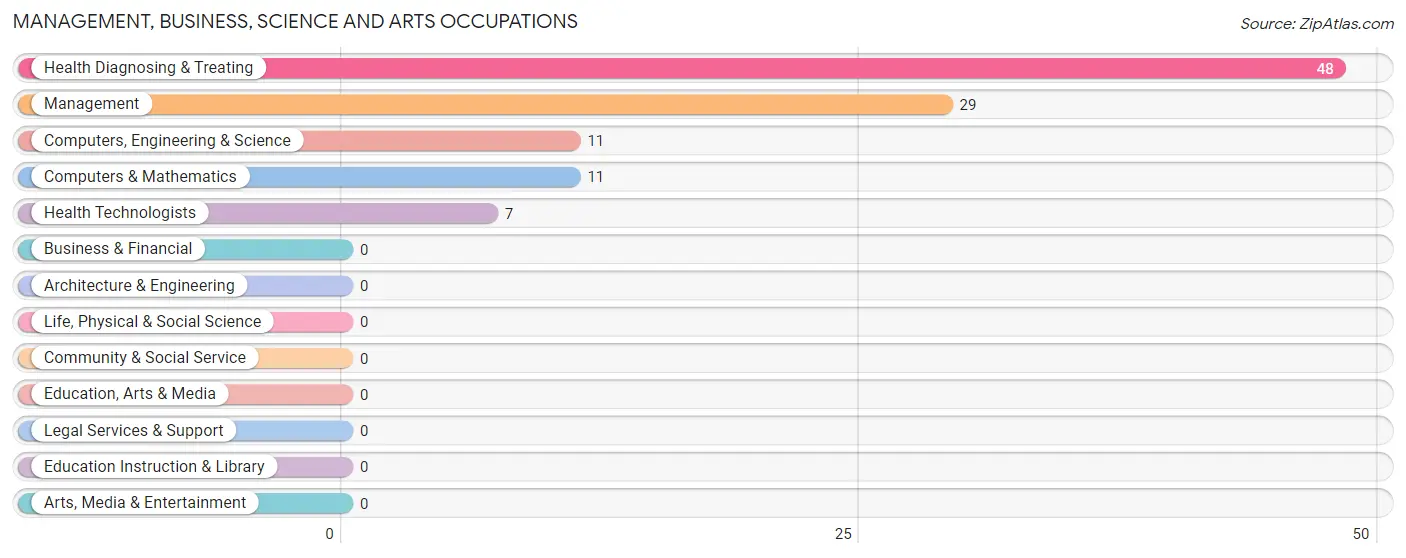
The most common Management, Business, Science and Arts occupations in South Canal are Health Diagnosing & Treating (48 | 10.3%), Management (29 | 6.2%), Computers, Engineering & Science (11 | 2.4%), Computers & Mathematics (11 | 2.4%), and Health Technologists (7 | 1.5%).
Management, Business, Science and Arts Occupations by Sex
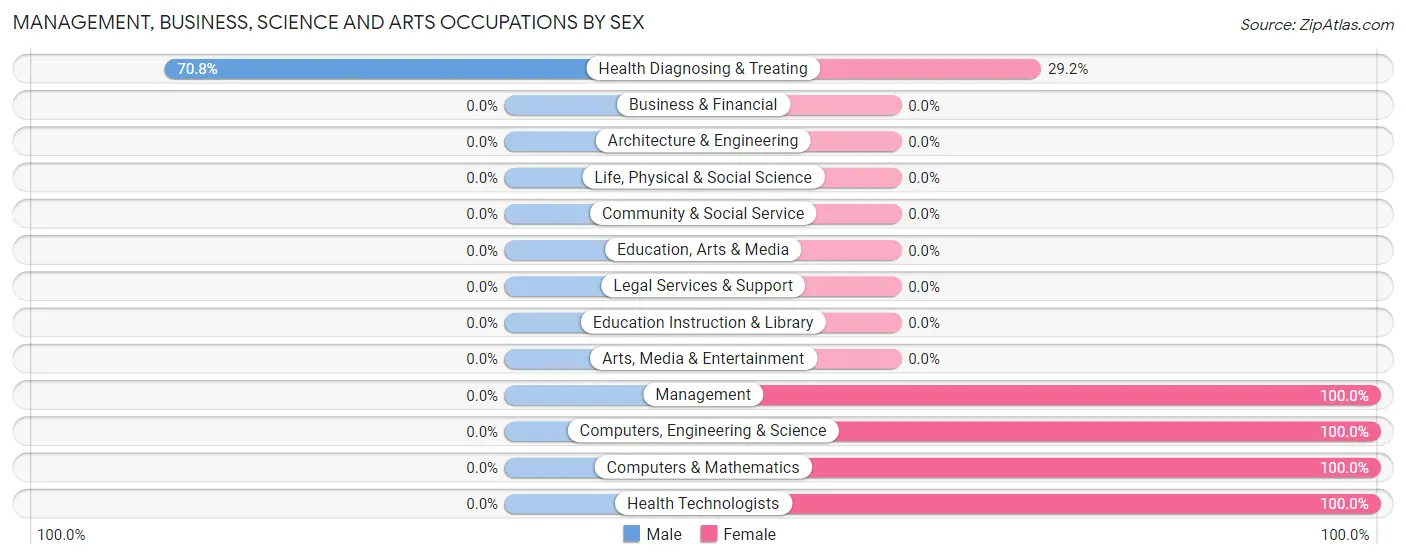
| Occupation | Male | Female |
| Management | 0 (0.0%) | 29 (100.0%) |
| Business & Financial | 0 (0.0%) | 0 (0.0%) |
| Computers, Engineering & Science | 0 (0.0%) | 11 (100.0%) |
| Computers & Mathematics | 0 (0.0%) | 11 (100.0%) |
| Architecture & Engineering | 0 (0.0%) | 0 (0.0%) |
| Life, Physical & Social Science | 0 (0.0%) | 0 (0.0%) |
| Community & Social Service | 0 (0.0%) | 0 (0.0%) |
| Education, Arts & Media | 0 (0.0%) | 0 (0.0%) |
| Legal Services & Support | 0 (0.0%) | 0 (0.0%) |
| Education Instruction & Library | 0 (0.0%) | 0 (0.0%) |
| Arts, Media & Entertainment | 0 (0.0%) | 0 (0.0%) |
| Health Diagnosing & Treating | 34 (70.8%) | 14 (29.2%) |
| Health Technologists | 0 (0.0%) | 7 (100.0%) |
| Total (Category) | 34 (38.6%) | 54 (61.4%) |
| Total (Overall) | 268 (57.4%) | 199 (42.6%) |
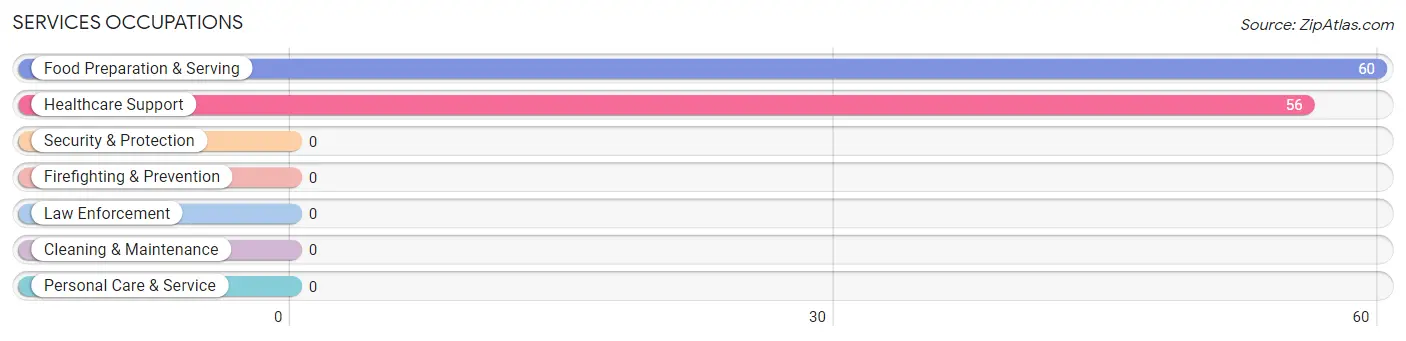
Services Occupations
The most common Services occupations in South Canal are Food Preparation & Serving (60 | 12.9%), and Healthcare Support (56 | 12.0%).
Services Occupations by Sex
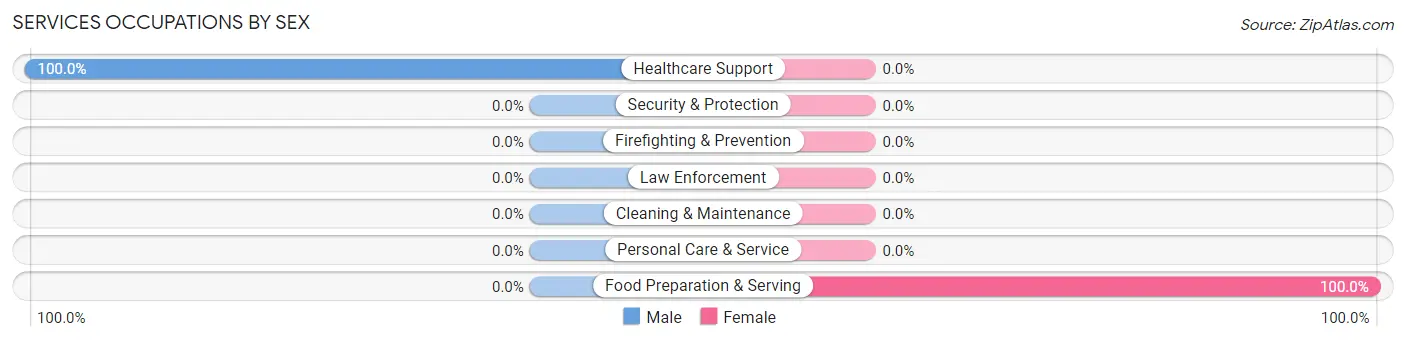
| Occupation | Male | Female |
| Healthcare Support | 56 (100.0%) | 0 (0.0%) |
| Security & Protection | 0 (0.0%) | 0 (0.0%) |
| Firefighting & Prevention | 0 (0.0%) | 0 (0.0%) |
| Law Enforcement | 0 (0.0%) | 0 (0.0%) |
| Food Preparation & Serving | 0 (0.0%) | 60 (100.0%) |
| Cleaning & Maintenance | 0 (0.0%) | 0 (0.0%) |
| Personal Care & Service | 0 (0.0%) | 0 (0.0%) |
| Total (Category) | 56 (48.3%) | 60 (51.7%) |
| Total (Overall) | 268 (57.4%) | 199 (42.6%) |
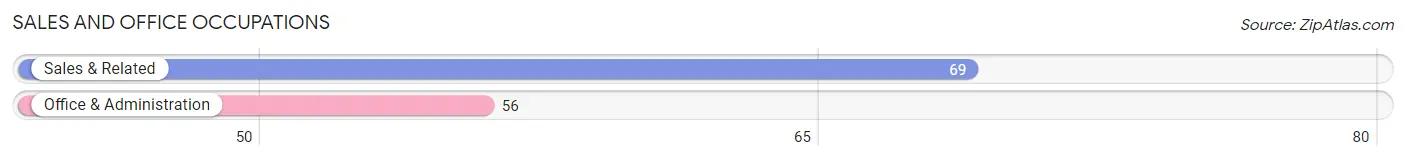
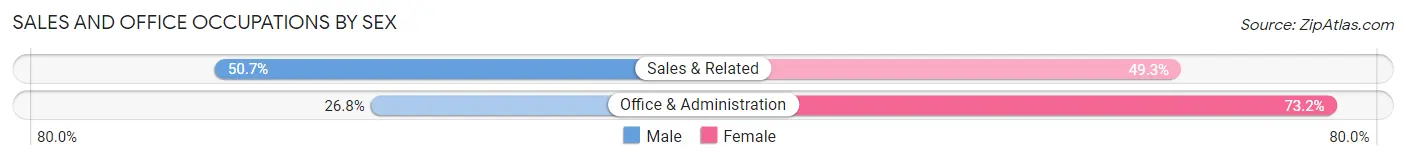
Sales and Office Occupations
The most common Sales and Office occupations in South Canal are Sales & Related (69 | 14.8%), and Office & Administration (56 | 12.0%).
Sales and Office Occupations by Sex
| Occupation | Male | Female |
| Sales & Related | 35 (50.7%) | 34 (49.3%) |
| Office & Administration | 15 (26.8%) | 41 (73.2%) |
| Total (Category) | 50 (40.0%) | 75 (60.0%) |
| Total (Overall) | 268 (57.4%) | 199 (42.6%) |
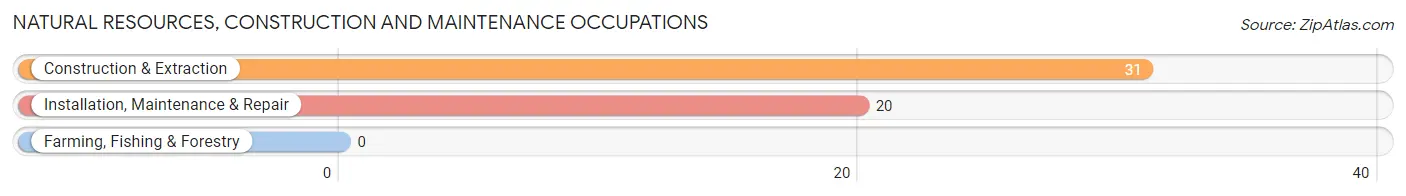
Natural Resources, Construction and Maintenance Occupations
The most common Natural Resources, Construction and Maintenance occupations in South Canal are Construction & Extraction (31 | 6.6%), and Installation, Maintenance & Repair (20 | 4.3%).
Natural Resources, Construction and Maintenance Occupations by Sex
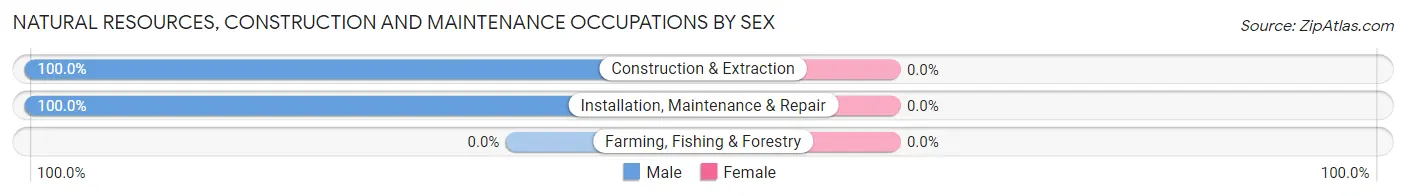
| Occupation | Male | Female |
| Farming, Fishing & Forestry | 0 (0.0%) | 0 (0.0%) |
| Construction & Extraction | 31 (100.0%) | 0 (0.0%) |
| Installation, Maintenance & Repair | 20 (100.0%) | 0 (0.0%) |
| Total (Category) | 51 (100.0%) | 0 (0.0%) |
| Total (Overall) | 268 (57.4%) | 199 (42.6%) |
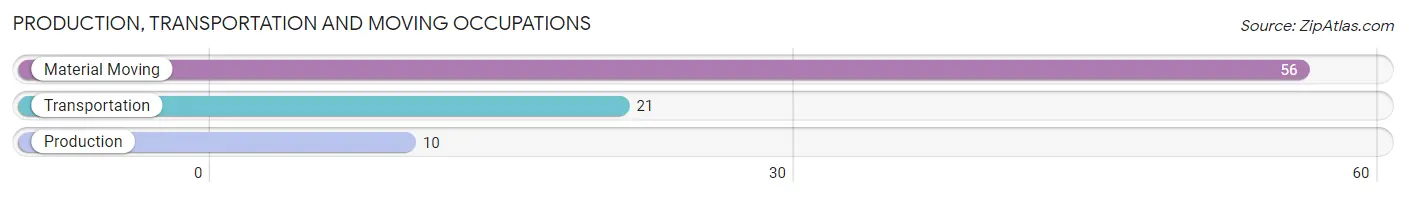
Production, Transportation and Moving Occupations
The most common Production, Transportation and Moving occupations in South Canal are Material Moving (56 | 12.0%), Transportation (21 | 4.5%), and Production (10 | 2.1%).
Production, Transportation and Moving Occupations by Sex
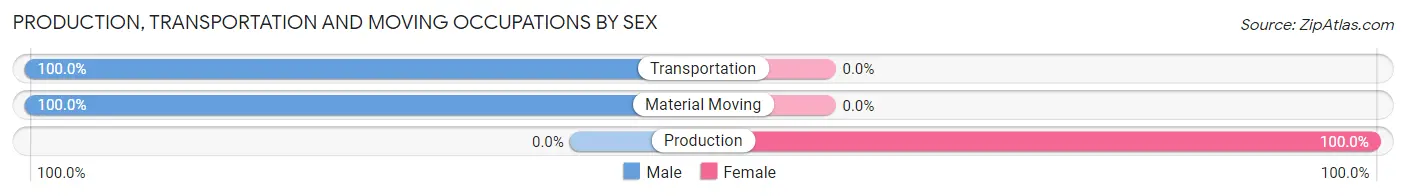
| Occupation | Male | Female |
| Production | 0 (0.0%) | 10 (100.0%) |
| Transportation | 21 (100.0%) | 0 (0.0%) |
| Material Moving | 56 (100.0%) | 0 (0.0%) |
| Total (Category) | 77 (88.5%) | 10 (11.5%) |
| Total (Overall) | 268 (57.4%) | 199 (42.6%) |
Employment Industries by Sex in South Canal
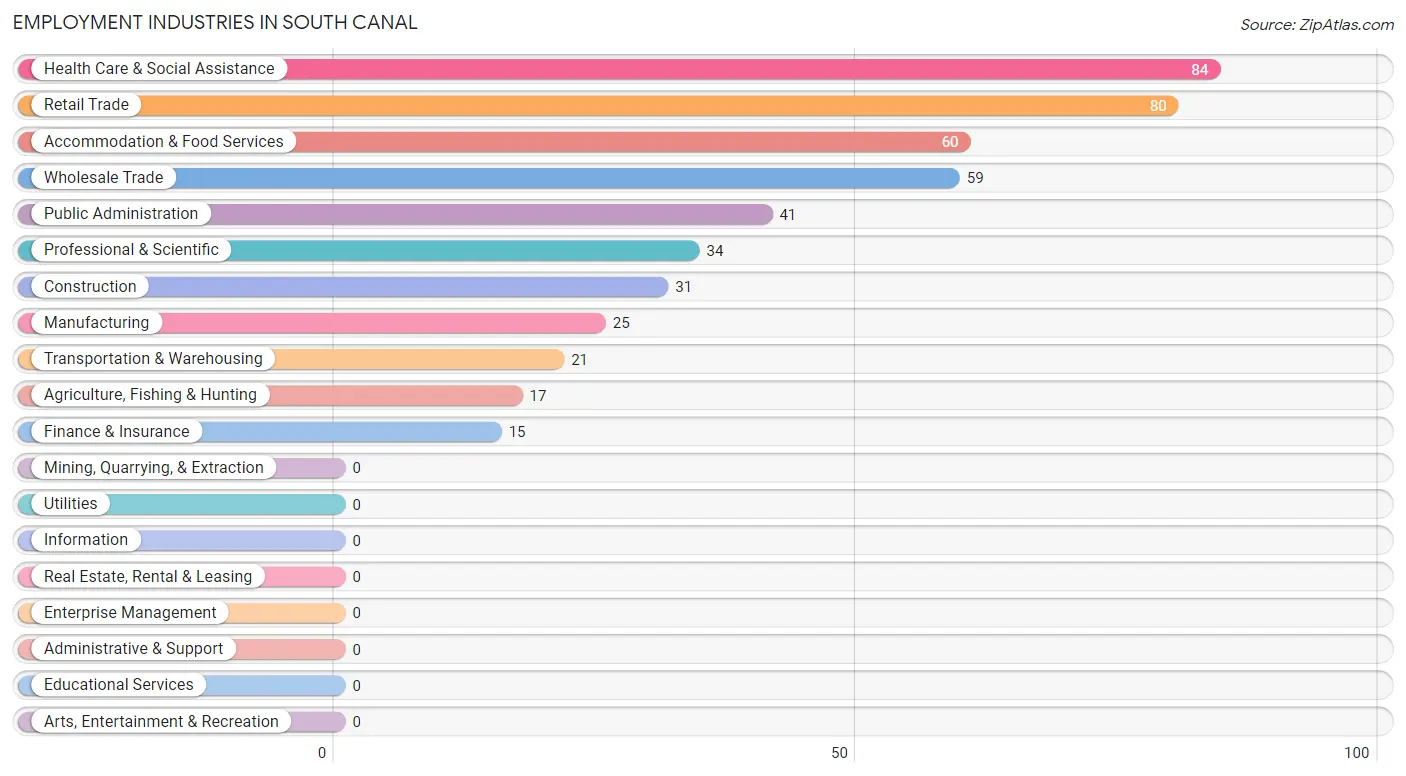
Employment Industries in South Canal
The major employment industries in South Canal include Health Care & Social Assistance (84 | 18.0%), Retail Trade (80 | 17.1%), Accommodation & Food Services (60 | 12.9%), Wholesale Trade (59 | 12.6%), and Public Administration (41 | 8.8%).
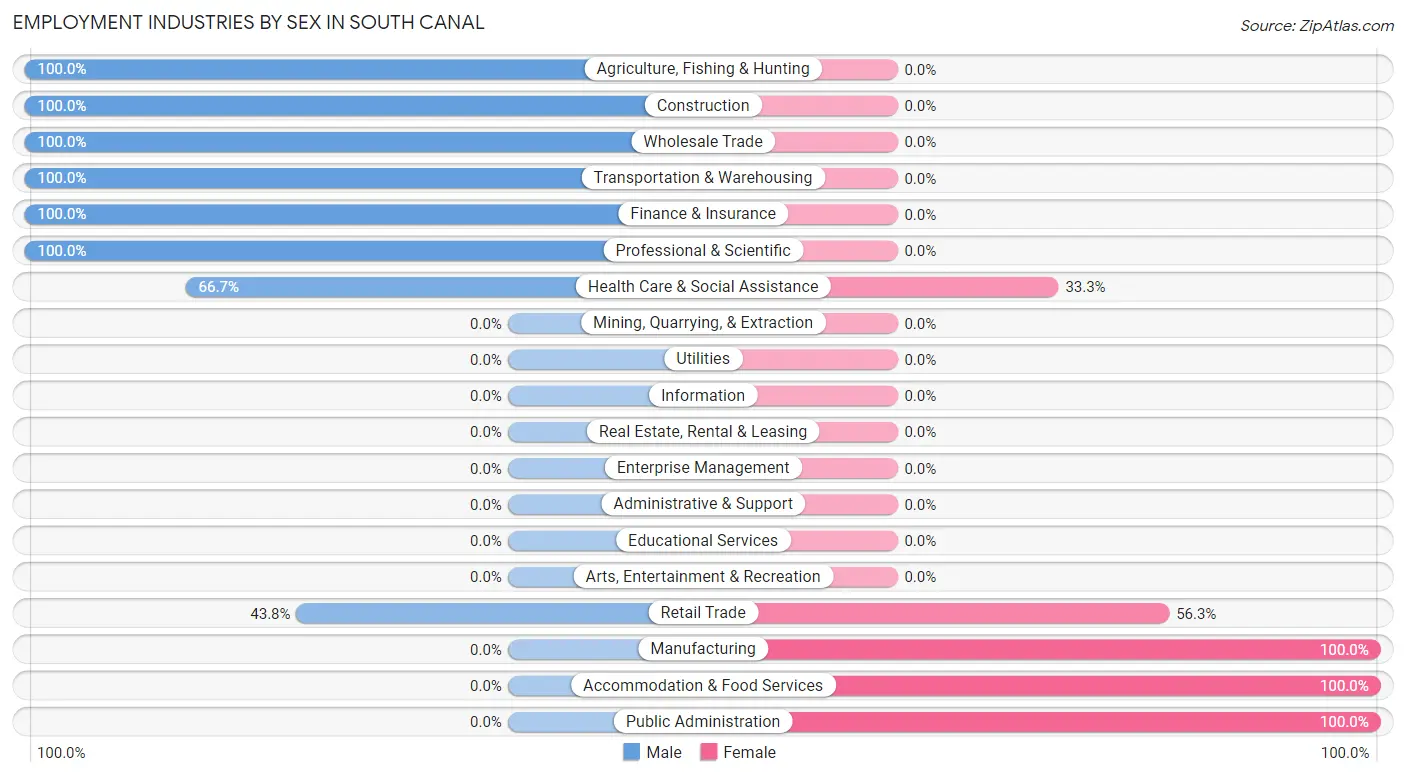
Employment Industries by Sex in South Canal
The South Canal industries that see more men than women are Agriculture, Fishing & Hunting (100.0%), Construction (100.0%), and Wholesale Trade (100.0%), whereas the industries that tend to have a higher number of women are Manufacturing (100.0%), Accommodation & Food Services (100.0%), and Public Administration (100.0%).
| Industry | Male | Female |
| Agriculture, Fishing & Hunting | 17 (100.0%) | 0 (0.0%) |
| Mining, Quarrying, & Extraction | 0 (0.0%) | 0 (0.0%) |
| Construction | 31 (100.0%) | 0 (0.0%) |
| Manufacturing | 0 (0.0%) | 25 (100.0%) |
| Wholesale Trade | 59 (100.0%) | 0 (0.0%) |
| Retail Trade | 35 (43.8%) | 45 (56.2%) |
| Transportation & Warehousing | 21 (100.0%) | 0 (0.0%) |
| Utilities | 0 (0.0%) | 0 (0.0%) |
| Information | 0 (0.0%) | 0 (0.0%) |
| Finance & Insurance | 15 (100.0%) | 0 (0.0%) |
| Real Estate, Rental & Leasing | 0 (0.0%) | 0 (0.0%) |
| Professional & Scientific | 34 (100.0%) | 0 (0.0%) |
| Enterprise Management | 0 (0.0%) | 0 (0.0%) |
| Administrative & Support | 0 (0.0%) | 0 (0.0%) |
| Educational Services | 0 (0.0%) | 0 (0.0%) |
| Health Care & Social Assistance | 56 (66.7%) | 28 (33.3%) |
| Arts, Entertainment & Recreation | 0 (0.0%) | 0 (0.0%) |
| Accommodation & Food Services | 0 (0.0%) | 60 (100.0%) |
| Public Administration | 0 (0.0%) | 41 (100.0%) |
| Total | 268 (57.4%) | 199 (42.6%) |
Education in South Canal
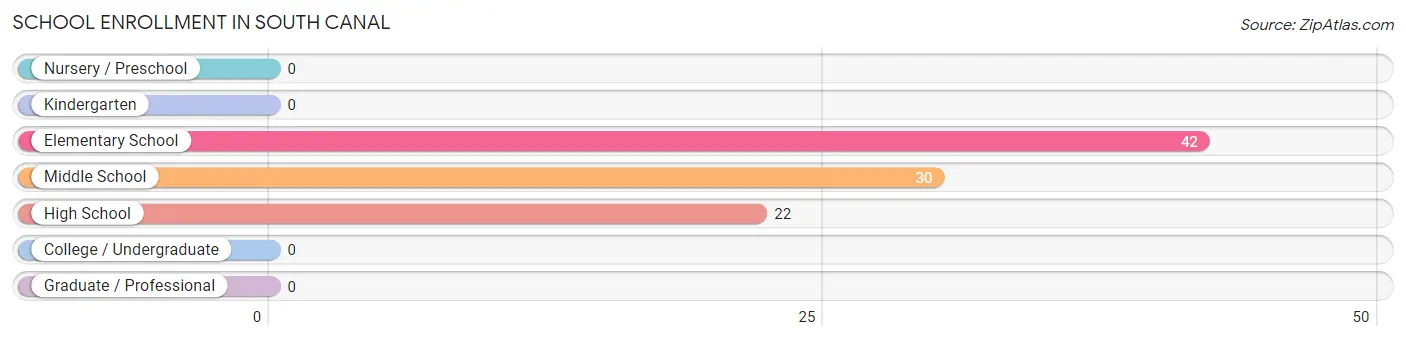
School Enrollment in South Canal
The most common levels of schooling among the 94 students in South Canal are elementary school (42 | 44.7%), middle school (30 | 31.9%), and high school (22 | 23.4%).
| School Level | # Students | % Students |
| Nursery / Preschool | 0 | 0.0% |
| Kindergarten | 0 | 0.0% |
| Elementary School | 42 | 44.7% |
| Middle School | 30 | 31.9% |
| High School | 22 | 23.4% |
| College / Undergraduate | 0 | 0.0% |
| Graduate / Professional | 0 | 0.0% |
| Total | 94 | 100.0% |
School Enrollment by Age by Funding Source in South Canal
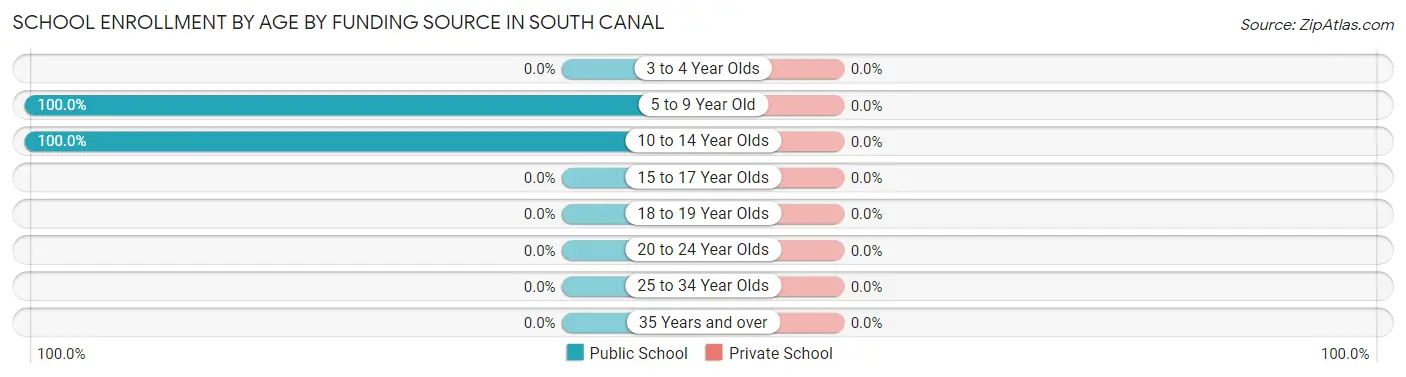
| Age Bracket | Public School | Private School |
| 3 to 4 Year Olds | 0 (0.0%) | 0 (0.0%) |
| 5 to 9 Year Old | 42 (100.0%) | 0 (0.0%) |
| 10 to 14 Year Olds | 52 (100.0%) | 0 (0.0%) |
| 15 to 17 Year Olds | 0 (0.0%) | 0 (0.0%) |
| 18 to 19 Year Olds | 0 (0.0%) | 0 (0.0%) |
| 20 to 24 Year Olds | 0 (0.0%) | 0 (0.0%) |
| 25 to 34 Year Olds | 0 (0.0%) | 0 (0.0%) |
| 35 Years and over | 0 (0.0%) | 0 (0.0%) |
| Total | 94 (100.0%) | 0 (0.0%) |
Educational Attainment by Field of Study in South Canal
Business (41 | 49.4%), arts & humanities (17 | 20.5%), liberal arts & history (11 | 13.3%), psychology (7 | 8.4%), and education (7 | 8.4%) are the most common fields of study among 83 individuals in South Canal who have obtained a bachelor's degree or higher.
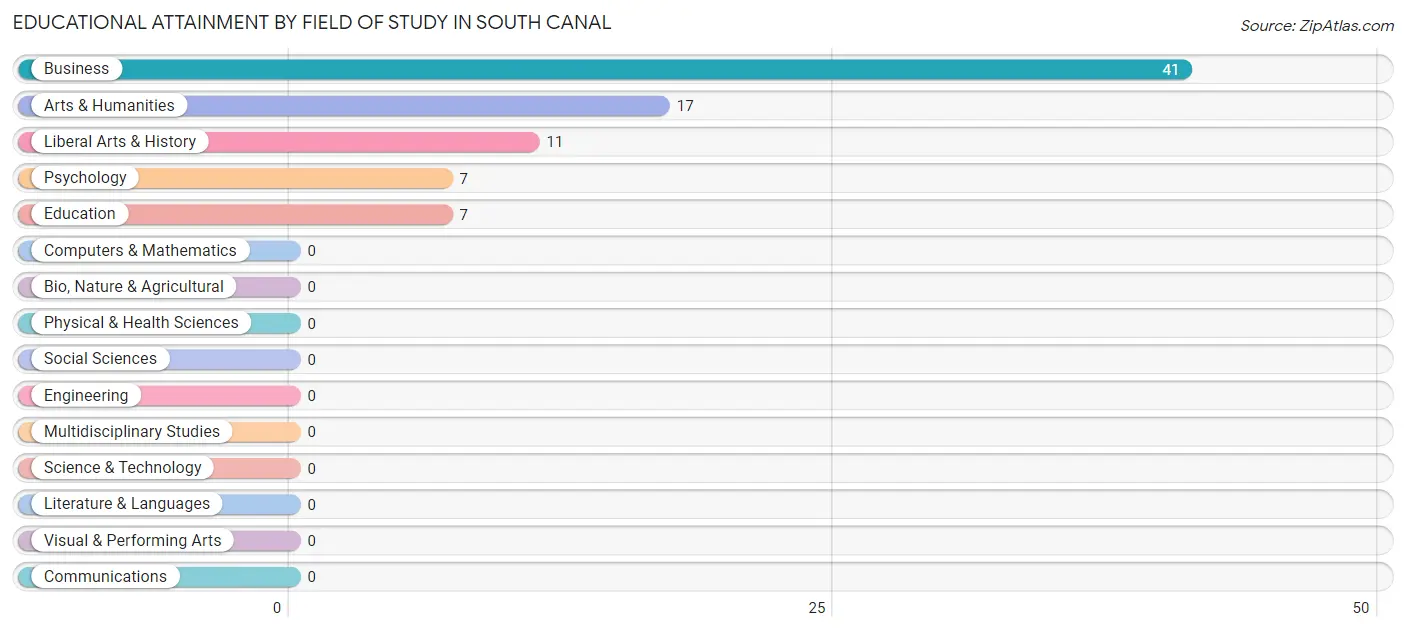
| Field of Study | # Graduates | % Graduates |
| Computers & Mathematics | 0 | 0.0% |
| Bio, Nature & Agricultural | 0 | 0.0% |
| Physical & Health Sciences | 0 | 0.0% |
| Psychology | 7 | 8.4% |
| Social Sciences | 0 | 0.0% |
| Engineering | 0 | 0.0% |
| Multidisciplinary Studies | 0 | 0.0% |
| Science & Technology | 0 | 0.0% |
| Business | 41 | 49.4% |
| Education | 7 | 8.4% |
| Literature & Languages | 0 | 0.0% |
| Liberal Arts & History | 11 | 13.3% |
| Visual & Performing Arts | 0 | 0.0% |
| Communications | 0 | 0.0% |
| Arts & Humanities | 17 | 20.5% |
| Total | 83 | 100.0% |
Transportation & Commute in South Canal
Vehicle Availability by Sex in South Canal
The most prevalent vehicle ownership categories in South Canal are males with 2 vehicles (184, accounting for 68.7%) and females with 2 vehicles (150, making up 92.5%).
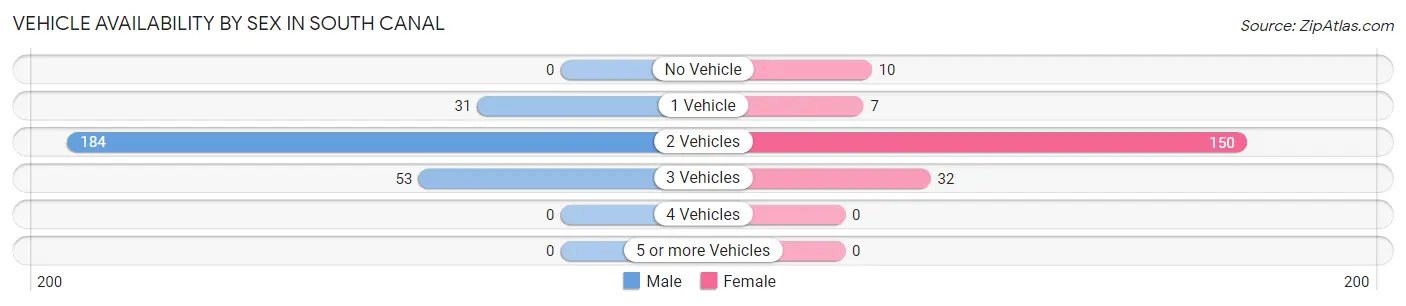
| Vehicles Available | Male | Female |
| No Vehicle | 0 (0.0%) | 10 (5.0%) |
| 1 Vehicle | 31 (11.6%) | 7 (3.5%) |
| 2 Vehicles | 184 (68.7%) | 150 (75.4%) |
| 3 Vehicles | 53 (19.8%) | 32 (16.1%) |
| 4 Vehicles | 0 (0.0%) | 0 (0.0%) |
| 5 or more Vehicles | 0 (0.0%) | 0 (0.0%) |
| Total | 268 (100.0%) | 199 (100.0%) |
Commute Time in South Canal
The most frequently occuring commute durations in South Canal are 20 to 24 minutes (85 commuters, 18.2%), 30 to 34 minutes (81 commuters, 17.3%), and 45 to 59 minutes (76 commuters, 16.3%).
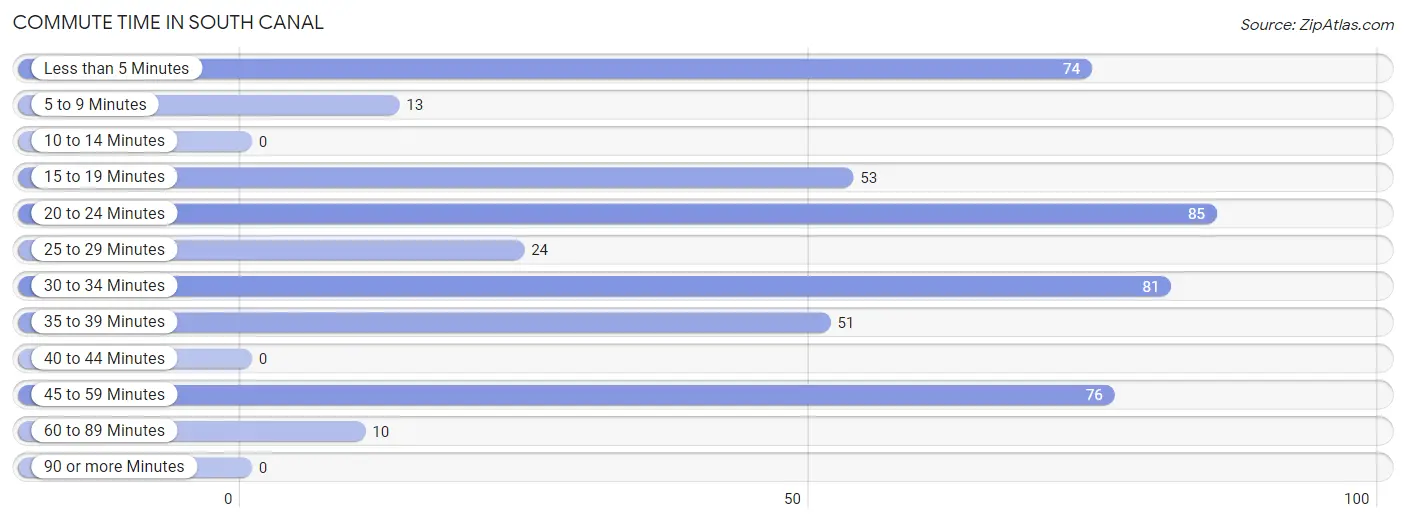
| Commute Time | # Commuters | % Commuters |
| Less than 5 Minutes | 74 | 15.9% |
| 5 to 9 Minutes | 13 | 2.8% |
| 10 to 14 Minutes | 0 | 0.0% |
| 15 to 19 Minutes | 53 | 11.4% |
| 20 to 24 Minutes | 85 | 18.2% |
| 25 to 29 Minutes | 24 | 5.1% |
| 30 to 34 Minutes | 81 | 17.3% |
| 35 to 39 Minutes | 51 | 10.9% |
| 40 to 44 Minutes | 0 | 0.0% |
| 45 to 59 Minutes | 76 | 16.3% |
| 60 to 89 Minutes | 10 | 2.1% |
| 90 or more Minutes | 0 | 0.0% |
Commute Time by Sex in South Canal
The most common commute times in South Canal are 20 to 24 minutes (78 commuters, 29.1%) for males and less than 5 minutes (63 commuters, 31.7%) for females.
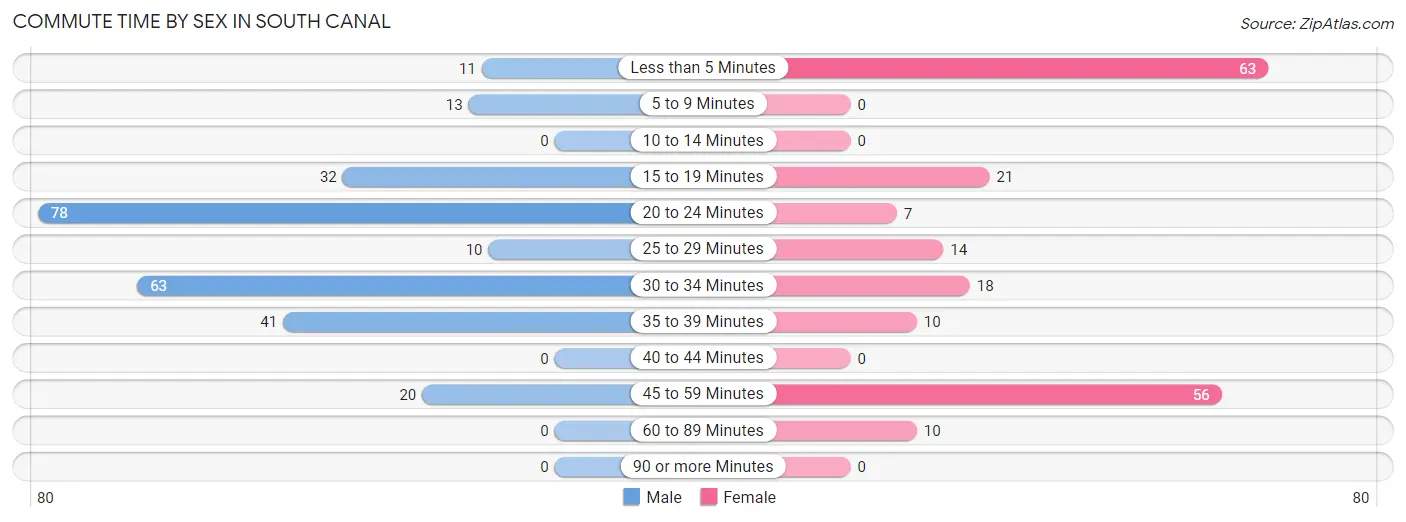
| Commute Time | Male | Female |
| Less than 5 Minutes | 11 (4.1%) | 63 (31.7%) |
| 5 to 9 Minutes | 13 (4.9%) | 0 (0.0%) |
| 10 to 14 Minutes | 0 (0.0%) | 0 (0.0%) |
| 15 to 19 Minutes | 32 (11.9%) | 21 (10.5%) |
| 20 to 24 Minutes | 78 (29.1%) | 7 (3.5%) |
| 25 to 29 Minutes | 10 (3.7%) | 14 (7.0%) |
| 30 to 34 Minutes | 63 (23.5%) | 18 (9.0%) |
| 35 to 39 Minutes | 41 (15.3%) | 10 (5.0%) |
| 40 to 44 Minutes | 0 (0.0%) | 0 (0.0%) |
| 45 to 59 Minutes | 20 (7.5%) | 56 (28.1%) |
| 60 to 89 Minutes | 0 (0.0%) | 10 (5.0%) |
| 90 or more Minutes | 0 (0.0%) | 0 (0.0%) |
Time of Departure to Work by Sex in South Canal
The most frequent times of departure to work in South Canal are 7:00 AM to 7:29 AM (119, 44.4%) for males and 10:00 AM to 10:59 AM (60, 30.1%) for females.
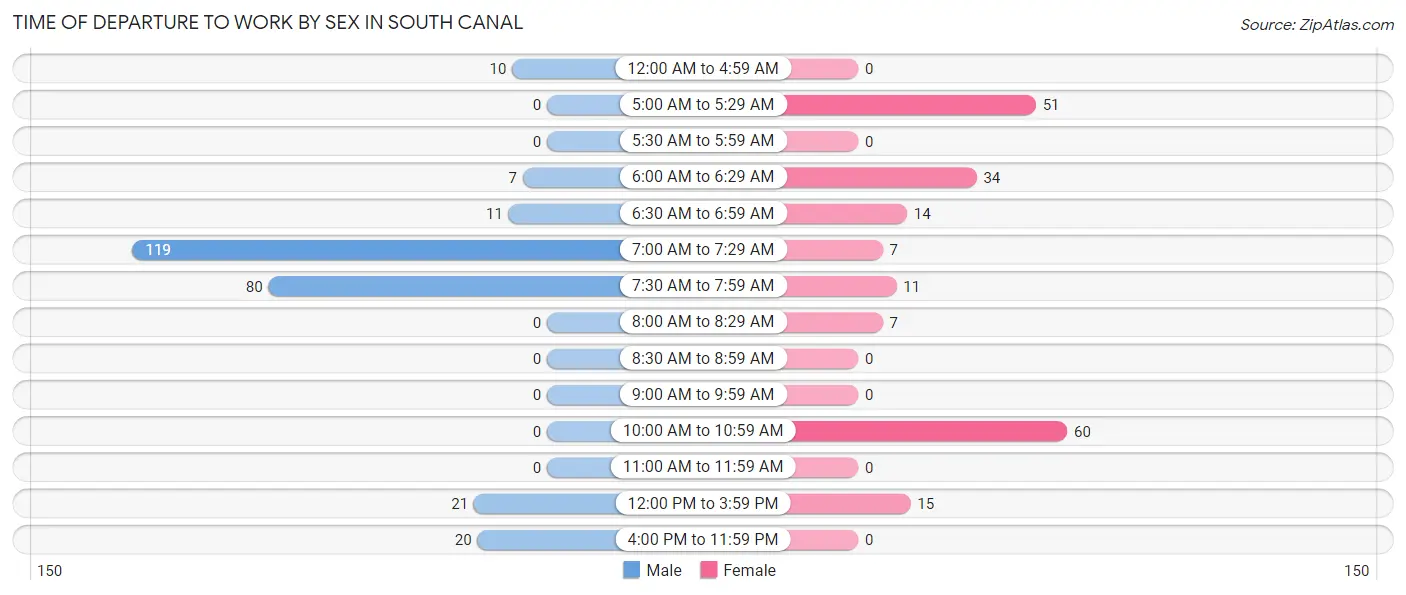
| Time of Departure | Male | Female |
| 12:00 AM to 4:59 AM | 10 (3.7%) | 0 (0.0%) |
| 5:00 AM to 5:29 AM | 0 (0.0%) | 51 (25.6%) |
| 5:30 AM to 5:59 AM | 0 (0.0%) | 0 (0.0%) |
| 6:00 AM to 6:29 AM | 7 (2.6%) | 34 (17.1%) |
| 6:30 AM to 6:59 AM | 11 (4.1%) | 14 (7.0%) |
| 7:00 AM to 7:29 AM | 119 (44.4%) | 7 (3.5%) |
| 7:30 AM to 7:59 AM | 80 (29.8%) | 11 (5.5%) |
| 8:00 AM to 8:29 AM | 0 (0.0%) | 7 (3.5%) |
| 8:30 AM to 8:59 AM | 0 (0.0%) | 0 (0.0%) |
| 9:00 AM to 9:59 AM | 0 (0.0%) | 0 (0.0%) |
| 10:00 AM to 10:59 AM | 0 (0.0%) | 60 (30.1%) |
| 11:00 AM to 11:59 AM | 0 (0.0%) | 0 (0.0%) |
| 12:00 PM to 3:59 PM | 21 (7.8%) | 15 (7.5%) |
| 4:00 PM to 11:59 PM | 20 (7.5%) | 0 (0.0%) |
| Total | 268 (100.0%) | 199 (100.0%) |
Housing Occupancy in South Canal
Occupancy by Ownership in South Canal
Of the total 472 dwellings in South Canal, owner-occupied units account for 453 (96.0%), while renter-occupied units make up 19 (4.0%).
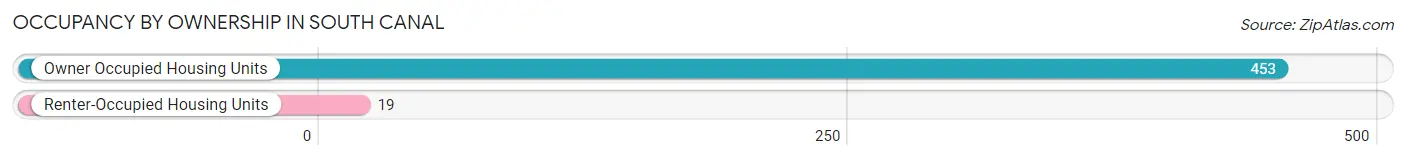
| Occupancy | # Housing Units | % Housing Units |
| Owner Occupied Housing Units | 453 | 96.0% |
| Renter-Occupied Housing Units | 19 | 4.0% |
| Total Occupied Housing Units | 472 | 100.0% |
Occupancy by Household Size in South Canal
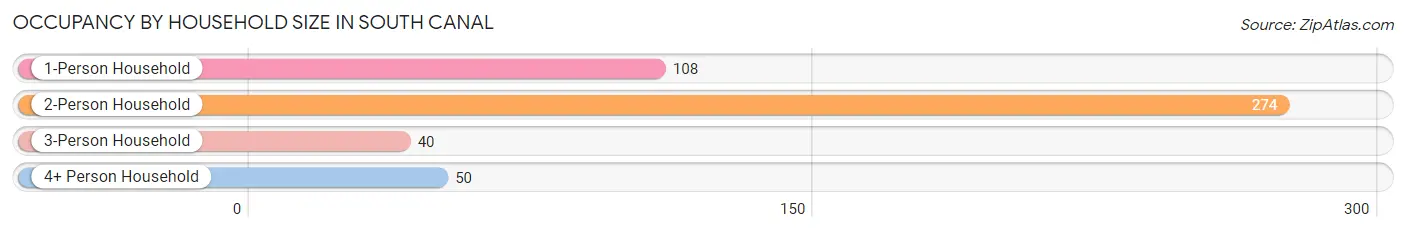
| Household Size | # Housing Units | % Housing Units |
| 1-Person Household | 108 | 22.9% |
| 2-Person Household | 274 | 58.1% |
| 3-Person Household | 40 | 8.5% |
| 4+ Person Household | 50 | 10.6% |
| Total Housing Units | 472 | 100.0% |
Occupancy by Ownership by Household Size in South Canal
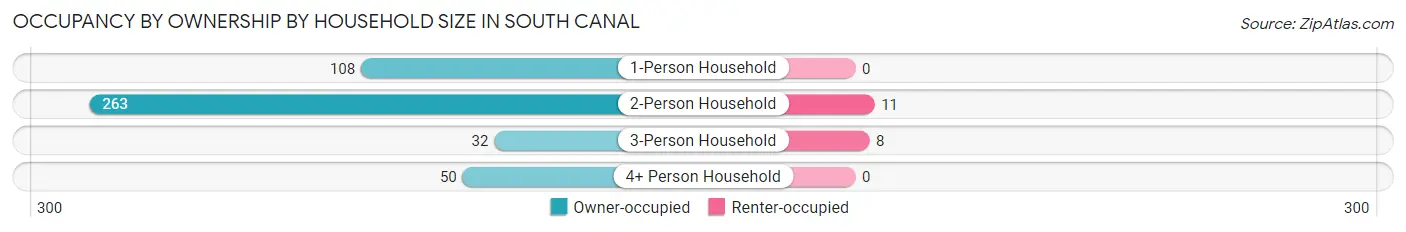
| Household Size | Owner-occupied | Renter-occupied |
| 1-Person Household | 108 (100.0%) | 0 (0.0%) |
| 2-Person Household | 263 (96.0%) | 11 (4.0%) |
| 3-Person Household | 32 (80.0%) | 8 (20.0%) |
| 4+ Person Household | 50 (100.0%) | 0 (0.0%) |
| Total Housing Units | 453 (96.0%) | 19 (4.0%) |
Occupancy by Educational Attainment in South Canal
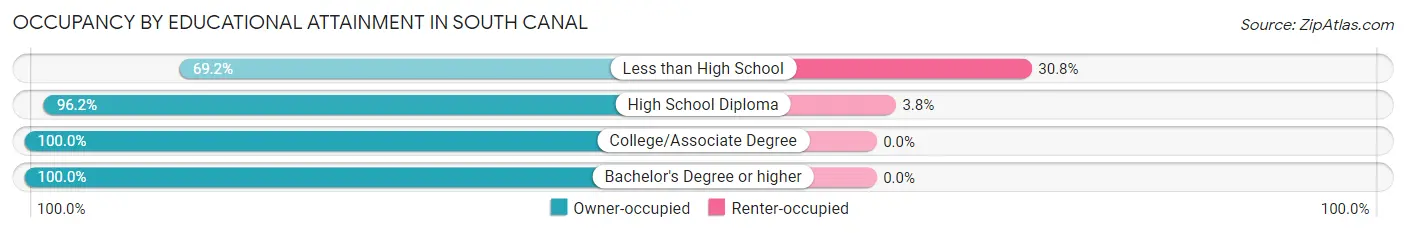
| Household Size | Owner-occupied | Renter-occupied |
| Less than High School | 18 (69.2%) | 8 (30.8%) |
| High School Diploma | 277 (96.2%) | 11 (3.8%) |
| College/Associate Degree | 140 (100.0%) | 0 (0.0%) |
| Bachelor's Degree or higher | 18 (100.0%) | 0 (0.0%) |
Occupancy by Age of Householder in South Canal
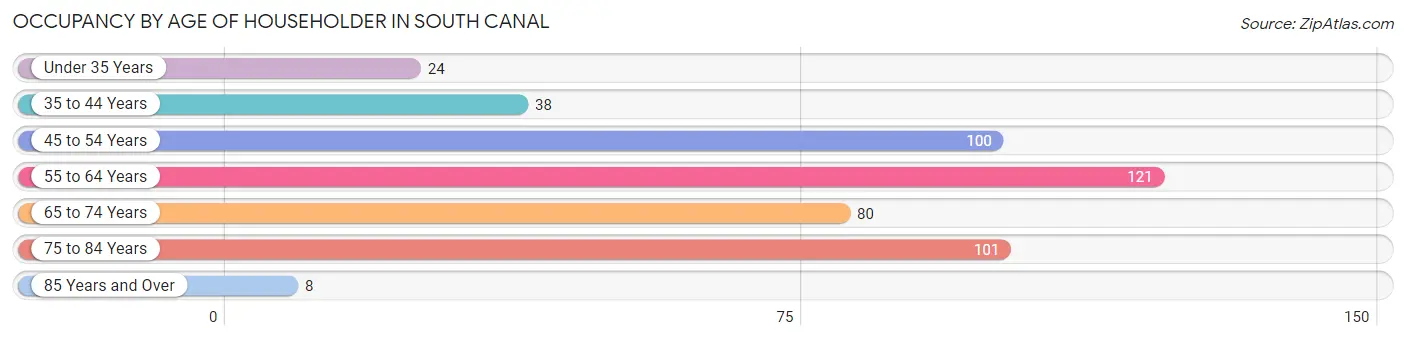
| Age Bracket | # Households | % Households |
| Under 35 Years | 24 | 5.1% |
| 35 to 44 Years | 38 | 8.1% |
| 45 to 54 Years | 100 | 21.2% |
| 55 to 64 Years | 121 | 25.6% |
| 65 to 74 Years | 80 | 17.0% |
| 75 to 84 Years | 101 | 21.4% |
| 85 Years and Over | 8 | 1.7% |
| Total | 472 | 100.0% |
Housing Finances in South Canal
Median Income by Occupancy in South Canal
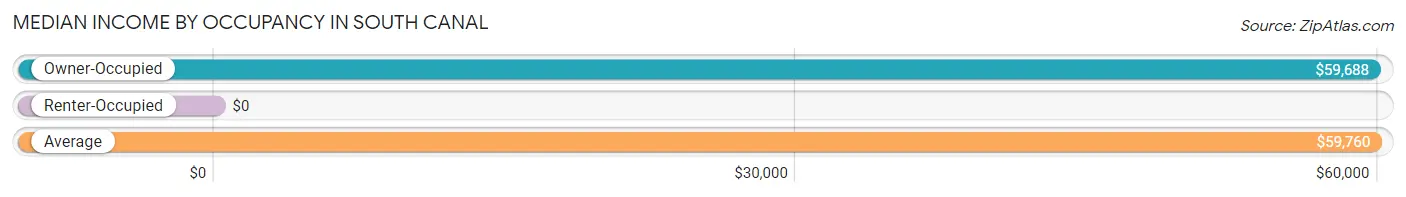
| Occupancy Type | # Households | Median Income |
| Owner-Occupied | 453 (96.0%) | $59,688 |
| Renter-Occupied | 19 (4.0%) | $0 |
| Average | 472 (100.0%) | $59,760 |
Occupancy by Householder Income Bracket in South Canal
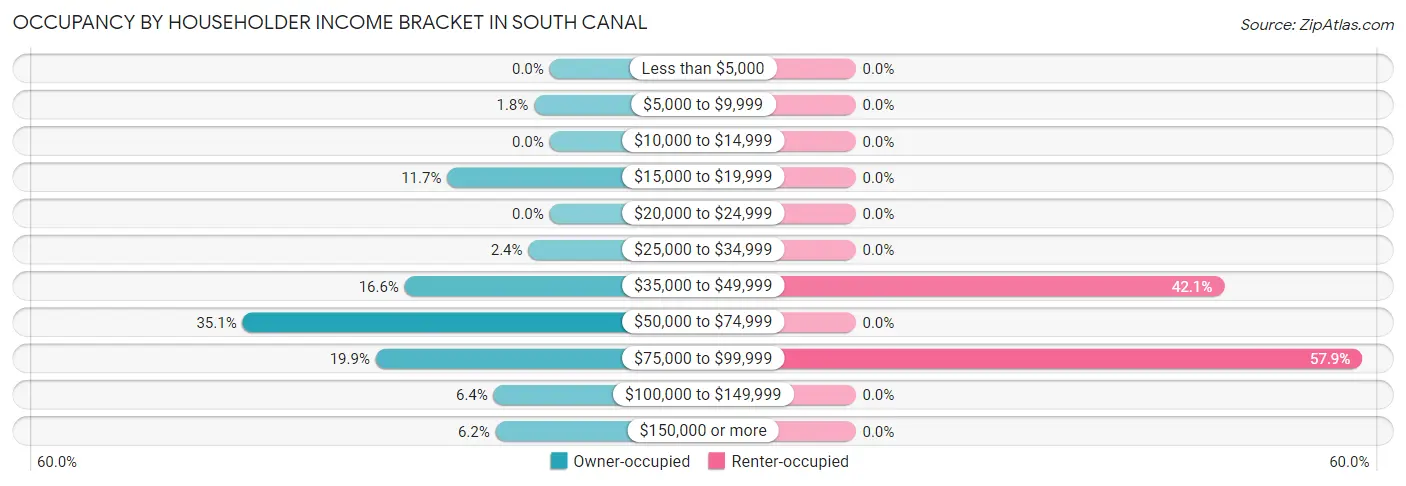
| Income Bracket | Owner-occupied | Renter-occupied |
| Less than $5,000 | 0 (0.0%) | 0 (0.0%) |
| $5,000 to $9,999 | 8 (1.8%) | 0 (0.0%) |
| $10,000 to $14,999 | 0 (0.0%) | 0 (0.0%) |
| $15,000 to $19,999 | 53 (11.7%) | 0 (0.0%) |
| $20,000 to $24,999 | 0 (0.0%) | 0 (0.0%) |
| $25,000 to $34,999 | 11 (2.4%) | 0 (0.0%) |
| $35,000 to $49,999 | 75 (16.6%) | 8 (42.1%) |
| $50,000 to $74,999 | 159 (35.1%) | 0 (0.0%) |
| $75,000 to $99,999 | 90 (19.9%) | 11 (57.9%) |
| $100,000 to $149,999 | 29 (6.4%) | 0 (0.0%) |
| $150,000 or more | 28 (6.2%) | 0 (0.0%) |
| Total | 453 (100.0%) | 19 (100.0%) |
Monthly Housing Cost Tiers in South Canal
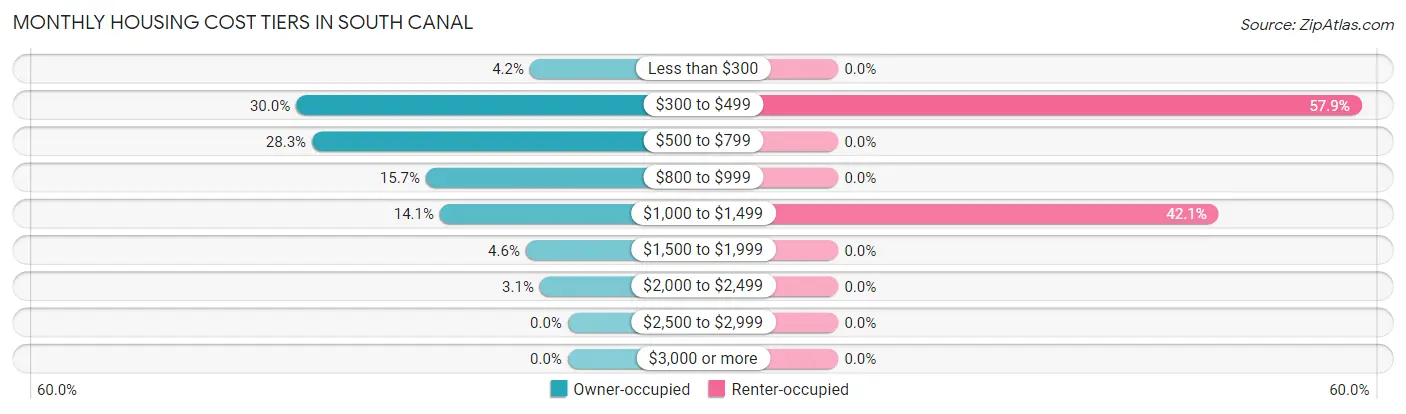
| Monthly Cost | Owner-occupied | Renter-occupied |
| Less than $300 | 19 (4.2%) | 0 (0.0%) |
| $300 to $499 | 136 (30.0%) | 11 (57.9%) |
| $500 to $799 | 128 (28.3%) | 0 (0.0%) |
| $800 to $999 | 71 (15.7%) | 0 (0.0%) |
| $1,000 to $1,499 | 64 (14.1%) | 8 (42.1%) |
| $1,500 to $1,999 | 21 (4.6%) | 0 (0.0%) |
| $2,000 to $2,499 | 14 (3.1%) | 0 (0.0%) |
| $2,500 to $2,999 | 0 (0.0%) | 0 (0.0%) |
| $3,000 or more | 0 (0.0%) | 0 (0.0%) |
| Total | 453 (100.0%) | 19 (100.0%) |
Physical Housing Characteristics in South Canal
Housing Structures in South Canal
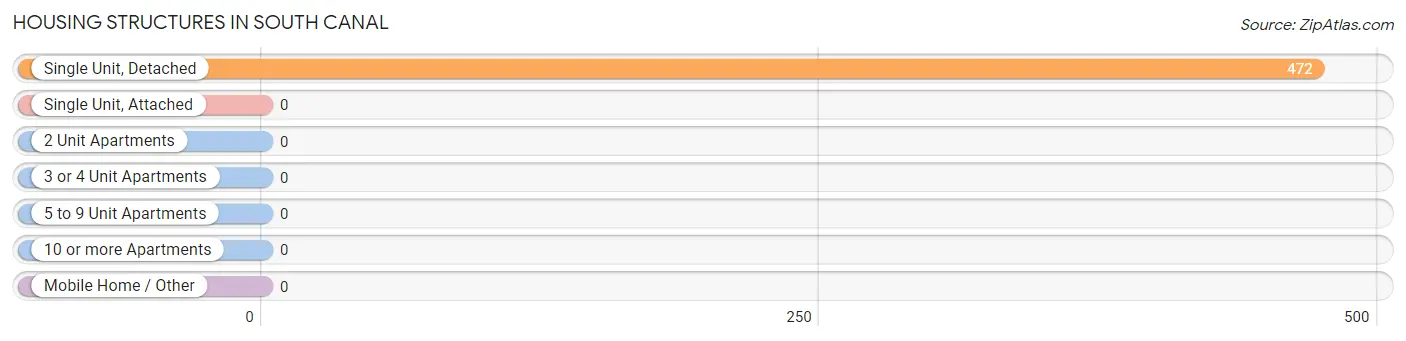
| Structure Type | # Housing Units | % Housing Units |
| Single Unit, Detached | 472 | 100.0% |
| Single Unit, Attached | 0 | 0.0% |
| 2 Unit Apartments | 0 | 0.0% |
| 3 or 4 Unit Apartments | 0 | 0.0% |
| 5 to 9 Unit Apartments | 0 | 0.0% |
| 10 or more Apartments | 0 | 0.0% |
| Mobile Home / Other | 0 | 0.0% |
| Total | 472 | 100.0% |
Housing Structures by Occupancy in South Canal
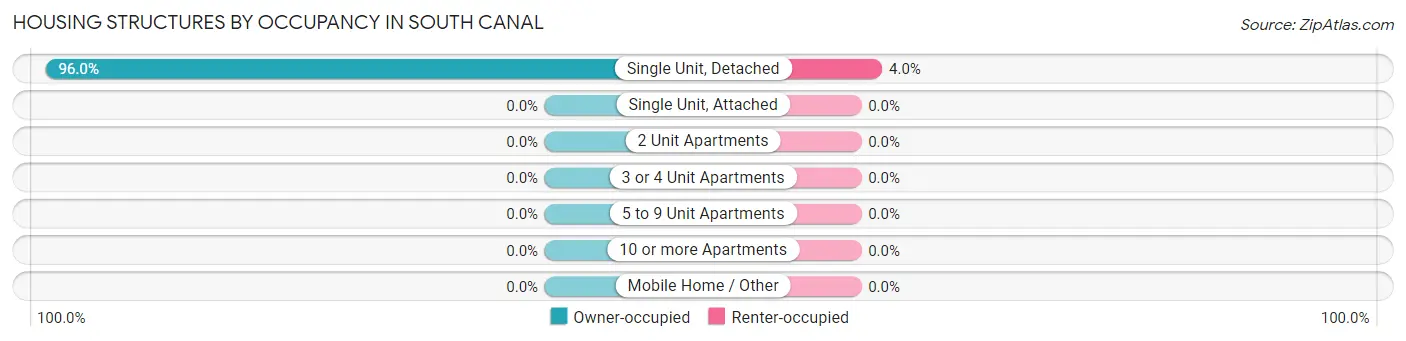
| Structure Type | Owner-occupied | Renter-occupied |
| Single Unit, Detached | 453 (96.0%) | 19 (4.0%) |
| Single Unit, Attached | 0 (0.0%) | 0 (0.0%) |
| 2 Unit Apartments | 0 (0.0%) | 0 (0.0%) |
| 3 or 4 Unit Apartments | 0 (0.0%) | 0 (0.0%) |
| 5 to 9 Unit Apartments | 0 (0.0%) | 0 (0.0%) |
| 10 or more Apartments | 0 (0.0%) | 0 (0.0%) |
| Mobile Home / Other | 0 (0.0%) | 0 (0.0%) |
| Total | 453 (96.0%) | 19 (4.0%) |
Housing Structures by Number of Rooms in South Canal
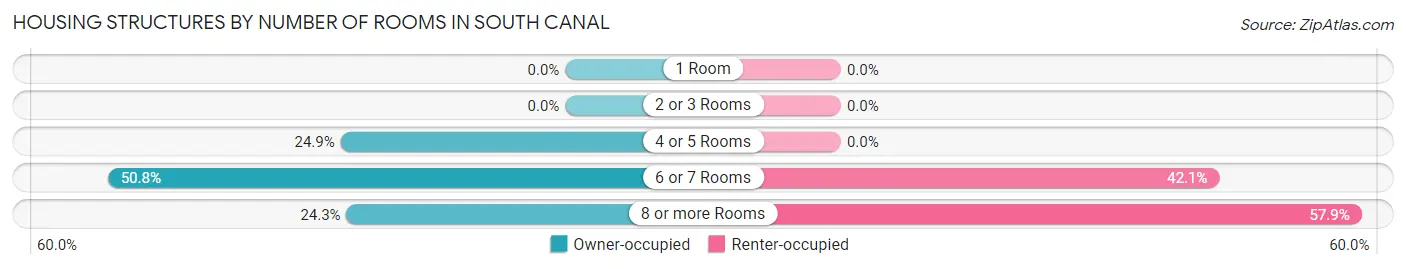
| Number of Rooms | Owner-occupied | Renter-occupied |
| 1 Room | 0 (0.0%) | 0 (0.0%) |
| 2 or 3 Rooms | 0 (0.0%) | 0 (0.0%) |
| 4 or 5 Rooms | 113 (24.9%) | 0 (0.0%) |
| 6 or 7 Rooms | 230 (50.8%) | 8 (42.1%) |
| 8 or more Rooms | 110 (24.3%) | 11 (57.9%) |
| Total | 453 (100.0%) | 19 (100.0%) |
Housing Structure by Heating Type in South Canal
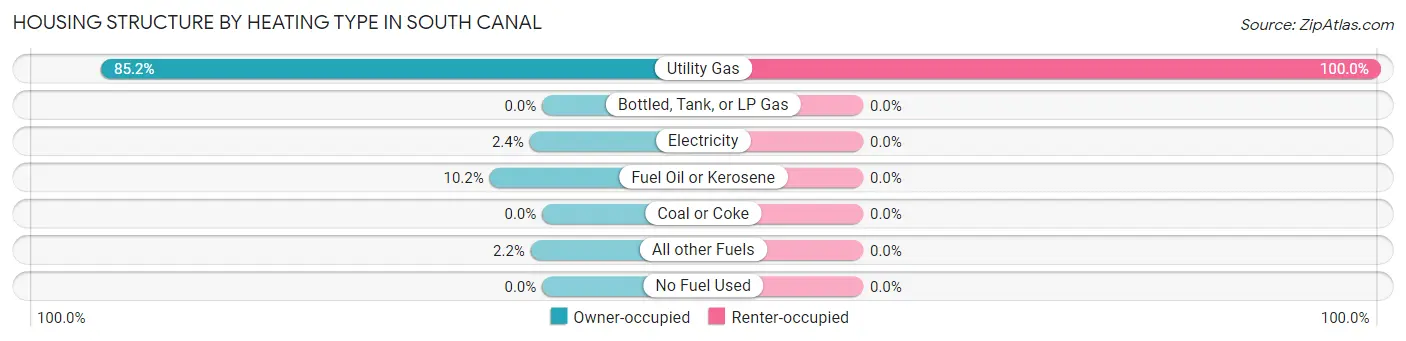
| Heating Type | Owner-occupied | Renter-occupied |
| Utility Gas | 386 (85.2%) | 19 (100.0%) |
| Bottled, Tank, or LP Gas | 0 (0.0%) | 0 (0.0%) |
| Electricity | 11 (2.4%) | 0 (0.0%) |
| Fuel Oil or Kerosene | 46 (10.2%) | 0 (0.0%) |
| Coal or Coke | 0 (0.0%) | 0 (0.0%) |
| All other Fuels | 10 (2.2%) | 0 (0.0%) |
| No Fuel Used | 0 (0.0%) | 0 (0.0%) |
| Total | 453 (100.0%) | 19 (100.0%) |
Household Vehicle Usage in South Canal
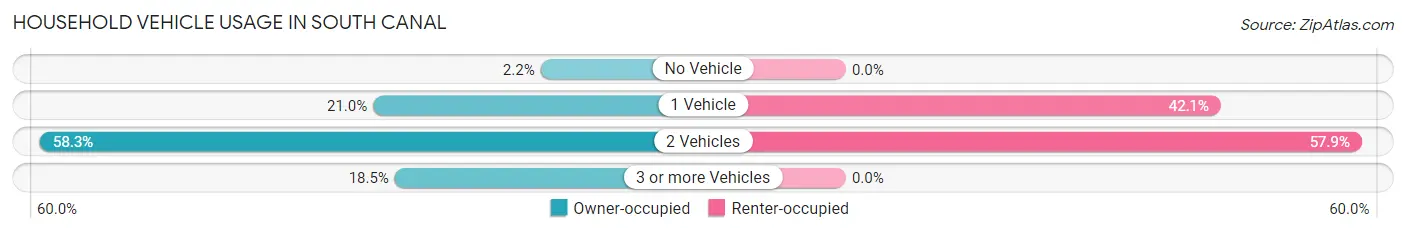
| Vehicles per Household | Owner-occupied | Renter-occupied |
| No Vehicle | 10 (2.2%) | 0 (0.0%) |
| 1 Vehicle | 95 (21.0%) | 8 (42.1%) |
| 2 Vehicles | 264 (58.3%) | 11 (57.9%) |
| 3 or more Vehicles | 84 (18.5%) | 0 (0.0%) |
| Total | 453 (100.0%) | 19 (100.0%) |
Real Estate & Mortgages in South Canal
Real Estate and Mortgage Overview in South Canal
| Characteristic | Without Mortgage | With Mortgage |
| Housing Units | 283 | 170 |
| Median Property Value | $117,200 | $130,300 |
| Median Household Income | $58,558 | $28 |
| Monthly Housing Costs | $481 | $0 |
| Real Estate Taxes | $1,904 | $0 |
Property Value by Mortgage Status in South Canal
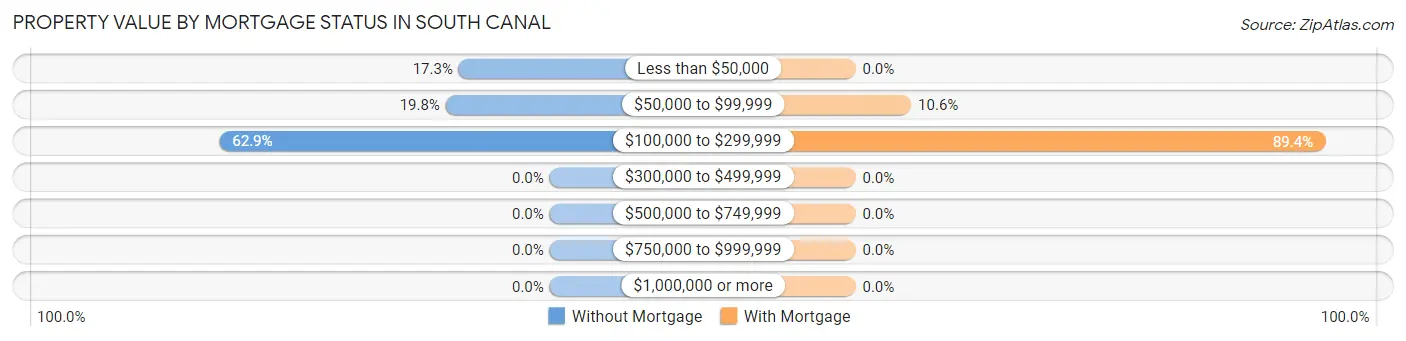
| Property Value | Without Mortgage | With Mortgage |
| Less than $50,000 | 49 (17.3%) | 0 (0.0%) |
| $50,000 to $99,999 | 56 (19.8%) | 18 (10.6%) |
| $100,000 to $299,999 | 178 (62.9%) | 152 (89.4%) |
| $300,000 to $499,999 | 0 (0.0%) | 0 (0.0%) |
| $500,000 to $749,999 | 0 (0.0%) | 0 (0.0%) |
| $750,000 to $999,999 | 0 (0.0%) | 0 (0.0%) |
| $1,000,000 or more | 0 (0.0%) | 0 (0.0%) |
| Total | 283 (100.0%) | 170 (100.0%) |
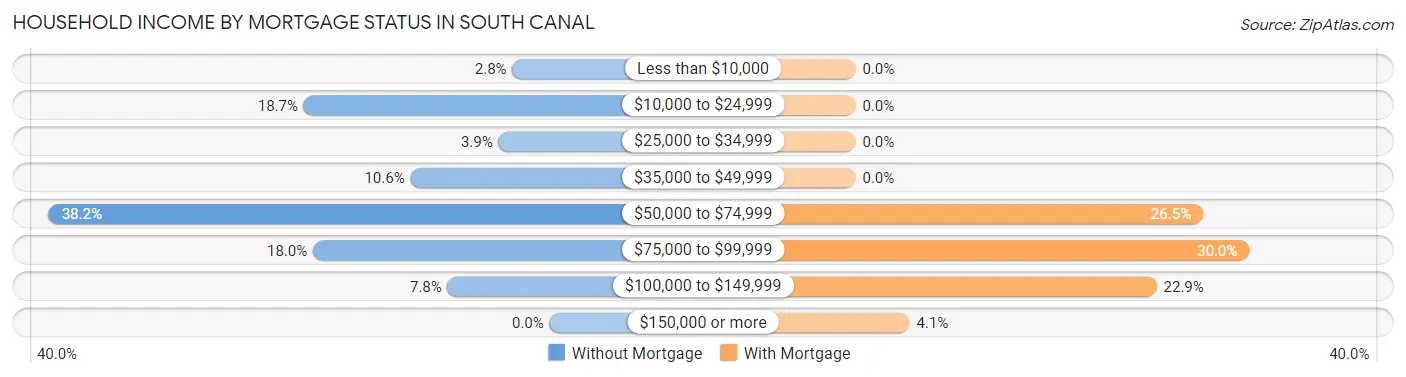
Household Income by Mortgage Status in South Canal
| Household Income | Without Mortgage | With Mortgage |
| Less than $10,000 | 8 (2.8%) | 0 (0.0%) |
| $10,000 to $24,999 | 53 (18.7%) | 0 (0.0%) |
| $25,000 to $34,999 | 11 (3.9%) | 0 (0.0%) |
| $35,000 to $49,999 | 30 (10.6%) | 0 (0.0%) |
| $50,000 to $74,999 | 108 (38.2%) | 45 (26.5%) |
| $75,000 to $99,999 | 51 (18.0%) | 51 (30.0%) |
| $100,000 to $149,999 | 22 (7.8%) | 39 (22.9%) |
| $150,000 or more | 0 (0.0%) | 7 (4.1%) |
| Total | 283 (100.0%) | 170 (100.0%) |
Property Value to Household Income Ratio in South Canal
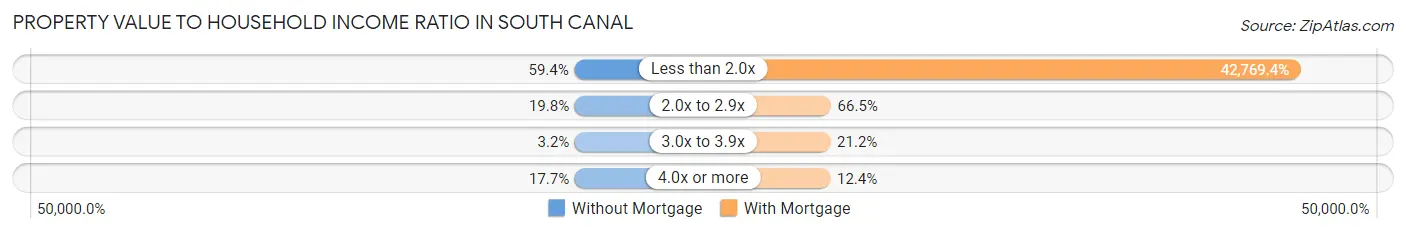
| Value-to-Income Ratio | Without Mortgage | With Mortgage |
| Less than 2.0x | 168 (59.4%) | 72,708 (42,769.4%) |
| 2.0x to 2.9x | 56 (19.8%) | 113 (66.5%) |
| 3.0x to 3.9x | 9 (3.2%) | 36 (21.2%) |
| 4.0x or more | 50 (17.7%) | 21 (12.3%) |
| Total | 283 (100.0%) | 170 (100.0%) |
Real Estate Taxes by Mortgage Status in South Canal
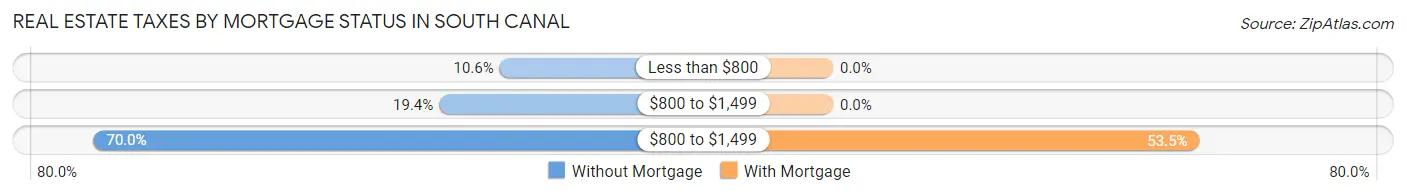
| Property Taxes | Without Mortgage | With Mortgage |
| Less than $800 | 30 (10.6%) | 0 (0.0%) |
| $800 to $1,499 | 55 (19.4%) | 0 (0.0%) |
| $800 to $1,499 | 198 (70.0%) | 91 (53.5%) |
| Total | 283 (100.0%) | 170 (100.0%) |
Health & Disability in South Canal
Health Insurance Coverage by Age in South Canal
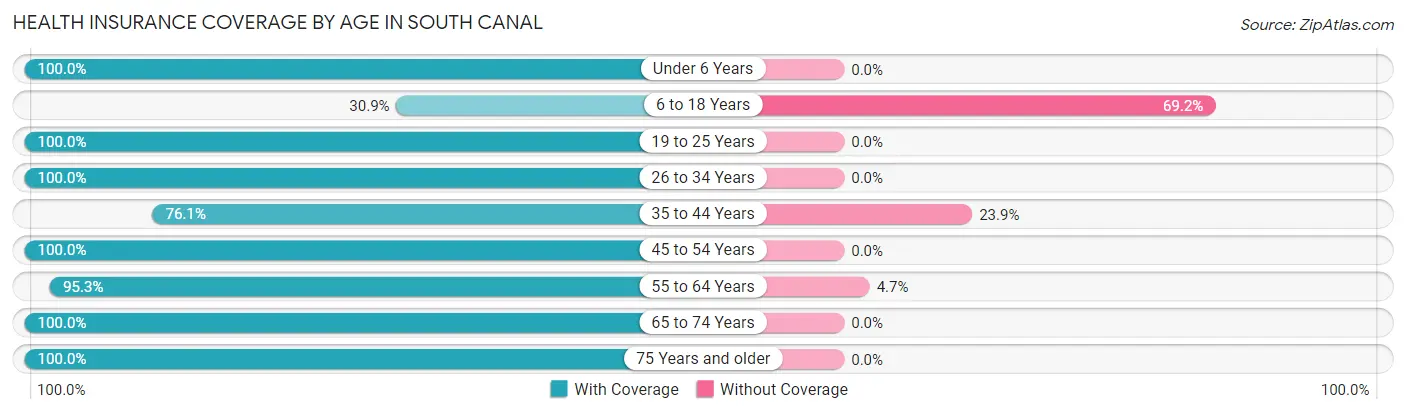
| Age Bracket | With Coverage | Without Coverage |
| Under 6 Years | 26 (100.0%) | 0 (0.0%) |
| 6 to 18 Years | 29 (30.8%) | 65 (69.2%) |
| 19 to 25 Years | 58 (100.0%) | 0 (0.0%) |
| 26 to 34 Years | 12 (100.0%) | 0 (0.0%) |
| 35 to 44 Years | 67 (76.1%) | 21 (23.9%) |
| 45 to 54 Years | 202 (100.0%) | 0 (0.0%) |
| 55 to 64 Years | 201 (95.3%) | 10 (4.7%) |
| 65 to 74 Years | 129 (100.0%) | 0 (0.0%) |
| 75 Years and older | 193 (100.0%) | 0 (0.0%) |
| Total | 917 (90.5%) | 96 (9.5%) |
Health Insurance Coverage by Citizenship Status in South Canal
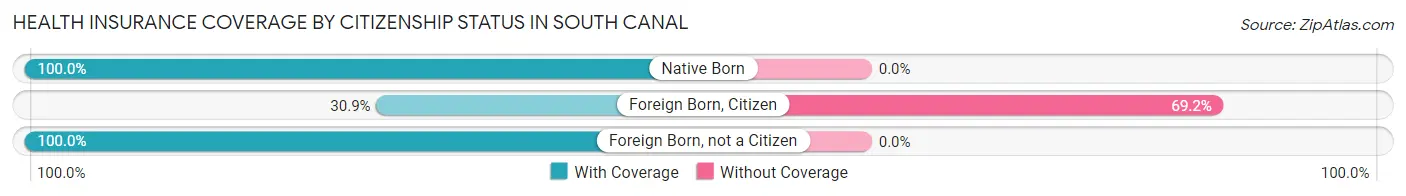
| Citizenship Status | With Coverage | Without Coverage |
| Native Born | 26 (100.0%) | 0 (0.0%) |
| Foreign Born, Citizen | 29 (30.8%) | 65 (69.2%) |
| Foreign Born, not a Citizen | 58 (100.0%) | 0 (0.0%) |
Health Insurance Coverage by Household Income in South Canal
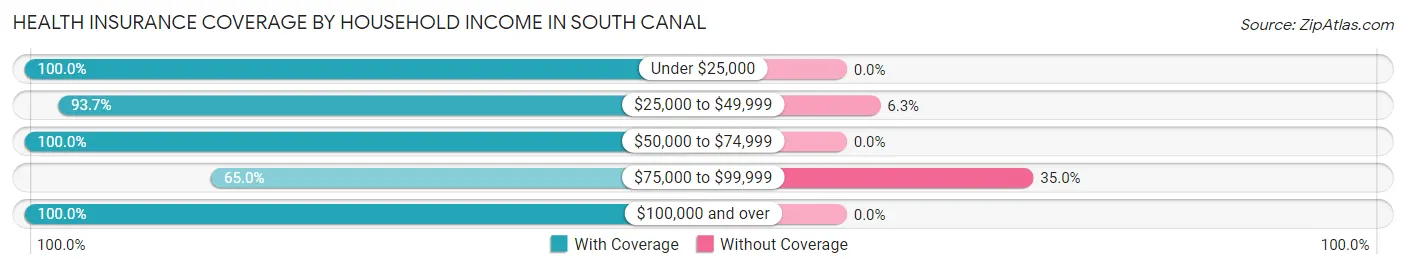
| Household Income | With Coverage | Without Coverage |
| Under $25,000 | 97 (100.0%) | 0 (0.0%) |
| $25,000 to $49,999 | 149 (93.7%) | 10 (6.3%) |
| $50,000 to $74,999 | 364 (100.0%) | 0 (0.0%) |
| $75,000 to $99,999 | 160 (65.0%) | 86 (35.0%) |
| $100,000 and over | 147 (100.0%) | 0 (0.0%) |
Public vs Private Health Insurance Coverage by Age in South Canal
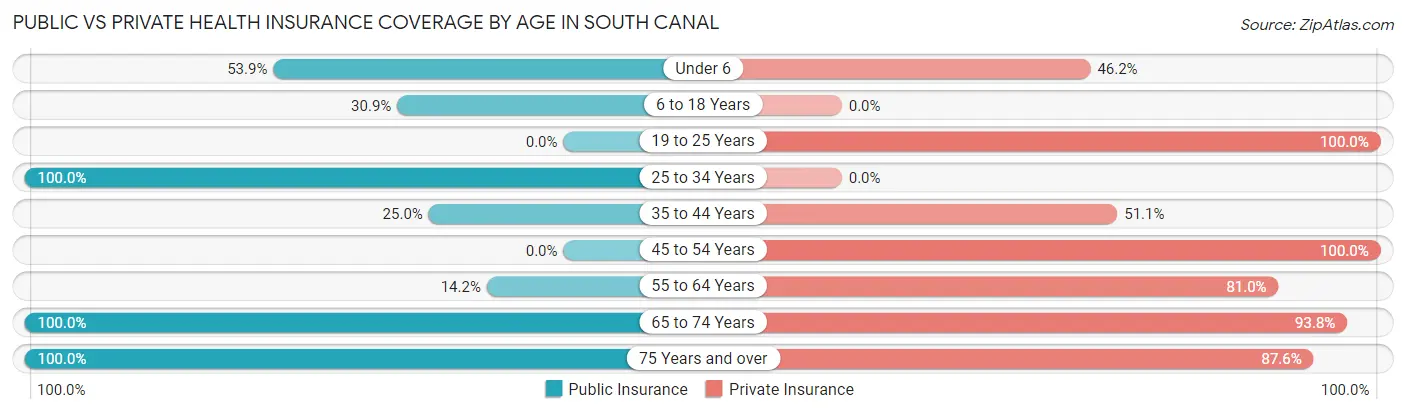
| Age Bracket | Public Insurance | Private Insurance |
| Under 6 | 14 (53.8%) | 12 (46.2%) |
| 6 to 18 Years | 29 (30.8%) | 0 (0.0%) |
| 19 to 25 Years | 0 (0.0%) | 58 (100.0%) |
| 25 to 34 Years | 12 (100.0%) | 0 (0.0%) |
| 35 to 44 Years | 22 (25.0%) | 45 (51.1%) |
| 45 to 54 Years | 0 (0.0%) | 202 (100.0%) |
| 55 to 64 Years | 30 (14.2%) | 171 (81.0%) |
| 65 to 74 Years | 129 (100.0%) | 121 (93.8%) |
| 75 Years and over | 193 (100.0%) | 169 (87.6%) |
| Total | 429 (42.3%) | 778 (76.8%) |
Disability Status by Sex by Age in South Canal
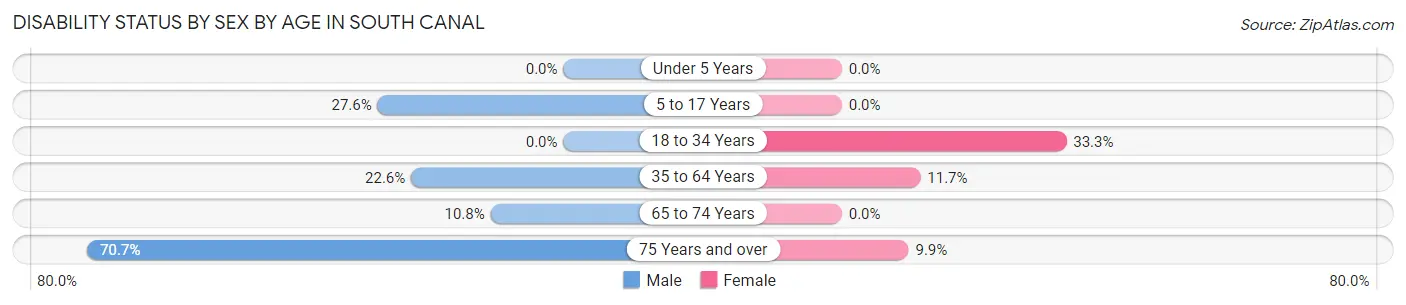
| Age Bracket | Male | Female |
| Under 5 Years | 0 (0.0%) | 0 (0.0%) |
| 5 to 17 Years | 8 (27.6%) | 0 (0.0%) |
| 18 to 34 Years | 0 (0.0%) | 12 (33.3%) |
| 35 to 64 Years | 59 (22.6%) | 28 (11.7%) |
| 65 to 74 Years | 8 (10.8%) | 0 (0.0%) |
| 75 Years and over | 58 (70.7%) | 11 (9.9%) |
Disability Class by Sex by Age in South Canal
Disability Class: Hearing Difficulty
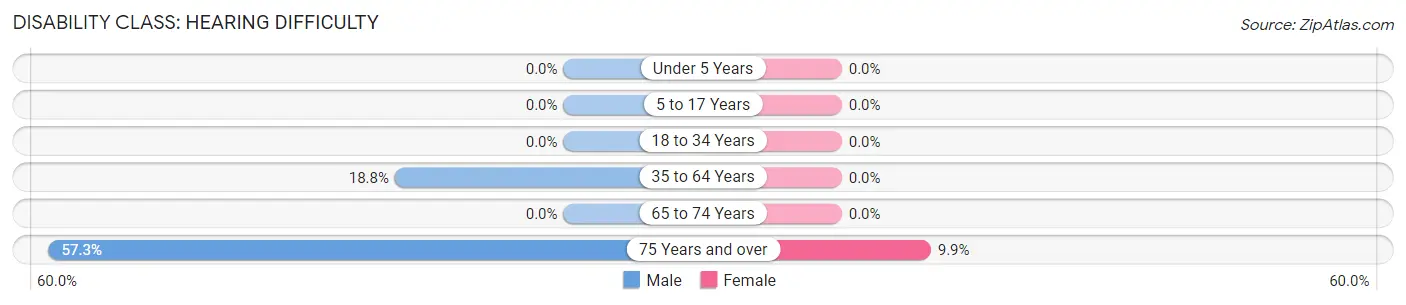
| Age Bracket | Male | Female |
| Under 5 Years | 0 (0.0%) | 0 (0.0%) |
| 5 to 17 Years | 0 (0.0%) | 0 (0.0%) |
| 18 to 34 Years | 0 (0.0%) | 0 (0.0%) |
| 35 to 64 Years | 49 (18.8%) | 0 (0.0%) |
| 65 to 74 Years | 0 (0.0%) | 0 (0.0%) |
| 75 Years and over | 47 (57.3%) | 11 (9.9%) |
Disability Class: Vision Difficulty
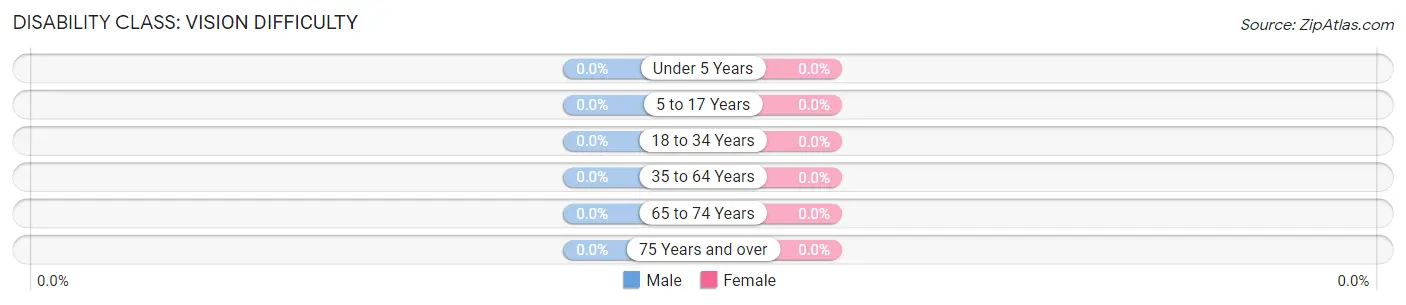
| Age Bracket | Male | Female |
| Under 5 Years | 0 (0.0%) | 0 (0.0%) |
| 5 to 17 Years | 0 (0.0%) | 0 (0.0%) |
| 18 to 34 Years | 0 (0.0%) | 0 (0.0%) |
| 35 to 64 Years | 0 (0.0%) | 0 (0.0%) |
| 65 to 74 Years | 0 (0.0%) | 0 (0.0%) |
| 75 Years and over | 0 (0.0%) | 0 (0.0%) |
Disability Class: Cognitive Difficulty
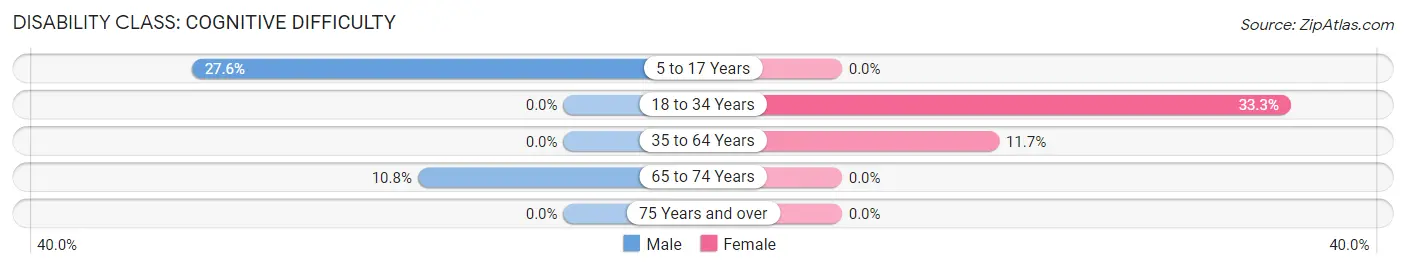
| Age Bracket | Male | Female |
| 5 to 17 Years | 8 (27.6%) | 0 (0.0%) |
| 18 to 34 Years | 0 (0.0%) | 12 (33.3%) |
| 35 to 64 Years | 0 (0.0%) | 28 (11.7%) |
| 65 to 74 Years | 8 (10.8%) | 0 (0.0%) |
| 75 Years and over | 0 (0.0%) | 0 (0.0%) |
Disability Class: Ambulatory Difficulty
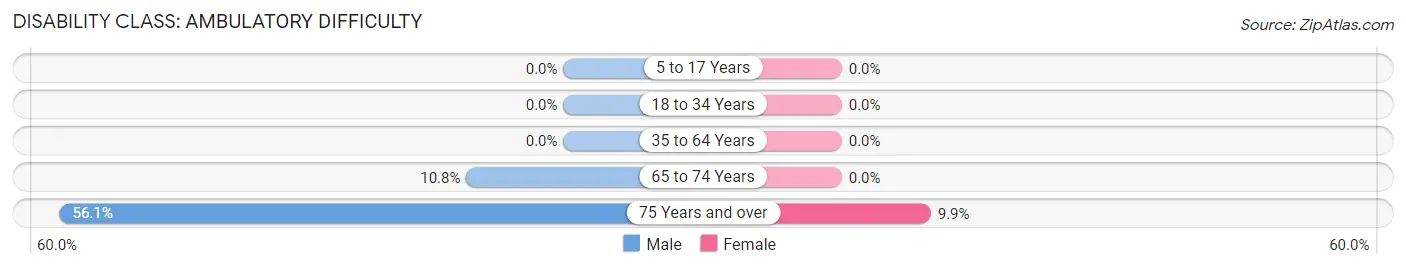
| Age Bracket | Male | Female |
| 5 to 17 Years | 0 (0.0%) | 0 (0.0%) |
| 18 to 34 Years | 0 (0.0%) | 0 (0.0%) |
| 35 to 64 Years | 0 (0.0%) | 0 (0.0%) |
| 65 to 74 Years | 8 (10.8%) | 0 (0.0%) |
| 75 Years and over | 46 (56.1%) | 11 (9.9%) |
Disability Class: Self-Care Difficulty
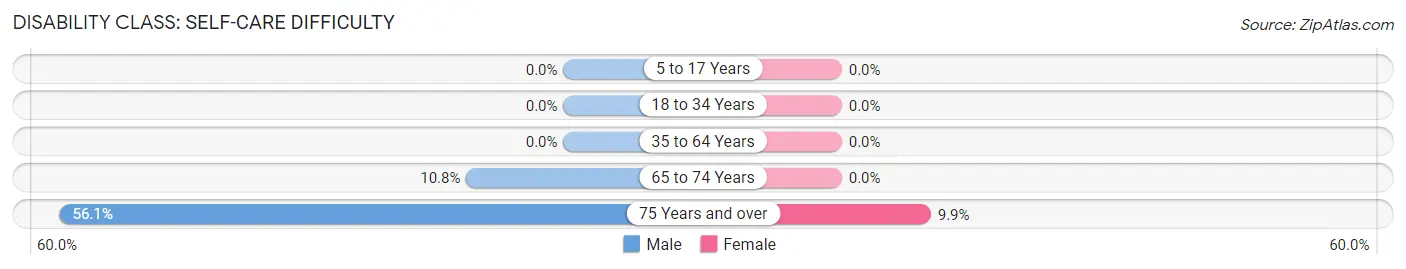
| Age Bracket | Male | Female |
| 5 to 17 Years | 0 (0.0%) | 0 (0.0%) |
| 18 to 34 Years | 0 (0.0%) | 0 (0.0%) |
| 35 to 64 Years | 0 (0.0%) | 0 (0.0%) |
| 65 to 74 Years | 8 (10.8%) | 0 (0.0%) |
| 75 Years and over | 46 (56.1%) | 11 (9.9%) |
Technology Access in South Canal
Computing Device Access in South Canal
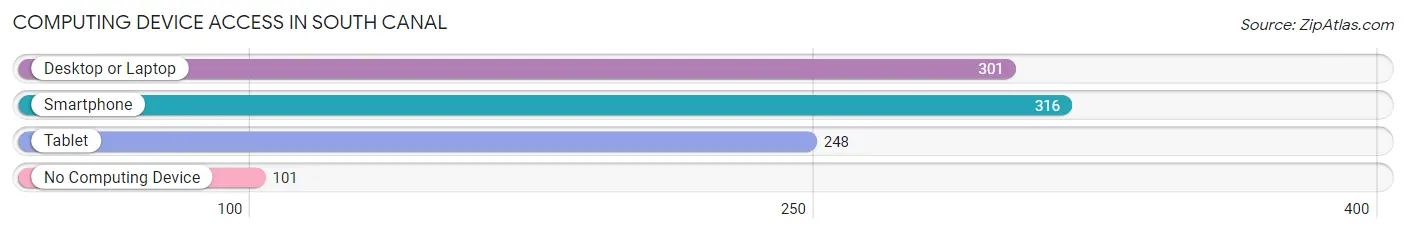
| Device Type | # Households | % Households |
| Desktop or Laptop | 301 | 63.8% |
| Smartphone | 316 | 66.9% |
| Tablet | 248 | 52.5% |
| No Computing Device | 101 | 21.4% |
| Total | 472 | 100.0% |
Internet Access in South Canal
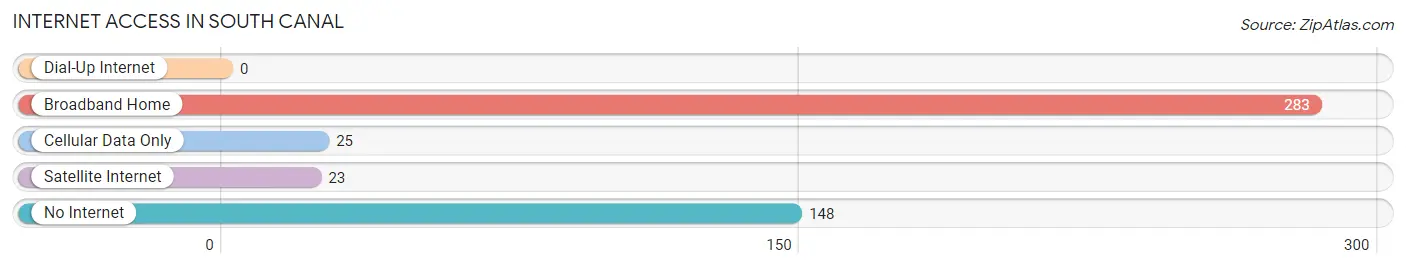
| Internet Type | # Households | % Households |
| Dial-Up Internet | 0 | 0.0% |
| Broadband Home | 283 | 60.0% |
| Cellular Data Only | 25 | 5.3% |
| Satellite Internet | 23 | 4.9% |
| No Internet | 148 | 31.4% |
| Total | 472 | 100.0% |
South Canal Summary
Canal, Ohio is a small village located in the southeastern corner of the state of Ohio. It is situated in the Appalachian foothills of the Appalachian Mountains, and is part of the Appalachian Plateau. The village is located in the Scioto River Valley, and is bordered by the Scioto River to the east and the Ohio River to the south. The village is located in the Scioto County, and is part of the Portsmouth Metropolitan Statistical Area.
History
The area that is now known as Canal, Ohio was first settled in the early 1800s by settlers from Pennsylvania and Virginia. The village was originally known as “The Narrows” due to its location at the narrowest point of the Scioto River. The village was officially incorporated in 1837, and was named after the canal that was built in the area in the early 1800s. The canal was built to connect the Ohio River to the Scioto River, and was used to transport goods and people between the two rivers.
The village of Canal, Ohio was an important stop on the Underground Railroad, and was a safe haven for escaped slaves. The village was also an important stop on the Ohio and Erie Canal, which was built in the early 1800s to connect the Ohio River to Lake Erie. The canal was used to transport goods and people between the two rivers, and was an important part of the economy of the village.
Geography
Canal, Ohio is located in the southeastern corner of the state of Ohio. It is situated in the Appalachian foothills of the Appalachian Mountains, and is part of the Appalachian Plateau. The village is located in the Scioto River Valley, and is bordered by the Scioto River to the east and the Ohio River to the south. The village is located in the Scioto County, and is part of the Portsmouth Metropolitan Statistical Area.
The village of Canal, Ohio has a total area of 0.7 square miles, all of which is land. The village is located at an elevation of 845 feet above sea level. The climate of the village is classified as humid continental, with hot summers and cold winters. The average annual temperature is around 50 degrees Fahrenheit, and the average annual precipitation is around 40 inches.
Economy
The economy of Canal, Ohio is largely based on agriculture and tourism. The village is home to several farms, which produce a variety of crops, including corn, soybeans, wheat, and hay. The village is also home to several wineries, which produce a variety of wines. The village is also home to several restaurants, which serve a variety of local and regional dishes.
The village of Canal, Ohio is also home to several small businesses, including a hardware store, a grocery store, and a gas station. The village is also home to several antique stores, which sell a variety of antiques and collectibles. The village is also home to several art galleries, which feature a variety of local and regional artwork.
Demographics
As of the 2010 census, the village of Canal, Ohio had a population of 1,093. The population density was 1,541 people per square mile. The racial makeup of the village was 97.3% White, 0.7% African American, 0.2% Native American, 0.2% Asian, 0.1% Pacific Islander, 0.2% from other races, and 1.3% from two or more races. Hispanic or Latino of any race were 0.7% of the population.
The median income for a household in the village was $37,500, and the median income for a family was $45,000. The per capita income for the village was $17,845. About 11.3% of families and 14.2% of the population were below the poverty line, including 18.2% of those under age 18 and 8.3% of those age 65 or over.
Common Questions
What is the Total Population of South Canal?
Total Population of South Canal is 1,013.
What is the Total Male Population of South Canal?
Total Male Population of South Canal is 494.
What is the Total Female Population of South Canal?
Total Female Population of South Canal is 519.
What is the Ratio of Males per 100 Females in South Canal?
There are 95.18 Males per 100 Females in South Canal.
What is the Ratio of Females per 100 Males in South Canal?
There are 105.06 Females per 100 Males in South Canal.
What is the Median Population Age in South Canal?
Median Population Age in South Canal is 56.3 Years.
What is the Average Family Size in South Canal
Average Family Size in South Canal is 2.4 People.
What is the Average Household Size in South Canal
Average Household Size in South Canal is 2.1 People.
What is Per Capita Income in South Canal?
Per Capita income in South Canal is $33,319.
What is the Median Family Income in South Canal?
Median Family Income in South Canal is $60,897.
What is the Median Household income in South Canal?
Median Household Income in South Canal is $59,760.
What is Income or Wage Gap in South Canal?
Income or Wage Gap in South Canal is 27.2%.
Women in South Canal earn 72.8 cents for every dollar earned by a man.
What is Inequality or Gini Index in South Canal?
Inequality or Gini Index in South Canal is 0.35.
How Large is the Labor Force in South Canal?
There are 479 People in the Labor Forcein in South Canal.
What is the Percentage of People in the Labor Force in South Canal?
53.6% of People are in the Labor Force in South Canal.
What is the Unemployment Rate in South Canal?
Unemployment Rate in South Canal is 2.5%.