Salem Heights, OH
Salem Heights Map
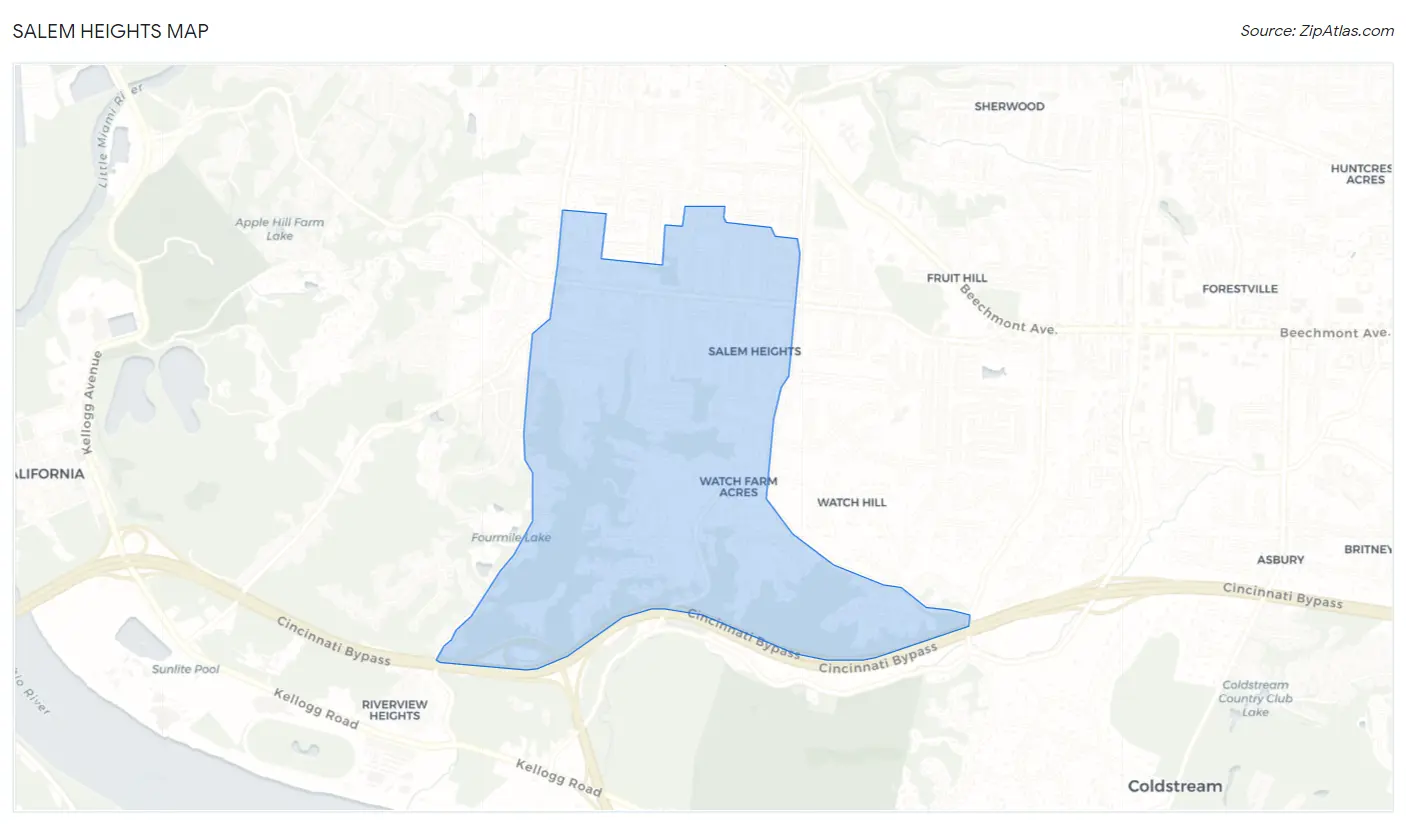
Salem Heights Overview
3,335
TOTAL POPULATION
1,641
MALE POPULATION
1,694
FEMALE POPULATION
96.87
MALES / 100 FEMALES
103.23
FEMALES / 100 MALES
40.8
MEDIAN AGE
2.8
AVG FAMILY SIZE
2.5
AVG HOUSEHOLD SIZE
$44,752
PER CAPITA INCOME
$117,778
AVG FAMILY INCOME
$93,971
AVG HOUSEHOLD INCOME
52.2%
WAGE / INCOME GAP [ % ]
47.8¢/ $1
WAGE / INCOME GAP [ $ ]
0.38
INEQUALITY / GINI INDEX
1,709
LABOR FORCE [ PEOPLE ]
62.0%
PERCENT IN LABOR FORCE
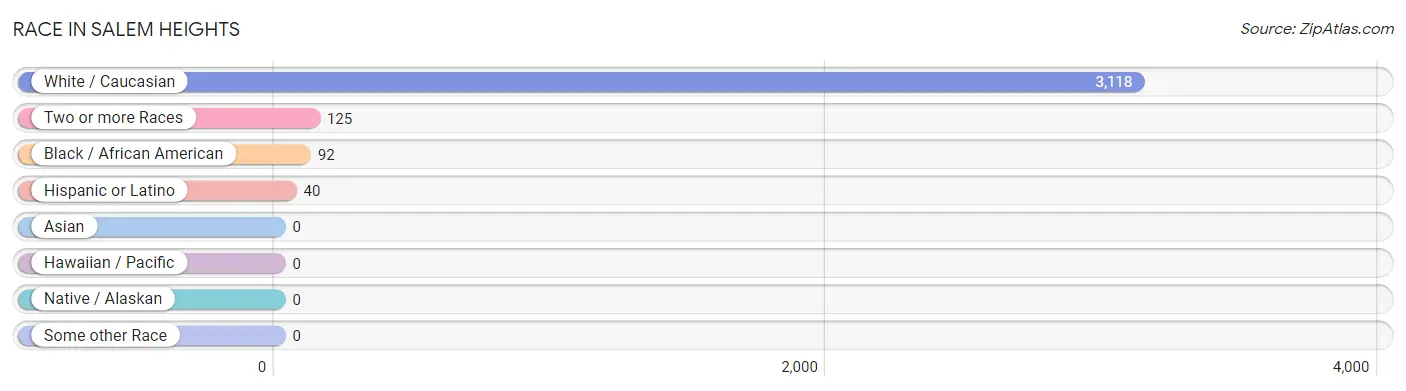
Race in Salem Heights
The most populous races in Salem Heights are White / Caucasian (3,118 | 93.5%), Two or more Races (125 | 3.7%), and Black / African American (92 | 2.8%).
| Race | # Population | % Population |
| Asian | 0 | 0.0% |
| Black / African American | 92 | 2.8% |
| Hawaiian / Pacific | 0 | 0.0% |
| Hispanic or Latino | 40 | 1.2% |
| Native / Alaskan | 0 | 0.0% |
| White / Caucasian | 3,118 | 93.5% |
| Two or more Races | 125 | 3.7% |
| Some other Race | 0 | 0.0% |
| Total | 3,335 | 100.0% |
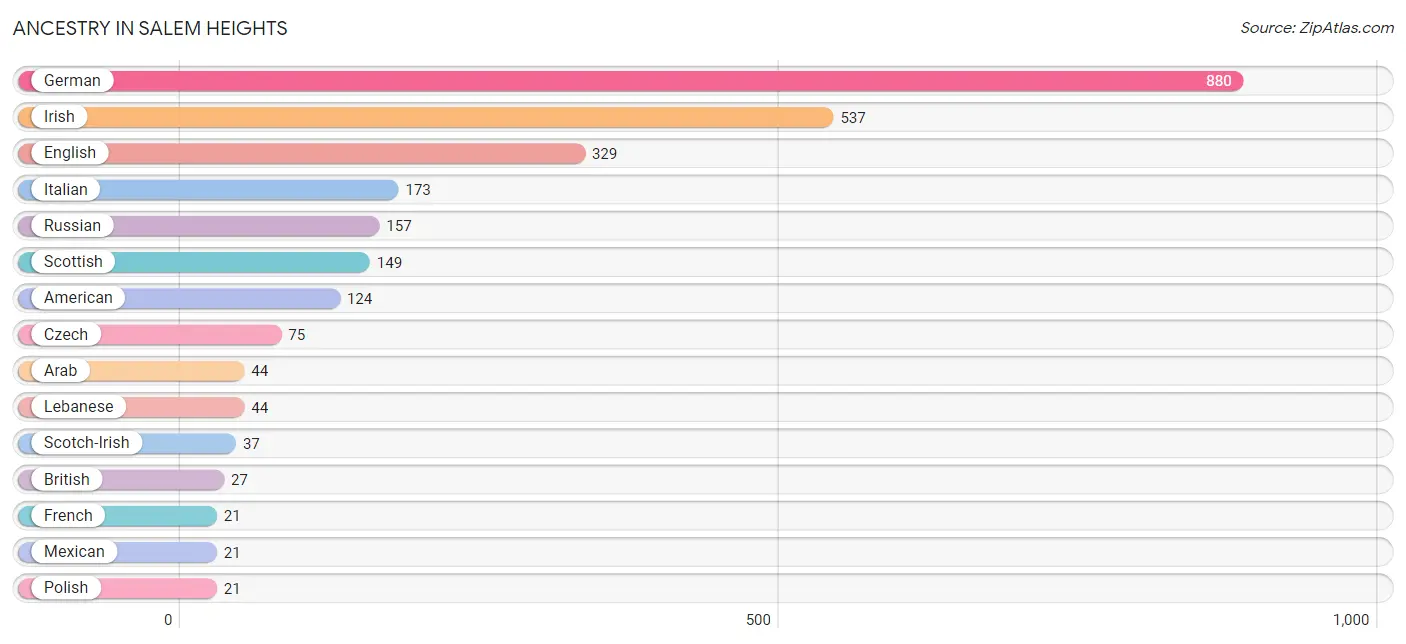
Ancestry in Salem Heights
The most populous ancestries reported in Salem Heights are German (880 | 26.4%), Irish (537 | 16.1%), English (329 | 9.9%), Italian (173 | 5.2%), and Russian (157 | 4.7%), together accounting for 62.3% of all Salem Heights residents.
| Ancestry | # Population | % Population |
| American | 124 | 3.7% |
| Arab | 44 | 1.3% |
| Armenian | 16 | 0.5% |
| British | 27 | 0.8% |
| Central American | 19 | 0.6% |
| Costa Rican | 19 | 0.6% |
| Czech | 75 | 2.2% |
| Eastern European | 16 | 0.5% |
| English | 329 | 9.9% |
| European | 1 | 0.0% |
| French | 21 | 0.6% |
| German | 880 | 26.4% |
| Hungarian | 19 | 0.6% |
| Irish | 537 | 16.1% |
| Italian | 173 | 5.2% |
| Lebanese | 44 | 1.3% |
| Mexican | 21 | 0.6% |
| Polish | 21 | 0.6% |
| Russian | 157 | 4.7% |
| Scotch-Irish | 37 | 1.1% |
| Scottish | 149 | 4.5% |
| Swedish | 15 | 0.4% | View All 22 Rows |
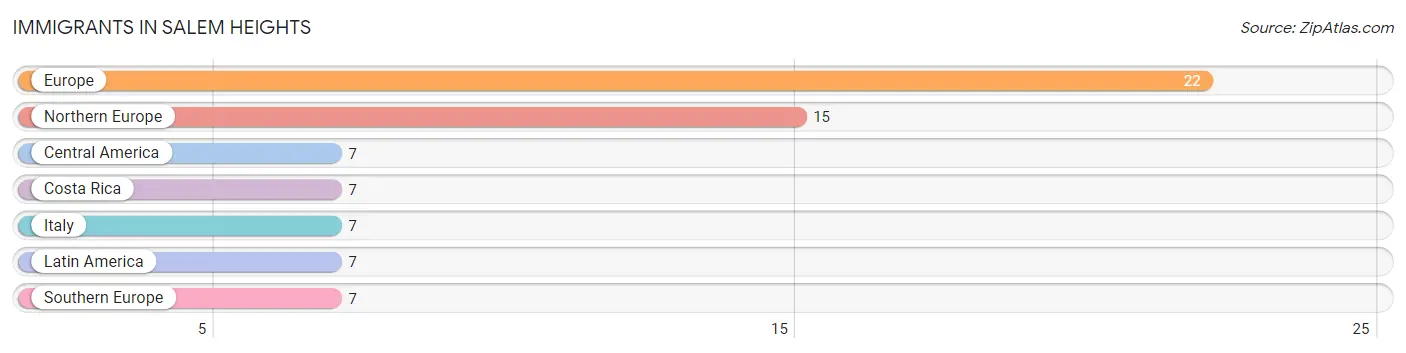
Immigrants in Salem Heights
The most numerous immigrant groups reported in Salem Heights came from Europe (22 | 0.7%), Northern Europe (15 | 0.4%), Central America (7 | 0.2%), Costa Rica (7 | 0.2%), and Italy (7 | 0.2%), together accounting for 1.7% of all Salem Heights residents.
| Immigration Origin | # Population | % Population |
| Central America | 7 | 0.2% |
| Costa Rica | 7 | 0.2% |
| Europe | 22 | 0.7% |
| Italy | 7 | 0.2% |
| Latin America | 7 | 0.2% |
| Northern Europe | 15 | 0.4% |
| Southern Europe | 7 | 0.2% | View All 7 Rows |
Sex and Age in Salem Heights
Sex and Age in Salem Heights
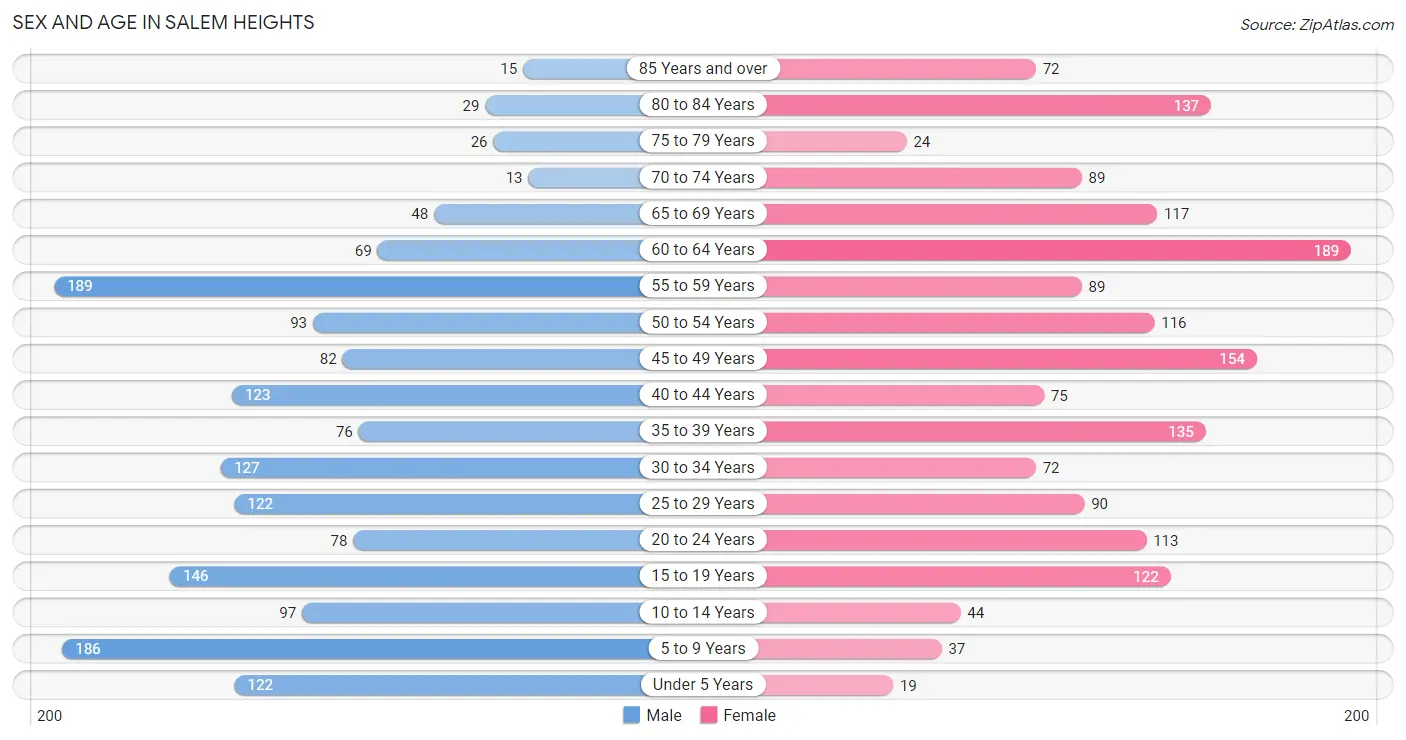
The most populous age groups in Salem Heights are 55 to 59 Years (189 | 11.5%) for men and 60 to 64 Years (189 | 11.2%) for women.
| Age Bracket | Male | Female |
| Under 5 Years | 122 (7.4%) | 19 (1.1%) |
| 5 to 9 Years | 186 (11.3%) | 37 (2.2%) |
| 10 to 14 Years | 97 (5.9%) | 44 (2.6%) |
| 15 to 19 Years | 146 (8.9%) | 122 (7.2%) |
| 20 to 24 Years | 78 (4.8%) | 113 (6.7%) |
| 25 to 29 Years | 122 (7.4%) | 90 (5.3%) |
| 30 to 34 Years | 127 (7.7%) | 72 (4.3%) |
| 35 to 39 Years | 76 (4.6%) | 135 (8.0%) |
| 40 to 44 Years | 123 (7.5%) | 75 (4.4%) |
| 45 to 49 Years | 82 (5.0%) | 154 (9.1%) |
| 50 to 54 Years | 93 (5.7%) | 116 (6.9%) |
| 55 to 59 Years | 189 (11.5%) | 89 (5.2%) |
| 60 to 64 Years | 69 (4.2%) | 189 (11.2%) |
| 65 to 69 Years | 48 (2.9%) | 117 (6.9%) |
| 70 to 74 Years | 13 (0.8%) | 89 (5.2%) |
| 75 to 79 Years | 26 (1.6%) | 24 (1.4%) |
| 80 to 84 Years | 29 (1.8%) | 137 (8.1%) |
| 85 Years and over | 15 (0.9%) | 72 (4.3%) |
| Total | 1,641 (100.0%) | 1,694 (100.0%) |
Families and Households in Salem Heights
Median Family Size in Salem Heights
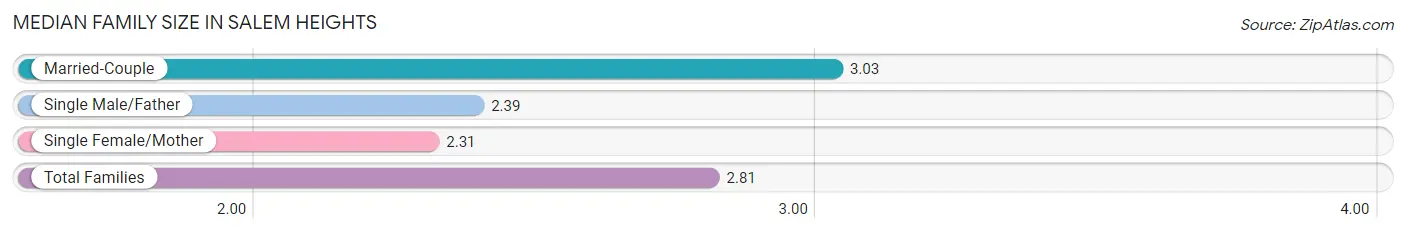
The median family size in Salem Heights is 2.81 persons per family, with married-couple families (678 | 68.9%) accounting for the largest median family size of 3.03 persons per family. On the other hand, single female/mother families (219 | 22.3%) represent the smallest median family size with 2.31 persons per family.
| Family Type | # Families | Family Size |
| Married-Couple | 678 (68.9%) | 3.03 |
| Single Male/Father | 87 (8.8%) | 2.39 |
| Single Female/Mother | 219 (22.3%) | 2.31 |
| Total Families | 984 (100.0%) | 2.81 |
Median Household Size in Salem Heights
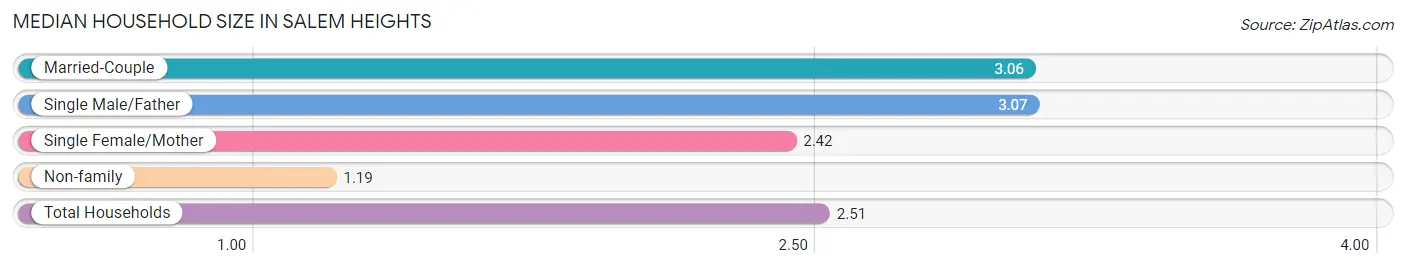
The median household size in Salem Heights is 2.51 persons per household, with single male/father households (87 | 6.8%) accounting for the largest median household size of 3.07 persons per household. non-family households (302 | 23.5%) represent the smallest median household size with 1.19 persons per household.
| Household Type | # Households | Household Size |
| Married-Couple | 678 (52.7%) | 3.06 |
| Single Male/Father | 87 (6.8%) | 3.07 |
| Single Female/Mother | 219 (17.0%) | 2.42 |
| Non-family | 302 (23.5%) | 1.19 |
| Total Households | 1,286 (100.0%) | 2.51 |
Household Size by Marriage Status in Salem Heights
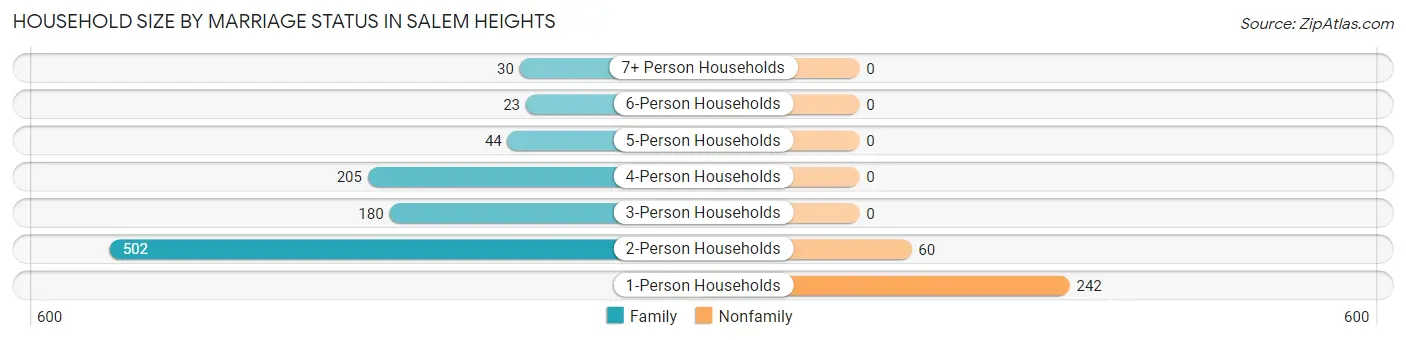
Out of a total of 1,286 households in Salem Heights, 984 (76.5%) are family households, while 302 (23.5%) are nonfamily households. The most numerous type of family households are 2-person households, comprising 502, and the most common type of nonfamily households are 1-person households, comprising 242.
| Household Size | Family Households | Nonfamily Households |
| 1-Person Households | - | 242 (18.8%) |
| 2-Person Households | 502 (39.0%) | 60 (4.7%) |
| 3-Person Households | 180 (14.0%) | 0 (0.0%) |
| 4-Person Households | 205 (15.9%) | 0 (0.0%) |
| 5-Person Households | 44 (3.4%) | 0 (0.0%) |
| 6-Person Households | 23 (1.8%) | 0 (0.0%) |
| 7+ Person Households | 30 (2.3%) | 0 (0.0%) |
| Total | 984 (76.5%) | 302 (23.5%) |
Female Fertility in Salem Heights
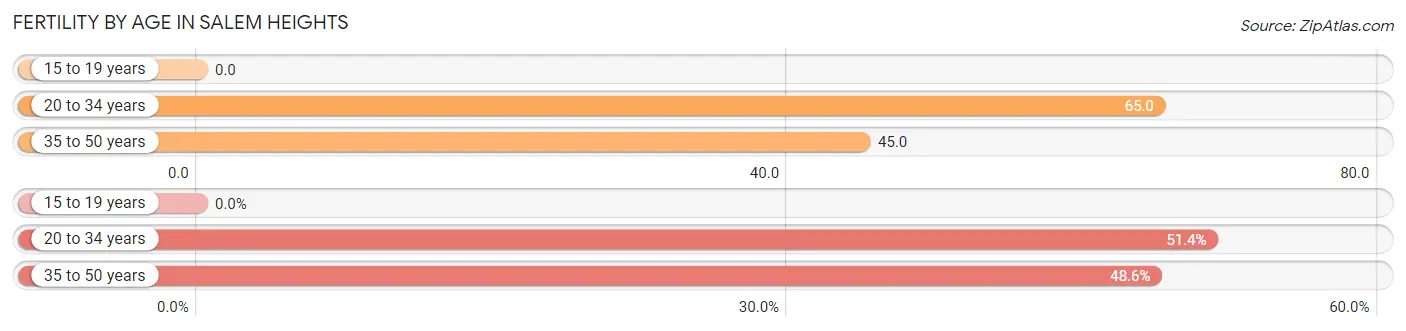
Fertility by Age in Salem Heights
Average fertility rate in Salem Heights is 45.0 births per 1,000 women. Women in the age bracket of 20 to 34 years have the highest fertility rate with 65.0 births per 1,000 women. Women in the age bracket of 20 to 34 years acount for 51.4% of all women with births.
| Age Bracket | Women with Births | Births / 1,000 Women |
| 15 to 19 years | 0 (0.0%) | 0.0 |
| 20 to 34 years | 18 (51.4%) | 65.0 |
| 35 to 50 years | 17 (48.6%) | 45.0 |
| Total | 35 (100.0%) | 45.0 |
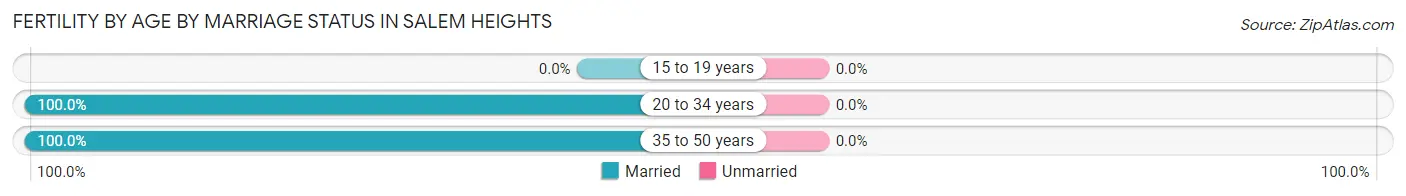
Fertility by Age by Marriage Status in Salem Heights
| Age Bracket | Married | Unmarried |
| 15 to 19 years | 0 (0.0%) | 0 (0.0%) |
| 20 to 34 years | 18 (100.0%) | 0 (0.0%) |
| 35 to 50 years | 17 (100.0%) | 0 (0.0%) |
| Total | 35 (100.0%) | 0 (0.0%) |
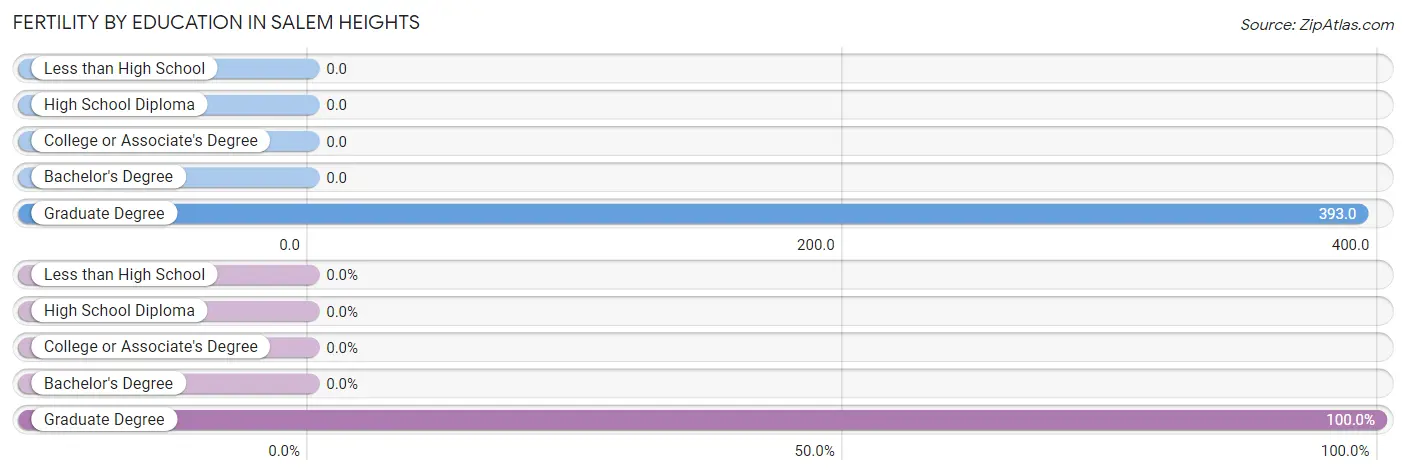
Fertility by Education in Salem Heights
| Educational Attainment | Women with Births | Births / 1,000 Women |
| Less than High School | 0 (0.0%) | 0.0 |
| High School Diploma | 0 (0.0%) | 0.0 |
| College or Associate's Degree | 0 (0.0%) | 0.0 |
| Bachelor's Degree | 0 (0.0%) | 0.0 |
| Graduate Degree | 35 (100.0%) | 393.0 |
| Total | 35 (100.0%) | 45.0 |
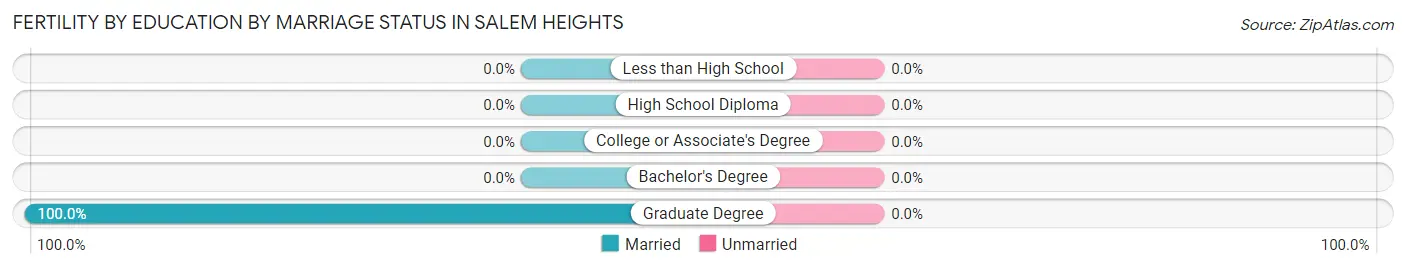
Fertility by Education by Marriage Status in Salem Heights
| Educational Attainment | Married | Unmarried |
| Less than High School | 0 (0.0%) | 0 (0.0%) |
| High School Diploma | 0 (0.0%) | 0 (0.0%) |
| College or Associate's Degree | 0 (0.0%) | 0 (0.0%) |
| Bachelor's Degree | 0 (0.0%) | 0 (0.0%) |
| Graduate Degree | 35 (100.0%) | 0 (0.0%) |
| Total | 35 (100.0%) | 0 (0.0%) |
Income in Salem Heights
Income Overview in Salem Heights
Per Capita Income in Salem Heights is $44,752, while median incomes of families and households are $117,778 and $93,971 respectively.
| Characteristic | Number | Measure |
| Per Capita Income | 3,335 | $44,752 |
| Median Family Income | 984 | $117,778 |
| Mean Family Income | 984 | $119,338 |
| Median Household Income | 1,286 | $93,971 |
| Mean Household Income | 1,286 | $116,425 |
| Income Deficit | 984 | $0 |
| Wage / Income Gap (%) | 3,335 | 52.16% |
| Wage / Income Gap ($) | 3,335 | 47.84¢ per $1 |
| Gini / Inequality Index | 3,335 | 0.38 |
Earnings by Sex in Salem Heights
Average Earnings in Salem Heights are $43,049, $56,856 for men and $27,198 for women, a difference of 52.2%.
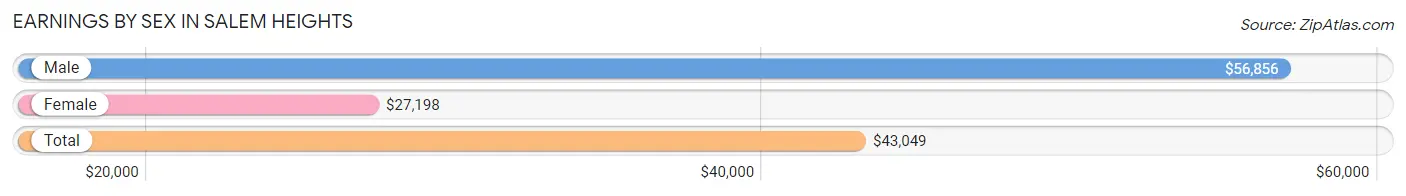
| Sex | Number | Average Earnings |
| Male | 953 (49.8%) | $56,856 |
| Female | 961 (50.2%) | $27,198 |
| Total | 1,914 (100.0%) | $43,049 |
Earnings by Sex by Income Bracket in Salem Heights
The most common earnings brackets in Salem Heights are $100,000+ for men (226 | 23.7%) and $100,000+ for women (147 | 15.3%).
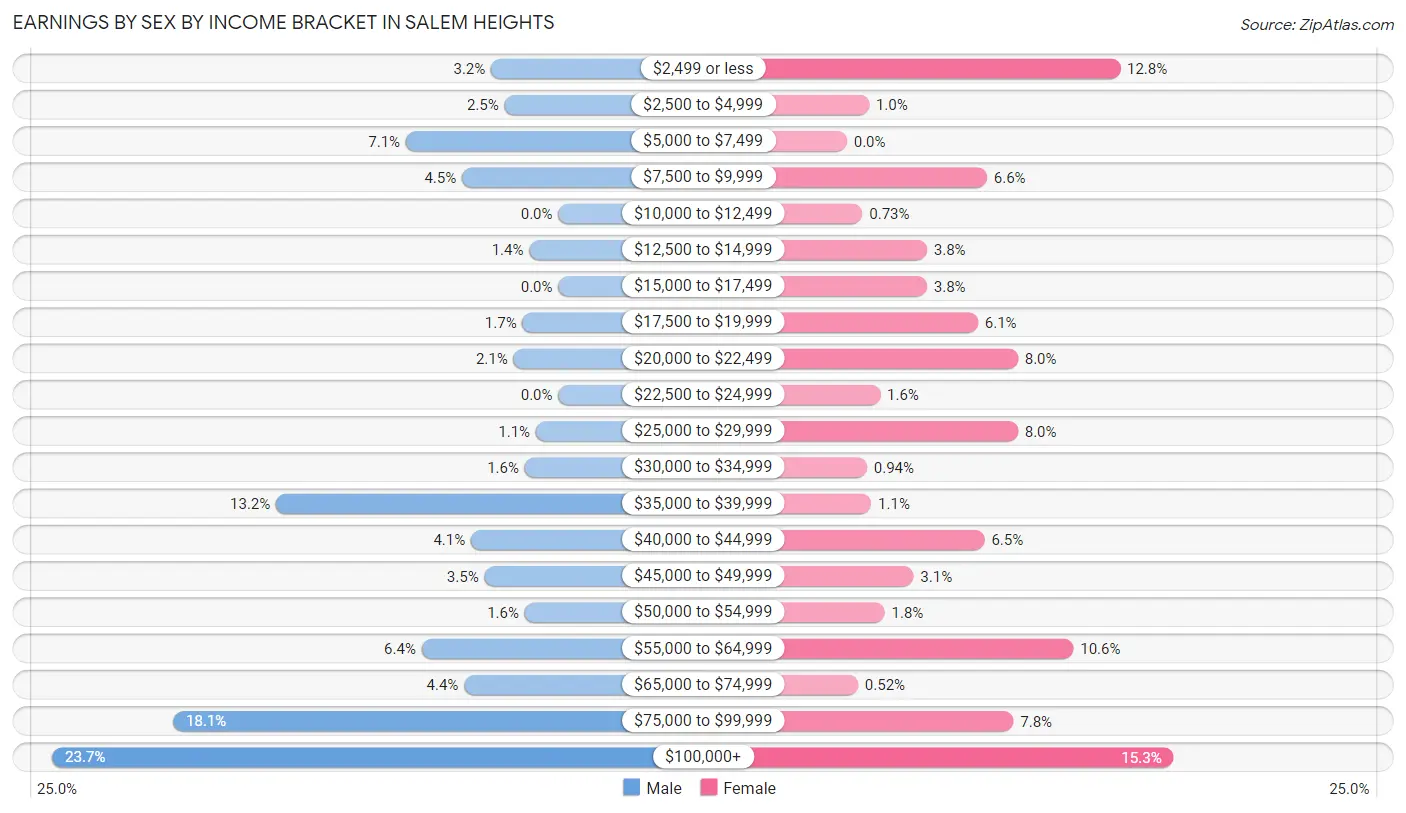
| Income | Male | Female |
| $2,499 or less | 30 (3.2%) | 123 (12.8%) |
| $2,500 to $4,999 | 24 (2.5%) | 10 (1.0%) |
| $5,000 to $7,499 | 68 (7.1%) | 0 (0.0%) |
| $7,500 to $9,999 | 43 (4.5%) | 63 (6.6%) |
| $10,000 to $12,499 | 0 (0.0%) | 7 (0.7%) |
| $12,500 to $14,999 | 13 (1.4%) | 36 (3.7%) |
| $15,000 to $17,499 | 0 (0.0%) | 36 (3.7%) |
| $17,500 to $19,999 | 16 (1.7%) | 59 (6.1%) |
| $20,000 to $22,499 | 20 (2.1%) | 77 (8.0%) |
| $22,500 to $24,999 | 0 (0.0%) | 15 (1.6%) |
| $25,000 to $29,999 | 10 (1.1%) | 77 (8.0%) |
| $30,000 to $34,999 | 15 (1.6%) | 9 (0.9%) |
| $35,000 to $39,999 | 126 (13.2%) | 11 (1.1%) |
| $40,000 to $44,999 | 39 (4.1%) | 62 (6.5%) |
| $45,000 to $49,999 | 33 (3.5%) | 30 (3.1%) |
| $50,000 to $54,999 | 15 (1.6%) | 17 (1.8%) |
| $55,000 to $64,999 | 61 (6.4%) | 102 (10.6%) |
| $65,000 to $74,999 | 42 (4.4%) | 5 (0.5%) |
| $75,000 to $99,999 | 172 (18.0%) | 75 (7.8%) |
| $100,000+ | 226 (23.7%) | 147 (15.3%) |
| Total | 953 (100.0%) | 961 (100.0%) |
Earnings by Sex by Educational Attainment in Salem Heights
Average earnings in Salem Heights are $70,598 for men and $44,329 for women, a difference of 37.2%. Men with an educational attainment of graduate degree enjoy the highest average annual earnings of $154,063, while those with college or associate's degree education earn the least with $39,901. Women with an educational attainment of bachelor's degree earn the most with the average annual earnings of $80,650, while those with high school diploma education have the smallest earnings of $21,997.
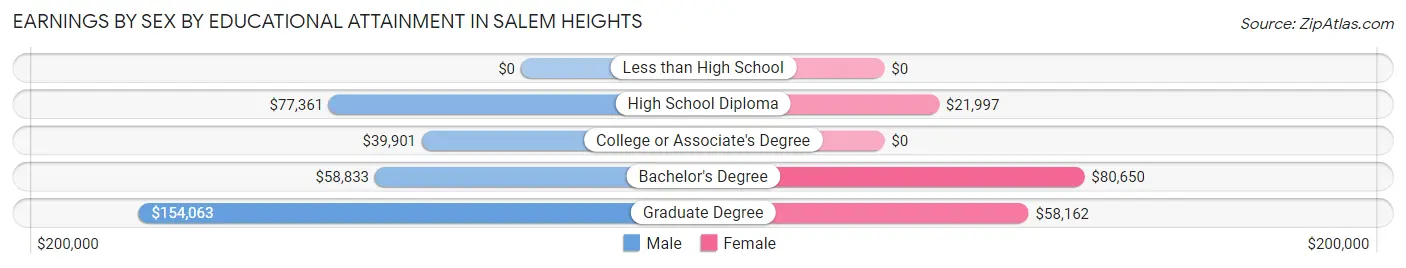
| Educational Attainment | Male Income | Female Income |
| Less than High School | - | - |
| High School Diploma | $77,361 | $21,997 |
| College or Associate's Degree | $39,901 | $0 |
| Bachelor's Degree | $58,833 | $80,650 |
| Graduate Degree | $154,063 | $58,162 |
| Total | $70,598 | $44,329 |
Family Income in Salem Heights
Family Income Brackets in Salem Heights
According to the Salem Heights family income data, there are 306 families falling into the $150,000 to $199,999 income range, which is the most common income bracket and makes up 31.1% of all families.
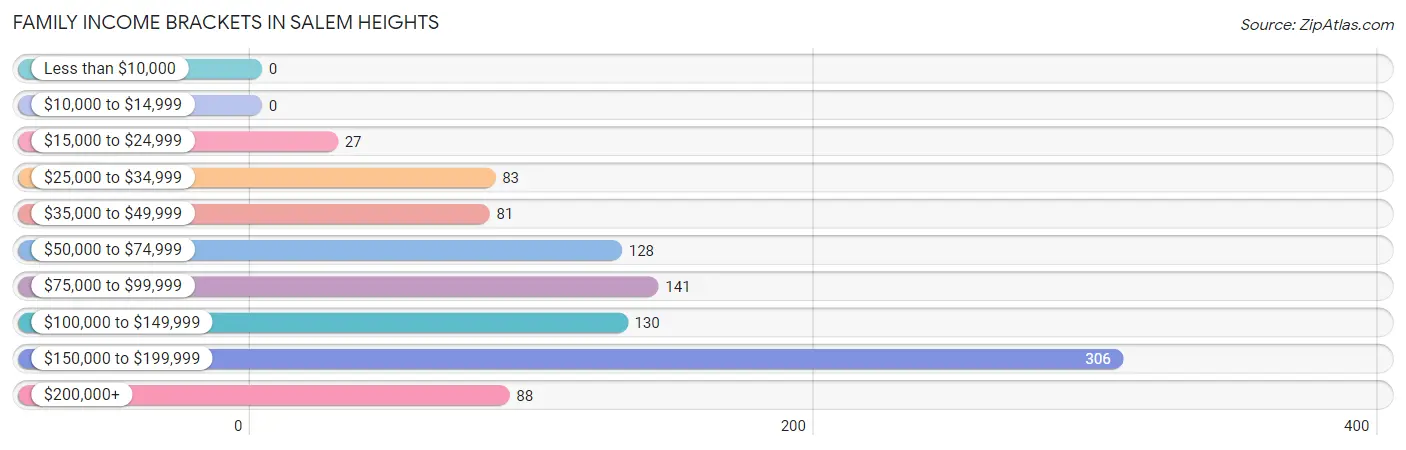
| Income Bracket | # Families | % Families |
| Less than $10,000 | 0 | 0.0% |
| $10,000 to $14,999 | 0 | 0.0% |
| $15,000 to $24,999 | 27 | 2.7% |
| $25,000 to $34,999 | 83 | 8.4% |
| $35,000 to $49,999 | 81 | 8.2% |
| $50,000 to $74,999 | 128 | 13.0% |
| $75,000 to $99,999 | 141 | 14.3% |
| $100,000 to $149,999 | 130 | 13.2% |
| $150,000 to $199,999 | 306 | 31.1% |
| $200,000+ | 88 | 8.9% |
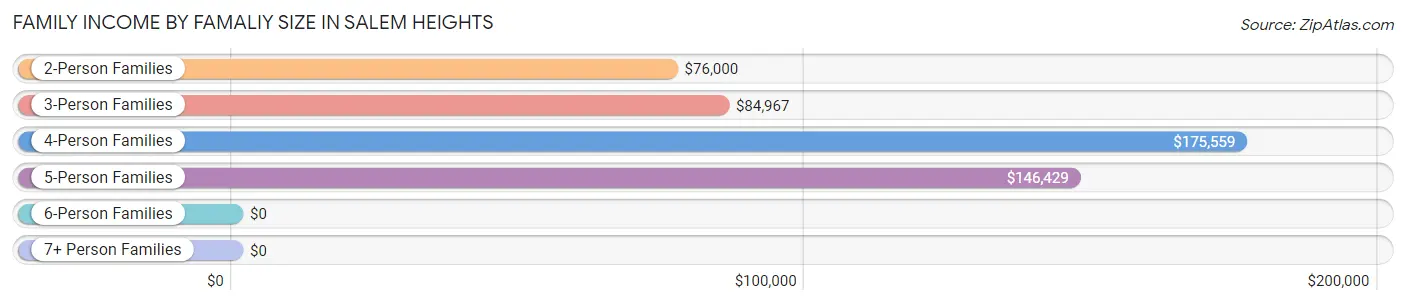
Family Income by Famaliy Size in Salem Heights
4-person families (117 | 11.9%) account for the highest median family income in Salem Heights with $175,559 per family, while 4-person families (117 | 11.9%) have the highest median income of $43,890 per family member.
| Income Bracket | # Families | Median Income |
| 2-Person Families | 528 (53.7%) | $76,000 |
| 3-Person Families | 242 (24.6%) | $84,967 |
| 4-Person Families | 117 (11.9%) | $175,559 |
| 5-Person Families | 44 (4.5%) | $146,429 |
| 6-Person Families | 33 (3.4%) | $0 |
| 7+ Person Families | 20 (2.0%) | $0 |
| Total | 984 (100.0%) | $117,778 |
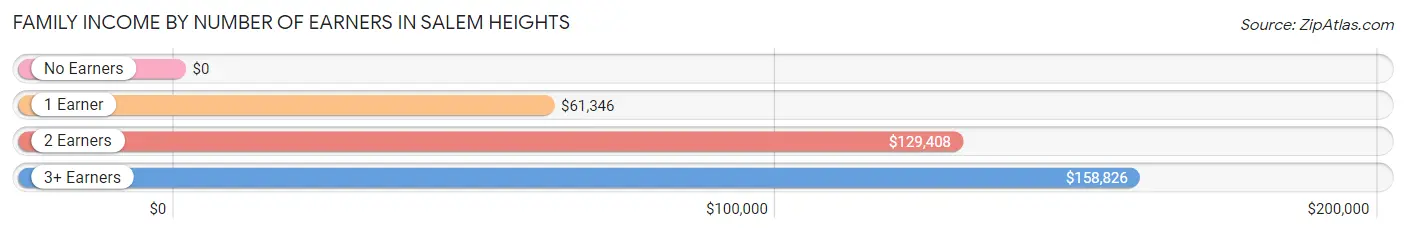
Family Income by Number of Earners in Salem Heights
| Number of Earners | # Families | Median Income |
| No Earners | 58 (5.9%) | $0 |
| 1 Earner | 398 (40.5%) | $61,346 |
| 2 Earners | 415 (42.2%) | $129,408 |
| 3+ Earners | 113 (11.5%) | $158,826 |
| Total | 984 (100.0%) | $117,778 |
Household Income in Salem Heights
Household Income Brackets in Salem Heights
With 307 households falling in the category, the $150,000 to $199,999 income range is the most frequent in Salem Heights, accounting for 23.9% of all households.
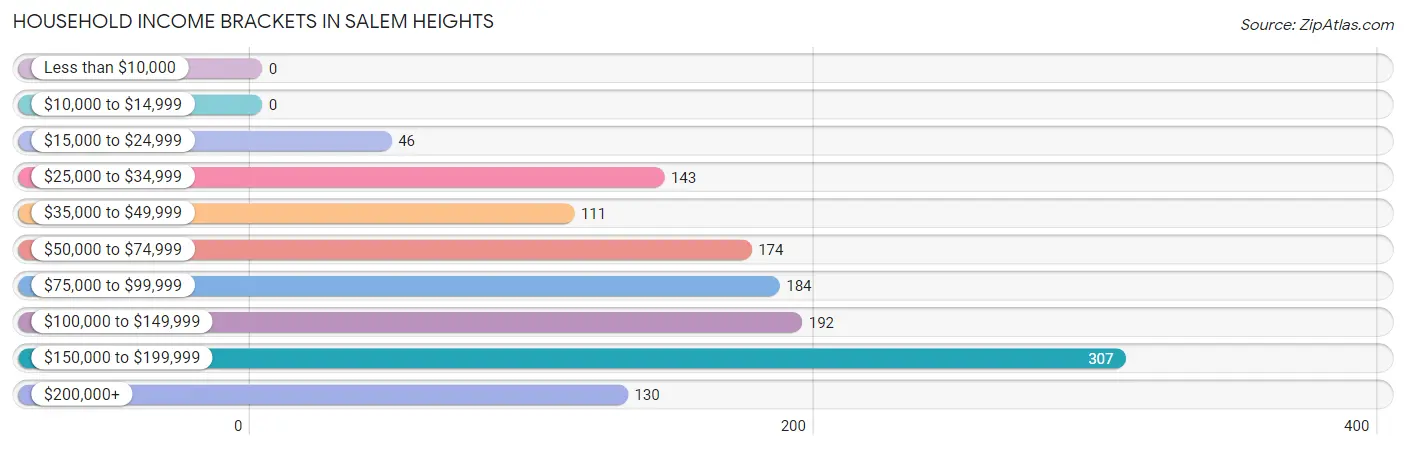
| Income Bracket | # Households | % Households |
| Less than $10,000 | 0 | 0.0% |
| $10,000 to $14,999 | 0 | 0.0% |
| $15,000 to $24,999 | 46 | 3.6% |
| $25,000 to $34,999 | 143 | 11.1% |
| $35,000 to $49,999 | 111 | 8.6% |
| $50,000 to $74,999 | 174 | 13.5% |
| $75,000 to $99,999 | 184 | 14.3% |
| $100,000 to $149,999 | 192 | 14.9% |
| $150,000 to $199,999 | 307 | 23.9% |
| $200,000+ | 130 | 10.1% |
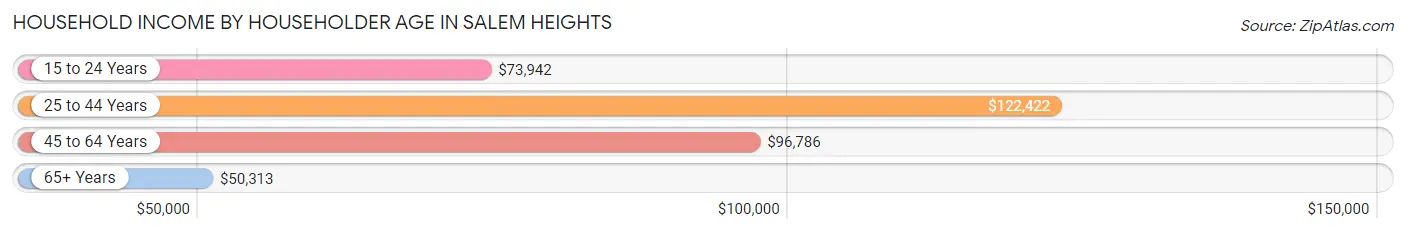
Household Income by Householder Age in Salem Heights
The median household income in Salem Heights is $93,971, with the highest median household income of $122,422 found in the 25 to 44 years age bracket for the primary householder. A total of 455 households (35.4%) fall into this category. Meanwhile, the 65+ years age bracket for the primary householder has the lowest median household income of $50,313, with 272 households (21.1%) in this group.
| Income Bracket | # Households | Median Income |
| 15 to 24 Years | 33 (2.6%) | $73,942 |
| 25 to 44 Years | 455 (35.4%) | $122,422 |
| 45 to 64 Years | 526 (40.9%) | $96,786 |
| 65+ Years | 272 (21.1%) | $50,313 |
| Total | 1,286 (100.0%) | $93,971 |
Poverty in Salem Heights
Income Below Poverty by Sex and Age in Salem Heights
With 4.3% poverty level for males and 7.8% for females among the residents of Salem Heights, 6 to 11 year old males and 15 year old females are the most vulnerable to poverty, with 55 males (26.3%) and 15 females (100.0%) in their respective age groups living below the poverty level.
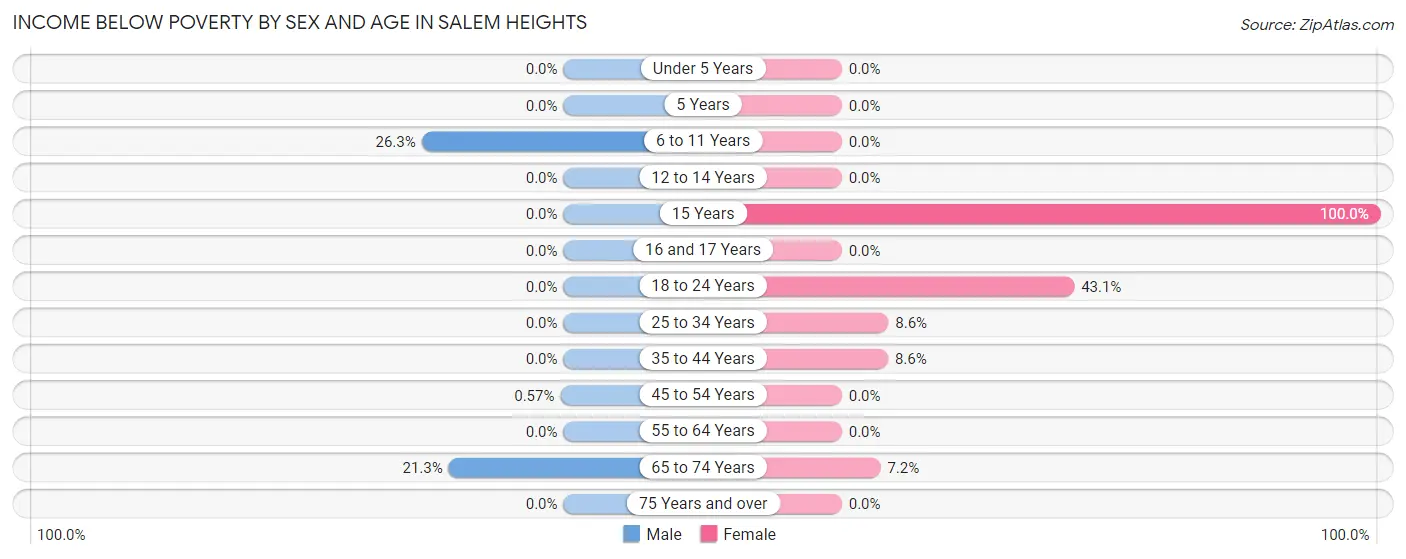
| Age Bracket | Male | Female |
| Under 5 Years | 0 (0.0%) | 0 (0.0%) |
| 5 Years | 0 (0.0%) | 0 (0.0%) |
| 6 to 11 Years | 55 (26.3%) | 0 (0.0%) |
| 12 to 14 Years | 0 (0.0%) | 0 (0.0%) |
| 15 Years | 0 (0.0%) | 15 (100.0%) |
| 16 and 17 Years | 0 (0.0%) | 0 (0.0%) |
| 18 to 24 Years | 0 (0.0%) | 66 (43.1%) |
| 25 to 34 Years | 0 (0.0%) | 14 (8.6%) |
| 35 to 44 Years | 0 (0.0%) | 18 (8.6%) |
| 45 to 54 Years | 1 (0.6%) | 0 (0.0%) |
| 55 to 64 Years | 0 (0.0%) | 0 (0.0%) |
| 65 to 74 Years | 13 (21.3%) | 14 (7.2%) |
| 75 Years and over | 0 (0.0%) | 0 (0.0%) |
| Total | 69 (4.3%) | 127 (7.8%) |
Income Above Poverty by Sex and Age in Salem Heights
According to the poverty statistics in Salem Heights, males aged under 5 years and females aged under 5 years are the age groups that are most secure financially, with 100.0% of males and 100.0% of females in these age groups living above the poverty line.
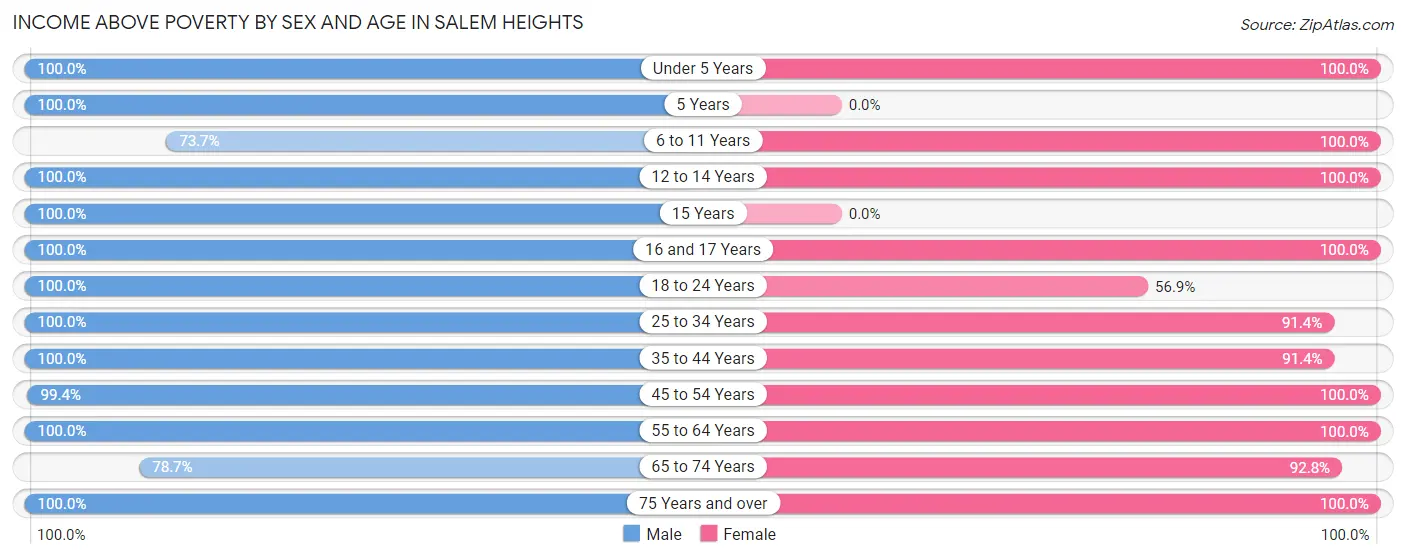
| Age Bracket | Male | Female |
| Under 5 Years | 122 (100.0%) | 19 (100.0%) |
| 5 Years | 24 (100.0%) | 0 (0.0%) |
| 6 to 11 Years | 154 (73.7%) | 57 (100.0%) |
| 12 to 14 Years | 50 (100.0%) | 24 (100.0%) |
| 15 Years | 59 (100.0%) | 0 (0.0%) |
| 16 and 17 Years | 87 (100.0%) | 67 (100.0%) |
| 18 to 24 Years | 78 (100.0%) | 87 (56.9%) |
| 25 to 34 Years | 249 (100.0%) | 148 (91.4%) |
| 35 to 44 Years | 189 (100.0%) | 192 (91.4%) |
| 45 to 54 Years | 174 (99.4%) | 270 (100.0%) |
| 55 to 64 Years | 238 (100.0%) | 278 (100.0%) |
| 65 to 74 Years | 48 (78.7%) | 181 (92.8%) |
| 75 Years and over | 70 (100.0%) | 172 (100.0%) |
| Total | 1,542 (95.7%) | 1,495 (92.2%) |
Income Below Poverty Among Married-Couple Families in Salem Heights
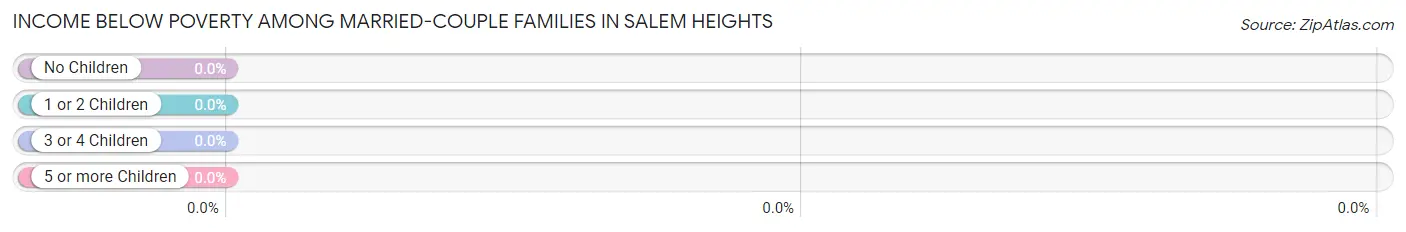
| Children | Above Poverty | Below Poverty |
| No Children | 370 (100.0%) | 0 (0.0%) |
| 1 or 2 Children | 255 (100.0%) | 0 (0.0%) |
| 3 or 4 Children | 53 (100.0%) | 0 (0.0%) |
| 5 or more Children | 0 (0.0%) | 0 (0.0%) |
| Total | 678 (100.0%) | 0 (0.0%) |
Income Below Poverty Among Single-Parent Households in Salem Heights
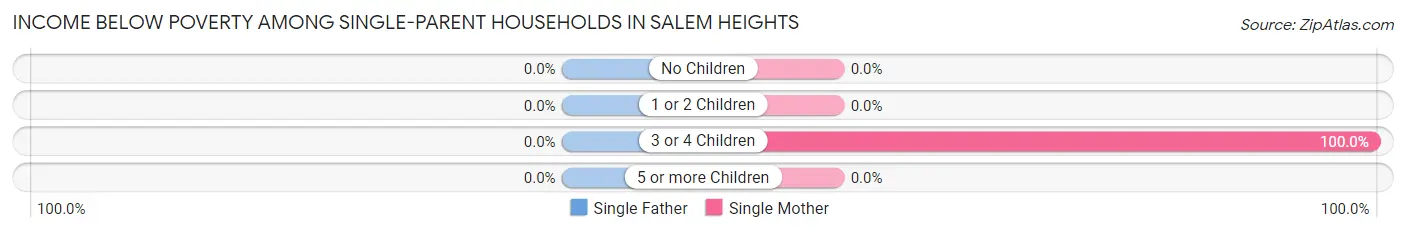
| Children | Single Father | Single Mother |
| No Children | 0 (0.0%) | 0 (0.0%) |
| 1 or 2 Children | 0 (0.0%) | 0 (0.0%) |
| 3 or 4 Children | 0 (0.0%) | 14 (100.0%) |
| 5 or more Children | 0 (0.0%) | 0 (0.0%) |
| Total | 0 (0.0%) | 14 (6.4%) |
Income Below Poverty Among Married-Couple vs Single-Parent Households in Salem Heights
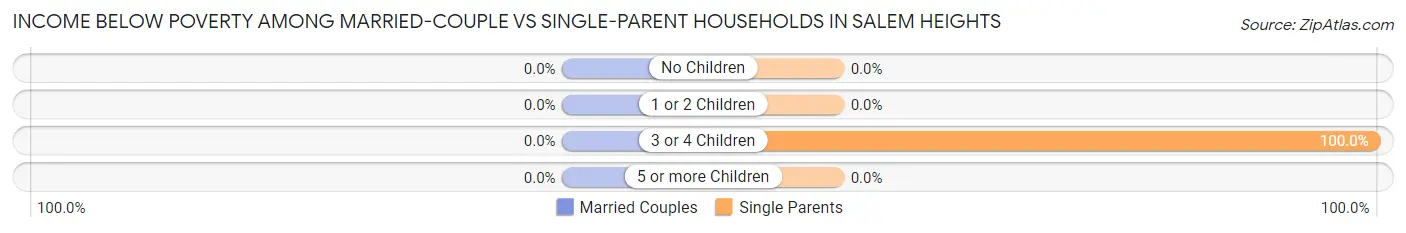
| Children | Married-Couple Families | Single-Parent Households |
| No Children | 0 (0.0%) | 0 (0.0%) |
| 1 or 2 Children | 0 (0.0%) | 0 (0.0%) |
| 3 or 4 Children | 0 (0.0%) | 14 (100.0%) |
| 5 or more Children | 0 (0.0%) | 0 (0.0%) |
| Total | 0 (0.0%) | 14 (4.6%) |
Employment Characteristics in Salem Heights
Employment by Class of Employer in Salem Heights
Among the 1,692 employed individuals in Salem Heights, private company employees (1,253 | 74.1%), not-for-profit organizations (134 | 7.9%), and self-employed (not incorporated) (128 | 7.6%) make up the most common classes of employment.
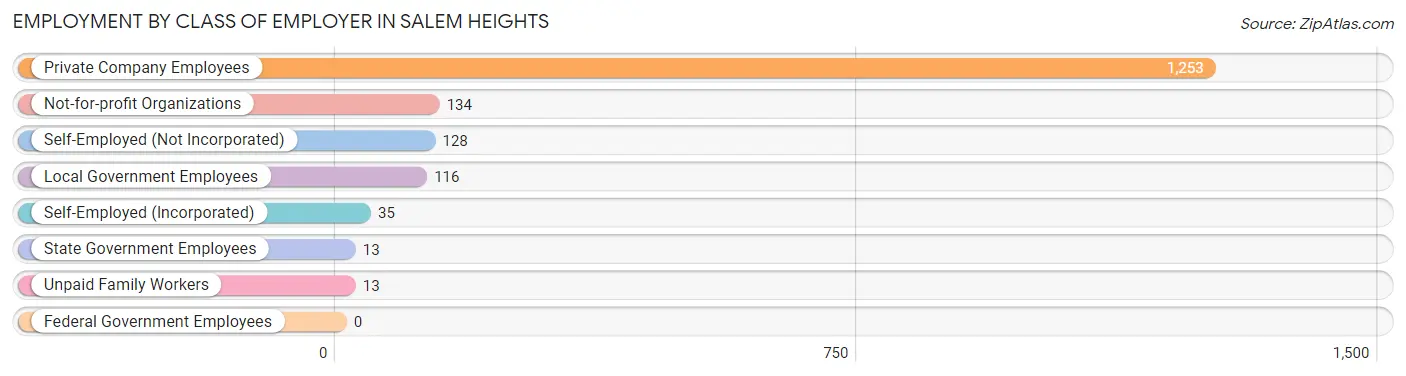
| Employer Class | # Employees | % Employees |
| Private Company Employees | 1,253 | 74.1% |
| Self-Employed (Incorporated) | 35 | 2.1% |
| Self-Employed (Not Incorporated) | 128 | 7.6% |
| Not-for-profit Organizations | 134 | 7.9% |
| Local Government Employees | 116 | 6.9% |
| State Government Employees | 13 | 0.8% |
| Federal Government Employees | 0 | 0.0% |
| Unpaid Family Workers | 13 | 0.8% |
| Total | 1,692 | 100.0% |
Employment Status by Age in Salem Heights
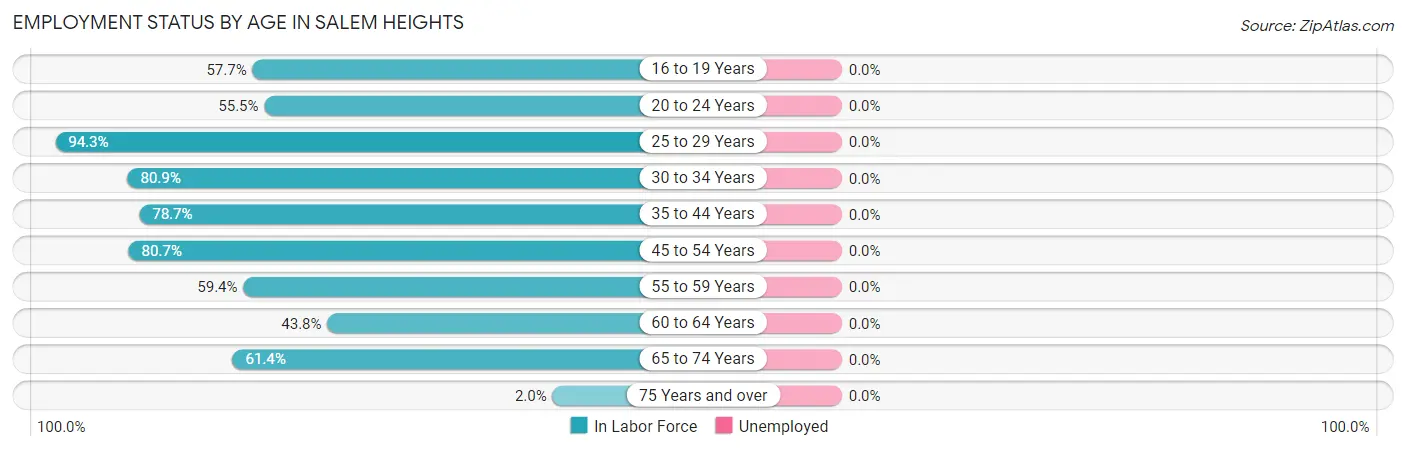
| Age Bracket | In Labor Force | Unemployed |
| 16 to 19 Years | 112 (57.7%) | 0 (0.0%) |
| 20 to 24 Years | 106 (55.5%) | 0 (0.0%) |
| 25 to 29 Years | 200 (94.3%) | 0 (0.0%) |
| 30 to 34 Years | 161 (80.9%) | 0 (0.0%) |
| 35 to 44 Years | 322 (78.7%) | 0 (0.0%) |
| 45 to 54 Years | 359 (80.7%) | 0 (0.0%) |
| 55 to 59 Years | 165 (59.4%) | 0 (0.0%) |
| 60 to 64 Years | 113 (43.8%) | 0 (0.0%) |
| 65 to 74 Years | 164 (61.4%) | 0 (0.0%) |
| 75 Years and over | 6 (2.0%) | 0 (0.0%) |
| Total | 1,709 (62.0%) | 0 (0.0%) |
Employment Status by Educational Attainment in Salem Heights
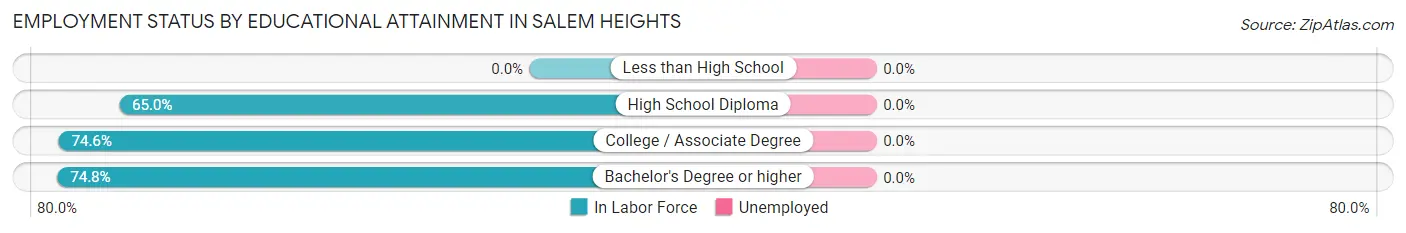
| Educational Attainment | In Labor Force | Unemployed |
| Less than High School | 0 (0.0%) | 0 (0.0%) |
| High School Diploma | 173 (65.0%) | 0 (0.0%) |
| College / Associate Degree | 320 (74.6%) | 0 (0.0%) |
| Bachelor's Degree or higher | 827 (74.8%) | 0 (0.0%) |
| Total | 1,320 (73.3%) | 0 (0.0%) |
Employment Occupations by Sex in Salem Heights
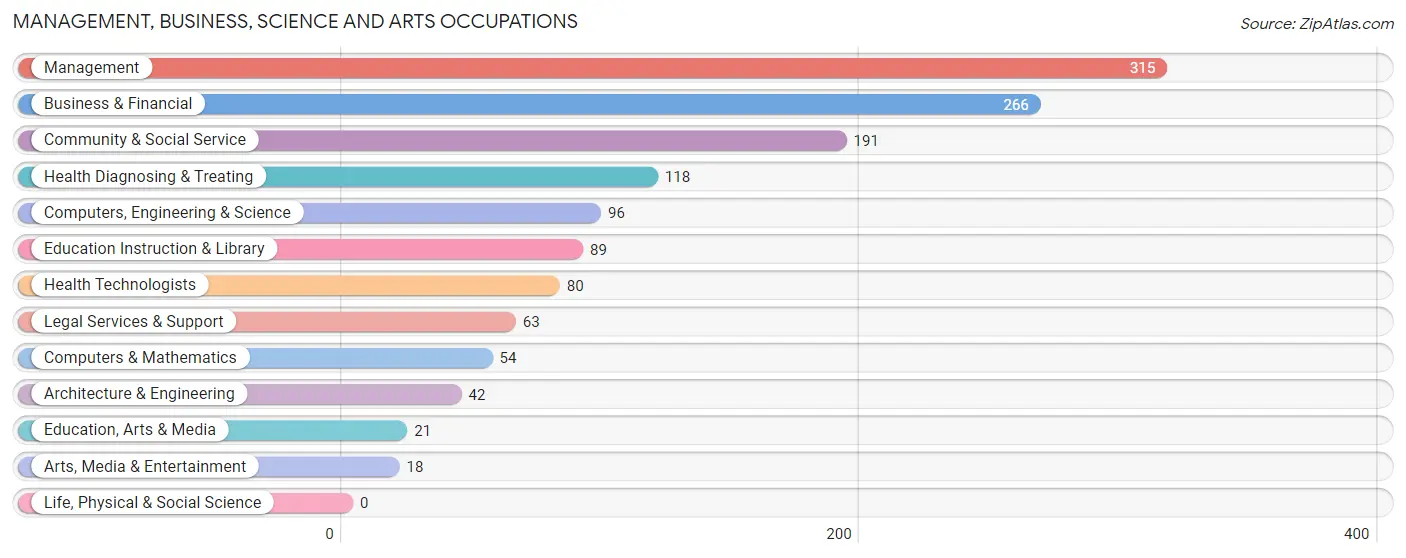
Management, Business, Science and Arts Occupations
The most common Management, Business, Science and Arts occupations in Salem Heights are Management (315 | 18.4%), Business & Financial (266 | 15.6%), Community & Social Service (191 | 11.2%), Health Diagnosing & Treating (118 | 6.9%), and Computers, Engineering & Science (96 | 5.6%).
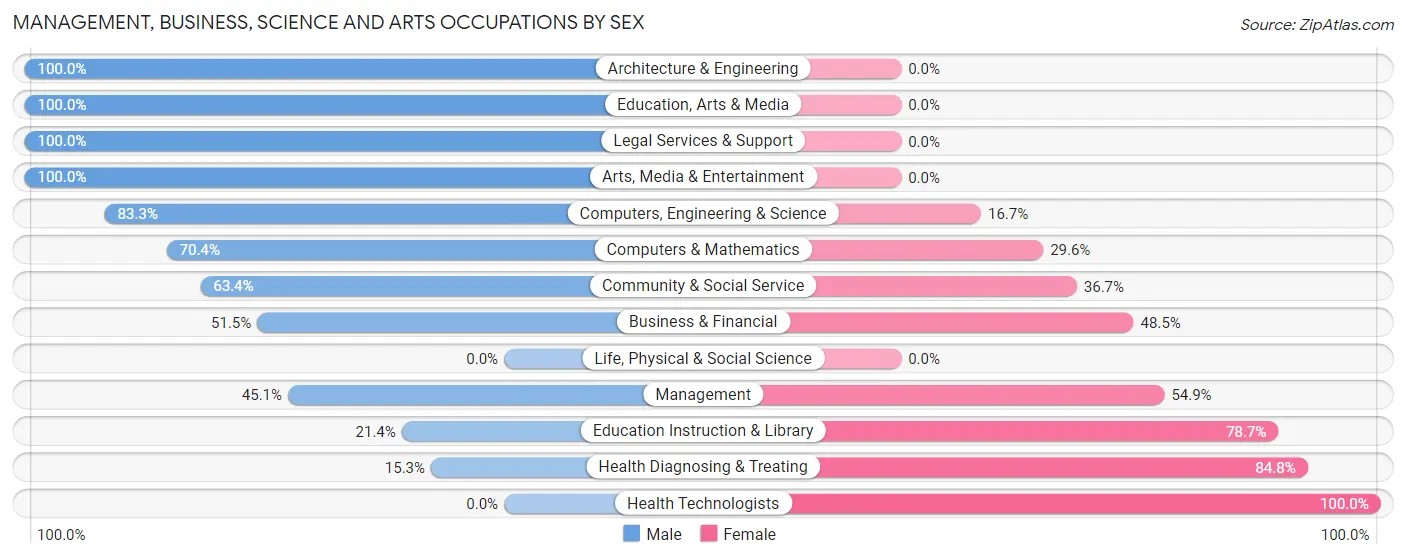
Management, Business, Science and Arts Occupations by Sex
Within the Management, Business, Science and Arts occupations in Salem Heights, the most male-oriented occupations are Architecture & Engineering (100.0%), Education, Arts & Media (100.0%), and Legal Services & Support (100.0%), while the most female-oriented occupations are Health Technologists (100.0%), Health Diagnosing & Treating (84.8%), and Education Instruction & Library (78.6%).
| Occupation | Male | Female |
| Management | 142 (45.1%) | 173 (54.9%) |
| Business & Financial | 137 (51.5%) | 129 (48.5%) |
| Computers, Engineering & Science | 80 (83.3%) | 16 (16.7%) |
| Computers & Mathematics | 38 (70.4%) | 16 (29.6%) |
| Architecture & Engineering | 42 (100.0%) | 0 (0.0%) |
| Life, Physical & Social Science | 0 (0.0%) | 0 (0.0%) |
| Community & Social Service | 121 (63.3%) | 70 (36.6%) |
| Education, Arts & Media | 21 (100.0%) | 0 (0.0%) |
| Legal Services & Support | 63 (100.0%) | 0 (0.0%) |
| Education Instruction & Library | 19 (21.3%) | 70 (78.6%) |
| Arts, Media & Entertainment | 18 (100.0%) | 0 (0.0%) |
| Health Diagnosing & Treating | 18 (15.2%) | 100 (84.8%) |
| Health Technologists | 0 (0.0%) | 80 (100.0%) |
| Total (Category) | 498 (50.5%) | 488 (49.5%) |
| Total (Overall) | 843 (49.4%) | 865 (50.6%) |
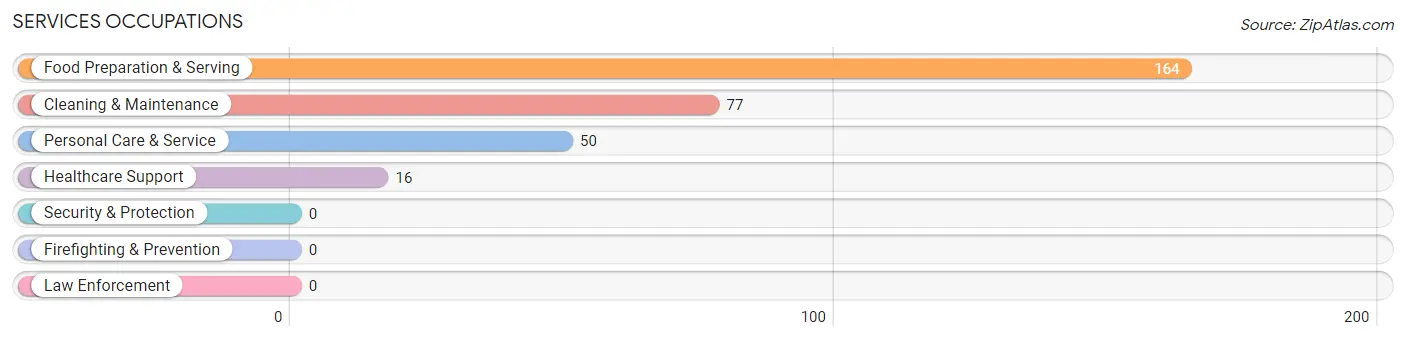
Services Occupations
The most common Services occupations in Salem Heights are Food Preparation & Serving (164 | 9.6%), Cleaning & Maintenance (77 | 4.5%), Personal Care & Service (50 | 2.9%), and Healthcare Support (16 | 0.9%).
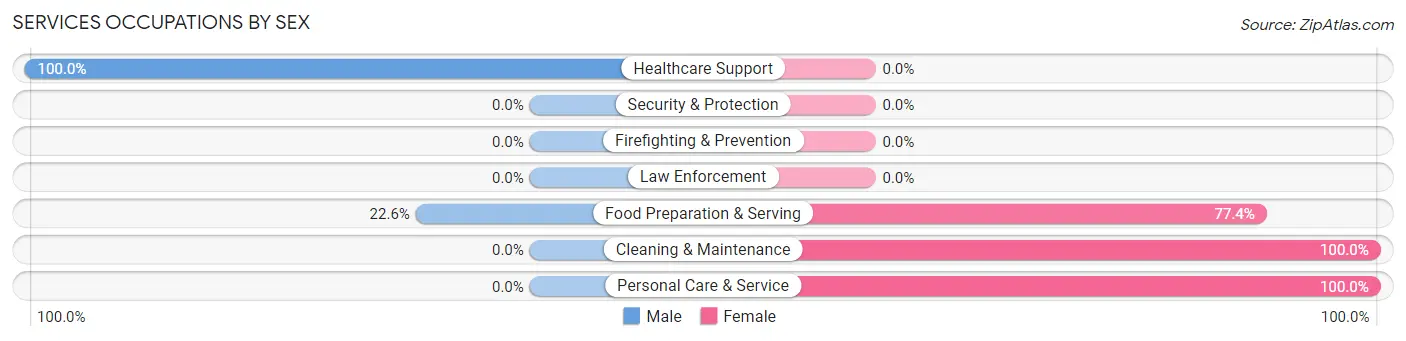
Services Occupations by Sex
Within the Services occupations in Salem Heights, the most male-oriented occupations are Healthcare Support (100.0%), and Food Preparation & Serving (22.6%), while the most female-oriented occupations are Cleaning & Maintenance (100.0%), Personal Care & Service (100.0%), and Food Preparation & Serving (77.4%).
| Occupation | Male | Female |
| Healthcare Support | 16 (100.0%) | 0 (0.0%) |
| Security & Protection | 0 (0.0%) | 0 (0.0%) |
| Firefighting & Prevention | 0 (0.0%) | 0 (0.0%) |
| Law Enforcement | 0 (0.0%) | 0 (0.0%) |
| Food Preparation & Serving | 37 (22.6%) | 127 (77.4%) |
| Cleaning & Maintenance | 0 (0.0%) | 77 (100.0%) |
| Personal Care & Service | 0 (0.0%) | 50 (100.0%) |
| Total (Category) | 53 (17.3%) | 254 (82.7%) |
| Total (Overall) | 843 (49.4%) | 865 (50.6%) |
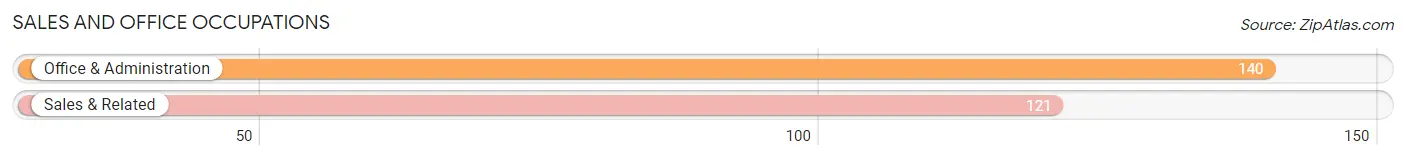
Sales and Office Occupations
The most common Sales and Office occupations in Salem Heights are Office & Administration (140 | 8.2%), and Sales & Related (121 | 7.1%).
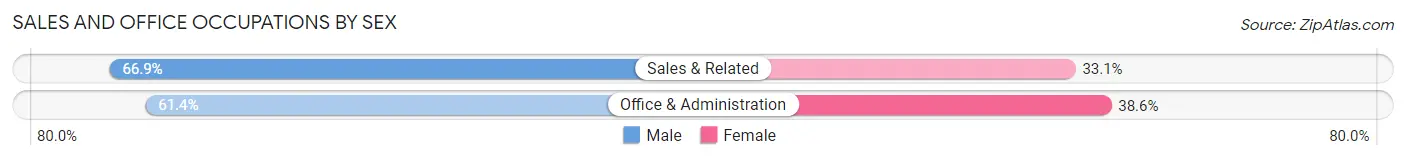
Sales and Office Occupations by Sex
| Occupation | Male | Female |
| Sales & Related | 81 (66.9%) | 40 (33.1%) |
| Office & Administration | 86 (61.4%) | 54 (38.6%) |
| Total (Category) | 167 (64.0%) | 94 (36.0%) |
| Total (Overall) | 843 (49.4%) | 865 (50.6%) |
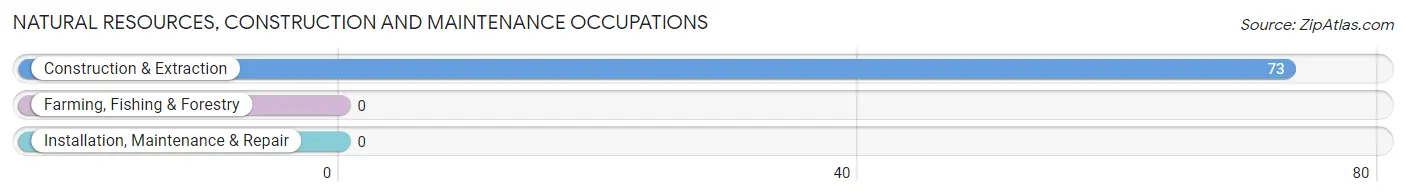
Natural Resources, Construction and Maintenance Occupations
The most common Natural Resources, Construction and Maintenance occupations in Salem Heights are , and Construction & Extraction (73 | 4.3%).
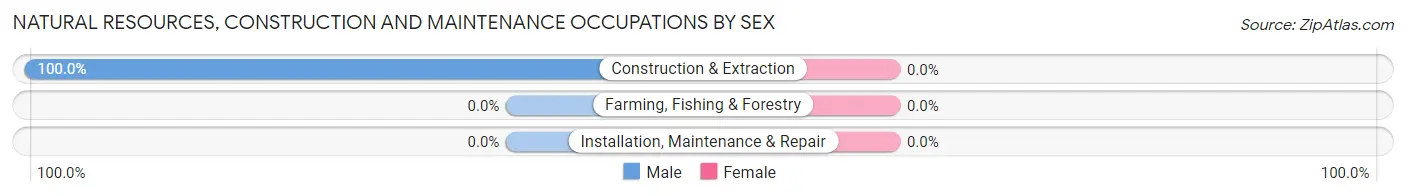
Natural Resources, Construction and Maintenance Occupations by Sex
| Occupation | Male | Female |
| Farming, Fishing & Forestry | 0 (0.0%) | 0 (0.0%) |
| Construction & Extraction | 73 (100.0%) | 0 (0.0%) |
| Installation, Maintenance & Repair | 0 (0.0%) | 0 (0.0%) |
| Total (Category) | 73 (100.0%) | 0 (0.0%) |
| Total (Overall) | 843 (49.4%) | 865 (50.6%) |
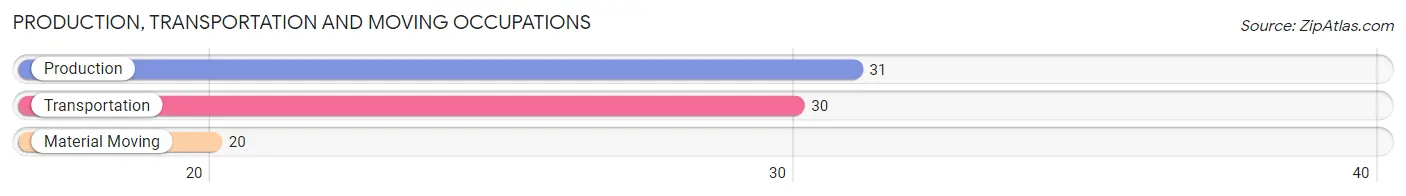
Production, Transportation and Moving Occupations
The most common Production, Transportation and Moving occupations in Salem Heights are Production (31 | 1.8%), Transportation (30 | 1.8%), and Material Moving (20 | 1.2%).
Production, Transportation and Moving Occupations by Sex
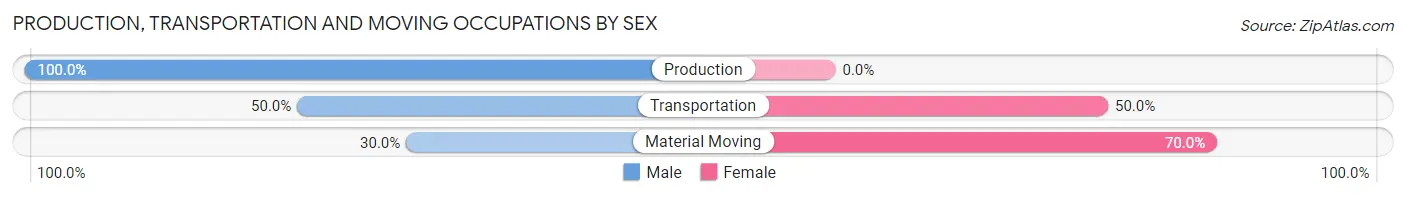
| Occupation | Male | Female |
| Production | 31 (100.0%) | 0 (0.0%) |
| Transportation | 15 (50.0%) | 15 (50.0%) |
| Material Moving | 6 (30.0%) | 14 (70.0%) |
| Total (Category) | 52 (64.2%) | 29 (35.8%) |
| Total (Overall) | 843 (49.4%) | 865 (50.6%) |
Employment Industries by Sex in Salem Heights
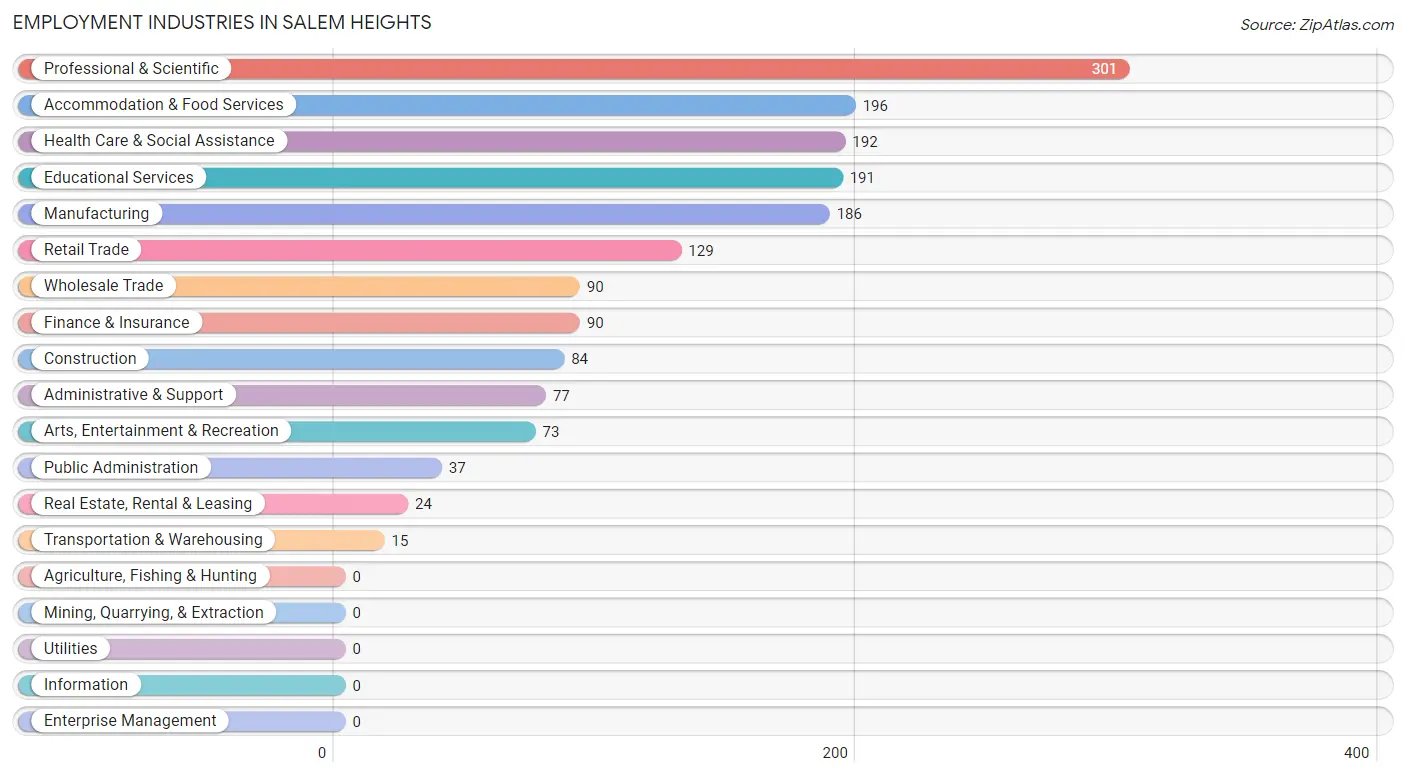
Employment Industries in Salem Heights
The major employment industries in Salem Heights include Professional & Scientific (301 | 17.6%), Accommodation & Food Services (196 | 11.5%), Health Care & Social Assistance (192 | 11.2%), Educational Services (191 | 11.2%), and Manufacturing (186 | 10.9%).
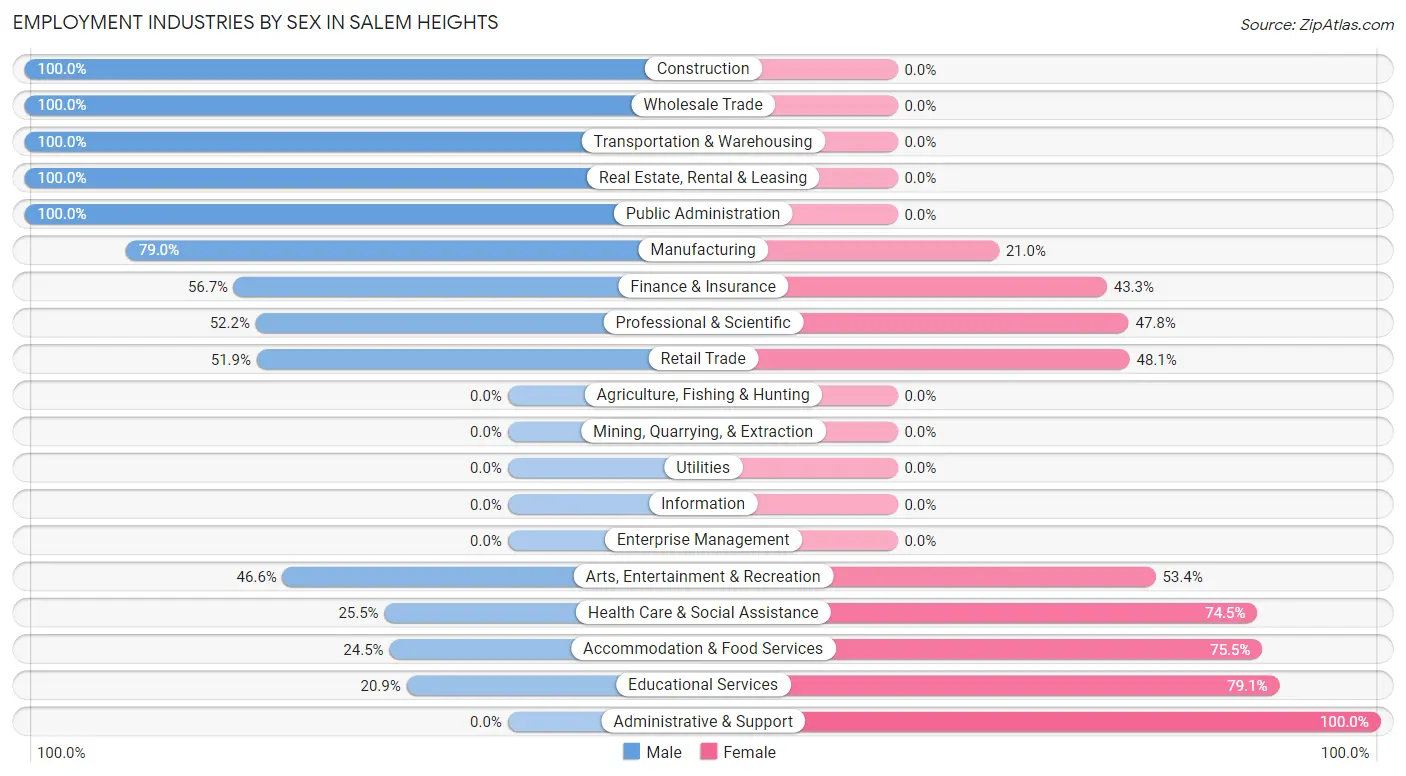
Employment Industries by Sex in Salem Heights
The Salem Heights industries that see more men than women are Construction (100.0%), Wholesale Trade (100.0%), and Transportation & Warehousing (100.0%), whereas the industries that tend to have a higher number of women are Administrative & Support (100.0%), Educational Services (79.1%), and Accommodation & Food Services (75.5%).
| Industry | Male | Female |
| Agriculture, Fishing & Hunting | 0 (0.0%) | 0 (0.0%) |
| Mining, Quarrying, & Extraction | 0 (0.0%) | 0 (0.0%) |
| Construction | 84 (100.0%) | 0 (0.0%) |
| Manufacturing | 147 (79.0%) | 39 (21.0%) |
| Wholesale Trade | 90 (100.0%) | 0 (0.0%) |
| Retail Trade | 67 (51.9%) | 62 (48.1%) |
| Transportation & Warehousing | 15 (100.0%) | 0 (0.0%) |
| Utilities | 0 (0.0%) | 0 (0.0%) |
| Information | 0 (0.0%) | 0 (0.0%) |
| Finance & Insurance | 51 (56.7%) | 39 (43.3%) |
| Real Estate, Rental & Leasing | 24 (100.0%) | 0 (0.0%) |
| Professional & Scientific | 157 (52.2%) | 144 (47.8%) |
| Enterprise Management | 0 (0.0%) | 0 (0.0%) |
| Administrative & Support | 0 (0.0%) | 77 (100.0%) |
| Educational Services | 40 (20.9%) | 151 (79.1%) |
| Health Care & Social Assistance | 49 (25.5%) | 143 (74.5%) |
| Arts, Entertainment & Recreation | 34 (46.6%) | 39 (53.4%) |
| Accommodation & Food Services | 48 (24.5%) | 148 (75.5%) |
| Public Administration | 37 (100.0%) | 0 (0.0%) |
| Total | 843 (49.4%) | 865 (50.6%) |
Education in Salem Heights
School Enrollment in Salem Heights
The most common levels of schooling among the 827 students in Salem Heights are high school (289 | 34.9%), elementary school (127 | 15.4%), and middle school (120 | 14.5%).
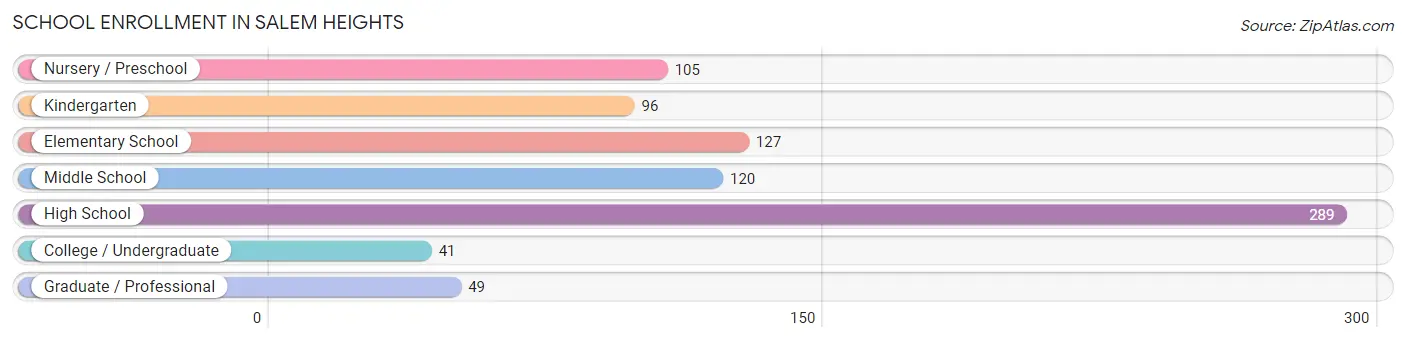
| School Level | # Students | % Students |
| Nursery / Preschool | 105 | 12.7% |
| Kindergarten | 96 | 11.6% |
| Elementary School | 127 | 15.4% |
| Middle School | 120 | 14.5% |
| High School | 289 | 34.9% |
| College / Undergraduate | 41 | 5.0% |
| Graduate / Professional | 49 | 5.9% |
| Total | 827 | 100.0% |
School Enrollment by Age by Funding Source in Salem Heights
Out of a total of 827 students who are enrolled in schools in Salem Heights, 290 (35.1%) attend a private institution, while the remaining 537 (64.9%) are enrolled in public schools. The age group of 3 to 4 year olds has the highest likelihood of being enrolled in private schools, with 88 (83.8% in the age bracket) enrolled. Conversely, the age group of 35 years and over has the lowest likelihood of being enrolled in a private school, with 13 (100.0% in the age bracket) attending a public institution.
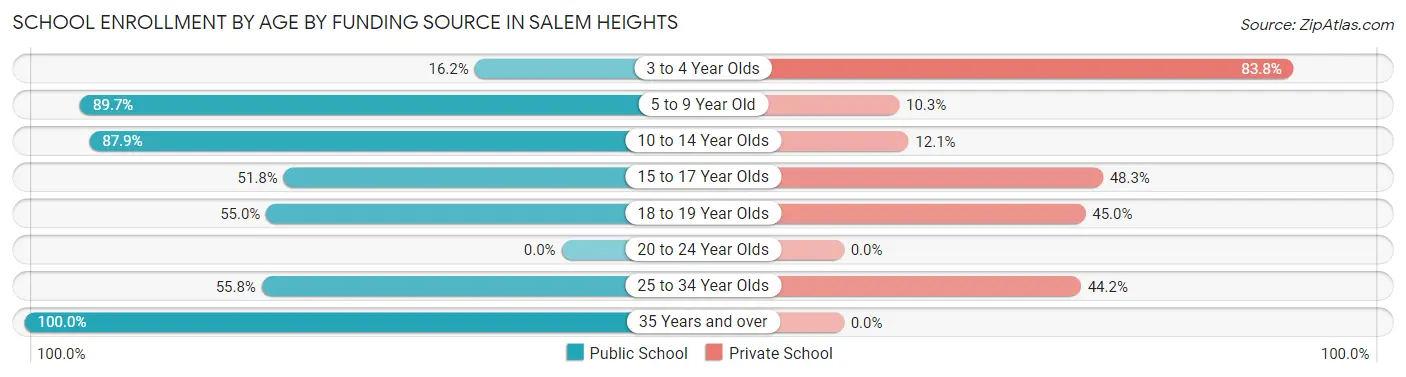
| Age Bracket | Public School | Private School |
| 3 to 4 Year Olds | 17 (16.2%) | 88 (83.8%) |
| 5 to 9 Year Old | 200 (89.7%) | 23 (10.3%) |
| 10 to 14 Year Olds | 124 (87.9%) | 17 (12.1%) |
| 15 to 17 Year Olds | 118 (51.7%) | 110 (48.2%) |
| 18 to 19 Year Olds | 22 (55.0%) | 18 (45.0%) |
| 20 to 24 Year Olds | 0 (0.0%) | 0 (0.0%) |
| 25 to 34 Year Olds | 43 (55.8%) | 34 (44.2%) |
| 35 Years and over | 13 (100.0%) | 0 (0.0%) |
| Total | 537 (64.9%) | 290 (35.1%) |
Educational Attainment by Field of Study in Salem Heights
Business (261 | 19.7%), arts & humanities (144 | 10.9%), education (134 | 10.1%), communications (131 | 9.9%), and engineering (119 | 9.0%) are the most common fields of study among 1,323 individuals in Salem Heights who have obtained a bachelor's degree or higher.
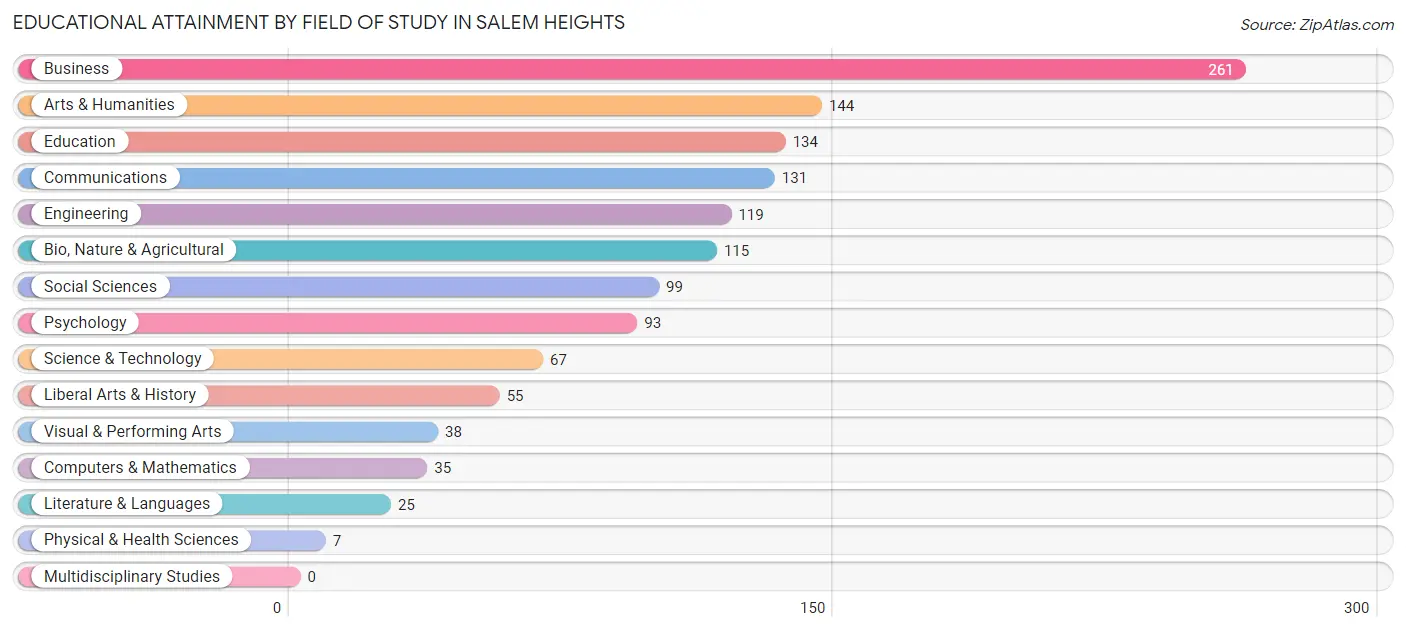
| Field of Study | # Graduates | % Graduates |
| Computers & Mathematics | 35 | 2.6% |
| Bio, Nature & Agricultural | 115 | 8.7% |
| Physical & Health Sciences | 7 | 0.5% |
| Psychology | 93 | 7.0% |
| Social Sciences | 99 | 7.5% |
| Engineering | 119 | 9.0% |
| Multidisciplinary Studies | 0 | 0.0% |
| Science & Technology | 67 | 5.1% |
| Business | 261 | 19.7% |
| Education | 134 | 10.1% |
| Literature & Languages | 25 | 1.9% |
| Liberal Arts & History | 55 | 4.2% |
| Visual & Performing Arts | 38 | 2.9% |
| Communications | 131 | 9.9% |
| Arts & Humanities | 144 | 10.9% |
| Total | 1,323 | 100.0% |
Transportation & Commute in Salem Heights
Vehicle Availability by Sex in Salem Heights
The most prevalent vehicle ownership categories in Salem Heights are males with 2 vehicles (443, accounting for 52.6%) and females with 2 vehicles (468, making up 52.2%).
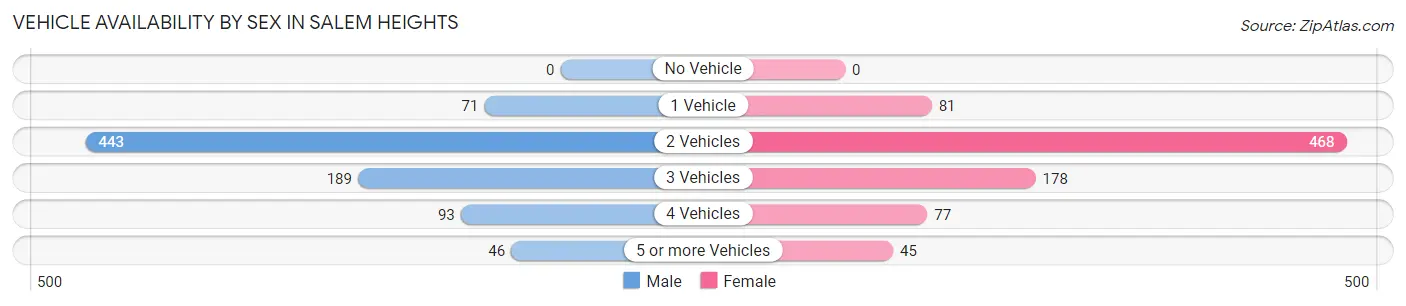
| Vehicles Available | Male | Female |
| No Vehicle | 0 (0.0%) | 0 (0.0%) |
| 1 Vehicle | 71 (8.4%) | 81 (9.5%) |
| 2 Vehicles | 443 (52.6%) | 468 (55.1%) |
| 3 Vehicles | 189 (22.5%) | 178 (21.0%) |
| 4 Vehicles | 93 (11.1%) | 77 (9.1%) |
| 5 or more Vehicles | 46 (5.5%) | 45 (5.3%) |
| Total | 842 (100.0%) | 849 (100.0%) |
Commute Time in Salem Heights
The most frequently occuring commute durations in Salem Heights are 20 to 24 minutes (262 commuters, 18.9%), 10 to 14 minutes (243 commuters, 17.5%), and 25 to 29 minutes (195 commuters, 14.1%).
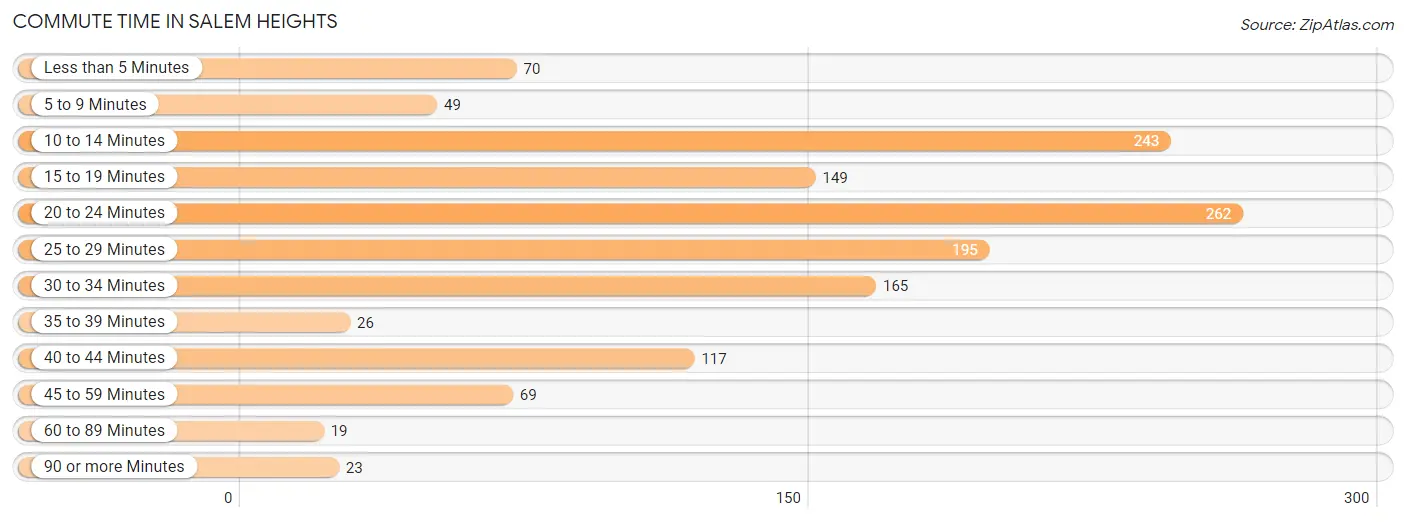
| Commute Time | # Commuters | % Commuters |
| Less than 5 Minutes | 70 | 5.1% |
| 5 to 9 Minutes | 49 | 3.5% |
| 10 to 14 Minutes | 243 | 17.5% |
| 15 to 19 Minutes | 149 | 10.7% |
| 20 to 24 Minutes | 262 | 18.9% |
| 25 to 29 Minutes | 195 | 14.1% |
| 30 to 34 Minutes | 165 | 11.9% |
| 35 to 39 Minutes | 26 | 1.9% |
| 40 to 44 Minutes | 117 | 8.4% |
| 45 to 59 Minutes | 69 | 5.0% |
| 60 to 89 Minutes | 19 | 1.4% |
| 90 or more Minutes | 23 | 1.7% |
Commute Time by Sex in Salem Heights
The most common commute times in Salem Heights are 20 to 24 minutes (153 commuters, 20.3%) for males and 10 to 14 minutes (163 commuters, 25.7%) for females.
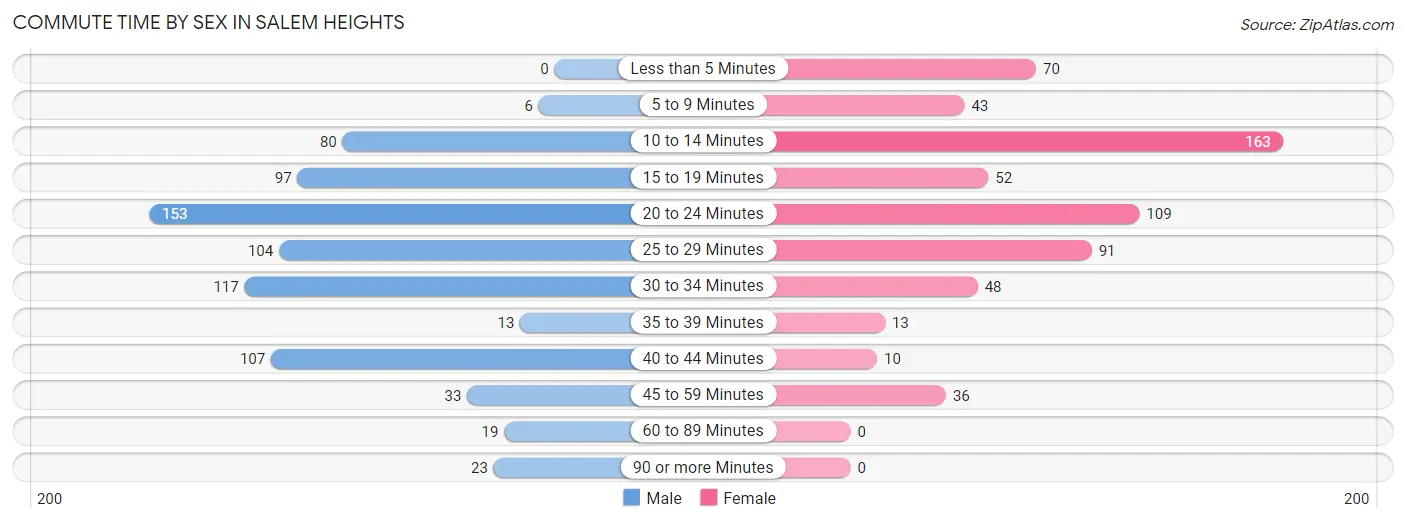
| Commute Time | Male | Female |
| Less than 5 Minutes | 0 (0.0%) | 70 (11.0%) |
| 5 to 9 Minutes | 6 (0.8%) | 43 (6.8%) |
| 10 to 14 Minutes | 80 (10.6%) | 163 (25.7%) |
| 15 to 19 Minutes | 97 (12.9%) | 52 (8.2%) |
| 20 to 24 Minutes | 153 (20.3%) | 109 (17.2%) |
| 25 to 29 Minutes | 104 (13.8%) | 91 (14.3%) |
| 30 to 34 Minutes | 117 (15.6%) | 48 (7.6%) |
| 35 to 39 Minutes | 13 (1.7%) | 13 (2.1%) |
| 40 to 44 Minutes | 107 (14.2%) | 10 (1.6%) |
| 45 to 59 Minutes | 33 (4.4%) | 36 (5.7%) |
| 60 to 89 Minutes | 19 (2.5%) | 0 (0.0%) |
| 90 or more Minutes | 23 (3.1%) | 0 (0.0%) |
Time of Departure to Work by Sex in Salem Heights
The most frequent times of departure to work in Salem Heights are 7:30 AM to 7:59 AM (197, 26.2%) for males and 8:00 AM to 8:29 AM (106, 16.7%) for females.
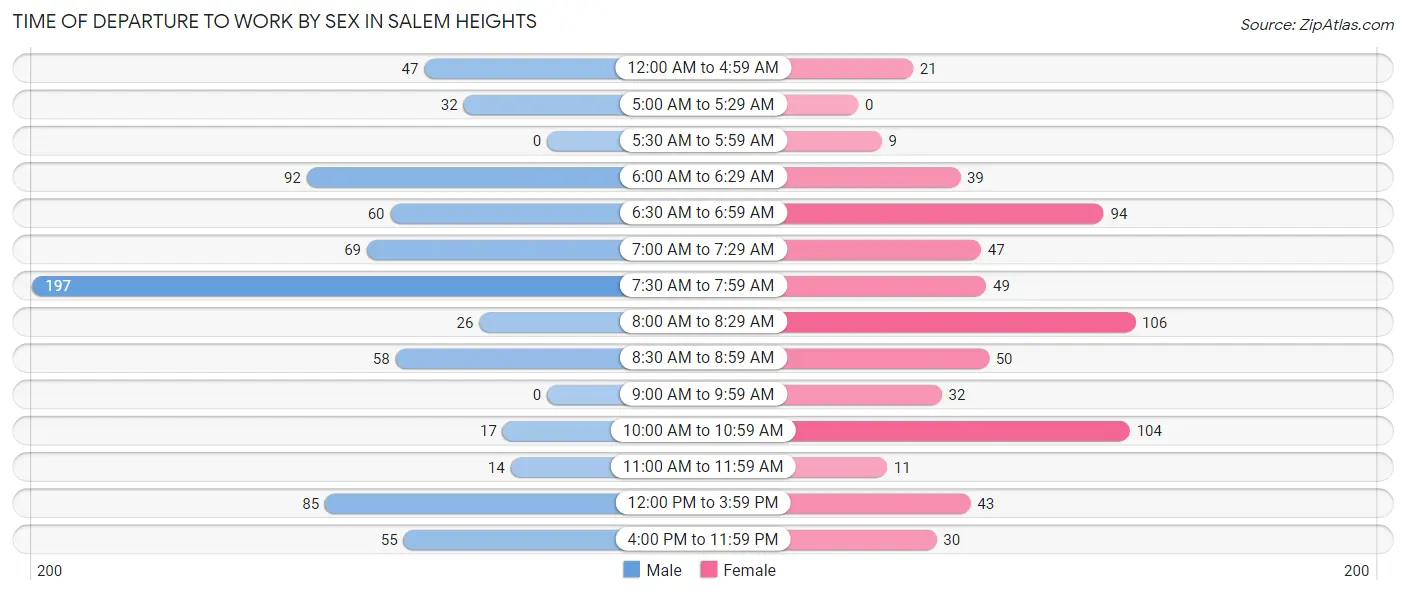
| Time of Departure | Male | Female |
| 12:00 AM to 4:59 AM | 47 (6.2%) | 21 (3.3%) |
| 5:00 AM to 5:29 AM | 32 (4.3%) | 0 (0.0%) |
| 5:30 AM to 5:59 AM | 0 (0.0%) | 9 (1.4%) |
| 6:00 AM to 6:29 AM | 92 (12.2%) | 39 (6.1%) |
| 6:30 AM to 6:59 AM | 60 (8.0%) | 94 (14.8%) |
| 7:00 AM to 7:29 AM | 69 (9.2%) | 47 (7.4%) |
| 7:30 AM to 7:59 AM | 197 (26.2%) | 49 (7.7%) |
| 8:00 AM to 8:29 AM | 26 (3.5%) | 106 (16.7%) |
| 8:30 AM to 8:59 AM | 58 (7.7%) | 50 (7.9%) |
| 9:00 AM to 9:59 AM | 0 (0.0%) | 32 (5.0%) |
| 10:00 AM to 10:59 AM | 17 (2.3%) | 104 (16.4%) |
| 11:00 AM to 11:59 AM | 14 (1.9%) | 11 (1.7%) |
| 12:00 PM to 3:59 PM | 85 (11.3%) | 43 (6.8%) |
| 4:00 PM to 11:59 PM | 55 (7.3%) | 30 (4.7%) |
| Total | 752 (100.0%) | 635 (100.0%) |
Housing Occupancy in Salem Heights
Occupancy by Ownership in Salem Heights
Of the total 1,286 dwellings in Salem Heights, owner-occupied units account for 1,227 (95.4%), while renter-occupied units make up 59 (4.6%).
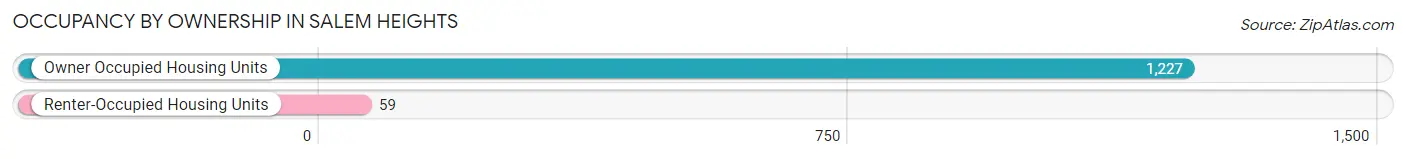
| Occupancy | # Housing Units | % Housing Units |
| Owner Occupied Housing Units | 1,227 | 95.4% |
| Renter-Occupied Housing Units | 59 | 4.6% |
| Total Occupied Housing Units | 1,286 | 100.0% |
Occupancy by Household Size in Salem Heights
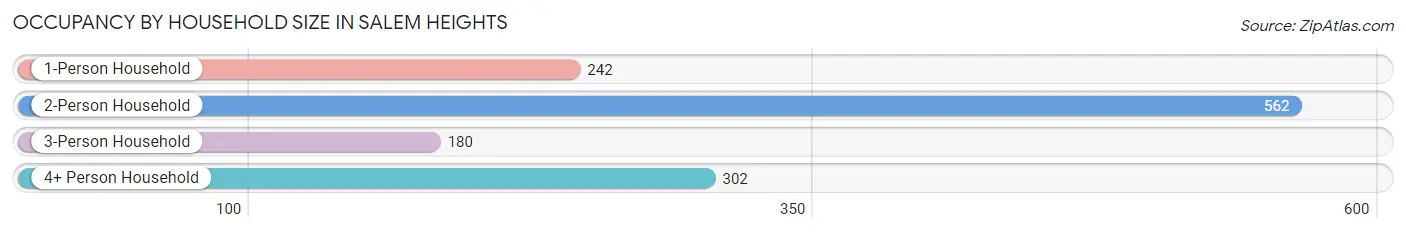
| Household Size | # Housing Units | % Housing Units |
| 1-Person Household | 242 | 18.8% |
| 2-Person Household | 562 | 43.7% |
| 3-Person Household | 180 | 14.0% |
| 4+ Person Household | 302 | 23.5% |
| Total Housing Units | 1,286 | 100.0% |
Occupancy by Ownership by Household Size in Salem Heights
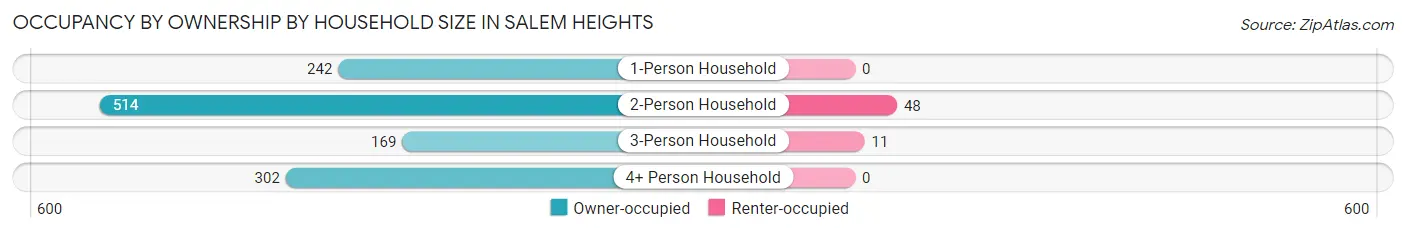
| Household Size | Owner-occupied | Renter-occupied |
| 1-Person Household | 242 (100.0%) | 0 (0.0%) |
| 2-Person Household | 514 (91.5%) | 48 (8.5%) |
| 3-Person Household | 169 (93.9%) | 11 (6.1%) |
| 4+ Person Household | 302 (100.0%) | 0 (0.0%) |
| Total Housing Units | 1,227 (95.4%) | 59 (4.6%) |
Occupancy by Educational Attainment in Salem Heights
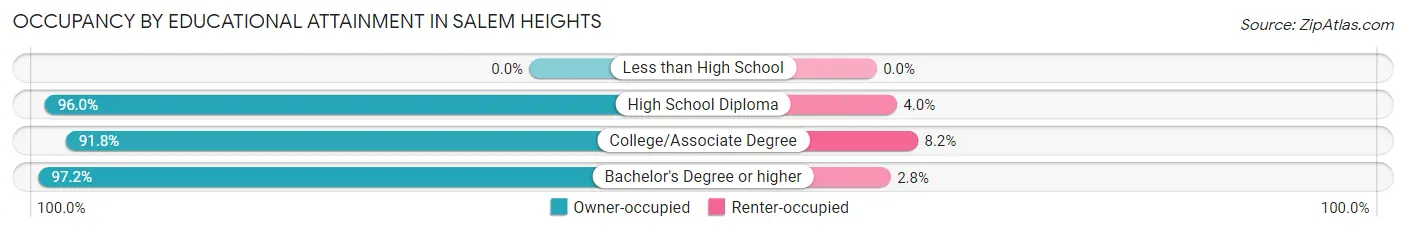
| Household Size | Owner-occupied | Renter-occupied |
| Less than High School | 0 (0.0%) | 0 (0.0%) |
| High School Diploma | 263 (96.0%) | 11 (4.0%) |
| College/Associate Degree | 336 (91.8%) | 30 (8.2%) |
| Bachelor's Degree or higher | 628 (97.2%) | 18 (2.8%) |
Occupancy by Age of Householder in Salem Heights
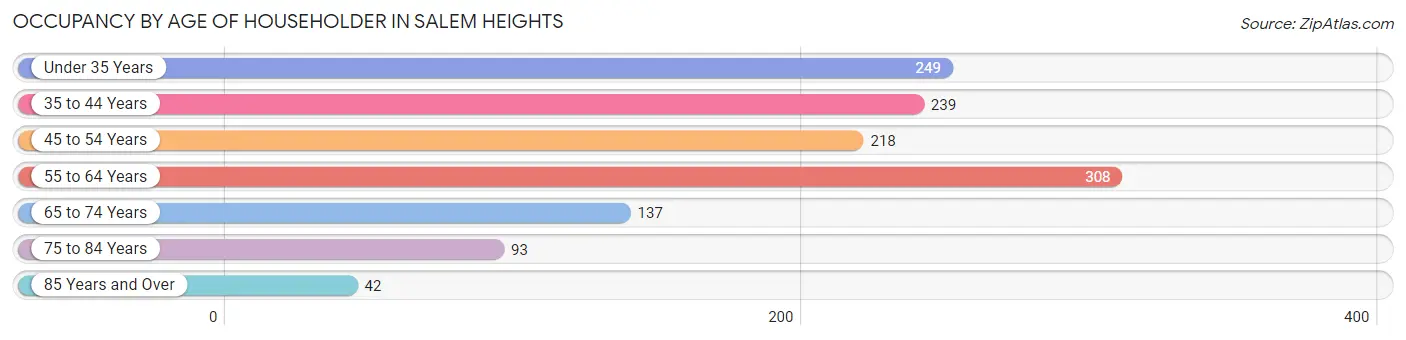
| Age Bracket | # Households | % Households |
| Under 35 Years | 249 | 19.4% |
| 35 to 44 Years | 239 | 18.6% |
| 45 to 54 Years | 218 | 17.0% |
| 55 to 64 Years | 308 | 23.9% |
| 65 to 74 Years | 137 | 10.6% |
| 75 to 84 Years | 93 | 7.2% |
| 85 Years and Over | 42 | 3.3% |
| Total | 1,286 | 100.0% |
Housing Finances in Salem Heights
Median Income by Occupancy in Salem Heights
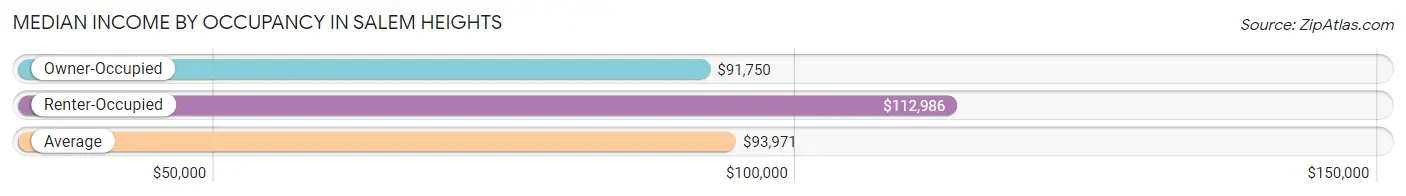
| Occupancy Type | # Households | Median Income |
| Owner-Occupied | 1,227 (95.4%) | $91,750 |
| Renter-Occupied | 59 (4.6%) | $112,986 |
| Average | 1,286 (100.0%) | $93,971 |
Occupancy by Householder Income Bracket in Salem Heights
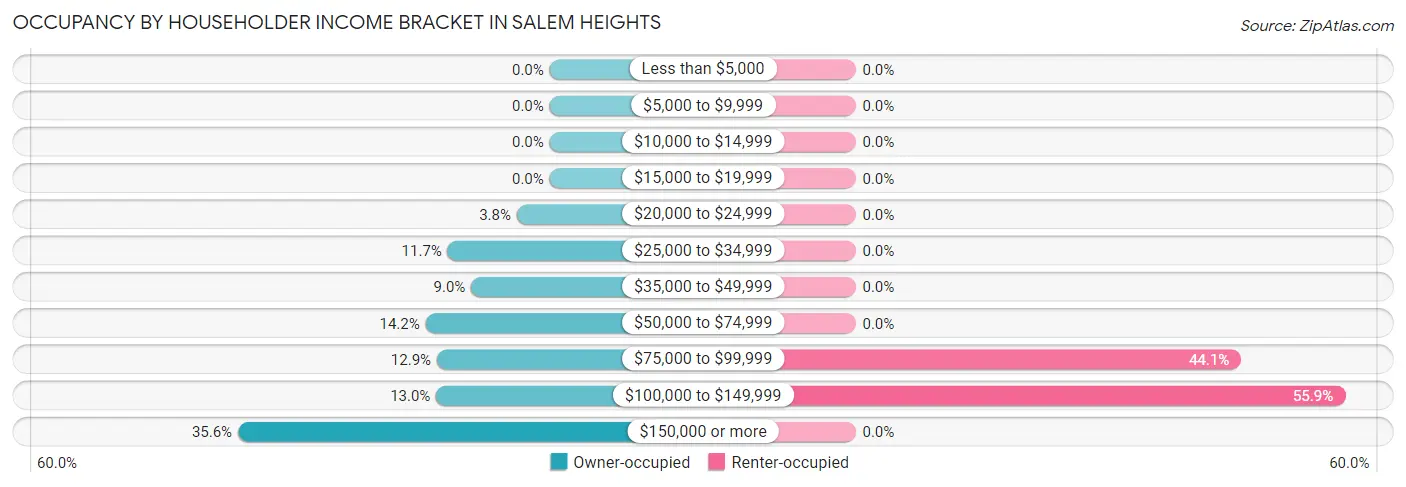
| Income Bracket | Owner-occupied | Renter-occupied |
| Less than $5,000 | 0 (0.0%) | 0 (0.0%) |
| $5,000 to $9,999 | 0 (0.0%) | 0 (0.0%) |
| $10,000 to $14,999 | 0 (0.0%) | 0 (0.0%) |
| $15,000 to $19,999 | 0 (0.0%) | 0 (0.0%) |
| $20,000 to $24,999 | 46 (3.7%) | 0 (0.0%) |
| $25,000 to $34,999 | 143 (11.7%) | 0 (0.0%) |
| $35,000 to $49,999 | 110 (9.0%) | 0 (0.0%) |
| $50,000 to $74,999 | 174 (14.2%) | 0 (0.0%) |
| $75,000 to $99,999 | 158 (12.9%) | 26 (44.1%) |
| $100,000 to $149,999 | 159 (13.0%) | 33 (55.9%) |
| $150,000 or more | 437 (35.6%) | 0 (0.0%) |
| Total | 1,227 (100.0%) | 59 (100.0%) |
Monthly Housing Cost Tiers in Salem Heights
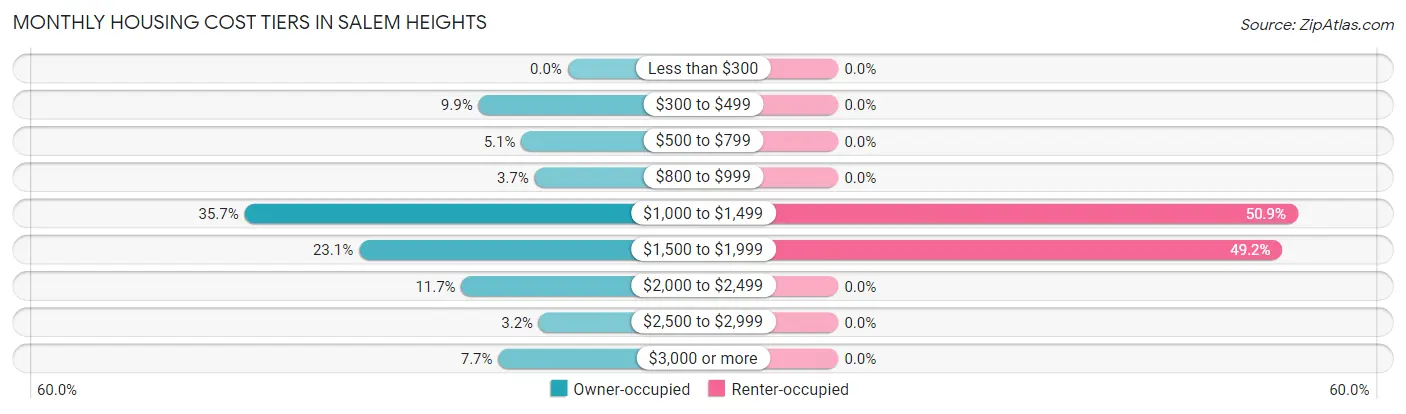
| Monthly Cost | Owner-occupied | Renter-occupied |
| Less than $300 | 0 (0.0%) | 0 (0.0%) |
| $300 to $499 | 121 (9.9%) | 0 (0.0%) |
| $500 to $799 | 63 (5.1%) | 0 (0.0%) |
| $800 to $999 | 45 (3.7%) | 0 (0.0%) |
| $1,000 to $1,499 | 438 (35.7%) | 30 (50.8%) |
| $1,500 to $1,999 | 283 (23.1%) | 29 (49.1%) |
| $2,000 to $2,499 | 144 (11.7%) | 0 (0.0%) |
| $2,500 to $2,999 | 39 (3.2%) | 0 (0.0%) |
| $3,000 or more | 94 (7.7%) | 0 (0.0%) |
| Total | 1,227 (100.0%) | 59 (100.0%) |
Physical Housing Characteristics in Salem Heights
Housing Structures in Salem Heights
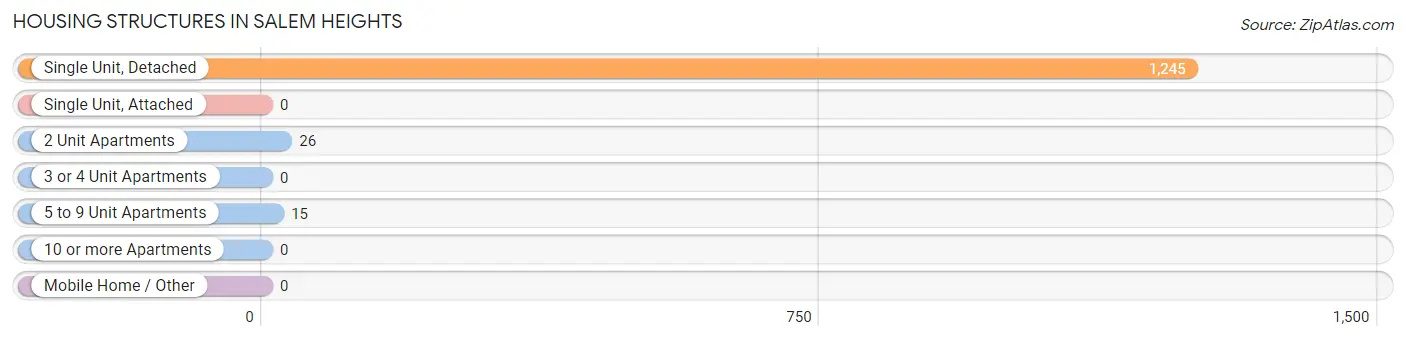
| Structure Type | # Housing Units | % Housing Units |
| Single Unit, Detached | 1,245 | 96.8% |
| Single Unit, Attached | 0 | 0.0% |
| 2 Unit Apartments | 26 | 2.0% |
| 3 or 4 Unit Apartments | 0 | 0.0% |
| 5 to 9 Unit Apartments | 15 | 1.2% |
| 10 or more Apartments | 0 | 0.0% |
| Mobile Home / Other | 0 | 0.0% |
| Total | 1,286 | 100.0% |
Housing Structures by Occupancy in Salem Heights
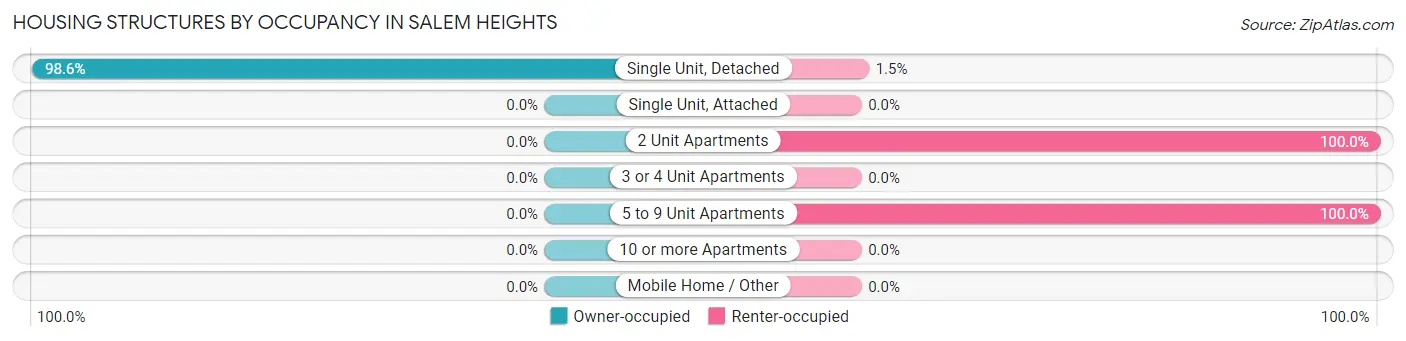
| Structure Type | Owner-occupied | Renter-occupied |
| Single Unit, Detached | 1,227 (98.6%) | 18 (1.5%) |
| Single Unit, Attached | 0 (0.0%) | 0 (0.0%) |
| 2 Unit Apartments | 0 (0.0%) | 26 (100.0%) |
| 3 or 4 Unit Apartments | 0 (0.0%) | 0 (0.0%) |
| 5 to 9 Unit Apartments | 0 (0.0%) | 15 (100.0%) |
| 10 or more Apartments | 0 (0.0%) | 0 (0.0%) |
| Mobile Home / Other | 0 (0.0%) | 0 (0.0%) |
| Total | 1,227 (95.4%) | 59 (4.6%) |
Housing Structures by Number of Rooms in Salem Heights
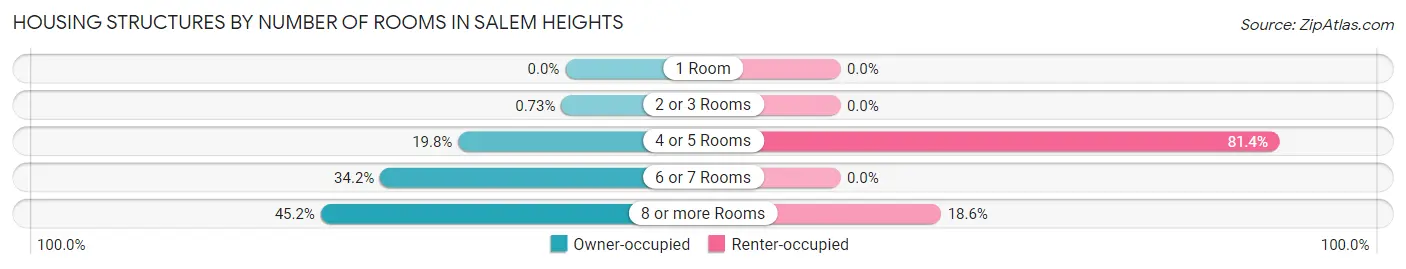
| Number of Rooms | Owner-occupied | Renter-occupied |
| 1 Room | 0 (0.0%) | 0 (0.0%) |
| 2 or 3 Rooms | 9 (0.7%) | 0 (0.0%) |
| 4 or 5 Rooms | 243 (19.8%) | 48 (81.4%) |
| 6 or 7 Rooms | 420 (34.2%) | 0 (0.0%) |
| 8 or more Rooms | 555 (45.2%) | 11 (18.6%) |
| Total | 1,227 (100.0%) | 59 (100.0%) |
Housing Structure by Heating Type in Salem Heights
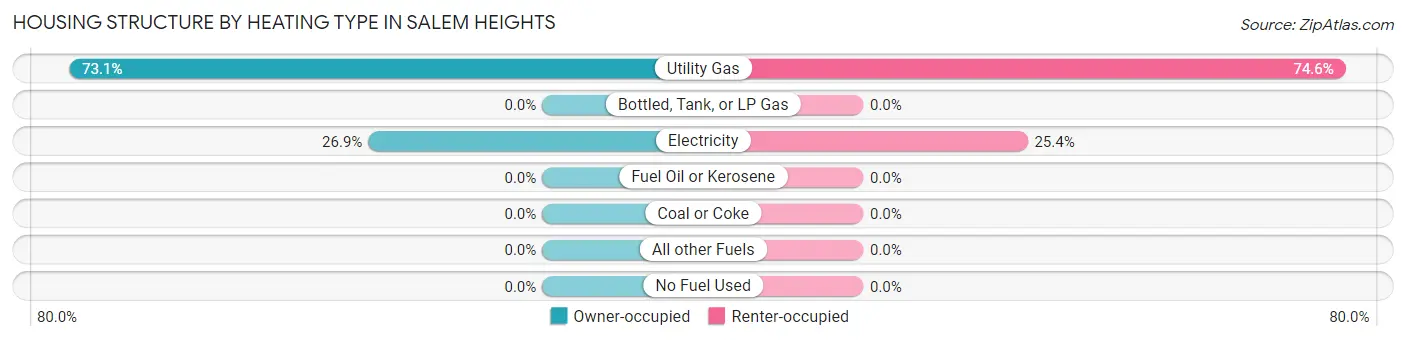
| Heating Type | Owner-occupied | Renter-occupied |
| Utility Gas | 897 (73.1%) | 44 (74.6%) |
| Bottled, Tank, or LP Gas | 0 (0.0%) | 0 (0.0%) |
| Electricity | 330 (26.9%) | 15 (25.4%) |
| Fuel Oil or Kerosene | 0 (0.0%) | 0 (0.0%) |
| Coal or Coke | 0 (0.0%) | 0 (0.0%) |
| All other Fuels | 0 (0.0%) | 0 (0.0%) |
| No Fuel Used | 0 (0.0%) | 0 (0.0%) |
| Total | 1,227 (100.0%) | 59 (100.0%) |
Household Vehicle Usage in Salem Heights
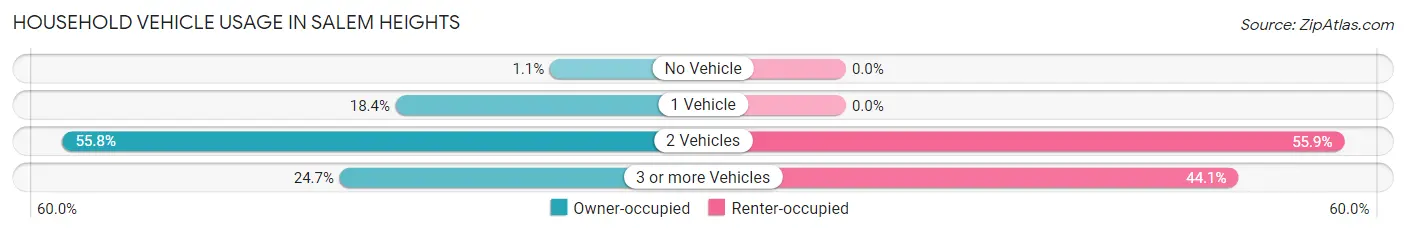
| Vehicles per Household | Owner-occupied | Renter-occupied |
| No Vehicle | 14 (1.1%) | 0 (0.0%) |
| 1 Vehicle | 226 (18.4%) | 0 (0.0%) |
| 2 Vehicles | 684 (55.7%) | 33 (55.9%) |
| 3 or more Vehicles | 303 (24.7%) | 26 (44.1%) |
| Total | 1,227 (100.0%) | 59 (100.0%) |
Real Estate & Mortgages in Salem Heights
Real Estate and Mortgage Overview in Salem Heights
| Characteristic | Without Mortgage | With Mortgage |
| Housing Units | 336 | 891 |
| Median Property Value | $206,700 | $215,200 |
| Median Household Income | $126,579 | $307 |
| Monthly Housing Costs | $810 | $94 |
| Real Estate Taxes | $4,444 | $13 |
Property Value by Mortgage Status in Salem Heights
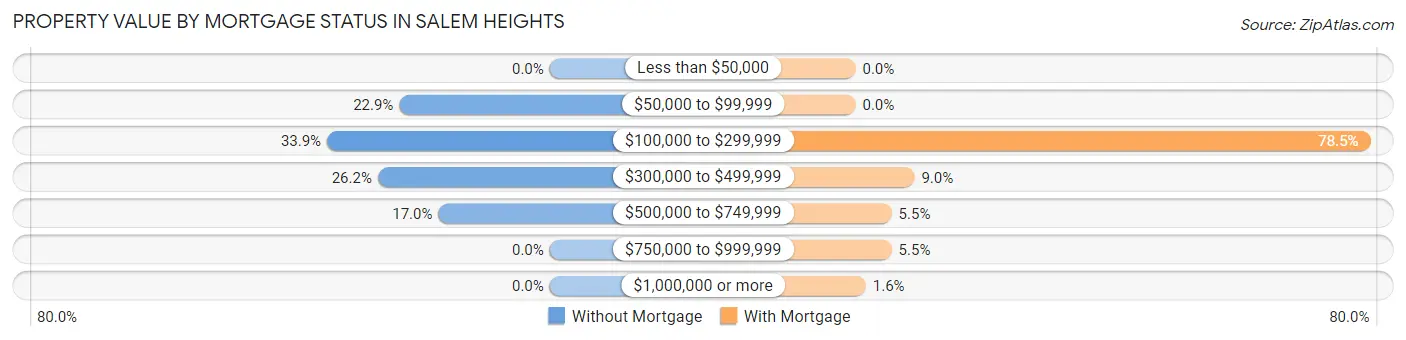
| Property Value | Without Mortgage | With Mortgage |
| Less than $50,000 | 0 (0.0%) | 0 (0.0%) |
| $50,000 to $99,999 | 77 (22.9%) | 0 (0.0%) |
| $100,000 to $299,999 | 114 (33.9%) | 699 (78.4%) |
| $300,000 to $499,999 | 88 (26.2%) | 80 (9.0%) |
| $500,000 to $749,999 | 57 (17.0%) | 49 (5.5%) |
| $750,000 to $999,999 | 0 (0.0%) | 49 (5.5%) |
| $1,000,000 or more | 0 (0.0%) | 14 (1.6%) |
| Total | 336 (100.0%) | 891 (100.0%) |
Household Income by Mortgage Status in Salem Heights
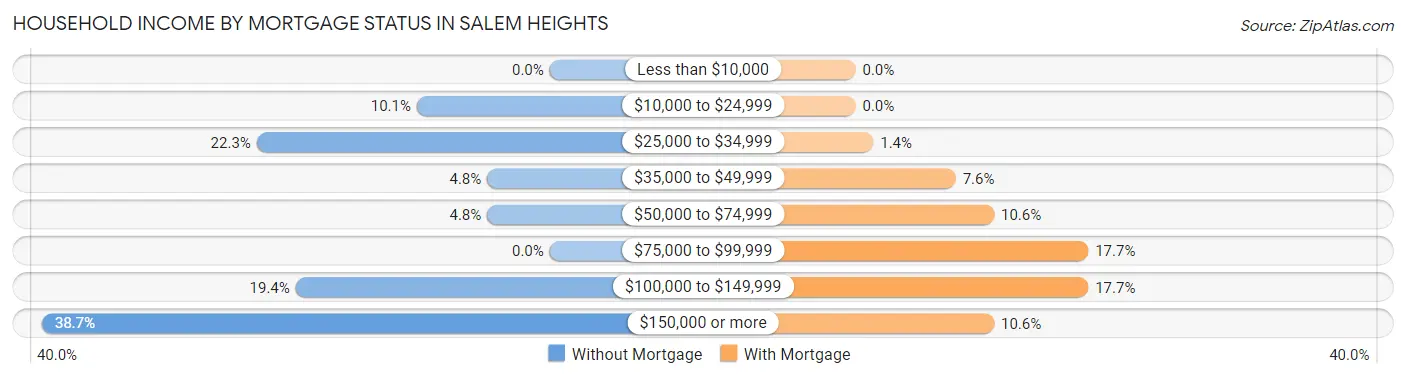
| Household Income | Without Mortgage | With Mortgage |
| Less than $10,000 | 0 (0.0%) | 0 (0.0%) |
| $10,000 to $24,999 | 34 (10.1%) | 0 (0.0%) |
| $25,000 to $34,999 | 75 (22.3%) | 12 (1.3%) |
| $35,000 to $49,999 | 16 (4.8%) | 68 (7.6%) |
| $50,000 to $74,999 | 16 (4.8%) | 94 (10.5%) |
| $75,000 to $99,999 | 0 (0.0%) | 158 (17.7%) |
| $100,000 to $149,999 | 65 (19.4%) | 158 (17.7%) |
| $150,000 or more | 130 (38.7%) | 94 (10.5%) |
| Total | 336 (100.0%) | 891 (100.0%) |
Property Value to Household Income Ratio in Salem Heights
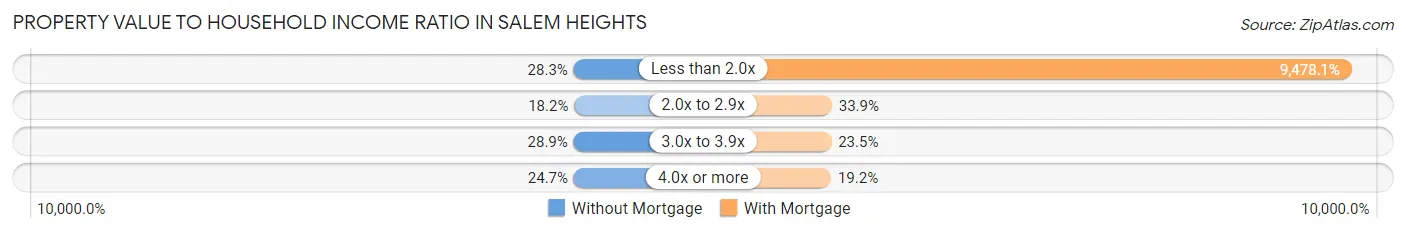
| Value-to-Income Ratio | Without Mortgage | With Mortgage |
| Less than 2.0x | 95 (28.3%) | 84,450 (9,478.1%) |
| 2.0x to 2.9x | 61 (18.1%) | 302 (33.9%) |
| 3.0x to 3.9x | 97 (28.9%) | 209 (23.5%) |
| 4.0x or more | 83 (24.7%) | 171 (19.2%) |
| Total | 336 (100.0%) | 891 (100.0%) |
Real Estate Taxes by Mortgage Status in Salem Heights
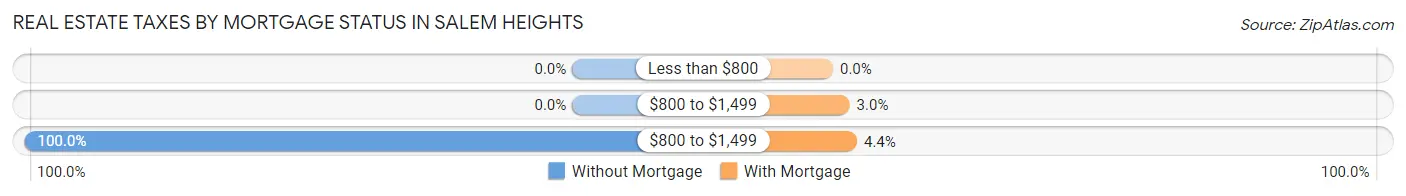
| Property Taxes | Without Mortgage | With Mortgage |
| Less than $800 | 0 (0.0%) | 0 (0.0%) |
| $800 to $1,499 | 0 (0.0%) | 27 (3.0%) |
| $800 to $1,499 | 336 (100.0%) | 39 (4.4%) |
| Total | 336 (100.0%) | 891 (100.0%) |
Health & Disability in Salem Heights
Health Insurance Coverage by Age in Salem Heights
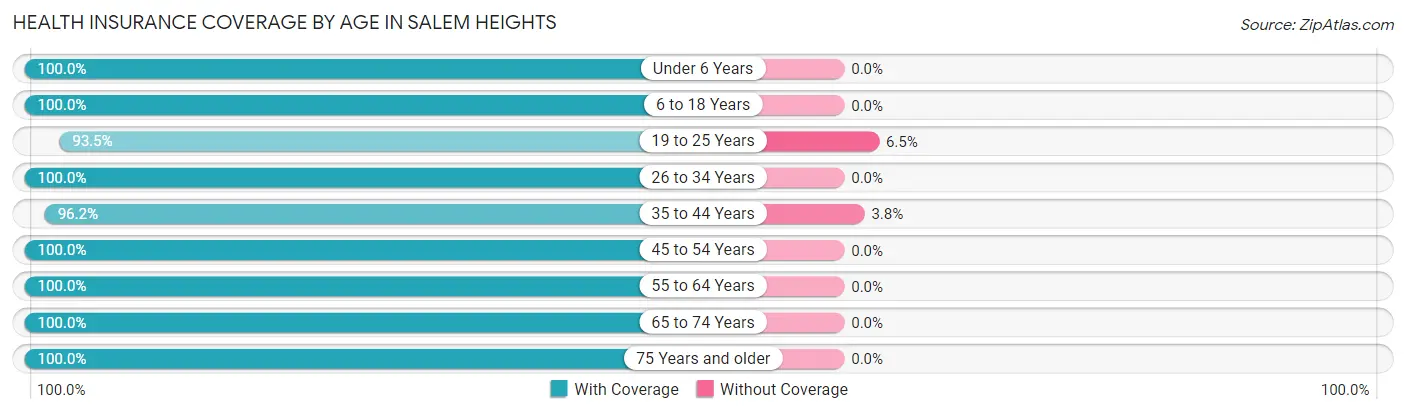
| Age Bracket | With Coverage | Without Coverage |
| Under 6 Years | 165 (100.0%) | 0 (0.0%) |
| 6 to 18 Years | 608 (100.0%) | 0 (0.0%) |
| 19 to 25 Years | 188 (93.5%) | 13 (6.5%) |
| 26 to 34 Years | 401 (100.0%) | 0 (0.0%) |
| 35 to 44 Years | 384 (96.2%) | 15 (3.8%) |
| 45 to 54 Years | 445 (100.0%) | 0 (0.0%) |
| 55 to 64 Years | 516 (100.0%) | 0 (0.0%) |
| 65 to 74 Years | 256 (100.0%) | 0 (0.0%) |
| 75 Years and older | 242 (100.0%) | 0 (0.0%) |
| Total | 3,205 (99.1%) | 28 (0.9%) |
Health Insurance Coverage by Citizenship Status in Salem Heights
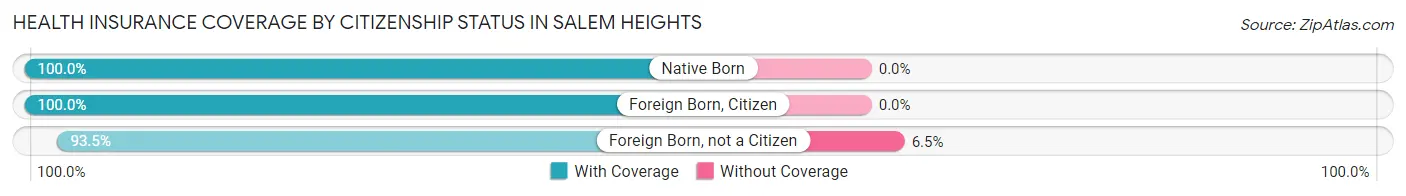
| Citizenship Status | With Coverage | Without Coverage |
| Native Born | 165 (100.0%) | 0 (0.0%) |
| Foreign Born, Citizen | 608 (100.0%) | 0 (0.0%) |
| Foreign Born, not a Citizen | 188 (93.5%) | 13 (6.5%) |
Health Insurance Coverage by Household Income in Salem Heights
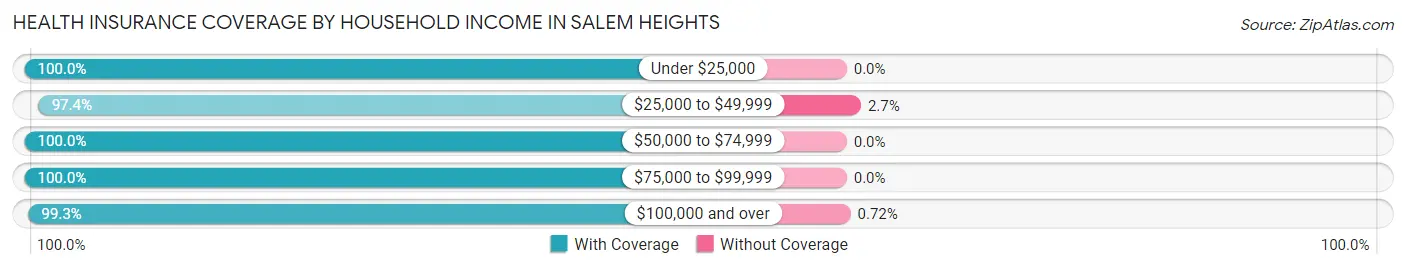
| Household Income | With Coverage | Without Coverage |
| Under $25,000 | 58 (100.0%) | 0 (0.0%) |
| $25,000 to $49,999 | 551 (97.4%) | 15 (2.6%) |
| $50,000 to $74,999 | 307 (100.0%) | 0 (0.0%) |
| $75,000 to $99,999 | 485 (100.0%) | 0 (0.0%) |
| $100,000 and over | 1,801 (99.3%) | 13 (0.7%) |
Public vs Private Health Insurance Coverage by Age in Salem Heights
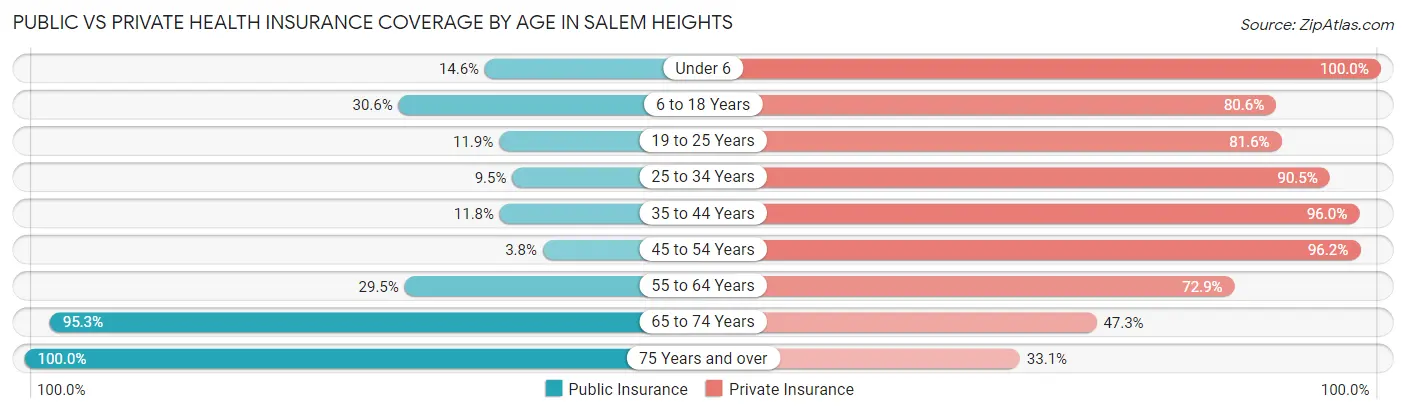
| Age Bracket | Public Insurance | Private Insurance |
| Under 6 | 24 (14.5%) | 165 (100.0%) |
| 6 to 18 Years | 186 (30.6%) | 490 (80.6%) |
| 19 to 25 Years | 24 (11.9%) | 164 (81.6%) |
| 25 to 34 Years | 38 (9.5%) | 363 (90.5%) |
| 35 to 44 Years | 47 (11.8%) | 383 (96.0%) |
| 45 to 54 Years | 17 (3.8%) | 428 (96.2%) |
| 55 to 64 Years | 152 (29.5%) | 376 (72.9%) |
| 65 to 74 Years | 244 (95.3%) | 121 (47.3%) |
| 75 Years and over | 242 (100.0%) | 80 (33.1%) |
| Total | 974 (30.1%) | 2,570 (79.5%) |
Disability Status by Sex by Age in Salem Heights
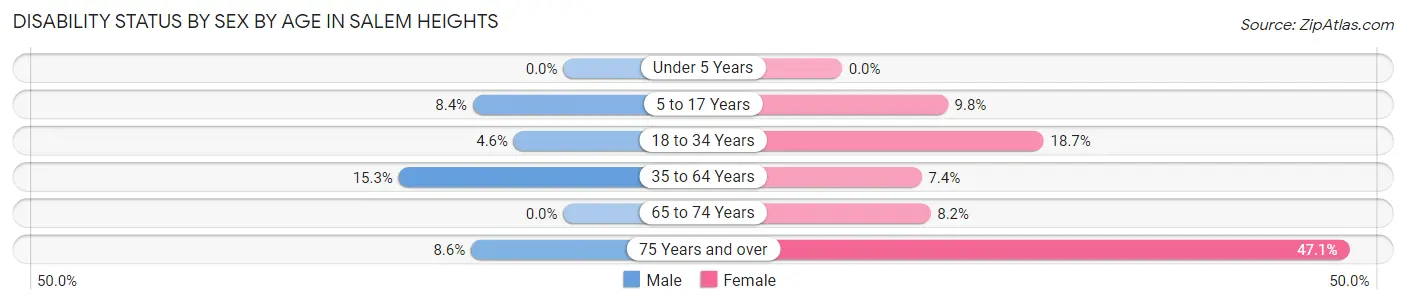
| Age Bracket | Male | Female |
| Under 5 Years | 0 (0.0%) | 0 (0.0%) |
| 5 to 17 Years | 36 (8.4%) | 16 (9.8%) |
| 18 to 34 Years | 15 (4.6%) | 59 (18.7%) |
| 35 to 64 Years | 92 (15.3%) | 56 (7.4%) |
| 65 to 74 Years | 0 (0.0%) | 16 (8.2%) |
| 75 Years and over | 6 (8.6%) | 81 (47.1%) |
Disability Class by Sex by Age in Salem Heights
Disability Class: Hearing Difficulty
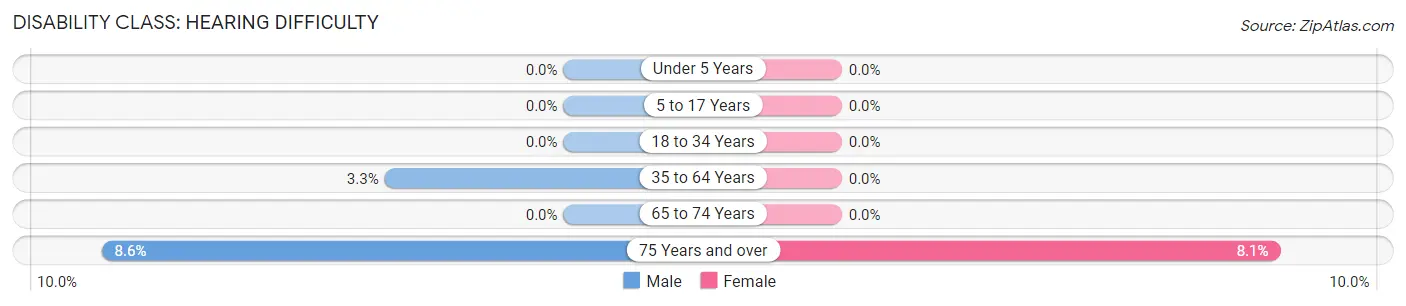
| Age Bracket | Male | Female |
| Under 5 Years | 0 (0.0%) | 0 (0.0%) |
| 5 to 17 Years | 0 (0.0%) | 0 (0.0%) |
| 18 to 34 Years | 0 (0.0%) | 0 (0.0%) |
| 35 to 64 Years | 20 (3.3%) | 0 (0.0%) |
| 65 to 74 Years | 0 (0.0%) | 0 (0.0%) |
| 75 Years and over | 6 (8.6%) | 14 (8.1%) |
Disability Class: Vision Difficulty
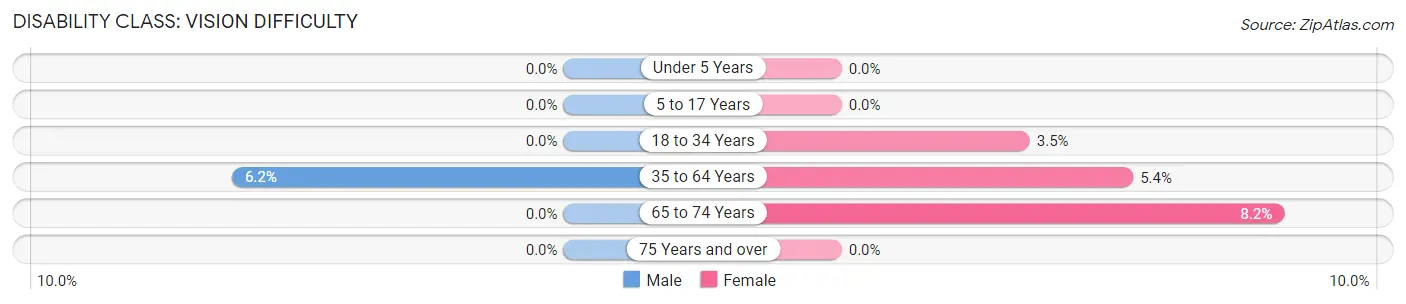
| Age Bracket | Male | Female |
| Under 5 Years | 0 (0.0%) | 0 (0.0%) |
| 5 to 17 Years | 0 (0.0%) | 0 (0.0%) |
| 18 to 34 Years | 0 (0.0%) | 11 (3.5%) |
| 35 to 64 Years | 37 (6.1%) | 41 (5.4%) |
| 65 to 74 Years | 0 (0.0%) | 16 (8.2%) |
| 75 Years and over | 0 (0.0%) | 0 (0.0%) |
Disability Class: Cognitive Difficulty
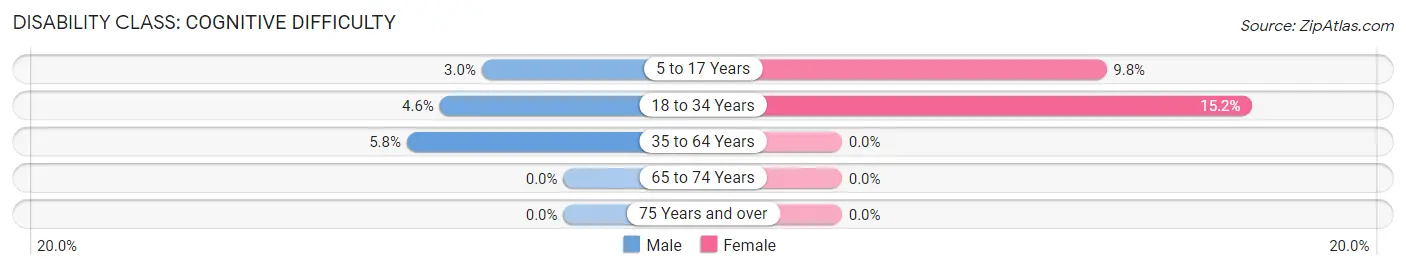
| Age Bracket | Male | Female |
| 5 to 17 Years | 13 (3.0%) | 16 (9.8%) |
| 18 to 34 Years | 15 (4.6%) | 48 (15.2%) |
| 35 to 64 Years | 35 (5.8%) | 0 (0.0%) |
| 65 to 74 Years | 0 (0.0%) | 0 (0.0%) |
| 75 Years and over | 0 (0.0%) | 0 (0.0%) |
Disability Class: Ambulatory Difficulty
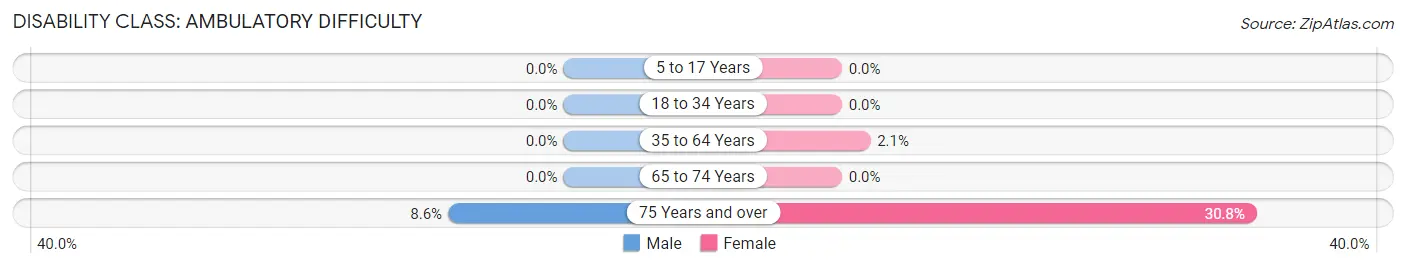
| Age Bracket | Male | Female |
| 5 to 17 Years | 0 (0.0%) | 0 (0.0%) |
| 18 to 34 Years | 0 (0.0%) | 0 (0.0%) |
| 35 to 64 Years | 0 (0.0%) | 16 (2.1%) |
| 65 to 74 Years | 0 (0.0%) | 0 (0.0%) |
| 75 Years and over | 6 (8.6%) | 53 (30.8%) |
Disability Class: Self-Care Difficulty
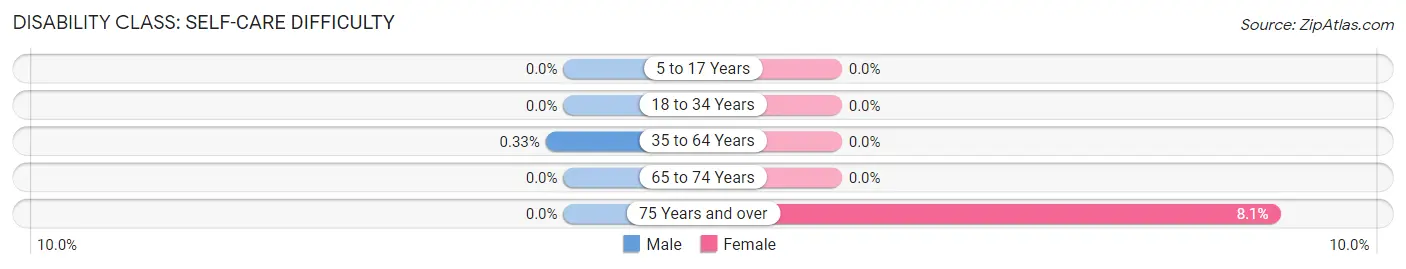
| Age Bracket | Male | Female |
| 5 to 17 Years | 0 (0.0%) | 0 (0.0%) |
| 18 to 34 Years | 0 (0.0%) | 0 (0.0%) |
| 35 to 64 Years | 2 (0.3%) | 0 (0.0%) |
| 65 to 74 Years | 0 (0.0%) | 0 (0.0%) |
| 75 Years and over | 0 (0.0%) | 14 (8.1%) |
Technology Access in Salem Heights
Computing Device Access in Salem Heights
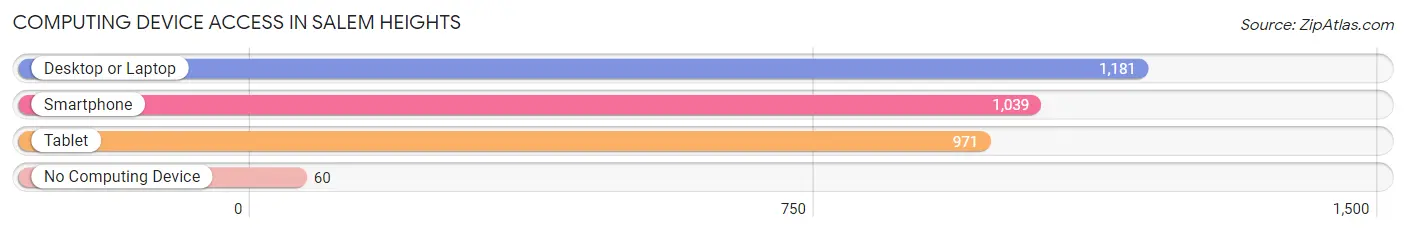
| Device Type | # Households | % Households |
| Desktop or Laptop | 1,181 | 91.8% |
| Smartphone | 1,039 | 80.8% |
| Tablet | 971 | 75.5% |
| No Computing Device | 60 | 4.7% |
| Total | 1,286 | 100.0% |
Internet Access in Salem Heights
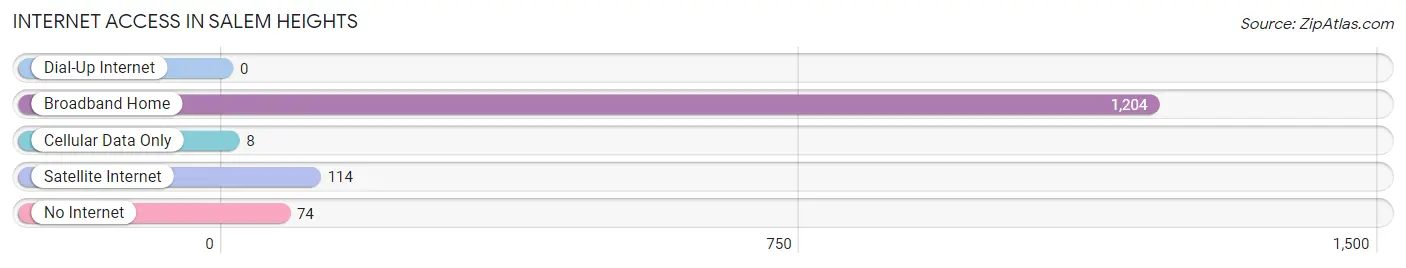
| Internet Type | # Households | % Households |
| Dial-Up Internet | 0 | 0.0% |
| Broadband Home | 1,204 | 93.6% |
| Cellular Data Only | 8 | 0.6% |
| Satellite Internet | 114 | 8.9% |
| No Internet | 74 | 5.8% |
| Total | 1,286 | 100.0% |
Salem Heights Summary
Salem Heights is a small village located in Mahoning County, Ohio. It is situated in the northeast corner of the county, just south of the city of Youngstown. The village has a population of approximately 1,000 people and is part of the Youngstown-Warren-Boardman metropolitan area.
History
Salem Heights was founded in 1820 by a group of settlers from Salem, Massachusetts. The settlers were attracted to the area due to its fertile soil and abundant natural resources. The village was originally known as Salem Township, but was later renamed Salem Heights in 1845.
The village was a small farming community until the late 19th century, when the steel industry began to boom in the area. The steel industry brought jobs and economic growth to the village, and it quickly became a thriving industrial center.
The village was incorporated in 1891 and has remained a small close knit community ever since
Geography
Salem Heights is located in the northeast corner of Mahoning County, Ohio. It is situated just south of the city of Youngstown and is part of the Youngstown-Warren-Boardman metropolitan area.
The village is situated on a plateau, with an elevation of approximately 1,000 feet above sea level. The terrain is mostly flat, with some rolling hills in the surrounding area.
The village is located in the Mahoning Valley, which is part of the larger Great Lakes region. The climate is humid continental, with hot summers and cold winters.
Economy
Salem Heights is a small, rural village with a population of approximately 1,000 people. The village is primarily a bedroom community, with most of its residents commuting to nearby cities for work.
The village does have some local businesses, including a few small retail stores, restaurants, and a gas station. The village also has a few small manufacturing companies, which produce a variety of products.
Demographics
As of the 2010 census, the population of Salem Heights was 1,000 people. The racial makeup of the village was 97.2% White, 0.7% African American, 0.3% Native American, 0.3% Asian, and 1.5% from other races.
The median household income in the village was $41,250, and the median family income was $50,000. The per capita income was $20,000.
Conclusion
Salem Heights is a small village located in Mahoning County, Ohio. It was founded in 1820 by a group of settlers from Salem, Massachusetts and was originally known as Salem Township. The village was incorporated in 1891 and has remained a small, close-knit community ever since. The village is situated on a plateau, with an elevation of approximately 1,000 feet above sea level. The village is primarily a bedroom community, with most of its residents commuting to nearby cities for work. As of the 2010 census, the population of Salem Heights was 1,000 people. The racial makeup of the village was 97.2% White, 0.7% African American, 0.3% Native American, 0.3% Asian, and 1.5% from other races. The median household income in the village was $41,250, and the median family income was $50,000. The per capita income was $20,000.
Common Questions
What is the Total Population of Salem Heights?
Total Population of Salem Heights is 3,335.
What is the Total Male Population of Salem Heights?
Total Male Population of Salem Heights is 1,641.
What is the Total Female Population of Salem Heights?
Total Female Population of Salem Heights is 1,694.
What is the Ratio of Males per 100 Females in Salem Heights?
There are 96.87 Males per 100 Females in Salem Heights.
What is the Ratio of Females per 100 Males in Salem Heights?
There are 103.23 Females per 100 Males in Salem Heights.
What is the Median Population Age in Salem Heights?
Median Population Age in Salem Heights is 40.8 Years.
What is the Average Family Size in Salem Heights
Average Family Size in Salem Heights is 2.8 People.
What is the Average Household Size in Salem Heights
Average Household Size in Salem Heights is 2.5 People.
What is Per Capita Income in Salem Heights?
Per Capita income in Salem Heights is $44,752.
What is the Median Family Income in Salem Heights?
Median Family Income in Salem Heights is $117,778.
What is the Median Household income in Salem Heights?
Median Household Income in Salem Heights is $93,971.
What is Income or Wage Gap in Salem Heights?
Income or Wage Gap in Salem Heights is 52.2%.
Women in Salem Heights earn 47.8 cents for every dollar earned by a man.
What is Inequality or Gini Index in Salem Heights?
Inequality or Gini Index in Salem Heights is 0.38.
How Large is the Labor Force in Salem Heights?
There are 1,709 People in the Labor Forcein in Salem Heights.
What is the Percentage of People in the Labor Force in Salem Heights?
62.0% of People are in the Labor Force in Salem Heights.