Rossmoyne, OH
Rossmoyne Map
Rossmoyne Overview
1,562
TOTAL POPULATION
681
MALE POPULATION
881
FEMALE POPULATION
77.30
MALES / 100 FEMALES
129.37
FEMALES / 100 MALES
43.3
MEDIAN AGE
2.7
AVG FAMILY SIZE
2.1
AVG HOUSEHOLD SIZE
$31,345
PER CAPITA INCOME
$70,491
AVG FAMILY INCOME
$46,231
AVG HOUSEHOLD INCOME
21.5%
WAGE / INCOME GAP [ % ]
78.5¢/ $1
WAGE / INCOME GAP [ $ ]
0.47
INEQUALITY / GINI INDEX
959
LABOR FORCE [ PEOPLE ]
70.8%
PERCENT IN LABOR FORCE
3.3%
UNEMPLOYMENT RATE
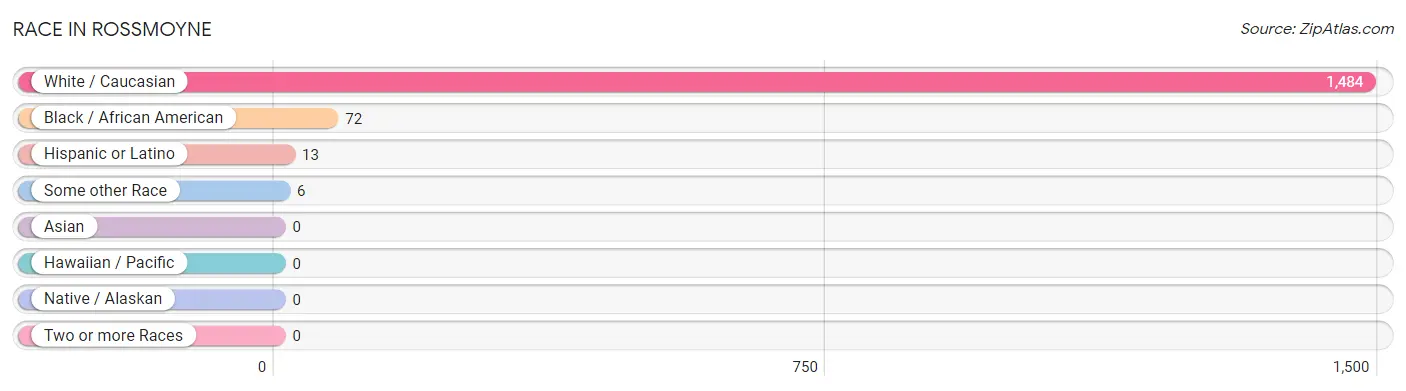
Race in Rossmoyne
The most populous races in Rossmoyne are White / Caucasian (1,484 | 95.0%), Black / African American (72 | 4.6%), and Hispanic or Latino (13 | 0.8%).
| Race | # Population | % Population |
| Asian | 0 | 0.0% |
| Black / African American | 72 | 4.6% |
| Hawaiian / Pacific | 0 | 0.0% |
| Hispanic or Latino | 13 | 0.8% |
| Native / Alaskan | 0 | 0.0% |
| White / Caucasian | 1,484 | 95.0% |
| Two or more Races | 0 | 0.0% |
| Some other Race | 6 | 0.4% |
| Total | 1,562 | 100.0% |
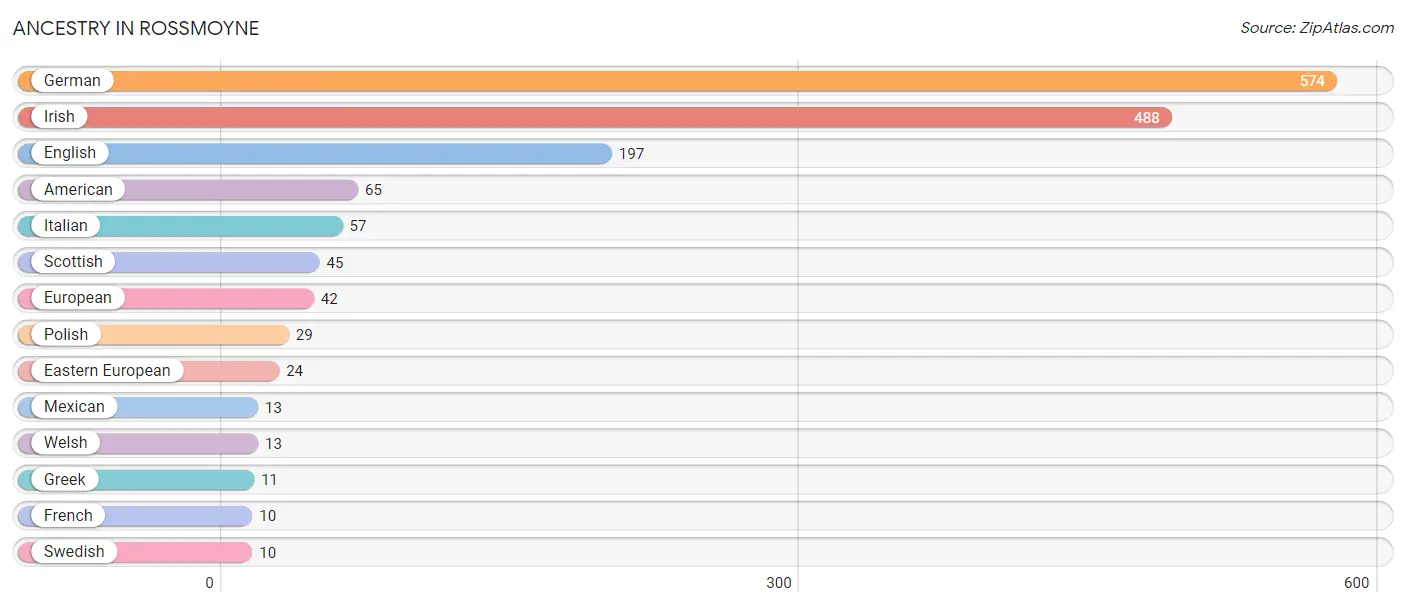
Ancestry in Rossmoyne
The most populous ancestries reported in Rossmoyne are German (574 | 36.7%), Irish (488 | 31.2%), English (197 | 12.6%), American (65 | 4.2%), and Italian (57 | 3.6%), together accounting for 88.4% of all Rossmoyne residents.
| Ancestry | # Population | % Population |
| American | 65 | 4.2% |
| Eastern European | 24 | 1.5% |
| English | 197 | 12.6% |
| European | 42 | 2.7% |
| French | 10 | 0.6% |
| German | 574 | 36.7% |
| Greek | 11 | 0.7% |
| Irish | 488 | 31.2% |
| Italian | 57 | 3.6% |
| Mexican | 13 | 0.8% |
| Polish | 29 | 1.9% |
| Scottish | 45 | 2.9% |
| Swedish | 10 | 0.6% |
| Welsh | 13 | 0.8% | View All 14 Rows |
Immigrants in Rossmoyne

| Immigration Origin | # Population | % Population | View All 0 Rows |
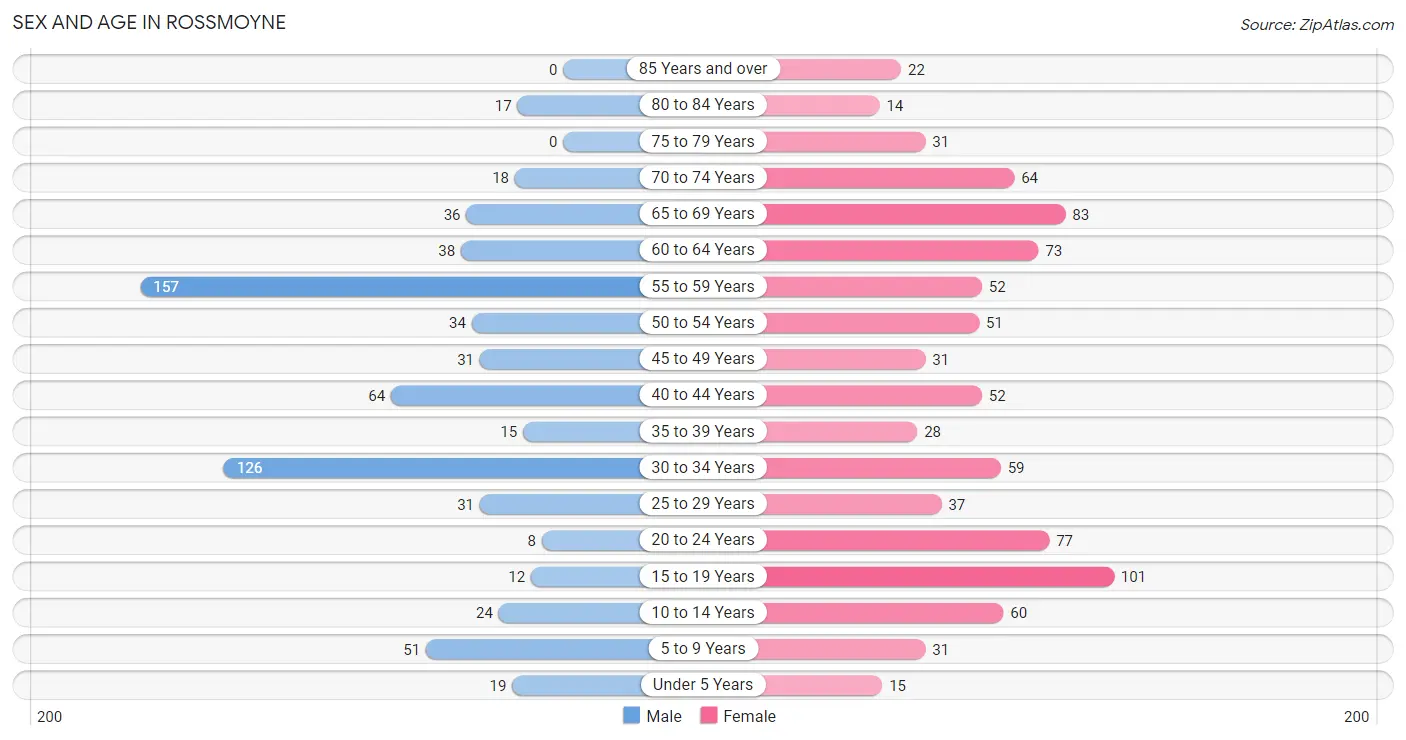
Sex and Age in Rossmoyne
Sex and Age in Rossmoyne
The most populous age groups in Rossmoyne are 55 to 59 Years (157 | 23.1%) for men and 15 to 19 Years (101 | 11.5%) for women.
| Age Bracket | Male | Female |
| Under 5 Years | 19 (2.8%) | 15 (1.7%) |
| 5 to 9 Years | 51 (7.5%) | 31 (3.5%) |
| 10 to 14 Years | 24 (3.5%) | 60 (6.8%) |
| 15 to 19 Years | 12 (1.8%) | 101 (11.5%) |
| 20 to 24 Years | 8 (1.2%) | 77 (8.7%) |
| 25 to 29 Years | 31 (4.5%) | 37 (4.2%) |
| 30 to 34 Years | 126 (18.5%) | 59 (6.7%) |
| 35 to 39 Years | 15 (2.2%) | 28 (3.2%) |
| 40 to 44 Years | 64 (9.4%) | 52 (5.9%) |
| 45 to 49 Years | 31 (4.5%) | 31 (3.5%) |
| 50 to 54 Years | 34 (5.0%) | 51 (5.8%) |
| 55 to 59 Years | 157 (23.1%) | 52 (5.9%) |
| 60 to 64 Years | 38 (5.6%) | 73 (8.3%) |
| 65 to 69 Years | 36 (5.3%) | 83 (9.4%) |
| 70 to 74 Years | 18 (2.6%) | 64 (7.3%) |
| 75 to 79 Years | 0 (0.0%) | 31 (3.5%) |
| 80 to 84 Years | 17 (2.5%) | 14 (1.6%) |
| 85 Years and over | 0 (0.0%) | 22 (2.5%) |
| Total | 681 (100.0%) | 881 (100.0%) |
Families and Households in Rossmoyne
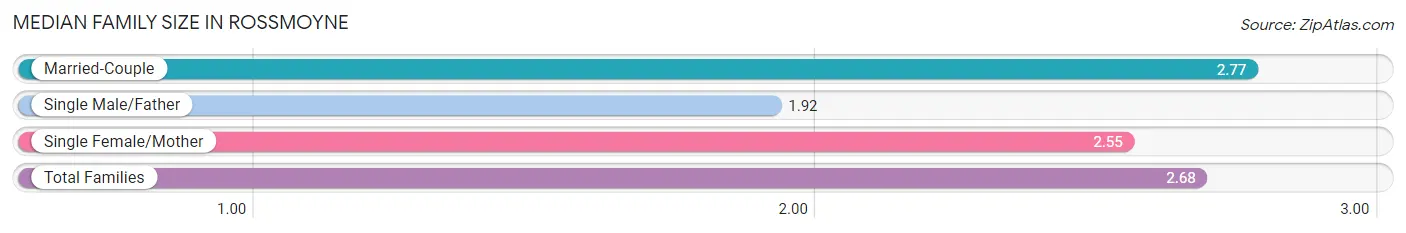
Median Family Size in Rossmoyne
The median family size in Rossmoyne is 2.68 persons per family, with married-couple families (264 | 66.8%) accounting for the largest median family size of 2.77 persons per family. On the other hand, single male/father families (13 | 3.3%) represent the smallest median family size with 1.92 persons per family.
| Family Type | # Families | Family Size |
| Married-Couple | 264 (66.8%) | 2.77 |
| Single Male/Father | 13 (3.3%) | 1.92 |
| Single Female/Mother | 118 (29.9%) | 2.55 |
| Total Families | 395 (100.0%) | 2.68 |
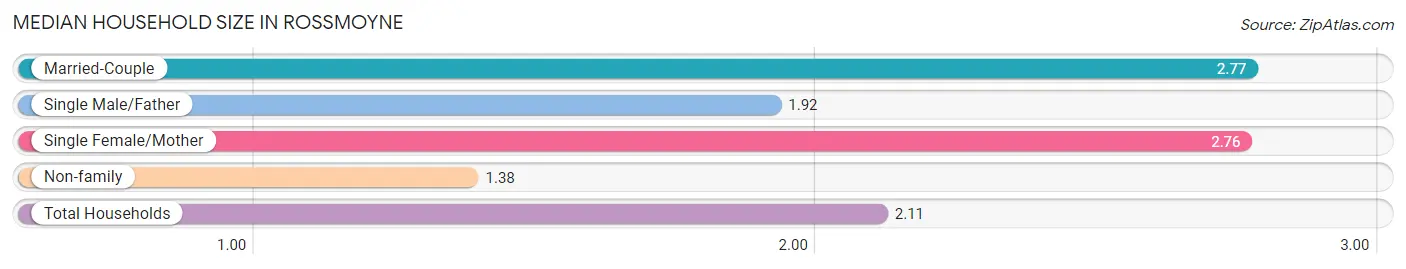
Median Household Size in Rossmoyne
The median household size in Rossmoyne is 2.11 persons per household, with married-couple households (264 | 35.7%) accounting for the largest median household size of 2.77 persons per household. non-family households (345 | 46.6%) represent the smallest median household size with 1.38 persons per household.
| Household Type | # Households | Household Size |
| Married-Couple | 264 (35.7%) | 2.77 |
| Single Male/Father | 13 (1.8%) | 1.92 |
| Single Female/Mother | 118 (16.0%) | 2.76 |
| Non-family | 345 (46.6%) | 1.38 |
| Total Households | 740 (100.0%) | 2.11 |
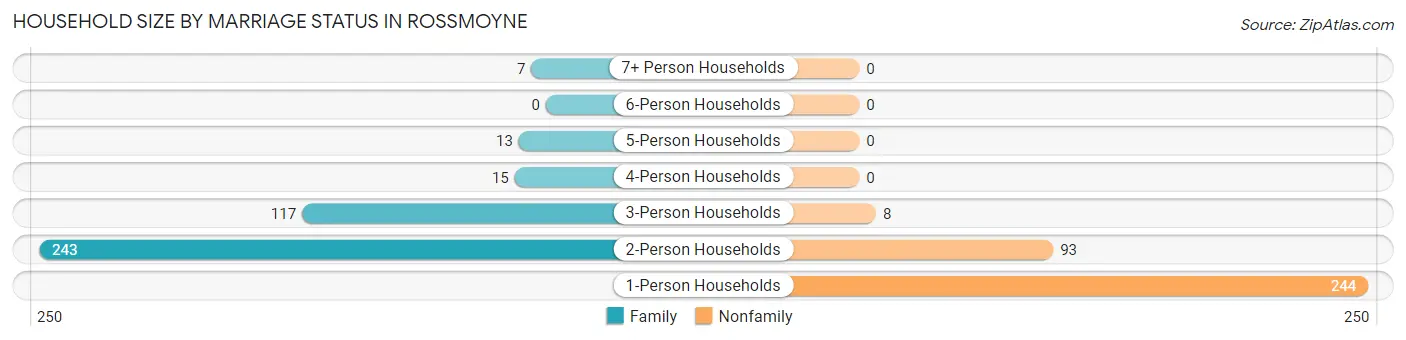
Household Size by Marriage Status in Rossmoyne
Out of a total of 740 households in Rossmoyne, 395 (53.4%) are family households, while 345 (46.6%) are nonfamily households. The most numerous type of family households are 2-person households, comprising 243, and the most common type of nonfamily households are 1-person households, comprising 244.
| Household Size | Family Households | Nonfamily Households |
| 1-Person Households | - | 244 (33.0%) |
| 2-Person Households | 243 (32.8%) | 93 (12.6%) |
| 3-Person Households | 117 (15.8%) | 8 (1.1%) |
| 4-Person Households | 15 (2.0%) | 0 (0.0%) |
| 5-Person Households | 13 (1.8%) | 0 (0.0%) |
| 6-Person Households | 0 (0.0%) | 0 (0.0%) |
| 7+ Person Households | 7 (0.9%) | 0 (0.0%) |
| Total | 395 (53.4%) | 345 (46.6%) |
Female Fertility in Rossmoyne
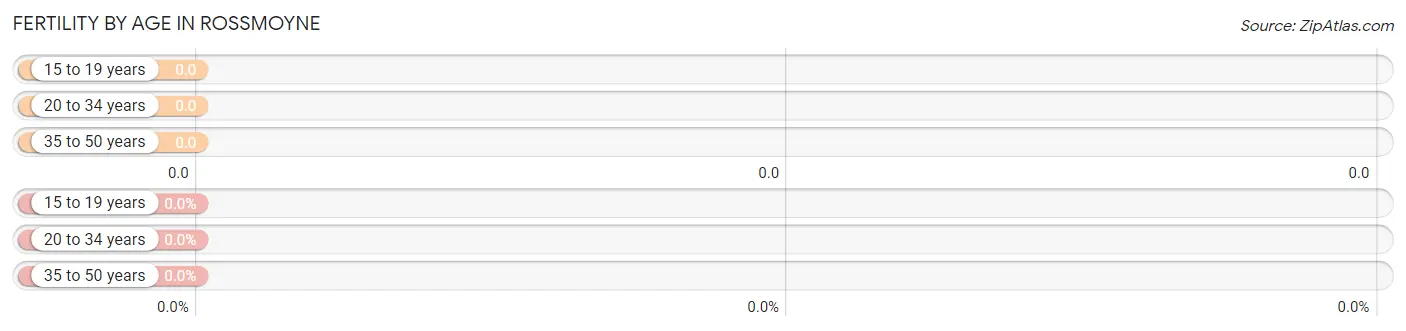
Fertility by Age in Rossmoyne
| Age Bracket | Women with Births | Births / 1,000 Women |
| 15 to 19 years | 0 (0.0%) | 0.0 |
| 20 to 34 years | 0 (0.0%) | 0.0 |
| 35 to 50 years | 0 (0.0%) | 0.0 |
| Total | 0 (0.0%) | 0.0 |
Fertility by Age by Marriage Status in Rossmoyne
| Age Bracket | Married | Unmarried |
| 15 to 19 years | 0 (0.0%) | 0 (0.0%) |
| 20 to 34 years | 0 (0.0%) | 0 (0.0%) |
| 35 to 50 years | 0 (0.0%) | 0 (0.0%) |
| Total | 0 (0.0%) | 0 (0.0%) |
Fertility by Education in Rossmoyne
| Educational Attainment | Women with Births | Births / 1,000 Women |
| Less than High School | 0 (0.0%) | 0.0 |
| High School Diploma | 0 (0.0%) | 0.0 |
| College or Associate's Degree | 0 (0.0%) | 0.0 |
| Bachelor's Degree | 0 (0.0%) | 0.0 |
| Graduate Degree | 0 (0.0%) | 0.0 |
| Total | 0 (0.0%) | 0.0 |
Fertility by Education by Marriage Status in Rossmoyne
| Educational Attainment | Married | Unmarried |
| Less than High School | 0 (0.0%) | 0 (0.0%) |
| High School Diploma | 0 (0.0%) | 0 (0.0%) |
| College or Associate's Degree | 0 (0.0%) | 0 (0.0%) |
| Bachelor's Degree | 0 (0.0%) | 0 (0.0%) |
| Graduate Degree | 0 (0.0%) | 0 (0.0%) |
| Total | 0 (0.0%) | 0 (0.0%) |
Income in Rossmoyne
Income Overview in Rossmoyne
Per Capita Income in Rossmoyne is $31,345, while median incomes of families and households are $70,491 and $46,231 respectively.
| Characteristic | Number | Measure |
| Per Capita Income | 1,562 | $31,345 |
| Median Family Income | 395 | $70,491 |
| Mean Family Income | 395 | $86,784 |
| Median Household Income | 740 | $46,231 |
| Mean Household Income | 740 | $64,136 |
| Income Deficit | 395 | $0 |
| Wage / Income Gap (%) | 1,562 | 21.55% |
| Wage / Income Gap ($) | 1,562 | 78.45¢ per $1 |
| Gini / Inequality Index | 1,562 | 0.47 |
Earnings by Sex in Rossmoyne
Average Earnings in Rossmoyne are $31,250, $36,563 for men and $28,685 for women, a difference of 21.5%.
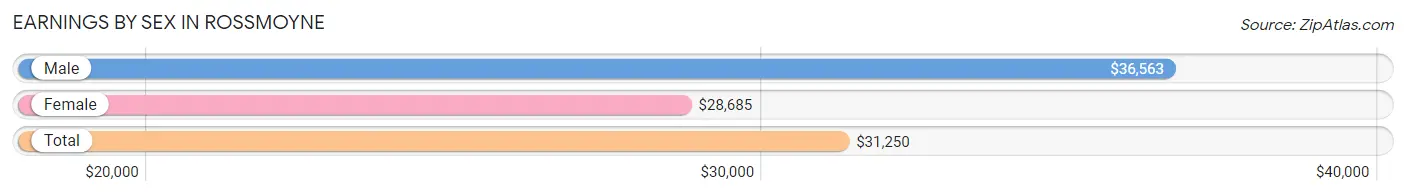
| Sex | Number | Average Earnings |
| Male | 489 (48.7%) | $36,563 |
| Female | 515 (51.3%) | $28,685 |
| Total | 1,004 (100.0%) | $31,250 |
Earnings by Sex by Income Bracket in Rossmoyne
The most common earnings brackets in Rossmoyne are $35,000 to $39,999 for men (87 | 17.8%) and $25,000 to $29,999 for women (125 | 24.3%).
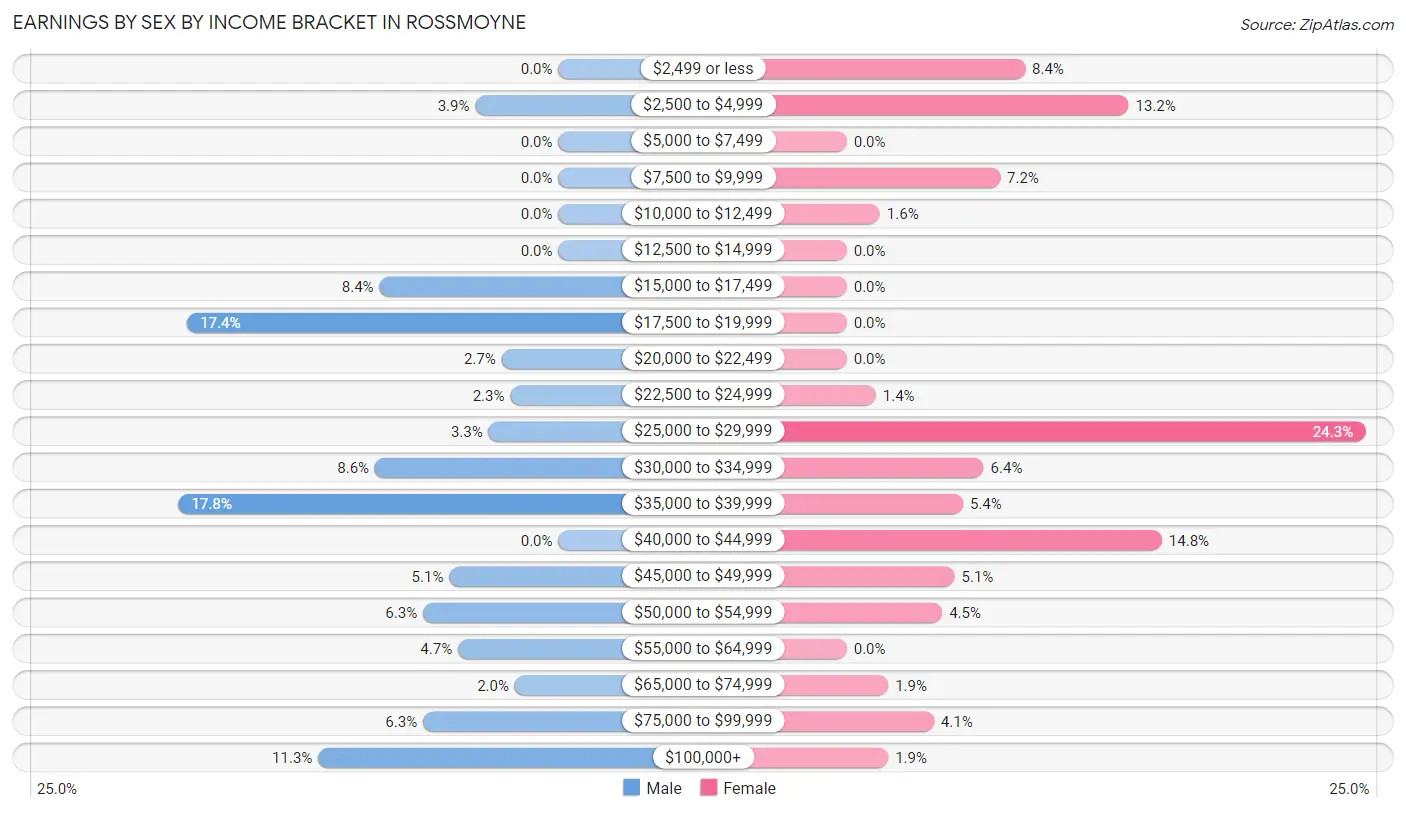
| Income | Male | Female |
| $2,499 or less | 0 (0.0%) | 43 (8.4%) |
| $2,500 to $4,999 | 19 (3.9%) | 68 (13.2%) |
| $5,000 to $7,499 | 0 (0.0%) | 0 (0.0%) |
| $7,500 to $9,999 | 0 (0.0%) | 37 (7.2%) |
| $10,000 to $12,499 | 0 (0.0%) | 8 (1.5%) |
| $12,500 to $14,999 | 0 (0.0%) | 0 (0.0%) |
| $15,000 to $17,499 | 41 (8.4%) | 0 (0.0%) |
| $17,500 to $19,999 | 85 (17.4%) | 0 (0.0%) |
| $20,000 to $22,499 | 13 (2.7%) | 0 (0.0%) |
| $22,500 to $24,999 | 11 (2.2%) | 7 (1.4%) |
| $25,000 to $29,999 | 16 (3.3%) | 125 (24.3%) |
| $30,000 to $34,999 | 42 (8.6%) | 33 (6.4%) |
| $35,000 to $39,999 | 87 (17.8%) | 28 (5.4%) |
| $40,000 to $44,999 | 0 (0.0%) | 76 (14.8%) |
| $45,000 to $49,999 | 25 (5.1%) | 26 (5.1%) |
| $50,000 to $54,999 | 31 (6.3%) | 23 (4.5%) |
| $55,000 to $64,999 | 23 (4.7%) | 0 (0.0%) |
| $65,000 to $74,999 | 10 (2.0%) | 10 (1.9%) |
| $75,000 to $99,999 | 31 (6.3%) | 21 (4.1%) |
| $100,000+ | 55 (11.3%) | 10 (1.9%) |
| Total | 489 (100.0%) | 515 (100.0%) |
Earnings by Sex by Educational Attainment in Rossmoyne
Average earnings in Rossmoyne are $36,741 for men and $32,386 for women, a difference of 11.8%. Men with an educational attainment of graduate degree enjoy the highest average annual earnings of $89,306, while those with high school diploma education earn the least with $18,956. Women with an educational attainment of bachelor's degree earn the most with the average annual earnings of $42,992, while those with high school diploma education have the smallest earnings of $42,750.
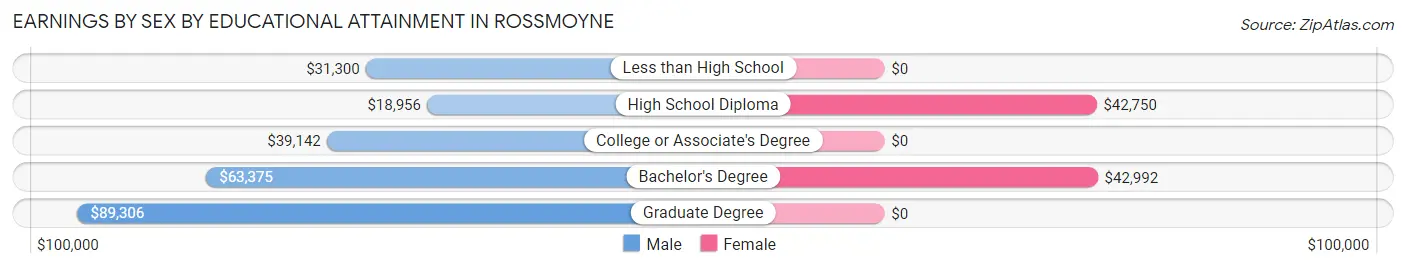
| Educational Attainment | Male Income | Female Income |
| Less than High School | $31,300 | $0 |
| High School Diploma | $18,956 | $42,750 |
| College or Associate's Degree | $39,142 | $0 |
| Bachelor's Degree | $63,375 | $42,992 |
| Graduate Degree | $89,306 | $0 |
| Total | $36,741 | $32,386 |
Family Income in Rossmoyne
Family Income Brackets in Rossmoyne
According to the Rossmoyne family income data, there are 91 families falling into the $50,000 to $74,999 income range, which is the most common income bracket and makes up 23.0% of all families.
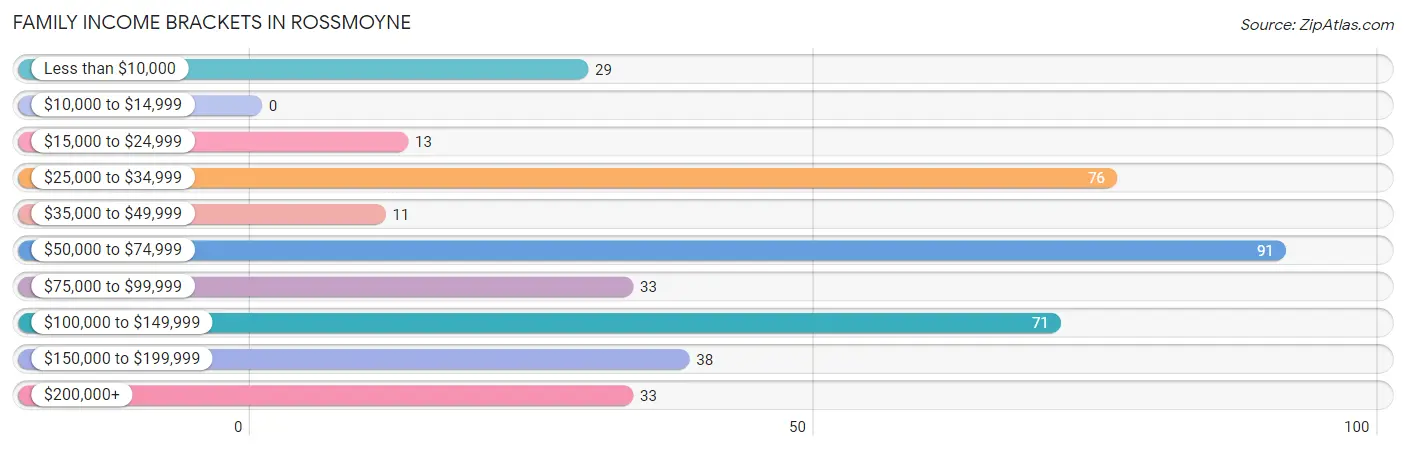
| Income Bracket | # Families | % Families |
| Less than $10,000 | 29 | 7.3% |
| $10,000 to $14,999 | 0 | 0.0% |
| $15,000 to $24,999 | 13 | 3.3% |
| $25,000 to $34,999 | 76 | 19.2% |
| $35,000 to $49,999 | 11 | 2.8% |
| $50,000 to $74,999 | 91 | 23.0% |
| $75,000 to $99,999 | 33 | 8.4% |
| $100,000 to $149,999 | 71 | 18.0% |
| $150,000 to $199,999 | 38 | 9.6% |
| $200,000+ | 33 | 8.4% |
Family Income by Famaliy Size in Rossmoyne
2-person families (253 | 64.0%) account for the highest median family income in Rossmoyne with $54,653 per family, while 2-person families (253 | 64.0%) have the highest median income of $27,326 per family member.
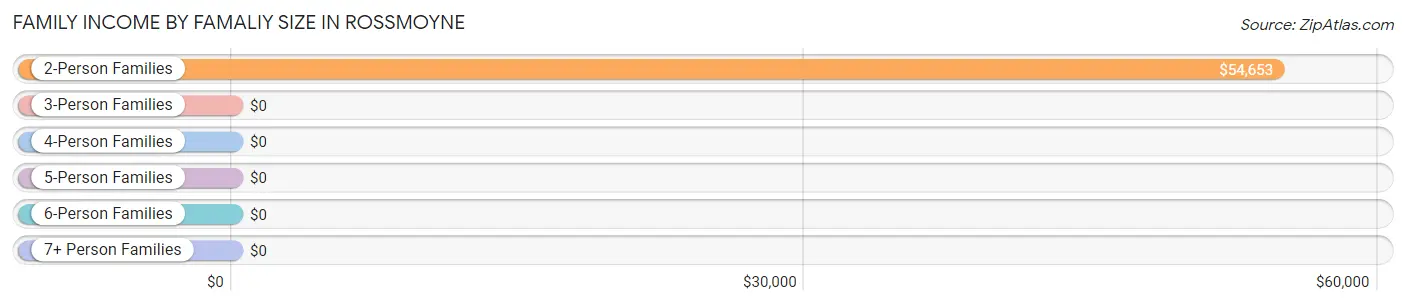
| Income Bracket | # Families | Median Income |
| 2-Person Families | 253 (64.0%) | $54,653 |
| 3-Person Families | 107 (27.1%) | $0 |
| 4-Person Families | 15 (3.8%) | $0 |
| 5-Person Families | 13 (3.3%) | $0 |
| 6-Person Families | 7 (1.8%) | $0 |
| 7+ Person Families | 0 (0.0%) | $0 |
| Total | 395 (100.0%) | $70,491 |
Family Income by Number of Earners in Rossmoyne
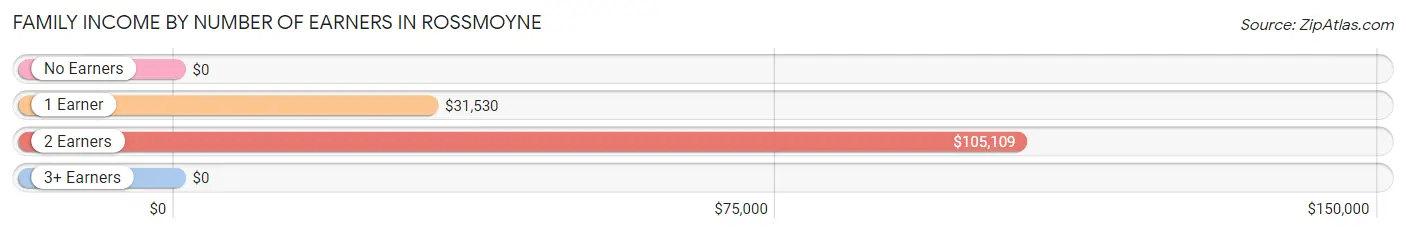
| Number of Earners | # Families | Median Income |
| No Earners | 26 (6.6%) | $0 |
| 1 Earner | 191 (48.3%) | $31,530 |
| 2 Earners | 132 (33.4%) | $105,109 |
| 3+ Earners | 46 (11.7%) | $0 |
| Total | 395 (100.0%) | $70,491 |
Household Income in Rossmoyne
Household Income Brackets in Rossmoyne
With 141 households falling in the category, the $15,000 to $24,999 income range is the most frequent in Rossmoyne, accounting for 19.1% of all households. In contrast, only 7 households (0.9%) fall into the $10,000 to $14,999 income bracket, making it the least populous group.
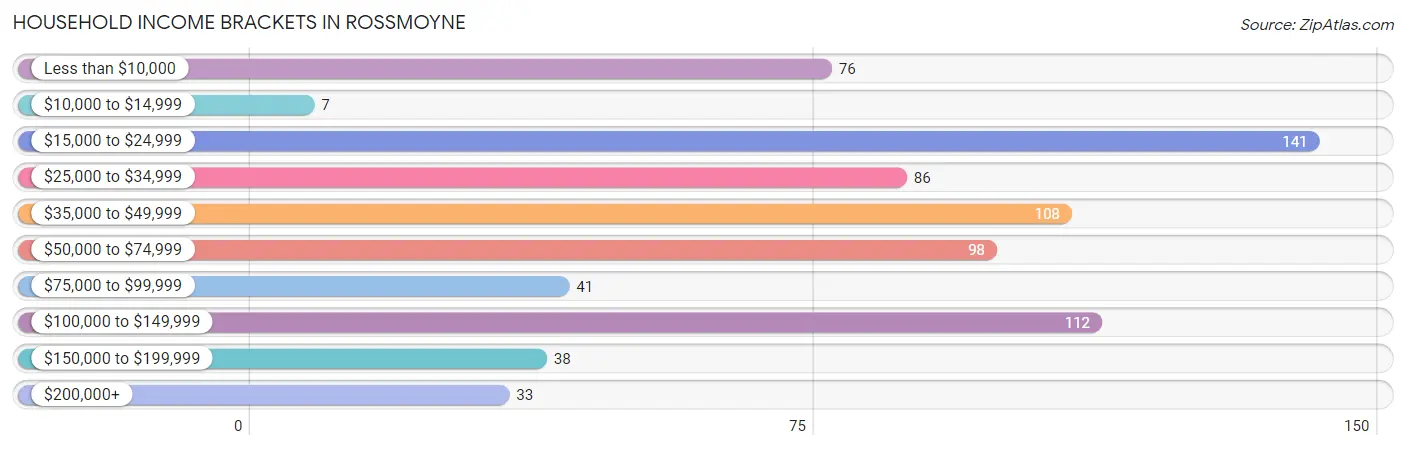
| Income Bracket | # Households | % Households |
| Less than $10,000 | 76 | 10.3% |
| $10,000 to $14,999 | 7 | 0.9% |
| $15,000 to $24,999 | 141 | 19.1% |
| $25,000 to $34,999 | 86 | 11.6% |
| $35,000 to $49,999 | 108 | 14.6% |
| $50,000 to $74,999 | 98 | 13.2% |
| $75,000 to $99,999 | 41 | 5.5% |
| $100,000 to $149,999 | 112 | 15.1% |
| $150,000 to $199,999 | 38 | 5.1% |
| $200,000+ | 33 | 4.5% |
Household Income by Householder Age in Rossmoyne
The median household income in Rossmoyne is $46,231, with the highest median household income of $71,473 found in the 25 to 44 years age bracket for the primary householder. A total of 149 households (20.1%) fall into this category. Meanwhile, the 45 to 64 years age bracket for the primary householder has the lowest median household income of $30,388, with 294 households (39.7%) in this group.
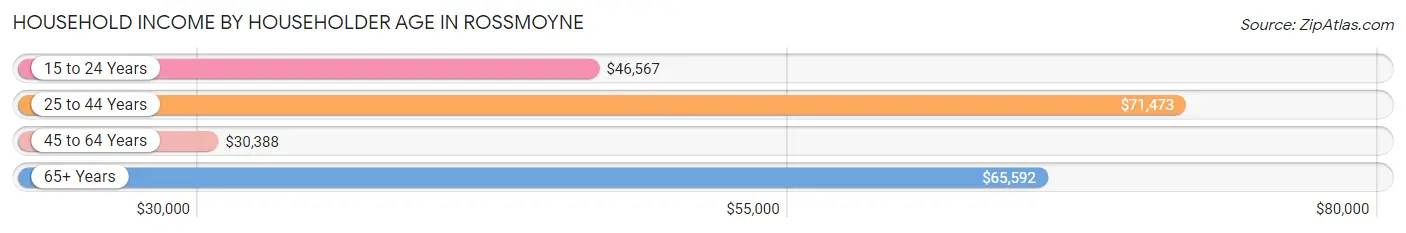
| Income Bracket | # Households | Median Income |
| 15 to 24 Years | 84 (11.4%) | $46,567 |
| 25 to 44 Years | 149 (20.1%) | $71,473 |
| 45 to 64 Years | 294 (39.7%) | $30,388 |
| 65+ Years | 213 (28.8%) | $65,592 |
| Total | 740 (100.0%) | $46,231 |
Poverty in Rossmoyne
Income Below Poverty by Sex and Age in Rossmoyne
With 12.6% poverty level for males and 6.2% for females among the residents of Rossmoyne, 6 to 11 year old males and 25 to 34 year old females are the most vulnerable to poverty, with 39 males (76.5%) and 37 females (38.5%) in their respective age groups living below the poverty level.
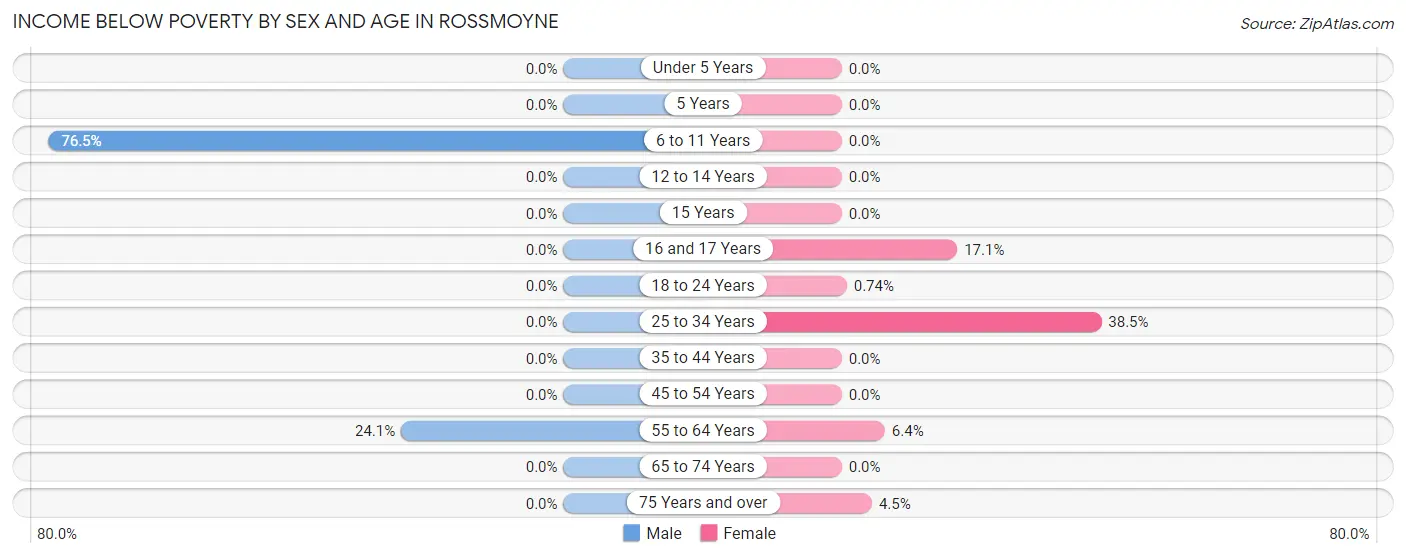
| Age Bracket | Male | Female |
| Under 5 Years | 0 (0.0%) | 0 (0.0%) |
| 5 Years | 0 (0.0%) | 0 (0.0%) |
| 6 to 11 Years | 39 (76.5%) | 0 (0.0%) |
| 12 to 14 Years | 0 (0.0%) | 0 (0.0%) |
| 15 Years | 0 (0.0%) | 0 (0.0%) |
| 16 and 17 Years | 0 (0.0%) | 6 (17.1%) |
| 18 to 24 Years | 0 (0.0%) | 1 (0.7%) |
| 25 to 34 Years | 0 (0.0%) | 37 (38.5%) |
| 35 to 44 Years | 0 (0.0%) | 0 (0.0%) |
| 45 to 54 Years | 0 (0.0%) | 0 (0.0%) |
| 55 to 64 Years | 47 (24.1%) | 8 (6.4%) |
| 65 to 74 Years | 0 (0.0%) | 0 (0.0%) |
| 75 Years and over | 0 (0.0%) | 3 (4.5%) |
| Total | 86 (12.6%) | 55 (6.2%) |
Income Above Poverty by Sex and Age in Rossmoyne
According to the poverty statistics in Rossmoyne, males aged under 5 years and females aged under 5 years are the age groups that are most secure financially, with 100.0% of males and 100.0% of females in these age groups living above the poverty line.
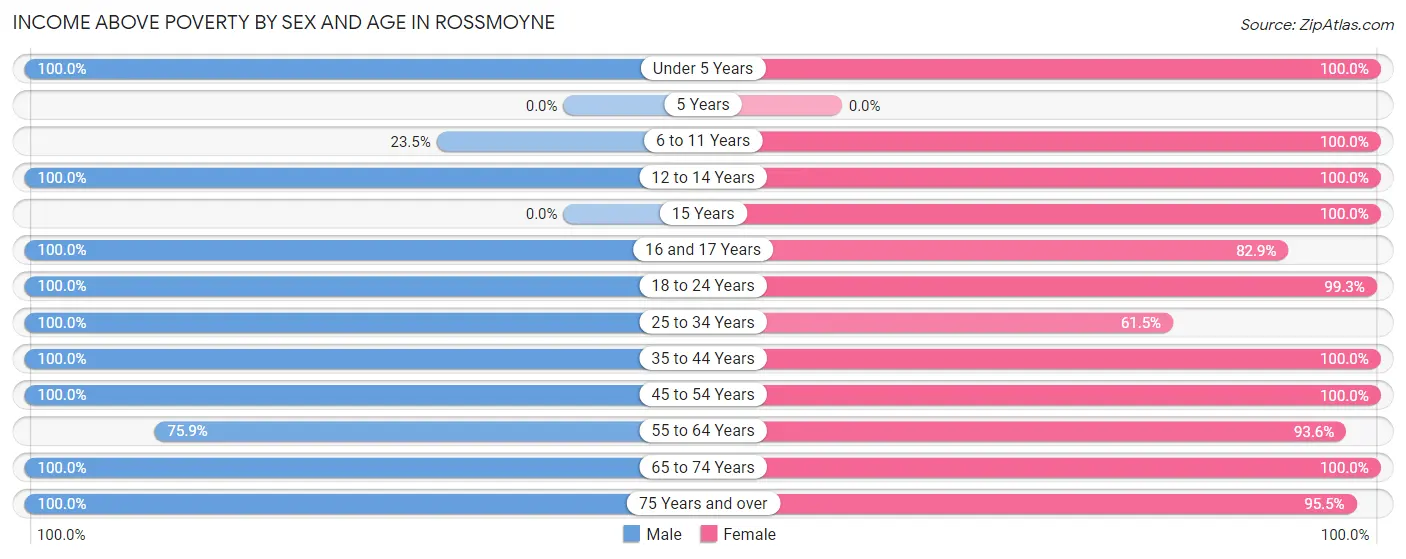
| Age Bracket | Male | Female |
| Under 5 Years | 19 (100.0%) | 15 (100.0%) |
| 5 Years | 0 (0.0%) | 0 (0.0%) |
| 6 to 11 Years | 12 (23.5%) | 39 (100.0%) |
| 12 to 14 Years | 24 (100.0%) | 52 (100.0%) |
| 15 Years | 0 (0.0%) | 7 (100.0%) |
| 16 and 17 Years | 12 (100.0%) | 29 (82.9%) |
| 18 to 24 Years | 8 (100.0%) | 135 (99.3%) |
| 25 to 34 Years | 157 (100.0%) | 59 (61.5%) |
| 35 to 44 Years | 79 (100.0%) | 80 (100.0%) |
| 45 to 54 Years | 65 (100.0%) | 82 (100.0%) |
| 55 to 64 Years | 148 (75.9%) | 117 (93.6%) |
| 65 to 74 Years | 54 (100.0%) | 147 (100.0%) |
| 75 Years and over | 17 (100.0%) | 64 (95.5%) |
| Total | 595 (87.4%) | 826 (93.8%) |
Income Below Poverty Among Married-Couple Families in Rossmoyne
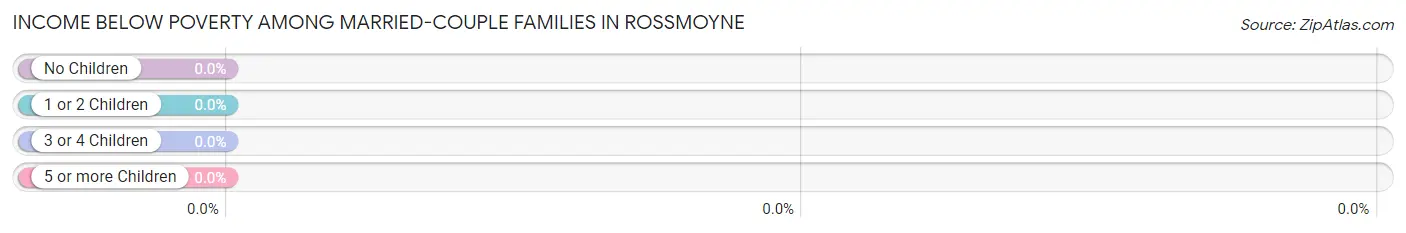
| Children | Above Poverty | Below Poverty |
| No Children | 217 (100.0%) | 0 (0.0%) |
| 1 or 2 Children | 34 (100.0%) | 0 (0.0%) |
| 3 or 4 Children | 13 (100.0%) | 0 (0.0%) |
| 5 or more Children | 0 (0.0%) | 0 (0.0%) |
| Total | 264 (100.0%) | 0 (0.0%) |
Income Below Poverty Among Single-Parent Households in Rossmoyne
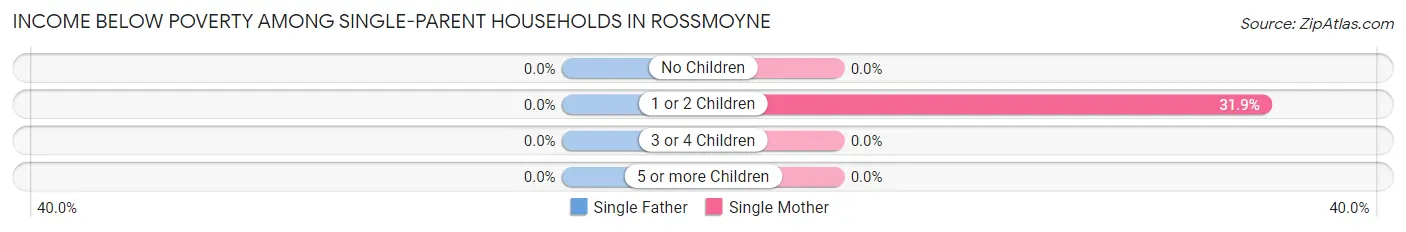
| Children | Single Father | Single Mother |
| No Children | 0 (0.0%) | 0 (0.0%) |
| 1 or 2 Children | 0 (0.0%) | 29 (31.9%) |
| 3 or 4 Children | 0 (0.0%) | 0 (0.0%) |
| 5 or more Children | 0 (0.0%) | 0 (0.0%) |
| Total | 0 (0.0%) | 29 (24.6%) |
Income Below Poverty Among Married-Couple vs Single-Parent Households in Rossmoyne
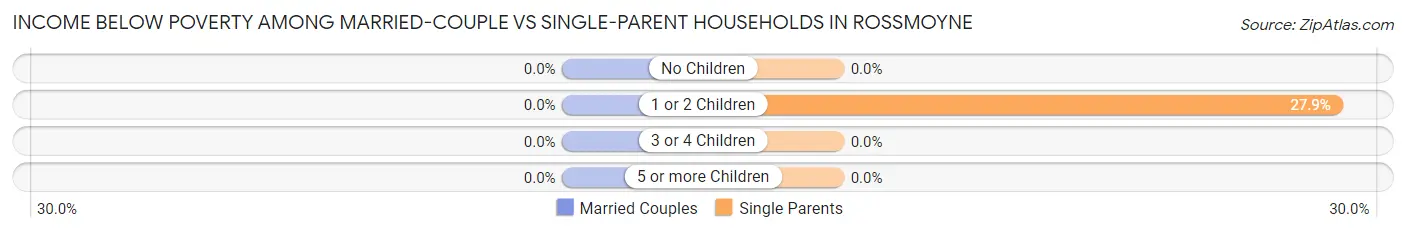
| Children | Married-Couple Families | Single-Parent Households |
| No Children | 0 (0.0%) | 0 (0.0%) |
| 1 or 2 Children | 0 (0.0%) | 29 (27.9%) |
| 3 or 4 Children | 0 (0.0%) | 0 (0.0%) |
| 5 or more Children | 0 (0.0%) | 0 (0.0%) |
| Total | 0 (0.0%) | 29 (22.1%) |
Employment Characteristics in Rossmoyne
Employment by Class of Employer in Rossmoyne
Among the 915 employed individuals in Rossmoyne, private company employees (737 | 80.5%), not-for-profit organizations (131 | 14.3%), and self-employed (not incorporated) (37 | 4.0%) make up the most common classes of employment.
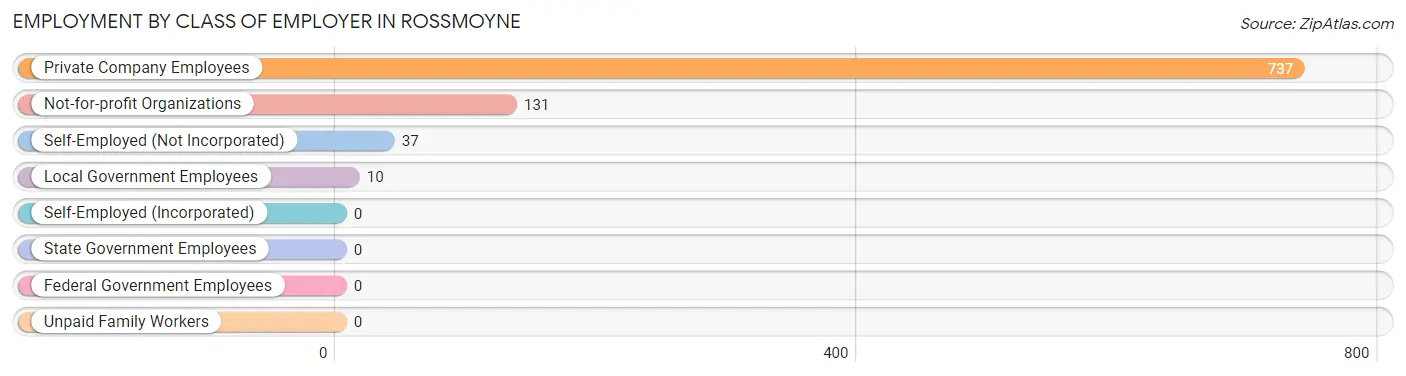
| Employer Class | # Employees | % Employees |
| Private Company Employees | 737 | 80.5% |
| Self-Employed (Incorporated) | 0 | 0.0% |
| Self-Employed (Not Incorporated) | 37 | 4.0% |
| Not-for-profit Organizations | 131 | 14.3% |
| Local Government Employees | 10 | 1.1% |
| State Government Employees | 0 | 0.0% |
| Federal Government Employees | 0 | 0.0% |
| Unpaid Family Workers | 0 | 0.0% |
| Total | 915 | 100.0% |
Employment Status by Age in Rossmoyne
According to the labor force statistics for Rossmoyne, out of the total population over 16 years of age (1,355), 70.8% or 959 individuals are in the labor force, with 3.3% or 32 of them unemployed. The age group with the highest labor force participation rate is 20 to 24 years, with 100.0% or 85 individuals in the labor force. Within the labor force, the 55 to 59 years age range has the highest percentage of unemployed individuals, with 19.8% or 23 of them being unemployed.
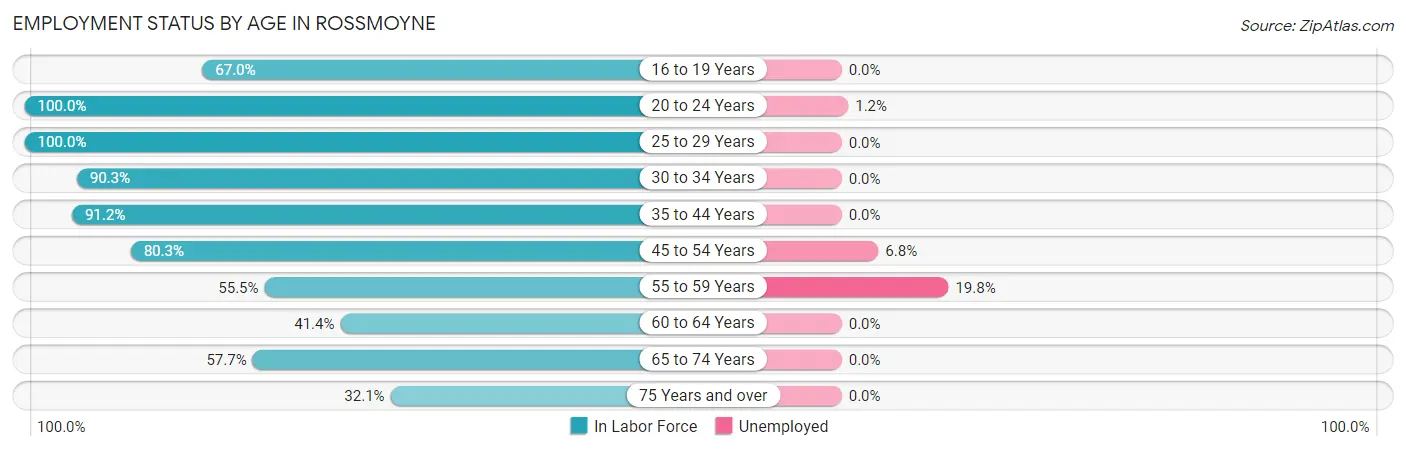
| Age Bracket | In Labor Force | Unemployed |
| 16 to 19 Years | 71 (67.0%) | 0 (0.0%) |
| 20 to 24 Years | 85 (100.0%) | 1 (1.2%) |
| 25 to 29 Years | 68 (100.0%) | 0 (0.0%) |
| 30 to 34 Years | 167 (90.3%) | 0 (0.0%) |
| 35 to 44 Years | 145 (91.2%) | 0 (0.0%) |
| 45 to 54 Years | 118 (80.3%) | 8 (6.8%) |
| 55 to 59 Years | 116 (55.5%) | 23 (19.8%) |
| 60 to 64 Years | 46 (41.4%) | 0 (0.0%) |
| 65 to 74 Years | 116 (57.7%) | 0 (0.0%) |
| 75 Years and over | 27 (32.1%) | 0 (0.0%) |
| Total | 959 (70.8%) | 32 (3.3%) |
Employment Status by Educational Attainment in Rossmoyne
According to labor force statistics for Rossmoyne, 75.1% of individuals (660) out of the total population between 25 and 64 years of age (879) are in the labor force, with 4.7% or 31 of them being unemployed. The group with the highest labor force participation rate are those with the educational attainment of bachelor's degree or higher, with 100.0% or 185 individuals in the labor force. Within the labor force, individuals with high school diploma education have the highest percentage of unemployment, with 15.3% or 31 of them being unemployed.
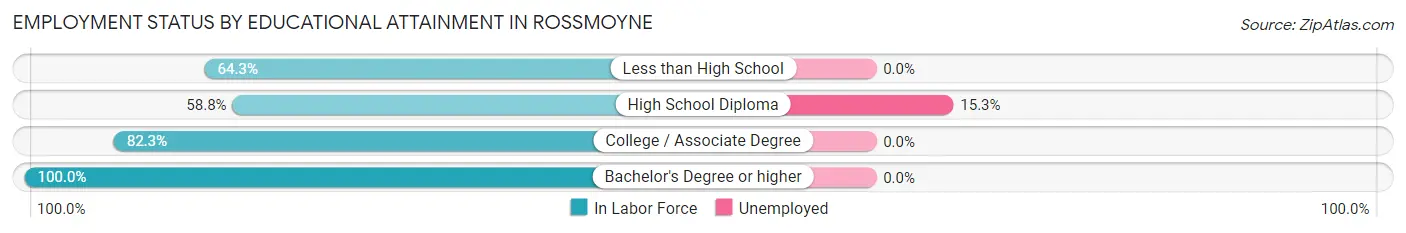
| Educational Attainment | In Labor Force | Unemployed |
| Less than High School | 54 (64.3%) | 0 (0.0%) |
| High School Diploma | 203 (58.8%) | 53 (15.3%) |
| College / Associate Degree | 218 (82.3%) | 0 (0.0%) |
| Bachelor's Degree or higher | 185 (100.0%) | 0 (0.0%) |
| Total | 660 (75.1%) | 41 (4.7%) |
Employment Occupations by Sex in Rossmoyne
Management, Business, Science and Arts Occupations
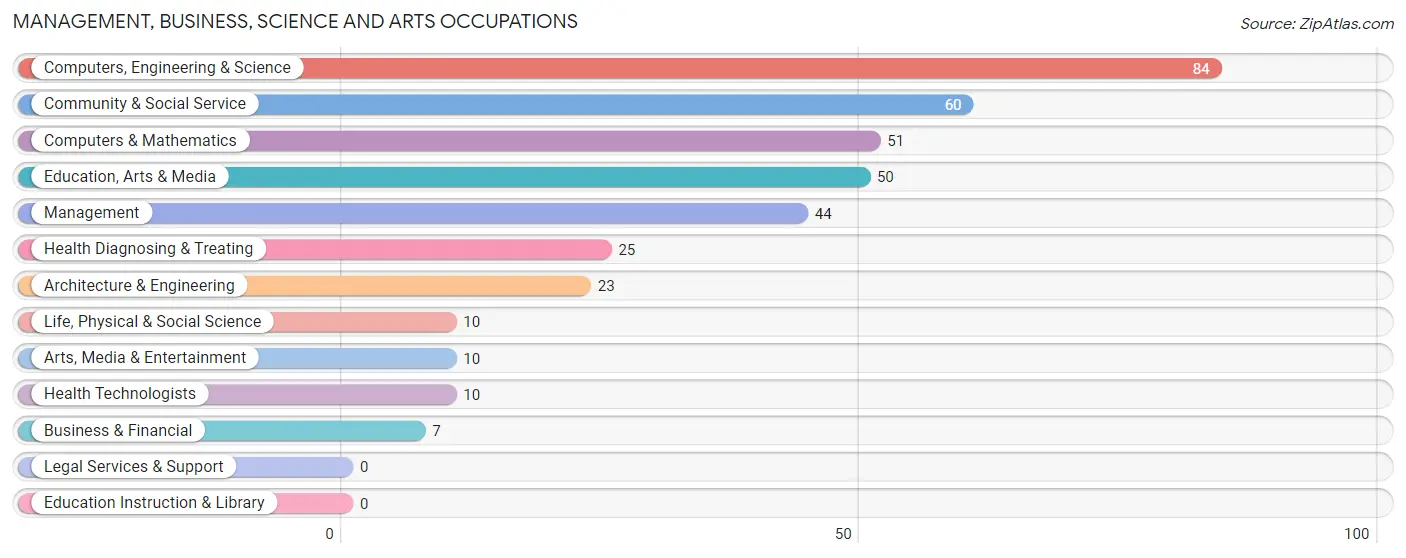
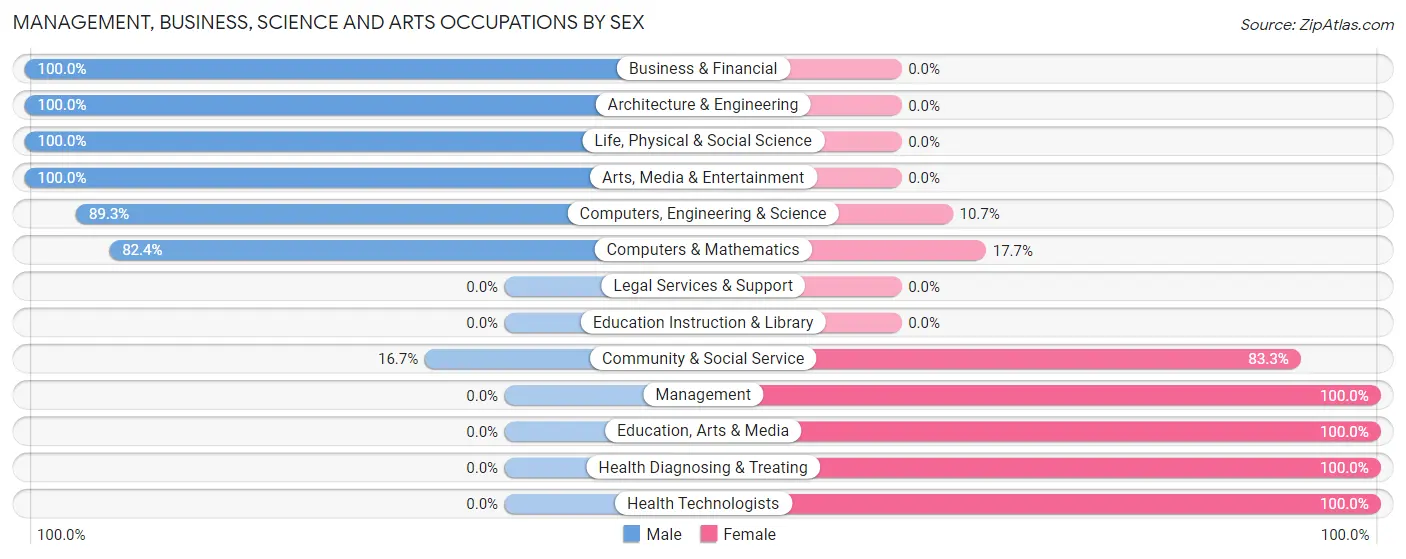
The most common Management, Business, Science and Arts occupations in Rossmoyne are Computers, Engineering & Science (84 | 9.1%), Community & Social Service (60 | 6.5%), Computers & Mathematics (51 | 5.5%), Education, Arts & Media (50 | 5.4%), and Management (44 | 4.8%).
Management, Business, Science and Arts Occupations by Sex
Within the Management, Business, Science and Arts occupations in Rossmoyne, the most male-oriented occupations are Business & Financial (100.0%), Architecture & Engineering (100.0%), and Life, Physical & Social Science (100.0%), while the most female-oriented occupations are Management (100.0%), Education, Arts & Media (100.0%), and Health Diagnosing & Treating (100.0%).
| Occupation | Male | Female |
| Management | 0 (0.0%) | 44 (100.0%) |
| Business & Financial | 7 (100.0%) | 0 (0.0%) |
| Computers, Engineering & Science | 75 (89.3%) | 9 (10.7%) |
| Computers & Mathematics | 42 (82.4%) | 9 (17.6%) |
| Architecture & Engineering | 23 (100.0%) | 0 (0.0%) |
| Life, Physical & Social Science | 10 (100.0%) | 0 (0.0%) |
| Community & Social Service | 10 (16.7%) | 50 (83.3%) |
| Education, Arts & Media | 0 (0.0%) | 50 (100.0%) |
| Legal Services & Support | 0 (0.0%) | 0 (0.0%) |
| Education Instruction & Library | 0 (0.0%) | 0 (0.0%) |
| Arts, Media & Entertainment | 10 (100.0%) | 0 (0.0%) |
| Health Diagnosing & Treating | 0 (0.0%) | 25 (100.0%) |
| Health Technologists | 0 (0.0%) | 10 (100.0%) |
| Total (Category) | 92 (41.8%) | 128 (58.2%) |
| Total (Overall) | 448 (48.3%) | 479 (51.7%) |
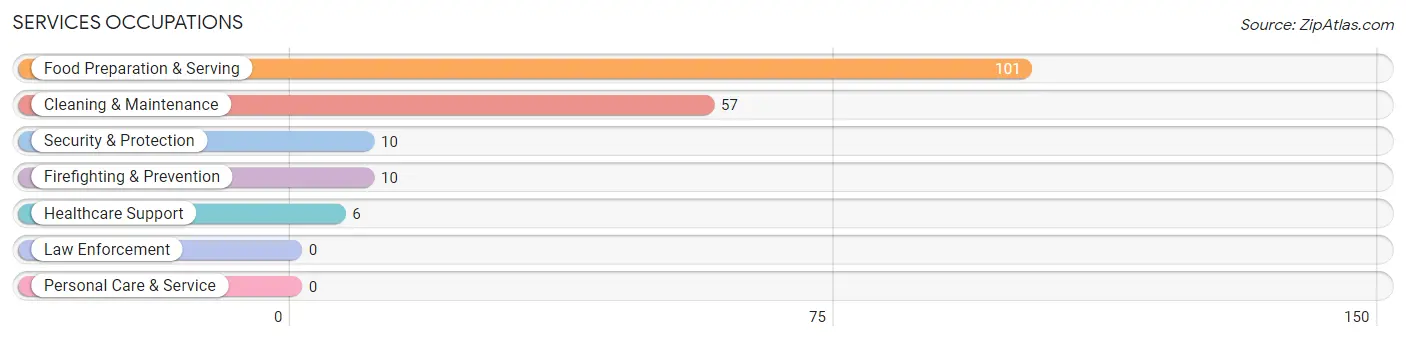
Services Occupations
The most common Services occupations in Rossmoyne are Food Preparation & Serving (101 | 10.9%), Cleaning & Maintenance (57 | 6.1%), Security & Protection (10 | 1.1%), Firefighting & Prevention (10 | 1.1%), and Healthcare Support (6 | 0.6%).
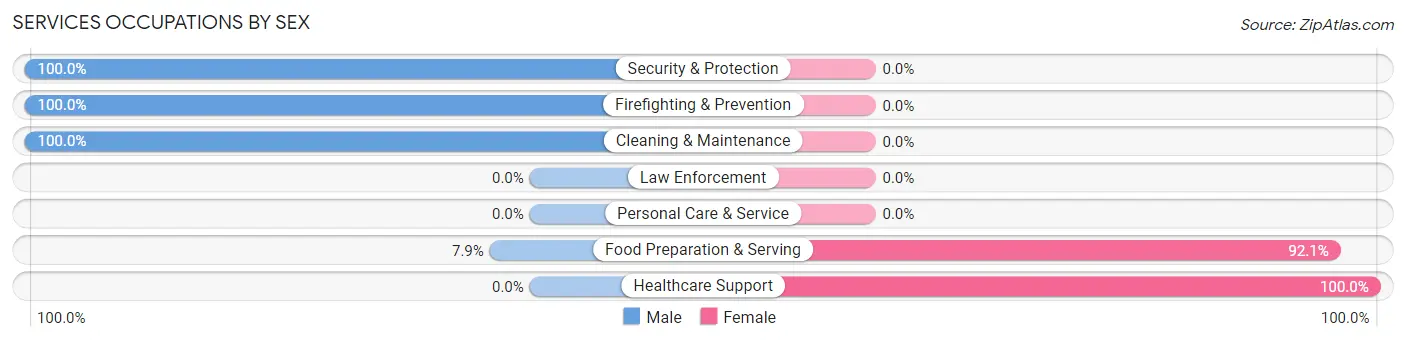
Services Occupations by Sex
Within the Services occupations in Rossmoyne, the most male-oriented occupations are Security & Protection (100.0%), Firefighting & Prevention (100.0%), and Cleaning & Maintenance (100.0%), while the most female-oriented occupations are Healthcare Support (100.0%), and Food Preparation & Serving (92.1%).
| Occupation | Male | Female |
| Healthcare Support | 0 (0.0%) | 6 (100.0%) |
| Security & Protection | 10 (100.0%) | 0 (0.0%) |
| Firefighting & Prevention | 10 (100.0%) | 0 (0.0%) |
| Law Enforcement | 0 (0.0%) | 0 (0.0%) |
| Food Preparation & Serving | 8 (7.9%) | 93 (92.1%) |
| Cleaning & Maintenance | 57 (100.0%) | 0 (0.0%) |
| Personal Care & Service | 0 (0.0%) | 0 (0.0%) |
| Total (Category) | 75 (43.1%) | 99 (56.9%) |
| Total (Overall) | 448 (48.3%) | 479 (51.7%) |
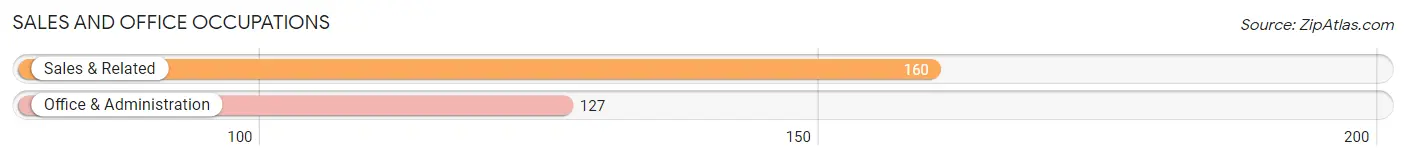
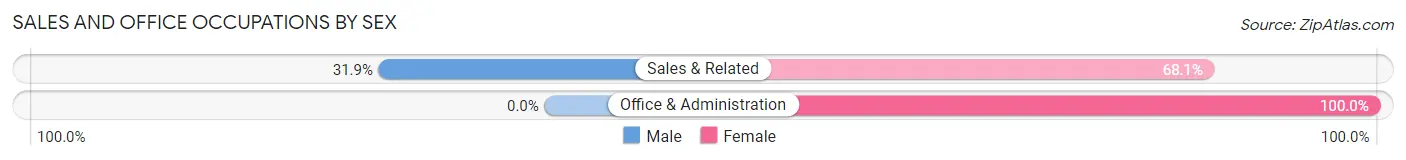
Sales and Office Occupations
The most common Sales and Office occupations in Rossmoyne are Sales & Related (160 | 17.3%), and Office & Administration (127 | 13.7%).
Sales and Office Occupations by Sex
| Occupation | Male | Female |
| Sales & Related | 51 (31.9%) | 109 (68.1%) |
| Office & Administration | 0 (0.0%) | 127 (100.0%) |
| Total (Category) | 51 (17.8%) | 236 (82.2%) |
| Total (Overall) | 448 (48.3%) | 479 (51.7%) |
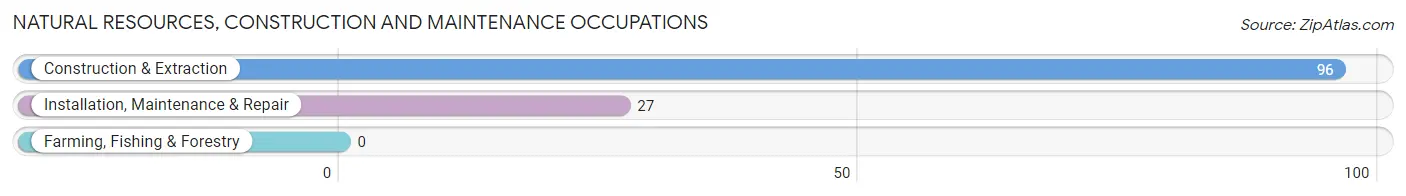
Natural Resources, Construction and Maintenance Occupations
The most common Natural Resources, Construction and Maintenance occupations in Rossmoyne are Construction & Extraction (96 | 10.4%), and Installation, Maintenance & Repair (27 | 2.9%).
Natural Resources, Construction and Maintenance Occupations by Sex
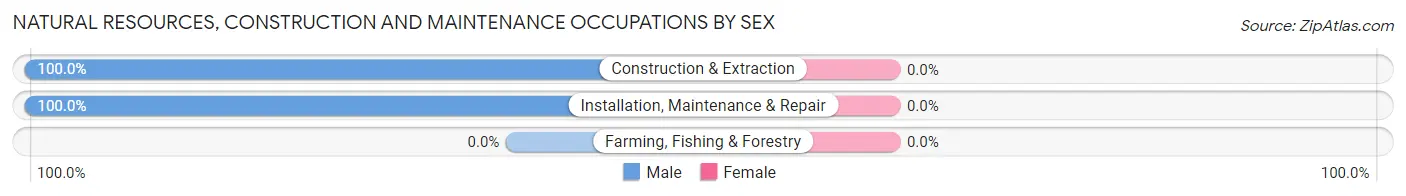
| Occupation | Male | Female |
| Farming, Fishing & Forestry | 0 (0.0%) | 0 (0.0%) |
| Construction & Extraction | 96 (100.0%) | 0 (0.0%) |
| Installation, Maintenance & Repair | 27 (100.0%) | 0 (0.0%) |
| Total (Category) | 123 (100.0%) | 0 (0.0%) |
| Total (Overall) | 448 (48.3%) | 479 (51.7%) |
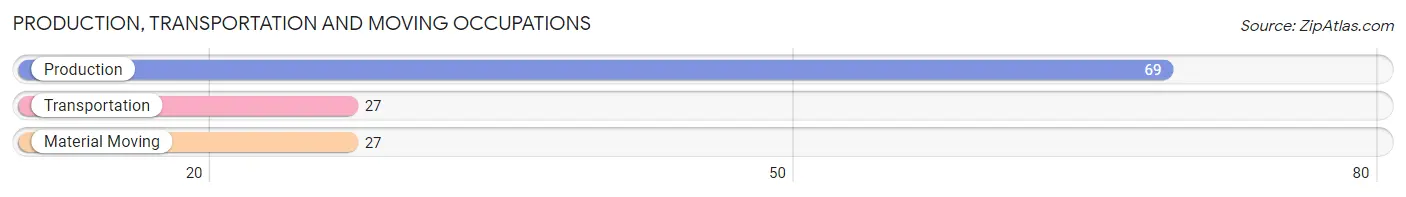
Production, Transportation and Moving Occupations
The most common Production, Transportation and Moving occupations in Rossmoyne are Production (69 | 7.4%), Transportation (27 | 2.9%), and Material Moving (27 | 2.9%).
Production, Transportation and Moving Occupations by Sex
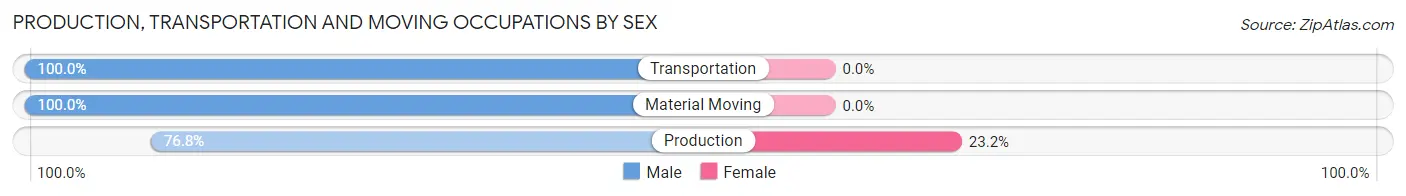
| Occupation | Male | Female |
| Production | 53 (76.8%) | 16 (23.2%) |
| Transportation | 27 (100.0%) | 0 (0.0%) |
| Material Moving | 27 (100.0%) | 0 (0.0%) |
| Total (Category) | 107 (87.0%) | 16 (13.0%) |
| Total (Overall) | 448 (48.3%) | 479 (51.7%) |
Employment Industries by Sex in Rossmoyne
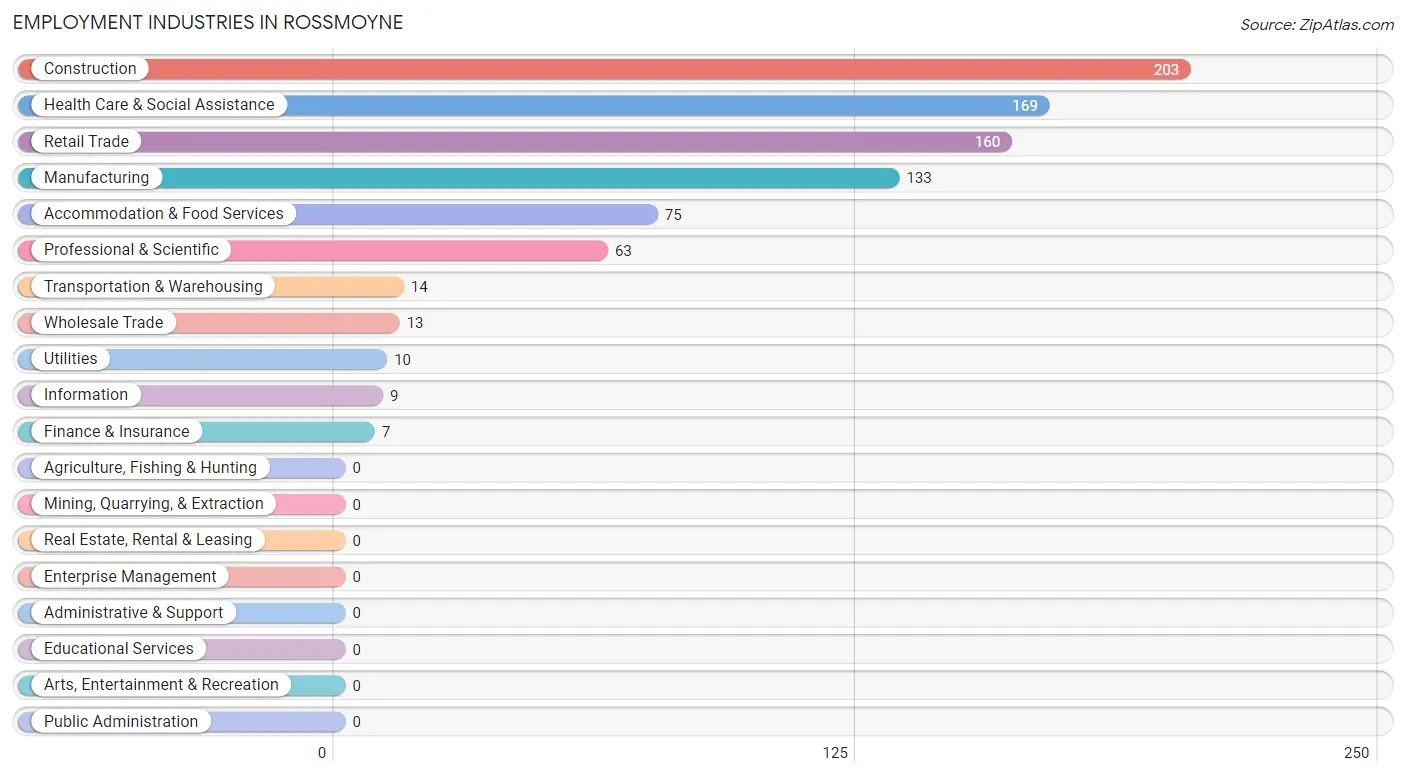
Employment Industries in Rossmoyne
The major employment industries in Rossmoyne include Construction (203 | 21.9%), Health Care & Social Assistance (169 | 18.2%), Retail Trade (160 | 17.3%), Manufacturing (133 | 14.3%), and Accommodation & Food Services (75 | 8.1%).
Employment Industries by Sex in Rossmoyne
The Rossmoyne industries that see more men than women are Transportation & Warehousing (100.0%), Utilities (100.0%), and Information (100.0%), whereas the industries that tend to have a higher number of women are Wholesale Trade (100.0%), Finance & Insurance (100.0%), and Health Care & Social Assistance (100.0%).
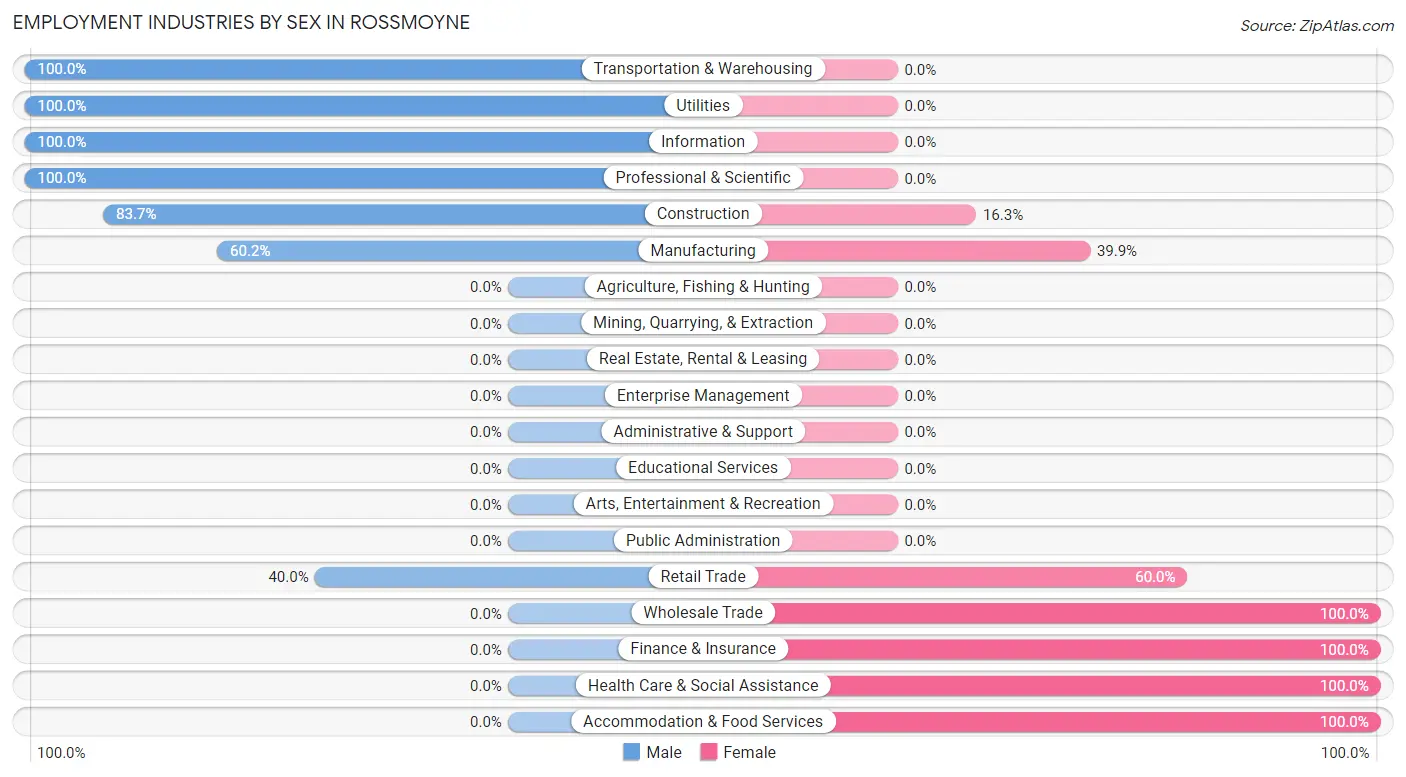
| Industry | Male | Female |
| Agriculture, Fishing & Hunting | 0 (0.0%) | 0 (0.0%) |
| Mining, Quarrying, & Extraction | 0 (0.0%) | 0 (0.0%) |
| Construction | 170 (83.7%) | 33 (16.3%) |
| Manufacturing | 80 (60.2%) | 53 (39.9%) |
| Wholesale Trade | 0 (0.0%) | 13 (100.0%) |
| Retail Trade | 64 (40.0%) | 96 (60.0%) |
| Transportation & Warehousing | 14 (100.0%) | 0 (0.0%) |
| Utilities | 10 (100.0%) | 0 (0.0%) |
| Information | 9 (100.0%) | 0 (0.0%) |
| Finance & Insurance | 0 (0.0%) | 7 (100.0%) |
| Real Estate, Rental & Leasing | 0 (0.0%) | 0 (0.0%) |
| Professional & Scientific | 63 (100.0%) | 0 (0.0%) |
| Enterprise Management | 0 (0.0%) | 0 (0.0%) |
| Administrative & Support | 0 (0.0%) | 0 (0.0%) |
| Educational Services | 0 (0.0%) | 0 (0.0%) |
| Health Care & Social Assistance | 0 (0.0%) | 169 (100.0%) |
| Arts, Entertainment & Recreation | 0 (0.0%) | 0 (0.0%) |
| Accommodation & Food Services | 0 (0.0%) | 75 (100.0%) |
| Public Administration | 0 (0.0%) | 0 (0.0%) |
| Total | 448 (48.3%) | 479 (51.7%) |
Education in Rossmoyne
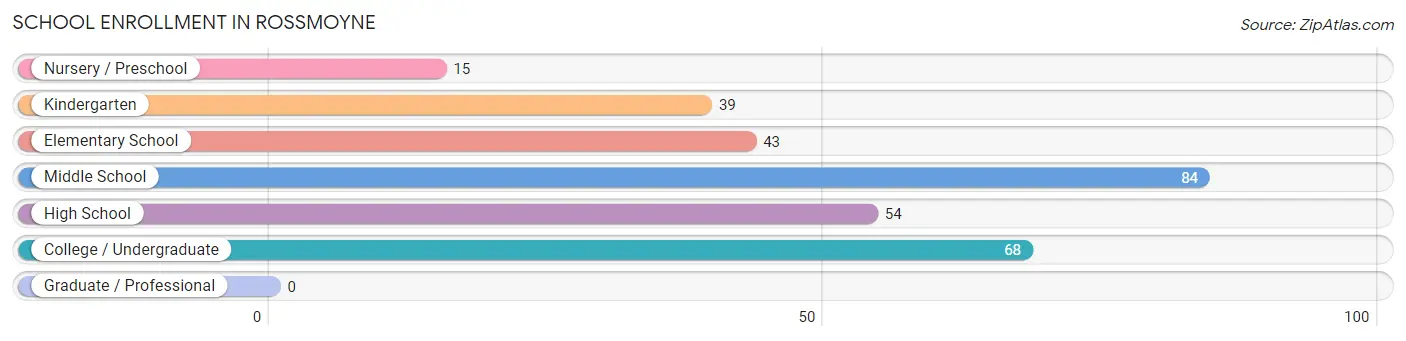
School Enrollment in Rossmoyne
The most common levels of schooling among the 303 students in Rossmoyne are middle school (84 | 27.7%), college / undergraduate (68 | 22.4%), and high school (54 | 17.8%).
| School Level | # Students | % Students |
| Nursery / Preschool | 15 | 5.0% |
| Kindergarten | 39 | 12.9% |
| Elementary School | 43 | 14.2% |
| Middle School | 84 | 27.7% |
| High School | 54 | 17.8% |
| College / Undergraduate | 68 | 22.4% |
| Graduate / Professional | 0 | 0.0% |
| Total | 303 | 100.0% |
School Enrollment by Age by Funding Source in Rossmoyne
Out of a total of 303 students who are enrolled in schools in Rossmoyne, 52 (17.2%) attend a private institution, while the remaining 251 (82.8%) are enrolled in public schools. The age group of 3 to 4 year olds has the highest likelihood of being enrolled in private schools, with 15 (100.0% in the age bracket) enrolled. Conversely, the age group of 5 to 9 year old has the lowest likelihood of being enrolled in a private school, with 82 (100.0% in the age bracket) attending a public institution.
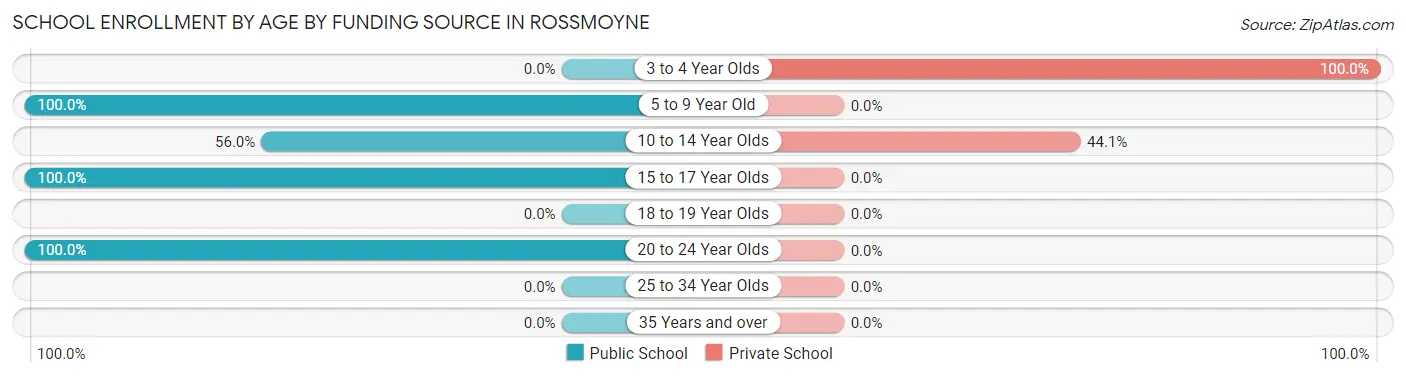
| Age Bracket | Public School | Private School |
| 3 to 4 Year Olds | 0 (0.0%) | 15 (100.0%) |
| 5 to 9 Year Old | 82 (100.0%) | 0 (0.0%) |
| 10 to 14 Year Olds | 47 (55.9%) | 37 (44.1%) |
| 15 to 17 Year Olds | 54 (100.0%) | 0 (0.0%) |
| 18 to 19 Year Olds | 0 (0.0%) | 0 (0.0%) |
| 20 to 24 Year Olds | 68 (100.0%) | 0 (0.0%) |
| 25 to 34 Year Olds | 0 (0.0%) | 0 (0.0%) |
| 35 Years and over | 0 (0.0%) | 0 (0.0%) |
| Total | 251 (82.8%) | 52 (17.2%) |
Educational Attainment by Field of Study in Rossmoyne
Business (66 | 21.7%), communications (50 | 16.5%), science & technology (43 | 14.1%), visual & performing arts (37 | 12.2%), and liberal arts & history (22 | 7.2%) are the most common fields of study among 304 individuals in Rossmoyne who have obtained a bachelor's degree or higher.
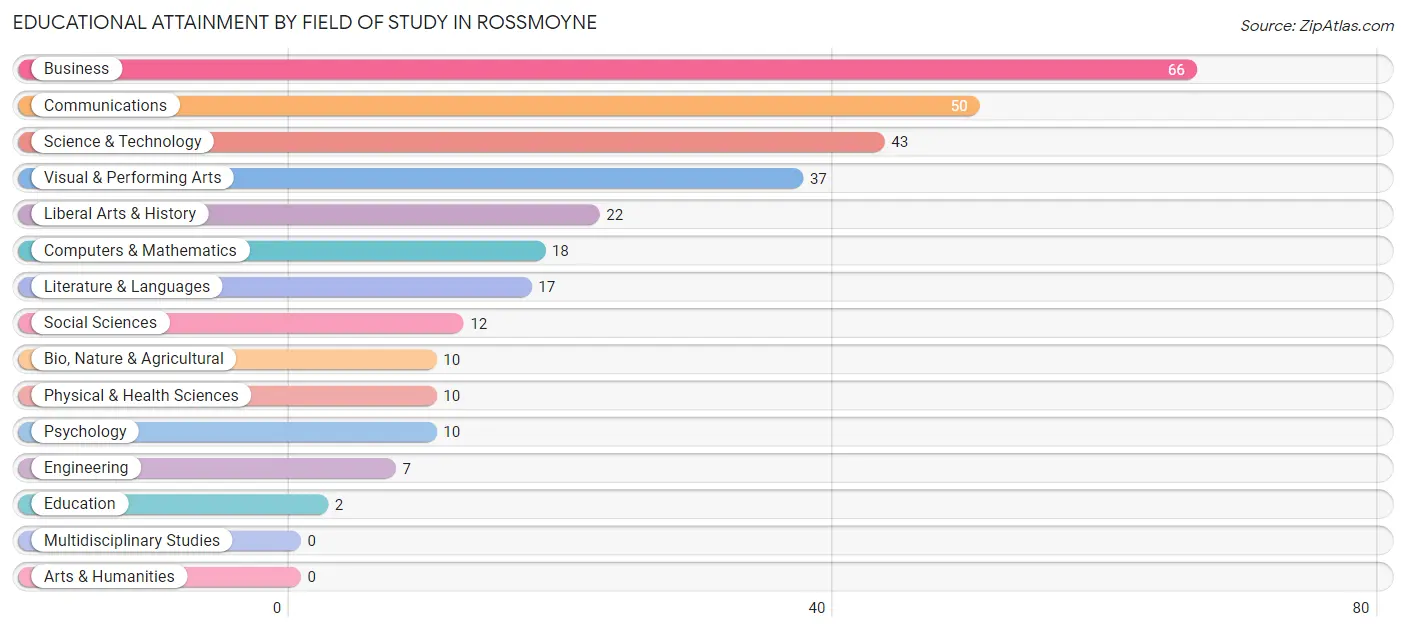
| Field of Study | # Graduates | % Graduates |
| Computers & Mathematics | 18 | 5.9% |
| Bio, Nature & Agricultural | 10 | 3.3% |
| Physical & Health Sciences | 10 | 3.3% |
| Psychology | 10 | 3.3% |
| Social Sciences | 12 | 4.0% |
| Engineering | 7 | 2.3% |
| Multidisciplinary Studies | 0 | 0.0% |
| Science & Technology | 43 | 14.1% |
| Business | 66 | 21.7% |
| Education | 2 | 0.7% |
| Literature & Languages | 17 | 5.6% |
| Liberal Arts & History | 22 | 7.2% |
| Visual & Performing Arts | 37 | 12.2% |
| Communications | 50 | 16.5% |
| Arts & Humanities | 0 | 0.0% |
| Total | 304 | 100.0% |
Transportation & Commute in Rossmoyne
Vehicle Availability by Sex in Rossmoyne
The most prevalent vehicle ownership categories in Rossmoyne are males with 2 vehicles (263, accounting for 60.3%) and females with 2 vehicles (181, making up 54.9%).
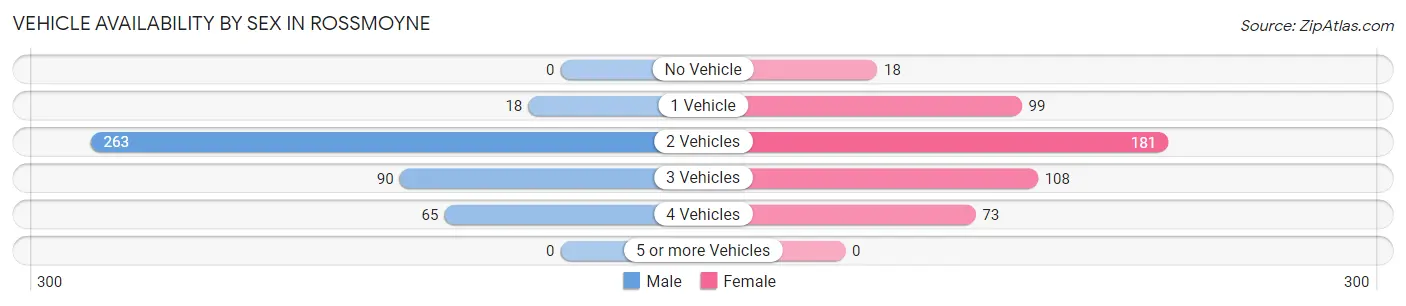
| Vehicles Available | Male | Female |
| No Vehicle | 0 (0.0%) | 18 (3.8%) |
| 1 Vehicle | 18 (4.1%) | 99 (20.7%) |
| 2 Vehicles | 263 (60.3%) | 181 (37.8%) |
| 3 Vehicles | 90 (20.6%) | 108 (22.6%) |
| 4 Vehicles | 65 (14.9%) | 73 (15.2%) |
| 5 or more Vehicles | 0 (0.0%) | 0 (0.0%) |
| Total | 436 (100.0%) | 479 (100.0%) |
Commute Time in Rossmoyne
The most frequently occuring commute durations in Rossmoyne are 5 to 9 minutes (235 commuters, 30.8%), 20 to 24 minutes (170 commuters, 22.3%), and 15 to 19 minutes (120 commuters, 15.8%).
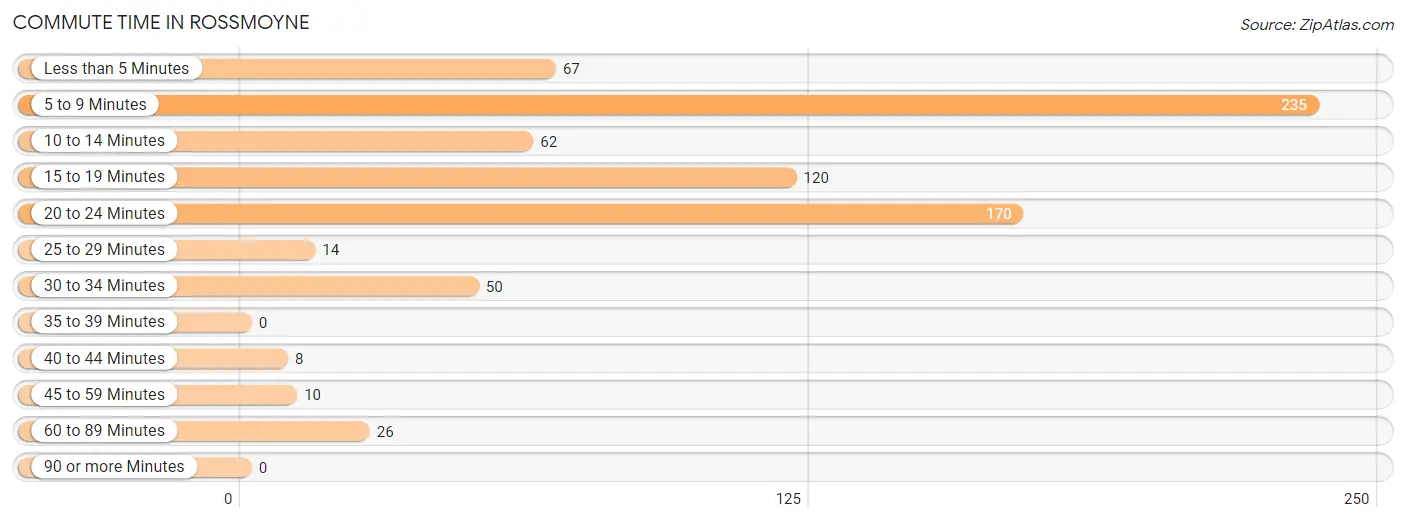
| Commute Time | # Commuters | % Commuters |
| Less than 5 Minutes | 67 | 8.8% |
| 5 to 9 Minutes | 235 | 30.8% |
| 10 to 14 Minutes | 62 | 8.1% |
| 15 to 19 Minutes | 120 | 15.8% |
| 20 to 24 Minutes | 170 | 22.3% |
| 25 to 29 Minutes | 14 | 1.8% |
| 30 to 34 Minutes | 50 | 6.6% |
| 35 to 39 Minutes | 0 | 0.0% |
| 40 to 44 Minutes | 8 | 1.1% |
| 45 to 59 Minutes | 10 | 1.3% |
| 60 to 89 Minutes | 26 | 3.4% |
| 90 or more Minutes | 0 | 0.0% |
Commute Time by Sex in Rossmoyne
The most common commute times in Rossmoyne are 5 to 9 minutes (93 commuters, 25.4%) for males and 5 to 9 minutes (142 commuters, 35.9%) for females.
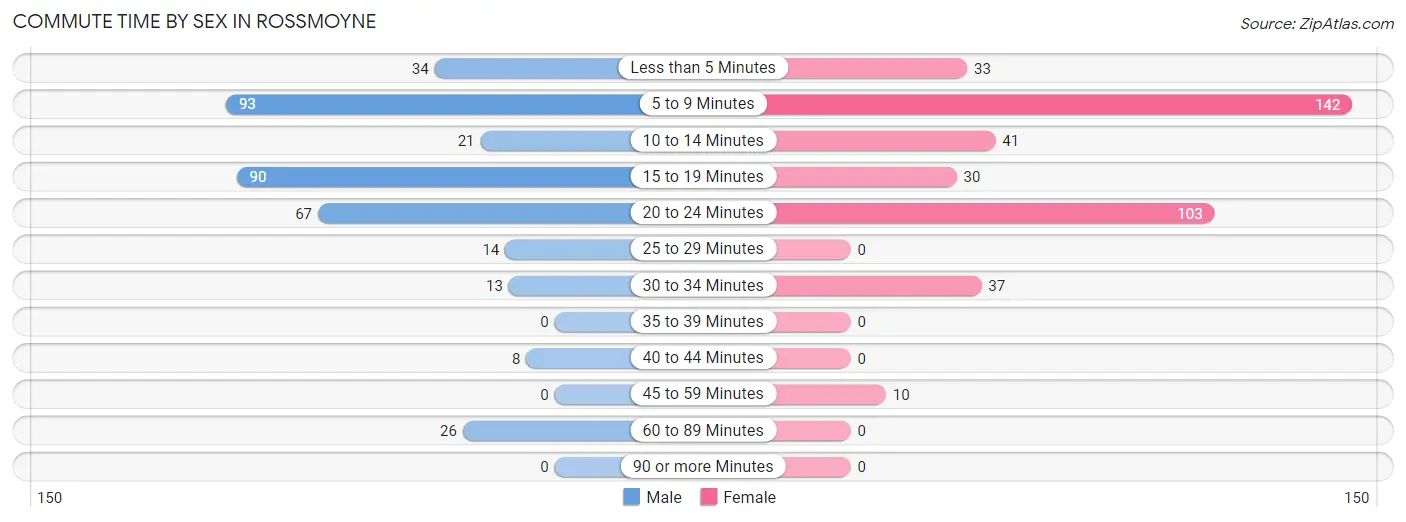
| Commute Time | Male | Female |
| Less than 5 Minutes | 34 (9.3%) | 33 (8.3%) |
| 5 to 9 Minutes | 93 (25.4%) | 142 (35.9%) |
| 10 to 14 Minutes | 21 (5.7%) | 41 (10.3%) |
| 15 to 19 Minutes | 90 (24.6%) | 30 (7.6%) |
| 20 to 24 Minutes | 67 (18.3%) | 103 (26.0%) |
| 25 to 29 Minutes | 14 (3.8%) | 0 (0.0%) |
| 30 to 34 Minutes | 13 (3.5%) | 37 (9.3%) |
| 35 to 39 Minutes | 0 (0.0%) | 0 (0.0%) |
| 40 to 44 Minutes | 8 (2.2%) | 0 (0.0%) |
| 45 to 59 Minutes | 0 (0.0%) | 10 (2.5%) |
| 60 to 89 Minutes | 26 (7.1%) | 0 (0.0%) |
| 90 or more Minutes | 0 (0.0%) | 0 (0.0%) |
Time of Departure to Work by Sex in Rossmoyne
The most frequent times of departure to work in Rossmoyne are 7:00 AM to 7:29 AM (125, 34.2%) for males and 8:00 AM to 8:29 AM (163, 41.2%) for females.
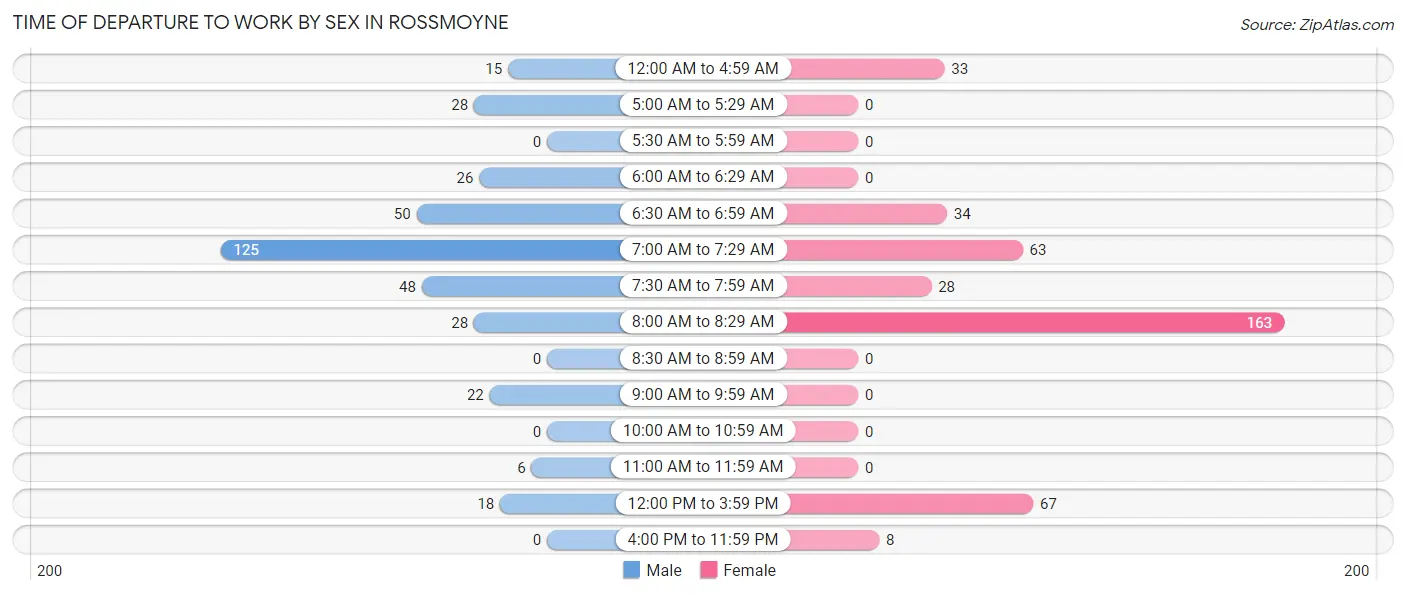
| Time of Departure | Male | Female |
| 12:00 AM to 4:59 AM | 15 (4.1%) | 33 (8.3%) |
| 5:00 AM to 5:29 AM | 28 (7.6%) | 0 (0.0%) |
| 5:30 AM to 5:59 AM | 0 (0.0%) | 0 (0.0%) |
| 6:00 AM to 6:29 AM | 26 (7.1%) | 0 (0.0%) |
| 6:30 AM to 6:59 AM | 50 (13.7%) | 34 (8.6%) |
| 7:00 AM to 7:29 AM | 125 (34.2%) | 63 (15.9%) |
| 7:30 AM to 7:59 AM | 48 (13.1%) | 28 (7.1%) |
| 8:00 AM to 8:29 AM | 28 (7.6%) | 163 (41.2%) |
| 8:30 AM to 8:59 AM | 0 (0.0%) | 0 (0.0%) |
| 9:00 AM to 9:59 AM | 22 (6.0%) | 0 (0.0%) |
| 10:00 AM to 10:59 AM | 0 (0.0%) | 0 (0.0%) |
| 11:00 AM to 11:59 AM | 6 (1.6%) | 0 (0.0%) |
| 12:00 PM to 3:59 PM | 18 (4.9%) | 67 (16.9%) |
| 4:00 PM to 11:59 PM | 0 (0.0%) | 8 (2.0%) |
| Total | 366 (100.0%) | 396 (100.0%) |
Housing Occupancy in Rossmoyne
Occupancy by Ownership in Rossmoyne
Of the total 740 dwellings in Rossmoyne, owner-occupied units account for 506 (68.4%), while renter-occupied units make up 234 (31.6%).
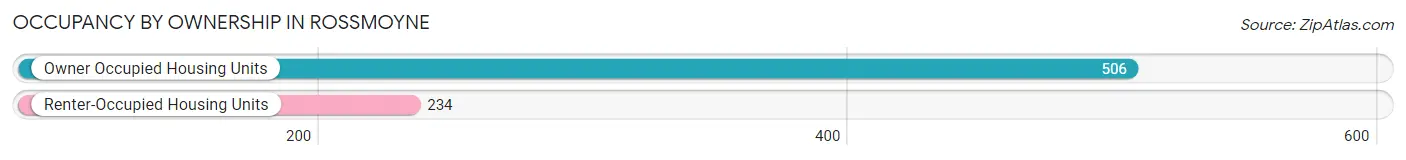
| Occupancy | # Housing Units | % Housing Units |
| Owner Occupied Housing Units | 506 | 68.4% |
| Renter-Occupied Housing Units | 234 | 31.6% |
| Total Occupied Housing Units | 740 | 100.0% |
Occupancy by Household Size in Rossmoyne
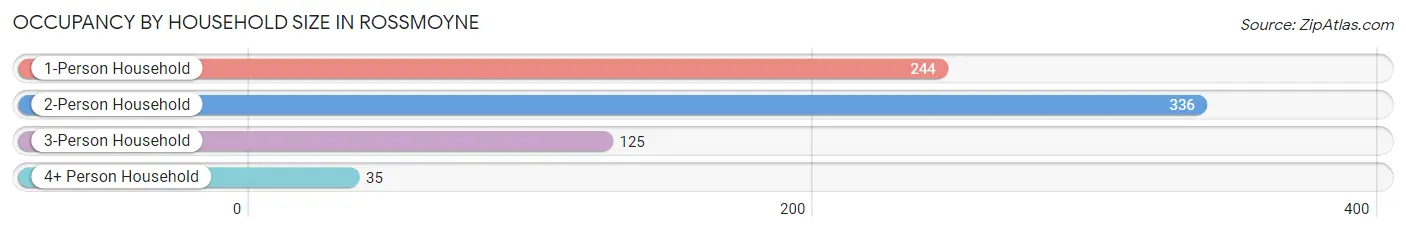
| Household Size | # Housing Units | % Housing Units |
| 1-Person Household | 244 | 33.0% |
| 2-Person Household | 336 | 45.4% |
| 3-Person Household | 125 | 16.9% |
| 4+ Person Household | 35 | 4.7% |
| Total Housing Units | 740 | 100.0% |
Occupancy by Ownership by Household Size in Rossmoyne
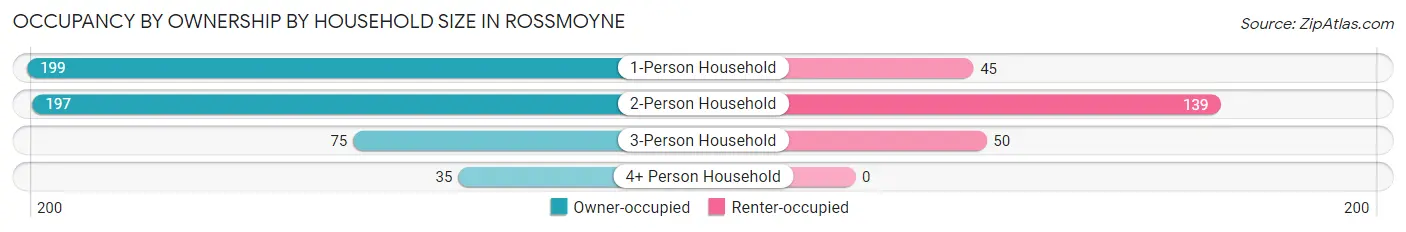
| Household Size | Owner-occupied | Renter-occupied |
| 1-Person Household | 199 (81.6%) | 45 (18.4%) |
| 2-Person Household | 197 (58.6%) | 139 (41.4%) |
| 3-Person Household | 75 (60.0%) | 50 (40.0%) |
| 4+ Person Household | 35 (100.0%) | 0 (0.0%) |
| Total Housing Units | 506 (68.4%) | 234 (31.6%) |
Occupancy by Educational Attainment in Rossmoyne
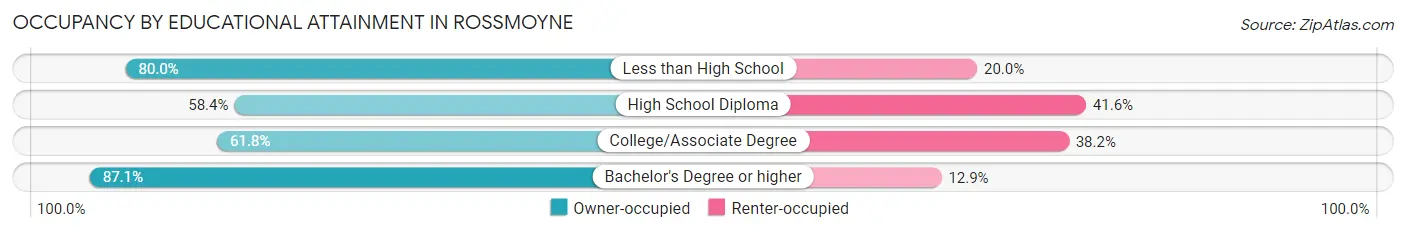
| Household Size | Owner-occupied | Renter-occupied |
| Less than High School | 32 (80.0%) | 8 (20.0%) |
| High School Diploma | 163 (58.4%) | 116 (41.6%) |
| College/Associate Degree | 136 (61.8%) | 84 (38.2%) |
| Bachelor's Degree or higher | 175 (87.1%) | 26 (12.9%) |
Occupancy by Age of Householder in Rossmoyne
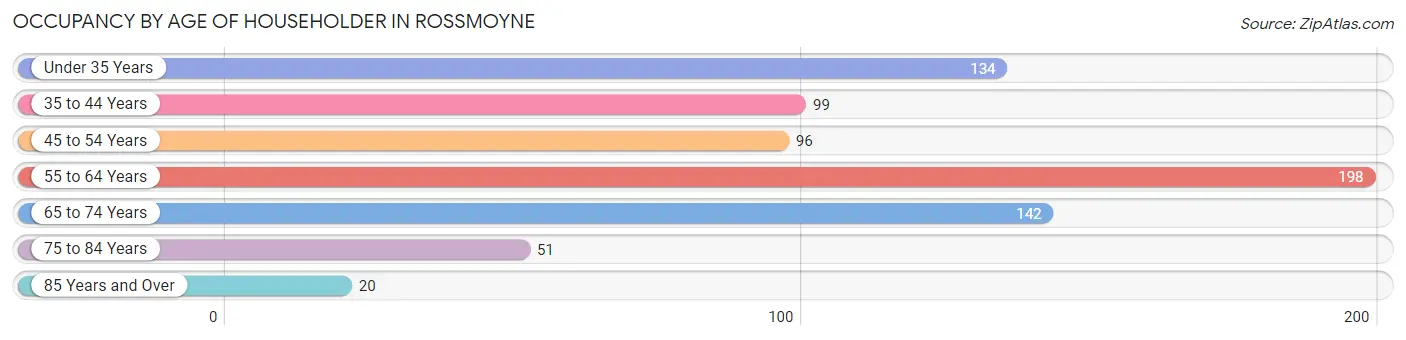
| Age Bracket | # Households | % Households |
| Under 35 Years | 134 | 18.1% |
| 35 to 44 Years | 99 | 13.4% |
| 45 to 54 Years | 96 | 13.0% |
| 55 to 64 Years | 198 | 26.8% |
| 65 to 74 Years | 142 | 19.2% |
| 75 to 84 Years | 51 | 6.9% |
| 85 Years and Over | 20 | 2.7% |
| Total | 740 | 100.0% |
Housing Finances in Rossmoyne
Median Income by Occupancy in Rossmoyne
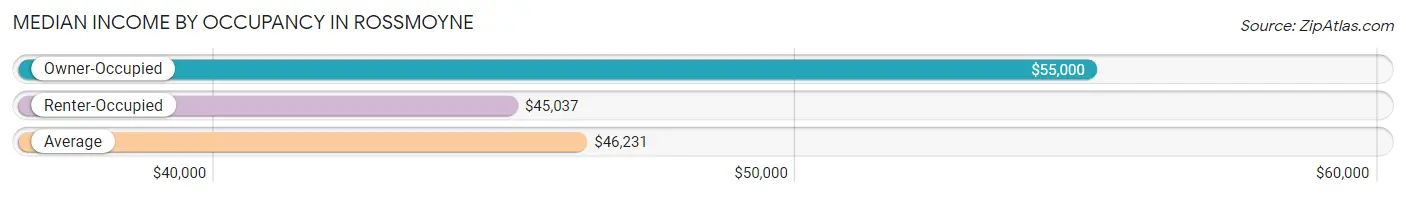
| Occupancy Type | # Households | Median Income |
| Owner-Occupied | 506 (68.4%) | $55,000 |
| Renter-Occupied | 234 (31.6%) | $45,037 |
| Average | 740 (100.0%) | $46,231 |
Occupancy by Householder Income Bracket in Rossmoyne
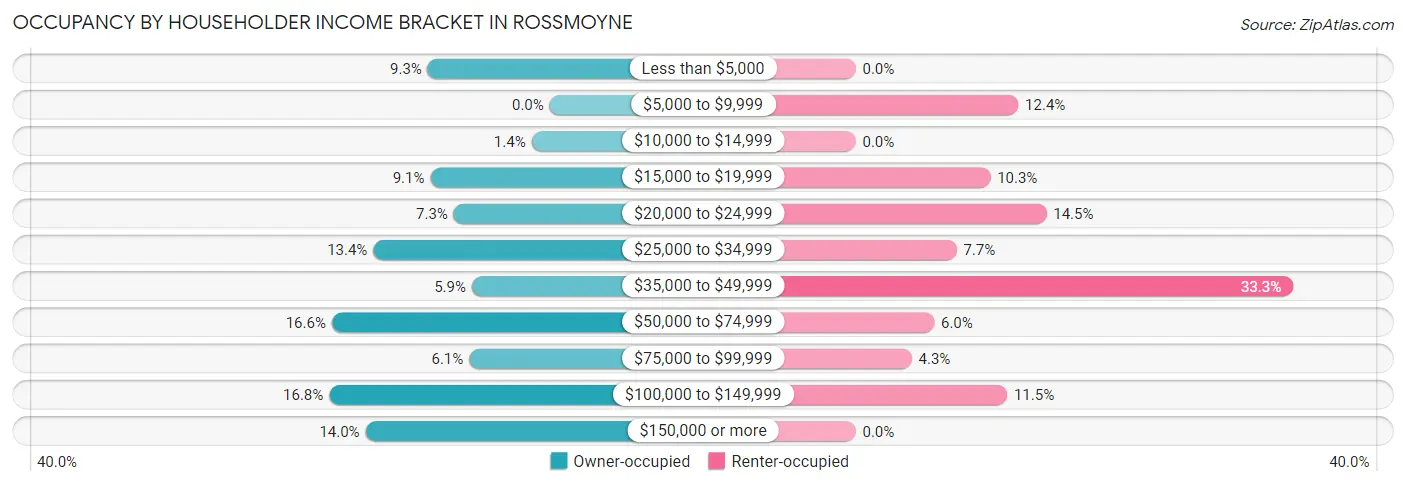
| Income Bracket | Owner-occupied | Renter-occupied |
| Less than $5,000 | 47 (9.3%) | 0 (0.0%) |
| $5,000 to $9,999 | 0 (0.0%) | 29 (12.4%) |
| $10,000 to $14,999 | 7 (1.4%) | 0 (0.0%) |
| $15,000 to $19,999 | 46 (9.1%) | 24 (10.3%) |
| $20,000 to $24,999 | 37 (7.3%) | 34 (14.5%) |
| $25,000 to $34,999 | 68 (13.4%) | 18 (7.7%) |
| $35,000 to $49,999 | 30 (5.9%) | 78 (33.3%) |
| $50,000 to $74,999 | 84 (16.6%) | 14 (6.0%) |
| $75,000 to $99,999 | 31 (6.1%) | 10 (4.3%) |
| $100,000 to $149,999 | 85 (16.8%) | 27 (11.5%) |
| $150,000 or more | 71 (14.0%) | 0 (0.0%) |
| Total | 506 (100.0%) | 234 (100.0%) |
Monthly Housing Cost Tiers in Rossmoyne
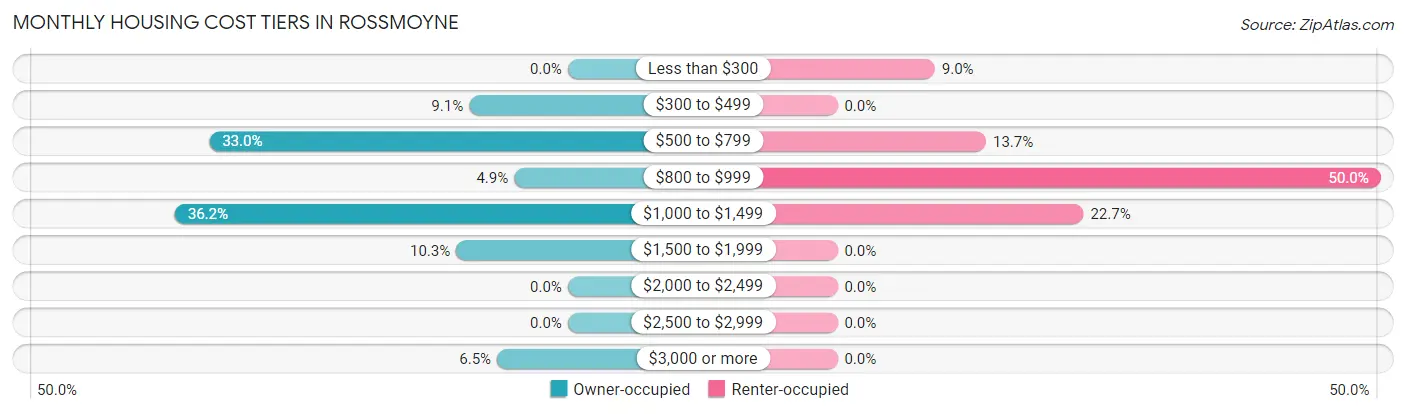
| Monthly Cost | Owner-occupied | Renter-occupied |
| Less than $300 | 0 (0.0%) | 21 (9.0%) |
| $300 to $499 | 46 (9.1%) | 0 (0.0%) |
| $500 to $799 | 167 (33.0%) | 32 (13.7%) |
| $800 to $999 | 25 (4.9%) | 117 (50.0%) |
| $1,000 to $1,499 | 183 (36.2%) | 53 (22.7%) |
| $1,500 to $1,999 | 52 (10.3%) | 0 (0.0%) |
| $2,000 to $2,499 | 0 (0.0%) | 0 (0.0%) |
| $2,500 to $2,999 | 0 (0.0%) | 0 (0.0%) |
| $3,000 or more | 33 (6.5%) | 0 (0.0%) |
| Total | 506 (100.0%) | 234 (100.0%) |
Physical Housing Characteristics in Rossmoyne
Housing Structures in Rossmoyne
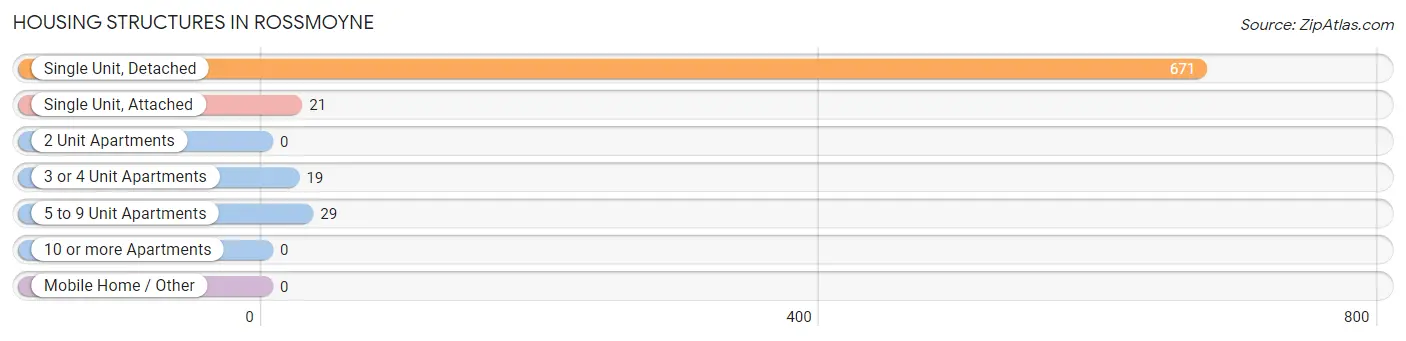
| Structure Type | # Housing Units | % Housing Units |
| Single Unit, Detached | 671 | 90.7% |
| Single Unit, Attached | 21 | 2.8% |
| 2 Unit Apartments | 0 | 0.0% |
| 3 or 4 Unit Apartments | 19 | 2.6% |
| 5 to 9 Unit Apartments | 29 | 3.9% |
| 10 or more Apartments | 0 | 0.0% |
| Mobile Home / Other | 0 | 0.0% |
| Total | 740 | 100.0% |
Housing Structures by Occupancy in Rossmoyne
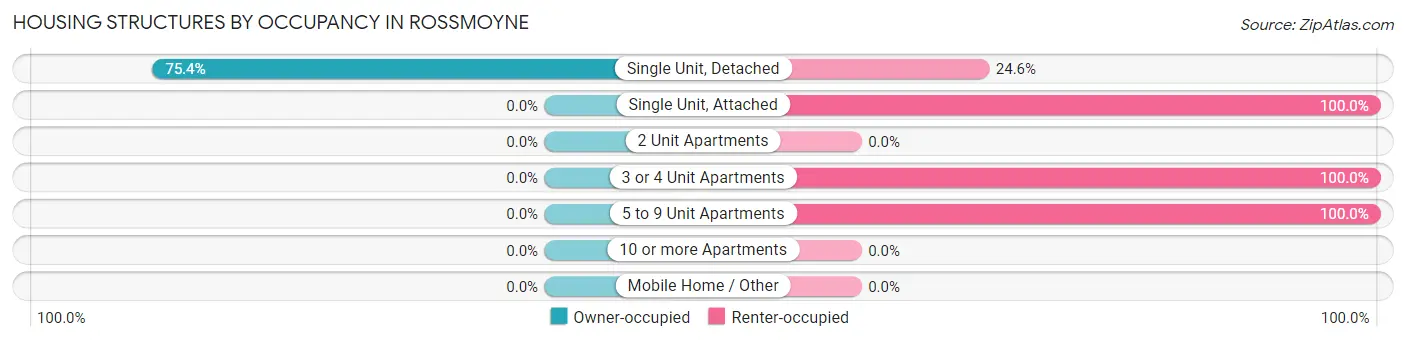
| Structure Type | Owner-occupied | Renter-occupied |
| Single Unit, Detached | 506 (75.4%) | 165 (24.6%) |
| Single Unit, Attached | 0 (0.0%) | 21 (100.0%) |
| 2 Unit Apartments | 0 (0.0%) | 0 (0.0%) |
| 3 or 4 Unit Apartments | 0 (0.0%) | 19 (100.0%) |
| 5 to 9 Unit Apartments | 0 (0.0%) | 29 (100.0%) |
| 10 or more Apartments | 0 (0.0%) | 0 (0.0%) |
| Mobile Home / Other | 0 (0.0%) | 0 (0.0%) |
| Total | 506 (68.4%) | 234 (31.6%) |
Housing Structures by Number of Rooms in Rossmoyne
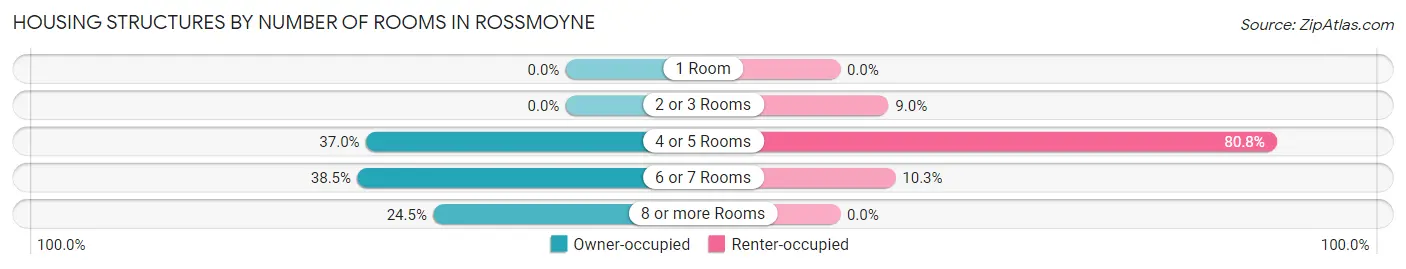
| Number of Rooms | Owner-occupied | Renter-occupied |
| 1 Room | 0 (0.0%) | 0 (0.0%) |
| 2 or 3 Rooms | 0 (0.0%) | 21 (9.0%) |
| 4 or 5 Rooms | 187 (37.0%) | 189 (80.8%) |
| 6 or 7 Rooms | 195 (38.5%) | 24 (10.3%) |
| 8 or more Rooms | 124 (24.5%) | 0 (0.0%) |
| Total | 506 (100.0%) | 234 (100.0%) |
Housing Structure by Heating Type in Rossmoyne
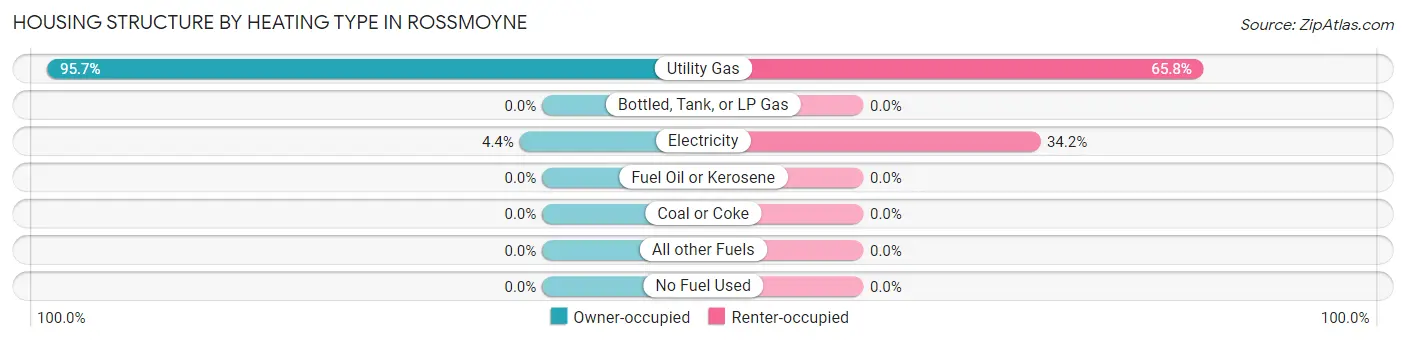
| Heating Type | Owner-occupied | Renter-occupied |
| Utility Gas | 484 (95.7%) | 154 (65.8%) |
| Bottled, Tank, or LP Gas | 0 (0.0%) | 0 (0.0%) |
| Electricity | 22 (4.3%) | 80 (34.2%) |
| Fuel Oil or Kerosene | 0 (0.0%) | 0 (0.0%) |
| Coal or Coke | 0 (0.0%) | 0 (0.0%) |
| All other Fuels | 0 (0.0%) | 0 (0.0%) |
| No Fuel Used | 0 (0.0%) | 0 (0.0%) |
| Total | 506 (100.0%) | 234 (100.0%) |
Household Vehicle Usage in Rossmoyne
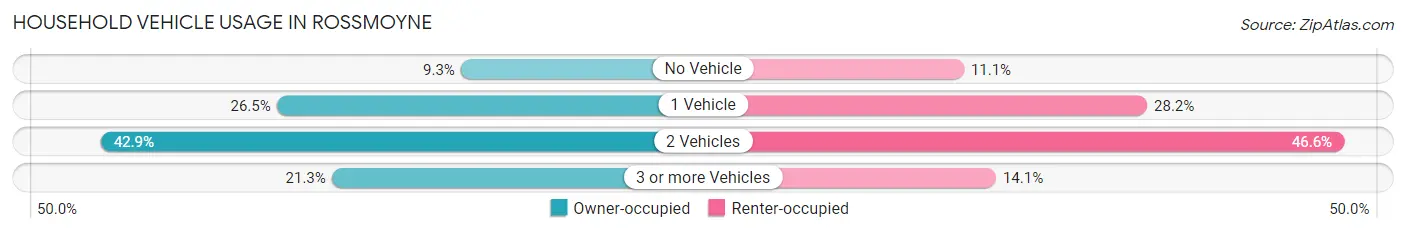
| Vehicles per Household | Owner-occupied | Renter-occupied |
| No Vehicle | 47 (9.3%) | 26 (11.1%) |
| 1 Vehicle | 134 (26.5%) | 66 (28.2%) |
| 2 Vehicles | 217 (42.9%) | 109 (46.6%) |
| 3 or more Vehicles | 108 (21.3%) | 33 (14.1%) |
| Total | 506 (100.0%) | 234 (100.0%) |
Real Estate & Mortgages in Rossmoyne
Real Estate and Mortgage Overview in Rossmoyne
| Characteristic | Without Mortgage | With Mortgage |
| Housing Units | 168 | 338 |
| Median Property Value | $127,300 | $158,900 |
| Median Household Income | $36,094 | $56 |
| Monthly Housing Costs | $563 | $33 |
| Real Estate Taxes | $3,263 | $0 |
Property Value by Mortgage Status in Rossmoyne
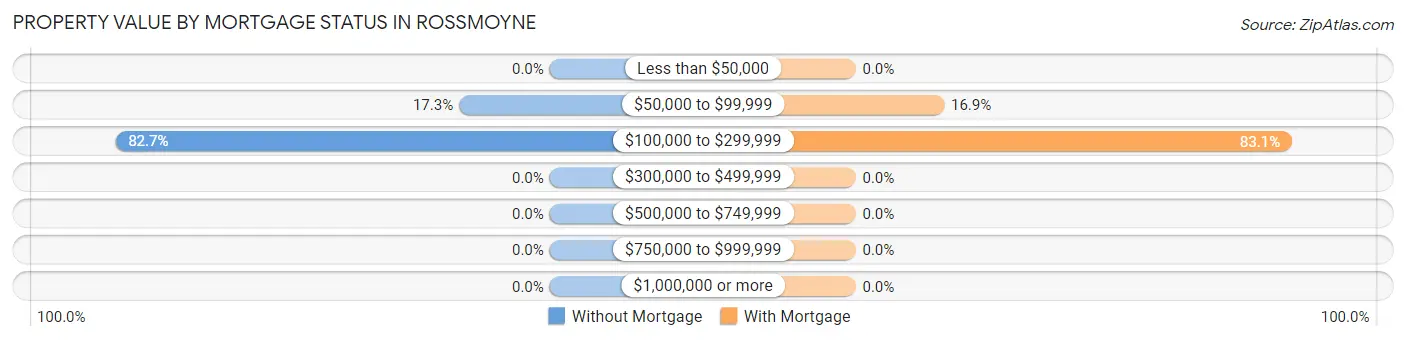
| Property Value | Without Mortgage | With Mortgage |
| Less than $50,000 | 0 (0.0%) | 0 (0.0%) |
| $50,000 to $99,999 | 29 (17.3%) | 57 (16.9%) |
| $100,000 to $299,999 | 139 (82.7%) | 281 (83.1%) |
| $300,000 to $499,999 | 0 (0.0%) | 0 (0.0%) |
| $500,000 to $749,999 | 0 (0.0%) | 0 (0.0%) |
| $750,000 to $999,999 | 0 (0.0%) | 0 (0.0%) |
| $1,000,000 or more | 0 (0.0%) | 0 (0.0%) |
| Total | 168 (100.0%) | 338 (100.0%) |
Household Income by Mortgage Status in Rossmoyne
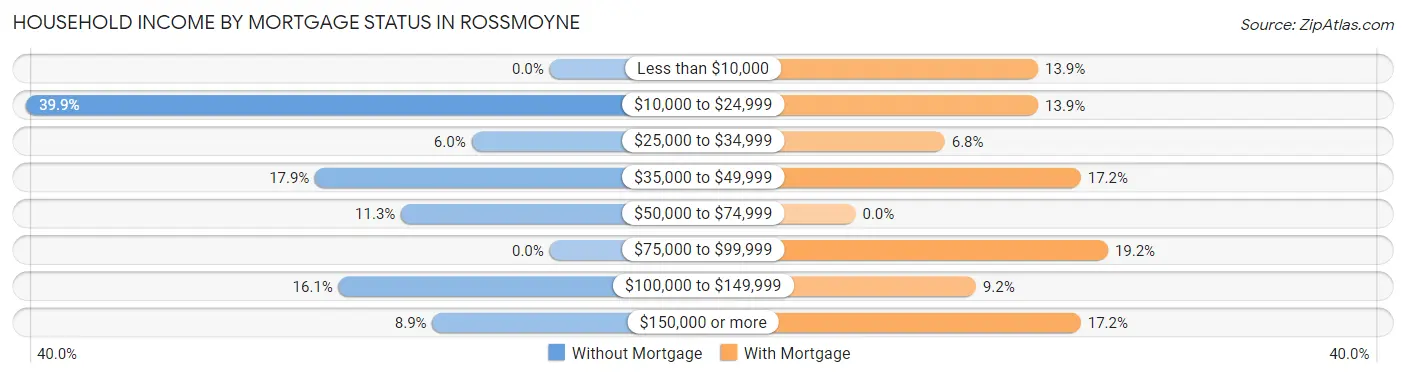
| Household Income | Without Mortgage | With Mortgage |
| Less than $10,000 | 0 (0.0%) | 47 (13.9%) |
| $10,000 to $24,999 | 67 (39.9%) | 47 (13.9%) |
| $25,000 to $34,999 | 10 (5.9%) | 23 (6.8%) |
| $35,000 to $49,999 | 30 (17.9%) | 58 (17.2%) |
| $50,000 to $74,999 | 19 (11.3%) | 0 (0.0%) |
| $75,000 to $99,999 | 0 (0.0%) | 65 (19.2%) |
| $100,000 to $149,999 | 27 (16.1%) | 31 (9.2%) |
| $150,000 or more | 15 (8.9%) | 58 (17.2%) |
| Total | 168 (100.0%) | 338 (100.0%) |
Property Value to Household Income Ratio in Rossmoyne
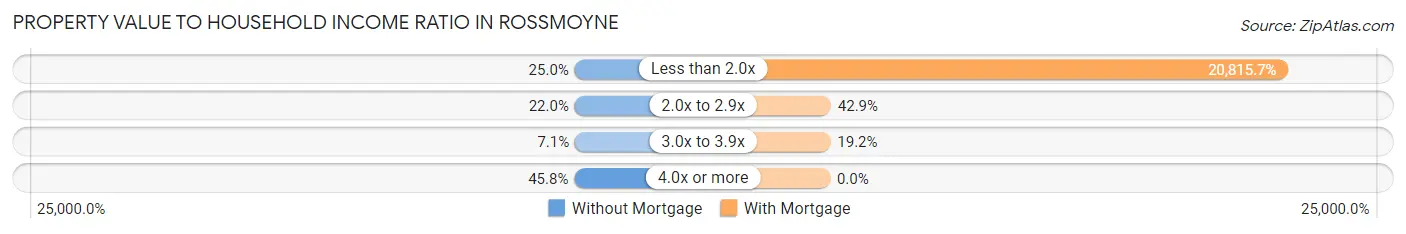
| Value-to-Income Ratio | Without Mortgage | With Mortgage |
| Less than 2.0x | 42 (25.0%) | 70,357 (20,815.7%) |
| 2.0x to 2.9x | 37 (22.0%) | 145 (42.9%) |
| 3.0x to 3.9x | 12 (7.1%) | 65 (19.2%) |
| 4.0x or more | 77 (45.8%) | 0 (0.0%) |
| Total | 168 (100.0%) | 338 (100.0%) |
Real Estate Taxes by Mortgage Status in Rossmoyne
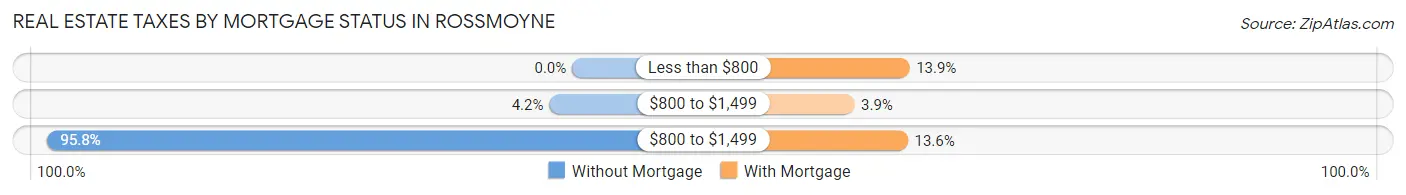
| Property Taxes | Without Mortgage | With Mortgage |
| Less than $800 | 0 (0.0%) | 47 (13.9%) |
| $800 to $1,499 | 7 (4.2%) | 13 (3.8%) |
| $800 to $1,499 | 161 (95.8%) | 46 (13.6%) |
| Total | 168 (100.0%) | 338 (100.0%) |
Health & Disability in Rossmoyne
Health Insurance Coverage by Age in Rossmoyne
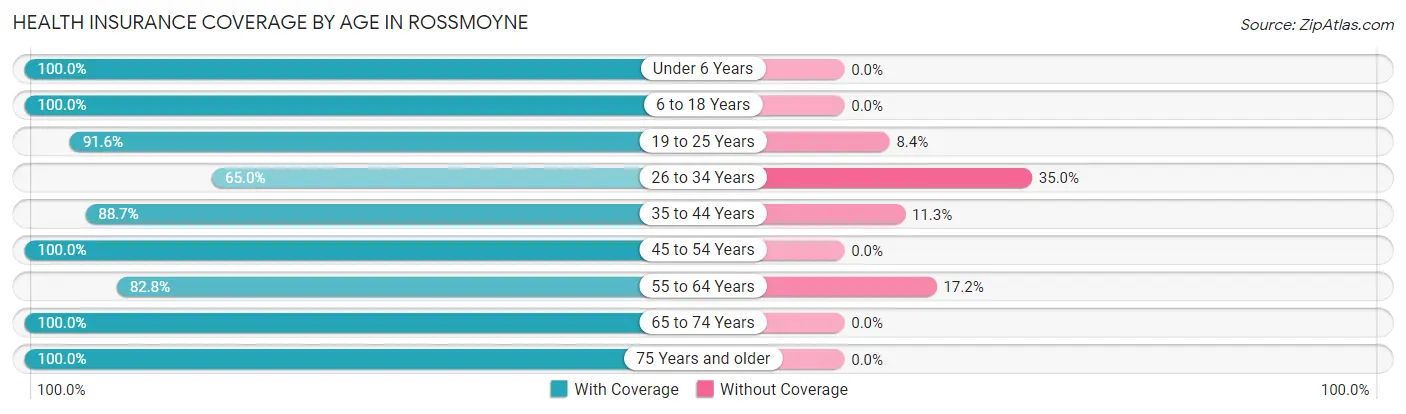
| Age Bracket | With Coverage | Without Coverage |
| Under 6 Years | 34 (100.0%) | 0 (0.0%) |
| 6 to 18 Years | 279 (100.0%) | 0 (0.0%) |
| 19 to 25 Years | 87 (91.6%) | 8 (8.4%) |
| 26 to 34 Years | 158 (65.0%) | 85 (35.0%) |
| 35 to 44 Years | 141 (88.7%) | 18 (11.3%) |
| 45 to 54 Years | 147 (100.0%) | 0 (0.0%) |
| 55 to 64 Years | 265 (82.8%) | 55 (17.2%) |
| 65 to 74 Years | 201 (100.0%) | 0 (0.0%) |
| 75 Years and older | 84 (100.0%) | 0 (0.0%) |
| Total | 1,396 (89.4%) | 166 (10.6%) |
Health Insurance Coverage by Citizenship Status in Rossmoyne
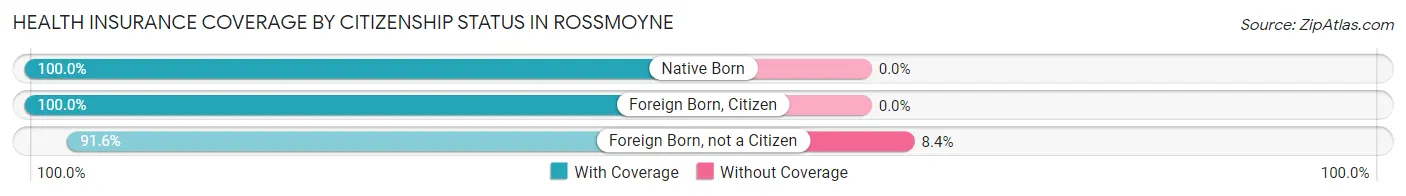
| Citizenship Status | With Coverage | Without Coverage |
| Native Born | 34 (100.0%) | 0 (0.0%) |
| Foreign Born, Citizen | 279 (100.0%) | 0 (0.0%) |
| Foreign Born, not a Citizen | 87 (91.6%) | 8 (8.4%) |
Health Insurance Coverage by Household Income in Rossmoyne
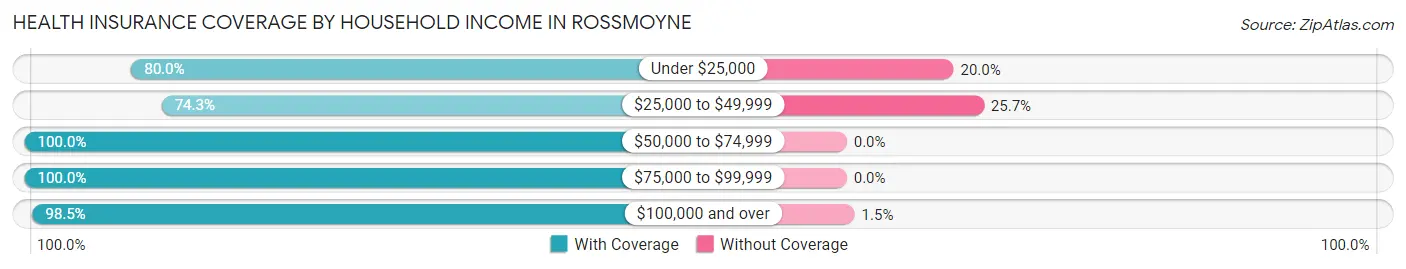
| Household Income | With Coverage | Without Coverage |
| Under $25,000 | 220 (80.0%) | 55 (20.0%) |
| $25,000 to $49,999 | 298 (74.3%) | 103 (25.7%) |
| $50,000 to $74,999 | 230 (100.0%) | 0 (0.0%) |
| $75,000 to $99,999 | 109 (100.0%) | 0 (0.0%) |
| $100,000 and over | 535 (98.5%) | 8 (1.5%) |
Public vs Private Health Insurance Coverage by Age in Rossmoyne
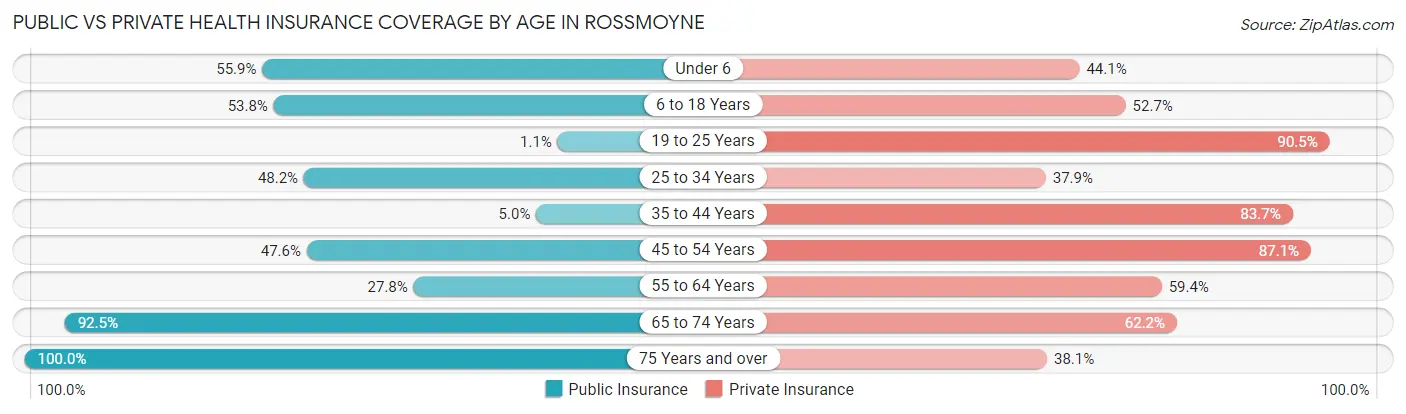
| Age Bracket | Public Insurance | Private Insurance |
| Under 6 | 19 (55.9%) | 15 (44.1%) |
| 6 to 18 Years | 150 (53.8%) | 147 (52.7%) |
| 19 to 25 Years | 1 (1.1%) | 86 (90.5%) |
| 25 to 34 Years | 117 (48.1%) | 92 (37.9%) |
| 35 to 44 Years | 8 (5.0%) | 133 (83.7%) |
| 45 to 54 Years | 70 (47.6%) | 128 (87.1%) |
| 55 to 64 Years | 89 (27.8%) | 190 (59.4%) |
| 65 to 74 Years | 186 (92.5%) | 125 (62.2%) |
| 75 Years and over | 84 (100.0%) | 32 (38.1%) |
| Total | 724 (46.4%) | 948 (60.7%) |
Disability Status by Sex by Age in Rossmoyne

| Age Bracket | Male | Female |
| Under 5 Years | 0 (0.0%) | 0 (0.0%) |
| 5 to 17 Years | 0 (0.0%) | 47 (35.3%) |
| 18 to 34 Years | 0 (0.0%) | 0 (0.0%) |
| 35 to 64 Years | 48 (14.2%) | 62 (21.6%) |
| 65 to 74 Years | 0 (0.0%) | 0 (0.0%) |
| 75 Years and over | 10 (58.8%) | 2 (3.0%) |
Disability Class by Sex by Age in Rossmoyne
Disability Class: Hearing Difficulty
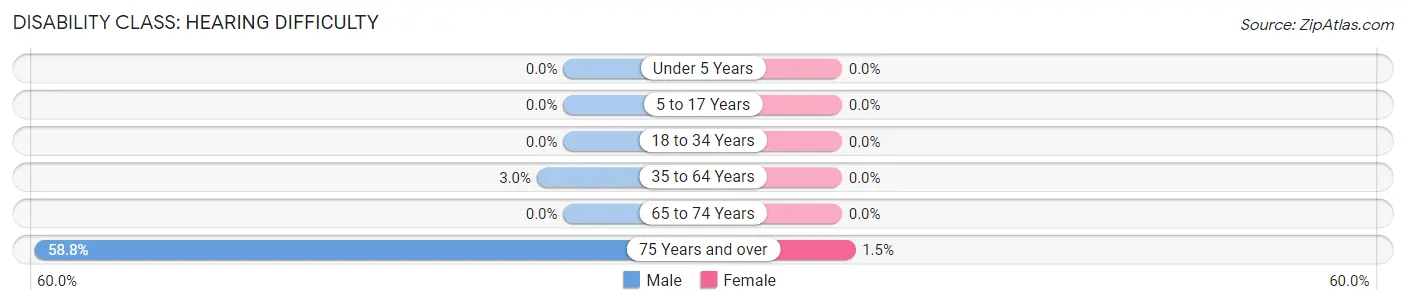
| Age Bracket | Male | Female |
| Under 5 Years | 0 (0.0%) | 0 (0.0%) |
| 5 to 17 Years | 0 (0.0%) | 0 (0.0%) |
| 18 to 34 Years | 0 (0.0%) | 0 (0.0%) |
| 35 to 64 Years | 10 (2.9%) | 0 (0.0%) |
| 65 to 74 Years | 0 (0.0%) | 0 (0.0%) |
| 75 Years and over | 10 (58.8%) | 1 (1.5%) |
Disability Class: Vision Difficulty
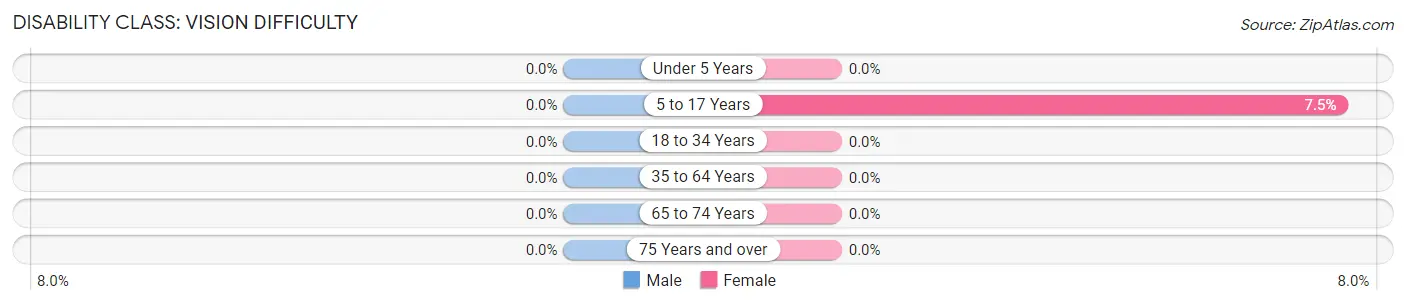
| Age Bracket | Male | Female |
| Under 5 Years | 0 (0.0%) | 0 (0.0%) |
| 5 to 17 Years | 0 (0.0%) | 10 (7.5%) |
| 18 to 34 Years | 0 (0.0%) | 0 (0.0%) |
| 35 to 64 Years | 0 (0.0%) | 0 (0.0%) |
| 65 to 74 Years | 0 (0.0%) | 0 (0.0%) |
| 75 Years and over | 0 (0.0%) | 0 (0.0%) |
Disability Class: Cognitive Difficulty
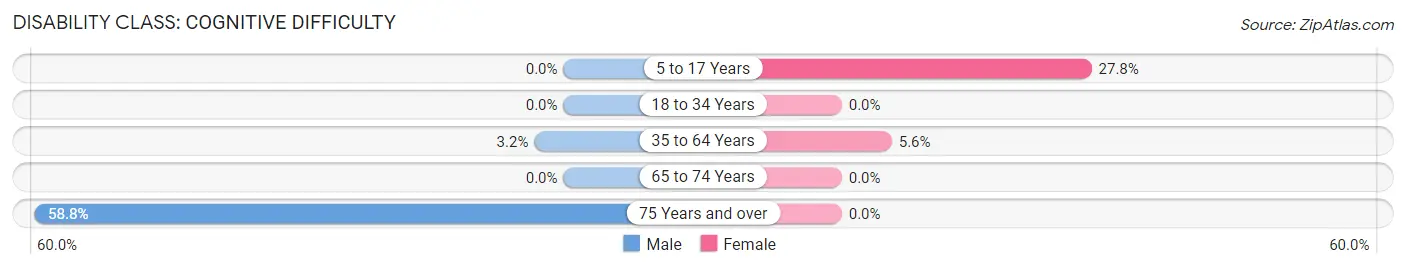
| Age Bracket | Male | Female |
| 5 to 17 Years | 0 (0.0%) | 37 (27.8%) |
| 18 to 34 Years | 0 (0.0%) | 0 (0.0%) |
| 35 to 64 Years | 11 (3.2%) | 16 (5.6%) |
| 65 to 74 Years | 0 (0.0%) | 0 (0.0%) |
| 75 Years and over | 10 (58.8%) | 0 (0.0%) |
Disability Class: Ambulatory Difficulty
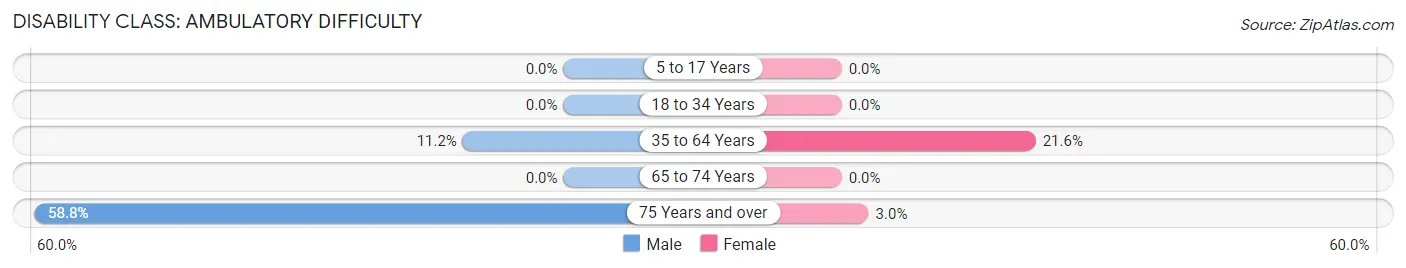
| Age Bracket | Male | Female |
| 5 to 17 Years | 0 (0.0%) | 0 (0.0%) |
| 18 to 34 Years | 0 (0.0%) | 0 (0.0%) |
| 35 to 64 Years | 38 (11.2%) | 62 (21.6%) |
| 65 to 74 Years | 0 (0.0%) | 0 (0.0%) |
| 75 Years and over | 10 (58.8%) | 2 (3.0%) |
Disability Class: Self-Care Difficulty
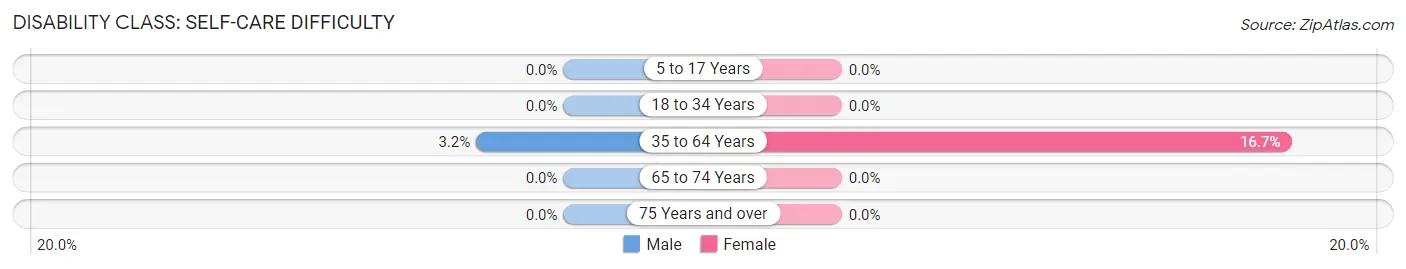
| Age Bracket | Male | Female |
| 5 to 17 Years | 0 (0.0%) | 0 (0.0%) |
| 18 to 34 Years | 0 (0.0%) | 0 (0.0%) |
| 35 to 64 Years | 11 (3.2%) | 48 (16.7%) |
| 65 to 74 Years | 0 (0.0%) | 0 (0.0%) |
| 75 Years and over | 0 (0.0%) | 0 (0.0%) |
Technology Access in Rossmoyne
Computing Device Access in Rossmoyne
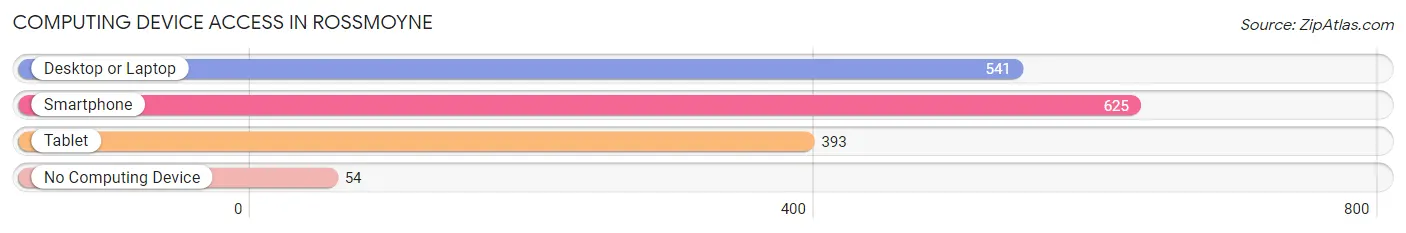
| Device Type | # Households | % Households |
| Desktop or Laptop | 541 | 73.1% |
| Smartphone | 625 | 84.5% |
| Tablet | 393 | 53.1% |
| No Computing Device | 54 | 7.3% |
| Total | 740 | 100.0% |
Internet Access in Rossmoyne
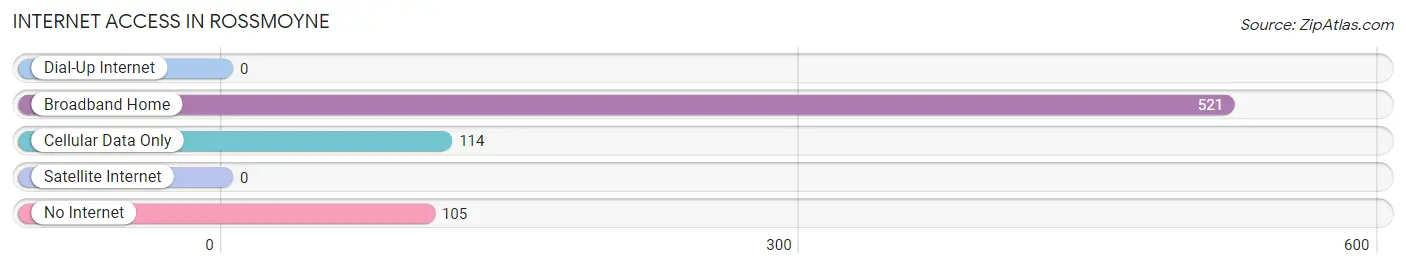
| Internet Type | # Households | % Households |
| Dial-Up Internet | 0 | 0.0% |
| Broadband Home | 521 | 70.4% |
| Cellular Data Only | 114 | 15.4% |
| Satellite Internet | 0 | 0.0% |
| No Internet | 105 | 14.2% |
| Total | 740 | 100.0% |
Rossmoyne Summary
Rossmoyne is a small unincorporated community located in Franklin County, Ohio. It is situated in the northwest corner of the county, just south of the city of Columbus. The population of Rossmoyne was estimated to be 1,845 in 2019.
History
The area that is now Rossmoyne was first settled in the early 1800s by German immigrants. The community was originally known as “Rossmoyne” after the Rossmoyne family, who were among the first settlers. The name was officially adopted in 1837 when the post office was established.
In the late 1800s, Rossmoyne was a thriving agricultural community. The area was known for its dairy farms and orchards. The Rossmoyne Creamery was established in 1891 and was a major employer in the area.
In the early 1900s, Rossmoyne began to experience a population boom as people moved to the area from other parts of Ohio and the Midwest. This growth was spurred by the development of the Rossmoyne Country Club in 1910. The club was a popular destination for golfers and other outdoor enthusiasts.
In the mid-1900s, Rossmoyne began to experience a decline in population as people moved away from the area. This decline was due to the decline of the dairy industry and the closure of the Rossmoyne Creamery in the 1950s.
Geography
Rossmoyne is located in the northwest corner of Franklin County, Ohio. It is situated just south of the city of Columbus. The community is bordered by the Scioto River to the east and the Olentangy River to the west.
The terrain of Rossmoyne is mostly flat with some rolling hills. The area is mostly rural with some residential and commercial development.
Economy
The economy of Rossmoyne is largely based on agriculture and tourism. The area is home to several farms, including dairy farms, orchards, and vegetable farms.
The Rossmoyne Country Club is a popular destination for golfers and other outdoor enthusiasts. The club offers a variety of activities, including golf, tennis, swimming, and more.
The area is also home to several small businesses, including restaurants, retail stores, and professional services.
Demographics
The population of Rossmoyne was estimated to be 1,845 in 2019. The population is mostly white (94.3%) with a small percentage of African Americans (2.2%) and Asians (1.2%). The median household income is $63,945 and the median home value is $220,000.
The majority of the population 90 3 is over the age of 18 The median age is 43 3 years
Conclusion
Rossmoyne is a small unincorporated community located in Franklin County, Ohio. It is situated in the northwest corner of the county, just south of the city of Columbus. The population of Rossmoyne was estimated to be 1,845 in 2019. The economy of Rossmoyne is largely based on agriculture and tourism. The majority of the population is white (94.3%) with a small percentage of African Americans (2.2%) and Asians (1.2%). The median household income is $63,945 and the median home value is $220,000.
Common Questions
What is the Total Population of Rossmoyne?
Total Population of Rossmoyne is 1,562.
What is the Total Male Population of Rossmoyne?
Total Male Population of Rossmoyne is 681.
What is the Total Female Population of Rossmoyne?
Total Female Population of Rossmoyne is 881.
What is the Ratio of Males per 100 Females in Rossmoyne?
There are 77.30 Males per 100 Females in Rossmoyne.
What is the Ratio of Females per 100 Males in Rossmoyne?
There are 129.37 Females per 100 Males in Rossmoyne.
What is the Median Population Age in Rossmoyne?
Median Population Age in Rossmoyne is 43.3 Years.
What is the Average Family Size in Rossmoyne
Average Family Size in Rossmoyne is 2.7 People.
What is the Average Household Size in Rossmoyne
Average Household Size in Rossmoyne is 2.1 People.
What is Per Capita Income in Rossmoyne?
Per Capita income in Rossmoyne is $31,345.
What is the Median Family Income in Rossmoyne?
Median Family Income in Rossmoyne is $70,491.
What is the Median Household income in Rossmoyne?
Median Household Income in Rossmoyne is $46,231.
What is Income or Wage Gap in Rossmoyne?
Income or Wage Gap in Rossmoyne is 21.5%.
Women in Rossmoyne earn 78.5 cents for every dollar earned by a man.
What is Inequality or Gini Index in Rossmoyne?
Inequality or Gini Index in Rossmoyne is 0.47.
How Large is the Labor Force in Rossmoyne?
There are 959 People in the Labor Forcein in Rossmoyne.
What is the Percentage of People in the Labor Force in Rossmoyne?
70.8% of People are in the Labor Force in Rossmoyne.
What is the Unemployment Rate in Rossmoyne?
Unemployment Rate in Rossmoyne is 3.3%.