Roaming Shores, OH
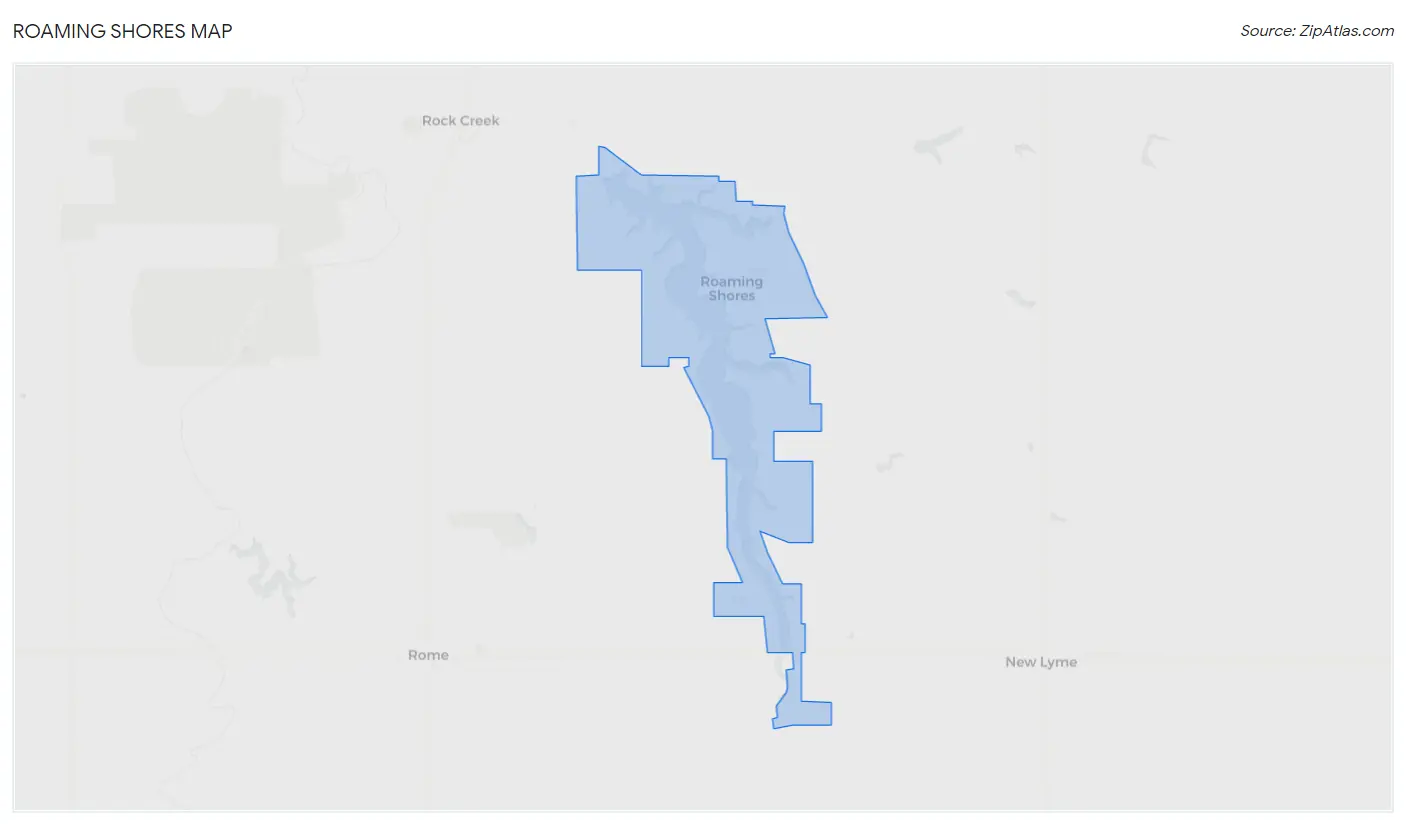
Roaming Shores Map
Roaming Shores Overview
1,957
TOTAL POPULATION
1,037
MALE POPULATION
920
FEMALE POPULATION
112.72
MALES / 100 FEMALES
88.72
FEMALES / 100 MALES
47.1
MEDIAN AGE
3.1
AVG FAMILY SIZE
2.6
AVG HOUSEHOLD SIZE
$44,546
PER CAPITA INCOME
$113,224
AVG FAMILY INCOME
$93,452
AVG HOUSEHOLD INCOME
51.1%
WAGE / INCOME GAP [ % ]
48.9¢/ $1
WAGE / INCOME GAP [ $ ]
0.38
INEQUALITY / GINI INDEX
1,029
LABOR FORCE [ PEOPLE ]
65.6%
PERCENT IN LABOR FORCE
1.7%
UNEMPLOYMENT RATE
Roaming Shores Area Codes
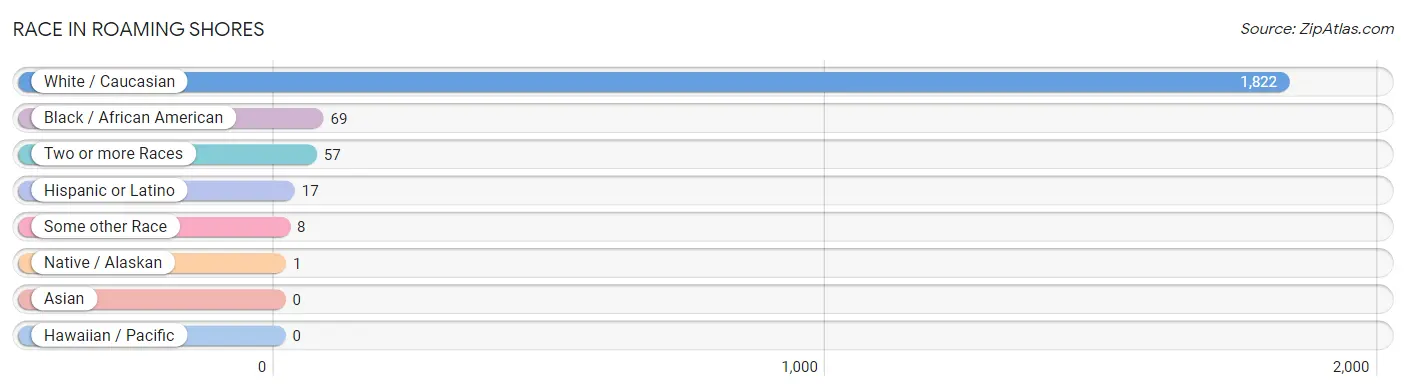
Race in Roaming Shores
The most populous races in Roaming Shores are White / Caucasian (1,822 | 93.1%), Black / African American (69 | 3.5%), and Two or more Races (57 | 2.9%).
| Race | # Population | % Population |
| Asian | 0 | 0.0% |
| Black / African American | 69 | 3.5% |
| Hawaiian / Pacific | 0 | 0.0% |
| Hispanic or Latino | 17 | 0.9% |
| Native / Alaskan | 1 | 0.1% |
| White / Caucasian | 1,822 | 93.1% |
| Two or more Races | 57 | 2.9% |
| Some other Race | 8 | 0.4% |
| Total | 1,957 | 100.0% |
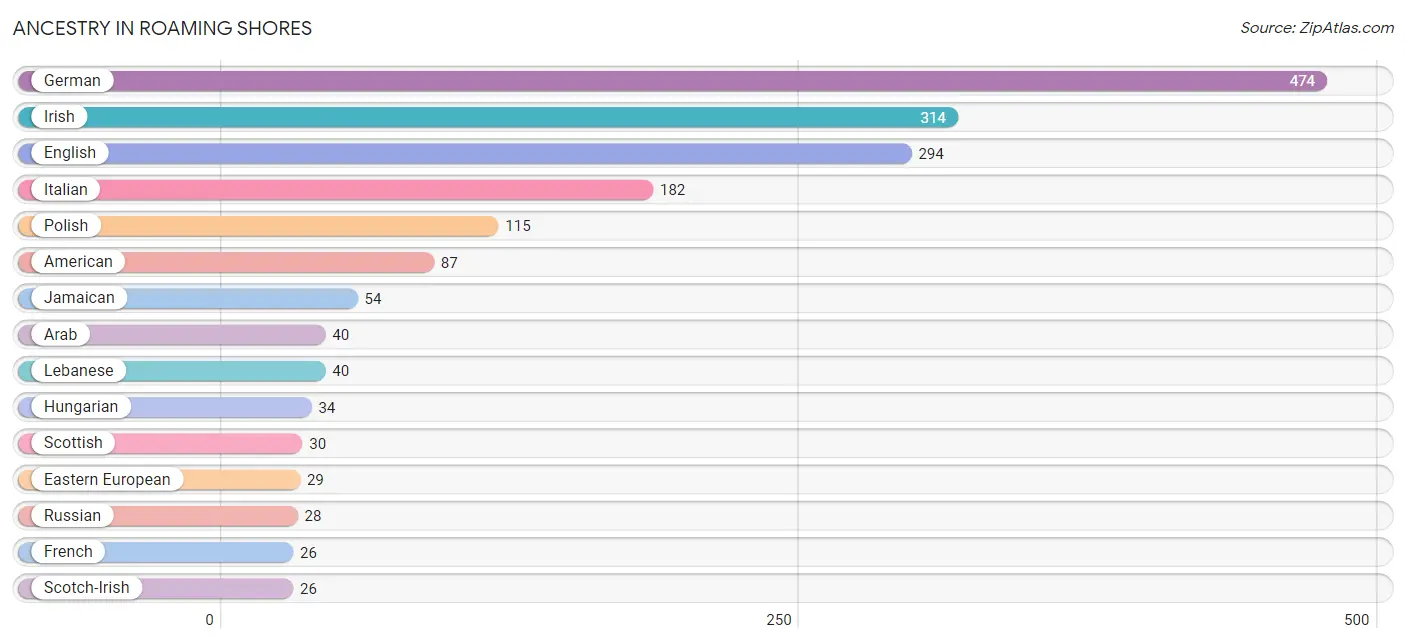
Ancestry in Roaming Shores
The most populous ancestries reported in Roaming Shores are German (474 | 24.2%), Irish (314 | 16.0%), English (294 | 15.0%), Italian (182 | 9.3%), and Polish (115 | 5.9%), together accounting for 70.5% of all Roaming Shores residents.
| Ancestry | # Population | % Population |
| American | 87 | 4.4% |
| Arab | 40 | 2.0% |
| Austrian | 4 | 0.2% |
| Croatian | 15 | 0.8% |
| Czech | 24 | 1.2% |
| Danish | 3 | 0.2% |
| Dutch | 8 | 0.4% |
| Eastern European | 29 | 1.5% |
| English | 294 | 15.0% |
| European | 25 | 1.3% |
| Finnish | 11 | 0.6% |
| French | 26 | 1.3% |
| French Canadian | 8 | 0.4% |
| German | 474 | 24.2% |
| German Russian | 18 | 0.9% |
| Hungarian | 34 | 1.7% |
| Irish | 314 | 16.0% |
| Italian | 182 | 9.3% |
| Jamaican | 54 | 2.8% |
| Latvian | 4 | 0.2% |
| Lebanese | 40 | 2.0% |
| Mexican | 6 | 0.3% |
| Norwegian | 5 | 0.3% |
| Pennsylvania German | 3 | 0.2% |
| Polish | 115 | 5.9% |
| Puerto Rican | 11 | 0.6% |
| Russian | 28 | 1.4% |
| Scotch-Irish | 26 | 1.3% |
| Scottish | 30 | 1.5% |
| Serbian | 5 | 0.3% |
| Slovak | 10 | 0.5% |
| Slovene | 17 | 0.9% |
| Swedish | 12 | 0.6% |
| Ukrainian | 3 | 0.2% |
| Welsh | 11 | 0.6% | View All 35 Rows |
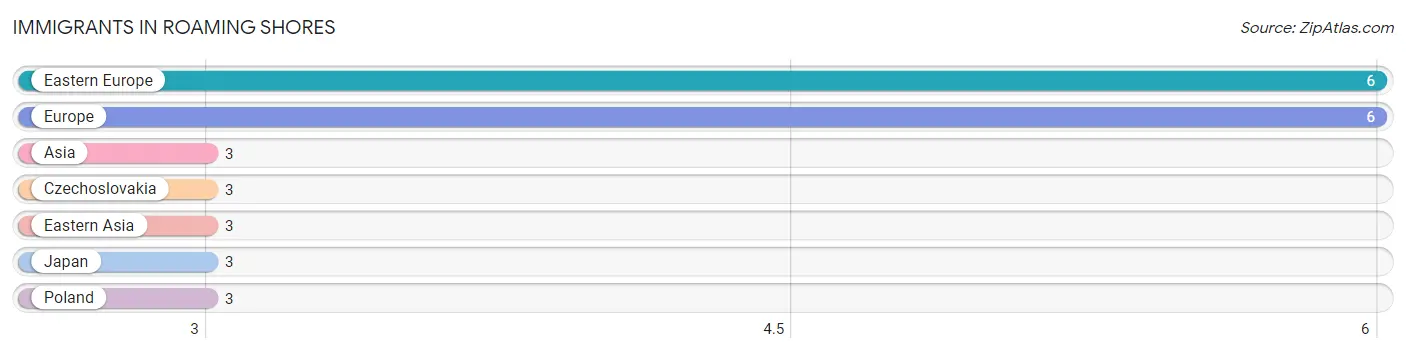
Immigrants in Roaming Shores
The most numerous immigrant groups reported in Roaming Shores came from Eastern Europe (6 | 0.3%), Europe (6 | 0.3%), Asia (3 | 0.2%), Czechoslovakia (3 | 0.2%), and Eastern Asia (3 | 0.2%), together accounting for 1.1% of all Roaming Shores residents.
| Immigration Origin | # Population | % Population |
| Asia | 3 | 0.2% |
| Czechoslovakia | 3 | 0.2% |
| Eastern Asia | 3 | 0.2% |
| Eastern Europe | 6 | 0.3% |
| Europe | 6 | 0.3% |
| Japan | 3 | 0.2% |
| Poland | 3 | 0.2% | View All 7 Rows |
Sex and Age in Roaming Shores
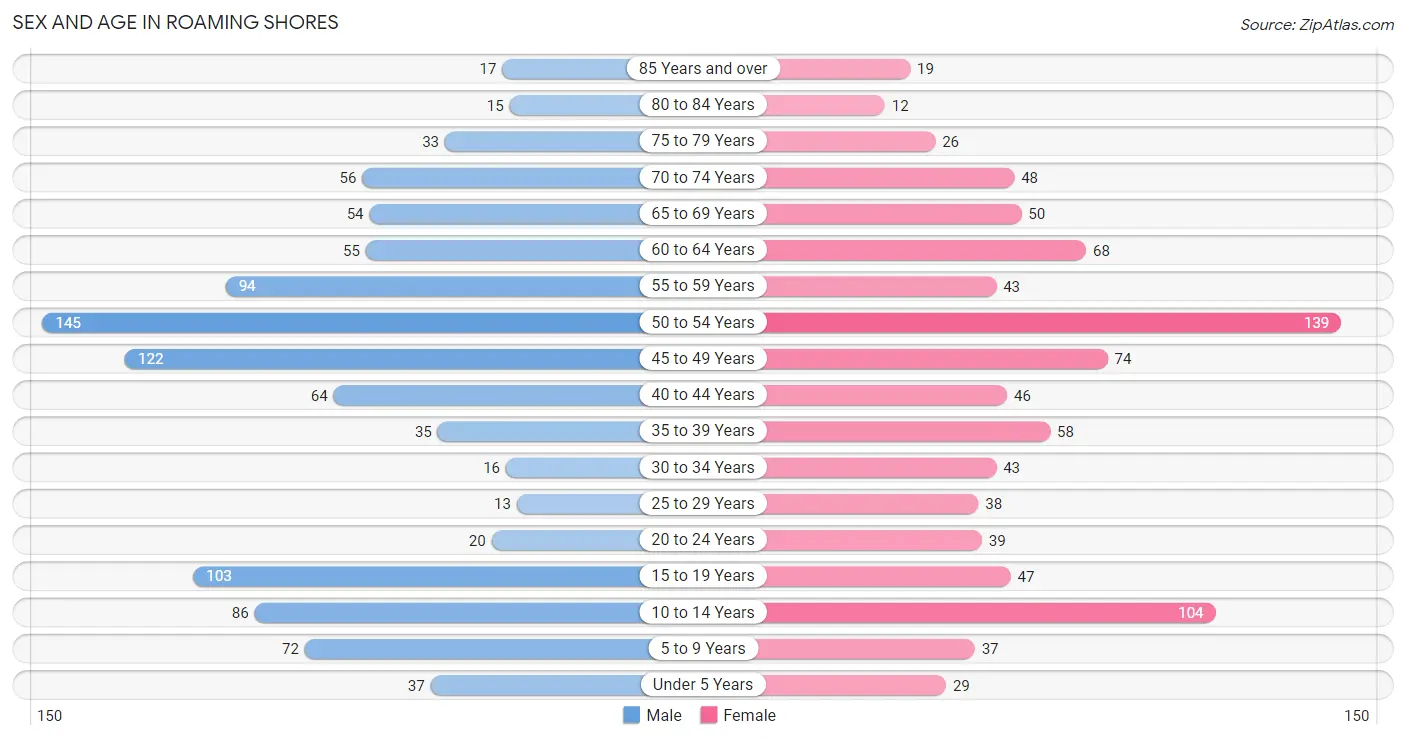
Sex and Age in Roaming Shores
The most populous age groups in Roaming Shores are 50 to 54 Years (145 | 14.0%) for men and 50 to 54 Years (139 | 15.1%) for women.
| Age Bracket | Male | Female |
| Under 5 Years | 37 (3.6%) | 29 (3.2%) |
| 5 to 9 Years | 72 (6.9%) | 37 (4.0%) |
| 10 to 14 Years | 86 (8.3%) | 104 (11.3%) |
| 15 to 19 Years | 103 (9.9%) | 47 (5.1%) |
| 20 to 24 Years | 20 (1.9%) | 39 (4.2%) |
| 25 to 29 Years | 13 (1.3%) | 38 (4.1%) |
| 30 to 34 Years | 16 (1.5%) | 43 (4.7%) |
| 35 to 39 Years | 35 (3.4%) | 58 (6.3%) |
| 40 to 44 Years | 64 (6.2%) | 46 (5.0%) |
| 45 to 49 Years | 122 (11.8%) | 74 (8.0%) |
| 50 to 54 Years | 145 (14.0%) | 139 (15.1%) |
| 55 to 59 Years | 94 (9.1%) | 43 (4.7%) |
| 60 to 64 Years | 55 (5.3%) | 68 (7.4%) |
| 65 to 69 Years | 54 (5.2%) | 50 (5.4%) |
| 70 to 74 Years | 56 (5.4%) | 48 (5.2%) |
| 75 to 79 Years | 33 (3.2%) | 26 (2.8%) |
| 80 to 84 Years | 15 (1.5%) | 12 (1.3%) |
| 85 Years and over | 17 (1.6%) | 19 (2.1%) |
| Total | 1,037 (100.0%) | 920 (100.0%) |
Families and Households in Roaming Shores
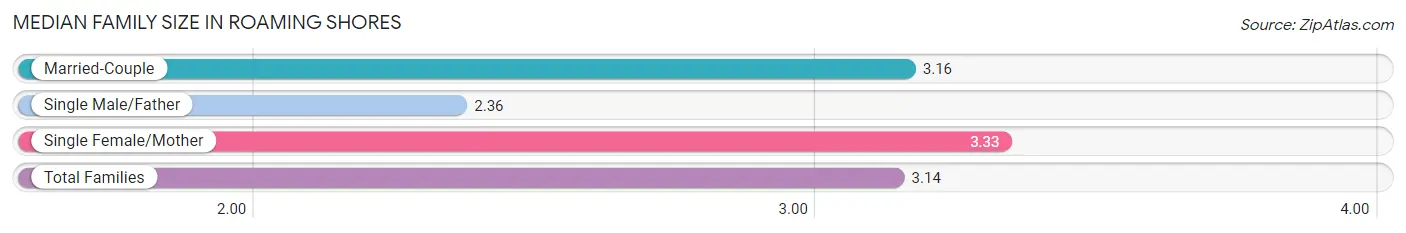
Median Family Size in Roaming Shores
The median family size in Roaming Shores is 3.14 persons per family, with single female/mother families (39 | 7.6%) accounting for the largest median family size of 3.33 persons per family. On the other hand, single male/father families (25 | 4.9%) represent the smallest median family size with 2.36 persons per family.
| Family Type | # Families | Family Size |
| Married-Couple | 451 (87.6%) | 3.16 |
| Single Male/Father | 25 (4.9%) | 2.36 |
| Single Female/Mother | 39 (7.6%) | 3.33 |
| Total Families | 515 (100.0%) | 3.14 |
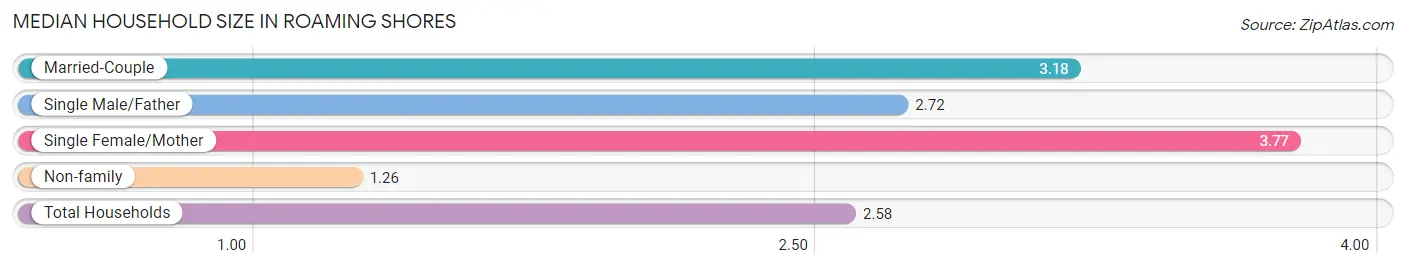
Median Household Size in Roaming Shores
The median household size in Roaming Shores is 2.58 persons per household, with single female/mother households (39 | 5.1%) accounting for the largest median household size of 3.77 persons per household. non-family households (243 | 32.1%) represent the smallest median household size with 1.26 persons per household.
| Household Type | # Households | Household Size |
| Married-Couple | 451 (59.5%) | 3.18 |
| Single Male/Father | 25 (3.3%) | 2.72 |
| Single Female/Mother | 39 (5.1%) | 3.77 |
| Non-family | 243 (32.1%) | 1.26 |
| Total Households | 758 (100.0%) | 2.58 |
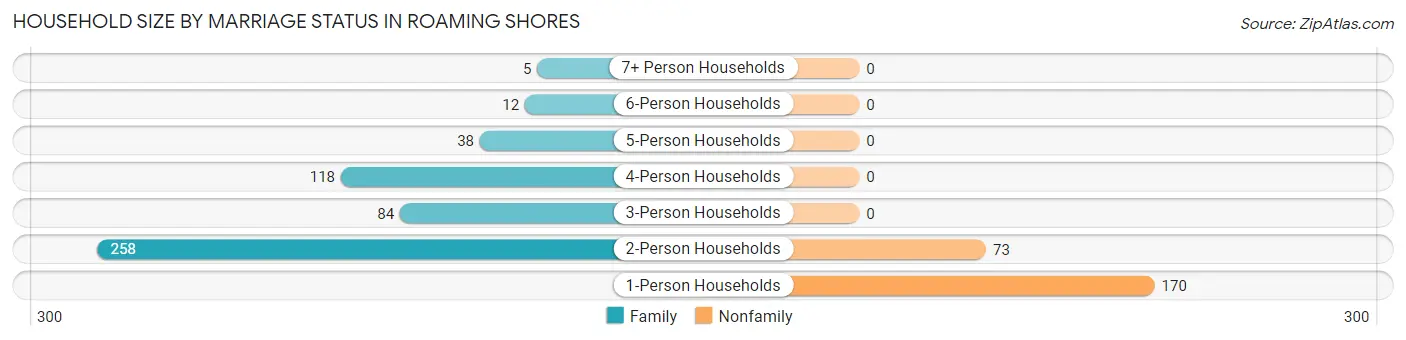
Household Size by Marriage Status in Roaming Shores
Out of a total of 758 households in Roaming Shores, 515 (67.9%) are family households, while 243 (32.1%) are nonfamily households. The most numerous type of family households are 2-person households, comprising 258, and the most common type of nonfamily households are 1-person households, comprising 170.
| Household Size | Family Households | Nonfamily Households |
| 1-Person Households | - | 170 (22.4%) |
| 2-Person Households | 258 (34.0%) | 73 (9.6%) |
| 3-Person Households | 84 (11.1%) | 0 (0.0%) |
| 4-Person Households | 118 (15.6%) | 0 (0.0%) |
| 5-Person Households | 38 (5.0%) | 0 (0.0%) |
| 6-Person Households | 12 (1.6%) | 0 (0.0%) |
| 7+ Person Households | 5 (0.7%) | 0 (0.0%) |
| Total | 515 (67.9%) | 243 (32.1%) |
Female Fertility in Roaming Shores
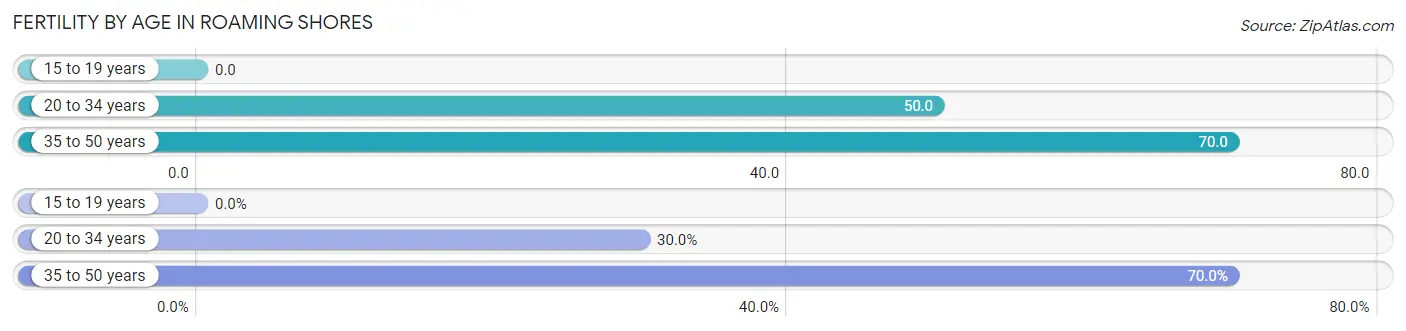
Fertility by Age in Roaming Shores
Average fertility rate in Roaming Shores is 54.0 births per 1,000 women. Women in the age bracket of 35 to 50 years have the highest fertility rate with 70.0 births per 1,000 women. Women in the age bracket of 35 to 50 years acount for 70.0% of all women with births.
| Age Bracket | Women with Births | Births / 1,000 Women |
| 15 to 19 years | 0 (0.0%) | 0.0 |
| 20 to 34 years | 6 (30.0%) | 50.0 |
| 35 to 50 years | 14 (70.0%) | 70.0 |
| Total | 20 (100.0%) | 54.0 |
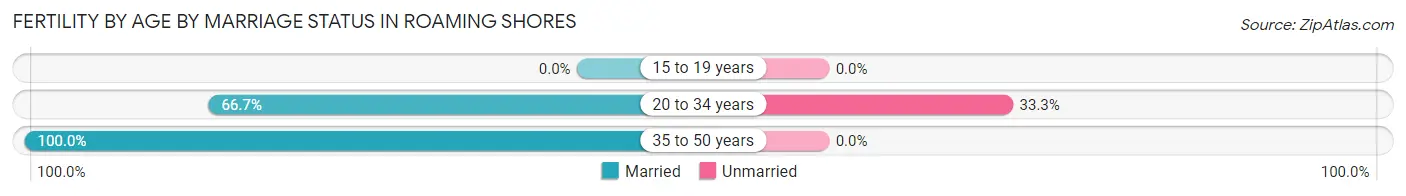
Fertility by Age by Marriage Status in Roaming Shores
90.0% of women with births (20) in Roaming Shores are married. The highest percentage of unmarried women with births falls into 20 to 34 years age bracket with 33.3% of them unmarried at the time of birth, while the lowest percentage of unmarried women with births belong to 35 to 50 years age bracket with 0.0% of them unmarried.
| Age Bracket | Married | Unmarried |
| 15 to 19 years | 0 (0.0%) | 0 (0.0%) |
| 20 to 34 years | 4 (66.7%) | 2 (33.3%) |
| 35 to 50 years | 14 (100.0%) | 0 (0.0%) |
| Total | 18 (90.0%) | 2 (10.0%) |
Fertility by Education in Roaming Shores
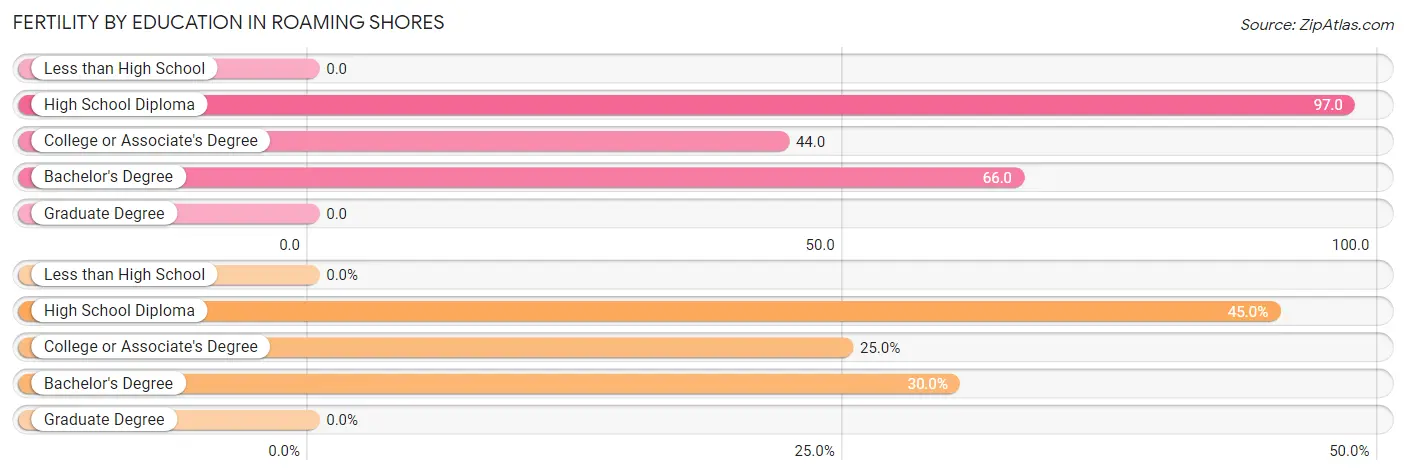
| Educational Attainment | Women with Births | Births / 1,000 Women |
| Less than High School | 0 (0.0%) | 0.0 |
| High School Diploma | 9 (45.0%) | 97.0 |
| College or Associate's Degree | 5 (25.0%) | 44.0 |
| Bachelor's Degree | 6 (30.0%) | 66.0 |
| Graduate Degree | 0 (0.0%) | 0.0 |
| Total | 20 (100.0%) | 54.0 |
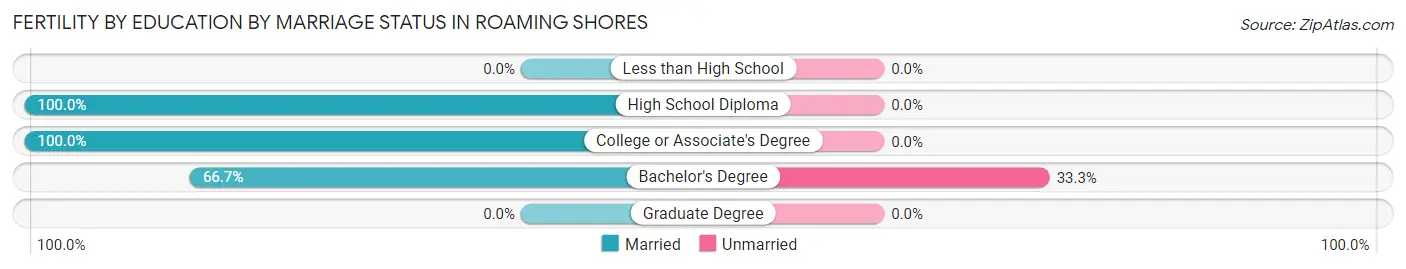
Fertility by Education by Marriage Status in Roaming Shores
10.0% of women with births in Roaming Shores are unmarried. Women with the educational attainment of high school diploma are most likely to be married with 100.0% of them married at childbirth, while women with the educational attainment of bachelor's degree are least likely to be married with 33.3% of them unmarried at childbirth.
| Educational Attainment | Married | Unmarried |
| Less than High School | 0 (0.0%) | 0 (0.0%) |
| High School Diploma | 9 (100.0%) | 0 (0.0%) |
| College or Associate's Degree | 5 (100.0%) | 0 (0.0%) |
| Bachelor's Degree | 4 (66.7%) | 2 (33.3%) |
| Graduate Degree | 0 (0.0%) | 0 (0.0%) |
| Total | 18 (90.0%) | 2 (10.0%) |
Income in Roaming Shores
Income Overview in Roaming Shores
Per Capita Income in Roaming Shores is $44,546, while median incomes of families and households are $113,224 and $93,452 respectively.
| Characteristic | Number | Measure |
| Per Capita Income | 1,957 | $44,546 |
| Median Family Income | 515 | $113,224 |
| Mean Family Income | 515 | $134,546 |
| Median Household Income | 758 | $93,452 |
| Mean Household Income | 758 | $113,904 |
| Income Deficit | 515 | $0 |
| Wage / Income Gap (%) | 1,957 | 51.14% |
| Wage / Income Gap ($) | 1,957 | 48.86¢ per $1 |
| Gini / Inequality Index | 1,957 | 0.38 |
Earnings by Sex in Roaming Shores
Average Earnings in Roaming Shores are $55,926, $64,347 for men and $31,442 for women, a difference of 51.1%.
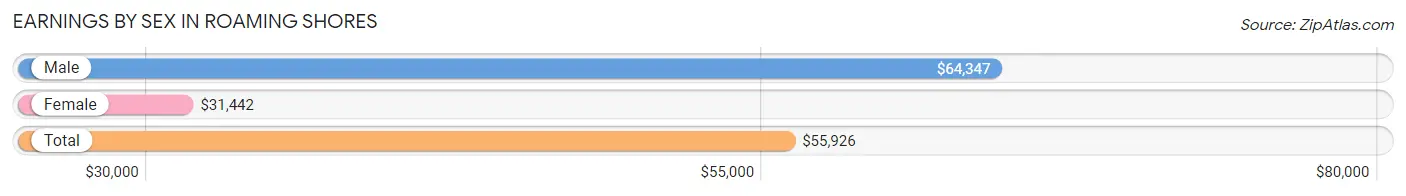
| Sex | Number | Average Earnings |
| Male | 607 (56.1%) | $64,347 |
| Female | 475 (43.9%) | $31,442 |
| Total | 1,082 (100.0%) | $55,926 |
Earnings by Sex by Income Bracket in Roaming Shores
The most common earnings brackets in Roaming Shores are $100,000+ for men (127 | 20.9%) and $75,000 to $99,999 for women (64 | 13.5%).
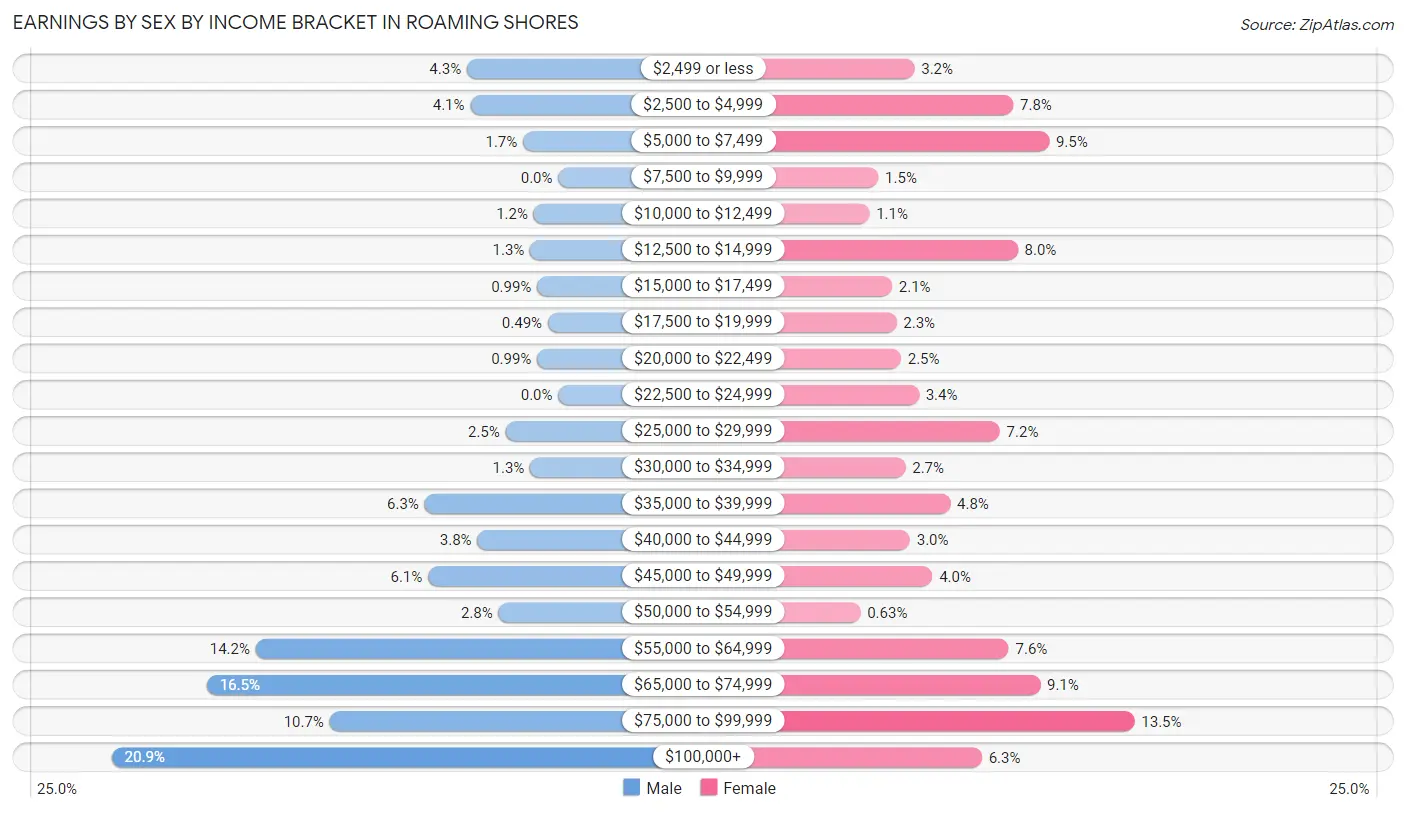
| Income | Male | Female |
| $2,499 or less | 26 (4.3%) | 15 (3.2%) |
| $2,500 to $4,999 | 25 (4.1%) | 37 (7.8%) |
| $5,000 to $7,499 | 10 (1.7%) | 45 (9.5%) |
| $7,500 to $9,999 | 0 (0.0%) | 7 (1.5%) |
| $10,000 to $12,499 | 7 (1.1%) | 5 (1.1%) |
| $12,500 to $14,999 | 8 (1.3%) | 38 (8.0%) |
| $15,000 to $17,499 | 6 (1.0%) | 10 (2.1%) |
| $17,500 to $19,999 | 3 (0.5%) | 11 (2.3%) |
| $20,000 to $22,499 | 6 (1.0%) | 12 (2.5%) |
| $22,500 to $24,999 | 0 (0.0%) | 16 (3.4%) |
| $25,000 to $29,999 | 15 (2.5%) | 34 (7.2%) |
| $30,000 to $34,999 | 8 (1.3%) | 13 (2.7%) |
| $35,000 to $39,999 | 38 (6.3%) | 23 (4.8%) |
| $40,000 to $44,999 | 23 (3.8%) | 14 (2.9%) |
| $45,000 to $49,999 | 37 (6.1%) | 19 (4.0%) |
| $50,000 to $54,999 | 17 (2.8%) | 3 (0.6%) |
| $55,000 to $64,999 | 86 (14.2%) | 36 (7.6%) |
| $65,000 to $74,999 | 100 (16.5%) | 43 (9.0%) |
| $75,000 to $99,999 | 65 (10.7%) | 64 (13.5%) |
| $100,000+ | 127 (20.9%) | 30 (6.3%) |
| Total | 607 (100.0%) | 475 (100.0%) |
Earnings by Sex by Educational Attainment in Roaming Shores
Average earnings in Roaming Shores are $69,219 for men and $42,604 for women, a difference of 38.5%. Men with an educational attainment of graduate degree enjoy the highest average annual earnings of $117,813, while those with less than high school education earn the least with $39,318. Women with an educational attainment of graduate degree earn the most with the average annual earnings of $67,396, while those with high school diploma education have the smallest earnings of $25,917.
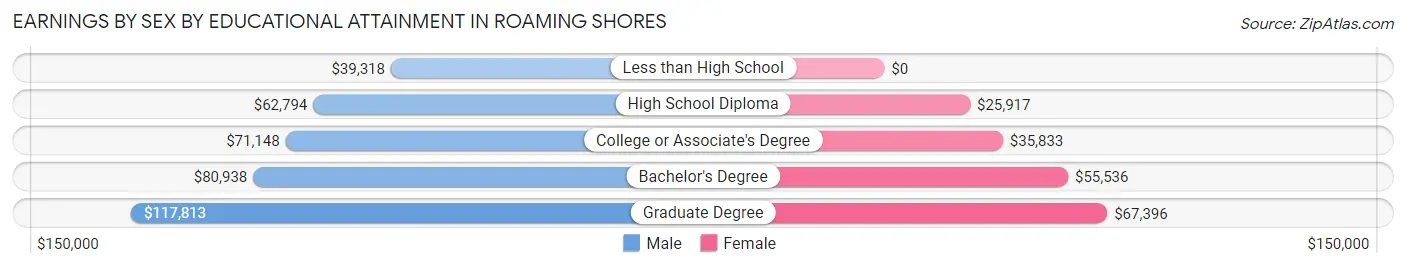
| Educational Attainment | Male Income | Female Income |
| Less than High School | $39,318 | $0 |
| High School Diploma | $62,794 | $25,917 |
| College or Associate's Degree | $71,148 | $35,833 |
| Bachelor's Degree | $80,938 | $55,536 |
| Graduate Degree | $117,813 | $67,396 |
| Total | $69,219 | $42,604 |
Family Income in Roaming Shores
Family Income Brackets in Roaming Shores
According to the Roaming Shores family income data, there are 194 families falling into the $100,000 to $149,999 income range, which is the most common income bracket and makes up 37.7% of all families.
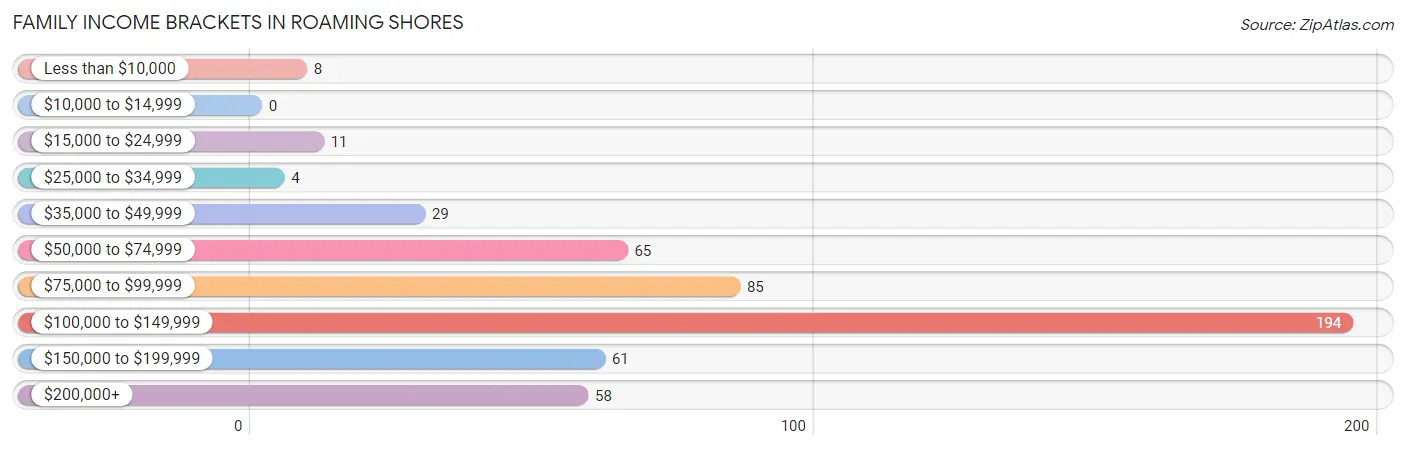
| Income Bracket | # Families | % Families |
| Less than $10,000 | 8 | 1.6% |
| $10,000 to $14,999 | 0 | 0.0% |
| $15,000 to $24,999 | 11 | 2.1% |
| $25,000 to $34,999 | 4 | 0.8% |
| $35,000 to $49,999 | 29 | 5.6% |
| $50,000 to $74,999 | 65 | 12.6% |
| $75,000 to $99,999 | 85 | 16.5% |
| $100,000 to $149,999 | 194 | 37.7% |
| $150,000 to $199,999 | 61 | 11.8% |
| $200,000+ | 58 | 11.3% |
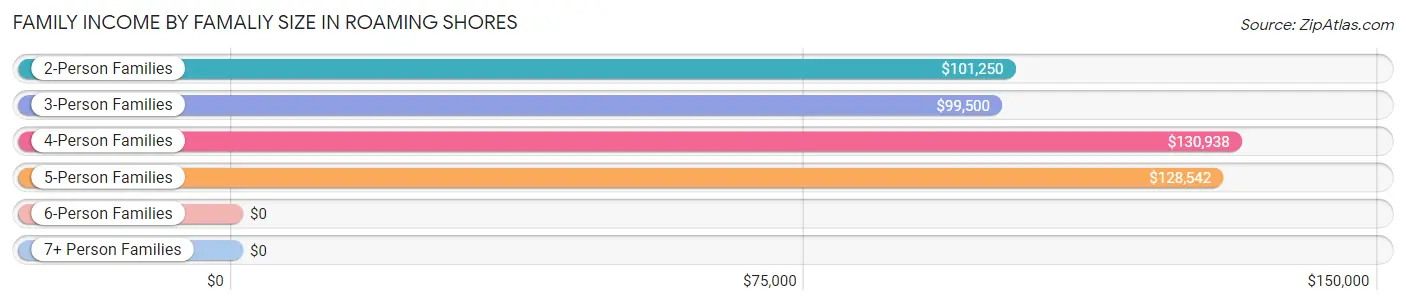
Family Income by Famaliy Size in Roaming Shores
4-person families (109 | 21.2%) account for the highest median family income in Roaming Shores with $130,938 per family, while 2-person families (269 | 52.2%) have the highest median income of $50,625 per family member.
| Income Bracket | # Families | Median Income |
| 2-Person Families | 269 (52.2%) | $101,250 |
| 3-Person Families | 88 (17.1%) | $99,500 |
| 4-Person Families | 109 (21.2%) | $130,938 |
| 5-Person Families | 37 (7.2%) | $128,542 |
| 6-Person Families | 7 (1.4%) | $0 |
| 7+ Person Families | 5 (1.0%) | $0 |
| Total | 515 (100.0%) | $113,224 |
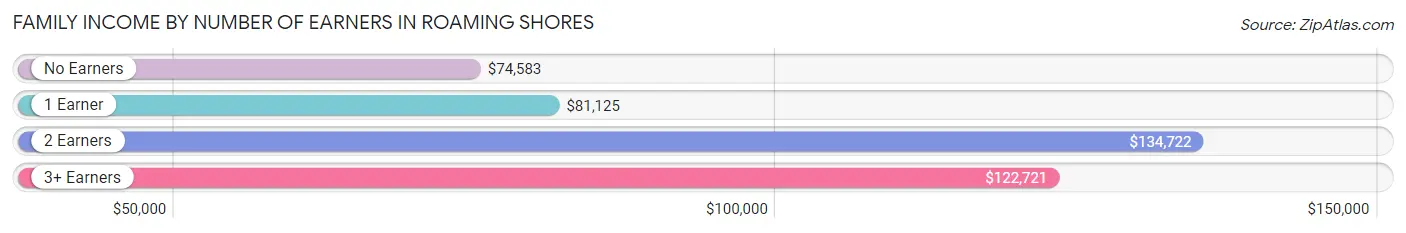
Family Income by Number of Earners in Roaming Shores
The median family income in Roaming Shores is $113,224, with families comprising 2 earners (218) having the highest median family income of $134,722, while families with no earners (79) have the lowest median family income of $74,583, accounting for 42.3% and 15.3% of families, respectively.
| Number of Earners | # Families | Median Income |
| No Earners | 79 (15.3%) | $74,583 |
| 1 Earner | 135 (26.2%) | $81,125 |
| 2 Earners | 218 (42.3%) | $134,722 |
| 3+ Earners | 83 (16.1%) | $122,721 |
| Total | 515 (100.0%) | $113,224 |
Household Income in Roaming Shores
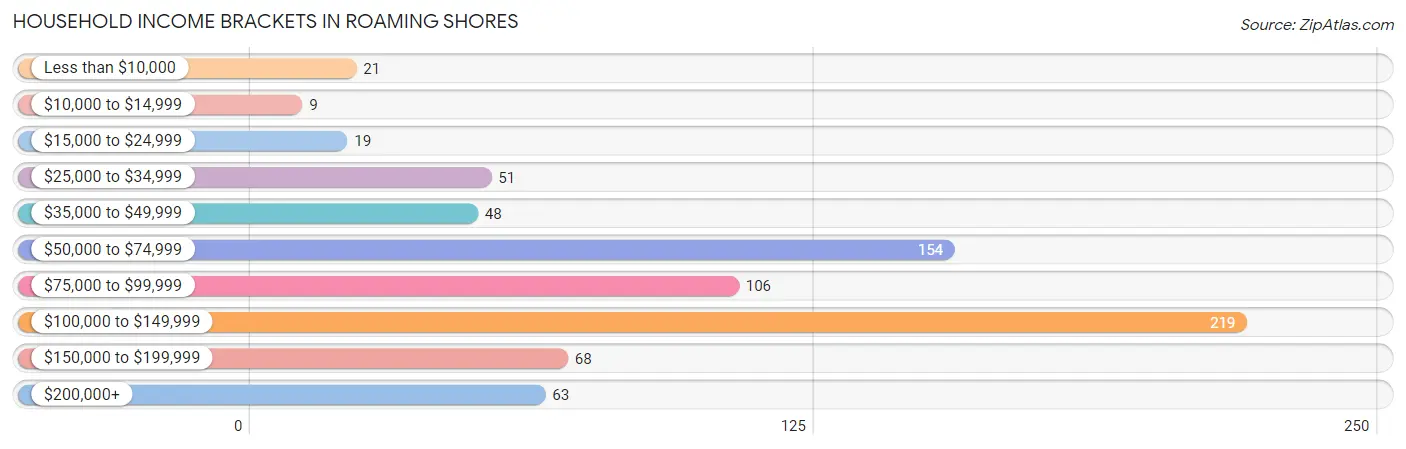
Household Income Brackets in Roaming Shores
With 219 households falling in the category, the $100,000 to $149,999 income range is the most frequent in Roaming Shores, accounting for 28.9% of all households. In contrast, only 9 households (1.2%) fall into the $10,000 to $14,999 income bracket, making it the least populous group.
| Income Bracket | # Households | % Households |
| Less than $10,000 | 21 | 2.8% |
| $10,000 to $14,999 | 9 | 1.2% |
| $15,000 to $24,999 | 19 | 2.5% |
| $25,000 to $34,999 | 51 | 6.7% |
| $35,000 to $49,999 | 48 | 6.3% |
| $50,000 to $74,999 | 154 | 20.3% |
| $75,000 to $99,999 | 106 | 14.0% |
| $100,000 to $149,999 | 219 | 28.9% |
| $150,000 to $199,999 | 68 | 9.0% |
| $200,000+ | 63 | 8.3% |
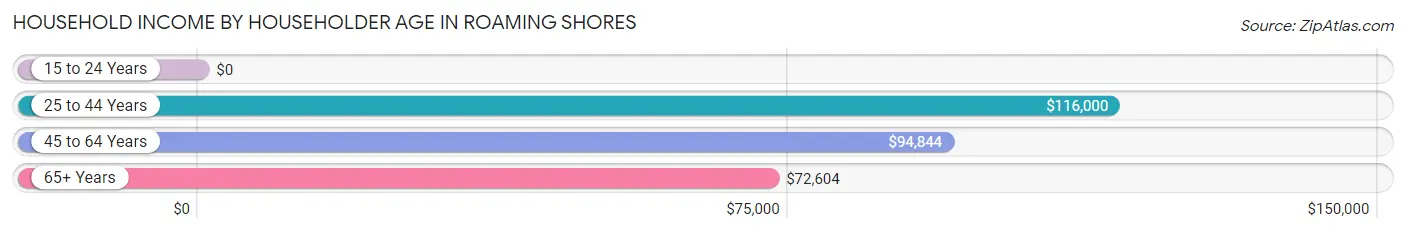
Household Income by Householder Age in Roaming Shores
The median household income in Roaming Shores is $93,452, with the highest median household income of $116,000 found in the 25 to 44 years age bracket for the primary householder. A total of 160 households (21.1%) fall into this category.
| Income Bracket | # Households | Median Income |
| 15 to 24 Years | 0 (0.0%) | $0 |
| 25 to 44 Years | 160 (21.1%) | $116,000 |
| 45 to 64 Years | 411 (54.2%) | $94,844 |
| 65+ Years | 187 (24.7%) | $72,604 |
| Total | 758 (100.0%) | $93,452 |
Poverty in Roaming Shores
Income Below Poverty by Sex and Age in Roaming Shores
With 4.2% poverty level for males and 12.0% for females among the residents of Roaming Shores, 16 and 17 year old males and 16 and 17 year old females are the most vulnerable to poverty, with 11 males (25.0%) and 8 females (36.4%) in their respective age groups living below the poverty level.
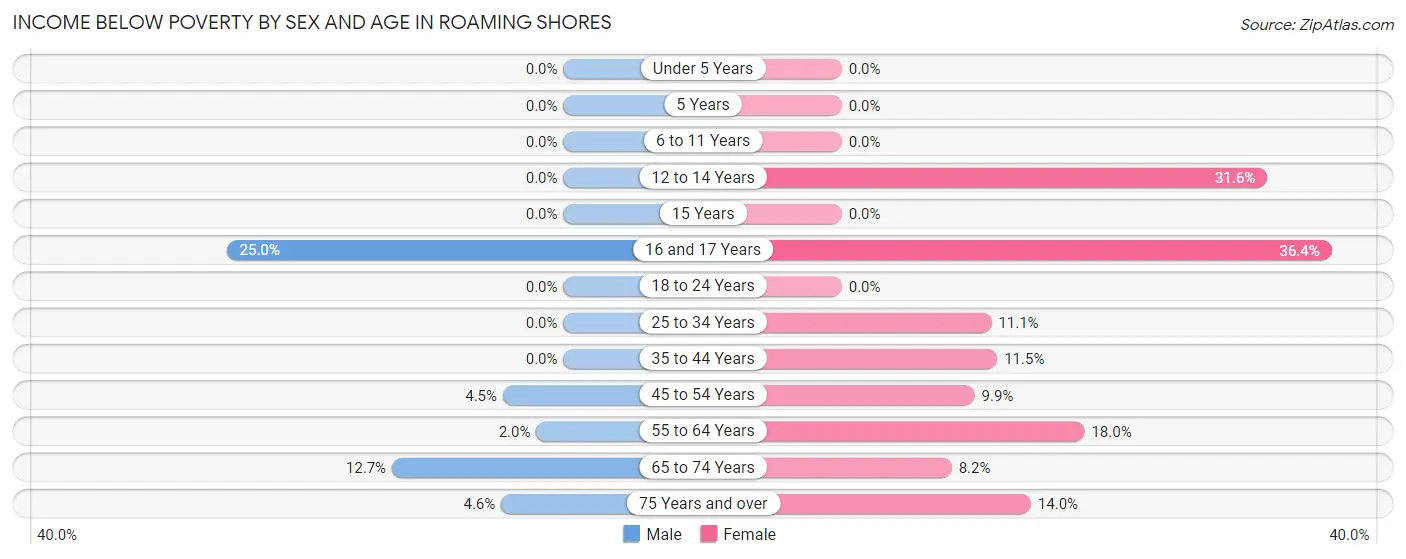
| Age Bracket | Male | Female |
| Under 5 Years | 0 (0.0%) | 0 (0.0%) |
| 5 Years | 0 (0.0%) | 0 (0.0%) |
| 6 to 11 Years | 0 (0.0%) | 0 (0.0%) |
| 12 to 14 Years | 0 (0.0%) | 24 (31.6%) |
| 15 Years | 0 (0.0%) | 0 (0.0%) |
| 16 and 17 Years | 11 (25.0%) | 8 (36.4%) |
| 18 to 24 Years | 0 (0.0%) | 0 (0.0%) |
| 25 to 34 Years | 0 (0.0%) | 9 (11.1%) |
| 35 to 44 Years | 0 (0.0%) | 12 (11.5%) |
| 45 to 54 Years | 12 (4.5%) | 21 (9.9%) |
| 55 to 64 Years | 3 (2.0%) | 20 (18.0%) |
| 65 to 74 Years | 14 (12.7%) | 8 (8.2%) |
| 75 Years and over | 3 (4.6%) | 8 (14.0%) |
| Total | 43 (4.2%) | 110 (12.0%) |
Income Above Poverty by Sex and Age in Roaming Shores
According to the poverty statistics in Roaming Shores, males aged under 5 years and females aged under 5 years are the age groups that are most secure financially, with 100.0% of males and 100.0% of females in these age groups living above the poverty line.
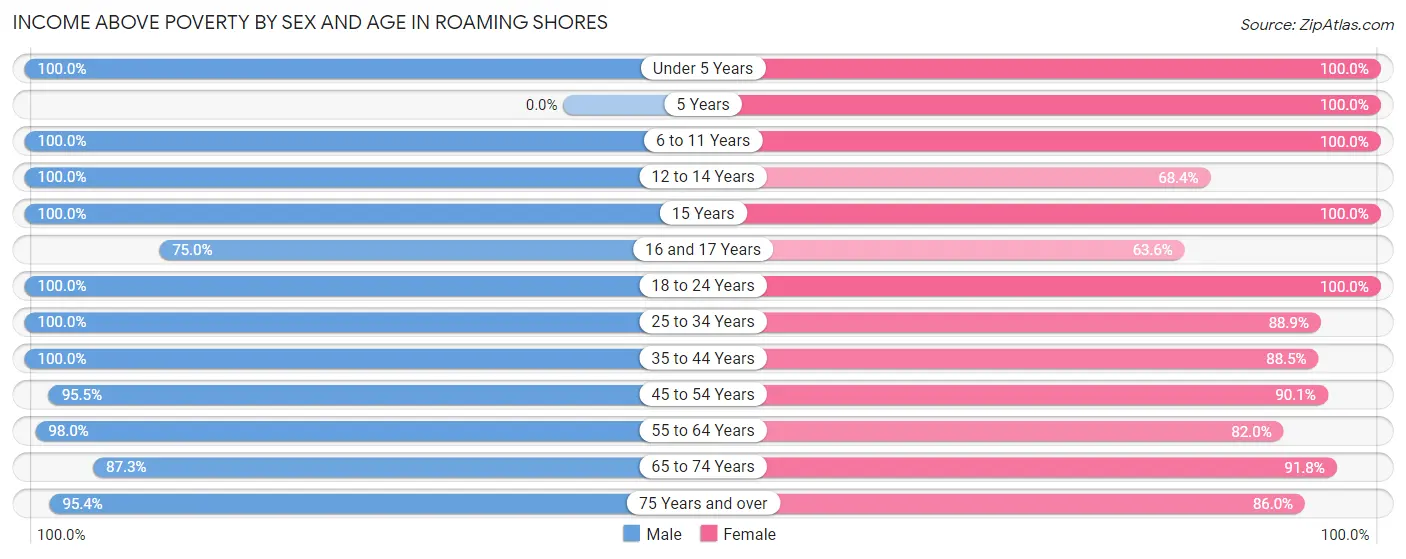
| Age Bracket | Male | Female |
| Under 5 Years | 37 (100.0%) | 29 (100.0%) |
| 5 Years | 0 (0.0%) | 2 (100.0%) |
| 6 to 11 Years | 99 (100.0%) | 63 (100.0%) |
| 12 to 14 Years | 59 (100.0%) | 52 (68.4%) |
| 15 Years | 14 (100.0%) | 9 (100.0%) |
| 16 and 17 Years | 33 (75.0%) | 14 (63.6%) |
| 18 to 24 Years | 65 (100.0%) | 55 (100.0%) |
| 25 to 34 Years | 29 (100.0%) | 72 (88.9%) |
| 35 to 44 Years | 99 (100.0%) | 92 (88.5%) |
| 45 to 54 Years | 255 (95.5%) | 192 (90.1%) |
| 55 to 64 Years | 146 (98.0%) | 91 (82.0%) |
| 65 to 74 Years | 96 (87.3%) | 90 (91.8%) |
| 75 Years and over | 62 (95.4%) | 49 (86.0%) |
| Total | 994 (95.9%) | 810 (88.0%) |
Income Below Poverty Among Married-Couple Families in Roaming Shores
The poverty statistics for married-couple families in Roaming Shores show that 1.5% or 7 of the total 451 families live below the poverty line. Families with no children have the highest poverty rate of 2.5%, comprising of 7 families. On the other hand, families with 1 or 2 children have the lowest poverty rate of 0.0%, which includes 0 families.
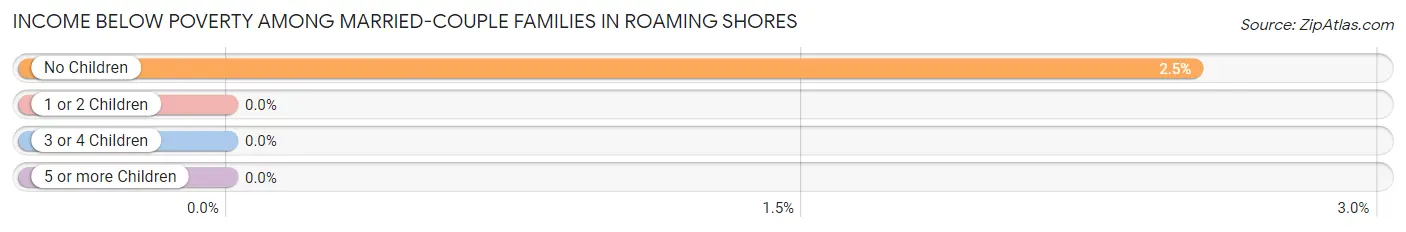
| Children | Above Poverty | Below Poverty |
| No Children | 271 (97.5%) | 7 (2.5%) |
| 1 or 2 Children | 143 (100.0%) | 0 (0.0%) |
| 3 or 4 Children | 25 (100.0%) | 0 (0.0%) |
| 5 or more Children | 5 (100.0%) | 0 (0.0%) |
| Total | 444 (98.5%) | 7 (1.5%) |
Income Below Poverty Among Single-Parent Households in Roaming Shores
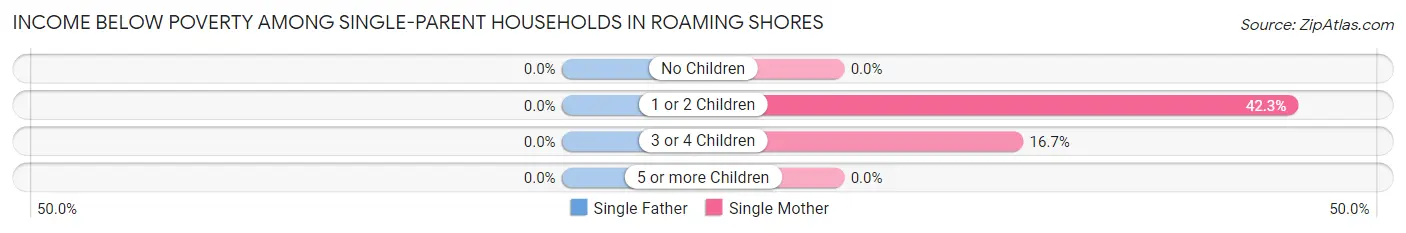
| Children | Single Father | Single Mother |
| No Children | 0 (0.0%) | 0 (0.0%) |
| 1 or 2 Children | 0 (0.0%) | 11 (42.3%) |
| 3 or 4 Children | 0 (0.0%) | 1 (16.7%) |
| 5 or more Children | 0 (0.0%) | 0 (0.0%) |
| Total | 0 (0.0%) | 12 (30.8%) |
Income Below Poverty Among Married-Couple vs Single-Parent Households in Roaming Shores
The poverty data for Roaming Shores shows that 7 of the married-couple family households (1.5%) and 12 of the single-parent households (18.8%) are living below the poverty level. Within the married-couple family households, those with no children have the highest poverty rate, with 7 households (2.5%) falling below the poverty line. Among the single-parent households, those with 1 or 2 children have the highest poverty rate, with 11 household (25.6%) living below poverty.
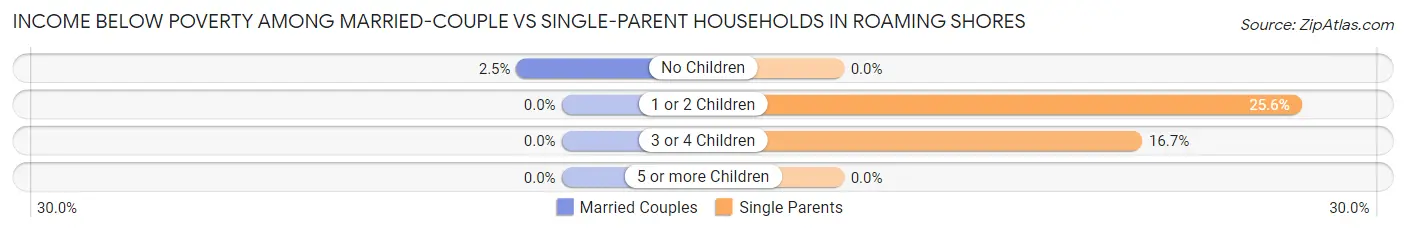
| Children | Married-Couple Families | Single-Parent Households |
| No Children | 7 (2.5%) | 0 (0.0%) |
| 1 or 2 Children | 0 (0.0%) | 11 (25.6%) |
| 3 or 4 Children | 0 (0.0%) | 1 (16.7%) |
| 5 or more Children | 0 (0.0%) | 0 (0.0%) |
| Total | 7 (1.5%) | 12 (18.8%) |
Employment Characteristics in Roaming Shores
Employment by Class of Employer in Roaming Shores
Among the 1,000 employed individuals in Roaming Shores, private company employees (660 | 66.0%), local government employees (133 | 13.3%), and not-for-profit organizations (84 | 8.4%) make up the most common classes of employment.
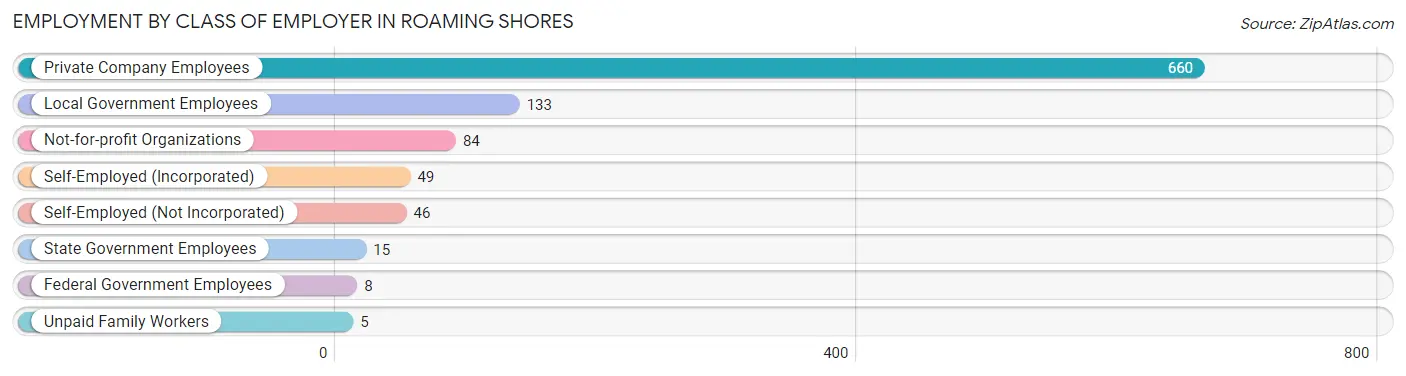
| Employer Class | # Employees | % Employees |
| Private Company Employees | 660 | 66.0% |
| Self-Employed (Incorporated) | 49 | 4.9% |
| Self-Employed (Not Incorporated) | 46 | 4.6% |
| Not-for-profit Organizations | 84 | 8.4% |
| Local Government Employees | 133 | 13.3% |
| State Government Employees | 15 | 1.5% |
| Federal Government Employees | 8 | 0.8% |
| Unpaid Family Workers | 5 | 0.5% |
| Total | 1,000 | 100.0% |
Employment Status by Age in Roaming Shores
According to the labor force statistics for Roaming Shores, out of the total population over 16 years of age (1,569), 65.6% or 1,029 individuals are in the labor force, with 1.7% or 17 of them unemployed. The age group with the highest labor force participation rate is 25 to 29 years, with 100.0% or 51 individuals in the labor force. Within the labor force, the 30 to 34 years age range has the highest percentage of unemployed individuals, with 10.2% or 6 of them being unemployed.
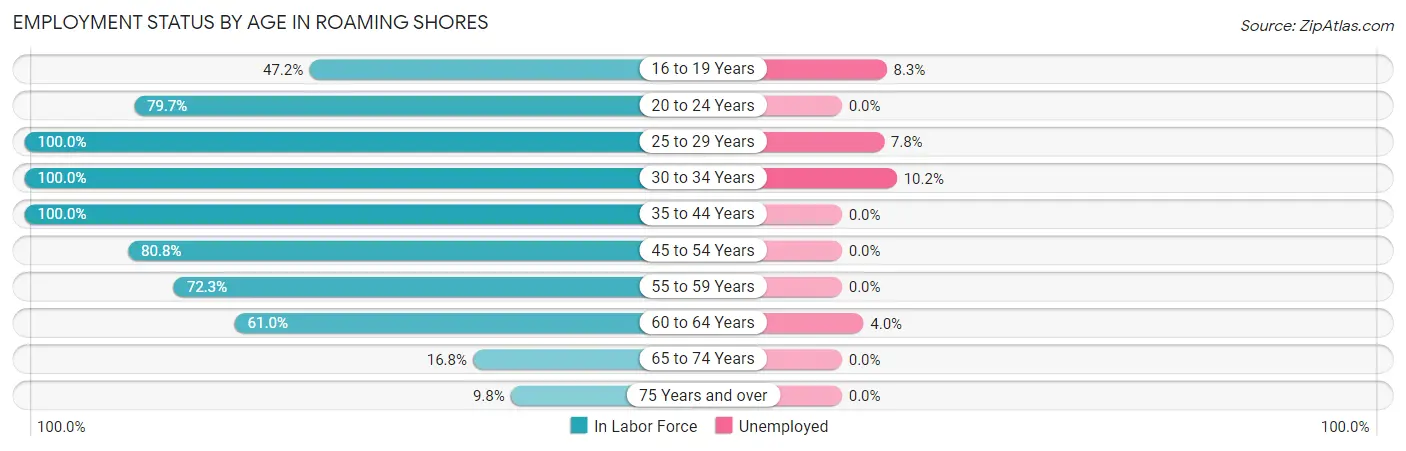
| Age Bracket | In Labor Force | Unemployed |
| 16 to 19 Years | 60 (47.2%) | 5 (8.3%) |
| 20 to 24 Years | 47 (79.7%) | 0 (0.0%) |
| 25 to 29 Years | 51 (100.0%) | 4 (7.8%) |
| 30 to 34 Years | 59 (100.0%) | 6 (10.2%) |
| 35 to 44 Years | 203 (100.0%) | 0 (0.0%) |
| 45 to 54 Years | 388 (80.8%) | 0 (0.0%) |
| 55 to 59 Years | 99 (72.3%) | 0 (0.0%) |
| 60 to 64 Years | 75 (61.0%) | 3 (4.0%) |
| 65 to 74 Years | 35 (16.8%) | 0 (0.0%) |
| 75 Years and over | 12 (9.8%) | 0 (0.0%) |
| Total | 1,029 (65.6%) | 17 (1.7%) |
Employment Status by Educational Attainment in Roaming Shores
According to labor force statistics for Roaming Shores, 83.1% of individuals (875) out of the total population between 25 and 64 years of age (1,053) are in the labor force, with 1.5% or 13 of them being unemployed. The group with the highest labor force participation rate are those with the educational attainment of bachelor's degree or higher, with 92.3% or 274 individuals in the labor force. Within the labor force, individuals with high school diploma education have the highest percentage of unemployment, with 2.4% or 7 of them being unemployed.
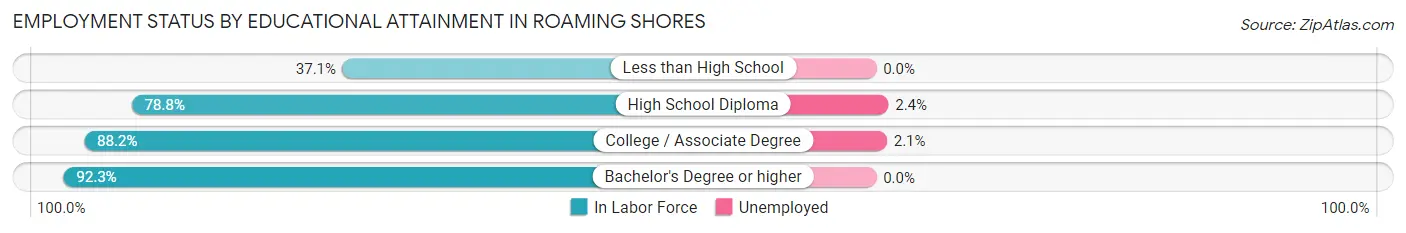
| Educational Attainment | In Labor Force | Unemployed |
| Less than High School | 23 (37.1%) | 0 (0.0%) |
| High School Diploma | 286 (78.8%) | 9 (2.4%) |
| College / Associate Degree | 292 (88.2%) | 7 (2.1%) |
| Bachelor's Degree or higher | 274 (92.3%) | 0 (0.0%) |
| Total | 875 (83.1%) | 16 (1.5%) |
Employment Occupations by Sex in Roaming Shores
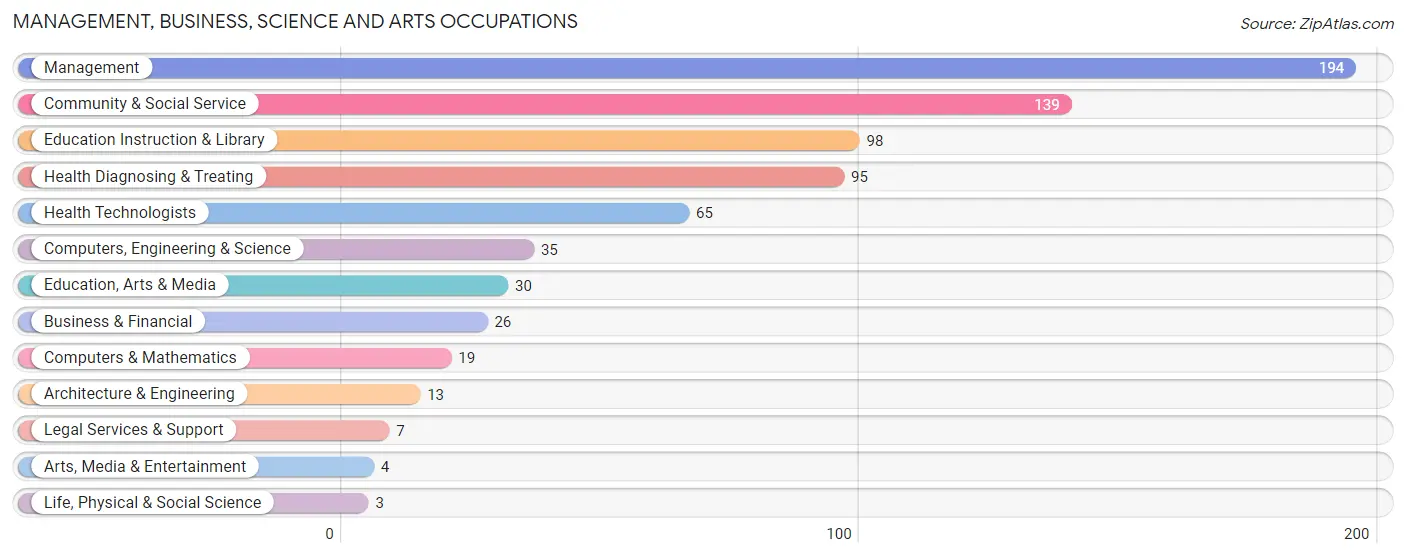
Management, Business, Science and Arts Occupations
The most common Management, Business, Science and Arts occupations in Roaming Shores are Management (194 | 19.2%), Community & Social Service (139 | 13.8%), Education Instruction & Library (98 | 9.7%), Health Diagnosing & Treating (95 | 9.4%), and Health Technologists (65 | 6.4%).
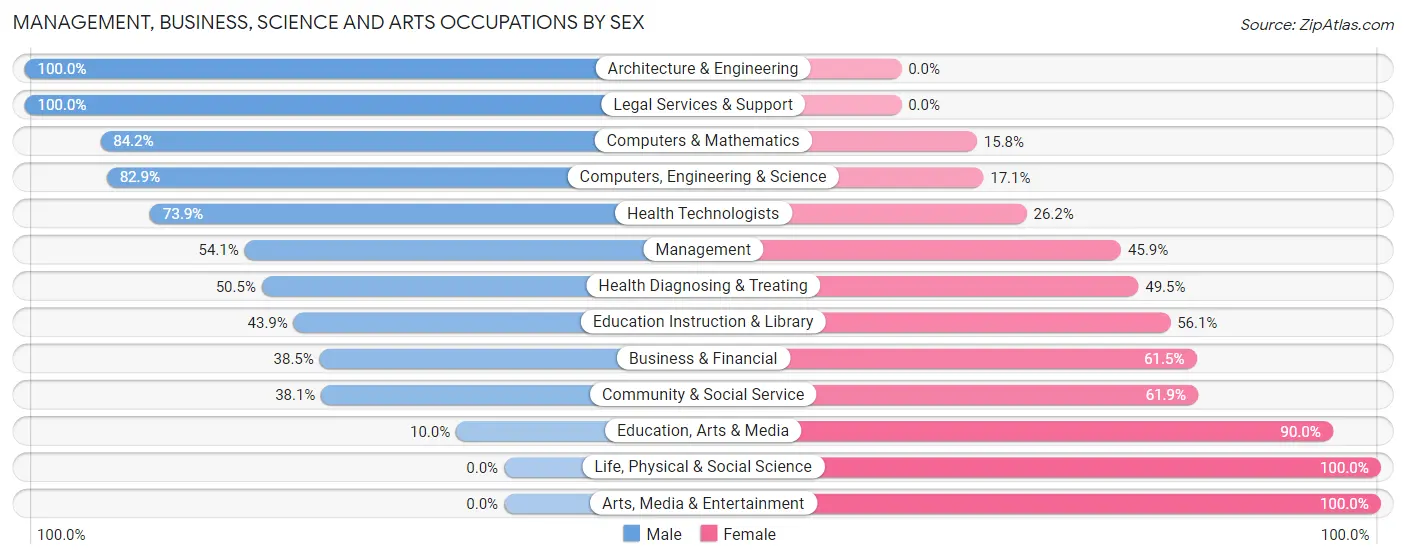
Management, Business, Science and Arts Occupations by Sex
Within the Management, Business, Science and Arts occupations in Roaming Shores, the most male-oriented occupations are Architecture & Engineering (100.0%), Legal Services & Support (100.0%), and Computers & Mathematics (84.2%), while the most female-oriented occupations are Life, Physical & Social Science (100.0%), Arts, Media & Entertainment (100.0%), and Education, Arts & Media (90.0%).
| Occupation | Male | Female |
| Management | 105 (54.1%) | 89 (45.9%) |
| Business & Financial | 10 (38.5%) | 16 (61.5%) |
| Computers, Engineering & Science | 29 (82.9%) | 6 (17.1%) |
| Computers & Mathematics | 16 (84.2%) | 3 (15.8%) |
| Architecture & Engineering | 13 (100.0%) | 0 (0.0%) |
| Life, Physical & Social Science | 0 (0.0%) | 3 (100.0%) |
| Community & Social Service | 53 (38.1%) | 86 (61.9%) |
| Education, Arts & Media | 3 (10.0%) | 27 (90.0%) |
| Legal Services & Support | 7 (100.0%) | 0 (0.0%) |
| Education Instruction & Library | 43 (43.9%) | 55 (56.1%) |
| Arts, Media & Entertainment | 0 (0.0%) | 4 (100.0%) |
| Health Diagnosing & Treating | 48 (50.5%) | 47 (49.5%) |
| Health Technologists | 48 (73.9%) | 17 (26.2%) |
| Total (Category) | 245 (50.1%) | 244 (49.9%) |
| Total (Overall) | 556 (55.0%) | 455 (45.0%) |
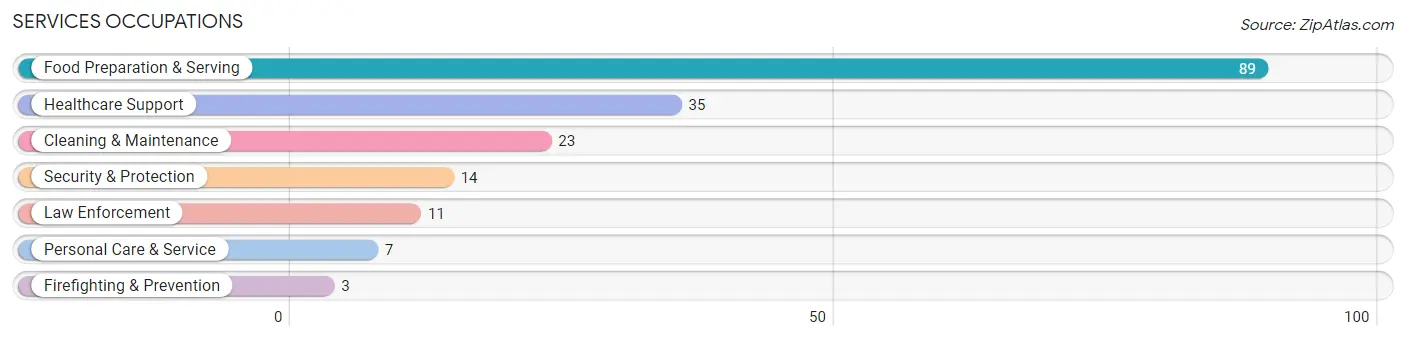
Services Occupations
The most common Services occupations in Roaming Shores are Food Preparation & Serving (89 | 8.8%), Healthcare Support (35 | 3.5%), Cleaning & Maintenance (23 | 2.3%), Security & Protection (14 | 1.4%), and Law Enforcement (11 | 1.1%).
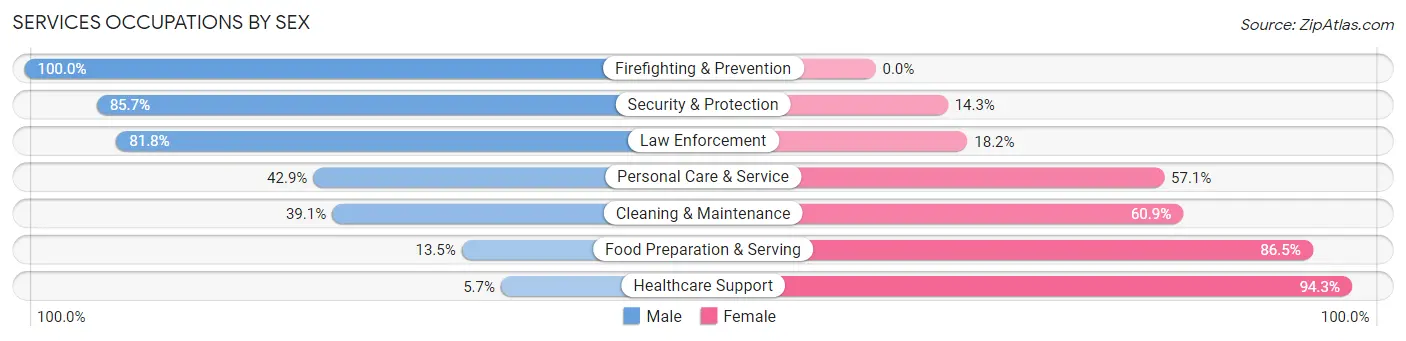
Services Occupations by Sex
Within the Services occupations in Roaming Shores, the most male-oriented occupations are Firefighting & Prevention (100.0%), Security & Protection (85.7%), and Law Enforcement (81.8%), while the most female-oriented occupations are Healthcare Support (94.3%), Food Preparation & Serving (86.5%), and Cleaning & Maintenance (60.9%).
| Occupation | Male | Female |
| Healthcare Support | 2 (5.7%) | 33 (94.3%) |
| Security & Protection | 12 (85.7%) | 2 (14.3%) |
| Firefighting & Prevention | 3 (100.0%) | 0 (0.0%) |
| Law Enforcement | 9 (81.8%) | 2 (18.2%) |
| Food Preparation & Serving | 12 (13.5%) | 77 (86.5%) |
| Cleaning & Maintenance | 9 (39.1%) | 14 (60.9%) |
| Personal Care & Service | 3 (42.9%) | 4 (57.1%) |
| Total (Category) | 38 (22.6%) | 130 (77.4%) |
| Total (Overall) | 556 (55.0%) | 455 (45.0%) |
Sales and Office Occupations
The most common Sales and Office occupations in Roaming Shores are Sales & Related (75 | 7.4%), and Office & Administration (38 | 3.8%).
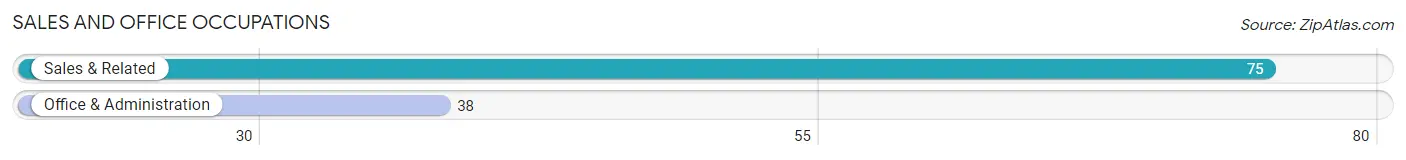
Sales and Office Occupations by Sex
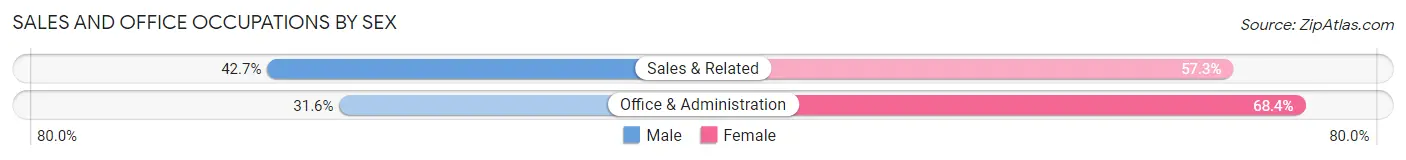
| Occupation | Male | Female |
| Sales & Related | 32 (42.7%) | 43 (57.3%) |
| Office & Administration | 12 (31.6%) | 26 (68.4%) |
| Total (Category) | 44 (38.9%) | 69 (61.1%) |
| Total (Overall) | 556 (55.0%) | 455 (45.0%) |
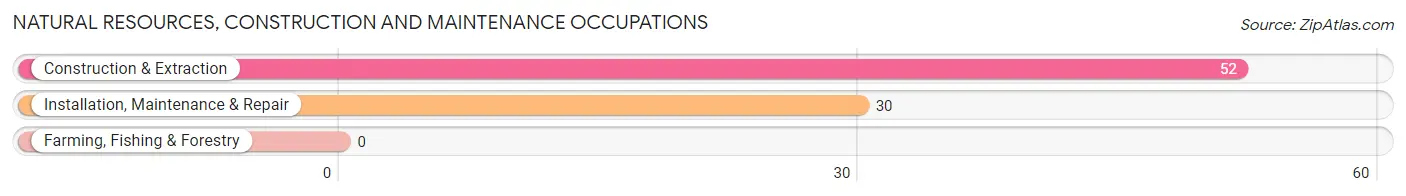
Natural Resources, Construction and Maintenance Occupations
The most common Natural Resources, Construction and Maintenance occupations in Roaming Shores are Construction & Extraction (52 | 5.1%), and Installation, Maintenance & Repair (30 | 3.0%).
Natural Resources, Construction and Maintenance Occupations by Sex
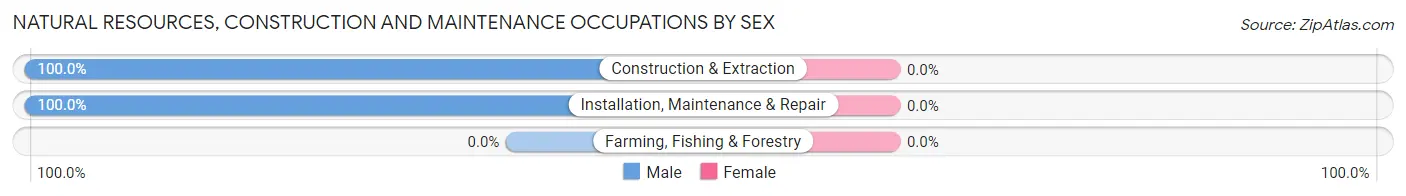
| Occupation | Male | Female |
| Farming, Fishing & Forestry | 0 (0.0%) | 0 (0.0%) |
| Construction & Extraction | 52 (100.0%) | 0 (0.0%) |
| Installation, Maintenance & Repair | 30 (100.0%) | 0 (0.0%) |
| Total (Category) | 82 (100.0%) | 0 (0.0%) |
| Total (Overall) | 556 (55.0%) | 455 (45.0%) |
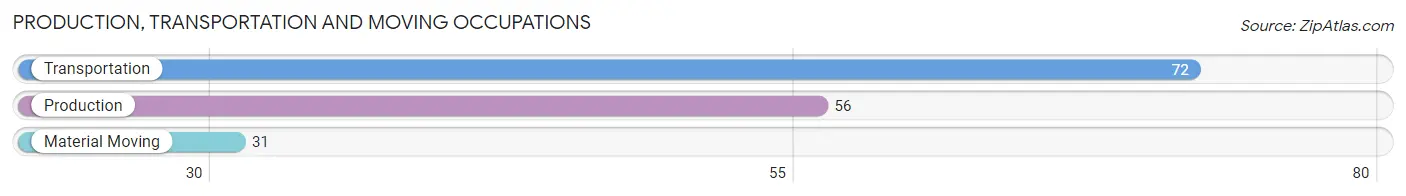
Production, Transportation and Moving Occupations
The most common Production, Transportation and Moving occupations in Roaming Shores are Transportation (72 | 7.1%), Production (56 | 5.5%), and Material Moving (31 | 3.1%).
Production, Transportation and Moving Occupations by Sex
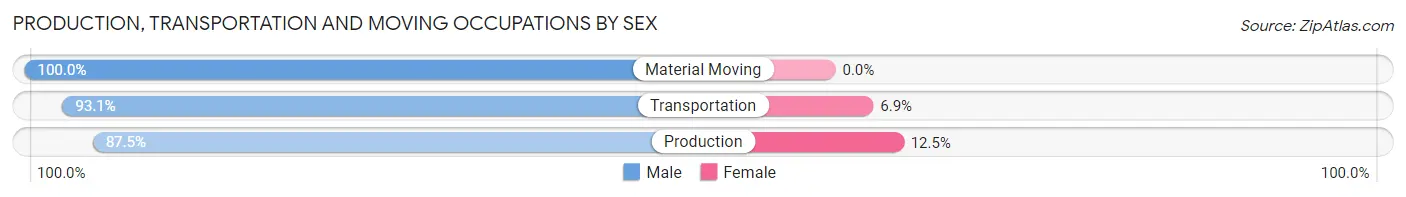
| Occupation | Male | Female |
| Production | 49 (87.5%) | 7 (12.5%) |
| Transportation | 67 (93.1%) | 5 (6.9%) |
| Material Moving | 31 (100.0%) | 0 (0.0%) |
| Total (Category) | 147 (92.4%) | 12 (7.5%) |
| Total (Overall) | 556 (55.0%) | 455 (45.0%) |
Employment Industries by Sex in Roaming Shores
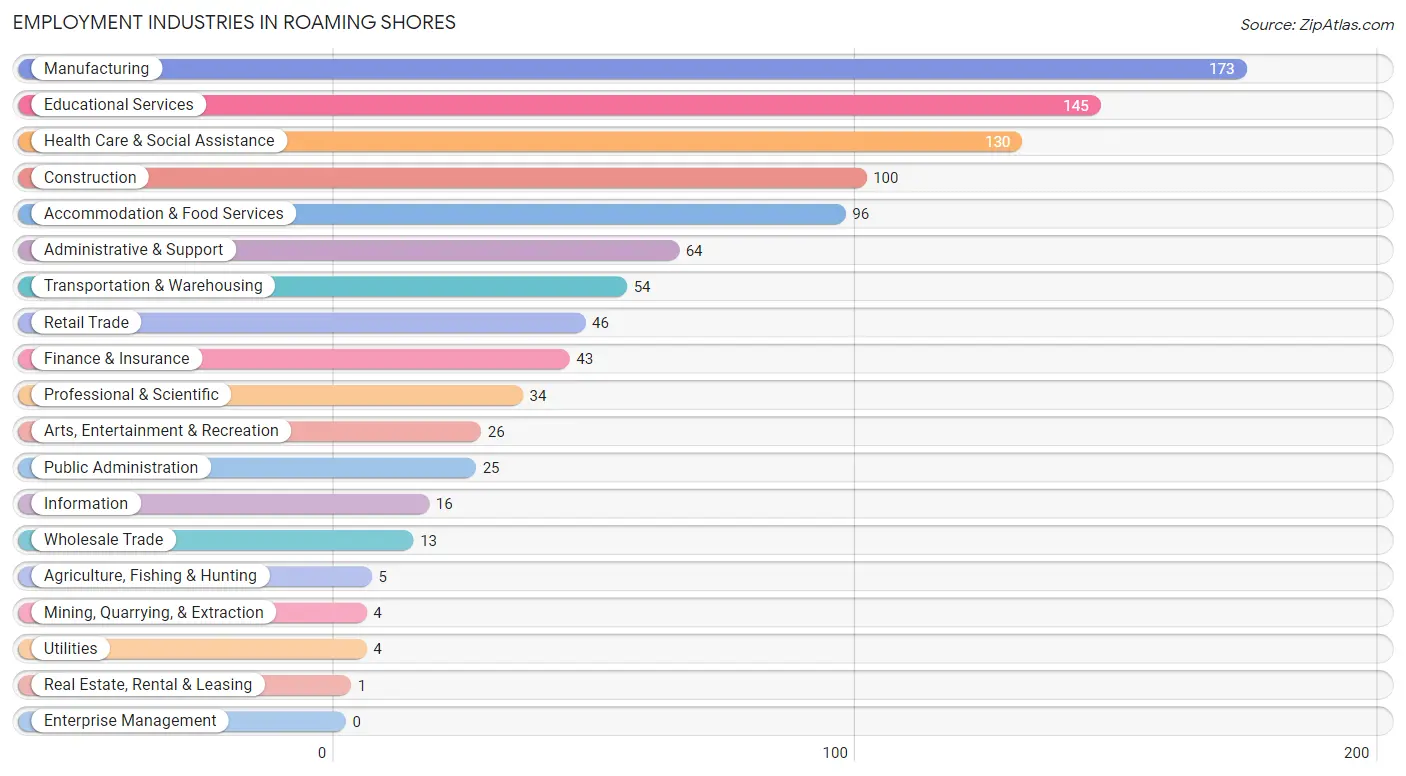
Employment Industries in Roaming Shores
The major employment industries in Roaming Shores include Manufacturing (173 | 17.1%), Educational Services (145 | 14.3%), Health Care & Social Assistance (130 | 12.9%), Construction (100 | 9.9%), and Accommodation & Food Services (96 | 9.5%).
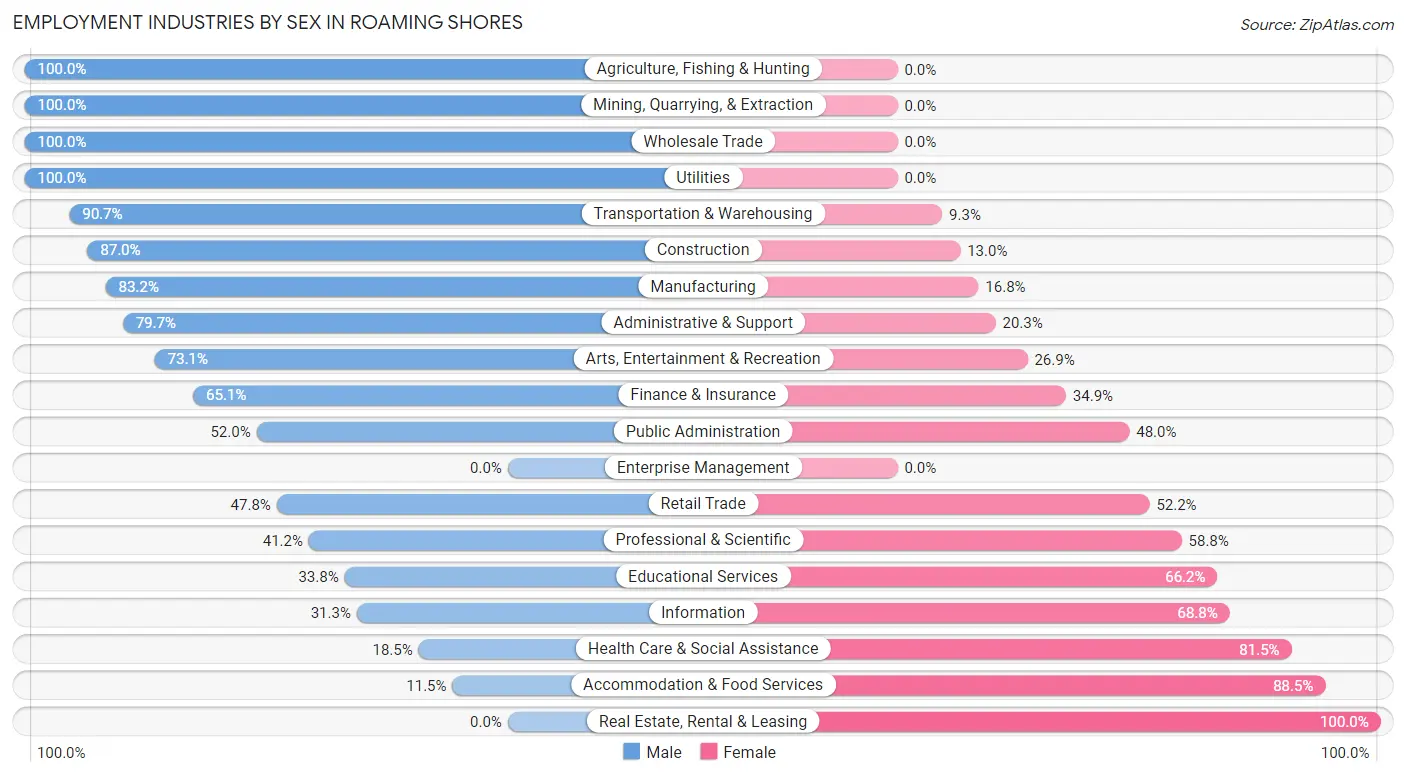
Employment Industries by Sex in Roaming Shores
The Roaming Shores industries that see more men than women are Agriculture, Fishing & Hunting (100.0%), Mining, Quarrying, & Extraction (100.0%), and Wholesale Trade (100.0%), whereas the industries that tend to have a higher number of women are Real Estate, Rental & Leasing (100.0%), Accommodation & Food Services (88.5%), and Health Care & Social Assistance (81.5%).
| Industry | Male | Female |
| Agriculture, Fishing & Hunting | 5 (100.0%) | 0 (0.0%) |
| Mining, Quarrying, & Extraction | 4 (100.0%) | 0 (0.0%) |
| Construction | 87 (87.0%) | 13 (13.0%) |
| Manufacturing | 144 (83.2%) | 29 (16.8%) |
| Wholesale Trade | 13 (100.0%) | 0 (0.0%) |
| Retail Trade | 22 (47.8%) | 24 (52.2%) |
| Transportation & Warehousing | 49 (90.7%) | 5 (9.3%) |
| Utilities | 4 (100.0%) | 0 (0.0%) |
| Information | 5 (31.2%) | 11 (68.8%) |
| Finance & Insurance | 28 (65.1%) | 15 (34.9%) |
| Real Estate, Rental & Leasing | 0 (0.0%) | 1 (100.0%) |
| Professional & Scientific | 14 (41.2%) | 20 (58.8%) |
| Enterprise Management | 0 (0.0%) | 0 (0.0%) |
| Administrative & Support | 51 (79.7%) | 13 (20.3%) |
| Educational Services | 49 (33.8%) | 96 (66.2%) |
| Health Care & Social Assistance | 24 (18.5%) | 106 (81.5%) |
| Arts, Entertainment & Recreation | 19 (73.1%) | 7 (26.9%) |
| Accommodation & Food Services | 11 (11.5%) | 85 (88.5%) |
| Public Administration | 13 (52.0%) | 12 (48.0%) |
| Total | 556 (55.0%) | 455 (45.0%) |
Education in Roaming Shores
School Enrollment in Roaming Shores
The most common levels of schooling among the 510 students in Roaming Shores are middle school (158 | 31.0%), high school (122 | 23.9%), and elementary school (115 | 22.6%).
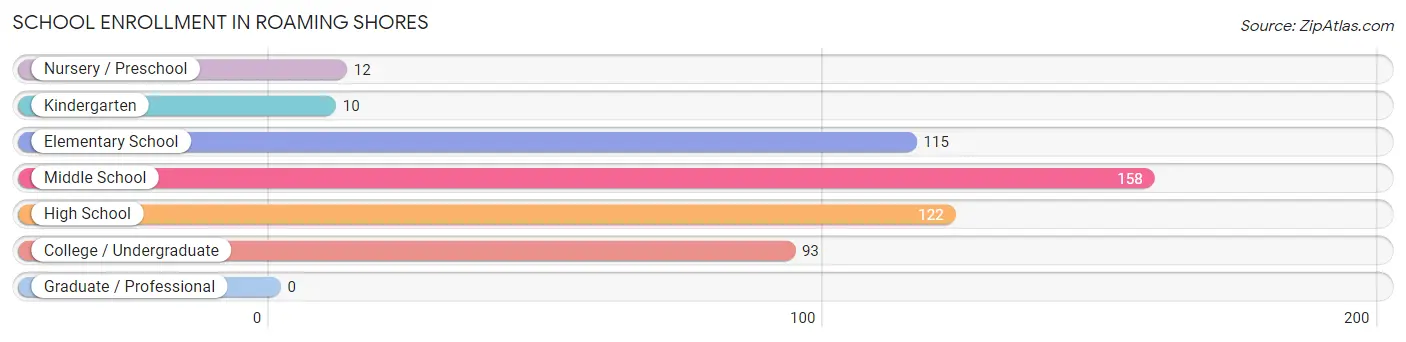
| School Level | # Students | % Students |
| Nursery / Preschool | 12 | 2.4% |
| Kindergarten | 10 | 2.0% |
| Elementary School | 115 | 22.6% |
| Middle School | 158 | 31.0% |
| High School | 122 | 23.9% |
| College / Undergraduate | 93 | 18.2% |
| Graduate / Professional | 0 | 0.0% |
| Total | 510 | 100.0% |
School Enrollment by Age by Funding Source in Roaming Shores
Out of a total of 510 students who are enrolled in schools in Roaming Shores, 23 (4.5%) attend a private institution, while the remaining 487 (95.5%) are enrolled in public schools. The age group of 18 to 19 year olds has the highest likelihood of being enrolled in private schools, with 3 (12.0% in the age bracket) enrolled. Conversely, the age group of 3 to 4 year olds has the lowest likelihood of being enrolled in a private school, with 12 (100.0% in the age bracket) attending a public institution.
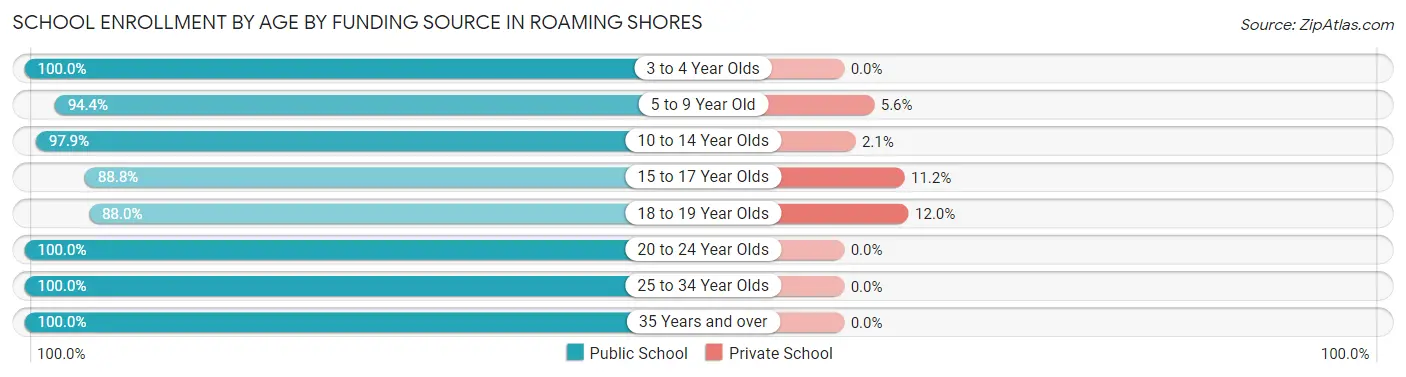
| Age Bracket | Public School | Private School |
| 3 to 4 Year Olds | 12 (100.0%) | 0 (0.0%) |
| 5 to 9 Year Old | 101 (94.4%) | 6 (5.6%) |
| 10 to 14 Year Olds | 186 (97.9%) | 4 (2.1%) |
| 15 to 17 Year Olds | 79 (88.8%) | 10 (11.2%) |
| 18 to 19 Year Olds | 22 (88.0%) | 3 (12.0%) |
| 20 to 24 Year Olds | 16 (100.0%) | 0 (0.0%) |
| 25 to 34 Year Olds | 22 (100.0%) | 0 (0.0%) |
| 35 Years and over | 49 (100.0%) | 0 (0.0%) |
| Total | 487 (95.5%) | 23 (4.5%) |
Educational Attainment by Field of Study in Roaming Shores
Education (102 | 23.3%), science & technology (59 | 13.5%), business (54 | 12.4%), engineering (42 | 9.6%), and social sciences (30 | 6.9%) are the most common fields of study among 437 individuals in Roaming Shores who have obtained a bachelor's degree or higher.
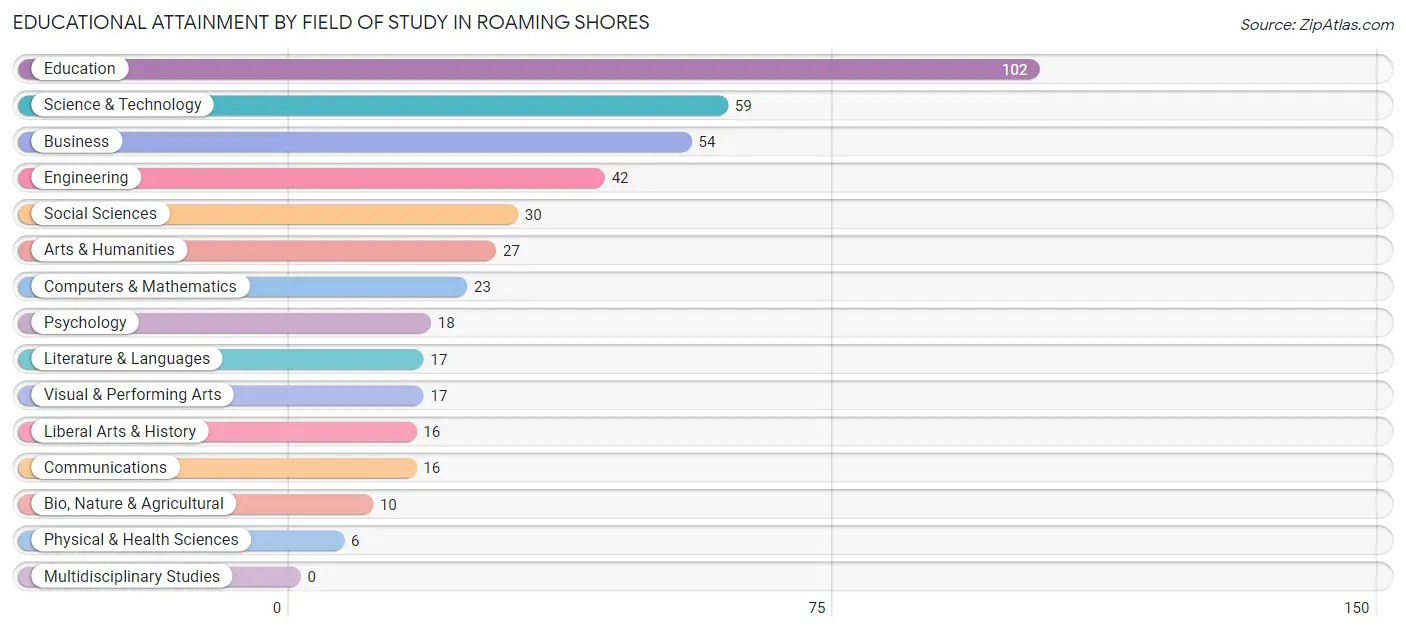
| Field of Study | # Graduates | % Graduates |
| Computers & Mathematics | 23 | 5.3% |
| Bio, Nature & Agricultural | 10 | 2.3% |
| Physical & Health Sciences | 6 | 1.4% |
| Psychology | 18 | 4.1% |
| Social Sciences | 30 | 6.9% |
| Engineering | 42 | 9.6% |
| Multidisciplinary Studies | 0 | 0.0% |
| Science & Technology | 59 | 13.5% |
| Business | 54 | 12.4% |
| Education | 102 | 23.3% |
| Literature & Languages | 17 | 3.9% |
| Liberal Arts & History | 16 | 3.7% |
| Visual & Performing Arts | 17 | 3.9% |
| Communications | 16 | 3.7% |
| Arts & Humanities | 27 | 6.2% |
| Total | 437 | 100.0% |
Transportation & Commute in Roaming Shores
Vehicle Availability by Sex in Roaming Shores
The most prevalent vehicle ownership categories in Roaming Shores are males with 2 vehicles (253, accounting for 46.4%) and females with 2 vehicles (173, making up 55.6%).
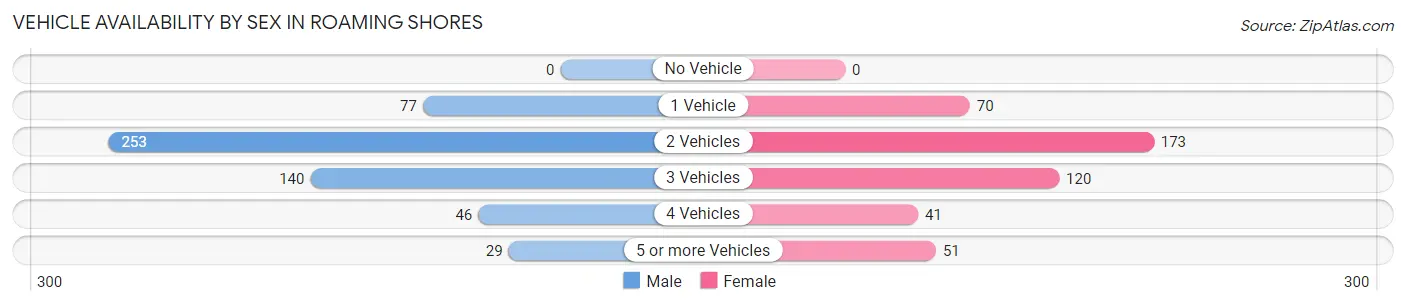
| Vehicles Available | Male | Female |
| No Vehicle | 0 (0.0%) | 0 (0.0%) |
| 1 Vehicle | 77 (14.1%) | 70 (15.4%) |
| 2 Vehicles | 253 (46.4%) | 173 (38.0%) |
| 3 Vehicles | 140 (25.7%) | 120 (26.4%) |
| 4 Vehicles | 46 (8.4%) | 41 (9.0%) |
| 5 or more Vehicles | 29 (5.3%) | 51 (11.2%) |
| Total | 545 (100.0%) | 455 (100.0%) |
Commute Time in Roaming Shores
The most frequently occuring commute durations in Roaming Shores are 40 to 44 minutes (151 commuters, 15.9%), 45 to 59 minutes (150 commuters, 15.8%), and 10 to 14 minutes (128 commuters, 13.5%).
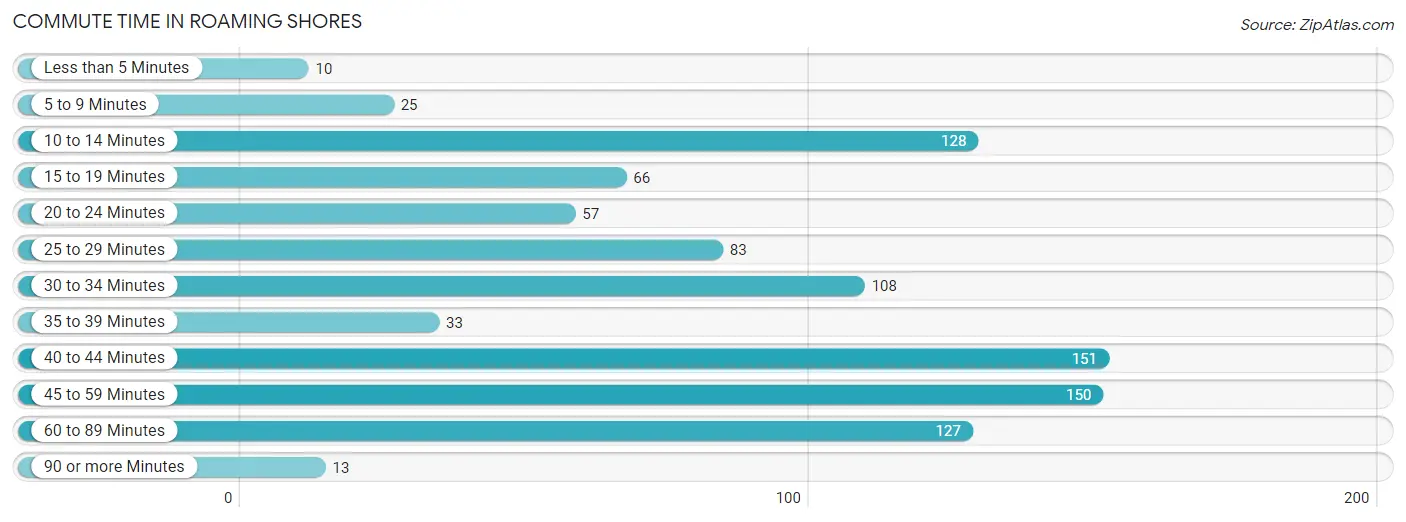
| Commute Time | # Commuters | % Commuters |
| Less than 5 Minutes | 10 | 1.1% |
| 5 to 9 Minutes | 25 | 2.6% |
| 10 to 14 Minutes | 128 | 13.5% |
| 15 to 19 Minutes | 66 | 6.9% |
| 20 to 24 Minutes | 57 | 6.0% |
| 25 to 29 Minutes | 83 | 8.7% |
| 30 to 34 Minutes | 108 | 11.4% |
| 35 to 39 Minutes | 33 | 3.5% |
| 40 to 44 Minutes | 151 | 15.9% |
| 45 to 59 Minutes | 150 | 15.8% |
| 60 to 89 Minutes | 127 | 13.4% |
| 90 or more Minutes | 13 | 1.4% |
Commute Time by Sex in Roaming Shores
The most common commute times in Roaming Shores are 45 to 59 minutes (111 commuters, 21.3%) for males and 10 to 14 minutes (88 commuters, 20.4%) for females.
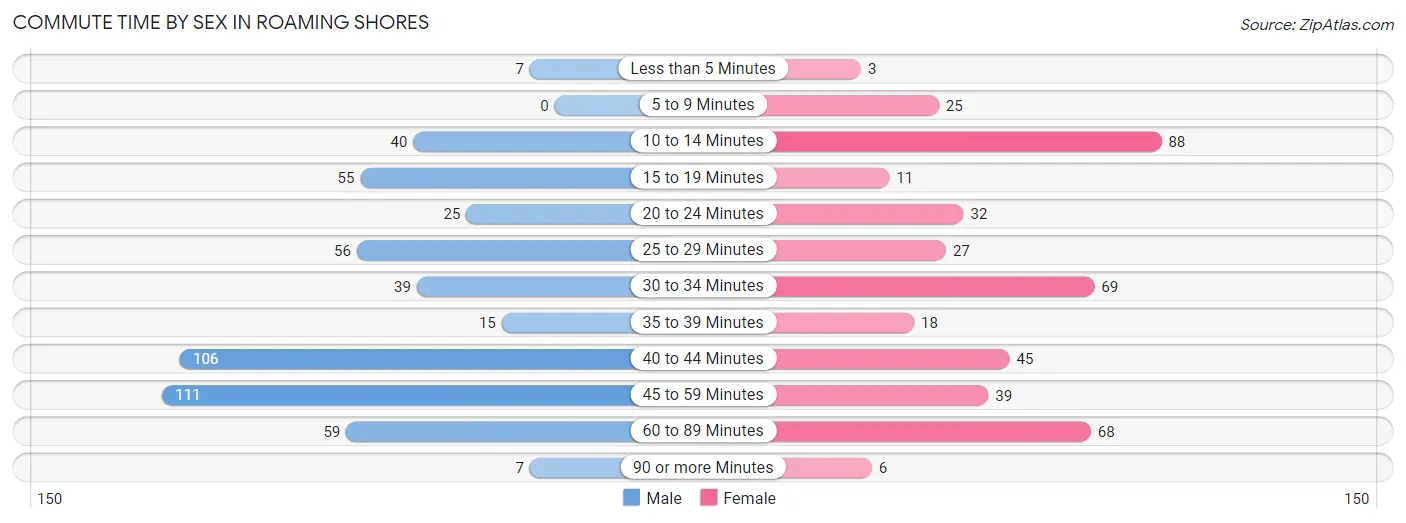
| Commute Time | Male | Female |
| Less than 5 Minutes | 7 (1.3%) | 3 (0.7%) |
| 5 to 9 Minutes | 0 (0.0%) | 25 (5.8%) |
| 10 to 14 Minutes | 40 (7.7%) | 88 (20.4%) |
| 15 to 19 Minutes | 55 (10.6%) | 11 (2.5%) |
| 20 to 24 Minutes | 25 (4.8%) | 32 (7.4%) |
| 25 to 29 Minutes | 56 (10.8%) | 27 (6.3%) |
| 30 to 34 Minutes | 39 (7.5%) | 69 (16.0%) |
| 35 to 39 Minutes | 15 (2.9%) | 18 (4.2%) |
| 40 to 44 Minutes | 106 (20.4%) | 45 (10.4%) |
| 45 to 59 Minutes | 111 (21.3%) | 39 (9.0%) |
| 60 to 89 Minutes | 59 (11.4%) | 68 (15.8%) |
| 90 or more Minutes | 7 (1.3%) | 6 (1.4%) |
Time of Departure to Work by Sex in Roaming Shores
The most frequent times of departure to work in Roaming Shores are 12:00 AM to 4:59 AM (81, 15.6%) for males and 8:00 AM to 8:29 AM (86, 20.0%) for females.
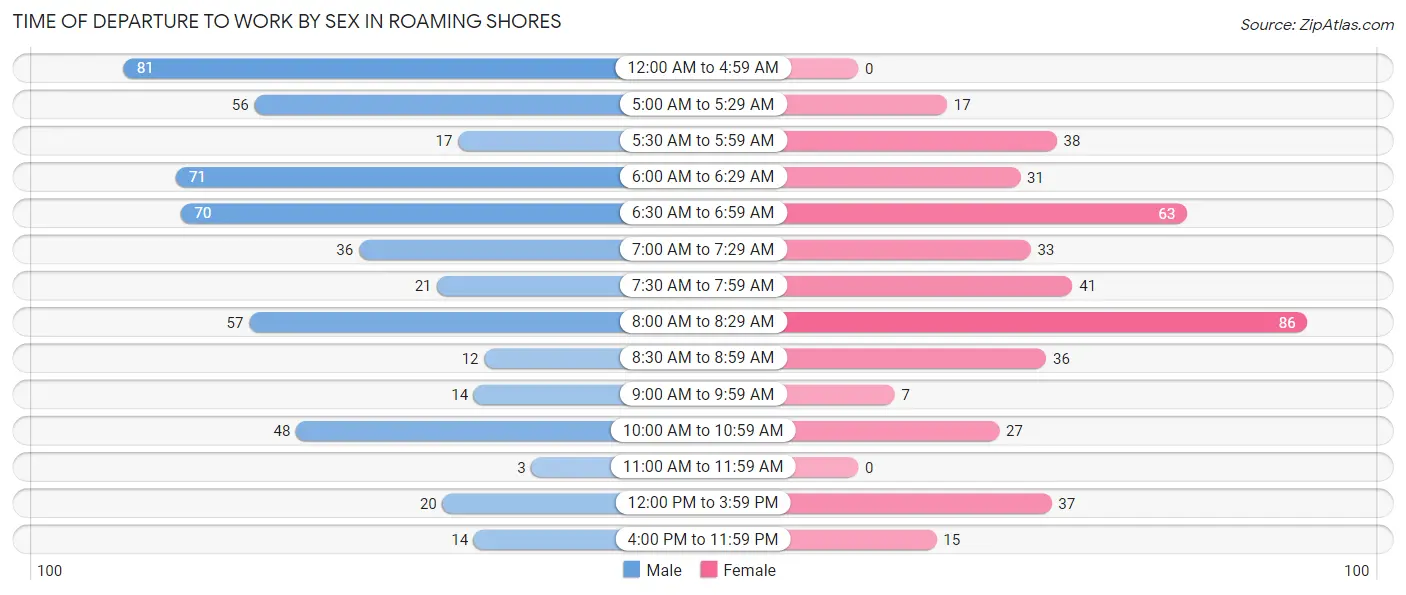
| Time of Departure | Male | Female |
| 12:00 AM to 4:59 AM | 81 (15.6%) | 0 (0.0%) |
| 5:00 AM to 5:29 AM | 56 (10.8%) | 17 (3.9%) |
| 5:30 AM to 5:59 AM | 17 (3.3%) | 38 (8.8%) |
| 6:00 AM to 6:29 AM | 71 (13.7%) | 31 (7.2%) |
| 6:30 AM to 6:59 AM | 70 (13.5%) | 63 (14.6%) |
| 7:00 AM to 7:29 AM | 36 (6.9%) | 33 (7.7%) |
| 7:30 AM to 7:59 AM | 21 (4.0%) | 41 (9.5%) |
| 8:00 AM to 8:29 AM | 57 (11.0%) | 86 (20.0%) |
| 8:30 AM to 8:59 AM | 12 (2.3%) | 36 (8.4%) |
| 9:00 AM to 9:59 AM | 14 (2.7%) | 7 (1.6%) |
| 10:00 AM to 10:59 AM | 48 (9.2%) | 27 (6.3%) |
| 11:00 AM to 11:59 AM | 3 (0.6%) | 0 (0.0%) |
| 12:00 PM to 3:59 PM | 20 (3.8%) | 37 (8.6%) |
| 4:00 PM to 11:59 PM | 14 (2.7%) | 15 (3.5%) |
| Total | 520 (100.0%) | 431 (100.0%) |
Housing Occupancy in Roaming Shores
Occupancy by Ownership in Roaming Shores
Of the total 758 dwellings in Roaming Shores, owner-occupied units account for 744 (98.2%), while renter-occupied units make up 14 (1.8%).
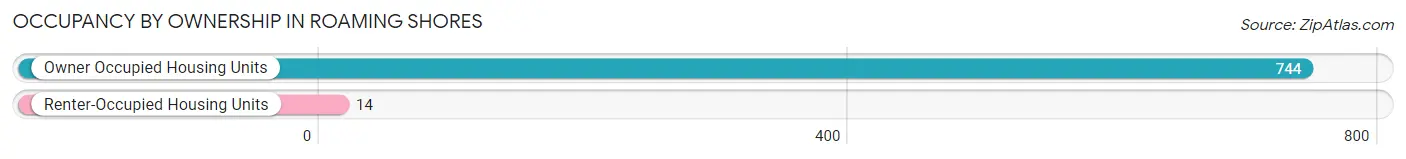
| Occupancy | # Housing Units | % Housing Units |
| Owner Occupied Housing Units | 744 | 98.2% |
| Renter-Occupied Housing Units | 14 | 1.8% |
| Total Occupied Housing Units | 758 | 100.0% |
Occupancy by Household Size in Roaming Shores
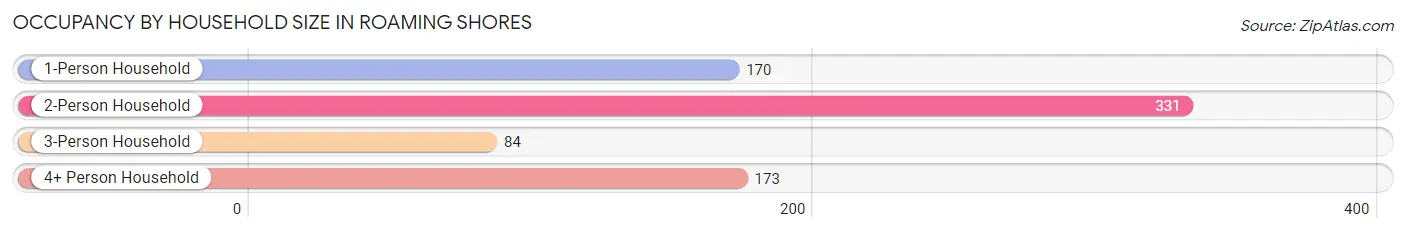
| Household Size | # Housing Units | % Housing Units |
| 1-Person Household | 170 | 22.4% |
| 2-Person Household | 331 | 43.7% |
| 3-Person Household | 84 | 11.1% |
| 4+ Person Household | 173 | 22.8% |
| Total Housing Units | 758 | 100.0% |
Occupancy by Ownership by Household Size in Roaming Shores
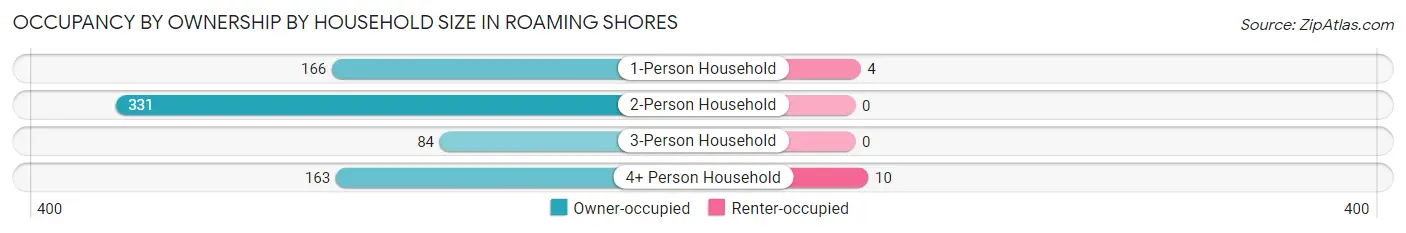
| Household Size | Owner-occupied | Renter-occupied |
| 1-Person Household | 166 (97.7%) | 4 (2.4%) |
| 2-Person Household | 331 (100.0%) | 0 (0.0%) |
| 3-Person Household | 84 (100.0%) | 0 (0.0%) |
| 4+ Person Household | 163 (94.2%) | 10 (5.8%) |
| Total Housing Units | 744 (98.2%) | 14 (1.8%) |
Occupancy by Educational Attainment in Roaming Shores
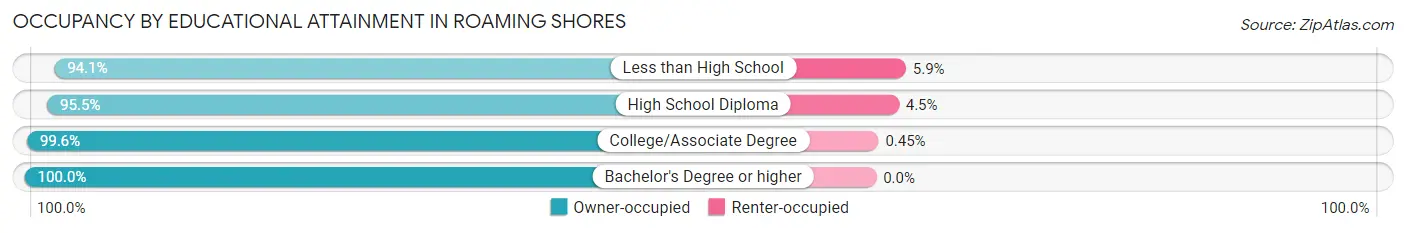
| Household Size | Owner-occupied | Renter-occupied |
| Less than High School | 64 (94.1%) | 4 (5.9%) |
| High School Diploma | 192 (95.5%) | 9 (4.5%) |
| College/Associate Degree | 222 (99.6%) | 1 (0.4%) |
| Bachelor's Degree or higher | 266 (100.0%) | 0 (0.0%) |
Occupancy by Age of Householder in Roaming Shores
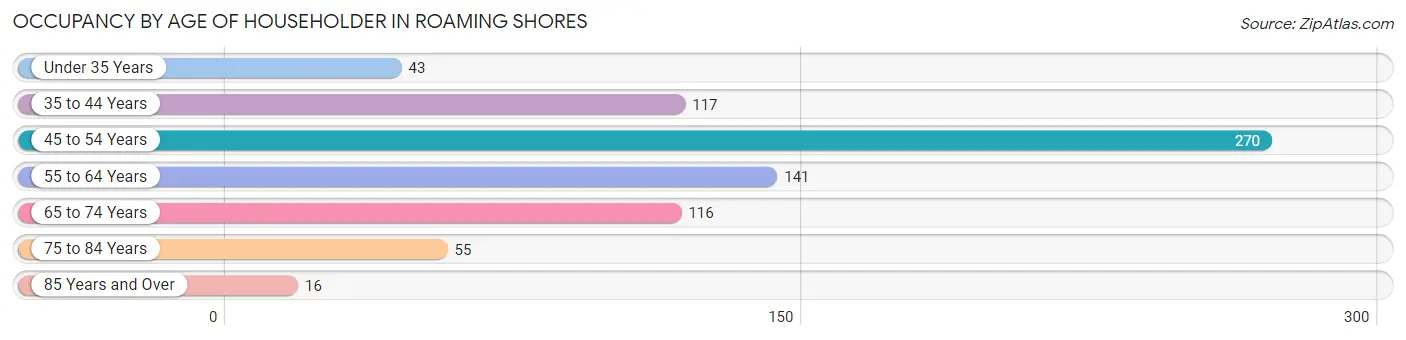
| Age Bracket | # Households | % Households |
| Under 35 Years | 43 | 5.7% |
| 35 to 44 Years | 117 | 15.4% |
| 45 to 54 Years | 270 | 35.6% |
| 55 to 64 Years | 141 | 18.6% |
| 65 to 74 Years | 116 | 15.3% |
| 75 to 84 Years | 55 | 7.3% |
| 85 Years and Over | 16 | 2.1% |
| Total | 758 | 100.0% |
Housing Finances in Roaming Shores
Median Income by Occupancy in Roaming Shores
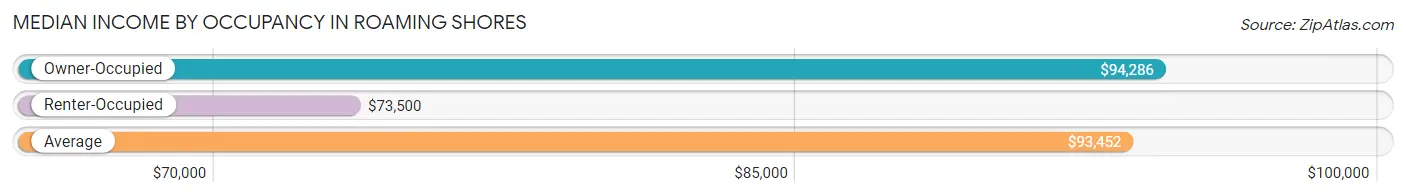
| Occupancy Type | # Households | Median Income |
| Owner-Occupied | 744 (98.2%) | $94,286 |
| Renter-Occupied | 14 (1.8%) | $73,500 |
| Average | 758 (100.0%) | $93,452 |
Occupancy by Householder Income Bracket in Roaming Shores
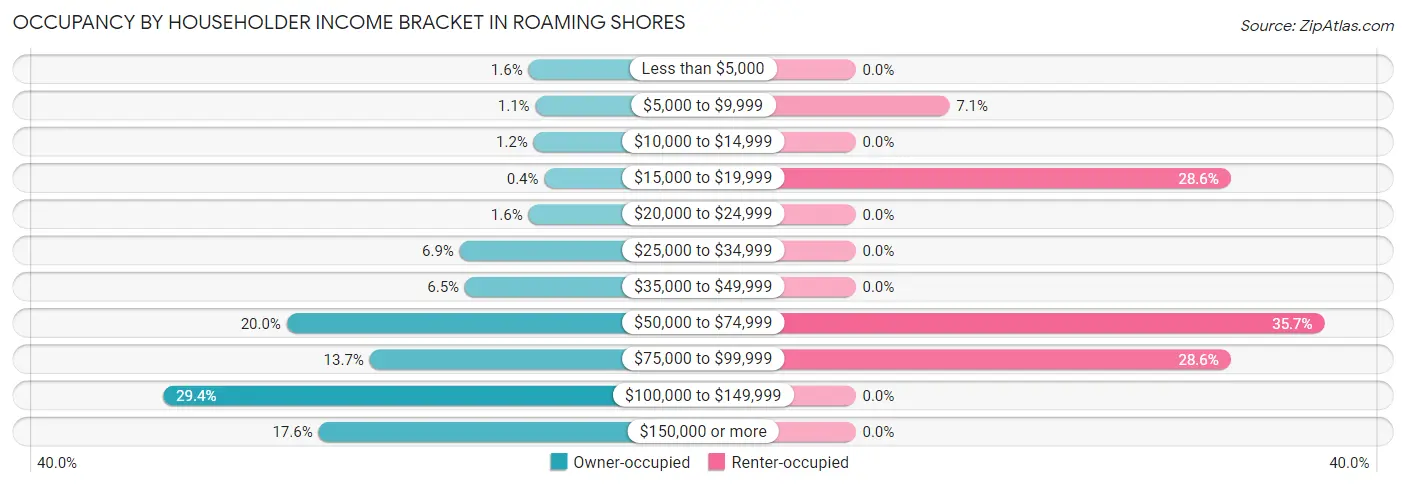
| Income Bracket | Owner-occupied | Renter-occupied |
| Less than $5,000 | 12 (1.6%) | 0 (0.0%) |
| $5,000 to $9,999 | 8 (1.1%) | 1 (7.1%) |
| $10,000 to $14,999 | 9 (1.2%) | 0 (0.0%) |
| $15,000 to $19,999 | 3 (0.4%) | 4 (28.6%) |
| $20,000 to $24,999 | 12 (1.6%) | 0 (0.0%) |
| $25,000 to $34,999 | 51 (6.9%) | 0 (0.0%) |
| $35,000 to $49,999 | 48 (6.5%) | 0 (0.0%) |
| $50,000 to $74,999 | 149 (20.0%) | 5 (35.7%) |
| $75,000 to $99,999 | 102 (13.7%) | 4 (28.6%) |
| $100,000 to $149,999 | 219 (29.4%) | 0 (0.0%) |
| $150,000 or more | 131 (17.6%) | 0 (0.0%) |
| Total | 744 (100.0%) | 14 (100.0%) |
Monthly Housing Cost Tiers in Roaming Shores
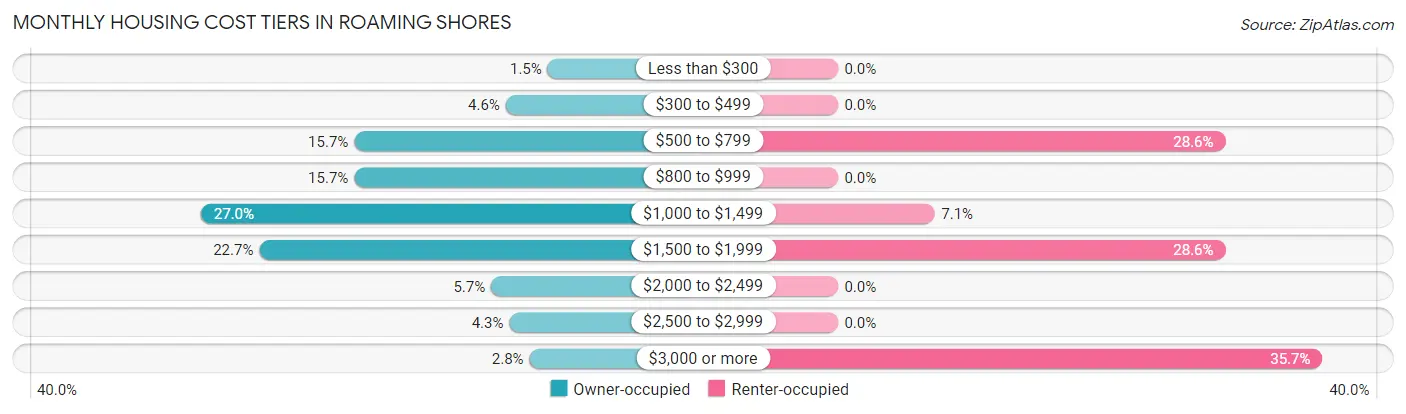
| Monthly Cost | Owner-occupied | Renter-occupied |
| Less than $300 | 11 (1.5%) | 0 (0.0%) |
| $300 to $499 | 34 (4.6%) | 0 (0.0%) |
| $500 to $799 | 117 (15.7%) | 4 (28.6%) |
| $800 to $999 | 117 (15.7%) | 0 (0.0%) |
| $1,000 to $1,499 | 201 (27.0%) | 1 (7.1%) |
| $1,500 to $1,999 | 169 (22.7%) | 4 (28.6%) |
| $2,000 to $2,499 | 42 (5.7%) | 0 (0.0%) |
| $2,500 to $2,999 | 32 (4.3%) | 0 (0.0%) |
| $3,000 or more | 21 (2.8%) | 5 (35.7%) |
| Total | 744 (100.0%) | 14 (100.0%) |
Physical Housing Characteristics in Roaming Shores
Housing Structures in Roaming Shores
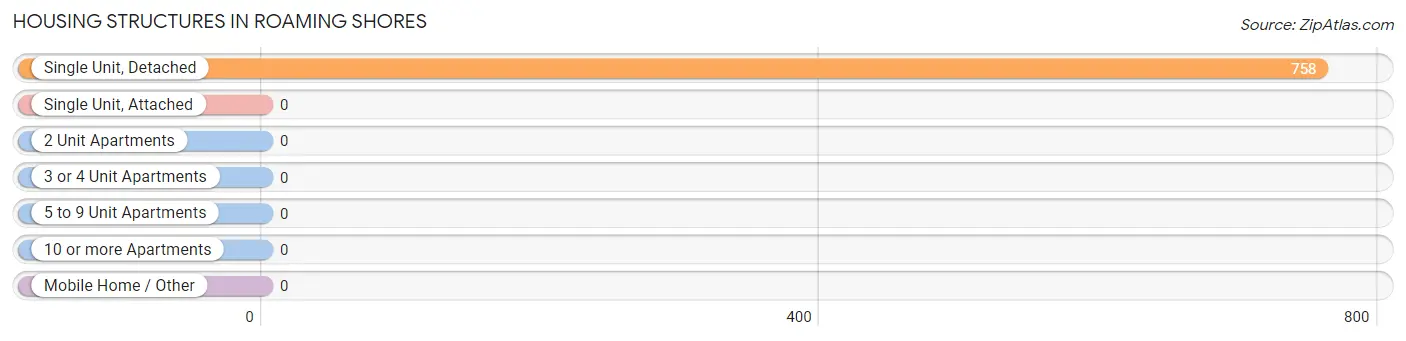
| Structure Type | # Housing Units | % Housing Units |
| Single Unit, Detached | 758 | 100.0% |
| Single Unit, Attached | 0 | 0.0% |
| 2 Unit Apartments | 0 | 0.0% |
| 3 or 4 Unit Apartments | 0 | 0.0% |
| 5 to 9 Unit Apartments | 0 | 0.0% |
| 10 or more Apartments | 0 | 0.0% |
| Mobile Home / Other | 0 | 0.0% |
| Total | 758 | 100.0% |
Housing Structures by Occupancy in Roaming Shores
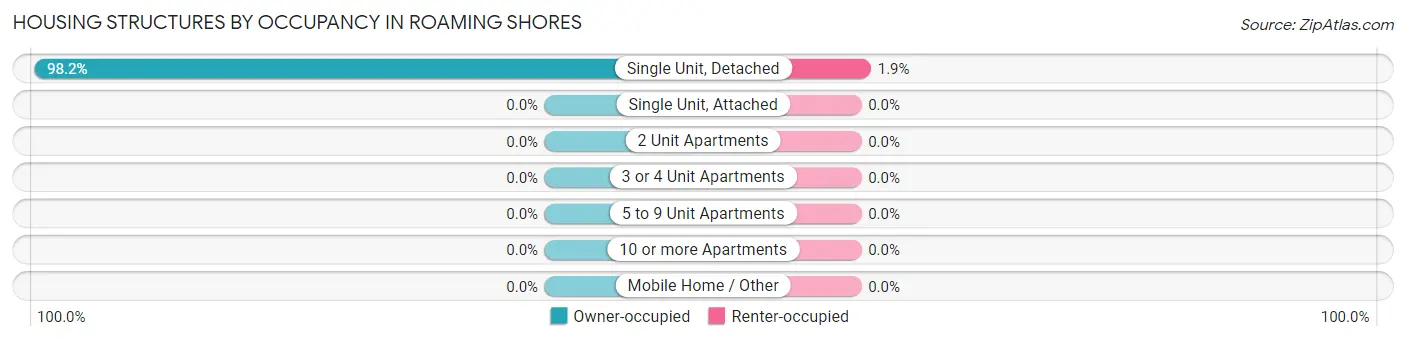
| Structure Type | Owner-occupied | Renter-occupied |
| Single Unit, Detached | 744 (98.2%) | 14 (1.8%) |
| Single Unit, Attached | 0 (0.0%) | 0 (0.0%) |
| 2 Unit Apartments | 0 (0.0%) | 0 (0.0%) |
| 3 or 4 Unit Apartments | 0 (0.0%) | 0 (0.0%) |
| 5 to 9 Unit Apartments | 0 (0.0%) | 0 (0.0%) |
| 10 or more Apartments | 0 (0.0%) | 0 (0.0%) |
| Mobile Home / Other | 0 (0.0%) | 0 (0.0%) |
| Total | 744 (98.2%) | 14 (1.8%) |
Housing Structures by Number of Rooms in Roaming Shores
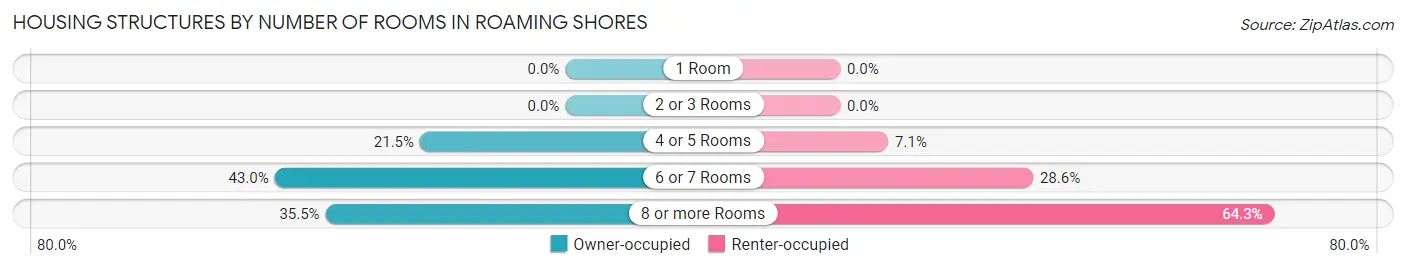
| Number of Rooms | Owner-occupied | Renter-occupied |
| 1 Room | 0 (0.0%) | 0 (0.0%) |
| 2 or 3 Rooms | 0 (0.0%) | 0 (0.0%) |
| 4 or 5 Rooms | 160 (21.5%) | 1 (7.1%) |
| 6 or 7 Rooms | 320 (43.0%) | 4 (28.6%) |
| 8 or more Rooms | 264 (35.5%) | 9 (64.3%) |
| Total | 744 (100.0%) | 14 (100.0%) |
Housing Structure by Heating Type in Roaming Shores
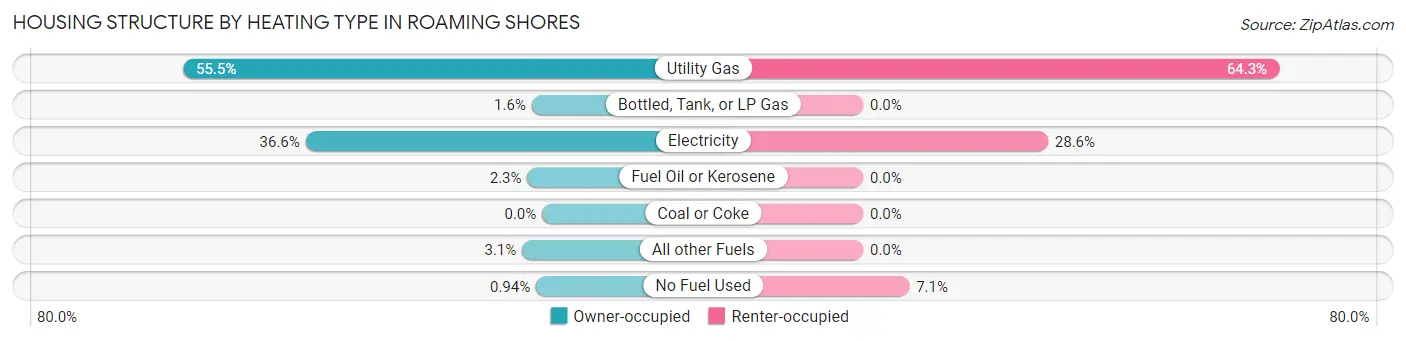
| Heating Type | Owner-occupied | Renter-occupied |
| Utility Gas | 413 (55.5%) | 9 (64.3%) |
| Bottled, Tank, or LP Gas | 12 (1.6%) | 0 (0.0%) |
| Electricity | 272 (36.6%) | 4 (28.6%) |
| Fuel Oil or Kerosene | 17 (2.3%) | 0 (0.0%) |
| Coal or Coke | 0 (0.0%) | 0 (0.0%) |
| All other Fuels | 23 (3.1%) | 0 (0.0%) |
| No Fuel Used | 7 (0.9%) | 1 (7.1%) |
| Total | 744 (100.0%) | 14 (100.0%) |
Household Vehicle Usage in Roaming Shores
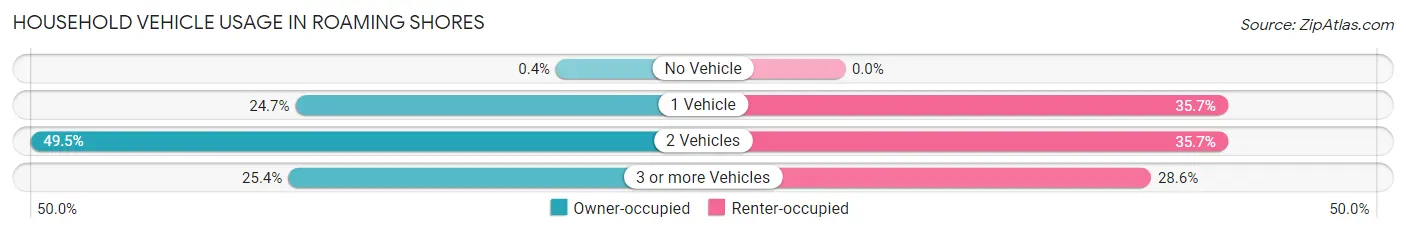
| Vehicles per Household | Owner-occupied | Renter-occupied |
| No Vehicle | 3 (0.4%) | 0 (0.0%) |
| 1 Vehicle | 184 (24.7%) | 5 (35.7%) |
| 2 Vehicles | 368 (49.5%) | 5 (35.7%) |
| 3 or more Vehicles | 189 (25.4%) | 4 (28.6%) |
| Total | 744 (100.0%) | 14 (100.0%) |
Real Estate & Mortgages in Roaming Shores
Real Estate and Mortgage Overview in Roaming Shores
| Characteristic | Without Mortgage | With Mortgage |
| Housing Units | 249 | 495 |
| Median Property Value | $306,400 | $182,300 |
| Median Household Income | $85,221 | $82 |
| Monthly Housing Costs | $746 | $21 |
| Real Estate Taxes | $4,517 | $18 |
Property Value by Mortgage Status in Roaming Shores
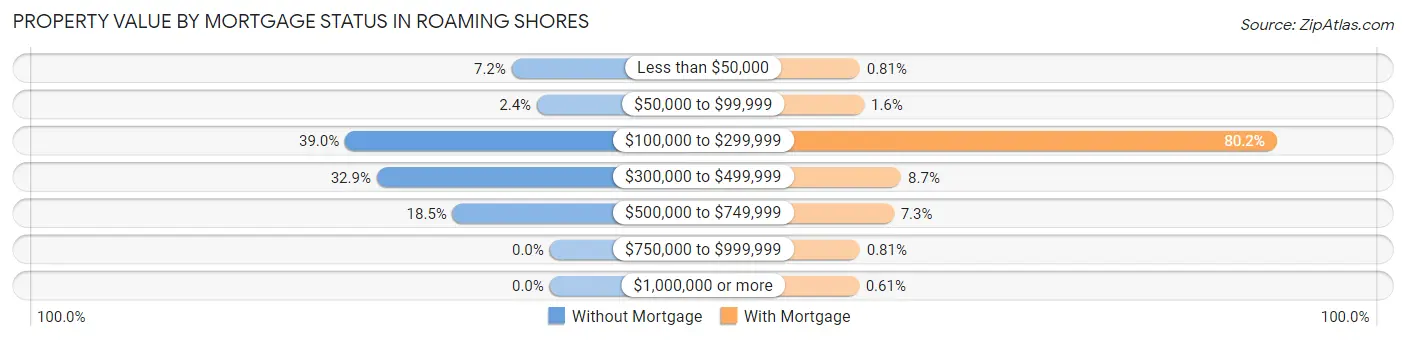
| Property Value | Without Mortgage | With Mortgage |
| Less than $50,000 | 18 (7.2%) | 4 (0.8%) |
| $50,000 to $99,999 | 6 (2.4%) | 8 (1.6%) |
| $100,000 to $299,999 | 97 (39.0%) | 397 (80.2%) |
| $300,000 to $499,999 | 82 (32.9%) | 43 (8.7%) |
| $500,000 to $749,999 | 46 (18.5%) | 36 (7.3%) |
| $750,000 to $999,999 | 0 (0.0%) | 4 (0.8%) |
| $1,000,000 or more | 0 (0.0%) | 3 (0.6%) |
| Total | 249 (100.0%) | 495 (100.0%) |
Household Income by Mortgage Status in Roaming Shores
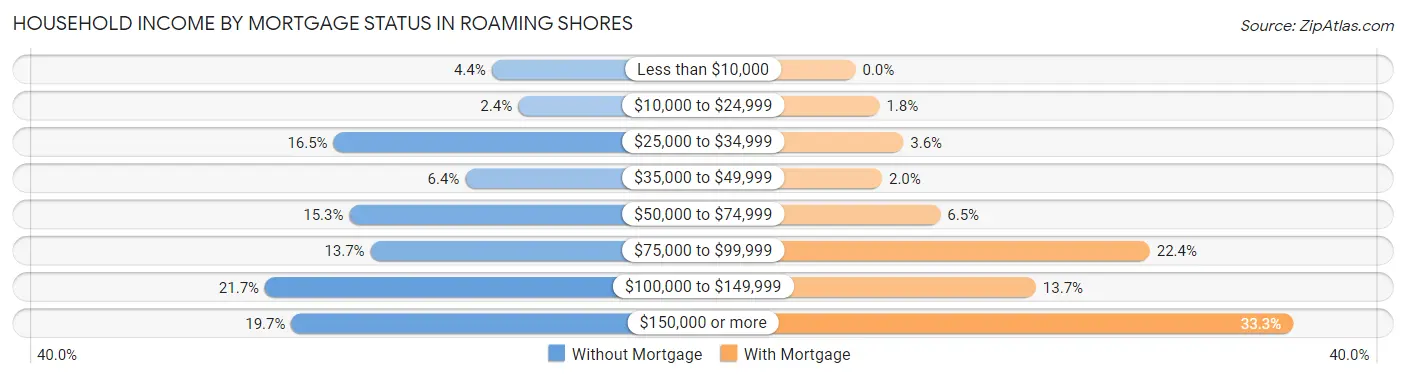
| Household Income | Without Mortgage | With Mortgage |
| Less than $10,000 | 11 (4.4%) | 0 (0.0%) |
| $10,000 to $24,999 | 6 (2.4%) | 9 (1.8%) |
| $25,000 to $34,999 | 41 (16.5%) | 18 (3.6%) |
| $35,000 to $49,999 | 16 (6.4%) | 10 (2.0%) |
| $50,000 to $74,999 | 38 (15.3%) | 32 (6.5%) |
| $75,000 to $99,999 | 34 (13.7%) | 111 (22.4%) |
| $100,000 to $149,999 | 54 (21.7%) | 68 (13.7%) |
| $150,000 or more | 49 (19.7%) | 165 (33.3%) |
| Total | 249 (100.0%) | 495 (100.0%) |
Property Value to Household Income Ratio in Roaming Shores
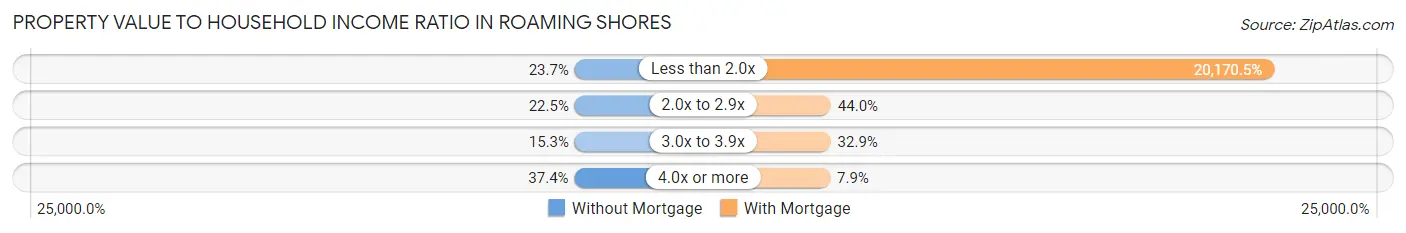
| Value-to-Income Ratio | Without Mortgage | With Mortgage |
| Less than 2.0x | 59 (23.7%) | 99,844 (20,170.5%) |
| 2.0x to 2.9x | 56 (22.5%) | 218 (44.0%) |
| 3.0x to 3.9x | 38 (15.3%) | 163 (32.9%) |
| 4.0x or more | 93 (37.3%) | 39 (7.9%) |
| Total | 249 (100.0%) | 495 (100.0%) |
Real Estate Taxes by Mortgage Status in Roaming Shores
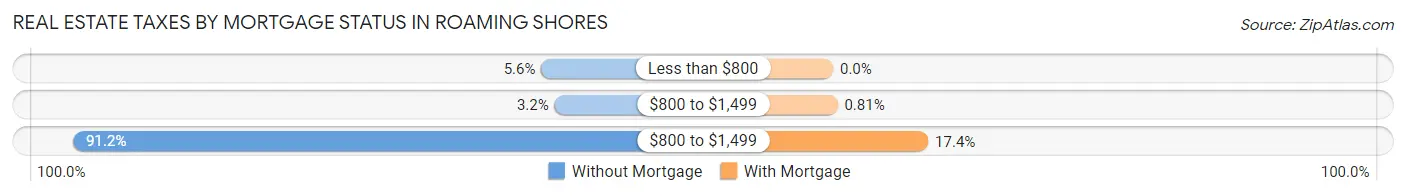
| Property Taxes | Without Mortgage | With Mortgage |
| Less than $800 | 14 (5.6%) | 0 (0.0%) |
| $800 to $1,499 | 8 (3.2%) | 4 (0.8%) |
| $800 to $1,499 | 227 (91.2%) | 86 (17.4%) |
| Total | 249 (100.0%) | 495 (100.0%) |
Health & Disability in Roaming Shores
Health Insurance Coverage by Age in Roaming Shores
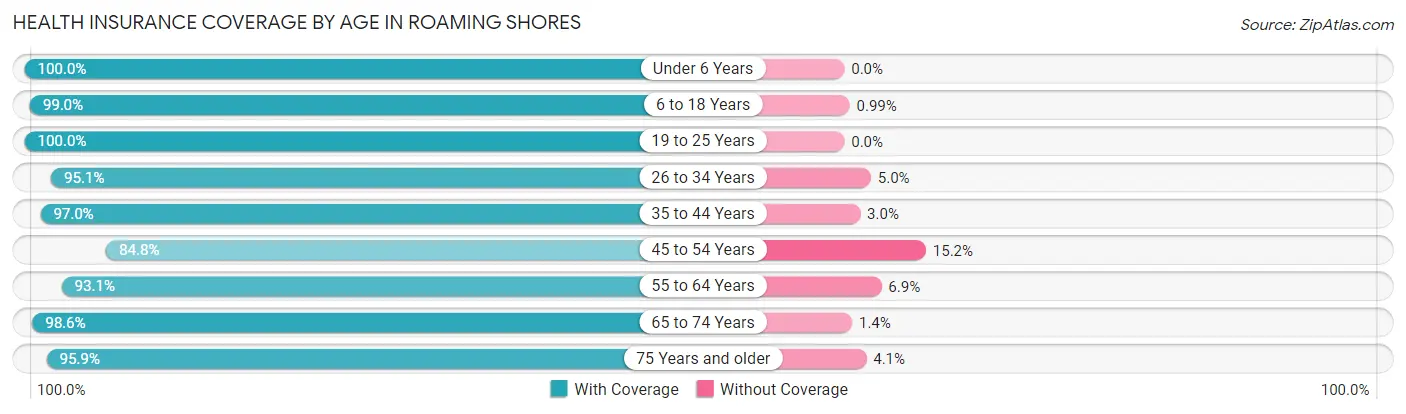
| Age Bracket | With Coverage | Without Coverage |
| Under 6 Years | 68 (100.0%) | 0 (0.0%) |
| 6 to 18 Years | 399 (99.0%) | 4 (1.0%) |
| 19 to 25 Years | 112 (100.0%) | 0 (0.0%) |
| 26 to 34 Years | 96 (95.1%) | 5 (5.0%) |
| 35 to 44 Years | 197 (97.0%) | 6 (3.0%) |
| 45 to 54 Years | 407 (84.8%) | 73 (15.2%) |
| 55 to 64 Years | 242 (93.1%) | 18 (6.9%) |
| 65 to 74 Years | 205 (98.6%) | 3 (1.4%) |
| 75 Years and older | 117 (95.9%) | 5 (4.1%) |
| Total | 1,843 (94.2%) | 114 (5.8%) |
Health Insurance Coverage by Citizenship Status in Roaming Shores
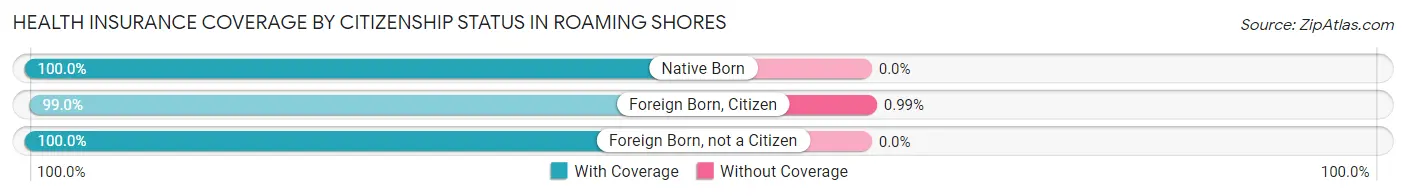
| Citizenship Status | With Coverage | Without Coverage |
| Native Born | 68 (100.0%) | 0 (0.0%) |
| Foreign Born, Citizen | 399 (99.0%) | 4 (1.0%) |
| Foreign Born, not a Citizen | 112 (100.0%) | 0 (0.0%) |
Health Insurance Coverage by Household Income in Roaming Shores
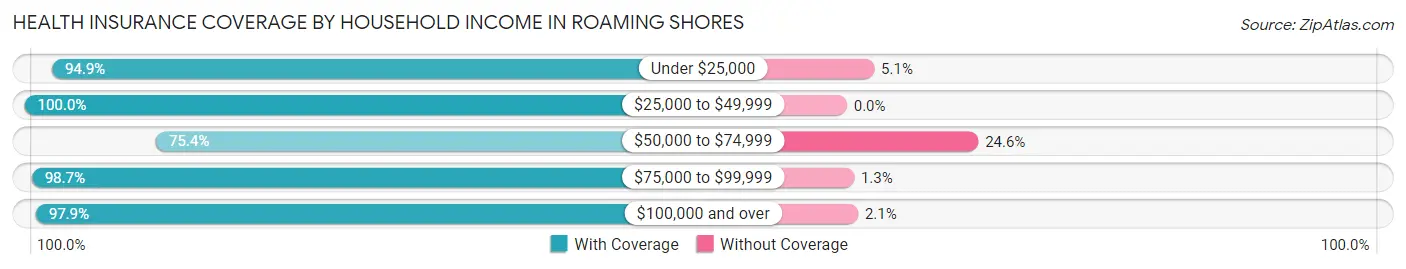
| Household Income | With Coverage | Without Coverage |
| Under $25,000 | 111 (94.9%) | 6 (5.1%) |
| $25,000 to $49,999 | 146 (100.0%) | 0 (0.0%) |
| $50,000 to $74,999 | 248 (75.4%) | 81 (24.6%) |
| $75,000 to $99,999 | 221 (98.7%) | 3 (1.3%) |
| $100,000 and over | 1,117 (97.9%) | 24 (2.1%) |
Public vs Private Health Insurance Coverage by Age in Roaming Shores
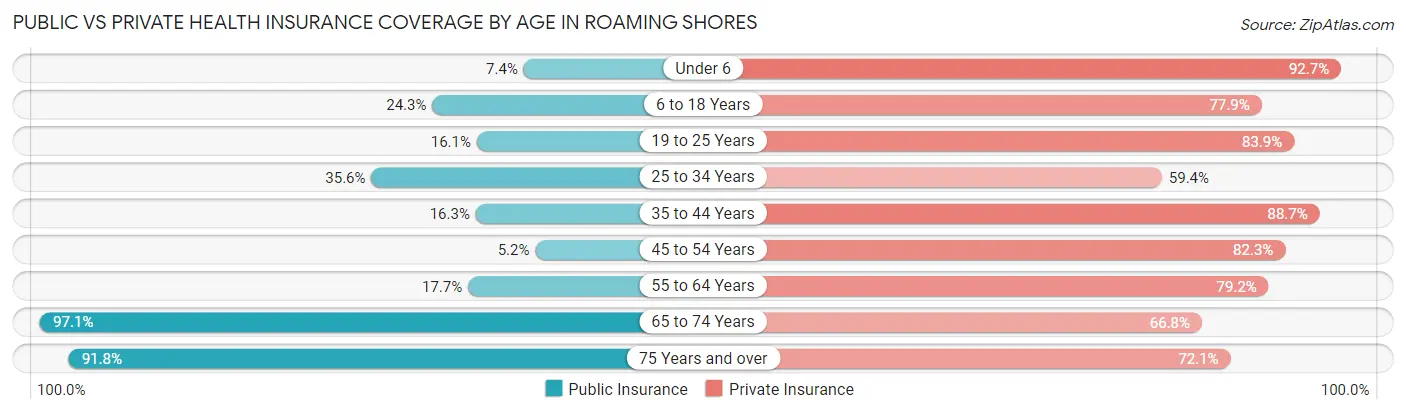
| Age Bracket | Public Insurance | Private Insurance |
| Under 6 | 5 (7.3%) | 63 (92.6%) |
| 6 to 18 Years | 98 (24.3%) | 314 (77.9%) |
| 19 to 25 Years | 18 (16.1%) | 94 (83.9%) |
| 25 to 34 Years | 36 (35.6%) | 60 (59.4%) |
| 35 to 44 Years | 33 (16.3%) | 180 (88.7%) |
| 45 to 54 Years | 25 (5.2%) | 395 (82.3%) |
| 55 to 64 Years | 46 (17.7%) | 206 (79.2%) |
| 65 to 74 Years | 202 (97.1%) | 139 (66.8%) |
| 75 Years and over | 112 (91.8%) | 88 (72.1%) |
| Total | 575 (29.4%) | 1,539 (78.6%) |
Disability Status by Sex by Age in Roaming Shores
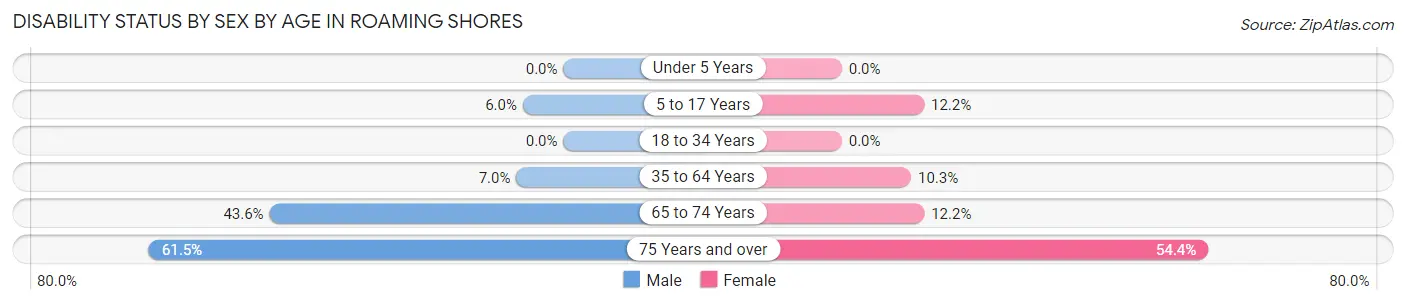
| Age Bracket | Male | Female |
| Under 5 Years | 0 (0.0%) | 0 (0.0%) |
| 5 to 17 Years | 13 (6.0%) | 21 (12.2%) |
| 18 to 34 Years | 0 (0.0%) | 0 (0.0%) |
| 35 to 64 Years | 36 (7.0%) | 44 (10.3%) |
| 65 to 74 Years | 48 (43.6%) | 12 (12.2%) |
| 75 Years and over | 40 (61.5%) | 31 (54.4%) |
Disability Class by Sex by Age in Roaming Shores
Disability Class: Hearing Difficulty
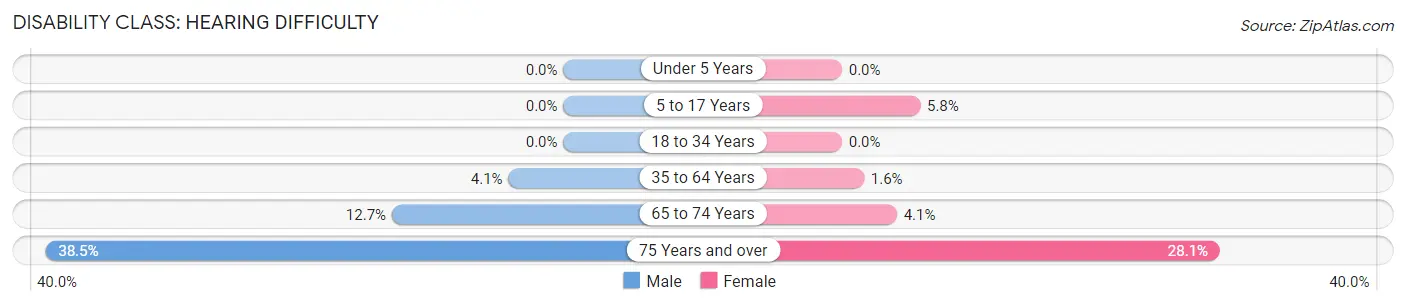
| Age Bracket | Male | Female |
| Under 5 Years | 0 (0.0%) | 0 (0.0%) |
| 5 to 17 Years | 0 (0.0%) | 10 (5.8%) |
| 18 to 34 Years | 0 (0.0%) | 0 (0.0%) |
| 35 to 64 Years | 21 (4.1%) | 7 (1.6%) |
| 65 to 74 Years | 14 (12.7%) | 4 (4.1%) |
| 75 Years and over | 25 (38.5%) | 16 (28.1%) |
Disability Class: Vision Difficulty
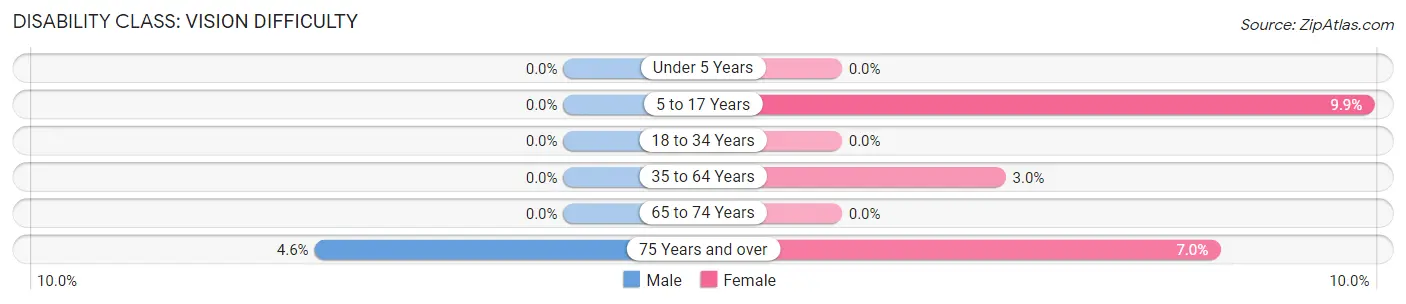
| Age Bracket | Male | Female |
| Under 5 Years | 0 (0.0%) | 0 (0.0%) |
| 5 to 17 Years | 0 (0.0%) | 17 (9.9%) |
| 18 to 34 Years | 0 (0.0%) | 0 (0.0%) |
| 35 to 64 Years | 0 (0.0%) | 13 (3.0%) |
| 65 to 74 Years | 0 (0.0%) | 0 (0.0%) |
| 75 Years and over | 3 (4.6%) | 4 (7.0%) |
Disability Class: Cognitive Difficulty
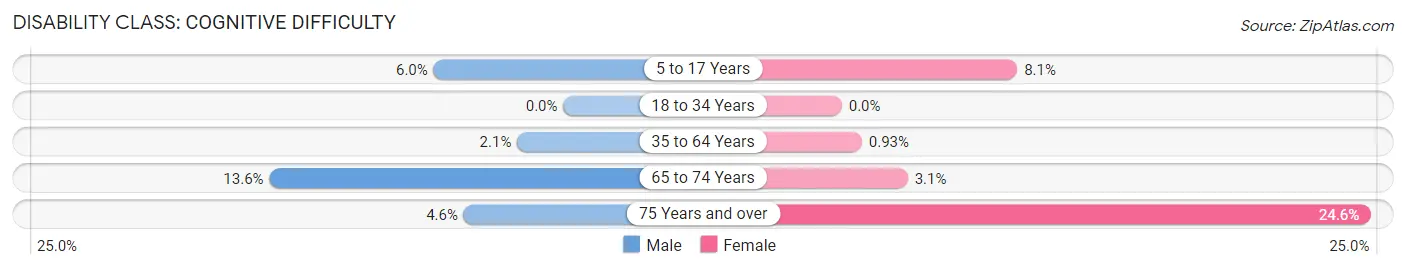
| Age Bracket | Male | Female |
| 5 to 17 Years | 13 (6.0%) | 14 (8.1%) |
| 18 to 34 Years | 0 (0.0%) | 0 (0.0%) |
| 35 to 64 Years | 11 (2.1%) | 4 (0.9%) |
| 65 to 74 Years | 15 (13.6%) | 3 (3.1%) |
| 75 Years and over | 3 (4.6%) | 14 (24.6%) |
Disability Class: Ambulatory Difficulty
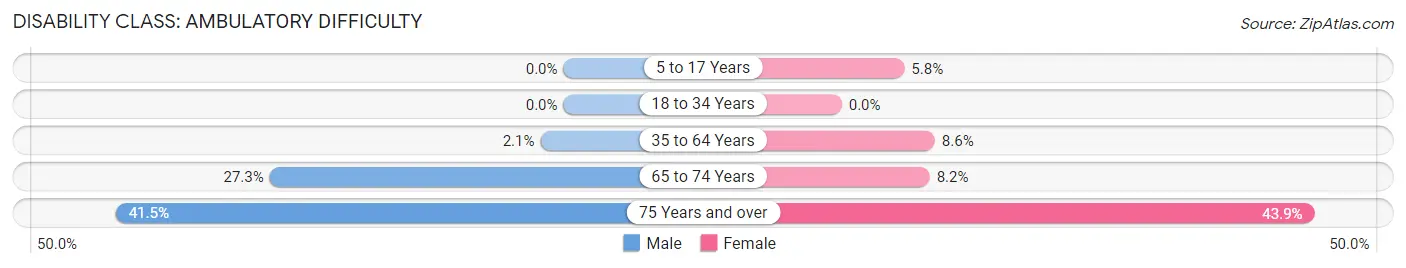
| Age Bracket | Male | Female |
| 5 to 17 Years | 0 (0.0%) | 10 (5.8%) |
| 18 to 34 Years | 0 (0.0%) | 0 (0.0%) |
| 35 to 64 Years | 11 (2.1%) | 37 (8.6%) |
| 65 to 74 Years | 30 (27.3%) | 8 (8.2%) |
| 75 Years and over | 27 (41.5%) | 25 (43.9%) |
Disability Class: Self-Care Difficulty
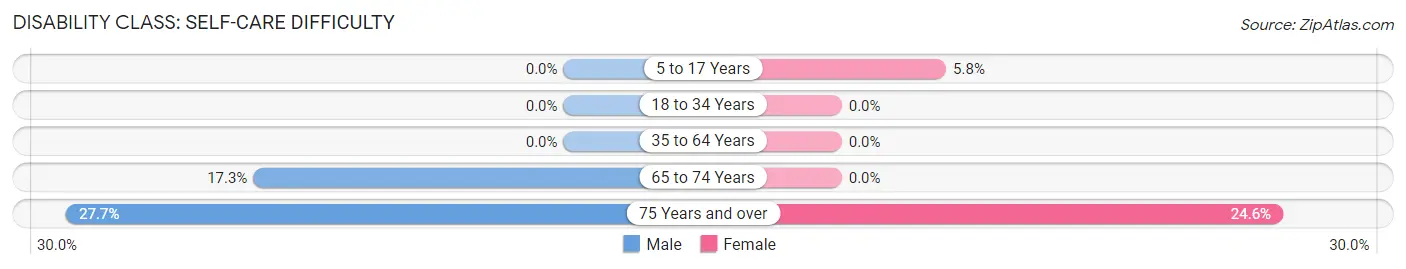
| Age Bracket | Male | Female |
| 5 to 17 Years | 0 (0.0%) | 10 (5.8%) |
| 18 to 34 Years | 0 (0.0%) | 0 (0.0%) |
| 35 to 64 Years | 0 (0.0%) | 0 (0.0%) |
| 65 to 74 Years | 19 (17.3%) | 0 (0.0%) |
| 75 Years and over | 18 (27.7%) | 14 (24.6%) |
Technology Access in Roaming Shores
Computing Device Access in Roaming Shores
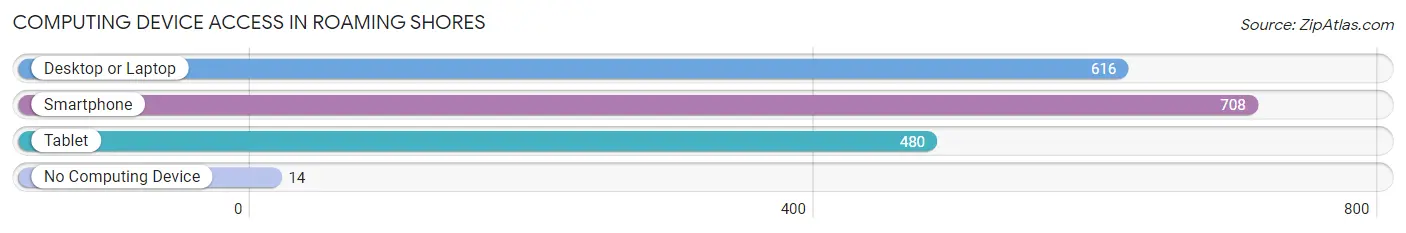
| Device Type | # Households | % Households |
| Desktop or Laptop | 616 | 81.3% |
| Smartphone | 708 | 93.4% |
| Tablet | 480 | 63.3% |
| No Computing Device | 14 | 1.8% |
| Total | 758 | 100.0% |
Internet Access in Roaming Shores
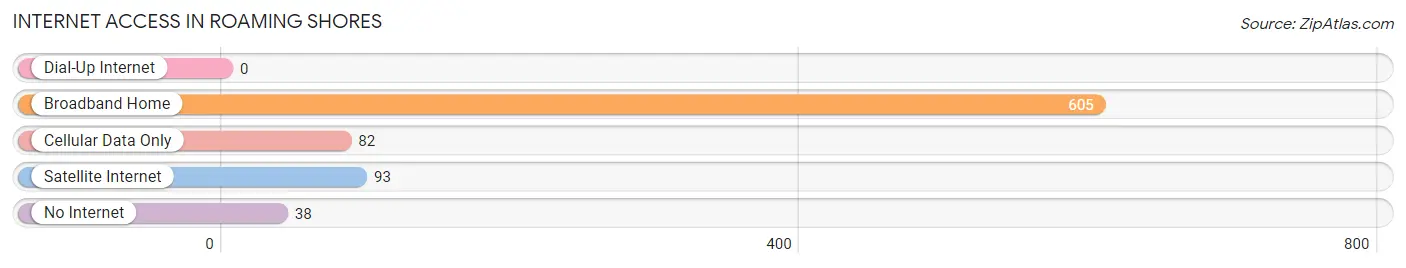
| Internet Type | # Households | % Households |
| Dial-Up Internet | 0 | 0.0% |
| Broadband Home | 605 | 79.8% |
| Cellular Data Only | 82 | 10.8% |
| Satellite Internet | 93 | 12.3% |
| No Internet | 38 | 5.0% |
| Total | 758 | 100.0% |
Roaming Shores Summary
History
Roaming Shores, Ohio is a small village located in Ashtabula County, Ohio. It was founded in 1818 by a group of settlers from Connecticut. The village was originally known as “Roaming”, but the name was changed to “Roaming Shores” in 1891. The village was incorporated in 1951.
Roaming Shores is located on the shore of Lake Erie, and is a popular destination for fishing, boating, and other recreational activities. The village is also home to a number of small businesses, including a marina, a grocery store, and a few restaurants.
Geography
Roaming Shores is located in the northeast corner of Ashtabula County, Ohio. It is situated on the shore of Lake Erie, and is bordered by the towns of Geneva and Conneaut. The village is located approximately 40 miles east of Cleveland, and is part of the Cleveland-Akron-Canton metropolitan area.
The village has a total area of 1.2 square miles, all of which is land. The terrain is mostly flat, with some rolling hills. The climate is humid continental, with hot summers and cold winters.
Economy
Roaming Shores is a small village with a population of just over 1,000 people. The village is home to a number of small businesses, including a marina, a grocery store, and a few restaurants. The village also has a few small manufacturing companies.
The village is also home to a number of recreational activities, including fishing, boating, and swimming. The village is also home to a number of parks and trails, including the Roaming Shores State Park.
Demographics
As of the 2010 census, the population of Roaming Shores was 1,072. The racial makeup of the village was 97.2% White, 0.7% African American, 0.2% Native American, 0.2% Asian, 0.1% Pacific Islander, 0.3% from other races, and 1.3% from two or more races. Hispanic or Latino of any race were 1.3% of the population.
The median income for a household in the village was $41,250, and the median income for a family was $45,000. The per capita income for the village was $19,845. About 8.3% of families and 10.2% of the population were below the poverty line, including 14.3% of those under age 18 and 4.2% of those age 65 or over.
Common Questions
What is the Total Population of Roaming Shores?
Total Population of Roaming Shores is 1,957.
What is the Total Male Population of Roaming Shores?
Total Male Population of Roaming Shores is 1,037.
What is the Total Female Population of Roaming Shores?
Total Female Population of Roaming Shores is 920.
What is the Ratio of Males per 100 Females in Roaming Shores?
There are 112.72 Males per 100 Females in Roaming Shores.
What is the Ratio of Females per 100 Males in Roaming Shores?
There are 88.72 Females per 100 Males in Roaming Shores.
What is the Median Population Age in Roaming Shores?
Median Population Age in Roaming Shores is 47.1 Years.
What is the Average Family Size in Roaming Shores
Average Family Size in Roaming Shores is 3.1 People.
What is the Average Household Size in Roaming Shores
Average Household Size in Roaming Shores is 2.6 People.
What is Per Capita Income in Roaming Shores?
Per Capita income in Roaming Shores is $44,546.
What is the Median Family Income in Roaming Shores?
Median Family Income in Roaming Shores is $113,224.
What is the Median Household income in Roaming Shores?
Median Household Income in Roaming Shores is $93,452.
What is Income or Wage Gap in Roaming Shores?
Income or Wage Gap in Roaming Shores is 51.1%.
Women in Roaming Shores earn 48.9 cents for every dollar earned by a man.
What is Inequality or Gini Index in Roaming Shores?
Inequality or Gini Index in Roaming Shores is 0.38.
How Large is the Labor Force in Roaming Shores?
There are 1,029 People in the Labor Forcein in Roaming Shores.
What is the Percentage of People in the Labor Force in Roaming Shores?
65.6% of People are in the Labor Force in Roaming Shores.
What is the Unemployment Rate in Roaming Shores?
Unemployment Rate in Roaming Shores is 1.7%.