Northridge, OH
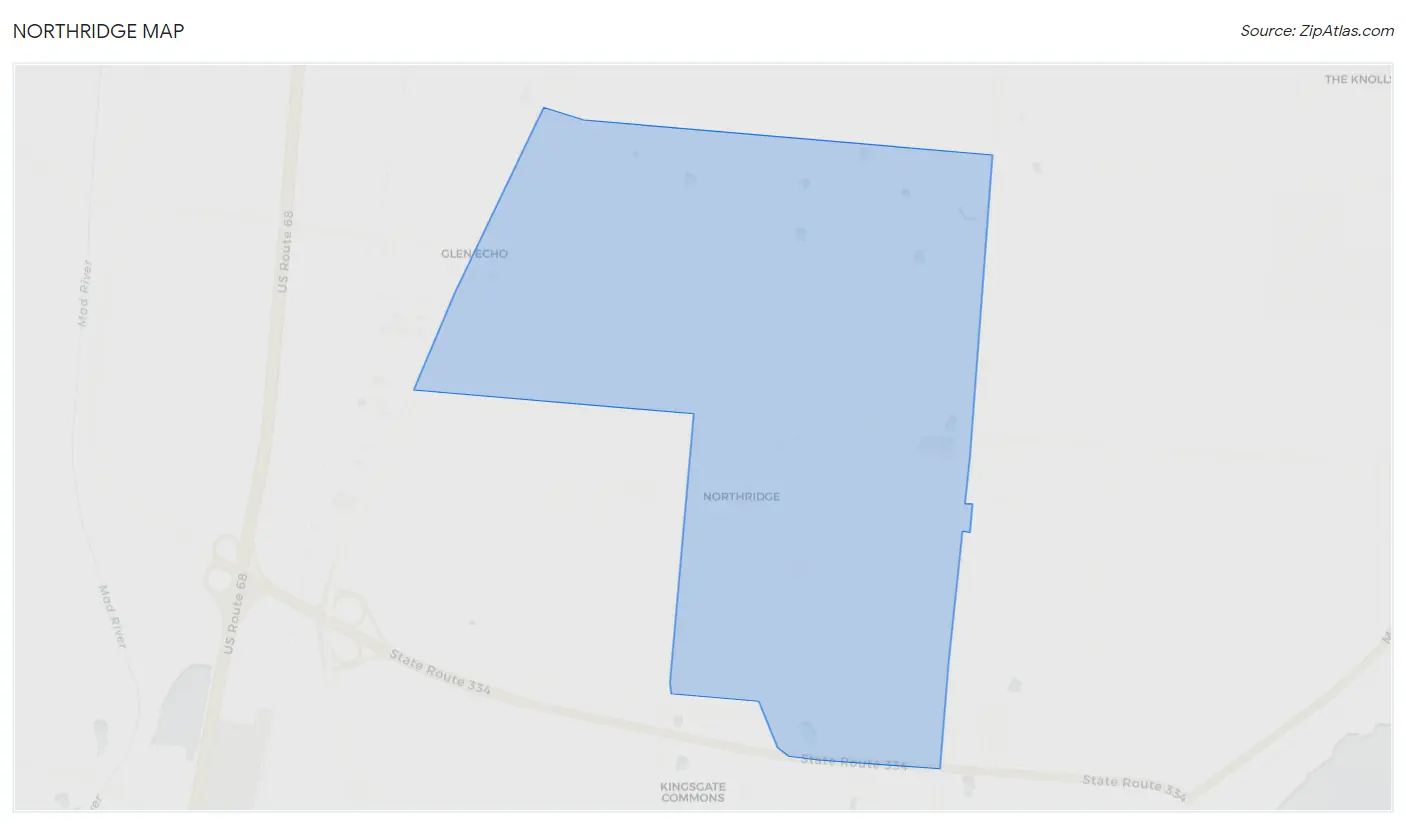
Northridge Map
Northridge Overview
7,675
TOTAL POPULATION
4,152
MALE POPULATION
3,523
FEMALE POPULATION
117.85
MALES / 100 FEMALES
84.85
FEMALES / 100 MALES
43.3
MEDIAN AGE
2.9
AVG FAMILY SIZE
2.3
AVG HOUSEHOLD SIZE
$37,614
PER CAPITA INCOME
$91,691
AVG FAMILY INCOME
$74,011
AVG HOUSEHOLD INCOME
28.8%
WAGE / INCOME GAP [ % ]
71.2¢/ $1
WAGE / INCOME GAP [ $ ]
0.39
INEQUALITY / GINI INDEX
3,396
LABOR FORCE [ PEOPLE ]
56.0%
PERCENT IN LABOR FORCE
4.9%
UNEMPLOYMENT RATE
Race in Northridge
The most populous races in Northridge are White / Caucasian (7,389 | 96.3%), Black / African American (144 | 1.9%), and Hispanic or Latino (117 | 1.5%).
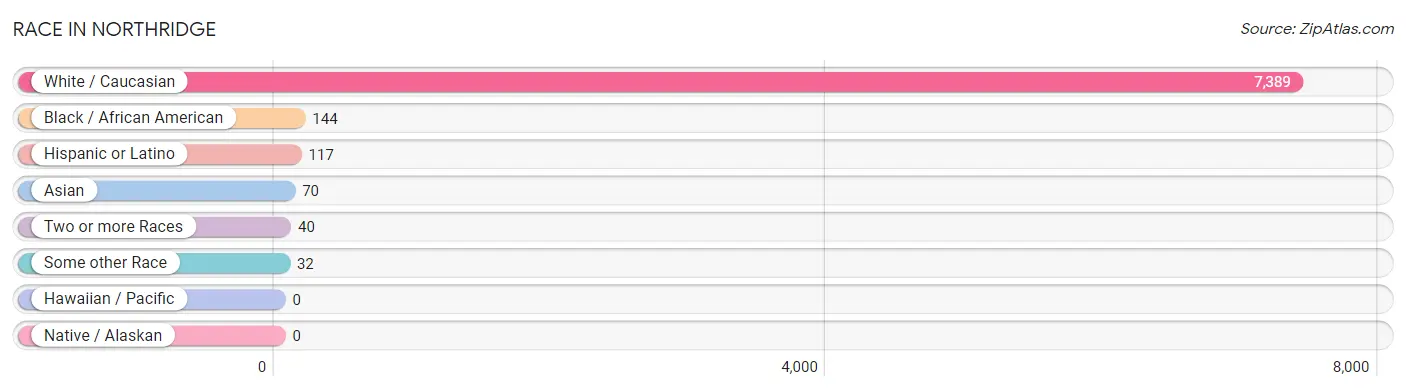
| Race | # Population | % Population |
| Asian | 70 | 0.9% |
| Black / African American | 144 | 1.9% |
| Hawaiian / Pacific | 0 | 0.0% |
| Hispanic or Latino | 117 | 1.5% |
| Native / Alaskan | 0 | 0.0% |
| White / Caucasian | 7,389 | 96.3% |
| Two or more Races | 40 | 0.5% |
| Some other Race | 32 | 0.4% |
| Total | 7,675 | 100.0% |
Ancestry in Northridge
The most populous ancestries reported in Northridge are German (1,667 | 21.7%), Irish (964 | 12.6%), English (962 | 12.5%), American (694 | 9.0%), and Italian (385 | 5.0%), together accounting for 60.9% of all Northridge residents.
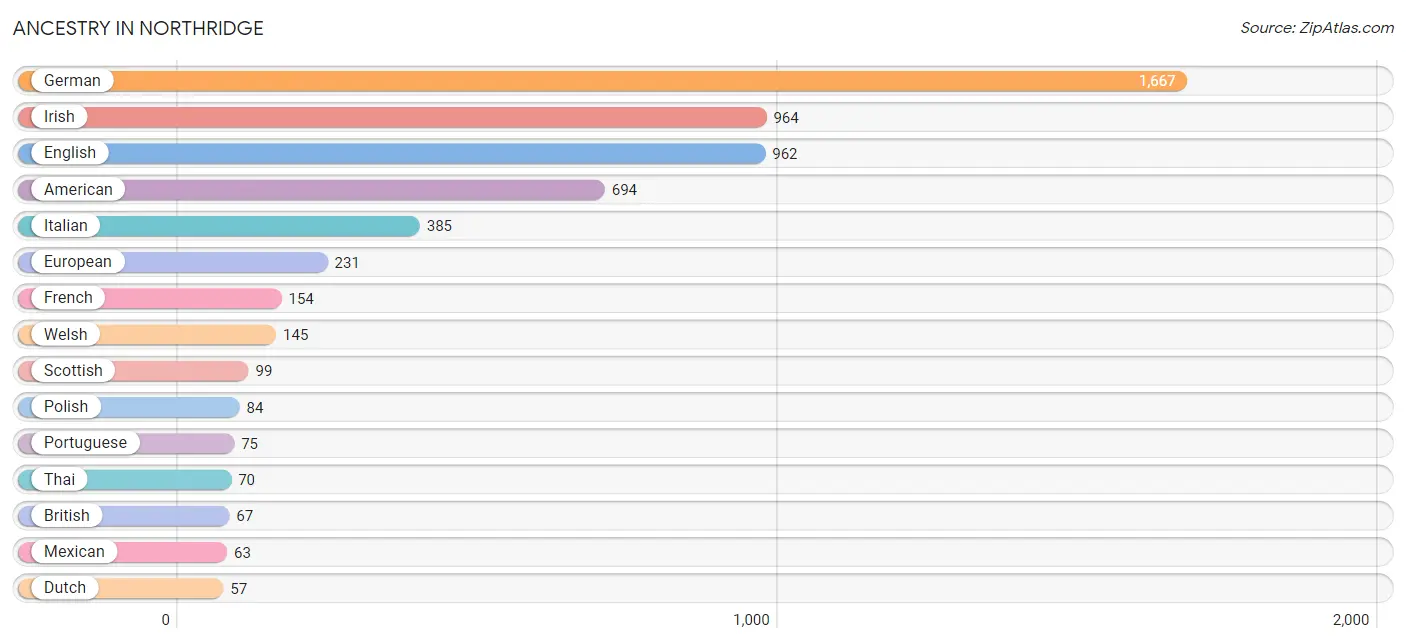
| Ancestry | # Population | % Population |
| American | 694 | 9.0% |
| Australian | 12 | 0.2% |
| British | 67 | 0.9% |
| Canadian | 20 | 0.3% |
| Cuban | 10 | 0.1% |
| Czech | 9 | 0.1% |
| Dutch | 57 | 0.7% |
| Eastern European | 14 | 0.2% |
| English | 962 | 12.5% |
| European | 231 | 3.0% |
| Finnish | 11 | 0.1% |
| French | 154 | 2.0% |
| French Canadian | 20 | 0.3% |
| German | 1,667 | 21.7% |
| Greek | 14 | 0.2% |
| Hungarian | 20 | 0.3% |
| Irish | 964 | 12.6% |
| Italian | 385 | 5.0% |
| Mexican | 63 | 0.8% |
| Norwegian | 11 | 0.1% |
| Polish | 84 | 1.1% |
| Portuguese | 75 | 1.0% |
| Puerto Rican | 24 | 0.3% |
| Scotch-Irish | 57 | 0.7% |
| Scottish | 99 | 1.3% |
| Spaniard | 20 | 0.3% |
| Swiss | 10 | 0.1% |
| Thai | 70 | 0.9% |
| Ukrainian | 14 | 0.2% |
| Welsh | 145 | 1.9% | View All 30 Rows |
Immigrants in Northridge
The most numerous immigrant groups reported in Northridge came from Europe (62 | 0.8%), Germany (56 | 0.7%), Western Europe (56 | 0.7%), Asia (31 | 0.4%), and India (31 | 0.4%), together accounting for 3.1% of all Northridge residents.
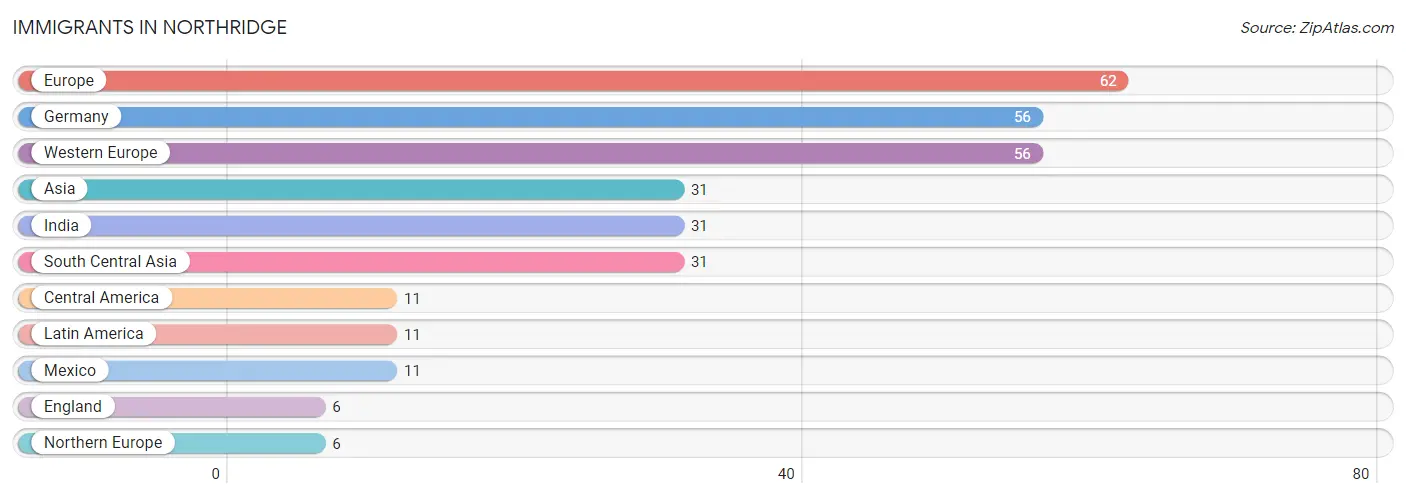
| Immigration Origin | # Population | % Population |
| Asia | 31 | 0.4% |
| Central America | 11 | 0.1% |
| England | 6 | 0.1% |
| Europe | 62 | 0.8% |
| Germany | 56 | 0.7% |
| India | 31 | 0.4% |
| Latin America | 11 | 0.1% |
| Mexico | 11 | 0.1% |
| Northern Europe | 6 | 0.1% |
| South Central Asia | 31 | 0.4% |
| Western Europe | 56 | 0.7% | View All 11 Rows |
Sex and Age in Northridge
Sex and Age in Northridge
The most populous age groups in Northridge are 5 to 9 Years (443 | 10.7%) for men and 30 to 34 Years (431 | 12.2%) for women.
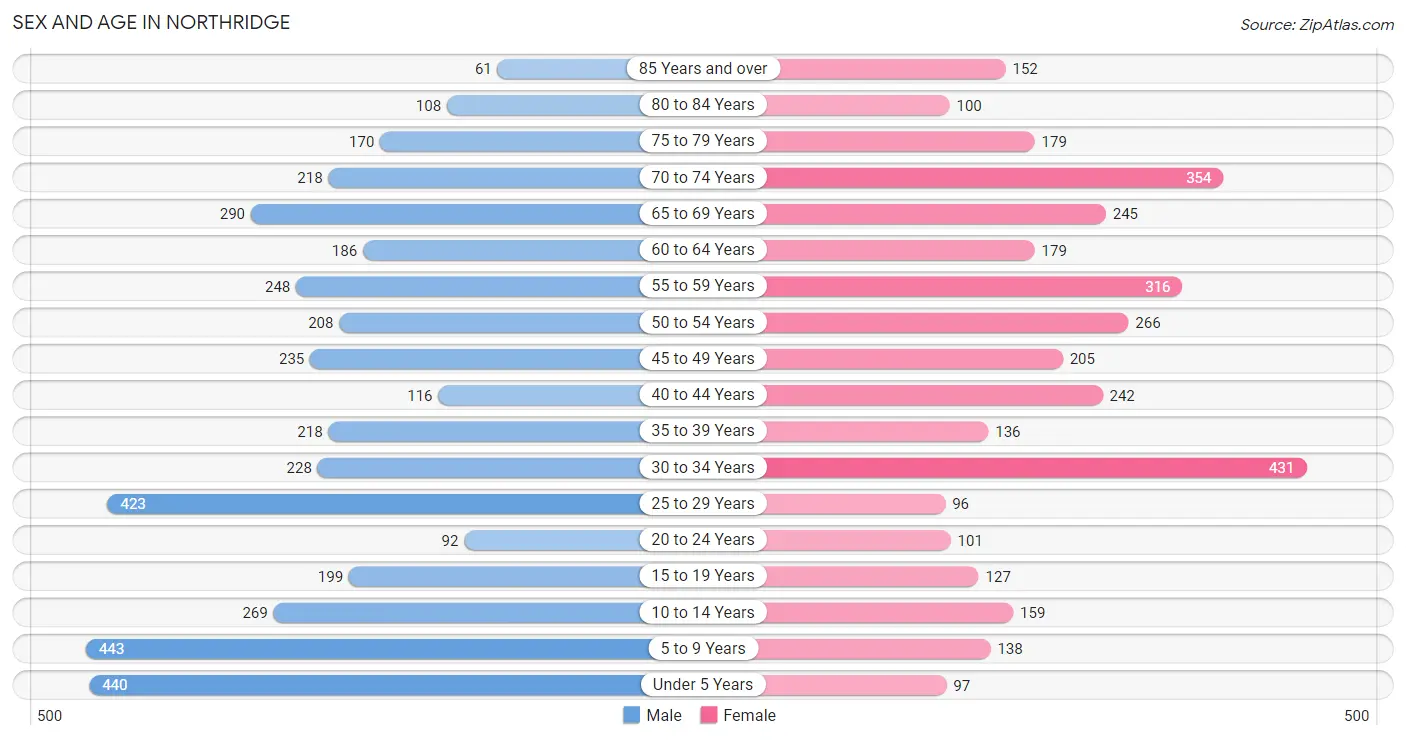
| Age Bracket | Male | Female |
| Under 5 Years | 440 (10.6%) | 97 (2.8%) |
| 5 to 9 Years | 443 (10.7%) | 138 (3.9%) |
| 10 to 14 Years | 269 (6.5%) | 159 (4.5%) |
| 15 to 19 Years | 199 (4.8%) | 127 (3.6%) |
| 20 to 24 Years | 92 (2.2%) | 101 (2.9%) |
| 25 to 29 Years | 423 (10.2%) | 96 (2.7%) |
| 30 to 34 Years | 228 (5.5%) | 431 (12.2%) |
| 35 to 39 Years | 218 (5.2%) | 136 (3.9%) |
| 40 to 44 Years | 116 (2.8%) | 242 (6.9%) |
| 45 to 49 Years | 235 (5.7%) | 205 (5.8%) |
| 50 to 54 Years | 208 (5.0%) | 266 (7.5%) |
| 55 to 59 Years | 248 (6.0%) | 316 (9.0%) |
| 60 to 64 Years | 186 (4.5%) | 179 (5.1%) |
| 65 to 69 Years | 290 (7.0%) | 245 (7.0%) |
| 70 to 74 Years | 218 (5.2%) | 354 (10.1%) |
| 75 to 79 Years | 170 (4.1%) | 179 (5.1%) |
| 80 to 84 Years | 108 (2.6%) | 100 (2.8%) |
| 85 Years and over | 61 (1.5%) | 152 (4.3%) |
| Total | 4,152 (100.0%) | 3,523 (100.0%) |
Families and Households in Northridge
Median Family Size in Northridge
The median family size in Northridge is 2.90 persons per family, with single female/mother families (337 | 16.1%) accounting for the largest median family size of 3.01 persons per family. On the other hand, single male/father families (201 | 9.6%) represent the smallest median family size with 2.37 persons per family.
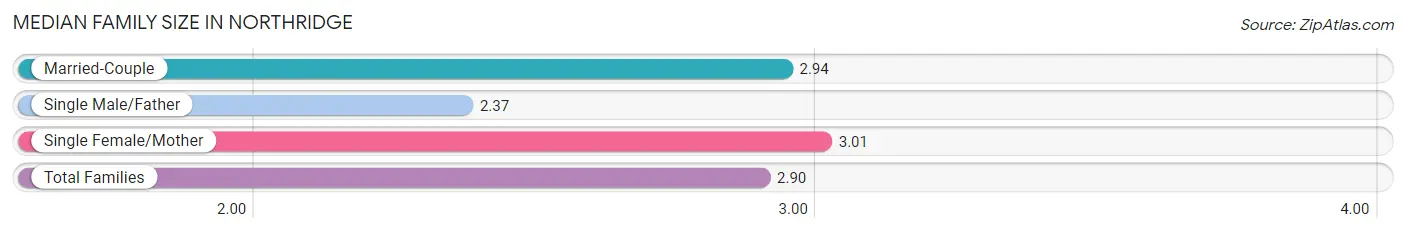
| Family Type | # Families | Family Size |
| Married-Couple | 1,557 (74.3%) | 2.94 |
| Single Male/Father | 201 (9.6%) | 2.37 |
| Single Female/Mother | 337 (16.1%) | 3.01 |
| Total Families | 2,095 (100.0%) | 2.90 |
Median Household Size in Northridge
The median household size in Northridge is 2.33 persons per household, with single female/mother households (337 | 10.2%) accounting for the largest median household size of 3.26 persons per household. non-family households (1,202 | 36.5%) represent the smallest median household size with 1.16 persons per household.
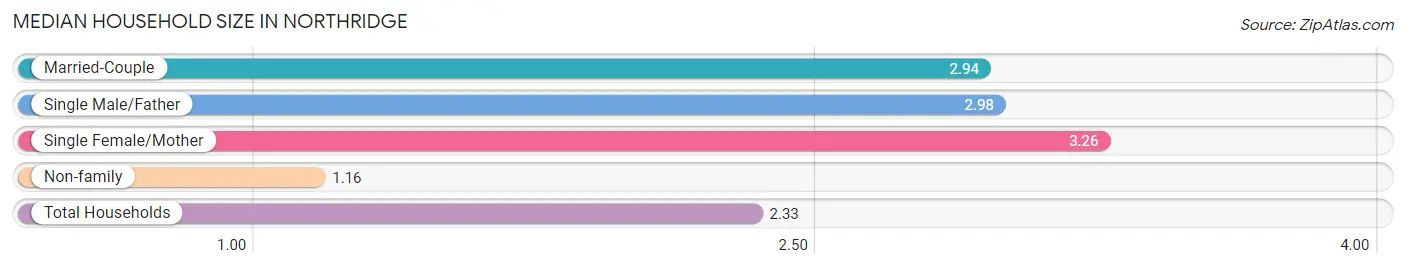
| Household Type | # Households | Household Size |
| Married-Couple | 1,557 (47.2%) | 2.94 |
| Single Male/Father | 201 (6.1%) | 2.98 |
| Single Female/Mother | 337 (10.2%) | 3.26 |
| Non-family | 1,202 (36.5%) | 1.16 |
| Total Households | 3,297 (100.0%) | 2.33 |
Household Size by Marriage Status in Northridge
Out of a total of 3,297 households in Northridge, 2,095 (63.5%) are family households, while 1,202 (36.5%) are nonfamily households. The most numerous type of family households are 2-person households, comprising 907, and the most common type of nonfamily households are 1-person households, comprising 1,039.
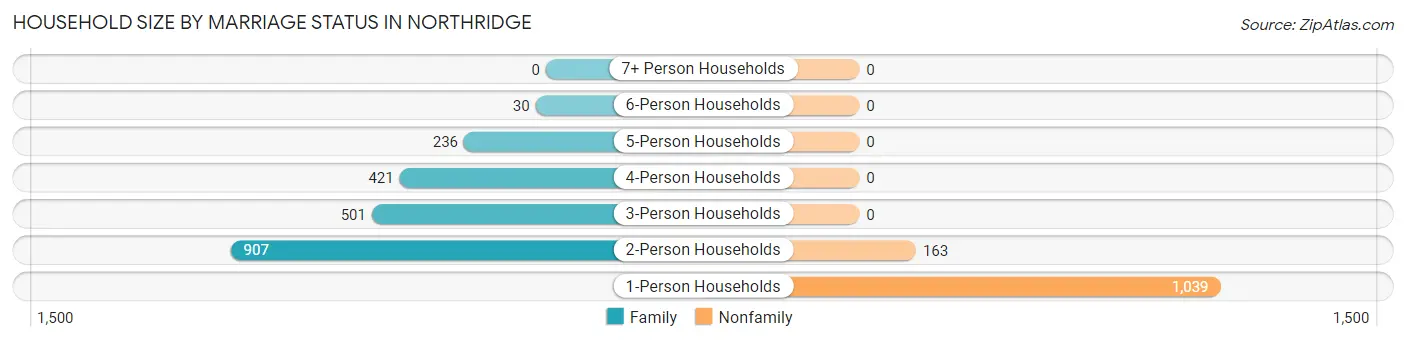
| Household Size | Family Households | Nonfamily Households |
| 1-Person Households | - | 1,039 (31.5%) |
| 2-Person Households | 907 (27.5%) | 163 (4.9%) |
| 3-Person Households | 501 (15.2%) | 0 (0.0%) |
| 4-Person Households | 421 (12.8%) | 0 (0.0%) |
| 5-Person Households | 236 (7.2%) | 0 (0.0%) |
| 6-Person Households | 30 (0.9%) | 0 (0.0%) |
| 7+ Person Households | 0 (0.0%) | 0 (0.0%) |
| Total | 2,095 (63.5%) | 1,202 (36.5%) |
Female Fertility in Northridge
Fertility by Age in Northridge
Average fertility rate in Northridge is 130.0 births per 1,000 women. Women in the age bracket of 20 to 34 years have the highest fertility rate with 255.0 births per 1,000 women. Women in the age bracket of 20 to 34 years acount for 90.9% of all women with births.
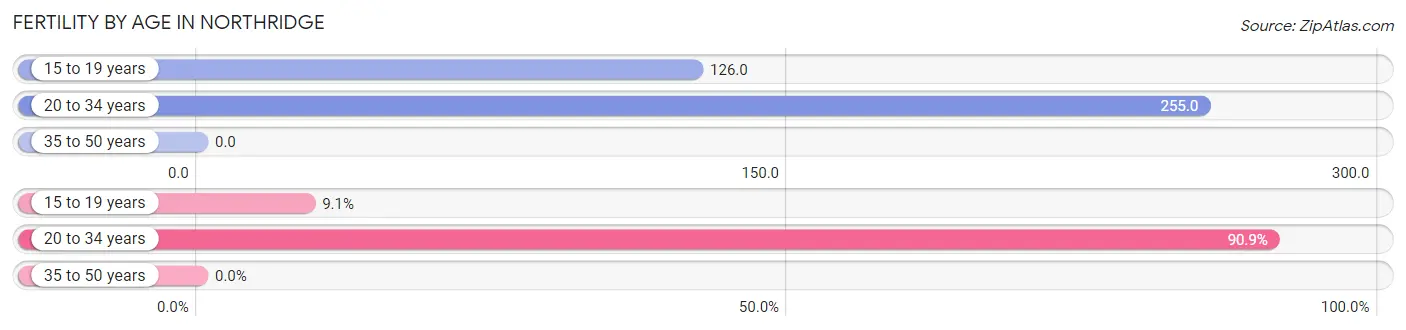
| Age Bracket | Women with Births | Births / 1,000 Women |
| 15 to 19 years | 16 (9.1%) | 126.0 |
| 20 to 34 years | 160 (90.9%) | 255.0 |
| 35 to 50 years | 0 (0.0%) | 0.0 |
| Total | 176 (100.0%) | 130.0 |
Fertility by Age by Marriage Status in Northridge
18.8% of women with births (176) in Northridge are married. The highest percentage of unmarried women with births falls into 15 to 19 years age bracket with 100.0% of them unmarried at the time of birth, while the lowest percentage of unmarried women with births belong to 20 to 34 years age bracket with 79.4% of them unmarried.

| Age Bracket | Married | Unmarried |
| 15 to 19 years | 0 (0.0%) | 16 (100.0%) |
| 20 to 34 years | 33 (20.6%) | 127 (79.4%) |
| 35 to 50 years | 0 (0.0%) | 0 (0.0%) |
| Total | 33 (18.8%) | 143 (81.2%) |
Fertility by Education in Northridge
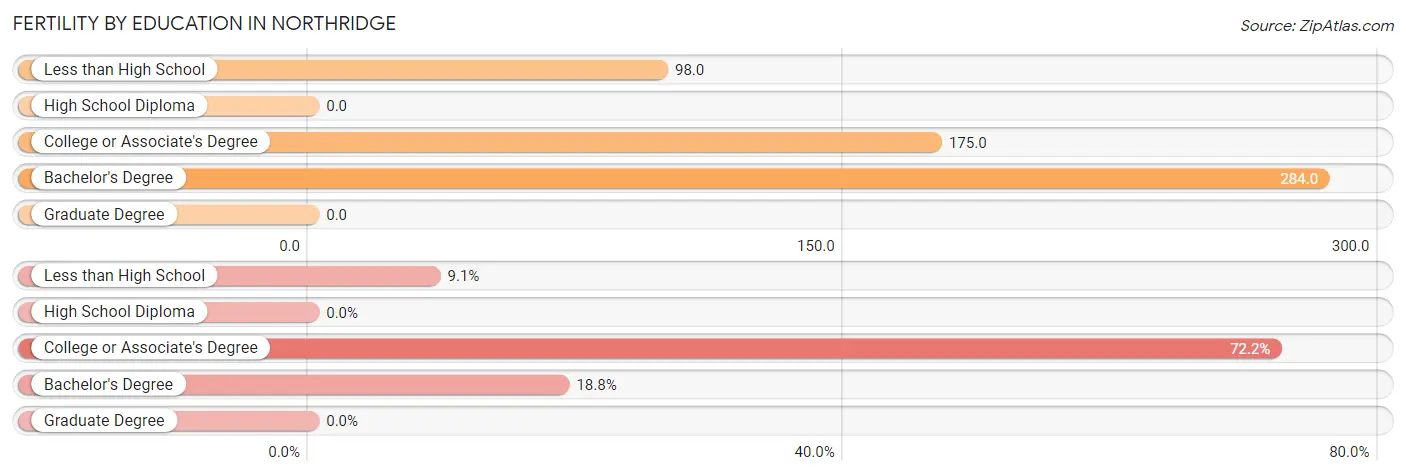
| Educational Attainment | Women with Births | Births / 1,000 Women |
| Less than High School | 16 (9.1%) | 98.0 |
| High School Diploma | 0 (0.0%) | 0.0 |
| College or Associate's Degree | 127 (72.2%) | 175.0 |
| Bachelor's Degree | 33 (18.8%) | 284.0 |
| Graduate Degree | 0 (0.0%) | 0.0 |
| Total | 176 (100.0%) | 130.0 |
Fertility by Education by Marriage Status in Northridge
81.2% of women with births in Northridge are unmarried. Women with the educational attainment of bachelor's degree are most likely to be married with 100.0% of them married at childbirth, while women with the educational attainment of less than high school are least likely to be married with 100.0% of them unmarried at childbirth.
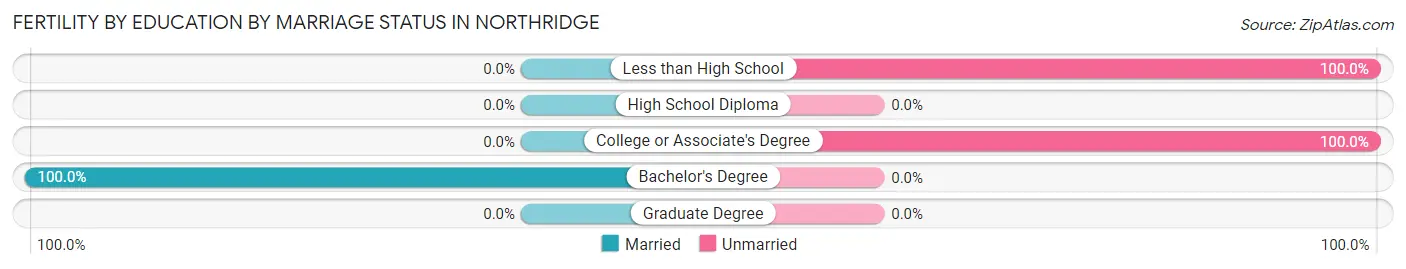
| Educational Attainment | Married | Unmarried |
| Less than High School | 0 (0.0%) | 16 (100.0%) |
| High School Diploma | 0 (0.0%) | 0 (0.0%) |
| College or Associate's Degree | 0 (0.0%) | 127 (100.0%) |
| Bachelor's Degree | 33 (100.0%) | 0 (0.0%) |
| Graduate Degree | 0 (0.0%) | 0 (0.0%) |
| Total | 33 (18.8%) | 143 (81.2%) |
Income in Northridge
Income Overview in Northridge
Per Capita Income in Northridge is $37,614, while median incomes of families and households are $91,691 and $74,011 respectively.
| Characteristic | Number | Measure |
| Per Capita Income | 7,675 | $37,614 |
| Median Family Income | 2,095 | $91,691 |
| Mean Family Income | 2,095 | $105,696 |
| Median Household Income | 3,297 | $74,011 |
| Mean Household Income | 3,297 | $86,817 |
| Income Deficit | 2,095 | $0 |
| Wage / Income Gap (%) | 7,675 | 28.80% |
| Wage / Income Gap ($) | 7,675 | 71.20¢ per $1 |
| Gini / Inequality Index | 7,675 | 0.39 |
Earnings by Sex in Northridge
Average Earnings in Northridge are $51,058, $59,567 for men and $42,409 for women, a difference of 28.8%.
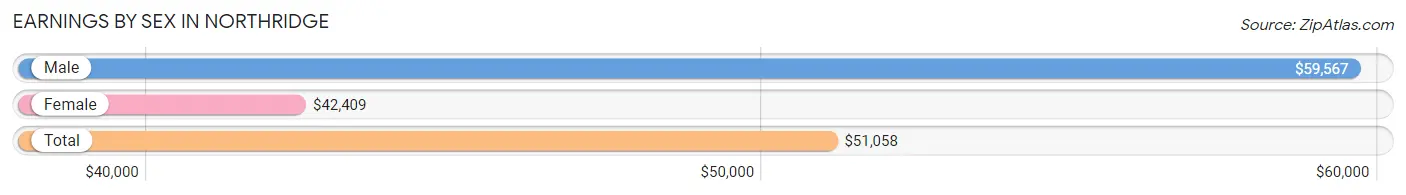
| Sex | Number | Average Earnings |
| Male | 1,826 (51.4%) | $59,567 |
| Female | 1,725 (48.6%) | $42,409 |
| Total | 3,551 (100.0%) | $51,058 |
Earnings by Sex by Income Bracket in Northridge
The most common earnings brackets in Northridge are $55,000 to $64,999 for men (378 | 20.7%) and $65,000 to $74,999 for women (210 | 12.2%).
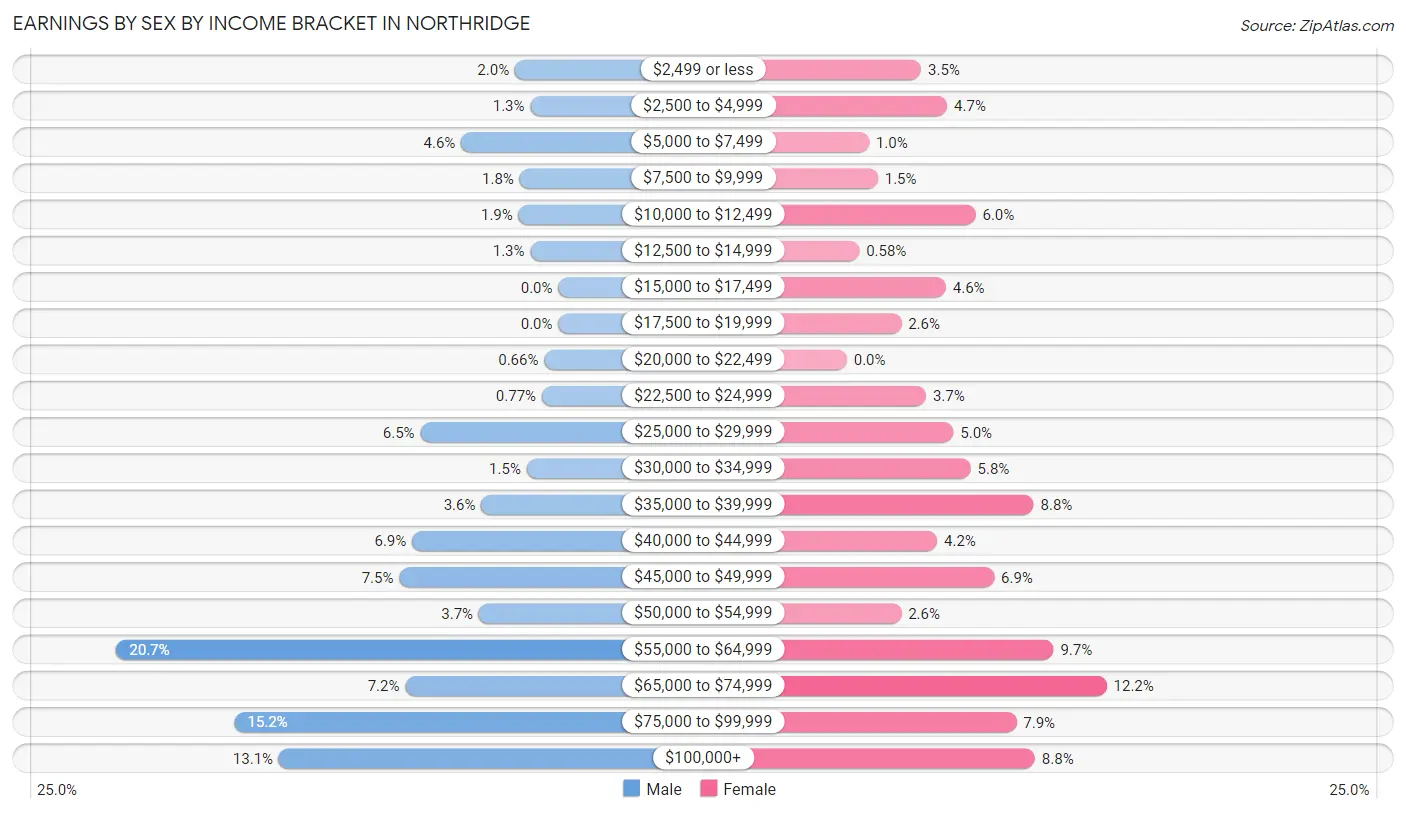
| Income | Male | Female |
| $2,499 or less | 37 (2.0%) | 60 (3.5%) |
| $2,500 to $4,999 | 24 (1.3%) | 81 (4.7%) |
| $5,000 to $7,499 | 83 (4.5%) | 18 (1.0%) |
| $7,500 to $9,999 | 33 (1.8%) | 25 (1.5%) |
| $10,000 to $12,499 | 34 (1.9%) | 104 (6.0%) |
| $12,500 to $14,999 | 24 (1.3%) | 10 (0.6%) |
| $15,000 to $17,499 | 0 (0.0%) | 80 (4.6%) |
| $17,500 to $19,999 | 0 (0.0%) | 44 (2.5%) |
| $20,000 to $22,499 | 12 (0.7%) | 0 (0.0%) |
| $22,500 to $24,999 | 14 (0.8%) | 64 (3.7%) |
| $25,000 to $29,999 | 118 (6.5%) | 86 (5.0%) |
| $30,000 to $34,999 | 27 (1.5%) | 100 (5.8%) |
| $35,000 to $39,999 | 66 (3.6%) | 151 (8.7%) |
| $40,000 to $44,999 | 125 (6.9%) | 73 (4.2%) |
| $45,000 to $49,999 | 136 (7.4%) | 119 (6.9%) |
| $50,000 to $54,999 | 68 (3.7%) | 44 (2.5%) |
| $55,000 to $64,999 | 378 (20.7%) | 167 (9.7%) |
| $65,000 to $74,999 | 131 (7.2%) | 210 (12.2%) |
| $75,000 to $99,999 | 277 (15.2%) | 137 (7.9%) |
| $100,000+ | 239 (13.1%) | 152 (8.8%) |
| Total | 1,826 (100.0%) | 1,725 (100.0%) |
Earnings by Sex by Educational Attainment in Northridge
Average earnings in Northridge are $62,533 for men and $46,250 for women, a difference of 26.0%. Men with an educational attainment of graduate degree enjoy the highest average annual earnings of $81,579, while those with college or associate's degree education earn the least with $59,821. Women with an educational attainment of high school diploma earn the most with the average annual earnings of $60,417, while those with college or associate's degree education have the smallest earnings of $38,840.
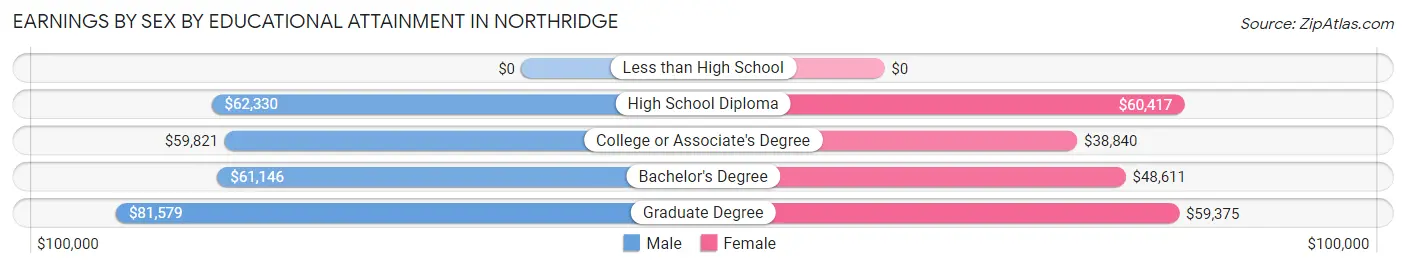
| Educational Attainment | Male Income | Female Income |
| Less than High School | - | - |
| High School Diploma | $62,330 | $60,417 |
| College or Associate's Degree | $59,821 | $38,840 |
| Bachelor's Degree | $61,146 | $48,611 |
| Graduate Degree | $81,579 | $59,375 |
| Total | $62,533 | $46,250 |
Family Income in Northridge
Family Income Brackets in Northridge
According to the Northridge family income data, there are 553 families falling into the $100,000 to $149,999 income range, which is the most common income bracket and makes up 26.4% of all families. Conversely, the $15,000 to $24,999 income bracket is the least frequent group with only 15 families (0.7%) belonging to this category.

| Income Bracket | # Families | % Families |
| Less than $10,000 | 31 | 1.5% |
| $10,000 to $14,999 | 149 | 7.1% |
| $15,000 to $24,999 | 15 | 0.7% |
| $25,000 to $34,999 | 52 | 2.5% |
| $35,000 to $49,999 | 122 | 5.8% |
| $50,000 to $74,999 | 515 | 24.6% |
| $75,000 to $99,999 | 264 | 12.6% |
| $100,000 to $149,999 | 553 | 26.4% |
| $150,000 to $199,999 | 249 | 11.9% |
| $200,000+ | 145 | 6.9% |
Family Income by Famaliy Size in Northridge
5-person families (150 | 7.2%) account for the highest median family income in Northridge with $118,279 per family, while 2-person families (1,007 | 48.1%) have the highest median income of $39,636 per family member.
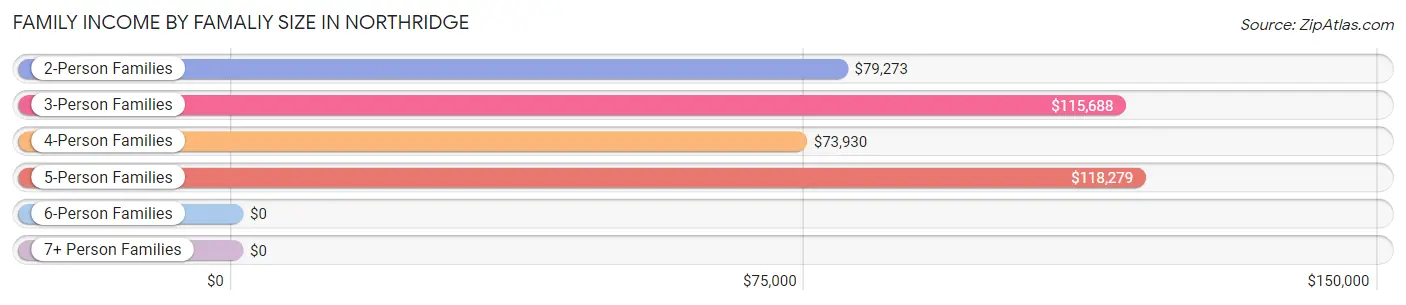
| Income Bracket | # Families | Median Income |
| 2-Person Families | 1,007 (48.1%) | $79,273 |
| 3-Person Families | 433 (20.7%) | $115,688 |
| 4-Person Families | 475 (22.7%) | $73,930 |
| 5-Person Families | 150 (7.2%) | $118,279 |
| 6-Person Families | 30 (1.4%) | $0 |
| 7+ Person Families | 0 (0.0%) | $0 |
| Total | 2,095 (100.0%) | $91,691 |
Family Income by Number of Earners in Northridge
The median family income in Northridge is $91,691, with families comprising 3+ earners (146) having the highest median family income of $156,528, while families with no earners (417) have the lowest median family income of $57,063, accounting for 7.0% and 19.9% of families, respectively.
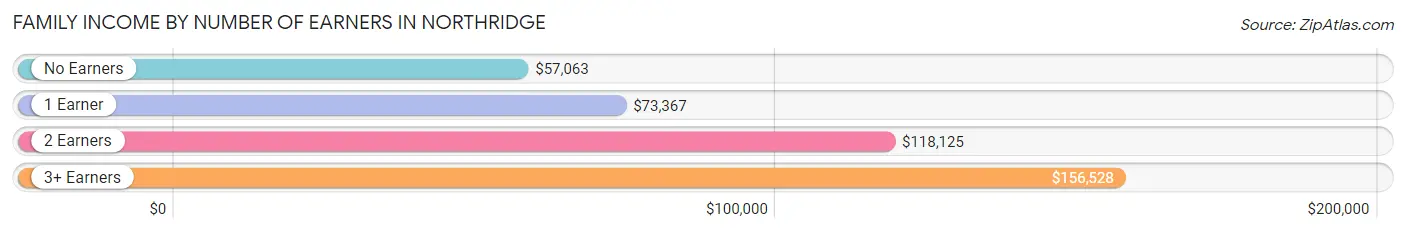
| Number of Earners | # Families | Median Income |
| No Earners | 417 (19.9%) | $57,063 |
| 1 Earner | 789 (37.7%) | $73,367 |
| 2 Earners | 743 (35.5%) | $118,125 |
| 3+ Earners | 146 (7.0%) | $156,528 |
| Total | 2,095 (100.0%) | $91,691 |
Household Income in Northridge
Household Income Brackets in Northridge
With 692 households falling in the category, the $50,000 to $74,999 income range is the most frequent in Northridge, accounting for 21.0% of all households. In contrast, only 66 households (2.0%) fall into the less than $10,000 income bracket, making it the least populous group.
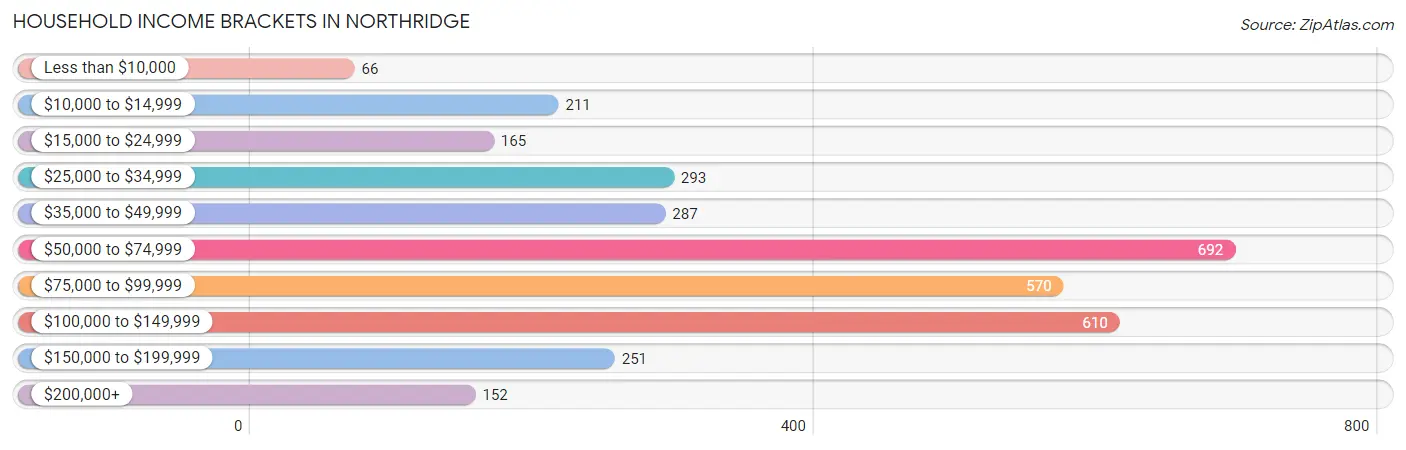
| Income Bracket | # Households | % Households |
| Less than $10,000 | 66 | 2.0% |
| $10,000 to $14,999 | 211 | 6.4% |
| $15,000 to $24,999 | 165 | 5.0% |
| $25,000 to $34,999 | 293 | 8.9% |
| $35,000 to $49,999 | 287 | 8.7% |
| $50,000 to $74,999 | 692 | 21.0% |
| $75,000 to $99,999 | 570 | 17.3% |
| $100,000 to $149,999 | 610 | 18.5% |
| $150,000 to $199,999 | 251 | 7.6% |
| $200,000+ | 152 | 4.6% |
Household Income by Householder Age in Northridge
The median household income in Northridge is $74,011, with the highest median household income of $93,483 found in the 45 to 64 years age bracket for the primary householder. A total of 1,015 households (30.8%) fall into this category. Meanwhile, the 15 to 24 years age bracket for the primary householder has the lowest median household income of $0, with 7 households (0.2%) in this group.
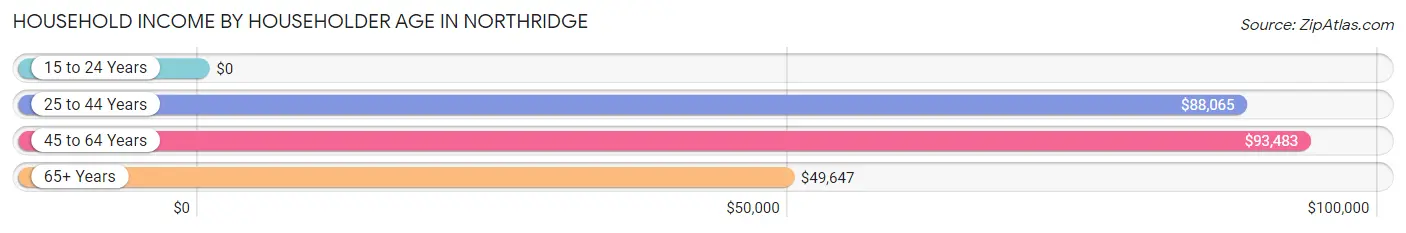
| Income Bracket | # Households | Median Income |
| 15 to 24 Years | 7 (0.2%) | $0 |
| 25 to 44 Years | 952 (28.9%) | $88,065 |
| 45 to 64 Years | 1,015 (30.8%) | $93,483 |
| 65+ Years | 1,323 (40.1%) | $49,647 |
| Total | 3,297 (100.0%) | $74,011 |
Poverty in Northridge
Income Below Poverty by Sex and Age in Northridge
With 9.1% poverty level for males and 12.9% for females among the residents of Northridge, 5 year old males and 6 to 11 year old females are the most vulnerable to poverty, with 9 males (52.9%) and 65 females (48.5%) in their respective age groups living below the poverty level.

| Age Bracket | Male | Female |
| Under 5 Years | 61 (14.5%) | 0 (0.0%) |
| 5 Years | 9 (52.9%) | 0 (0.0%) |
| 6 to 11 Years | 200 (34.9%) | 65 (48.5%) |
| 12 to 14 Years | 0 (0.0%) | 38 (26.0%) |
| 15 Years | 0 (0.0%) | 0 (0.0%) |
| 16 and 17 Years | 0 (0.0%) | 0 (0.0%) |
| 18 to 24 Years | 0 (0.0%) | 0 (0.0%) |
| 25 to 34 Years | 55 (8.5%) | 133 (25.2%) |
| 35 to 44 Years | 0 (0.0%) | 20 (5.3%) |
| 45 to 54 Years | 0 (0.0%) | 9 (1.9%) |
| 55 to 64 Years | 0 (0.0%) | 31 (6.3%) |
| 65 to 74 Years | 0 (0.0%) | 45 (7.5%) |
| 75 Years and over | 51 (15.0%) | 112 (26.0%) |
| Total | 376 (9.1%) | 453 (12.9%) |
Income Above Poverty by Sex and Age in Northridge
According to the poverty statistics in Northridge, males aged 12 to 14 years and females aged under 5 years are the age groups that are most secure financially, with 100.0% of males and 100.0% of females in these age groups living above the poverty line.

| Age Bracket | Male | Female |
| Under 5 Years | 360 (85.5%) | 97 (100.0%) |
| 5 Years | 8 (47.1%) | 17 (100.0%) |
| 6 to 11 Years | 373 (65.1%) | 69 (51.5%) |
| 12 to 14 Years | 104 (100.0%) | 108 (74.0%) |
| 15 Years | 50 (100.0%) | 15 (100.0%) |
| 16 and 17 Years | 86 (100.0%) | 112 (100.0%) |
| 18 to 24 Years | 155 (100.0%) | 101 (100.0%) |
| 25 to 34 Years | 596 (91.5%) | 394 (74.8%) |
| 35 to 44 Years | 334 (100.0%) | 358 (94.7%) |
| 45 to 54 Years | 443 (100.0%) | 462 (98.1%) |
| 55 to 64 Years | 434 (100.0%) | 464 (93.7%) |
| 65 to 74 Years | 508 (100.0%) | 554 (92.5%) |
| 75 Years and over | 288 (85.0%) | 319 (74.0%) |
| Total | 3,739 (90.9%) | 3,070 (87.1%) |
Income Below Poverty Among Married-Couple Families in Northridge
The poverty statistics for married-couple families in Northridge show that 2.9% or 45 of the total 1,557 families live below the poverty line. Families with no children have the highest poverty rate of 5.2%, comprising of 45 families. On the other hand, families with 1 or 2 children have the lowest poverty rate of 0.0%, which includes 0 families.
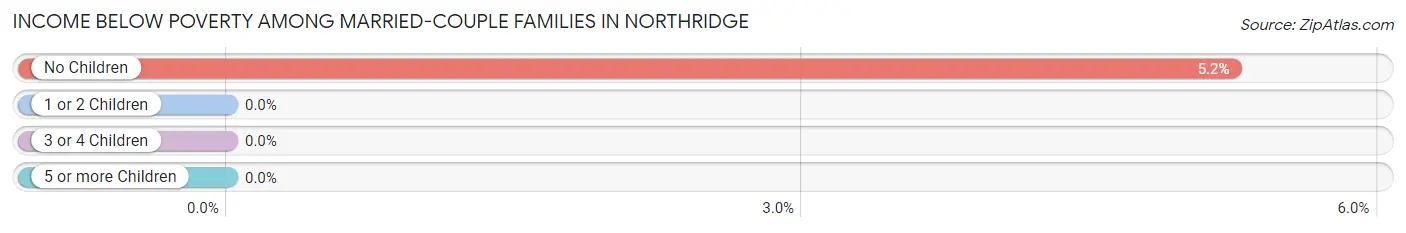
| Children | Above Poverty | Below Poverty |
| No Children | 814 (94.8%) | 45 (5.2%) |
| 1 or 2 Children | 576 (100.0%) | 0 (0.0%) |
| 3 or 4 Children | 122 (100.0%) | 0 (0.0%) |
| 5 or more Children | 0 (0.0%) | 0 (0.0%) |
| Total | 1,512 (97.1%) | 45 (2.9%) |
Income Below Poverty Among Single-Parent Households in Northridge

| Children | Single Father | Single Mother |
| No Children | 0 (0.0%) | 0 (0.0%) |
| 1 or 2 Children | 0 (0.0%) | 42 (38.5%) |
| 3 or 4 Children | 0 (0.0%) | 108 (100.0%) |
| 5 or more Children | 0 (0.0%) | 0 (0.0%) |
| Total | 0 (0.0%) | 150 (44.5%) |
Income Below Poverty Among Married-Couple vs Single-Parent Households in Northridge
The poverty data for Northridge shows that 45 of the married-couple family households (2.9%) and 150 of the single-parent households (27.9%) are living below the poverty level. Within the married-couple family households, those with no children have the highest poverty rate, with 45 households (5.2%) falling below the poverty line. Among the single-parent households, those with 3 or 4 children have the highest poverty rate, with 108 household (100.0%) living below poverty.
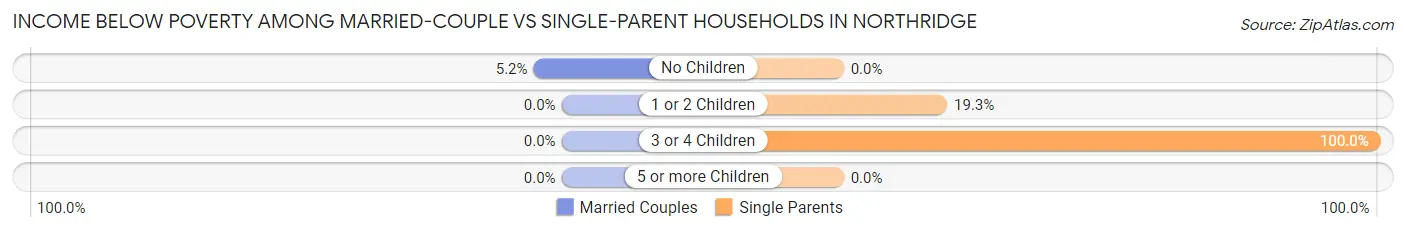
| Children | Married-Couple Families | Single-Parent Households |
| No Children | 45 (5.2%) | 0 (0.0%) |
| 1 or 2 Children | 0 (0.0%) | 42 (19.3%) |
| 3 or 4 Children | 0 (0.0%) | 108 (100.0%) |
| 5 or more Children | 0 (0.0%) | 0 (0.0%) |
| Total | 45 (2.9%) | 150 (27.9%) |
Employment Characteristics in Northridge
Employment by Class of Employer in Northridge
Among the 3,094 employed individuals in Northridge, private company employees (2,055 | 66.4%), not-for-profit organizations (518 | 16.7%), and local government employees (306 | 9.9%) make up the most common classes of employment.
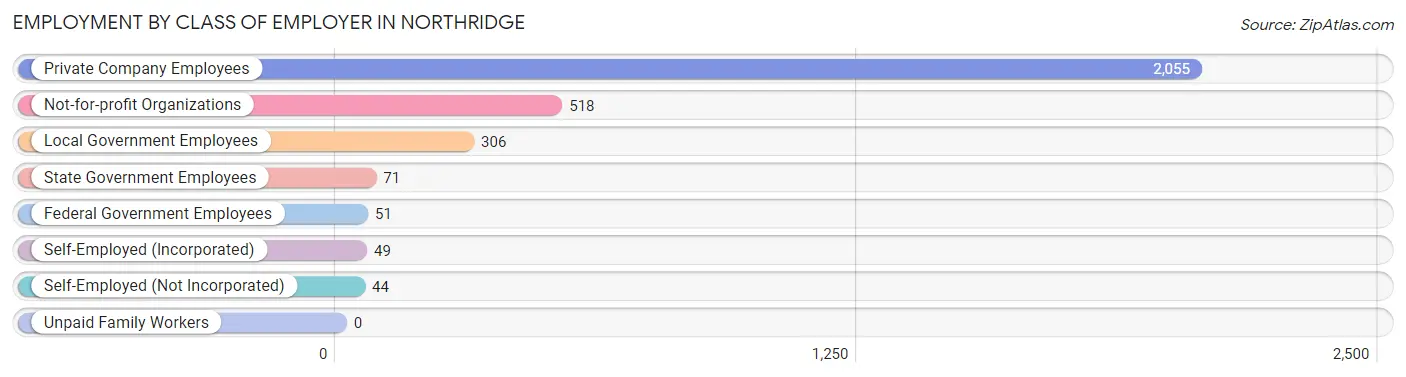
| Employer Class | # Employees | % Employees |
| Private Company Employees | 2,055 | 66.4% |
| Self-Employed (Incorporated) | 49 | 1.6% |
| Self-Employed (Not Incorporated) | 44 | 1.4% |
| Not-for-profit Organizations | 518 | 16.7% |
| Local Government Employees | 306 | 9.9% |
| State Government Employees | 71 | 2.3% |
| Federal Government Employees | 51 | 1.7% |
| Unpaid Family Workers | 0 | 0.0% |
| Total | 3,094 | 100.0% |
Employment Status by Age in Northridge
According to the labor force statistics for Northridge, out of the total population over 16 years of age (6,064), 56.0% or 3,396 individuals are in the labor force, with 4.9% or 166 of them unemployed. The age group with the highest labor force participation rate is 20 to 24 years, with 90.7% or 175 individuals in the labor force. Within the labor force, the 30 to 34 years age range has the highest percentage of unemployed individuals, with 22.6% or 125 of them being unemployed.
| Age Bracket | In Labor Force | Unemployed |
| 16 to 19 Years | 121 (46.4%) | 26 (21.5%) |
| 20 to 24 Years | 175 (90.7%) | 0 (0.0%) |
| 25 to 29 Years | 260 (50.1%) | 0 (0.0%) |
| 30 to 34 Years | 552 (83.8%) | 125 (22.6%) |
| 35 to 44 Years | 583 (81.9%) | 0 (0.0%) |
| 45 to 54 Years | 813 (88.9%) | 16 (2.0%) |
| 55 to 59 Years | 368 (65.2%) | 1 (0.3%) |
| 60 to 64 Years | 211 (57.8%) | 0 (0.0%) |
| 65 to 74 Years | 289 (26.1%) | 0 (0.0%) |
| 75 Years and over | 25 (3.2%) | 0 (0.0%) |
| Total | 3,396 (56.0%) | 166 (4.9%) |
Employment Status by Educational Attainment in Northridge
According to labor force statistics for Northridge, 74.7% of individuals (2,789) out of the total population between 25 and 64 years of age (3,733) are in the labor force, with 5.1% or 142 of them being unemployed. The group with the highest labor force participation rate are those with the educational attainment of bachelor's degree or higher, with 89.8% or 770 individuals in the labor force. Within the labor force, individuals with high school diploma education have the highest percentage of unemployment, with 18.4% or 126 of them being unemployed.
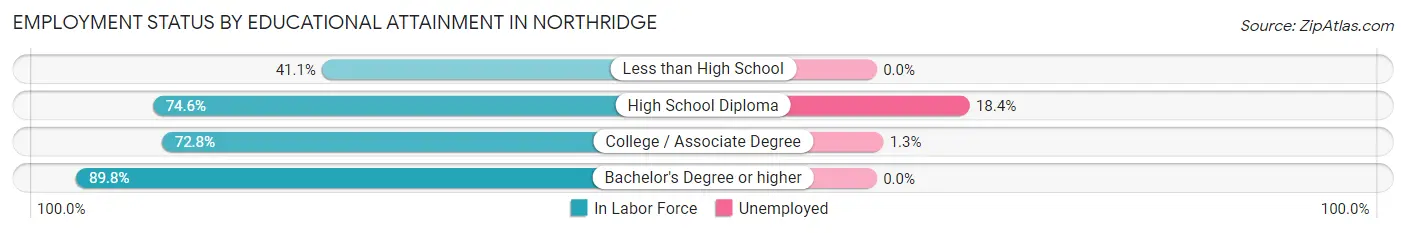
| Educational Attainment | In Labor Force | Unemployed |
| Less than High School | 122 (41.1%) | 0 (0.0%) |
| High School Diploma | 685 (74.6%) | 169 (18.4%) |
| College / Associate Degree | 1,209 (72.8%) | 22 (1.3%) |
| Bachelor's Degree or higher | 770 (89.8%) | 0 (0.0%) |
| Total | 2,789 (74.7%) | 190 (5.1%) |
Employment Occupations by Sex in Northridge
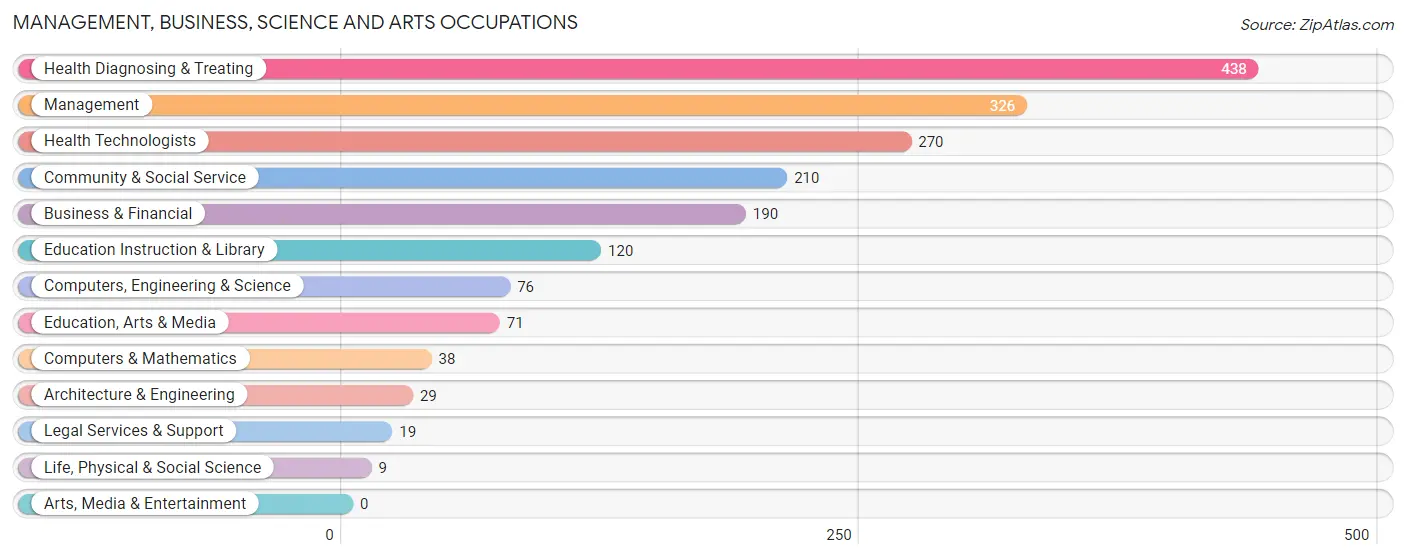
Management, Business, Science and Arts Occupations
The most common Management, Business, Science and Arts occupations in Northridge are Health Diagnosing & Treating (438 | 13.6%), Management (326 | 10.1%), Health Technologists (270 | 8.4%), Community & Social Service (210 | 6.5%), and Business & Financial (190 | 5.9%).
Management, Business, Science and Arts Occupations by Sex
Within the Management, Business, Science and Arts occupations in Northridge, the most male-oriented occupations are Legal Services & Support (100.0%), Computers & Mathematics (86.8%), and Education, Arts & Media (74.7%), while the most female-oriented occupations are Life, Physical & Social Science (100.0%), Education Instruction & Library (88.3%), and Health Diagnosing & Treating (86.1%).
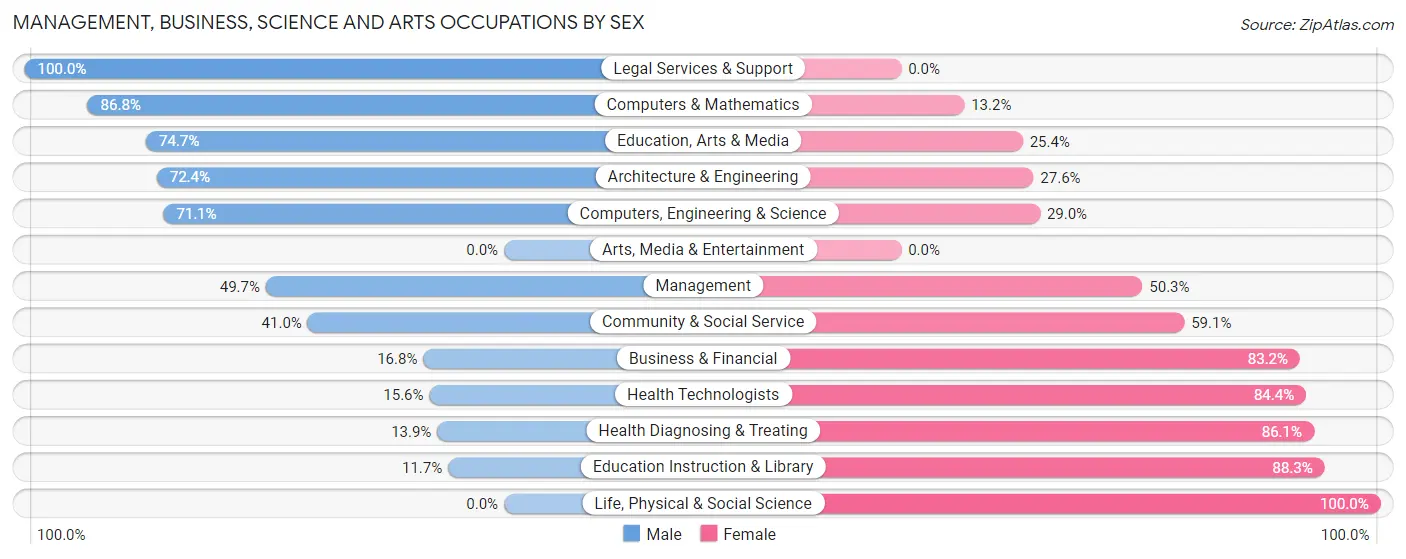
| Occupation | Male | Female |
| Management | 162 (49.7%) | 164 (50.3%) |
| Business & Financial | 32 (16.8%) | 158 (83.2%) |
| Computers, Engineering & Science | 54 (71.1%) | 22 (28.9%) |
| Computers & Mathematics | 33 (86.8%) | 5 (13.2%) |
| Architecture & Engineering | 21 (72.4%) | 8 (27.6%) |
| Life, Physical & Social Science | 0 (0.0%) | 9 (100.0%) |
| Community & Social Service | 86 (40.9%) | 124 (59.1%) |
| Education, Arts & Media | 53 (74.7%) | 18 (25.4%) |
| Legal Services & Support | 19 (100.0%) | 0 (0.0%) |
| Education Instruction & Library | 14 (11.7%) | 106 (88.3%) |
| Arts, Media & Entertainment | 0 (0.0%) | 0 (0.0%) |
| Health Diagnosing & Treating | 61 (13.9%) | 377 (86.1%) |
| Health Technologists | 42 (15.6%) | 228 (84.4%) |
| Total (Category) | 395 (31.9%) | 845 (68.1%) |
| Total (Overall) | 1,715 (53.1%) | 1,514 (46.9%) |
Services Occupations
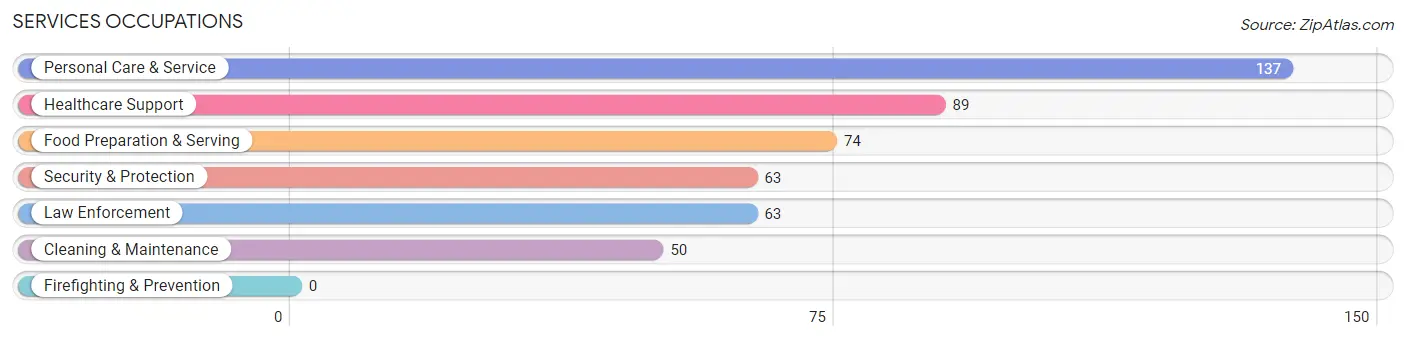
The most common Services occupations in Northridge are Personal Care & Service (137 | 4.2%), Healthcare Support (89 | 2.8%), Food Preparation & Serving (74 | 2.3%), Security & Protection (63 | 1.9%), and Law Enforcement (63 | 1.9%).
Services Occupations by Sex
Within the Services occupations in Northridge, the most male-oriented occupations are Security & Protection (100.0%), Law Enforcement (100.0%), and Personal Care & Service (35.0%), while the most female-oriented occupations are Healthcare Support (100.0%), Food Preparation & Serving (71.6%), and Cleaning & Maintenance (68.0%).
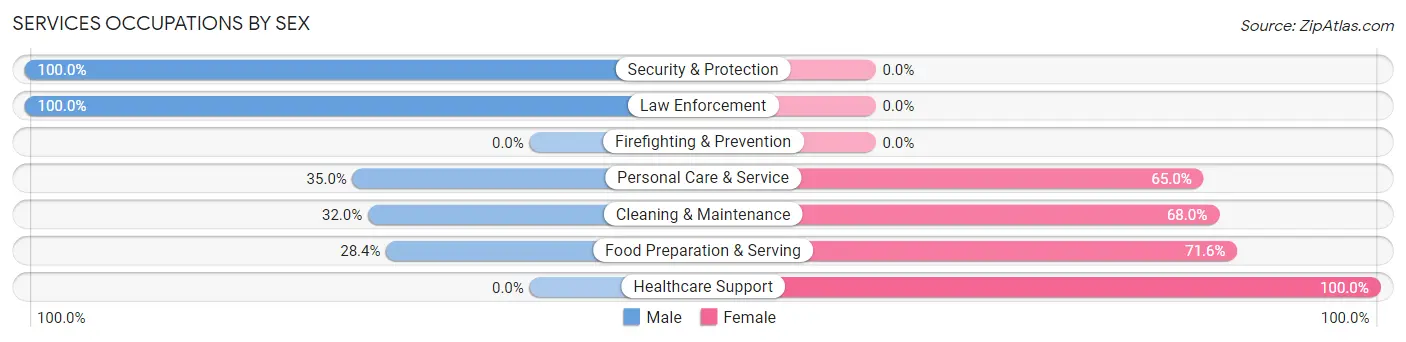
| Occupation | Male | Female |
| Healthcare Support | 0 (0.0%) | 89 (100.0%) |
| Security & Protection | 63 (100.0%) | 0 (0.0%) |
| Firefighting & Prevention | 0 (0.0%) | 0 (0.0%) |
| Law Enforcement | 63 (100.0%) | 0 (0.0%) |
| Food Preparation & Serving | 21 (28.4%) | 53 (71.6%) |
| Cleaning & Maintenance | 16 (32.0%) | 34 (68.0%) |
| Personal Care & Service | 48 (35.0%) | 89 (65.0%) |
| Total (Category) | 148 (35.8%) | 265 (64.2%) |
| Total (Overall) | 1,715 (53.1%) | 1,514 (46.9%) |
Sales and Office Occupations
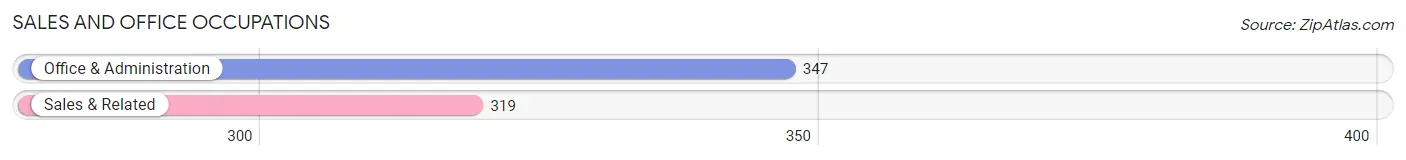
The most common Sales and Office occupations in Northridge are Office & Administration (347 | 10.7%), and Sales & Related (319 | 9.9%).
Sales and Office Occupations by Sex

| Occupation | Male | Female |
| Sales & Related | 250 (78.4%) | 69 (21.6%) |
| Office & Administration | 166 (47.8%) | 181 (52.2%) |
| Total (Category) | 416 (62.5%) | 250 (37.5%) |
| Total (Overall) | 1,715 (53.1%) | 1,514 (46.9%) |
Natural Resources, Construction and Maintenance Occupations
The most common Natural Resources, Construction and Maintenance occupations in Northridge are Construction & Extraction (179 | 5.5%), and Installation, Maintenance & Repair (139 | 4.3%).

Natural Resources, Construction and Maintenance Occupations by Sex
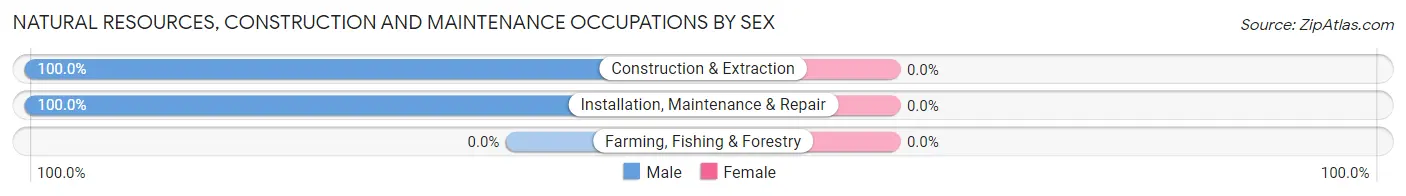
| Occupation | Male | Female |
| Farming, Fishing & Forestry | 0 (0.0%) | 0 (0.0%) |
| Construction & Extraction | 179 (100.0%) | 0 (0.0%) |
| Installation, Maintenance & Repair | 139 (100.0%) | 0 (0.0%) |
| Total (Category) | 318 (100.0%) | 0 (0.0%) |
| Total (Overall) | 1,715 (53.1%) | 1,514 (46.9%) |
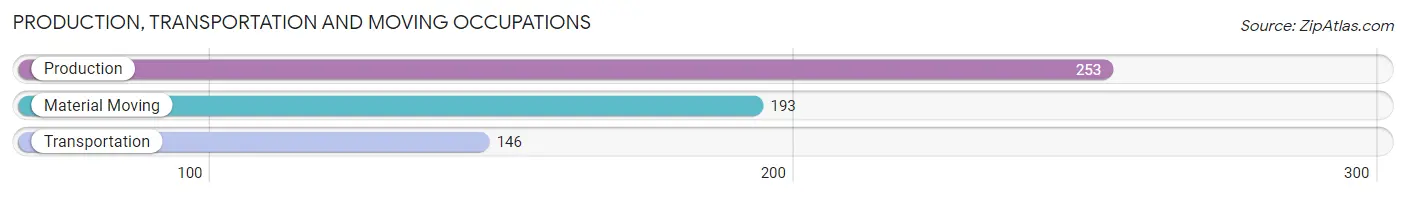
Production, Transportation and Moving Occupations
The most common Production, Transportation and Moving occupations in Northridge are Production (253 | 7.8%), Material Moving (193 | 6.0%), and Transportation (146 | 4.5%).
Production, Transportation and Moving Occupations by Sex

| Occupation | Male | Female |
| Production | 194 (76.7%) | 59 (23.3%) |
| Transportation | 121 (82.9%) | 25 (17.1%) |
| Material Moving | 123 (63.7%) | 70 (36.3%) |
| Total (Category) | 438 (74.0%) | 154 (26.0%) |
| Total (Overall) | 1,715 (53.1%) | 1,514 (46.9%) |
Employment Industries by Sex in Northridge
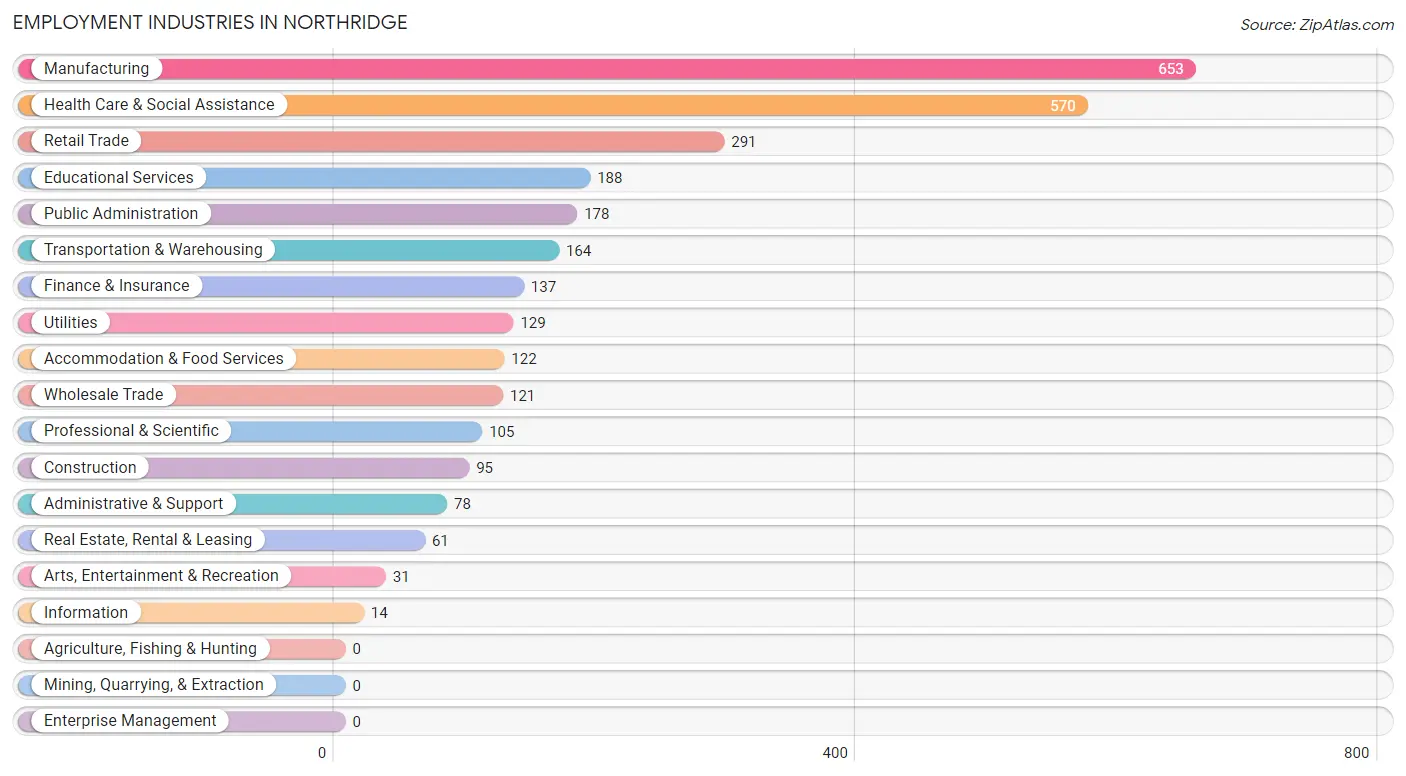
Employment Industries in Northridge
The major employment industries in Northridge include Manufacturing (653 | 20.2%), Health Care & Social Assistance (570 | 17.6%), Retail Trade (291 | 9.0%), Educational Services (188 | 5.8%), and Public Administration (178 | 5.5%).
Employment Industries by Sex in Northridge
The Northridge industries that see more men than women are Construction (100.0%), Wholesale Trade (100.0%), and Utilities (100.0%), whereas the industries that tend to have a higher number of women are Information (100.0%), Real Estate, Rental & Leasing (100.0%), and Arts, Entertainment & Recreation (100.0%).
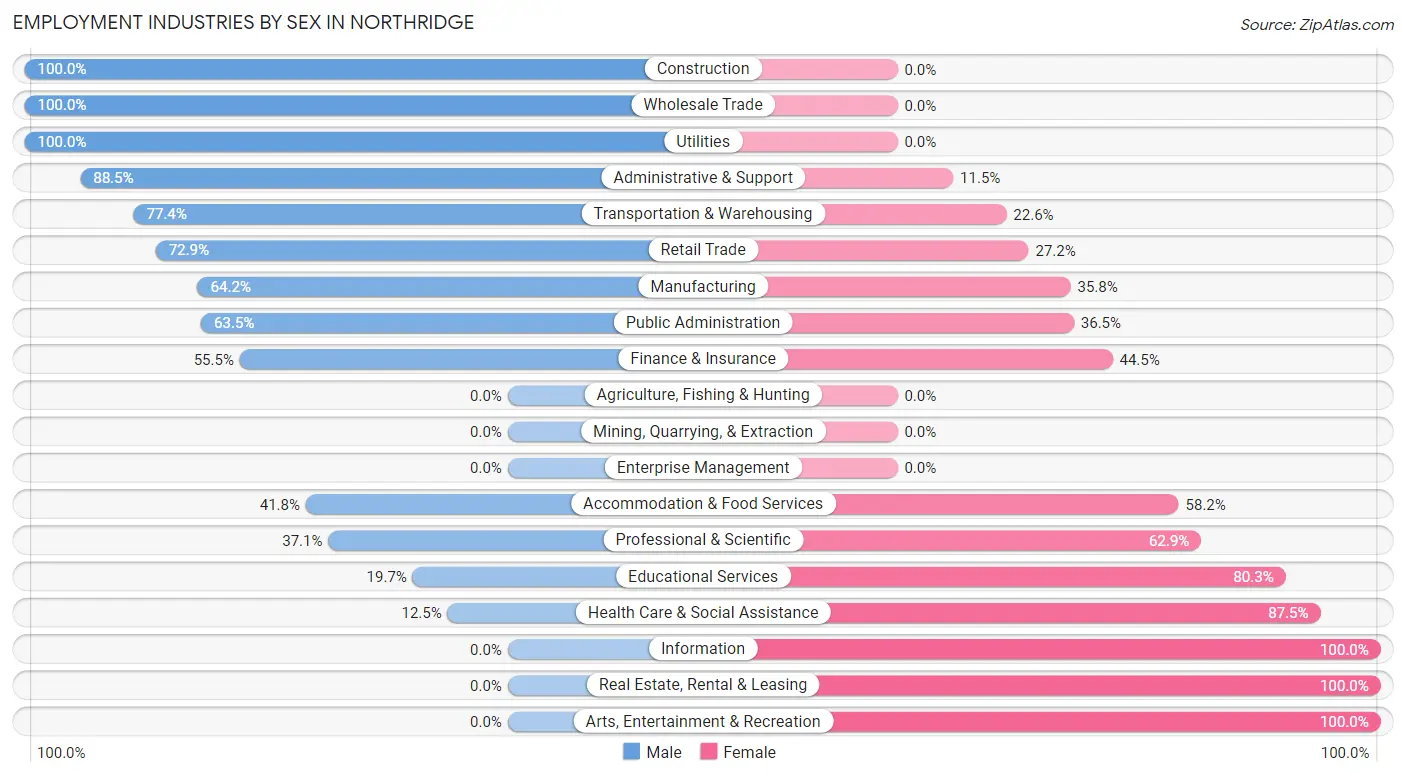
| Industry | Male | Female |
| Agriculture, Fishing & Hunting | 0 (0.0%) | 0 (0.0%) |
| Mining, Quarrying, & Extraction | 0 (0.0%) | 0 (0.0%) |
| Construction | 95 (100.0%) | 0 (0.0%) |
| Manufacturing | 419 (64.2%) | 234 (35.8%) |
| Wholesale Trade | 121 (100.0%) | 0 (0.0%) |
| Retail Trade | 212 (72.9%) | 79 (27.2%) |
| Transportation & Warehousing | 127 (77.4%) | 37 (22.6%) |
| Utilities | 129 (100.0%) | 0 (0.0%) |
| Information | 0 (0.0%) | 14 (100.0%) |
| Finance & Insurance | 76 (55.5%) | 61 (44.5%) |
| Real Estate, Rental & Leasing | 0 (0.0%) | 61 (100.0%) |
| Professional & Scientific | 39 (37.1%) | 66 (62.9%) |
| Enterprise Management | 0 (0.0%) | 0 (0.0%) |
| Administrative & Support | 69 (88.5%) | 9 (11.5%) |
| Educational Services | 37 (19.7%) | 151 (80.3%) |
| Health Care & Social Assistance | 71 (12.5%) | 499 (87.5%) |
| Arts, Entertainment & Recreation | 0 (0.0%) | 31 (100.0%) |
| Accommodation & Food Services | 51 (41.8%) | 71 (58.2%) |
| Public Administration | 113 (63.5%) | 65 (36.5%) |
| Total | 1,715 (53.1%) | 1,514 (46.9%) |
Education in Northridge
School Enrollment in Northridge
The most common levels of schooling among the 1,472 students in Northridge are elementary school (536 | 36.4%), middle school (325 | 22.1%), and high school (281 | 19.1%).
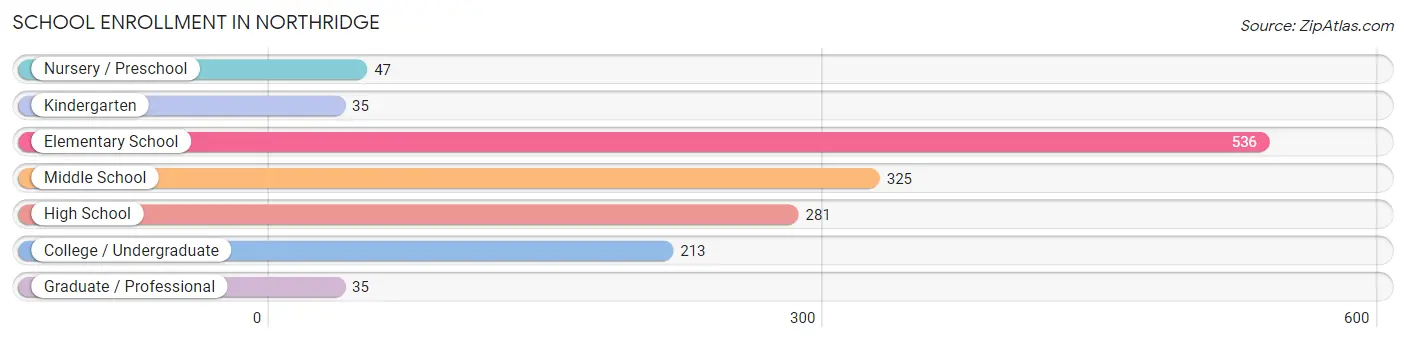
| School Level | # Students | % Students |
| Nursery / Preschool | 47 | 3.2% |
| Kindergarten | 35 | 2.4% |
| Elementary School | 536 | 36.4% |
| Middle School | 325 | 22.1% |
| High School | 281 | 19.1% |
| College / Undergraduate | 213 | 14.5% |
| Graduate / Professional | 35 | 2.4% |
| Total | 1,472 | 100.0% |
School Enrollment by Age by Funding Source in Northridge
Out of a total of 1,472 students who are enrolled in schools in Northridge, 135 (9.2%) attend a private institution, while the remaining 1,337 (90.8%) are enrolled in public schools. The age group of 3 to 4 year olds has the highest likelihood of being enrolled in private schools, with 38 (100.0% in the age bracket) enrolled. Conversely, the age group of 18 to 19 year olds has the lowest likelihood of being enrolled in a private school, with 45 (100.0% in the age bracket) attending a public institution.

| Age Bracket | Public School | Private School |
| 3 to 4 Year Olds | 0 (0.0%) | 38 (100.0%) |
| 5 to 9 Year Old | 515 (91.5%) | 48 (8.5%) |
| 10 to 14 Year Olds | 340 (97.4%) | 9 (2.6%) |
| 15 to 17 Year Olds | 226 (89.7%) | 26 (10.3%) |
| 18 to 19 Year Olds | 45 (100.0%) | 0 (0.0%) |
| 20 to 24 Year Olds | 87 (100.0%) | 0 (0.0%) |
| 25 to 34 Year Olds | 124 (89.9%) | 14 (10.1%) |
| 35 Years and over | 0 (0.0%) | 0 (0.0%) |
| Total | 1,337 (90.8%) | 135 (9.2%) |
Educational Attainment by Field of Study in Northridge
Business (314 | 23.6%), science & technology (201 | 15.1%), education (195 | 14.7%), arts & humanities (110 | 8.3%), and literature & languages (101 | 7.6%) are the most common fields of study among 1,329 individuals in Northridge who have obtained a bachelor's degree or higher.

| Field of Study | # Graduates | % Graduates |
| Computers & Mathematics | 0 | 0.0% |
| Bio, Nature & Agricultural | 58 | 4.4% |
| Physical & Health Sciences | 67 | 5.0% |
| Psychology | 65 | 4.9% |
| Social Sciences | 53 | 4.0% |
| Engineering | 43 | 3.2% |
| Multidisciplinary Studies | 6 | 0.4% |
| Science & Technology | 201 | 15.1% |
| Business | 314 | 23.6% |
| Education | 195 | 14.7% |
| Literature & Languages | 101 | 7.6% |
| Liberal Arts & History | 79 | 5.9% |
| Visual & Performing Arts | 0 | 0.0% |
| Communications | 37 | 2.8% |
| Arts & Humanities | 110 | 8.3% |
| Total | 1,329 | 100.0% |
Transportation & Commute in Northridge
Vehicle Availability by Sex in Northridge
The most prevalent vehicle ownership categories in Northridge are males with 2 vehicles (718, accounting for 45.4%) and females with 2 vehicles (698, making up 47.5%).
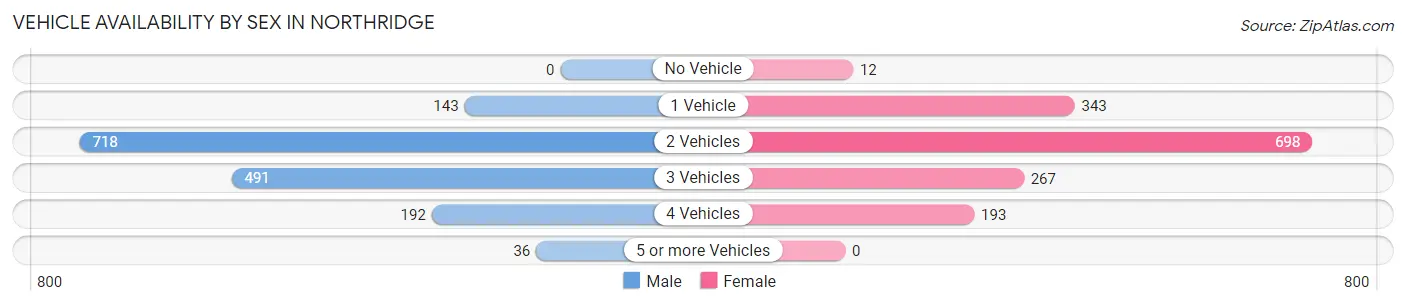
| Vehicles Available | Male | Female |
| No Vehicle | 0 (0.0%) | 12 (0.8%) |
| 1 Vehicle | 143 (9.0%) | 343 (22.7%) |
| 2 Vehicles | 718 (45.4%) | 698 (46.1%) |
| 3 Vehicles | 491 (31.1%) | 267 (17.6%) |
| 4 Vehicles | 192 (12.1%) | 193 (12.8%) |
| 5 or more Vehicles | 36 (2.3%) | 0 (0.0%) |
| Total | 1,580 (100.0%) | 1,513 (100.0%) |
Commute Time in Northridge
The most frequently occuring commute durations in Northridge are 15 to 19 minutes (765 commuters, 25.8%), 10 to 14 minutes (594 commuters, 20.1%), and 5 to 9 minutes (334 commuters, 11.3%).
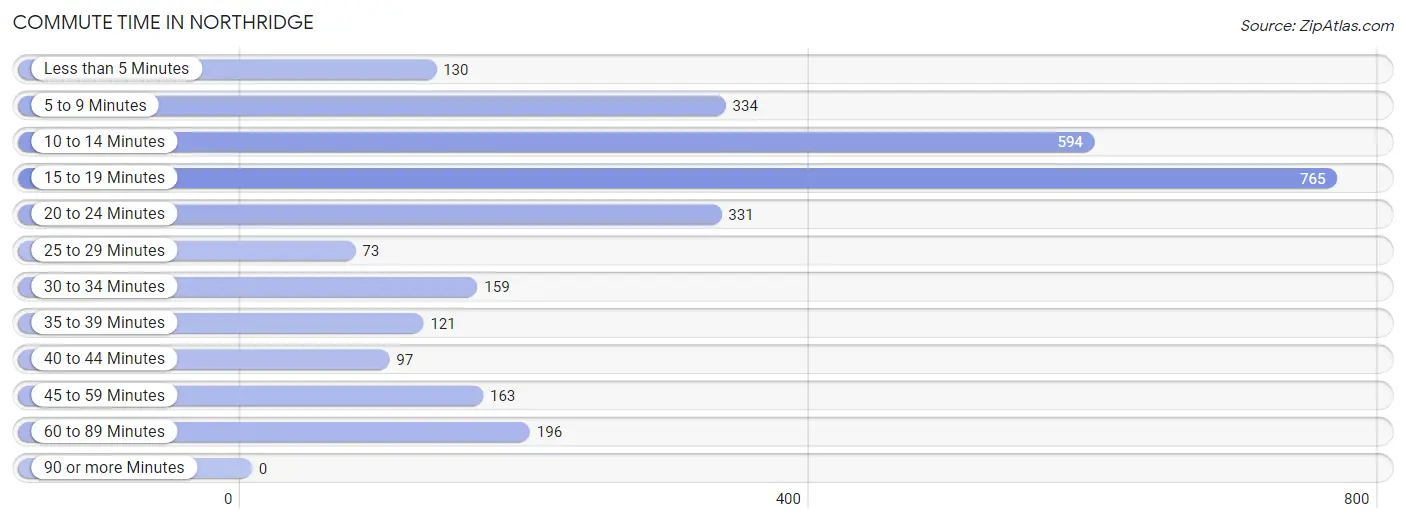
| Commute Time | # Commuters | % Commuters |
| Less than 5 Minutes | 130 | 4.4% |
| 5 to 9 Minutes | 334 | 11.3% |
| 10 to 14 Minutes | 594 | 20.1% |
| 15 to 19 Minutes | 765 | 25.8% |
| 20 to 24 Minutes | 331 | 11.2% |
| 25 to 29 Minutes | 73 | 2.5% |
| 30 to 34 Minutes | 159 | 5.4% |
| 35 to 39 Minutes | 121 | 4.1% |
| 40 to 44 Minutes | 97 | 3.3% |
| 45 to 59 Minutes | 163 | 5.5% |
| 60 to 89 Minutes | 196 | 6.6% |
| 90 or more Minutes | 0 | 0.0% |
Commute Time by Sex in Northridge
The most common commute times in Northridge are 15 to 19 minutes (424 commuters, 27.3%) for males and 10 to 14 minutes (384 commuters, 27.3%) for females.
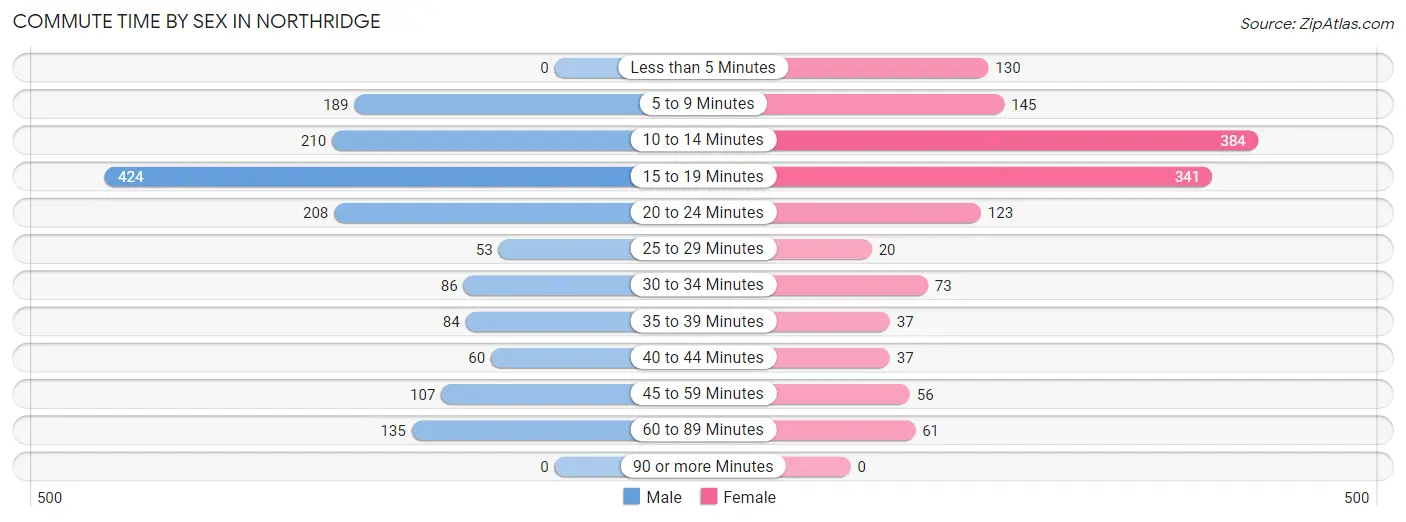
| Commute Time | Male | Female |
| Less than 5 Minutes | 0 (0.0%) | 130 (9.2%) |
| 5 to 9 Minutes | 189 (12.1%) | 145 (10.3%) |
| 10 to 14 Minutes | 210 (13.5%) | 384 (27.3%) |
| 15 to 19 Minutes | 424 (27.3%) | 341 (24.2%) |
| 20 to 24 Minutes | 208 (13.4%) | 123 (8.7%) |
| 25 to 29 Minutes | 53 (3.4%) | 20 (1.4%) |
| 30 to 34 Minutes | 86 (5.5%) | 73 (5.2%) |
| 35 to 39 Minutes | 84 (5.4%) | 37 (2.6%) |
| 40 to 44 Minutes | 60 (3.9%) | 37 (2.6%) |
| 45 to 59 Minutes | 107 (6.9%) | 56 (4.0%) |
| 60 to 89 Minutes | 135 (8.7%) | 61 (4.3%) |
| 90 or more Minutes | 0 (0.0%) | 0 (0.0%) |
Time of Departure to Work by Sex in Northridge
The most frequent times of departure to work in Northridge are 7:30 AM to 7:59 AM (369, 23.7%) for males and 8:00 AM to 8:29 AM (247, 17.6%) for females.
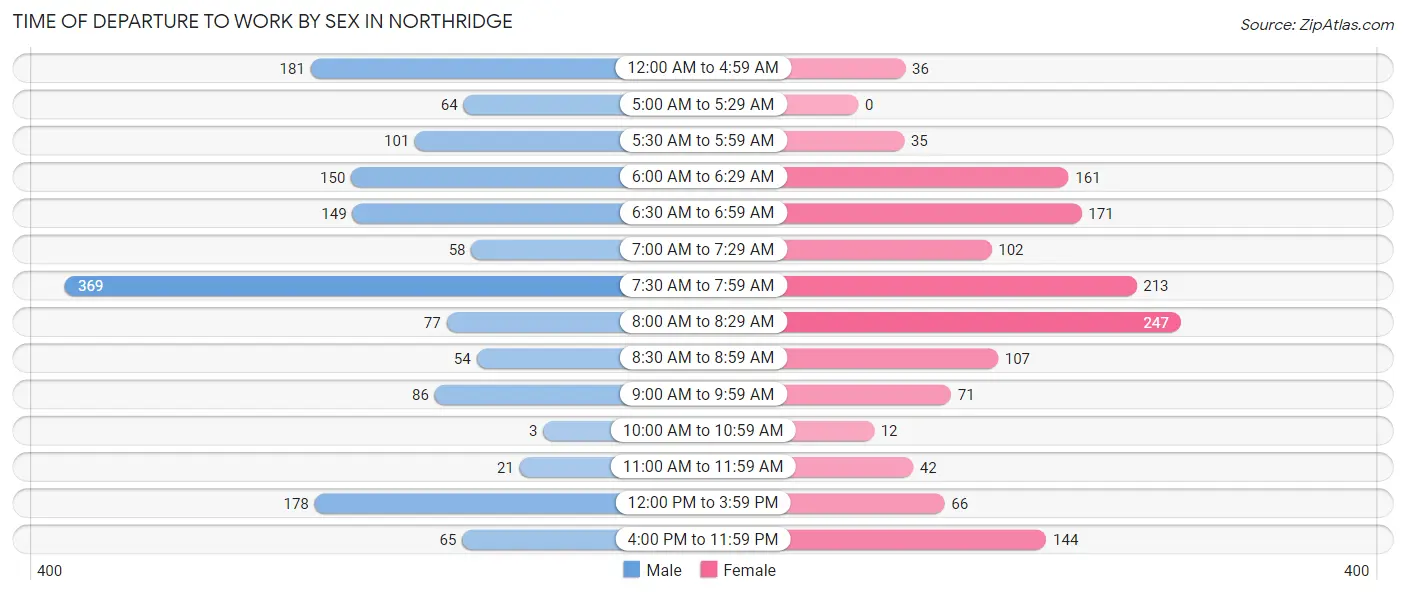
| Time of Departure | Male | Female |
| 12:00 AM to 4:59 AM | 181 (11.6%) | 36 (2.6%) |
| 5:00 AM to 5:29 AM | 64 (4.1%) | 0 (0.0%) |
| 5:30 AM to 5:59 AM | 101 (6.5%) | 35 (2.5%) |
| 6:00 AM to 6:29 AM | 150 (9.6%) | 161 (11.4%) |
| 6:30 AM to 6:59 AM | 149 (9.6%) | 171 (12.1%) |
| 7:00 AM to 7:29 AM | 58 (3.7%) | 102 (7.2%) |
| 7:30 AM to 7:59 AM | 369 (23.7%) | 213 (15.1%) |
| 8:00 AM to 8:29 AM | 77 (5.0%) | 247 (17.6%) |
| 8:30 AM to 8:59 AM | 54 (3.5%) | 107 (7.6%) |
| 9:00 AM to 9:59 AM | 86 (5.5%) | 71 (5.1%) |
| 10:00 AM to 10:59 AM | 3 (0.2%) | 12 (0.9%) |
| 11:00 AM to 11:59 AM | 21 (1.3%) | 42 (3.0%) |
| 12:00 PM to 3:59 PM | 178 (11.4%) | 66 (4.7%) |
| 4:00 PM to 11:59 PM | 65 (4.2%) | 144 (10.2%) |
| Total | 1,556 (100.0%) | 1,407 (100.0%) |
Housing Occupancy in Northridge
Occupancy by Ownership in Northridge
Of the total 3,297 dwellings in Northridge, owner-occupied units account for 2,496 (75.7%), while renter-occupied units make up 801 (24.3%).
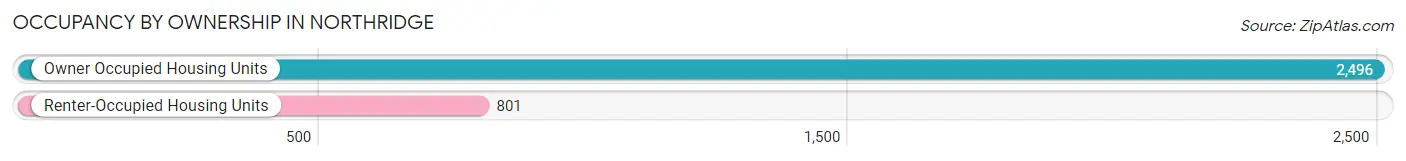
| Occupancy | # Housing Units | % Housing Units |
| Owner Occupied Housing Units | 2,496 | 75.7% |
| Renter-Occupied Housing Units | 801 | 24.3% |
| Total Occupied Housing Units | 3,297 | 100.0% |
Occupancy by Household Size in Northridge
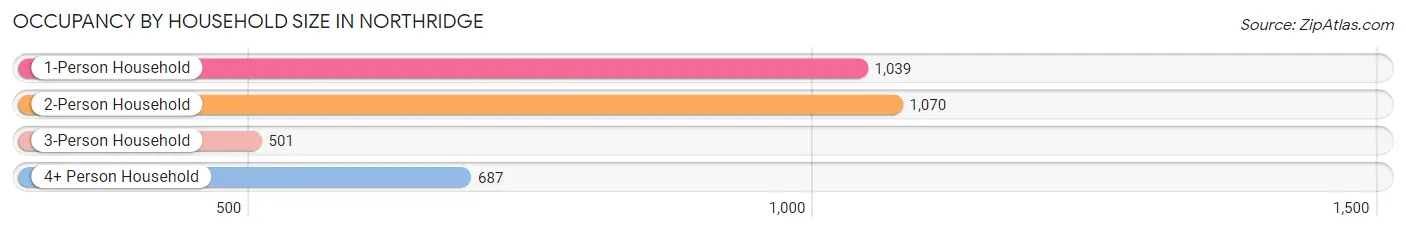
| Household Size | # Housing Units | % Housing Units |
| 1-Person Household | 1,039 | 31.5% |
| 2-Person Household | 1,070 | 32.5% |
| 3-Person Household | 501 | 15.2% |
| 4+ Person Household | 687 | 20.8% |
| Total Housing Units | 3,297 | 100.0% |
Occupancy by Ownership by Household Size in Northridge
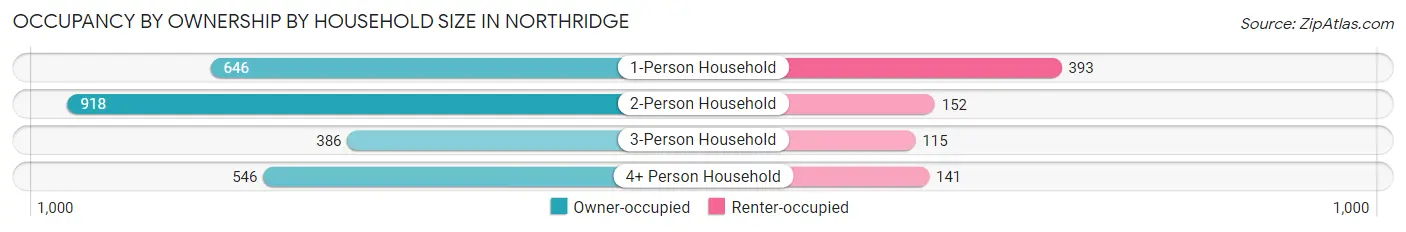
| Household Size | Owner-occupied | Renter-occupied |
| 1-Person Household | 646 (62.2%) | 393 (37.8%) |
| 2-Person Household | 918 (85.8%) | 152 (14.2%) |
| 3-Person Household | 386 (77.0%) | 115 (23.0%) |
| 4+ Person Household | 546 (79.5%) | 141 (20.5%) |
| Total Housing Units | 2,496 (75.7%) | 801 (24.3%) |
Occupancy by Educational Attainment in Northridge
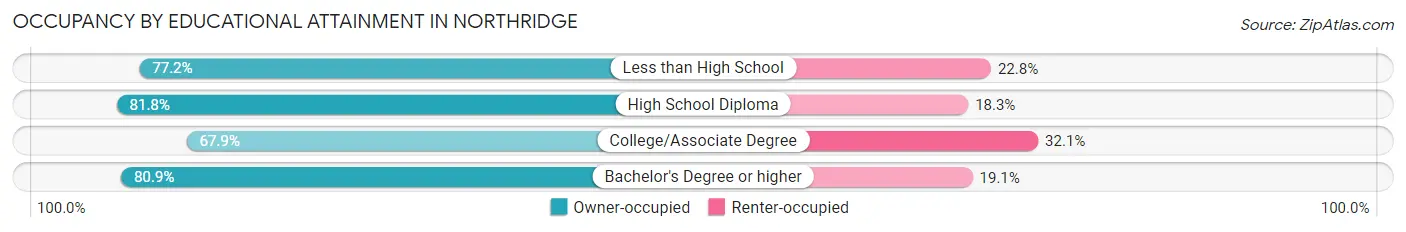
| Household Size | Owner-occupied | Renter-occupied |
| Less than High School | 95 (77.2%) | 28 (22.8%) |
| High School Diploma | 860 (81.8%) | 192 (18.2%) |
| College/Associate Degree | 915 (67.9%) | 433 (32.1%) |
| Bachelor's Degree or higher | 626 (80.9%) | 148 (19.1%) |
Occupancy by Age of Householder in Northridge
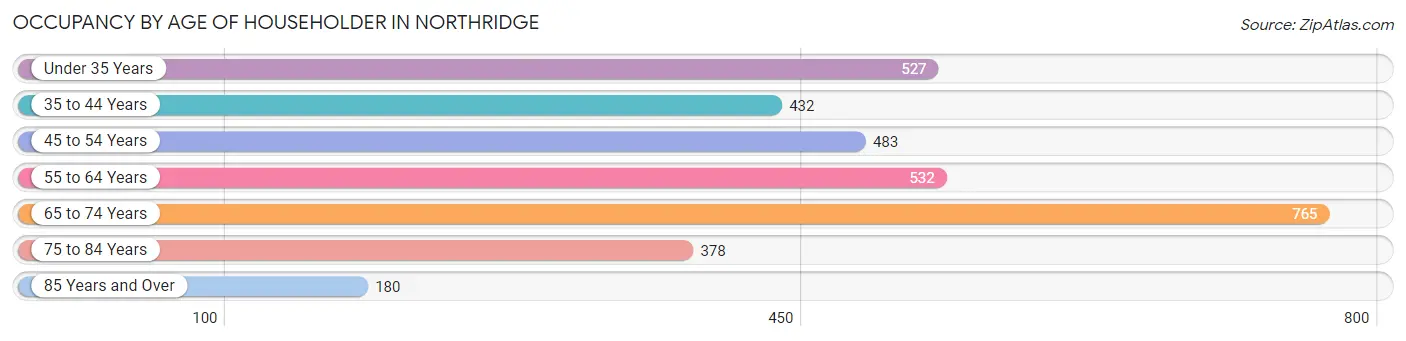
| Age Bracket | # Households | % Households |
| Under 35 Years | 527 | 16.0% |
| 35 to 44 Years | 432 | 13.1% |
| 45 to 54 Years | 483 | 14.6% |
| 55 to 64 Years | 532 | 16.1% |
| 65 to 74 Years | 765 | 23.2% |
| 75 to 84 Years | 378 | 11.5% |
| 85 Years and Over | 180 | 5.5% |
| Total | 3,297 | 100.0% |
Housing Finances in Northridge
Median Income by Occupancy in Northridge
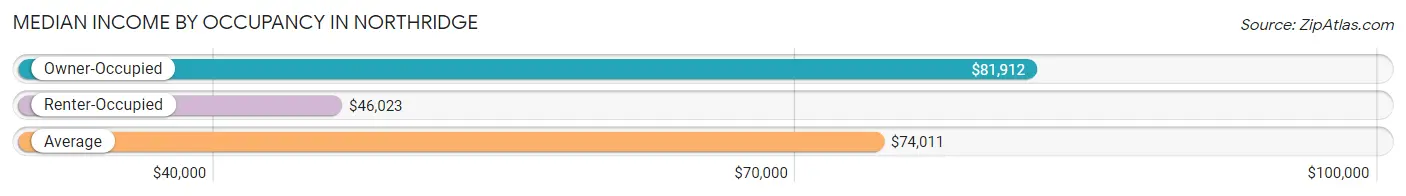
| Occupancy Type | # Households | Median Income |
| Owner-Occupied | 2,496 (75.7%) | $81,912 |
| Renter-Occupied | 801 (24.3%) | $46,023 |
| Average | 3,297 (100.0%) | $74,011 |
Occupancy by Householder Income Bracket in Northridge
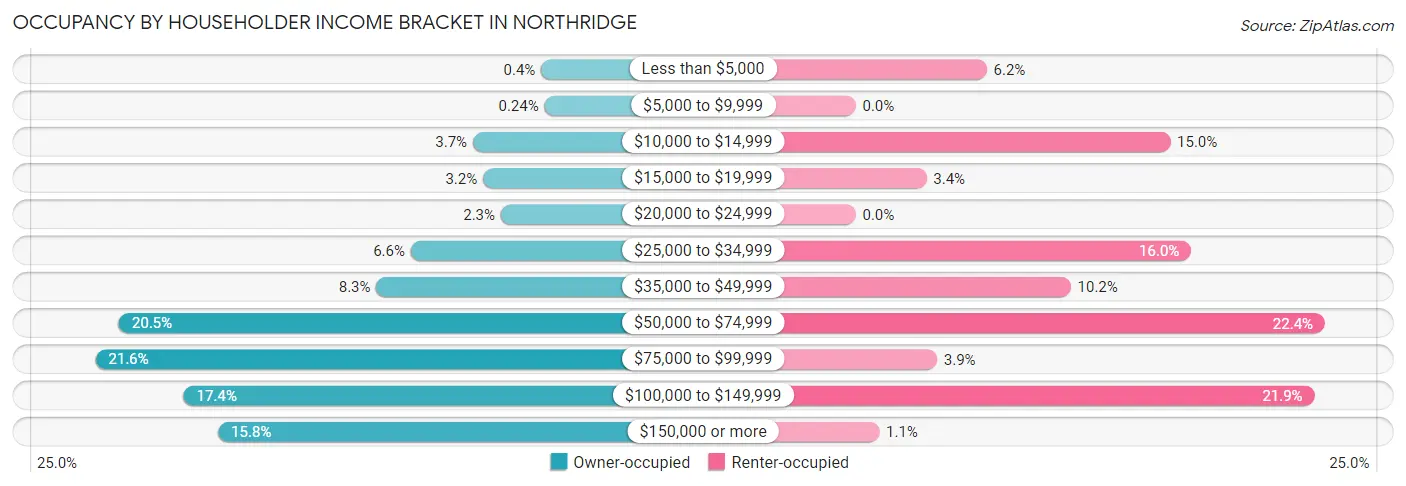
| Income Bracket | Owner-occupied | Renter-occupied |
| Less than $5,000 | 10 (0.4%) | 50 (6.2%) |
| $5,000 to $9,999 | 6 (0.2%) | 0 (0.0%) |
| $10,000 to $14,999 | 91 (3.6%) | 120 (15.0%) |
| $15,000 to $19,999 | 79 (3.2%) | 27 (3.4%) |
| $20,000 to $24,999 | 58 (2.3%) | 0 (0.0%) |
| $25,000 to $34,999 | 165 (6.6%) | 128 (16.0%) |
| $35,000 to $49,999 | 206 (8.3%) | 82 (10.2%) |
| $50,000 to $74,999 | 512 (20.5%) | 179 (22.4%) |
| $75,000 to $99,999 | 540 (21.6%) | 31 (3.9%) |
| $100,000 to $149,999 | 435 (17.4%) | 175 (21.8%) |
| $150,000 or more | 394 (15.8%) | 9 (1.1%) |
| Total | 2,496 (100.0%) | 801 (100.0%) |
Monthly Housing Cost Tiers in Northridge
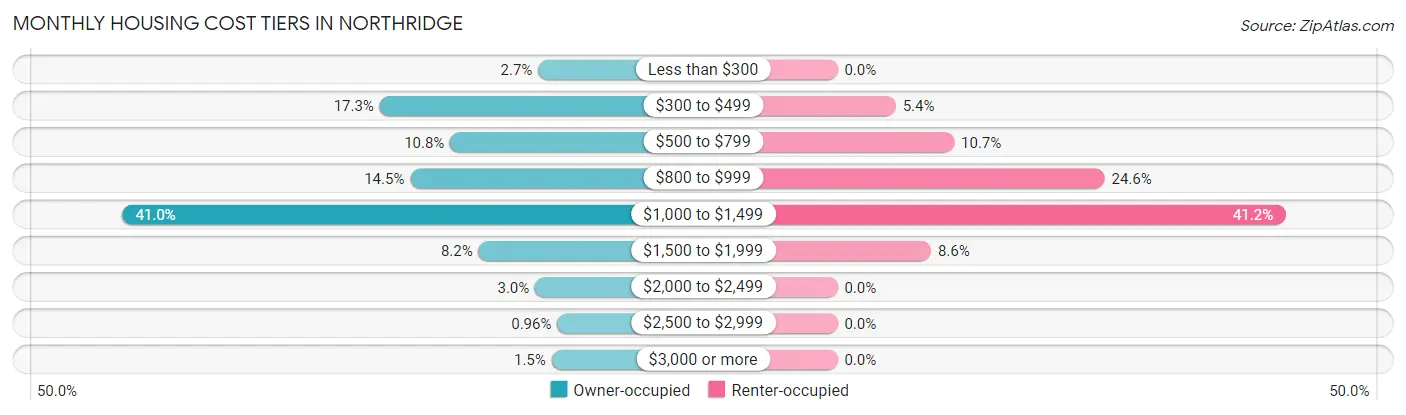
| Monthly Cost | Owner-occupied | Renter-occupied |
| Less than $300 | 68 (2.7%) | 0 (0.0%) |
| $300 to $499 | 432 (17.3%) | 43 (5.4%) |
| $500 to $799 | 270 (10.8%) | 86 (10.7%) |
| $800 to $999 | 362 (14.5%) | 197 (24.6%) |
| $1,000 to $1,499 | 1,023 (41.0%) | 330 (41.2%) |
| $1,500 to $1,999 | 205 (8.2%) | 69 (8.6%) |
| $2,000 to $2,499 | 75 (3.0%) | 0 (0.0%) |
| $2,500 to $2,999 | 24 (1.0%) | 0 (0.0%) |
| $3,000 or more | 37 (1.5%) | 0 (0.0%) |
| Total | 2,496 (100.0%) | 801 (100.0%) |
Physical Housing Characteristics in Northridge
Housing Structures in Northridge
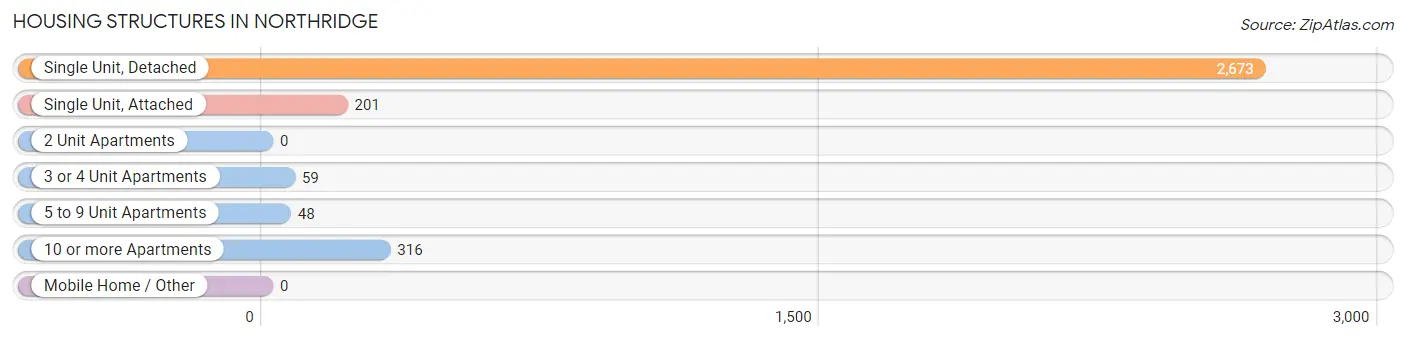
| Structure Type | # Housing Units | % Housing Units |
| Single Unit, Detached | 2,673 | 81.1% |
| Single Unit, Attached | 201 | 6.1% |
| 2 Unit Apartments | 0 | 0.0% |
| 3 or 4 Unit Apartments | 59 | 1.8% |
| 5 to 9 Unit Apartments | 48 | 1.5% |
| 10 or more Apartments | 316 | 9.6% |
| Mobile Home / Other | 0 | 0.0% |
| Total | 3,297 | 100.0% |
Housing Structures by Occupancy in Northridge
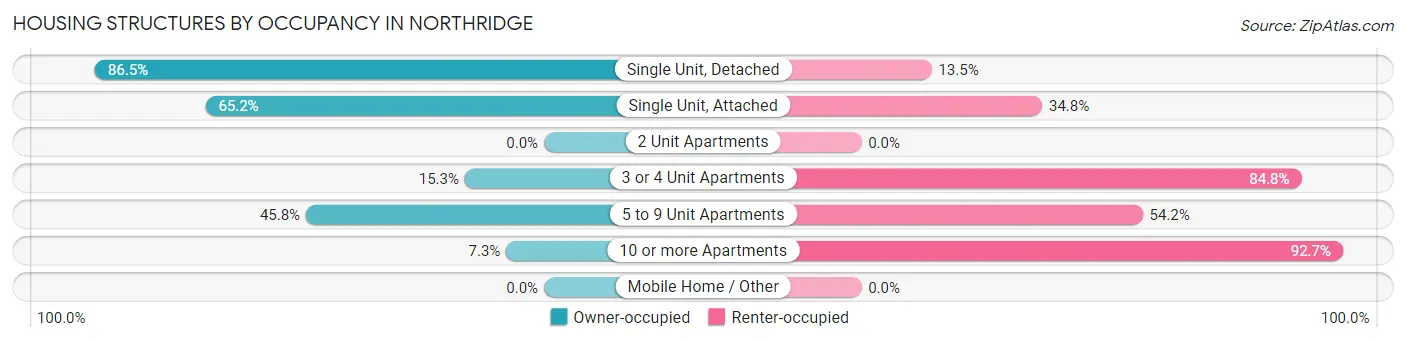
| Structure Type | Owner-occupied | Renter-occupied |
| Single Unit, Detached | 2,311 (86.5%) | 362 (13.5%) |
| Single Unit, Attached | 131 (65.2%) | 70 (34.8%) |
| 2 Unit Apartments | 0 (0.0%) | 0 (0.0%) |
| 3 or 4 Unit Apartments | 9 (15.2%) | 50 (84.8%) |
| 5 to 9 Unit Apartments | 22 (45.8%) | 26 (54.2%) |
| 10 or more Apartments | 23 (7.3%) | 293 (92.7%) |
| Mobile Home / Other | 0 (0.0%) | 0 (0.0%) |
| Total | 2,496 (75.7%) | 801 (24.3%) |
Housing Structures by Number of Rooms in Northridge
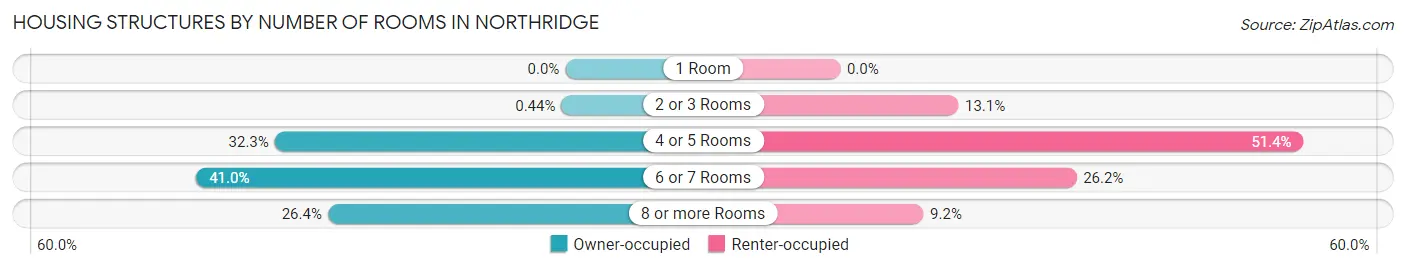
| Number of Rooms | Owner-occupied | Renter-occupied |
| 1 Room | 0 (0.0%) | 0 (0.0%) |
| 2 or 3 Rooms | 11 (0.4%) | 105 (13.1%) |
| 4 or 5 Rooms | 805 (32.3%) | 412 (51.4%) |
| 6 or 7 Rooms | 1,022 (40.9%) | 210 (26.2%) |
| 8 or more Rooms | 658 (26.4%) | 74 (9.2%) |
| Total | 2,496 (100.0%) | 801 (100.0%) |
Housing Structure by Heating Type in Northridge
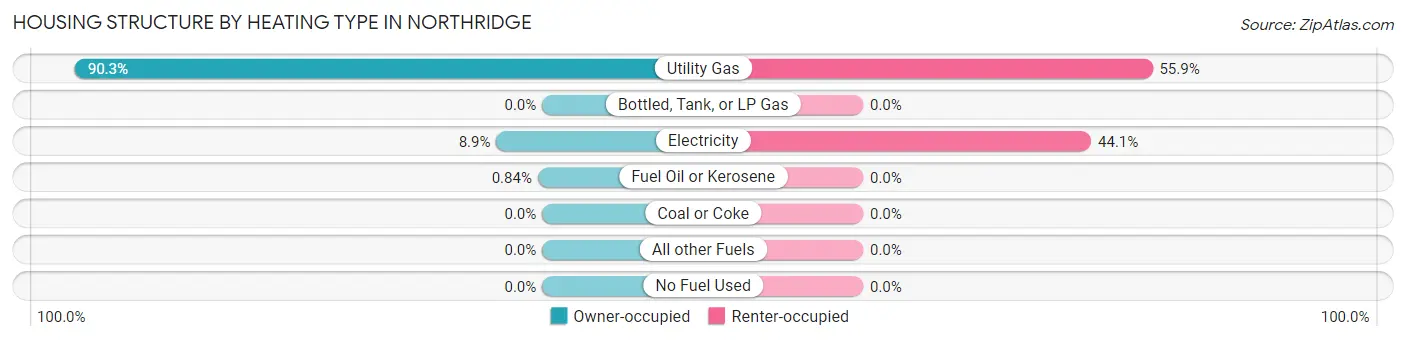
| Heating Type | Owner-occupied | Renter-occupied |
| Utility Gas | 2,254 (90.3%) | 448 (55.9%) |
| Bottled, Tank, or LP Gas | 0 (0.0%) | 0 (0.0%) |
| Electricity | 221 (8.8%) | 353 (44.1%) |
| Fuel Oil or Kerosene | 21 (0.8%) | 0 (0.0%) |
| Coal or Coke | 0 (0.0%) | 0 (0.0%) |
| All other Fuels | 0 (0.0%) | 0 (0.0%) |
| No Fuel Used | 0 (0.0%) | 0 (0.0%) |
| Total | 2,496 (100.0%) | 801 (100.0%) |
Household Vehicle Usage in Northridge

| Vehicles per Household | Owner-occupied | Renter-occupied |
| No Vehicle | 20 (0.8%) | 110 (13.7%) |
| 1 Vehicle | 717 (28.7%) | 397 (49.6%) |
| 2 Vehicles | 1,179 (47.2%) | 197 (24.6%) |
| 3 or more Vehicles | 580 (23.2%) | 97 (12.1%) |
| Total | 2,496 (100.0%) | 801 (100.0%) |
Real Estate & Mortgages in Northridge
Real Estate and Mortgage Overview in Northridge
| Characteristic | Without Mortgage | With Mortgage |
| Housing Units | 810 | 1,686 |
| Median Property Value | $167,000 | $158,400 |
| Median Household Income | $60,395 | $307 |
| Monthly Housing Costs | $463 | $37 |
| Real Estate Taxes | $1,924 | $140 |
Property Value by Mortgage Status in Northridge
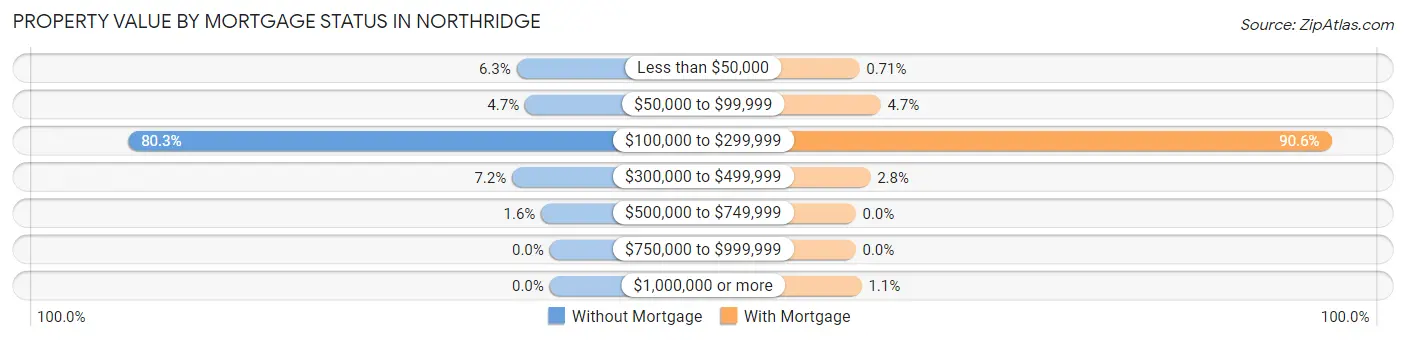
| Property Value | Without Mortgage | With Mortgage |
| Less than $50,000 | 51 (6.3%) | 12 (0.7%) |
| $50,000 to $99,999 | 38 (4.7%) | 80 (4.7%) |
| $100,000 to $299,999 | 650 (80.2%) | 1,528 (90.6%) |
| $300,000 to $499,999 | 58 (7.2%) | 47 (2.8%) |
| $500,000 to $749,999 | 13 (1.6%) | 0 (0.0%) |
| $750,000 to $999,999 | 0 (0.0%) | 0 (0.0%) |
| $1,000,000 or more | 0 (0.0%) | 19 (1.1%) |
| Total | 810 (100.0%) | 1,686 (100.0%) |
Household Income by Mortgage Status in Northridge
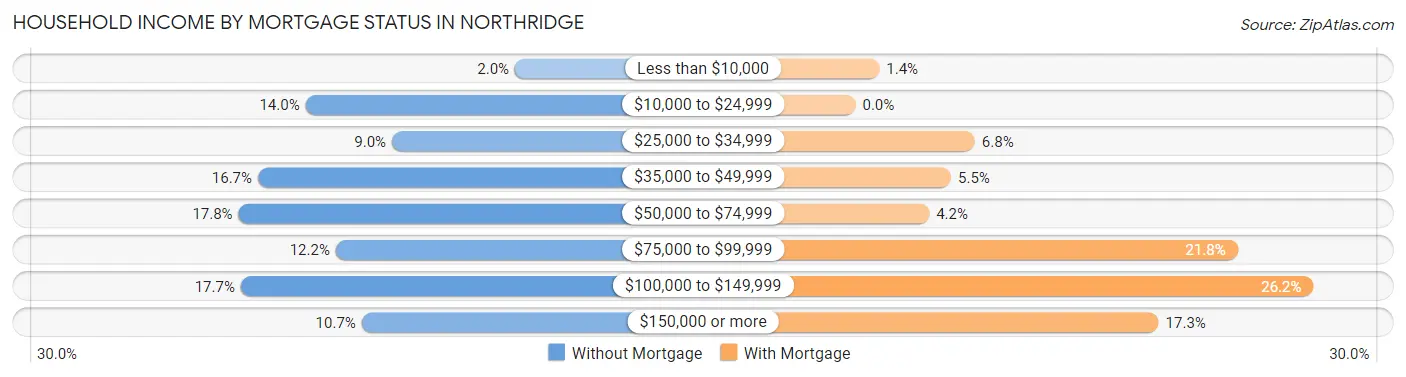
| Household Income | Without Mortgage | With Mortgage |
| Less than $10,000 | 16 (2.0%) | 23 (1.4%) |
| $10,000 to $24,999 | 113 (14.0%) | 0 (0.0%) |
| $25,000 to $34,999 | 73 (9.0%) | 115 (6.8%) |
| $35,000 to $49,999 | 135 (16.7%) | 92 (5.5%) |
| $50,000 to $74,999 | 144 (17.8%) | 71 (4.2%) |
| $75,000 to $99,999 | 99 (12.2%) | 368 (21.8%) |
| $100,000 to $149,999 | 143 (17.6%) | 441 (26.2%) |
| $150,000 or more | 87 (10.7%) | 292 (17.3%) |
| Total | 810 (100.0%) | 1,686 (100.0%) |
Property Value to Household Income Ratio in Northridge
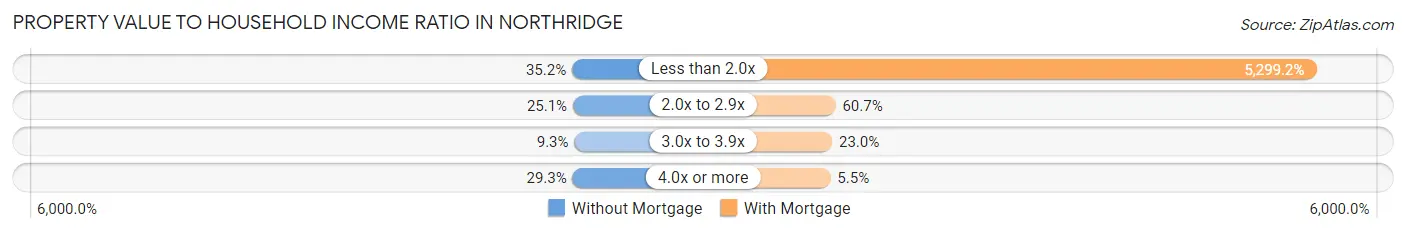
| Value-to-Income Ratio | Without Mortgage | With Mortgage |
| Less than 2.0x | 285 (35.2%) | 89,344 (5,299.2%) |
| 2.0x to 2.9x | 203 (25.1%) | 1,023 (60.7%) |
| 3.0x to 3.9x | 75 (9.3%) | 387 (23.0%) |
| 4.0x or more | 237 (29.3%) | 93 (5.5%) |
| Total | 810 (100.0%) | 1,686 (100.0%) |
Real Estate Taxes by Mortgage Status in Northridge
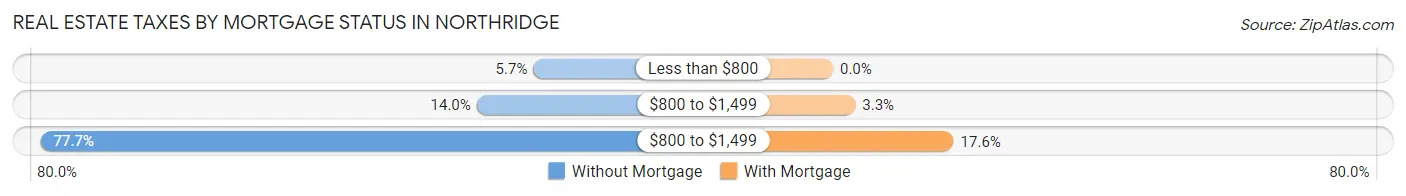
| Property Taxes | Without Mortgage | With Mortgage |
| Less than $800 | 46 (5.7%) | 0 (0.0%) |
| $800 to $1,499 | 113 (14.0%) | 55 (3.3%) |
| $800 to $1,499 | 629 (77.6%) | 297 (17.6%) |
| Total | 810 (100.0%) | 1,686 (100.0%) |
Health & Disability in Northridge
Health Insurance Coverage by Age in Northridge
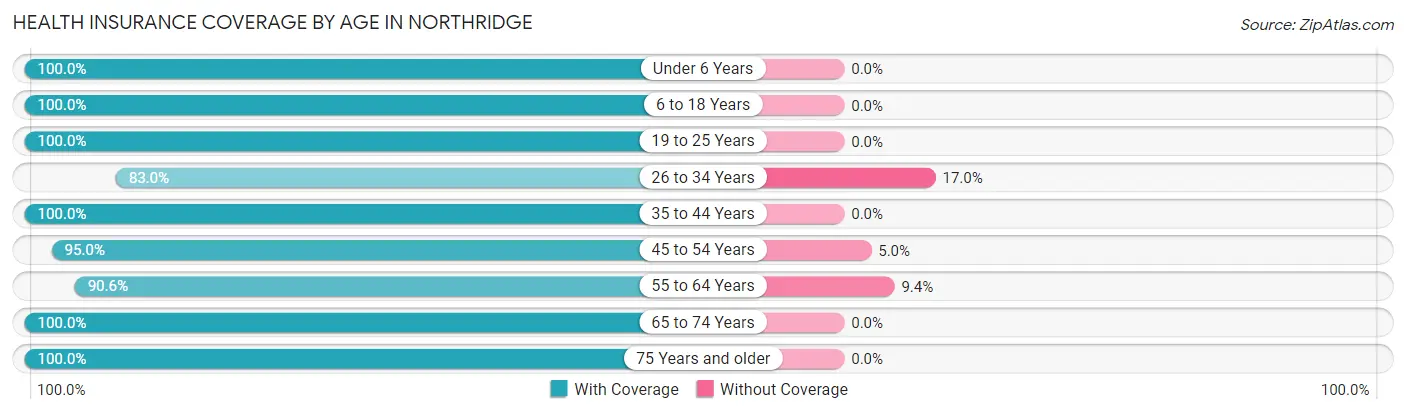
| Age Bracket | With Coverage | Without Coverage |
| Under 6 Years | 589 (100.0%) | 0 (0.0%) |
| 6 to 18 Years | 1,279 (100.0%) | 0 (0.0%) |
| 19 to 25 Years | 293 (100.0%) | 0 (0.0%) |
| 26 to 34 Years | 898 (83.0%) | 184 (17.0%) |
| 35 to 44 Years | 712 (100.0%) | 0 (0.0%) |
| 45 to 54 Years | 868 (95.0%) | 46 (5.0%) |
| 55 to 64 Years | 842 (90.6%) | 87 (9.4%) |
| 65 to 74 Years | 1,107 (100.0%) | 0 (0.0%) |
| 75 Years and older | 770 (100.0%) | 0 (0.0%) |
| Total | 7,358 (95.9%) | 317 (4.1%) |
Health Insurance Coverage by Citizenship Status in Northridge
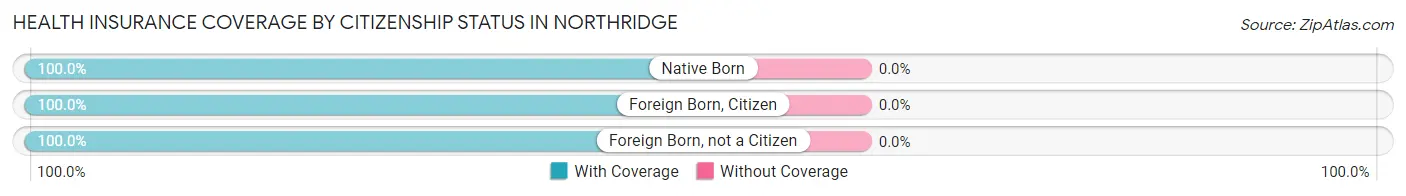
| Citizenship Status | With Coverage | Without Coverage |
| Native Born | 589 (100.0%) | 0 (0.0%) |
| Foreign Born, Citizen | 1,279 (100.0%) | 0 (0.0%) |
| Foreign Born, not a Citizen | 293 (100.0%) | 0 (0.0%) |
Health Insurance Coverage by Household Income in Northridge

| Household Income | With Coverage | Without Coverage |
| Under $25,000 | 855 (100.0%) | 0 (0.0%) |
| $25,000 to $49,999 | 813 (100.0%) | 0 (0.0%) |
| $50,000 to $74,999 | 1,528 (88.2%) | 205 (11.8%) |
| $75,000 to $99,999 | 1,227 (93.6%) | 84 (6.4%) |
| $100,000 and over | 2,930 (99.1%) | 28 (0.9%) |
Public vs Private Health Insurance Coverage by Age in Northridge
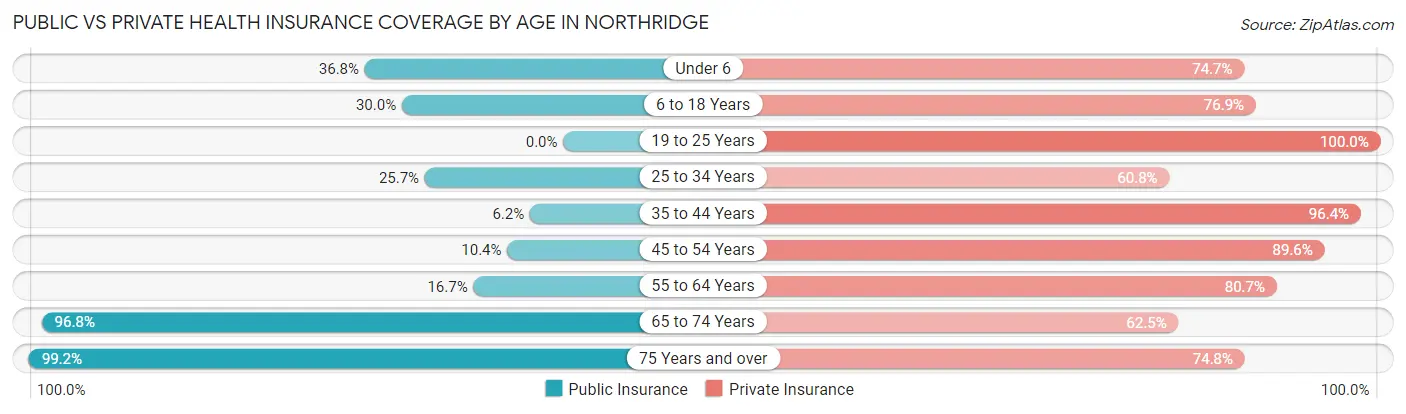
| Age Bracket | Public Insurance | Private Insurance |
| Under 6 | 217 (36.8%) | 440 (74.7%) |
| 6 to 18 Years | 383 (29.9%) | 983 (76.9%) |
| 19 to 25 Years | 0 (0.0%) | 293 (100.0%) |
| 25 to 34 Years | 278 (25.7%) | 658 (60.8%) |
| 35 to 44 Years | 44 (6.2%) | 686 (96.4%) |
| 45 to 54 Years | 95 (10.4%) | 819 (89.6%) |
| 55 to 64 Years | 155 (16.7%) | 750 (80.7%) |
| 65 to 74 Years | 1,072 (96.8%) | 692 (62.5%) |
| 75 Years and over | 764 (99.2%) | 576 (74.8%) |
| Total | 3,008 (39.2%) | 5,897 (76.8%) |
Disability Status by Sex by Age in Northridge
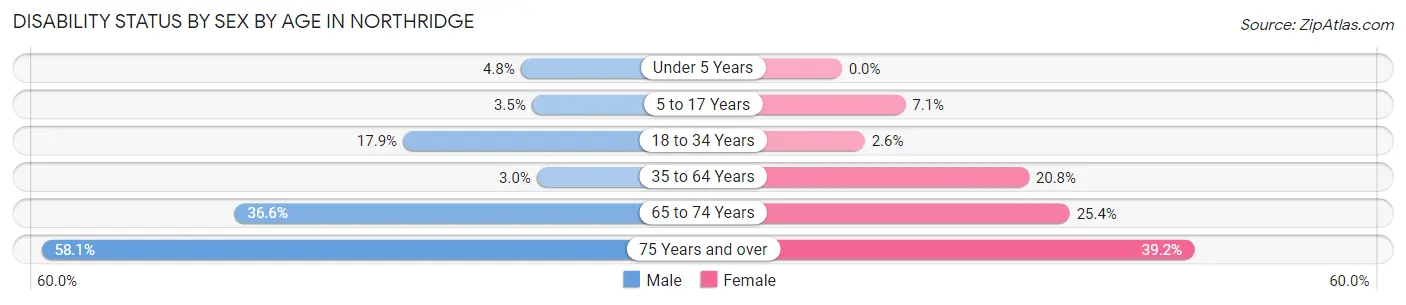
| Age Bracket | Male | Female |
| Under 5 Years | 21 (4.8%) | 0 (0.0%) |
| 5 to 17 Years | 30 (3.5%) | 30 (7.1%) |
| 18 to 34 Years | 144 (17.9%) | 16 (2.5%) |
| 35 to 64 Years | 36 (3.0%) | 280 (20.8%) |
| 65 to 74 Years | 186 (36.6%) | 152 (25.4%) |
| 75 Years and over | 197 (58.1%) | 169 (39.2%) |
Disability Class by Sex by Age in Northridge
Disability Class: Hearing Difficulty
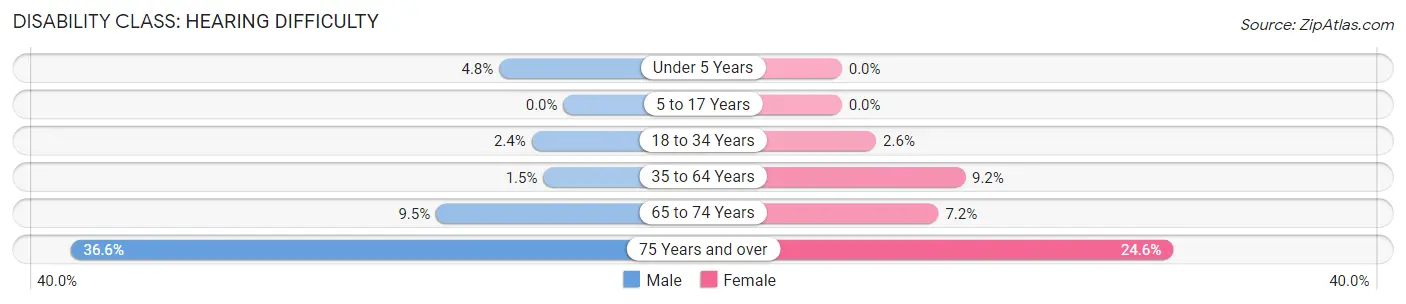
| Age Bracket | Male | Female |
| Under 5 Years | 21 (4.8%) | 0 (0.0%) |
| 5 to 17 Years | 0 (0.0%) | 0 (0.0%) |
| 18 to 34 Years | 19 (2.4%) | 16 (2.5%) |
| 35 to 64 Years | 18 (1.5%) | 123 (9.1%) |
| 65 to 74 Years | 48 (9.5%) | 43 (7.2%) |
| 75 Years and over | 124 (36.6%) | 106 (24.6%) |
Disability Class: Vision Difficulty
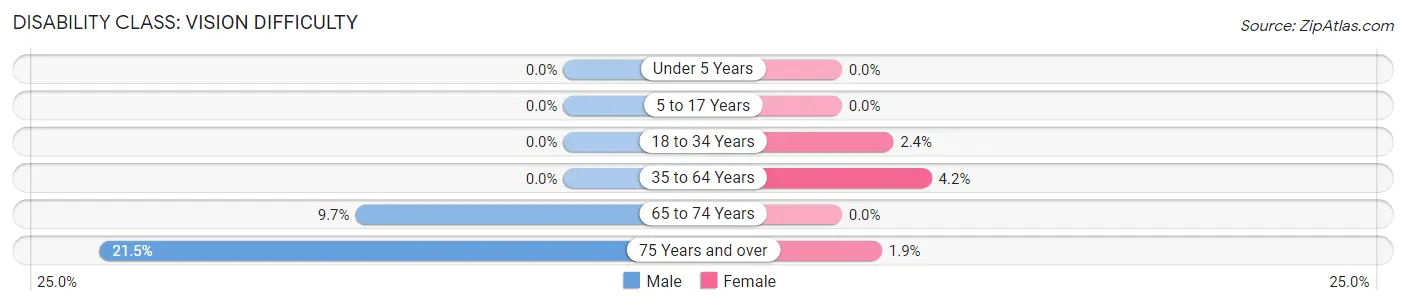
| Age Bracket | Male | Female |
| Under 5 Years | 0 (0.0%) | 0 (0.0%) |
| 5 to 17 Years | 0 (0.0%) | 0 (0.0%) |
| 18 to 34 Years | 0 (0.0%) | 15 (2.4%) |
| 35 to 64 Years | 0 (0.0%) | 56 (4.2%) |
| 65 to 74 Years | 49 (9.7%) | 0 (0.0%) |
| 75 Years and over | 73 (21.5%) | 8 (1.9%) |
Disability Class: Cognitive Difficulty
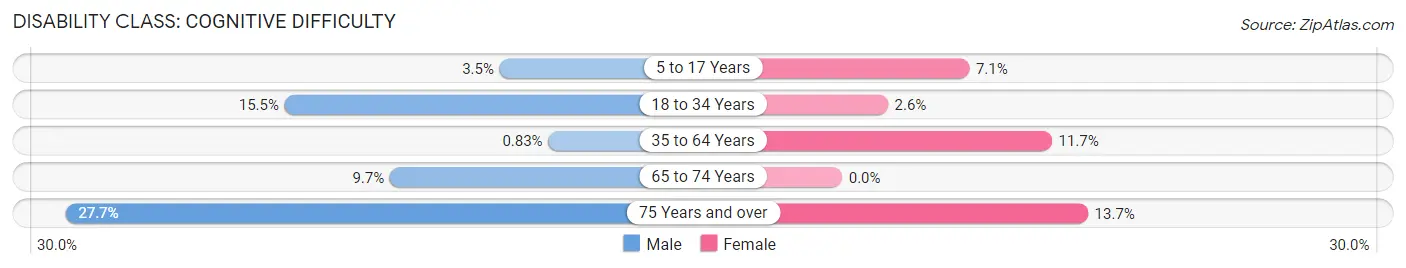
| Age Bracket | Male | Female |
| 5 to 17 Years | 30 (3.5%) | 30 (7.1%) |
| 18 to 34 Years | 125 (15.5%) | 16 (2.5%) |
| 35 to 64 Years | 10 (0.8%) | 157 (11.7%) |
| 65 to 74 Years | 49 (9.7%) | 0 (0.0%) |
| 75 Years and over | 94 (27.7%) | 59 (13.7%) |
Disability Class: Ambulatory Difficulty
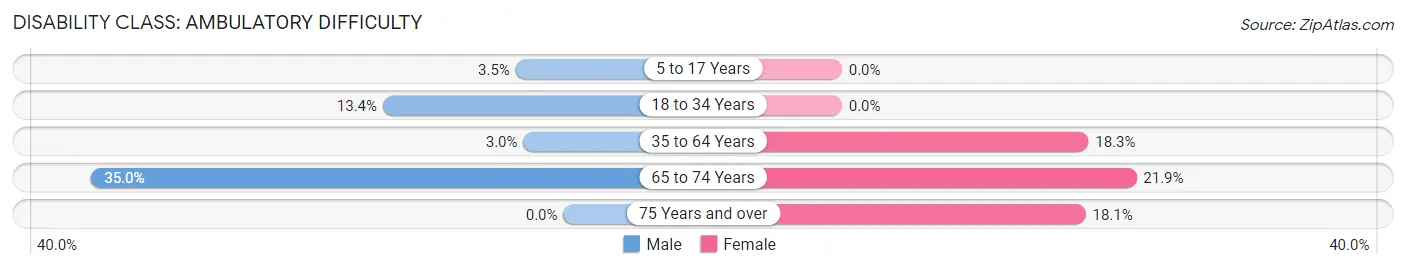
| Age Bracket | Male | Female |
| 5 to 17 Years | 30 (3.5%) | 0 (0.0%) |
| 18 to 34 Years | 108 (13.4%) | 0 (0.0%) |
| 35 to 64 Years | 36 (3.0%) | 246 (18.3%) |
| 65 to 74 Years | 178 (35.0%) | 131 (21.9%) |
| 75 Years and over | 0 (0.0%) | 78 (18.1%) |
Disability Class: Self-Care Difficulty
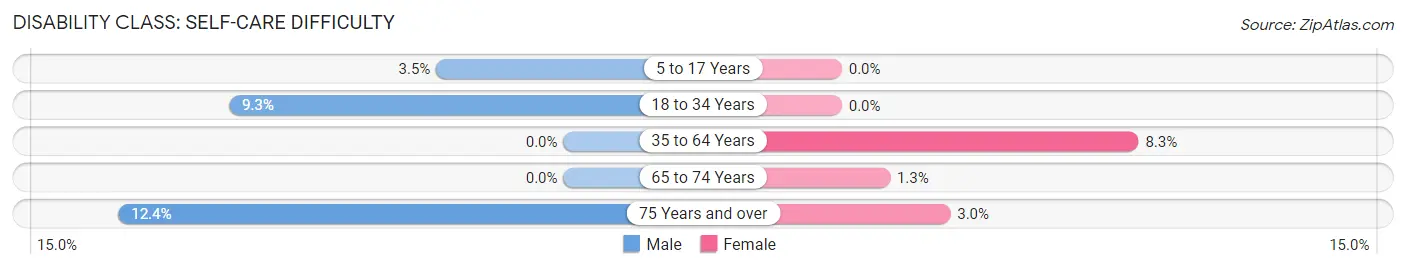
| Age Bracket | Male | Female |
| 5 to 17 Years | 30 (3.5%) | 0 (0.0%) |
| 18 to 34 Years | 75 (9.3%) | 0 (0.0%) |
| 35 to 64 Years | 0 (0.0%) | 111 (8.3%) |
| 65 to 74 Years | 0 (0.0%) | 8 (1.3%) |
| 75 Years and over | 42 (12.4%) | 13 (3.0%) |
Technology Access in Northridge
Computing Device Access in Northridge
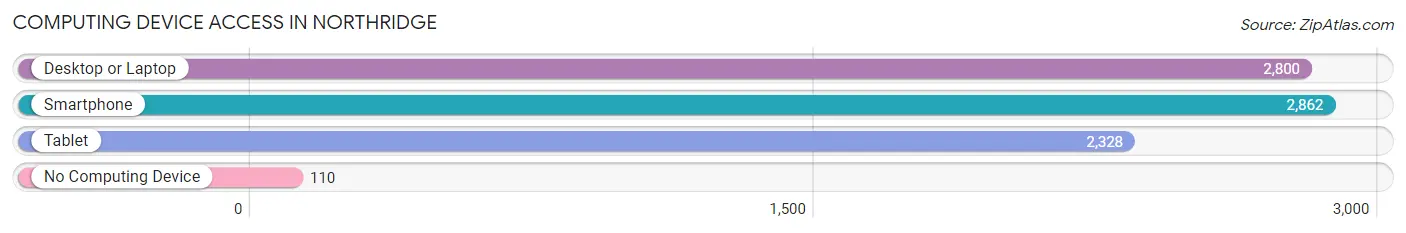
| Device Type | # Households | % Households |
| Desktop or Laptop | 2,800 | 84.9% |
| Smartphone | 2,862 | 86.8% |
| Tablet | 2,328 | 70.6% |
| No Computing Device | 110 | 3.3% |
| Total | 3,297 | 100.0% |
Internet Access in Northridge
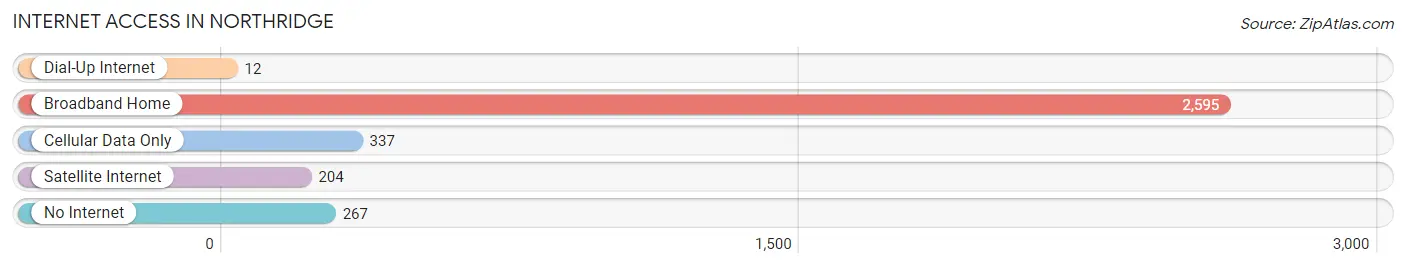
| Internet Type | # Households | % Households |
| Dial-Up Internet | 12 | 0.4% |
| Broadband Home | 2,595 | 78.7% |
| Cellular Data Only | 337 | 10.2% |
| Satellite Internet | 204 | 6.2% |
| No Internet | 267 | 8.1% |
| Total | 3,297 | 100.0% |
Northridge Summary
Northridge is a small village located in Montgomery County, Ohio, United States. It is situated in the Miami Valley region of the state, approximately 8 miles north of Dayton. The village was incorporated in 1891 and has a population of approximately 1,500 people.
History
Northridge was first settled in the early 1800s by a group of German immigrants. The village was originally known as “New Germany” and was later renamed Northridge in 1891. The village was named after the nearby Northridge Creek, which was named after the nearby Northridge Hills.
The village was primarily an agricultural community until the early 1900s when the Wright Brothers opened their airplane factory in nearby Dayton. This brought an influx of new residents to the area and the village began to grow.
In the 1950s, the village was annexed by the City of Dayton and became part of the larger metropolitan area. This brought new development to the area and the village began to experience rapid growth.
Geography
Northridge is located in the Miami Valley region of Ohio, approximately 8 miles north of Dayton. The village is situated on the banks of the Great Miami River and is surrounded by rolling hills and farmland.
The village is located in a humid continental climate zone, with hot summers and cold winters. The average annual temperature is around 50 degrees Fahrenheit and the average annual precipitation is around 40 inches.
Economy
Northridge is primarily a residential community, with most of its residents commuting to nearby Dayton for work. The village is home to several small businesses, including a grocery store, a hardware store, and a few restaurants.
The village is also home to a few light industrial businesses, including a plastics manufacturer and a printing company.
Demographics
As of the 2010 census, Northridge had a population of 1,500 people. The racial makeup of the village was 94.7% White, 1.3% African American, 0.7% Asian, 0.3% Native American, and 2.7% from other races.
The median household income in Northridge was $45,000, and the median family income was $50,000. The per capita income was $20,000.
Conclusion
Northridge is a small village located in Montgomery County, Ohio, United States. It is situated in the Miami Valley region of the state, approximately 8 miles north of Dayton. The village was incorporated in 1891 and has a population of approximately 1,500 people. Northridge is primarily a residential community, with most of its residents commuting to nearby Dayton for work. The village is home to several small businesses, including a grocery store, a hardware store, and a few restaurants. The village is also home to a few light industrial businesses, including a plastics manufacturer and a printing company. As of the 2010 census, Northridge had a population of 1,500 people. The racial makeup of the village was 94.7% White, 1.3% African American, 0.7% Asian, 0.3% Native American, and 2.7% from other races. The median household income in Northridge was $45,000, and the median family income was $50,000. The per capita income was $20,000.
Common Questions
What is the Total Population of Northridge?
Total Population of Northridge is 7,675.
What is the Total Male Population of Northridge?
Total Male Population of Northridge is 4,152.
What is the Total Female Population of Northridge?
Total Female Population of Northridge is 3,523.
What is the Ratio of Males per 100 Females in Northridge?
There are 117.85 Males per 100 Females in Northridge.
What is the Ratio of Females per 100 Males in Northridge?
There are 84.85 Females per 100 Males in Northridge.
What is the Median Population Age in Northridge?
Median Population Age in Northridge is 43.3 Years.
What is the Average Family Size in Northridge
Average Family Size in Northridge is 2.9 People.
What is the Average Household Size in Northridge
Average Household Size in Northridge is 2.3 People.
What is Per Capita Income in Northridge?
Per Capita income in Northridge is $37,614.
What is the Median Family Income in Northridge?
Median Family Income in Northridge is $91,691.
What is the Median Household income in Northridge?
Median Household Income in Northridge is $74,011.
What is Income or Wage Gap in Northridge?
Income or Wage Gap in Northridge is 28.8%.
Women in Northridge earn 71.2 cents for every dollar earned by a man.
What is Inequality or Gini Index in Northridge?
Inequality or Gini Index in Northridge is 0.39.
How Large is the Labor Force in Northridge?
There are 3,396 People in the Labor Forcein in Northridge.
What is the Percentage of People in the Labor Force in Northridge?
56.0% of People are in the Labor Force in Northridge.
What is the Unemployment Rate in Northridge?
Unemployment Rate in Northridge is 4.9%.