New Hampshire, OH
New Hampshire Map
New Hampshire Overview
449
TOTAL POPULATION
295
MALE POPULATION
154
FEMALE POPULATION
191.56
MALES / 100 FEMALES
52.20
FEMALES / 100 MALES
31.9
MEDIAN AGE
4.0
AVG FAMILY SIZE
4.0
AVG HOUSEHOLD SIZE
$34,827
PER CAPITA INCOME
$150,278
AVG FAMILY INCOME
$150,278
AVG HOUSEHOLD INCOME
4.7%
WAGE / INCOME GAP [ % ]
95.3¢/ $1
WAGE / INCOME GAP [ $ ]
0.10
INEQUALITY / GINI INDEX
246
LABOR FORCE [ PEOPLE ]
95.3%
PERCENT IN LABOR FORCE
35.0%
UNEMPLOYMENT RATE
New Hampshire Zip Codes
New Hampshire Area Codes
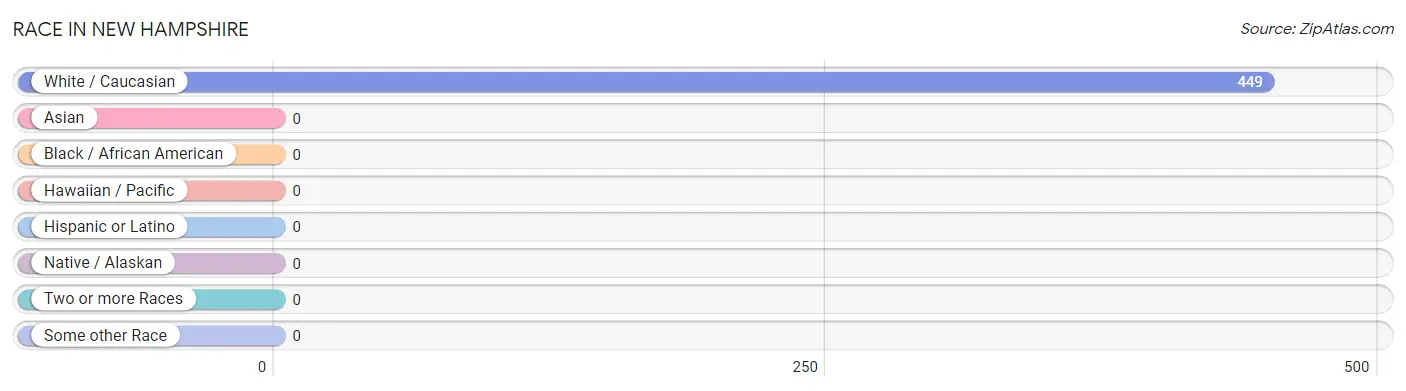
Race in New Hampshire
The most populous races in New Hampshire are , and White / Caucasian (449 | 100.0%).
| Race | # Population | % Population |
| Asian | 0 | 0.0% |
| Black / African American | 0 | 0.0% |
| Hawaiian / Pacific | 0 | 0.0% |
| Hispanic or Latino | 0 | 0.0% |
| Native / Alaskan | 0 | 0.0% |
| White / Caucasian | 449 | 100.0% |
| Two or more Races | 0 | 0.0% |
| Some other Race | 0 | 0.0% |
| Total | 449 | 100.0% |
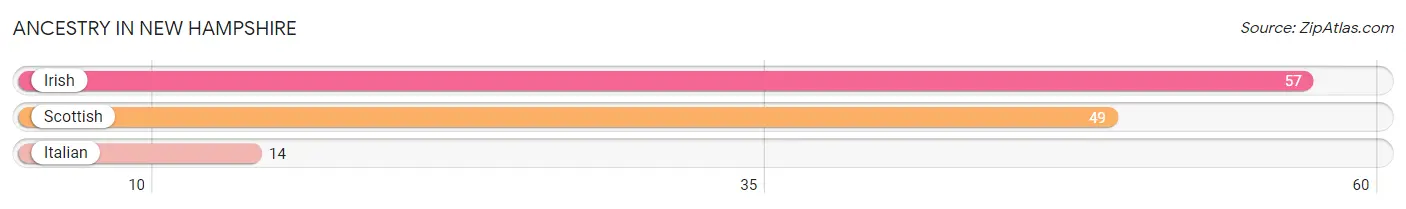
Ancestry in New Hampshire
The most populous ancestries reported in New Hampshire are Irish (57 | 12.7%), Scottish (49 | 10.9%), and Italian (14 | 3.1%), together accounting for 26.7% of all New Hampshire residents.
| Ancestry | # Population | % Population |
| Irish | 57 | 12.7% |
| Italian | 14 | 3.1% |
| Scottish | 49 | 10.9% | View All 3 Rows |
Immigrants in New Hampshire

| Immigration Origin | # Population | % Population | View All 0 Rows |
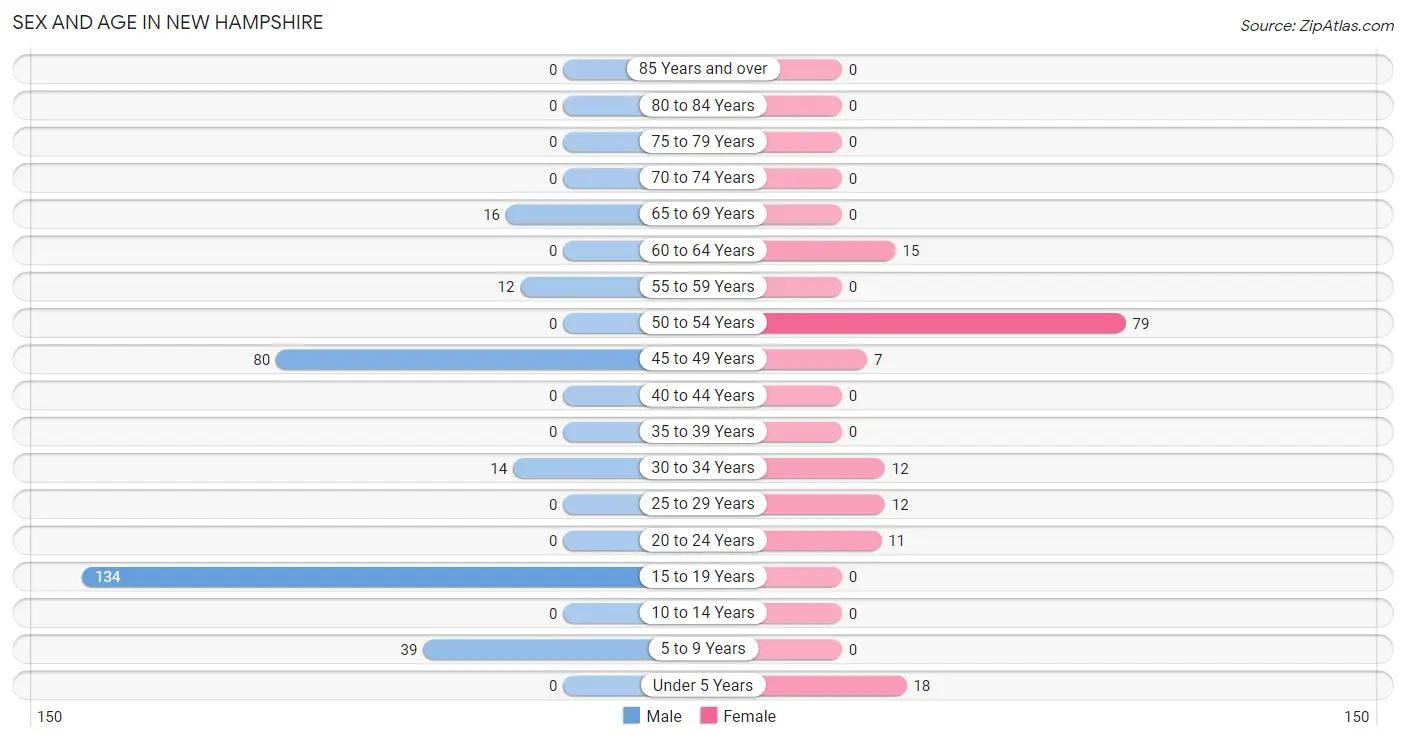
Sex and Age in New Hampshire
Sex and Age in New Hampshire
The most populous age groups in New Hampshire are 15 to 19 Years (134 | 45.4%) for men and 50 to 54 Years (79 | 51.3%) for women.
| Age Bracket | Male | Female |
| Under 5 Years | 0 (0.0%) | 18 (11.7%) |
| 5 to 9 Years | 39 (13.2%) | 0 (0.0%) |
| 10 to 14 Years | 0 (0.0%) | 0 (0.0%) |
| 15 to 19 Years | 134 (45.4%) | 0 (0.0%) |
| 20 to 24 Years | 0 (0.0%) | 11 (7.1%) |
| 25 to 29 Years | 0 (0.0%) | 12 (7.8%) |
| 30 to 34 Years | 14 (4.8%) | 12 (7.8%) |
| 35 to 39 Years | 0 (0.0%) | 0 (0.0%) |
| 40 to 44 Years | 0 (0.0%) | 0 (0.0%) |
| 45 to 49 Years | 80 (27.1%) | 7 (4.5%) |
| 50 to 54 Years | 0 (0.0%) | 79 (51.3%) |
| 55 to 59 Years | 12 (4.1%) | 0 (0.0%) |
| 60 to 64 Years | 0 (0.0%) | 15 (9.7%) |
| 65 to 69 Years | 16 (5.4%) | 0 (0.0%) |
| 70 to 74 Years | 0 (0.0%) | 0 (0.0%) |
| 75 to 79 Years | 0 (0.0%) | 0 (0.0%) |
| 80 to 84 Years | 0 (0.0%) | 0 (0.0%) |
| 85 Years and over | 0 (0.0%) | 0 (0.0%) |
| Total | 295 (100.0%) | 154 (100.0%) |
Families and Households in New Hampshire
Median Family Size in New Hampshire
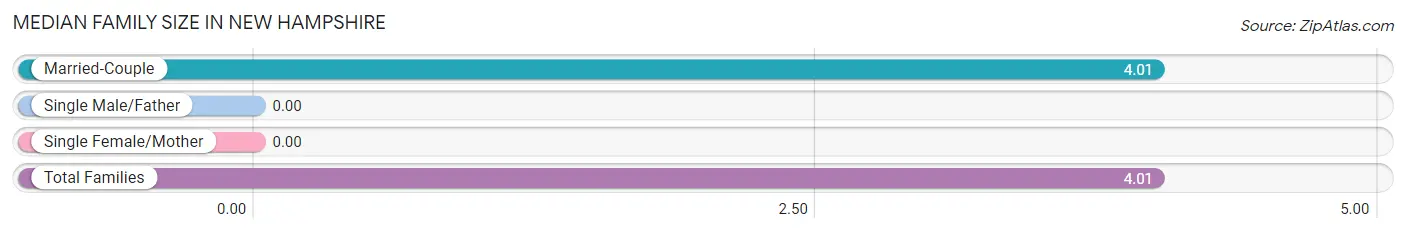
| Family Type | # Families | Family Size |
| Married-Couple | 112 (100.0%) | 4.01 |
| Single Male/Father | 0 (0.0%) | - |
| Single Female/Mother | 0 (0.0%) | - |
| Total Families | 112 (100.0%) | 4.01 |
Median Household Size in New Hampshire
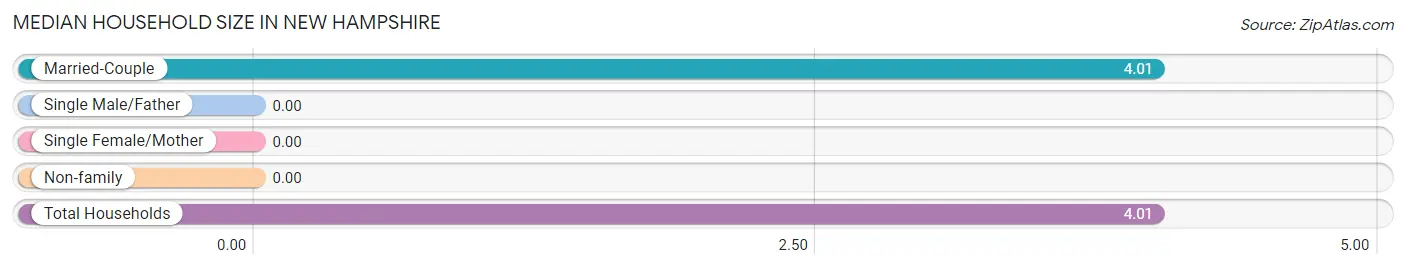
| Household Type | # Households | Household Size |
| Married-Couple | 112 (100.0%) | 4.01 |
| Single Male/Father | 0 (0.0%) | - |
| Single Female/Mother | 0 (0.0%) | - |
| Non-family | 0 (0.0%) | - |
| Total Households | 112 (100.0%) | 4.01 |
Household Size by Marriage Status in New Hampshire
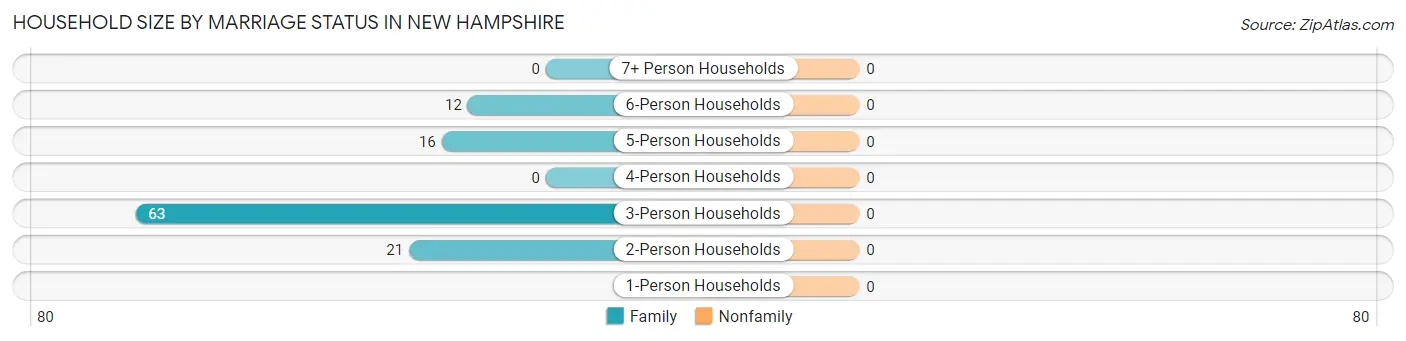
| Household Size | Family Households | Nonfamily Households |
| 1-Person Households | - | 0 (0.0%) |
| 2-Person Households | 21 (18.8%) | 0 (0.0%) |
| 3-Person Households | 63 (56.2%) | 0 (0.0%) |
| 4-Person Households | 0 (0.0%) | 0 (0.0%) |
| 5-Person Households | 16 (14.3%) | 0 (0.0%) |
| 6-Person Households | 12 (10.7%) | 0 (0.0%) |
| 7+ Person Households | 0 (0.0%) | 0 (0.0%) |
| Total | 112 (100.0%) | 0 (0.0%) |
Female Fertility in New Hampshire
Fertility by Age in New Hampshire
Average fertility rate in New Hampshire is 114.0 births per 1,000 women. Women in the age bracket of 20 to 34 years have the highest fertility rate with 343.0 births per 1,000 women. Women in the age bracket of 20 to 34 years acount for 100.0% of all women with births.
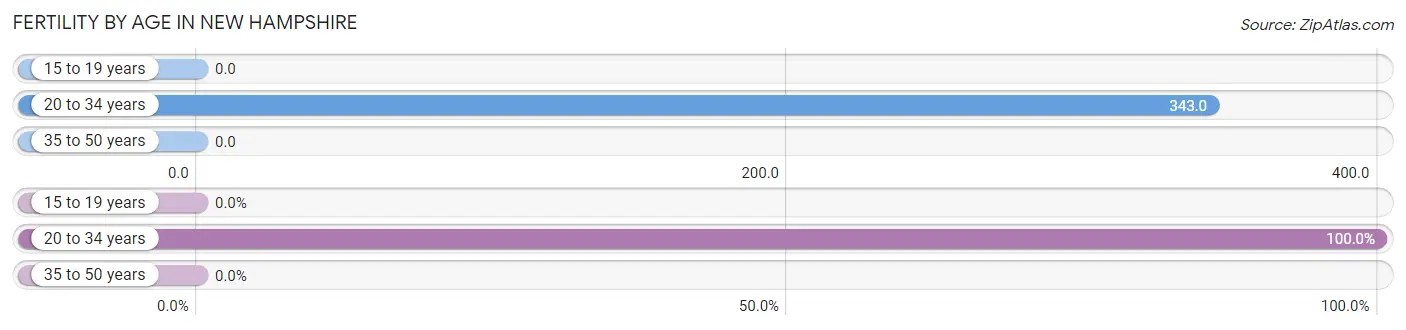
| Age Bracket | Women with Births | Births / 1,000 Women |
| 15 to 19 years | 0 (0.0%) | 0.0 |
| 20 to 34 years | 12 (100.0%) | 343.0 |
| 35 to 50 years | 0 (0.0%) | 0.0 |
| Total | 12 (100.0%) | 114.0 |
Fertility by Age by Marriage Status in New Hampshire
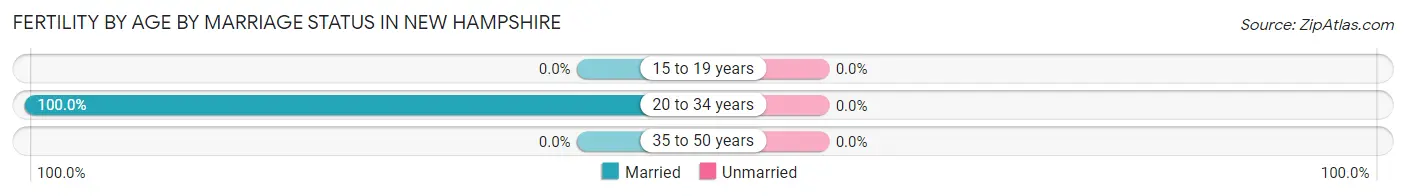
| Age Bracket | Married | Unmarried |
| 15 to 19 years | 0 (0.0%) | 0 (0.0%) |
| 20 to 34 years | 12 (100.0%) | 0 (0.0%) |
| 35 to 50 years | 0 (0.0%) | 0 (0.0%) |
| Total | 12 (100.0%) | 0 (0.0%) |
Fertility by Education in New Hampshire
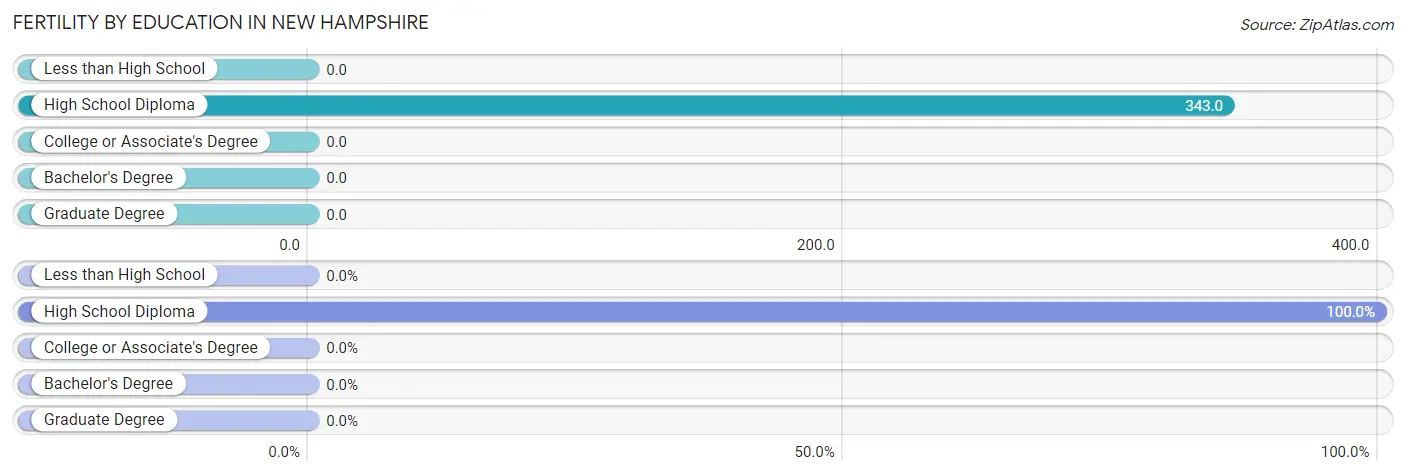
| Educational Attainment | Women with Births | Births / 1,000 Women |
| Less than High School | 0 (0.0%) | 0.0 |
| High School Diploma | 12 (100.0%) | 343.0 |
| College or Associate's Degree | 0 (0.0%) | 0.0 |
| Bachelor's Degree | 0 (0.0%) | 0.0 |
| Graduate Degree | 0 (0.0%) | 0.0 |
| Total | 12 (100.0%) | 114.0 |
Fertility by Education by Marriage Status in New Hampshire
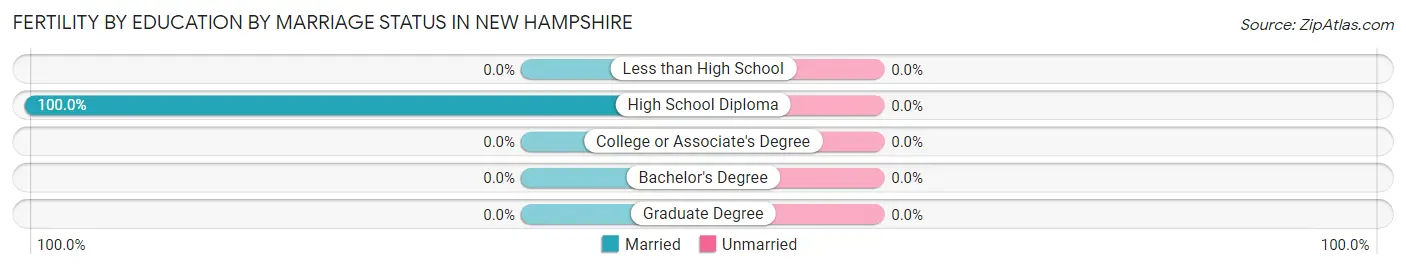
| Educational Attainment | Married | Unmarried |
| Less than High School | 0 (0.0%) | 0 (0.0%) |
| High School Diploma | 12 (100.0%) | 0 (0.0%) |
| College or Associate's Degree | 0 (0.0%) | 0 (0.0%) |
| Bachelor's Degree | 0 (0.0%) | 0 (0.0%) |
| Graduate Degree | 0 (0.0%) | 0 (0.0%) |
| Total | 12 (100.0%) | 0 (0.0%) |
Income in New Hampshire
Income Overview in New Hampshire
Per Capita Income in New Hampshire is $34,827, while median incomes of families and households are $150,278 and $150,278 respectively.
| Characteristic | Number | Measure |
| Per Capita Income | 449 | $34,827 |
| Median Family Income | 112 | $150,278 |
| Mean Family Income | 112 | $134,069 |
| Median Household Income | 112 | $150,278 |
| Mean Household Income | 112 | $134,069 |
| Income Deficit | 112 | $0 |
| Wage / Income Gap (%) | 449 | 4.74% |
| Wage / Income Gap ($) | 449 | 95.26¢ per $1 |
| Gini / Inequality Index | 449 | 0.10 |
Earnings by Sex in New Hampshire
Average Earnings in New Hampshire are $74,324, $74,088 for men and $77,778 for women, a difference of 4.7%.
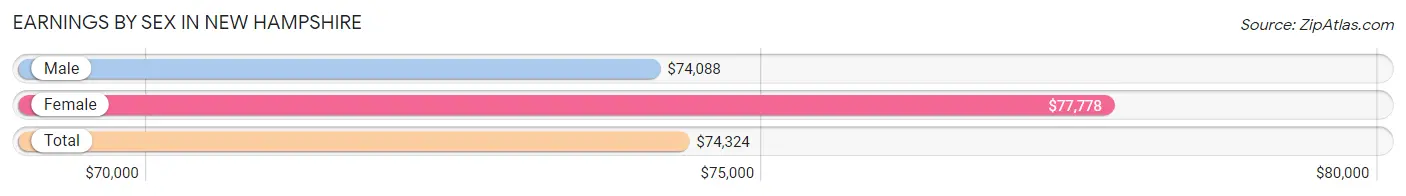
| Sex | Number | Average Earnings |
| Male | 122 (52.1%) | $74,088 |
| Female | 112 (47.9%) | $77,778 |
| Total | 234 (100.0%) | $74,324 |
Earnings by Sex by Income Bracket in New Hampshire
The most common earnings brackets in New Hampshire are $65,000 to $74,999 for men (74 | 60.7%) and $75,000 to $99,999 for women (63 | 56.2%).
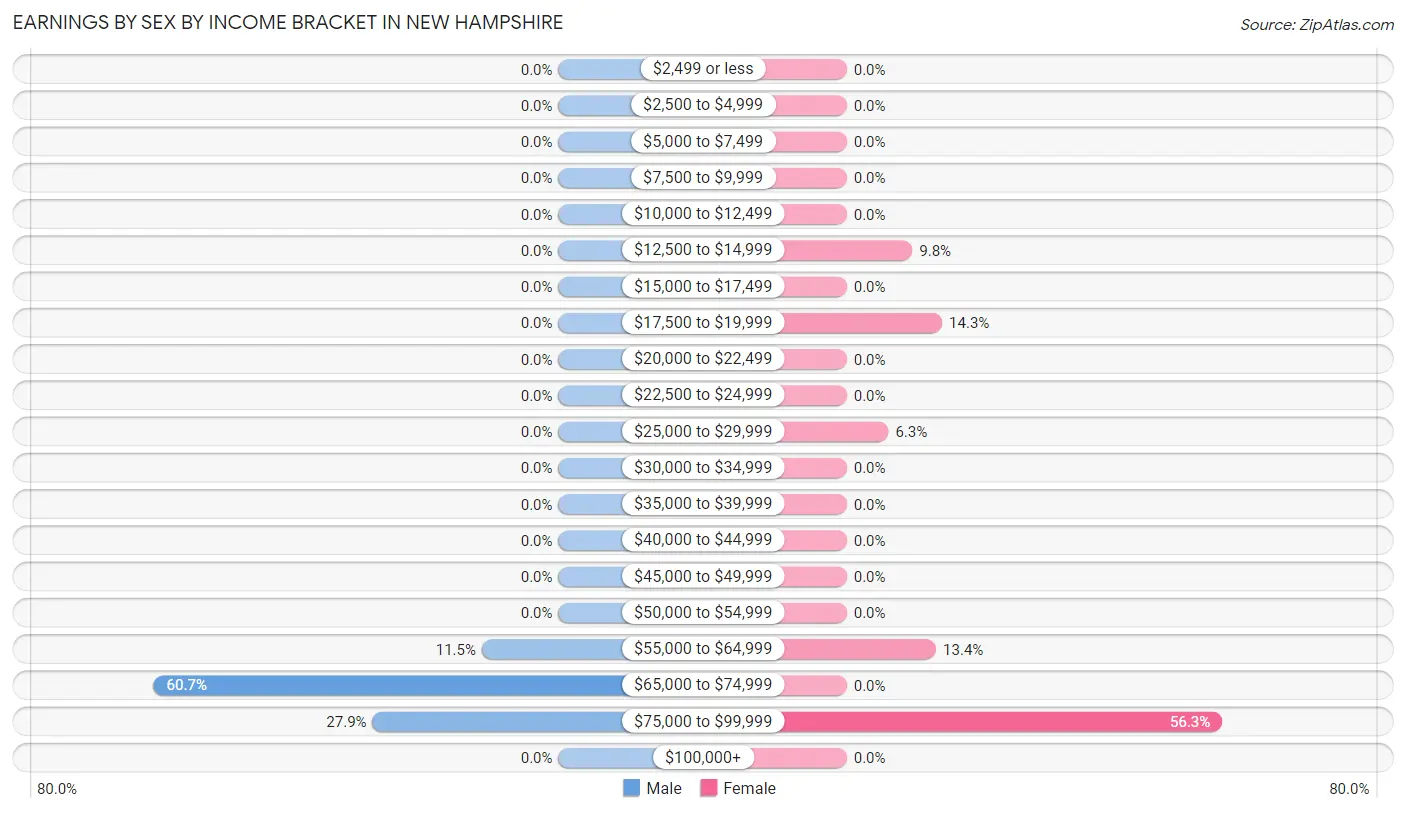
| Income | Male | Female |
| $2,499 or less | 0 (0.0%) | 0 (0.0%) |
| $2,500 to $4,999 | 0 (0.0%) | 0 (0.0%) |
| $5,000 to $7,499 | 0 (0.0%) | 0 (0.0%) |
| $7,500 to $9,999 | 0 (0.0%) | 0 (0.0%) |
| $10,000 to $12,499 | 0 (0.0%) | 0 (0.0%) |
| $12,500 to $14,999 | 0 (0.0%) | 11 (9.8%) |
| $15,000 to $17,499 | 0 (0.0%) | 0 (0.0%) |
| $17,500 to $19,999 | 0 (0.0%) | 16 (14.3%) |
| $20,000 to $22,499 | 0 (0.0%) | 0 (0.0%) |
| $22,500 to $24,999 | 0 (0.0%) | 0 (0.0%) |
| $25,000 to $29,999 | 0 (0.0%) | 7 (6.2%) |
| $30,000 to $34,999 | 0 (0.0%) | 0 (0.0%) |
| $35,000 to $39,999 | 0 (0.0%) | 0 (0.0%) |
| $40,000 to $44,999 | 0 (0.0%) | 0 (0.0%) |
| $45,000 to $49,999 | 0 (0.0%) | 0 (0.0%) |
| $50,000 to $54,999 | 0 (0.0%) | 0 (0.0%) |
| $55,000 to $64,999 | 14 (11.5%) | 15 (13.4%) |
| $65,000 to $74,999 | 74 (60.7%) | 0 (0.0%) |
| $75,000 to $99,999 | 34 (27.9%) | 63 (56.2%) |
| $100,000+ | 0 (0.0%) | 0 (0.0%) |
| Total | 122 (100.0%) | 112 (100.0%) |
Earnings by Sex by Educational Attainment in New Hampshire
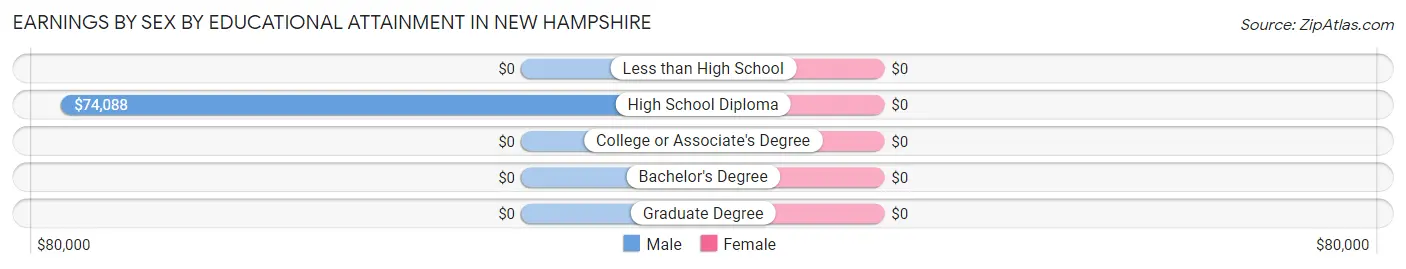
| Educational Attainment | Male Income | Female Income |
| Less than High School | - | - |
| High School Diploma | $74,088 | $0 |
| College or Associate's Degree | - | - |
| Bachelor's Degree | - | - |
| Graduate Degree | - | - |
| Total | $74,088 | $77,996 |
Family Income in New Hampshire
Family Income Brackets in New Hampshire
According to the New Hampshire family income data, there are 63 families falling into the $150,000 to $199,999 income range, which is the most common income bracket and makes up 56.2% of all families.
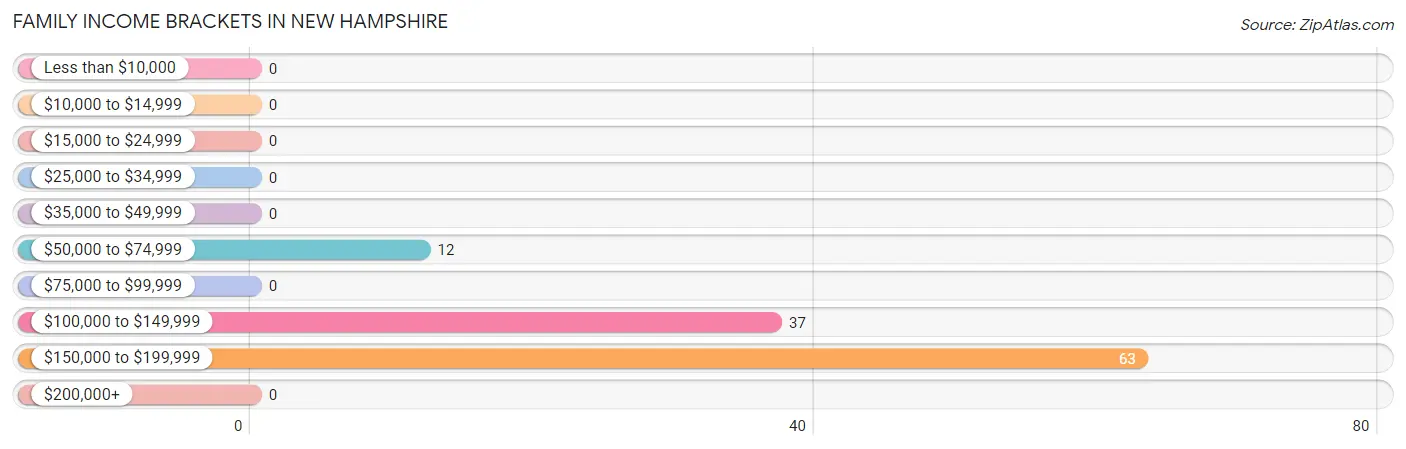
| Income Bracket | # Families | % Families |
| Less than $10,000 | 0 | 0.0% |
| $10,000 to $14,999 | 0 | 0.0% |
| $15,000 to $24,999 | 0 | 0.0% |
| $25,000 to $34,999 | 0 | 0.0% |
| $35,000 to $49,999 | 0 | 0.0% |
| $50,000 to $74,999 | 12 | 10.7% |
| $75,000 to $99,999 | 0 | 0.0% |
| $100,000 to $149,999 | 37 | 33.0% |
| $150,000 to $199,999 | 63 | 56.3% |
| $200,000+ | 0 | 0.0% |
Family Income by Famaliy Size in New Hampshire
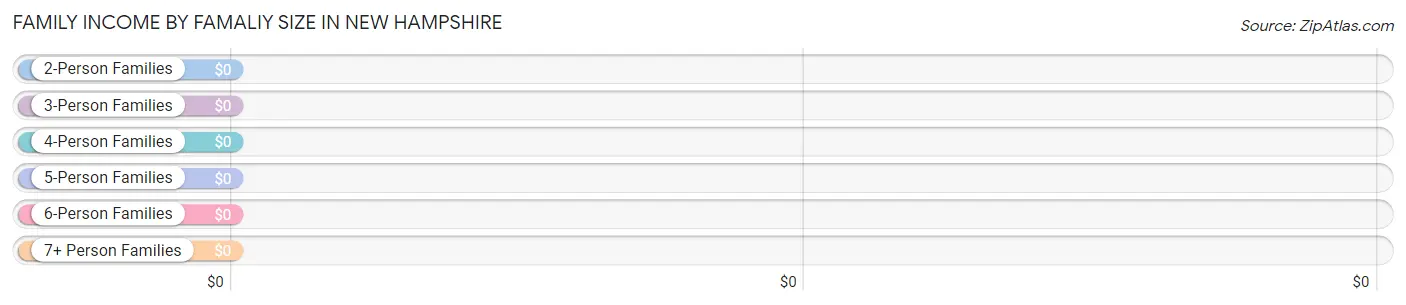
| Income Bracket | # Families | Median Income |
| 2-Person Families | 21 (18.8%) | $0 |
| 3-Person Families | 63 (56.2%) | $0 |
| 4-Person Families | 0 (0.0%) | $0 |
| 5-Person Families | 16 (14.3%) | $0 |
| 6-Person Families | 12 (10.7%) | $0 |
| 7+ Person Families | 0 (0.0%) | $0 |
| Total | 112 (100.0%) | $150,278 |
Family Income by Number of Earners in New Hampshire
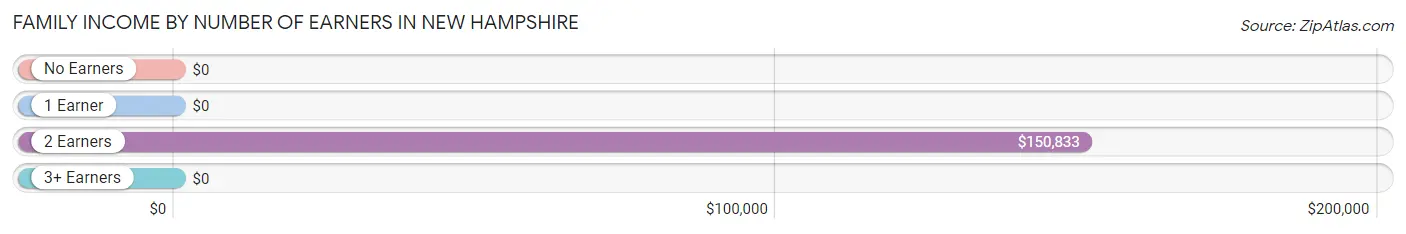
| Number of Earners | # Families | Median Income |
| No Earners | 0 (0.0%) | $0 |
| 1 Earner | 12 (10.7%) | $0 |
| 2 Earners | 84 (75.0%) | $150,833 |
| 3+ Earners | 16 (14.3%) | $0 |
| Total | 112 (100.0%) | $150,278 |
Household Income in New Hampshire
Household Income Brackets in New Hampshire
With 63 households falling in the category, the $150,000 to $199,999 income range is the most frequent in New Hampshire, accounting for 56.2% of all households.
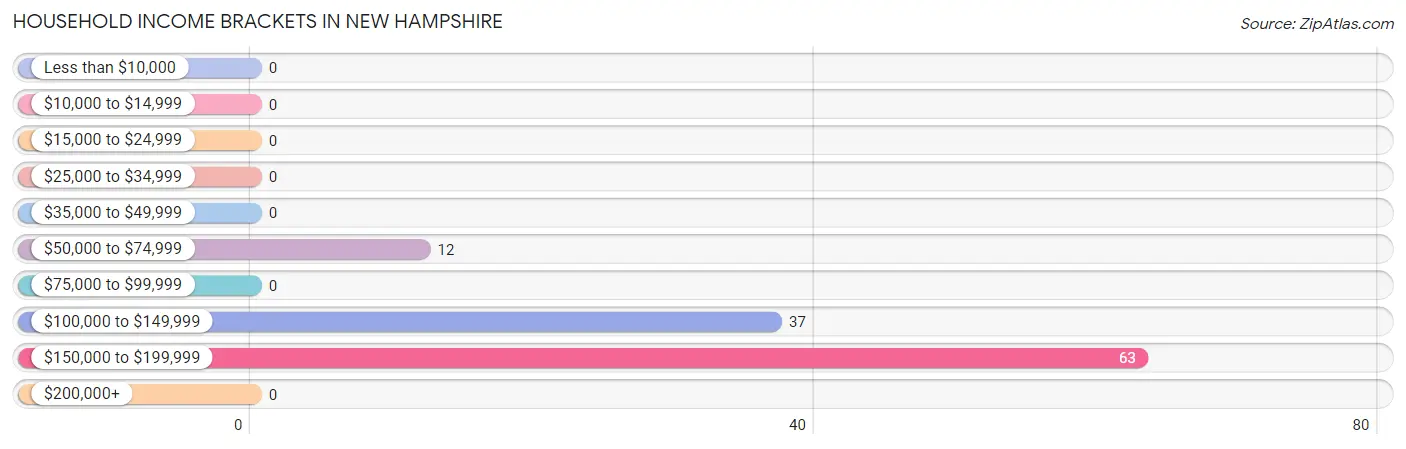
| Income Bracket | # Households | % Households |
| Less than $10,000 | 0 | 0.0% |
| $10,000 to $14,999 | 0 | 0.0% |
| $15,000 to $24,999 | 0 | 0.0% |
| $25,000 to $34,999 | 0 | 0.0% |
| $35,000 to $49,999 | 0 | 0.0% |
| $50,000 to $74,999 | 12 | 10.7% |
| $75,000 to $99,999 | 0 | 0.0% |
| $100,000 to $149,999 | 37 | 33.0% |
| $150,000 to $199,999 | 63 | 56.3% |
| $200,000+ | 0 | 0.0% |
Household Income by Householder Age in New Hampshire
The median household income in New Hampshire is $150,278, with the highest median household income of $150,516 found in the 45 to 64 years age bracket for the primary householder. A total of 100 households (89.3%) fall into this category.
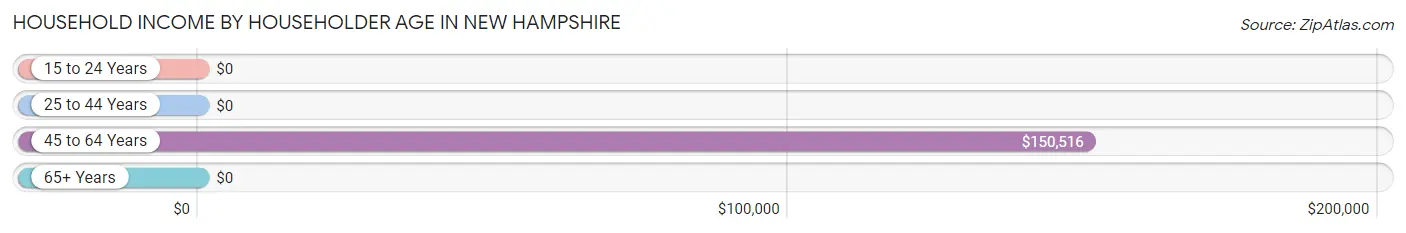
| Income Bracket | # Households | Median Income |
| 15 to 24 Years | 0 (0.0%) | $0 |
| 25 to 44 Years | 12 (10.7%) | $0 |
| 45 to 64 Years | 100 (89.3%) | $150,516 |
| 65+ Years | 0 (0.0%) | $0 |
| Total | 112 (100.0%) | $150,278 |
Poverty in New Hampshire
Income Below Poverty by Sex and Age in New Hampshire
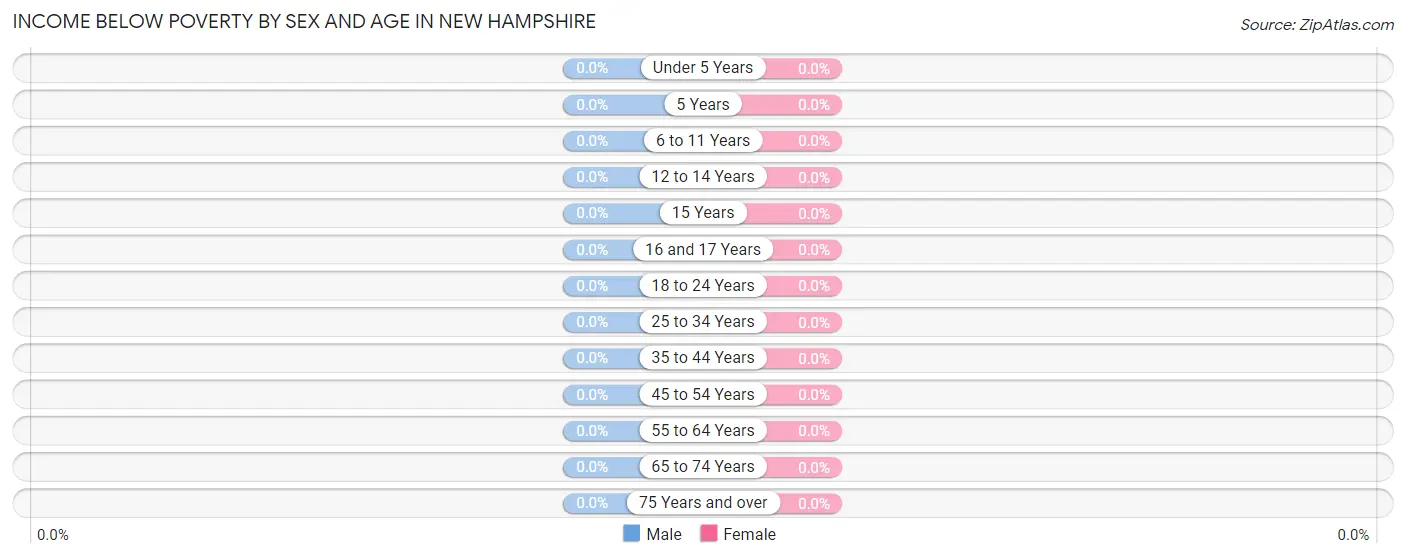
| Age Bracket | Male | Female |
| Under 5 Years | 0 (0.0%) | 0 (0.0%) |
| 5 Years | 0 (0.0%) | 0 (0.0%) |
| 6 to 11 Years | 0 (0.0%) | 0 (0.0%) |
| 12 to 14 Years | 0 (0.0%) | 0 (0.0%) |
| 15 Years | 0 (0.0%) | 0 (0.0%) |
| 16 and 17 Years | 0 (0.0%) | 0 (0.0%) |
| 18 to 24 Years | 0 (0.0%) | 0 (0.0%) |
| 25 to 34 Years | 0 (0.0%) | 0 (0.0%) |
| 35 to 44 Years | 0 (0.0%) | 0 (0.0%) |
| 45 to 54 Years | 0 (0.0%) | 0 (0.0%) |
| 55 to 64 Years | 0 (0.0%) | 0 (0.0%) |
| 65 to 74 Years | 0 (0.0%) | 0 (0.0%) |
| 75 Years and over | 0 (0.0%) | 0 (0.0%) |
| Total | 0 (0.0%) | 0 (0.0%) |
Income Above Poverty by Sex and Age in New Hampshire
According to the poverty statistics in New Hampshire, males aged 5 years and females aged under 5 years are the age groups that are most secure financially, with 100.0% of males and 100.0% of females in these age groups living above the poverty line.
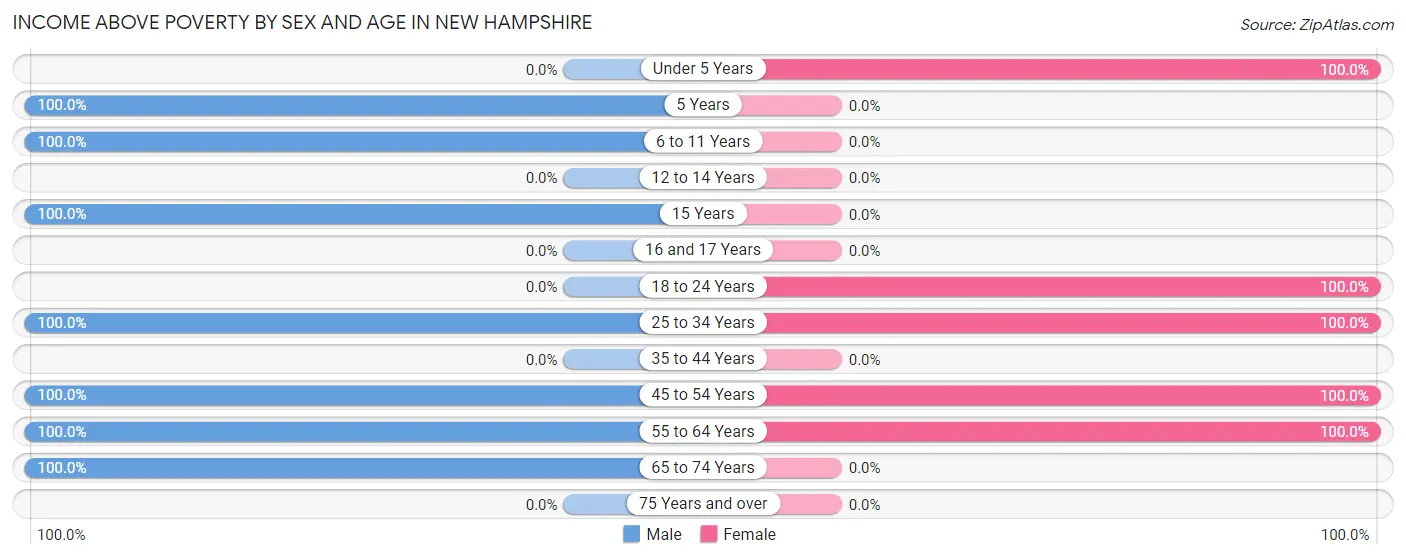
| Age Bracket | Male | Female |
| Under 5 Years | 0 (0.0%) | 18 (100.0%) |
| 5 Years | 27 (100.0%) | 0 (0.0%) |
| 6 to 11 Years | 12 (100.0%) | 0 (0.0%) |
| 12 to 14 Years | 0 (0.0%) | 0 (0.0%) |
| 15 Years | 134 (100.0%) | 0 (0.0%) |
| 16 and 17 Years | 0 (0.0%) | 0 (0.0%) |
| 18 to 24 Years | 0 (0.0%) | 11 (100.0%) |
| 25 to 34 Years | 14 (100.0%) | 24 (100.0%) |
| 35 to 44 Years | 0 (0.0%) | 0 (0.0%) |
| 45 to 54 Years | 80 (100.0%) | 86 (100.0%) |
| 55 to 64 Years | 12 (100.0%) | 15 (100.0%) |
| 65 to 74 Years | 16 (100.0%) | 0 (0.0%) |
| 75 Years and over | 0 (0.0%) | 0 (0.0%) |
| Total | 295 (100.0%) | 154 (100.0%) |
Income Below Poverty Among Married-Couple Families in New Hampshire
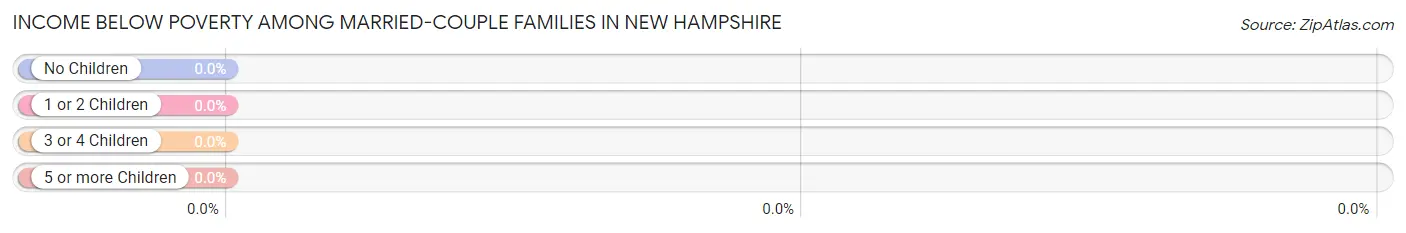
| Children | Above Poverty | Below Poverty |
| No Children | 21 (100.0%) | 0 (0.0%) |
| 1 or 2 Children | 79 (100.0%) | 0 (0.0%) |
| 3 or 4 Children | 12 (100.0%) | 0 (0.0%) |
| 5 or more Children | 0 (0.0%) | 0 (0.0%) |
| Total | 112 (100.0%) | 0 (0.0%) |
Income Below Poverty Among Single-Parent Households in New Hampshire
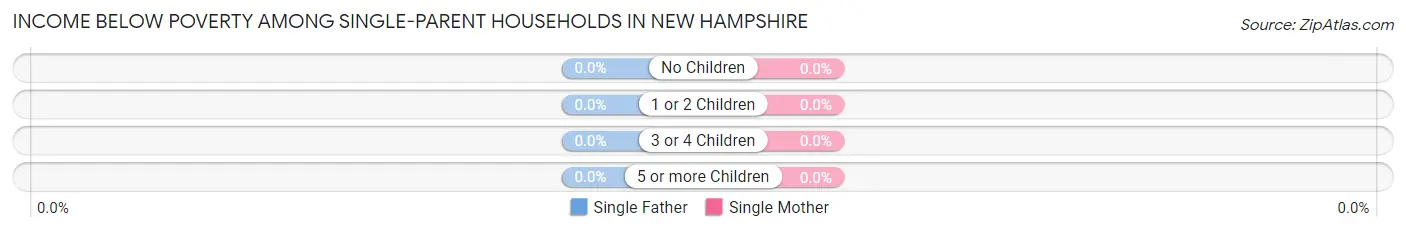
| Children | Single Father | Single Mother |
| No Children | 0 (0.0%) | 0 (0.0%) |
| 1 or 2 Children | 0 (0.0%) | 0 (0.0%) |
| 3 or 4 Children | 0 (0.0%) | 0 (0.0%) |
| 5 or more Children | 0 (0.0%) | 0 (0.0%) |
| Total | 0 (0.0%) | 0 (0.0%) |
Income Below Poverty Among Married-Couple vs Single-Parent Households in New Hampshire
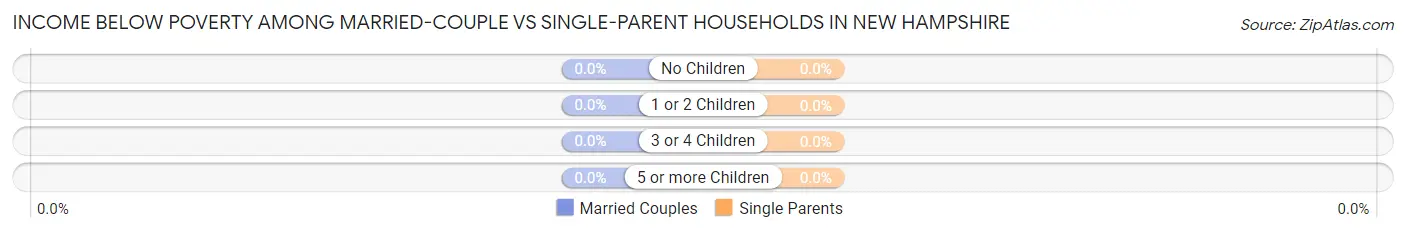
| Children | Married-Couple Families | Single-Parent Households |
| No Children | 0 (0.0%) | 0 (0.0%) |
| 1 or 2 Children | 0 (0.0%) | 0 (0.0%) |
| 3 or 4 Children | 0 (0.0%) | 0 (0.0%) |
| 5 or more Children | 0 (0.0%) | 0 (0.0%) |
| Total | 0 (0.0%) | 0 (0.0%) |
Employment Characteristics in New Hampshire
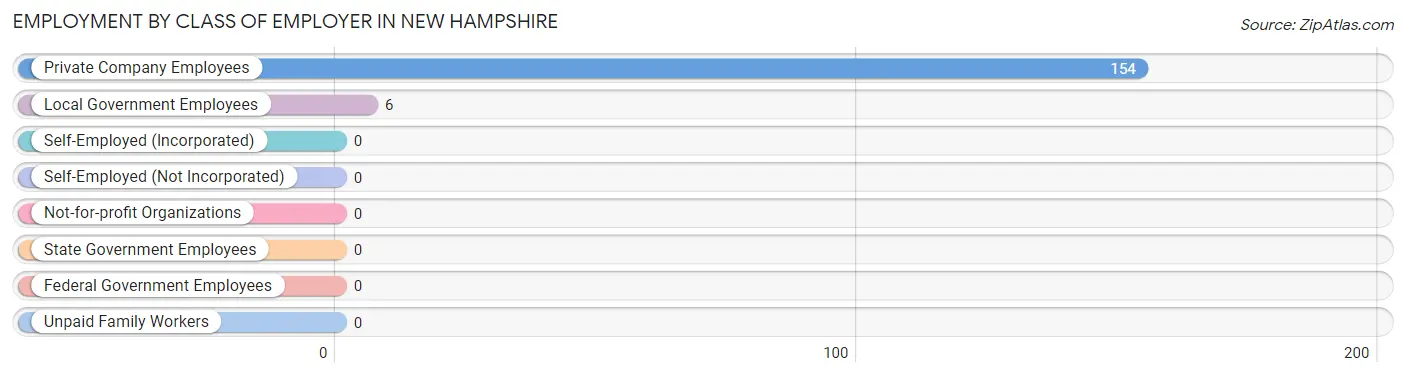
Employment by Class of Employer in New Hampshire
Among the 160 employed individuals in New Hampshire, private company employees (154 | 96.3%), and local government employees (6 | 3.7%) make up the most common classes of employment.
| Employer Class | # Employees | % Employees |
| Private Company Employees | 154 | 96.3% |
| Self-Employed (Incorporated) | 0 | 0.0% |
| Self-Employed (Not Incorporated) | 0 | 0.0% |
| Not-for-profit Organizations | 0 | 0.0% |
| Local Government Employees | 6 | 3.7% |
| State Government Employees | 0 | 0.0% |
| Federal Government Employees | 0 | 0.0% |
| Unpaid Family Workers | 0 | 0.0% |
| Total | 160 | 100.0% |
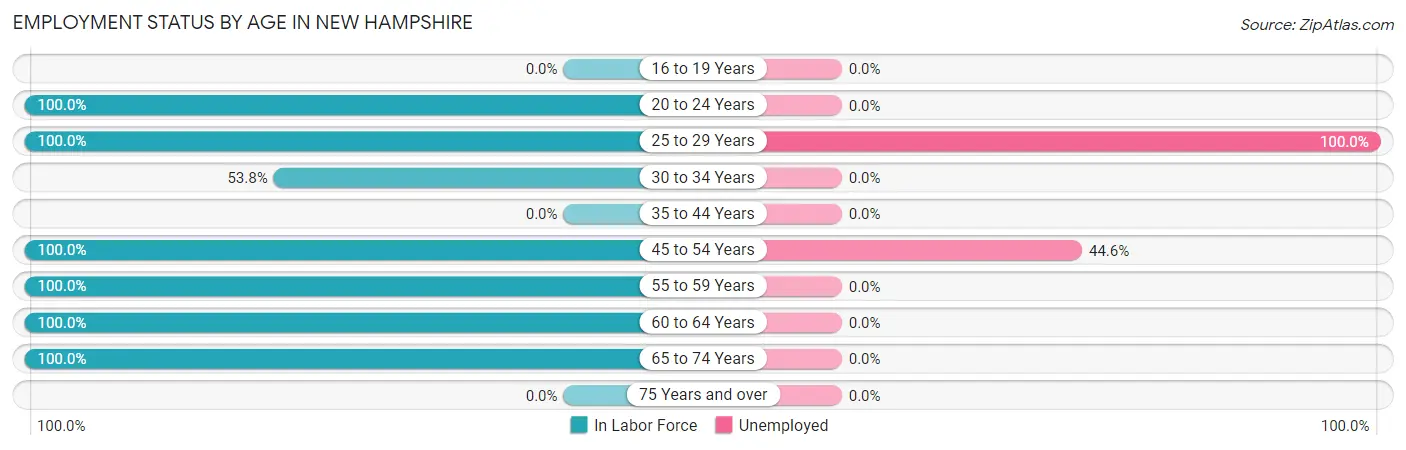
Employment Status by Age in New Hampshire
According to the labor force statistics for New Hampshire, out of the total population over 16 years of age (258), 95.3% or 246 individuals are in the labor force, with 35.0% or 86 of them unemployed. The age group with the highest labor force participation rate is 20 to 24 years, with 100.0% or 11 individuals in the labor force. Within the labor force, the 25 to 29 years age range has the highest percentage of unemployed individuals, with 100.0% or 12 of them being unemployed.
| Age Bracket | In Labor Force | Unemployed |
| 16 to 19 Years | 0 (0.0%) | 0 (0.0%) |
| 20 to 24 Years | 11 (100.0%) | 0 (0.0%) |
| 25 to 29 Years | 12 (100.0%) | 12 (100.0%) |
| 30 to 34 Years | 14 (53.8%) | 0 (0.0%) |
| 35 to 44 Years | 0 (0.0%) | 0 (0.0%) |
| 45 to 54 Years | 166 (100.0%) | 74 (44.6%) |
| 55 to 59 Years | 12 (100.0%) | 0 (0.0%) |
| 60 to 64 Years | 15 (100.0%) | 0 (0.0%) |
| 65 to 74 Years | 16 (100.0%) | 0 (0.0%) |
| 75 Years and over | 0 (0.0%) | 0 (0.0%) |
| Total | 246 (95.3%) | 86 (35.0%) |
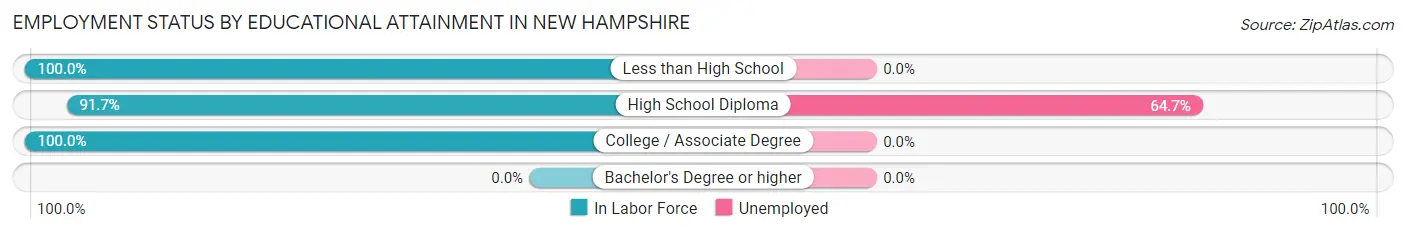
Employment Status by Educational Attainment in New Hampshire
According to labor force statistics for New Hampshire, 94.8% of individuals (219) out of the total population between 25 and 64 years of age (231) are in the labor force, with 39.3% or 86 of them being unemployed. The group with the highest labor force participation rate are those with the educational attainment of less than high school, with 100.0% or 23 individuals in the labor force. Within the labor force, individuals with high school diploma education have the highest percentage of unemployment, with 64.7% or 86 of them being unemployed.
| Educational Attainment | In Labor Force | Unemployed |
| Less than High School | 23 (100.0%) | 0 (0.0%) |
| High School Diploma | 133 (91.7%) | 94 (64.7%) |
| College / Associate Degree | 63 (100.0%) | 0 (0.0%) |
| Bachelor's Degree or higher | 0 (0.0%) | 0 (0.0%) |
| Total | 219 (94.8%) | 91 (39.3%) |
Employment Occupations by Sex in New Hampshire
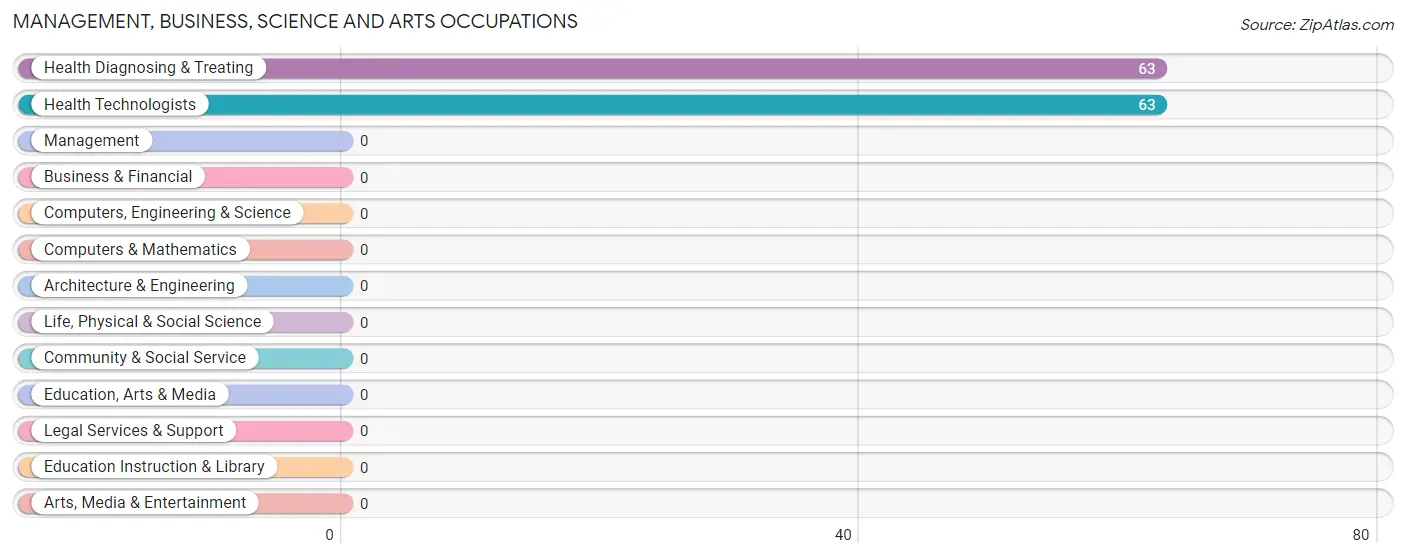
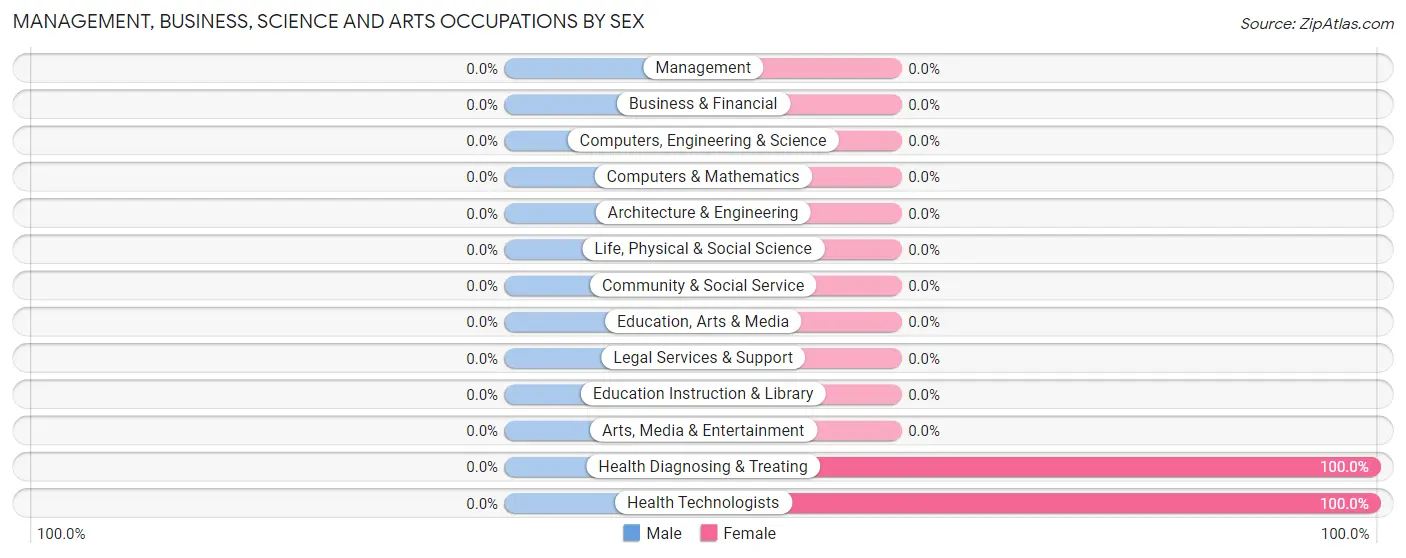
Management, Business, Science and Arts Occupations
The most common Management, Business, Science and Arts occupations in New Hampshire are Health Diagnosing & Treating (63 | 39.4%), and Health Technologists (63 | 39.4%).
Management, Business, Science and Arts Occupations by Sex
| Occupation | Male | Female |
| Management | 0 (0.0%) | 0 (0.0%) |
| Business & Financial | 0 (0.0%) | 0 (0.0%) |
| Computers, Engineering & Science | 0 (0.0%) | 0 (0.0%) |
| Computers & Mathematics | 0 (0.0%) | 0 (0.0%) |
| Architecture & Engineering | 0 (0.0%) | 0 (0.0%) |
| Life, Physical & Social Science | 0 (0.0%) | 0 (0.0%) |
| Community & Social Service | 0 (0.0%) | 0 (0.0%) |
| Education, Arts & Media | 0 (0.0%) | 0 (0.0%) |
| Legal Services & Support | 0 (0.0%) | 0 (0.0%) |
| Education Instruction & Library | 0 (0.0%) | 0 (0.0%) |
| Arts, Media & Entertainment | 0 (0.0%) | 0 (0.0%) |
| Health Diagnosing & Treating | 0 (0.0%) | 63 (100.0%) |
| Health Technologists | 0 (0.0%) | 63 (100.0%) |
| Total (Category) | 0 (0.0%) | 63 (100.0%) |
| Total (Overall) | 48 (30.0%) | 112 (70.0%) |
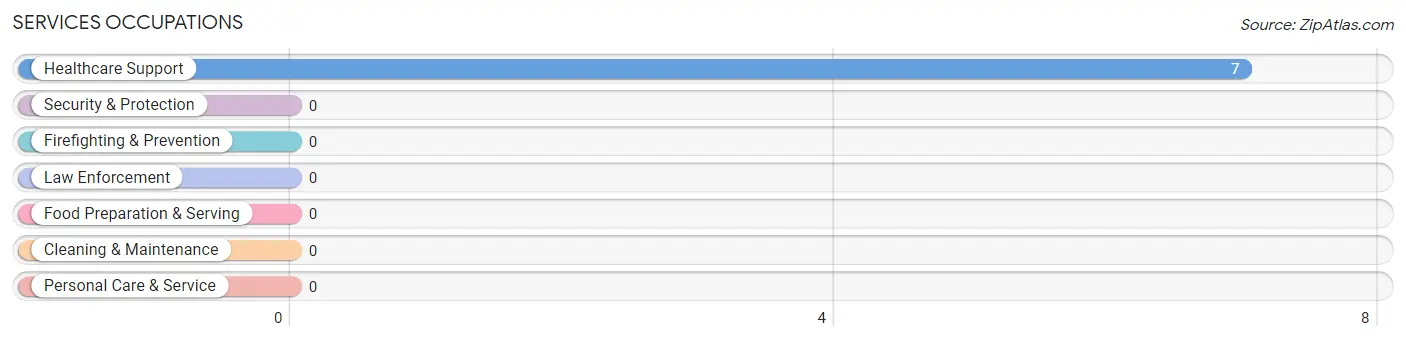
Services Occupations
The most common Services occupations in New Hampshire are , and Healthcare Support (7 | 4.4%).
Services Occupations by Sex
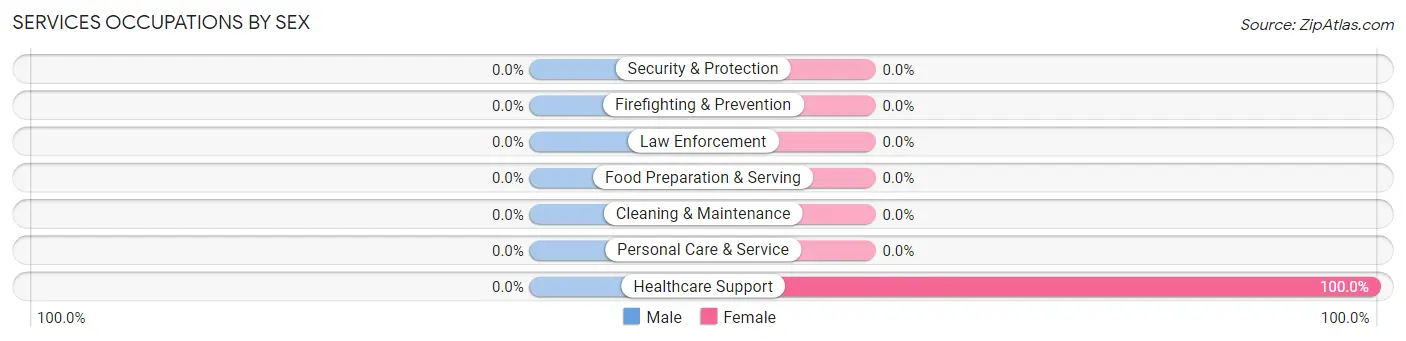
| Occupation | Male | Female |
| Healthcare Support | 0 (0.0%) | 7 (100.0%) |
| Security & Protection | 0 (0.0%) | 0 (0.0%) |
| Firefighting & Prevention | 0 (0.0%) | 0 (0.0%) |
| Law Enforcement | 0 (0.0%) | 0 (0.0%) |
| Food Preparation & Serving | 0 (0.0%) | 0 (0.0%) |
| Cleaning & Maintenance | 0 (0.0%) | 0 (0.0%) |
| Personal Care & Service | 0 (0.0%) | 0 (0.0%) |
| Total (Category) | 0 (0.0%) | 7 (100.0%) |
| Total (Overall) | 48 (30.0%) | 112 (70.0%) |
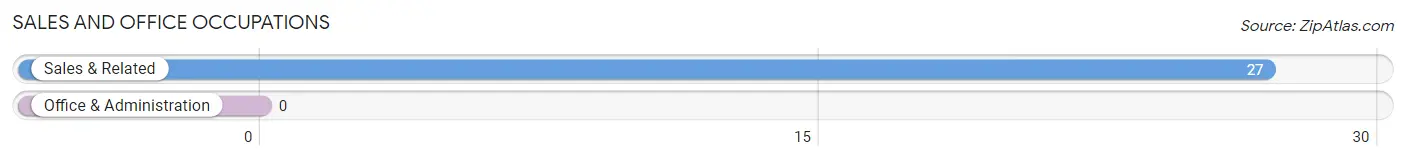
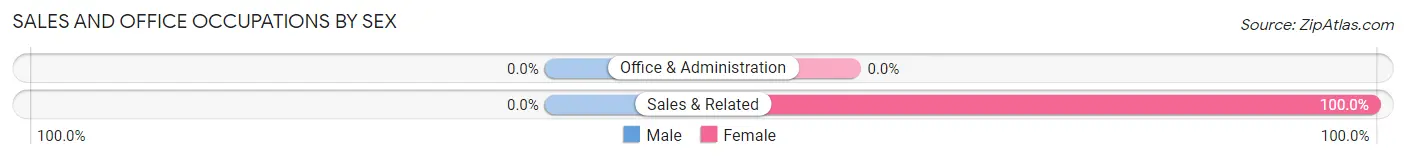
Sales and Office Occupations
The most common Sales and Office occupations in New Hampshire are , and Sales & Related (27 | 16.9%).
Sales and Office Occupations by Sex
| Occupation | Male | Female |
| Sales & Related | 0 (0.0%) | 27 (100.0%) |
| Office & Administration | 0 (0.0%) | 0 (0.0%) |
| Total (Category) | 0 (0.0%) | 27 (100.0%) |
| Total (Overall) | 48 (30.0%) | 112 (70.0%) |
Natural Resources, Construction and Maintenance Occupations
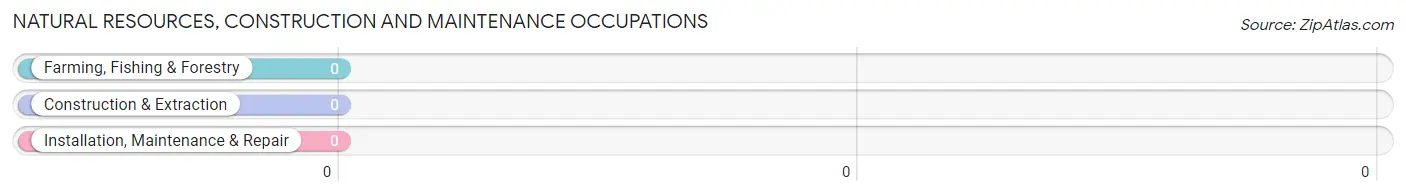
Natural Resources, Construction and Maintenance Occupations by Sex
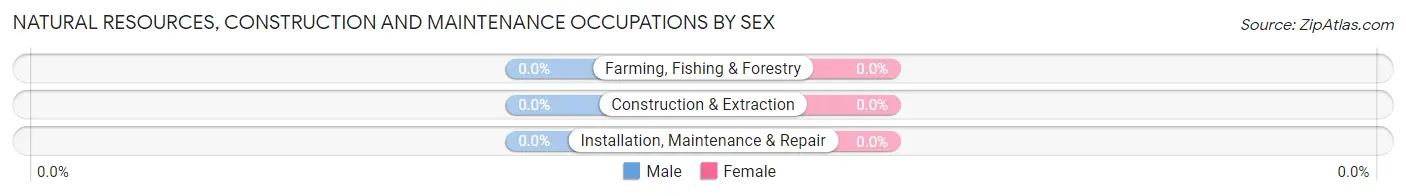
| Occupation | Male | Female |
| Farming, Fishing & Forestry | 0 (0.0%) | 0 (0.0%) |
| Construction & Extraction | 0 (0.0%) | 0 (0.0%) |
| Installation, Maintenance & Repair | 0 (0.0%) | 0 (0.0%) |
| Total (Category) | 0 (0.0%) | 0 (0.0%) |
| Total (Overall) | 48 (30.0%) | 112 (70.0%) |
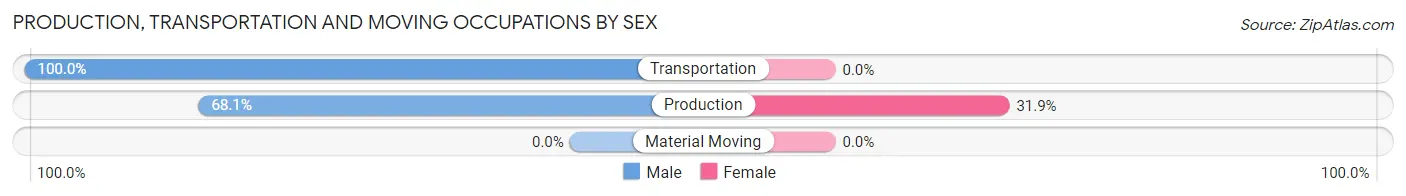
Production, Transportation and Moving Occupations
The most common Production, Transportation and Moving occupations in New Hampshire are Production (47 | 29.4%), and Transportation (16 | 10.0%).
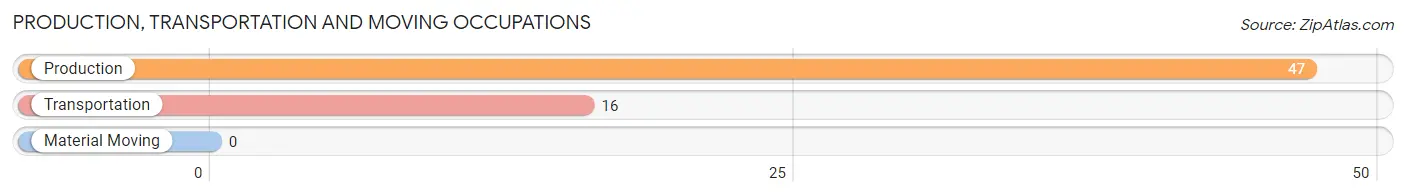
Production, Transportation and Moving Occupations by Sex
| Occupation | Male | Female |
| Production | 32 (68.1%) | 15 (31.9%) |
| Transportation | 16 (100.0%) | 0 (0.0%) |
| Material Moving | 0 (0.0%) | 0 (0.0%) |
| Total (Category) | 48 (76.2%) | 15 (23.8%) |
| Total (Overall) | 48 (30.0%) | 112 (70.0%) |
Employment Industries by Sex in New Hampshire
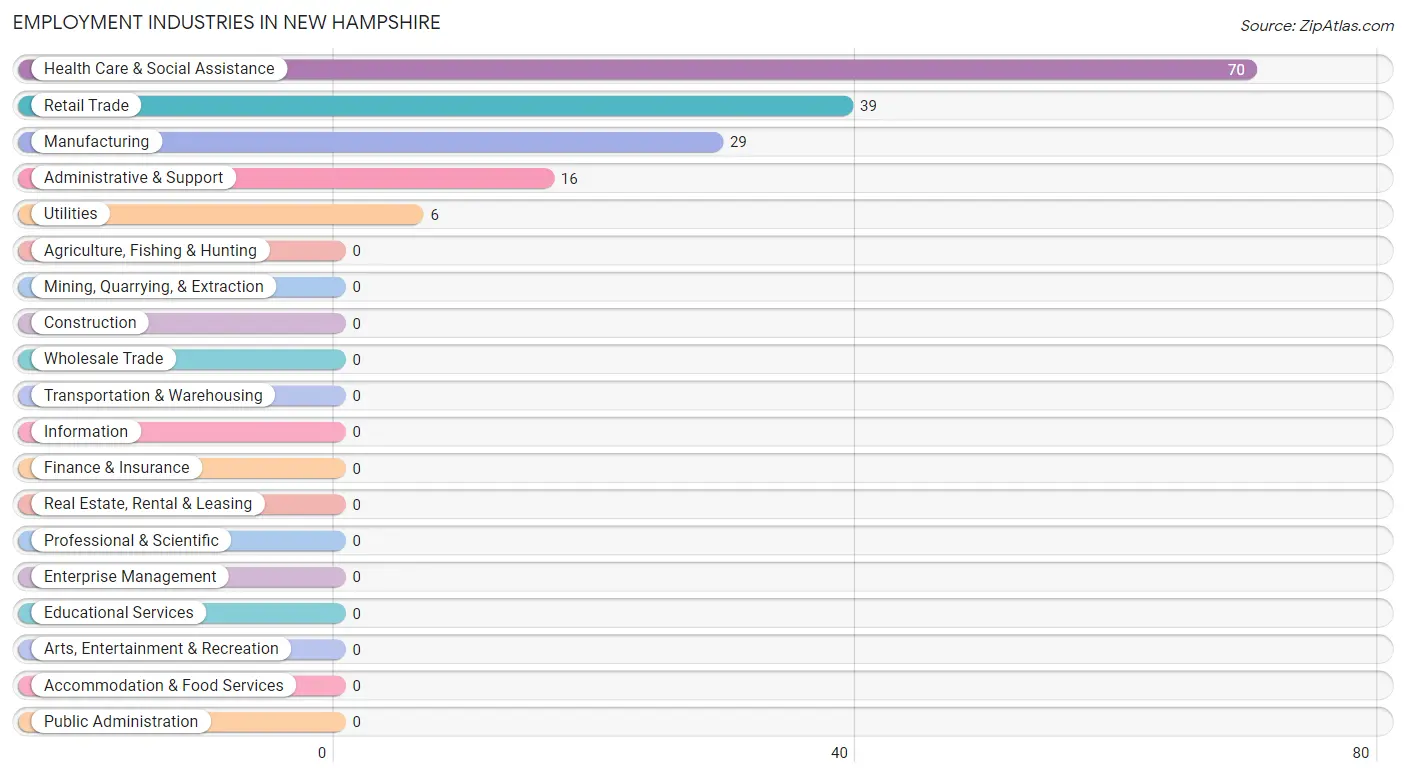
Employment Industries in New Hampshire
The major employment industries in New Hampshire include Health Care & Social Assistance (70 | 43.8%), Retail Trade (39 | 24.4%), Manufacturing (29 | 18.1%), Administrative & Support (16 | 10.0%), and Utilities (6 | 3.7%).
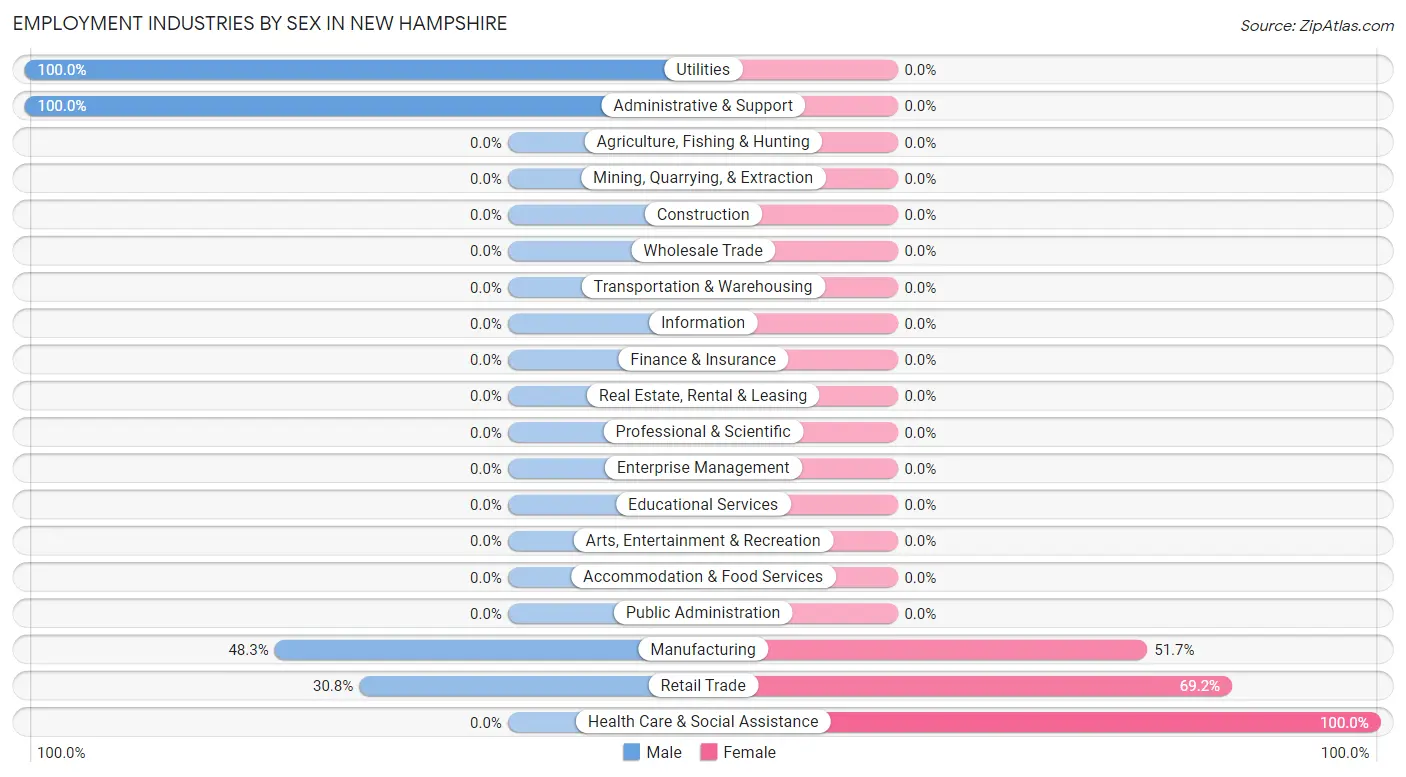
Employment Industries by Sex in New Hampshire
The New Hampshire industries that see more men than women are Utilities (100.0%), Administrative & Support (100.0%), and Manufacturing (48.3%), whereas the industries that tend to have a higher number of women are Health Care & Social Assistance (100.0%), Retail Trade (69.2%), and Manufacturing (51.7%).
| Industry | Male | Female |
| Agriculture, Fishing & Hunting | 0 (0.0%) | 0 (0.0%) |
| Mining, Quarrying, & Extraction | 0 (0.0%) | 0 (0.0%) |
| Construction | 0 (0.0%) | 0 (0.0%) |
| Manufacturing | 14 (48.3%) | 15 (51.7%) |
| Wholesale Trade | 0 (0.0%) | 0 (0.0%) |
| Retail Trade | 12 (30.8%) | 27 (69.2%) |
| Transportation & Warehousing | 0 (0.0%) | 0 (0.0%) |
| Utilities | 6 (100.0%) | 0 (0.0%) |
| Information | 0 (0.0%) | 0 (0.0%) |
| Finance & Insurance | 0 (0.0%) | 0 (0.0%) |
| Real Estate, Rental & Leasing | 0 (0.0%) | 0 (0.0%) |
| Professional & Scientific | 0 (0.0%) | 0 (0.0%) |
| Enterprise Management | 0 (0.0%) | 0 (0.0%) |
| Administrative & Support | 16 (100.0%) | 0 (0.0%) |
| Educational Services | 0 (0.0%) | 0 (0.0%) |
| Health Care & Social Assistance | 0 (0.0%) | 70 (100.0%) |
| Arts, Entertainment & Recreation | 0 (0.0%) | 0 (0.0%) |
| Accommodation & Food Services | 0 (0.0%) | 0 (0.0%) |
| Public Administration | 0 (0.0%) | 0 (0.0%) |
| Total | 48 (30.0%) | 112 (70.0%) |
Education in New Hampshire
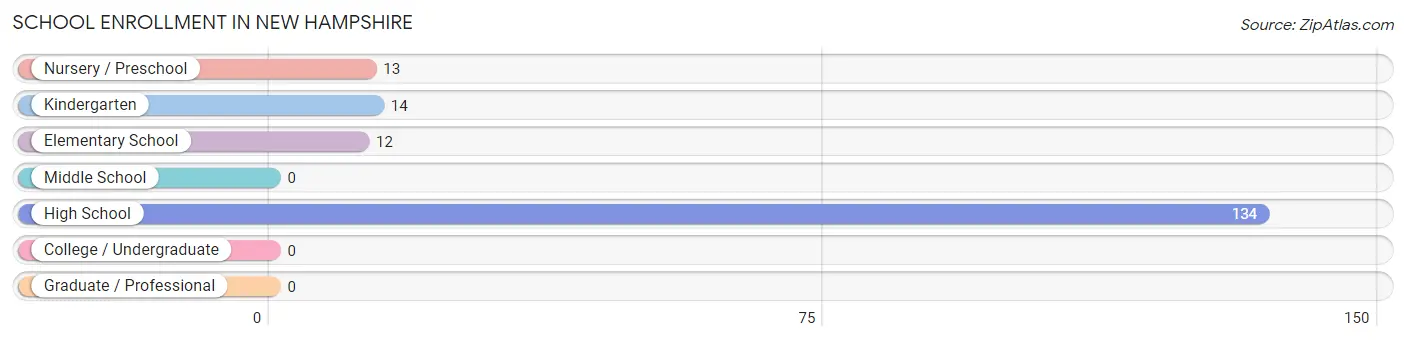
School Enrollment in New Hampshire
The most common levels of schooling among the 173 students in New Hampshire are high school (134 | 77.5%), kindergarten (14 | 8.1%), and nursery / preschool (13 | 7.5%).
| School Level | # Students | % Students |
| Nursery / Preschool | 13 | 7.5% |
| Kindergarten | 14 | 8.1% |
| Elementary School | 12 | 6.9% |
| Middle School | 0 | 0.0% |
| High School | 134 | 77.5% |
| College / Undergraduate | 0 | 0.0% |
| Graduate / Professional | 0 | 0.0% |
| Total | 173 | 100.0% |
School Enrollment by Age by Funding Source in New Hampshire
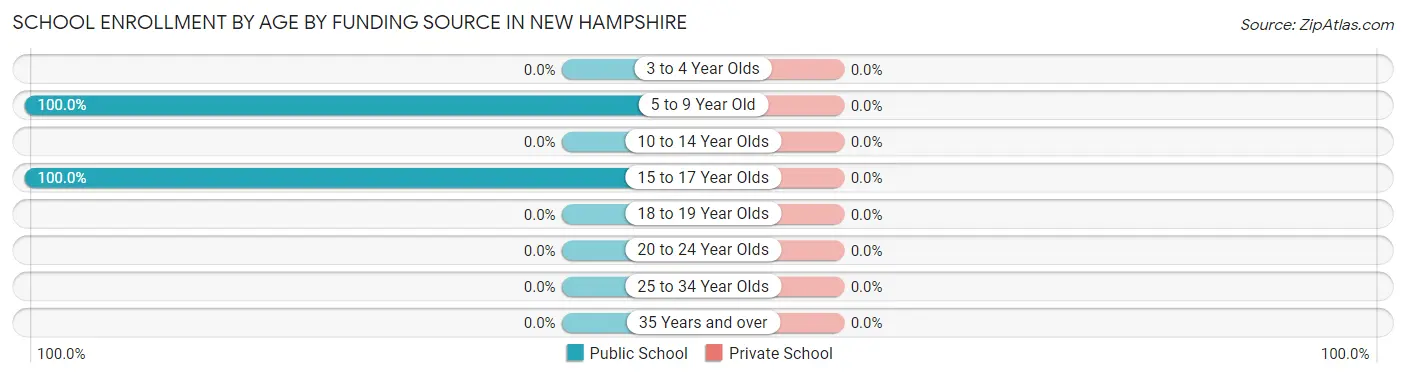
| Age Bracket | Public School | Private School |
| 3 to 4 Year Olds | 0 (0.0%) | 0 (0.0%) |
| 5 to 9 Year Old | 39 (100.0%) | 0 (0.0%) |
| 10 to 14 Year Olds | 0 (0.0%) | 0 (0.0%) |
| 15 to 17 Year Olds | 134 (100.0%) | 0 (0.0%) |
| 18 to 19 Year Olds | 0 (0.0%) | 0 (0.0%) |
| 20 to 24 Year Olds | 0 (0.0%) | 0 (0.0%) |
| 25 to 34 Year Olds | 0 (0.0%) | 0 (0.0%) |
| 35 Years and over | 0 (0.0%) | 0 (0.0%) |
| Total | 173 (100.0%) | 0 (0.0%) |
Educational Attainment by Field of Study in New Hampshire
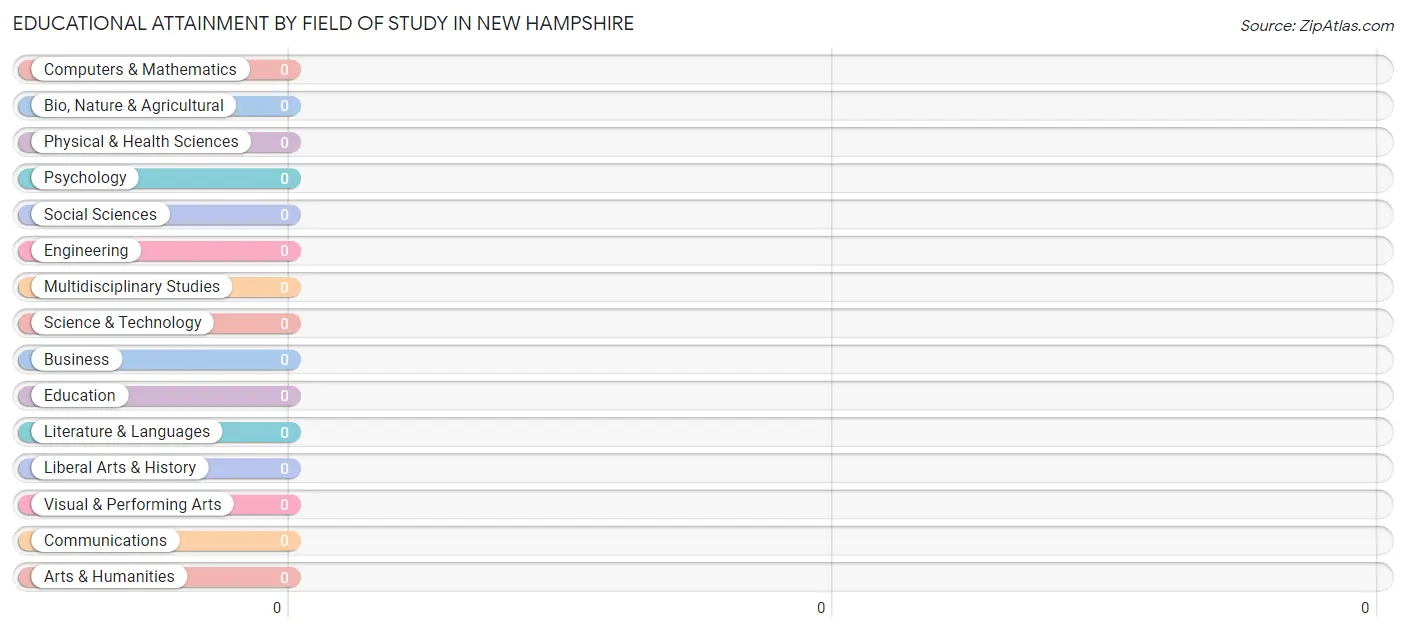
| Field of Study | # Graduates | % Graduates |
| Computers & Mathematics | 0 | 0.0% |
| Bio, Nature & Agricultural | 0 | 0.0% |
| Physical & Health Sciences | 0 | 0.0% |
| Psychology | 0 | 0.0% |
| Social Sciences | 0 | 0.0% |
| Engineering | 0 | 0.0% |
| Multidisciplinary Studies | 0 | 0.0% |
| Science & Technology | 0 | 0.0% |
| Business | 0 | 0.0% |
| Education | 0 | 0.0% |
| Literature & Languages | 0 | 0.0% |
| Liberal Arts & History | 0 | 0.0% |
| Visual & Performing Arts | 0 | 0.0% |
| Communications | 0 | 0.0% |
| Arts & Humanities | 0 | 0.0% |
| Total | 0 | 0.0% |
Transportation & Commute in New Hampshire
Vehicle Availability by Sex in New Hampshire
The most prevalent vehicle ownership categories in New Hampshire are males with 4 vehicles (28, accounting for 58.3%) and females with 4 vehicles (42, making up 25.0%).
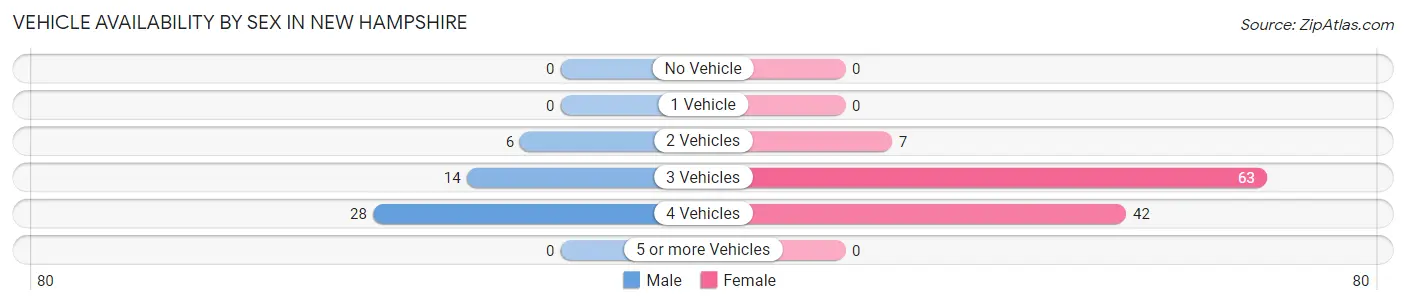
| Vehicles Available | Male | Female |
| No Vehicle | 0 (0.0%) | 0 (0.0%) |
| 1 Vehicle | 0 (0.0%) | 0 (0.0%) |
| 2 Vehicles | 6 (12.5%) | 7 (6.2%) |
| 3 Vehicles | 14 (29.2%) | 63 (56.2%) |
| 4 Vehicles | 28 (58.3%) | 42 (37.5%) |
| 5 or more Vehicles | 0 (0.0%) | 0 (0.0%) |
| Total | 48 (100.0%) | 112 (100.0%) |
Commute Time in New Hampshire
The most frequently occuring commute durations in New Hampshire are 20 to 24 minutes (77 commuters, 53.5%), 25 to 29 minutes (43 commuters, 29.9%), and 15 to 19 minutes (18 commuters, 12.5%).
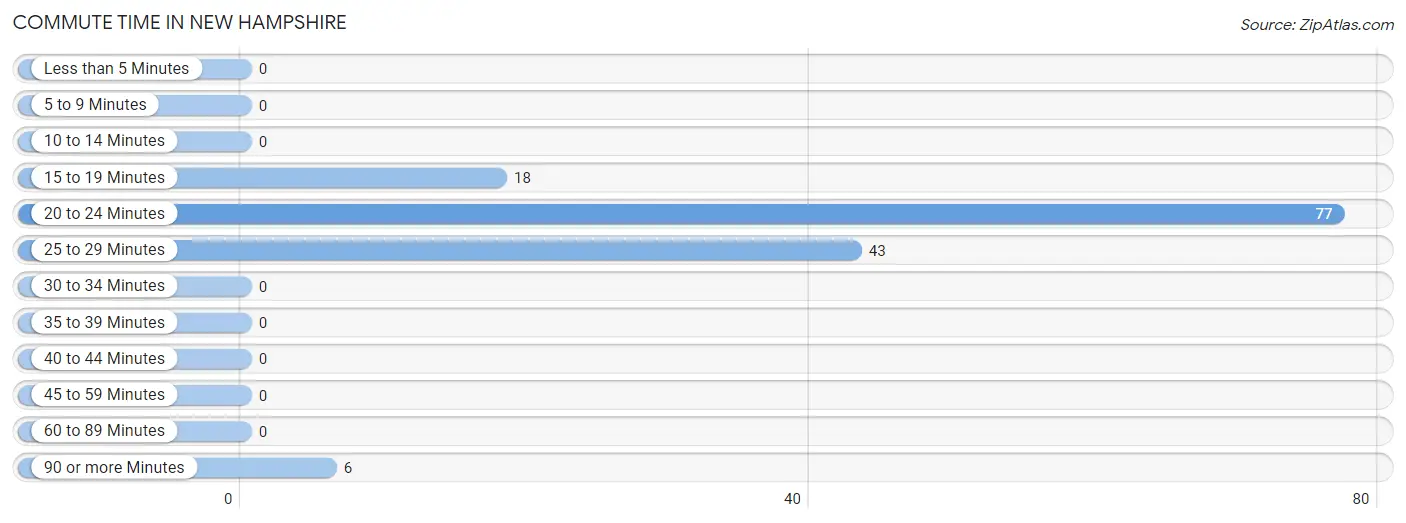
| Commute Time | # Commuters | % Commuters |
| Less than 5 Minutes | 0 | 0.0% |
| 5 to 9 Minutes | 0 | 0.0% |
| 10 to 14 Minutes | 0 | 0.0% |
| 15 to 19 Minutes | 18 | 12.5% |
| 20 to 24 Minutes | 77 | 53.5% |
| 25 to 29 Minutes | 43 | 29.9% |
| 30 to 34 Minutes | 0 | 0.0% |
| 35 to 39 Minutes | 0 | 0.0% |
| 40 to 44 Minutes | 0 | 0.0% |
| 45 to 59 Minutes | 0 | 0.0% |
| 60 to 89 Minutes | 0 | 0.0% |
| 90 or more Minutes | 6 | 4.2% |
Commute Time by Sex in New Hampshire
The most common commute times in New Hampshire are 20 to 24 minutes (14 commuters, 43.8%) for males and 20 to 24 minutes (63 commuters, 56.2%) for females.
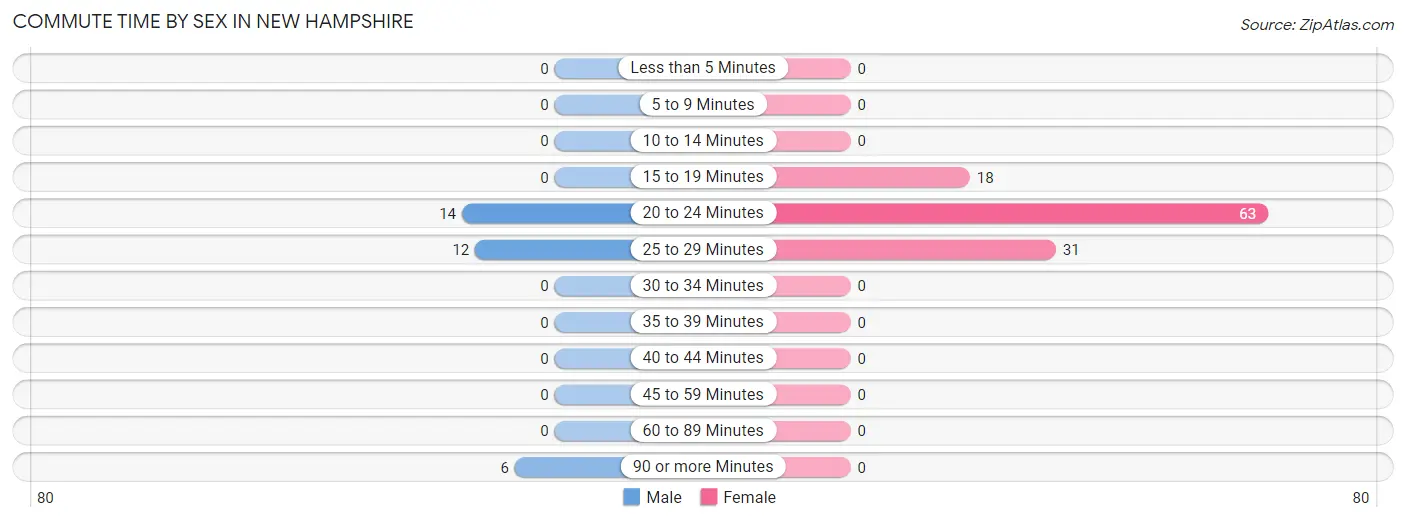
| Commute Time | Male | Female |
| Less than 5 Minutes | 0 (0.0%) | 0 (0.0%) |
| 5 to 9 Minutes | 0 (0.0%) | 0 (0.0%) |
| 10 to 14 Minutes | 0 (0.0%) | 0 (0.0%) |
| 15 to 19 Minutes | 0 (0.0%) | 18 (16.1%) |
| 20 to 24 Minutes | 14 (43.8%) | 63 (56.2%) |
| 25 to 29 Minutes | 12 (37.5%) | 31 (27.7%) |
| 30 to 34 Minutes | 0 (0.0%) | 0 (0.0%) |
| 35 to 39 Minutes | 0 (0.0%) | 0 (0.0%) |
| 40 to 44 Minutes | 0 (0.0%) | 0 (0.0%) |
| 45 to 59 Minutes | 0 (0.0%) | 0 (0.0%) |
| 60 to 89 Minutes | 0 (0.0%) | 0 (0.0%) |
| 90 or more Minutes | 6 (18.8%) | 0 (0.0%) |
Time of Departure to Work by Sex in New Hampshire
The most frequent times of departure to work in New Hampshire are 6:00 AM to 6:29 AM (18, 56.2%) for males and 7:00 AM to 7:29 AM (78, 69.6%) for females.
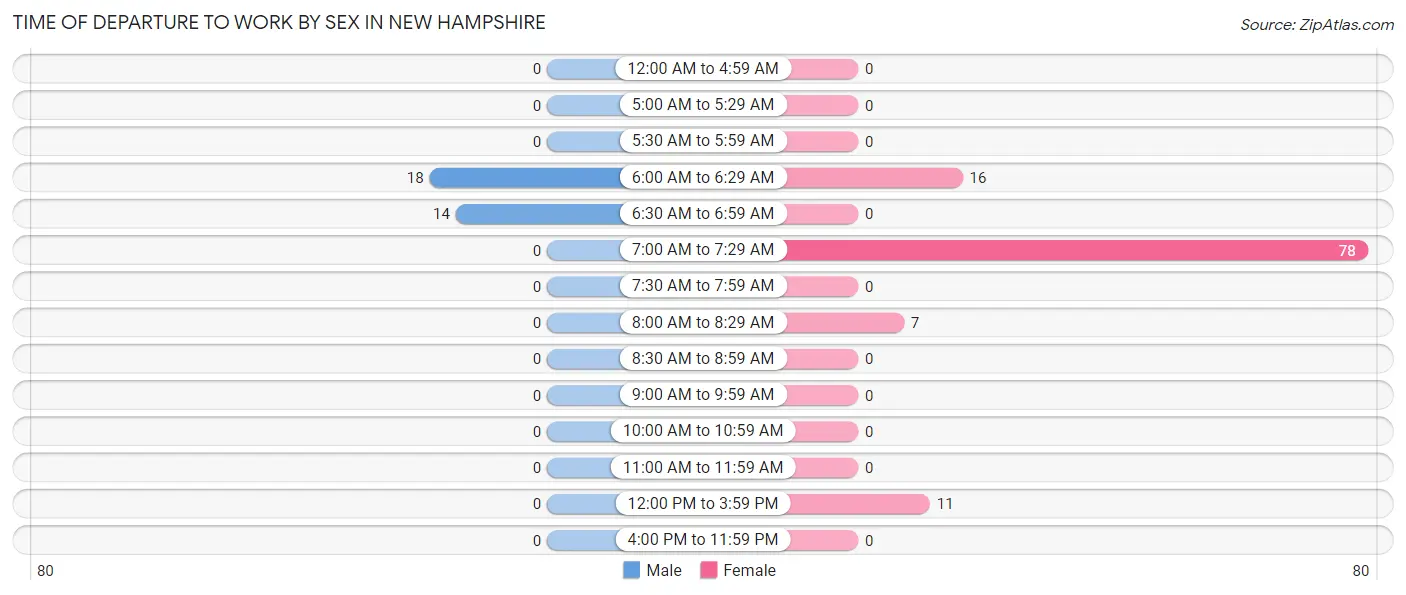
| Time of Departure | Male | Female |
| 12:00 AM to 4:59 AM | 0 (0.0%) | 0 (0.0%) |
| 5:00 AM to 5:29 AM | 0 (0.0%) | 0 (0.0%) |
| 5:30 AM to 5:59 AM | 0 (0.0%) | 0 (0.0%) |
| 6:00 AM to 6:29 AM | 18 (56.2%) | 16 (14.3%) |
| 6:30 AM to 6:59 AM | 14 (43.8%) | 0 (0.0%) |
| 7:00 AM to 7:29 AM | 0 (0.0%) | 78 (69.6%) |
| 7:30 AM to 7:59 AM | 0 (0.0%) | 0 (0.0%) |
| 8:00 AM to 8:29 AM | 0 (0.0%) | 7 (6.2%) |
| 8:30 AM to 8:59 AM | 0 (0.0%) | 0 (0.0%) |
| 9:00 AM to 9:59 AM | 0 (0.0%) | 0 (0.0%) |
| 10:00 AM to 10:59 AM | 0 (0.0%) | 0 (0.0%) |
| 11:00 AM to 11:59 AM | 0 (0.0%) | 0 (0.0%) |
| 12:00 PM to 3:59 PM | 0 (0.0%) | 11 (9.8%) |
| 4:00 PM to 11:59 PM | 0 (0.0%) | 0 (0.0%) |
| Total | 32 (100.0%) | 112 (100.0%) |
Housing Occupancy in New Hampshire
Occupancy by Ownership in New Hampshire
Of the total 112 dwellings in New Hampshire, owner-occupied units account for 112 (100.0%), while renter-occupied units make up 0 (0.0%).
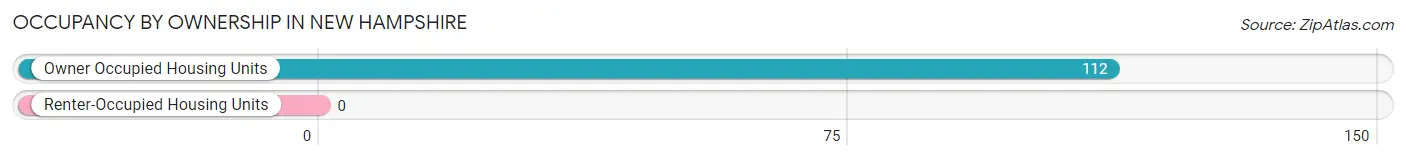
| Occupancy | # Housing Units | % Housing Units |
| Owner Occupied Housing Units | 112 | 100.0% |
| Renter-Occupied Housing Units | 0 | 0.0% |
| Total Occupied Housing Units | 112 | 100.0% |
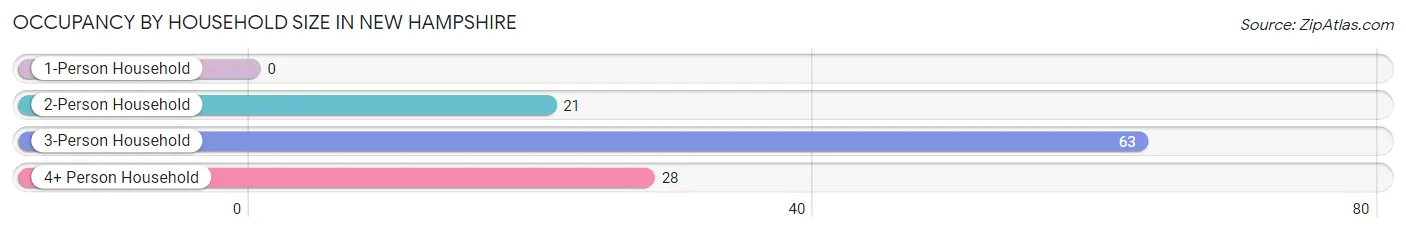
Occupancy by Household Size in New Hampshire
| Household Size | # Housing Units | % Housing Units |
| 1-Person Household | 0 | 0.0% |
| 2-Person Household | 21 | 18.8% |
| 3-Person Household | 63 | 56.2% |
| 4+ Person Household | 28 | 25.0% |
| Total Housing Units | 112 | 100.0% |
Occupancy by Ownership by Household Size in New Hampshire
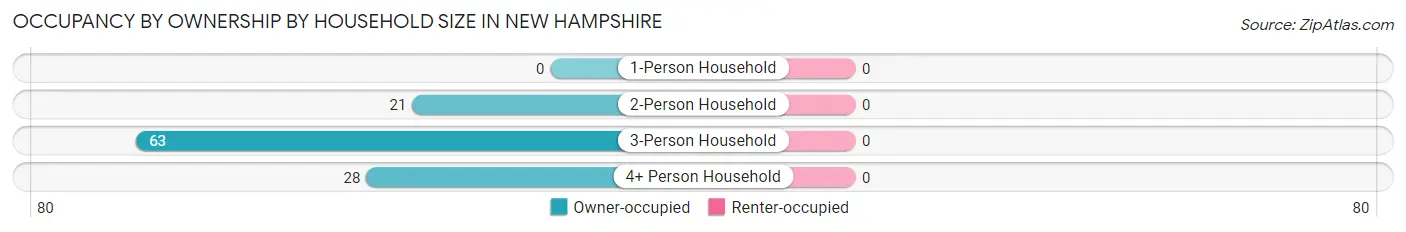
| Household Size | Owner-occupied | Renter-occupied |
| 1-Person Household | 0 (0.0%) | 0 (0.0%) |
| 2-Person Household | 21 (100.0%) | 0 (0.0%) |
| 3-Person Household | 63 (100.0%) | 0 (0.0%) |
| 4+ Person Household | 28 (100.0%) | 0 (0.0%) |
| Total Housing Units | 112 (100.0%) | 0 (0.0%) |
Occupancy by Educational Attainment in New Hampshire
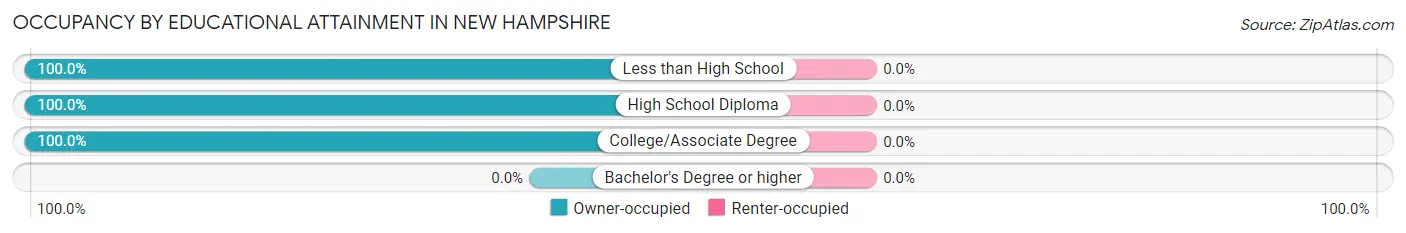
| Household Size | Owner-occupied | Renter-occupied |
| Less than High School | 16 (100.0%) | 0 (0.0%) |
| High School Diploma | 33 (100.0%) | 0 (0.0%) |
| College/Associate Degree | 63 (100.0%) | 0 (0.0%) |
| Bachelor's Degree or higher | 0 (0.0%) | 0 (0.0%) |
Occupancy by Age of Householder in New Hampshire
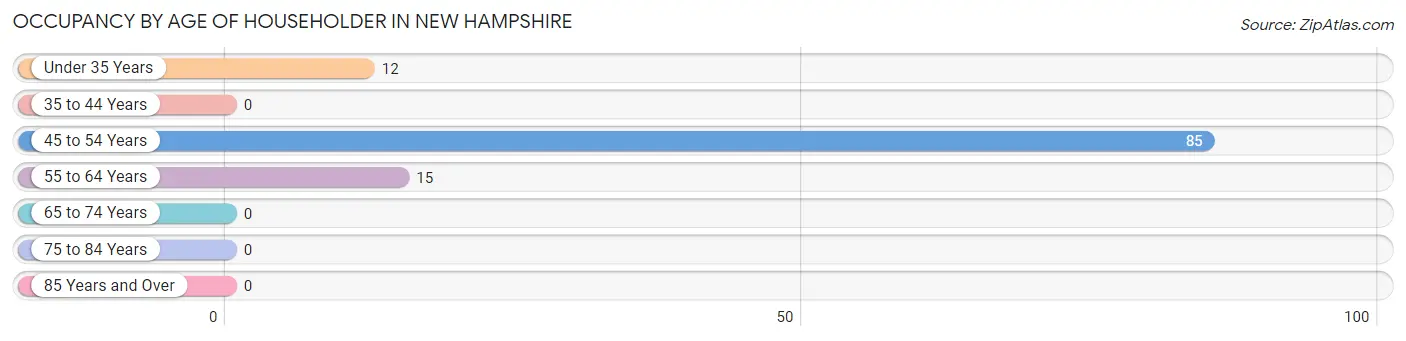
| Age Bracket | # Households | % Households |
| Under 35 Years | 12 | 10.7% |
| 35 to 44 Years | 0 | 0.0% |
| 45 to 54 Years | 85 | 75.9% |
| 55 to 64 Years | 15 | 13.4% |
| 65 to 74 Years | 0 | 0.0% |
| 75 to 84 Years | 0 | 0.0% |
| 85 Years and Over | 0 | 0.0% |
| Total | 112 | 100.0% |
Housing Finances in New Hampshire
Median Income by Occupancy in New Hampshire
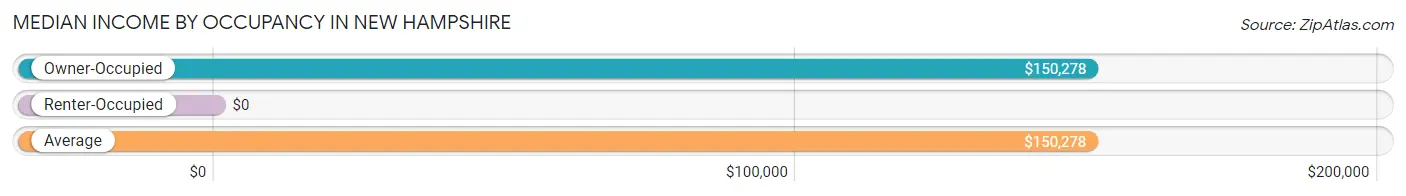
| Occupancy Type | # Households | Median Income |
| Owner-Occupied | 112 (100.0%) | $150,278 |
| Renter-Occupied | 0 (0.0%) | $0 |
| Average | 112 (100.0%) | $150,278 |
Occupancy by Householder Income Bracket in New Hampshire
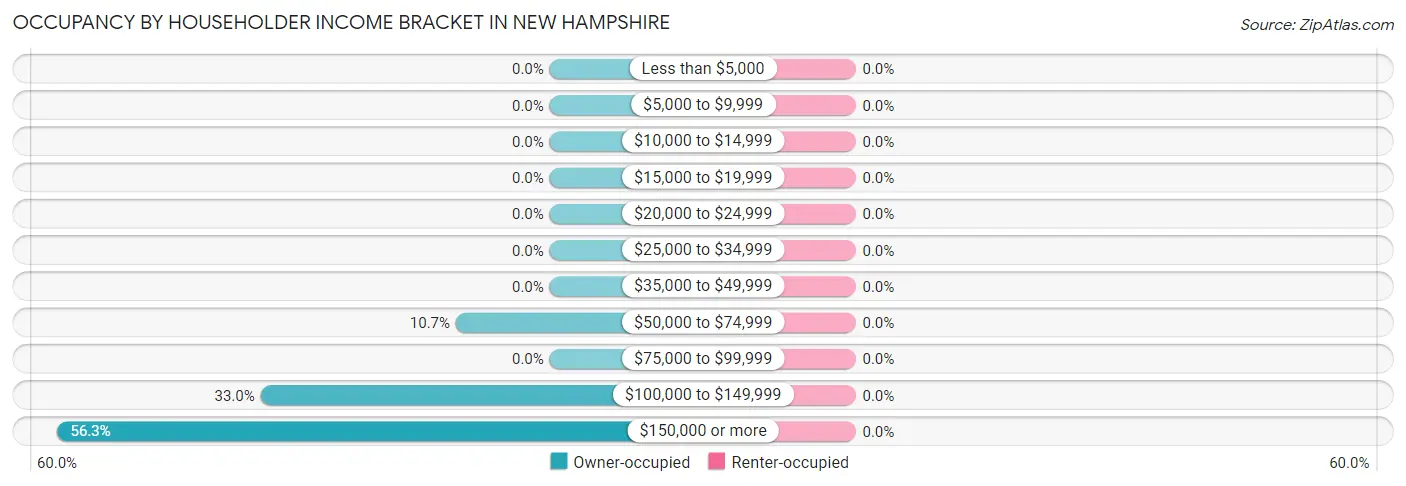
| Income Bracket | Owner-occupied | Renter-occupied |
| Less than $5,000 | 0 (0.0%) | 0 (0.0%) |
| $5,000 to $9,999 | 0 (0.0%) | 0 (0.0%) |
| $10,000 to $14,999 | 0 (0.0%) | 0 (0.0%) |
| $15,000 to $19,999 | 0 (0.0%) | 0 (0.0%) |
| $20,000 to $24,999 | 0 (0.0%) | 0 (0.0%) |
| $25,000 to $34,999 | 0 (0.0%) | 0 (0.0%) |
| $35,000 to $49,999 | 0 (0.0%) | 0 (0.0%) |
| $50,000 to $74,999 | 12 (10.7%) | 0 (0.0%) |
| $75,000 to $99,999 | 0 (0.0%) | 0 (0.0%) |
| $100,000 to $149,999 | 37 (33.0%) | 0 (0.0%) |
| $150,000 or more | 63 (56.2%) | 0 (0.0%) |
| Total | 112 (100.0%) | 0 (0.0%) |
Monthly Housing Cost Tiers in New Hampshire
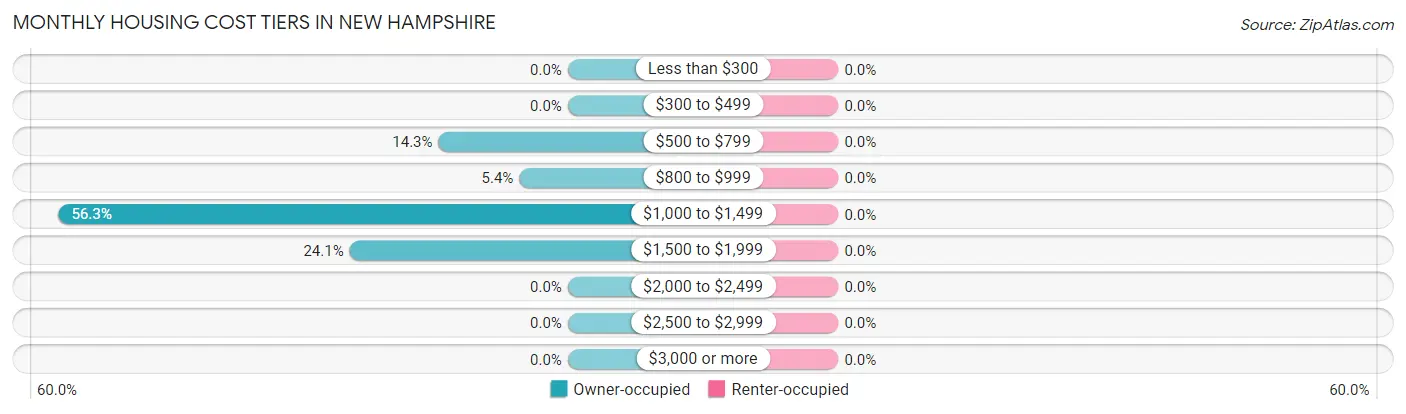
| Monthly Cost | Owner-occupied | Renter-occupied |
| Less than $300 | 0 (0.0%) | 0 (0.0%) |
| $300 to $499 | 0 (0.0%) | 0 (0.0%) |
| $500 to $799 | 16 (14.3%) | 0 (0.0%) |
| $800 to $999 | 6 (5.4%) | 0 (0.0%) |
| $1,000 to $1,499 | 63 (56.2%) | 0 (0.0%) |
| $1,500 to $1,999 | 27 (24.1%) | 0 (0.0%) |
| $2,000 to $2,499 | 0 (0.0%) | 0 (0.0%) |
| $2,500 to $2,999 | 0 (0.0%) | 0 (0.0%) |
| $3,000 or more | 0 (0.0%) | 0 (0.0%) |
| Total | 112 (100.0%) | 0 (0.0%) |
Physical Housing Characteristics in New Hampshire
Housing Structures in New Hampshire
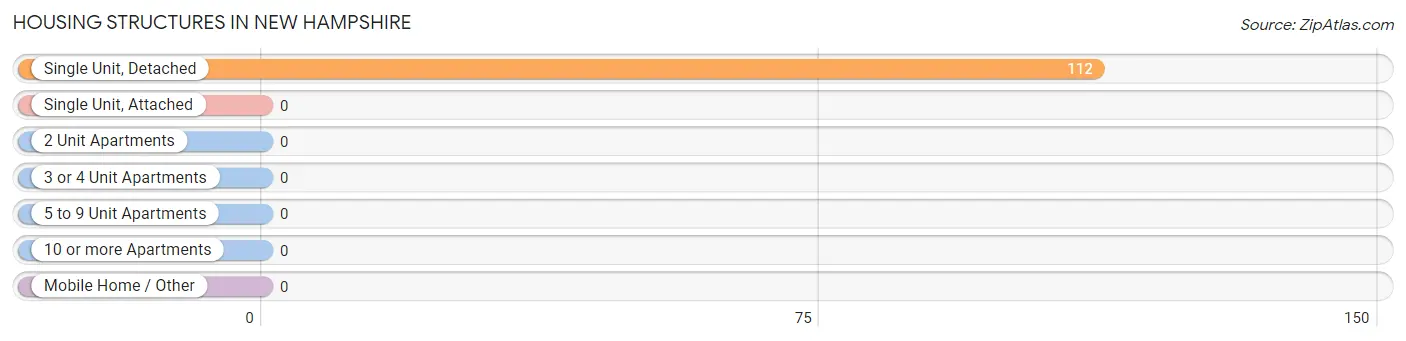
| Structure Type | # Housing Units | % Housing Units |
| Single Unit, Detached | 112 | 100.0% |
| Single Unit, Attached | 0 | 0.0% |
| 2 Unit Apartments | 0 | 0.0% |
| 3 or 4 Unit Apartments | 0 | 0.0% |
| 5 to 9 Unit Apartments | 0 | 0.0% |
| 10 or more Apartments | 0 | 0.0% |
| Mobile Home / Other | 0 | 0.0% |
| Total | 112 | 100.0% |
Housing Structures by Occupancy in New Hampshire
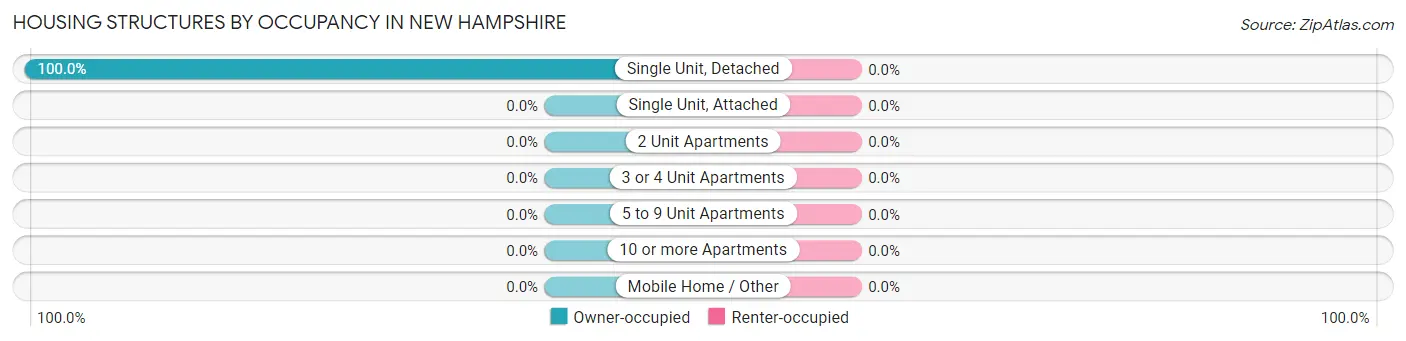
| Structure Type | Owner-occupied | Renter-occupied |
| Single Unit, Detached | 112 (100.0%) | 0 (0.0%) |
| Single Unit, Attached | 0 (0.0%) | 0 (0.0%) |
| 2 Unit Apartments | 0 (0.0%) | 0 (0.0%) |
| 3 or 4 Unit Apartments | 0 (0.0%) | 0 (0.0%) |
| 5 to 9 Unit Apartments | 0 (0.0%) | 0 (0.0%) |
| 10 or more Apartments | 0 (0.0%) | 0 (0.0%) |
| Mobile Home / Other | 0 (0.0%) | 0 (0.0%) |
| Total | 112 (100.0%) | 0 (0.0%) |
Housing Structures by Number of Rooms in New Hampshire
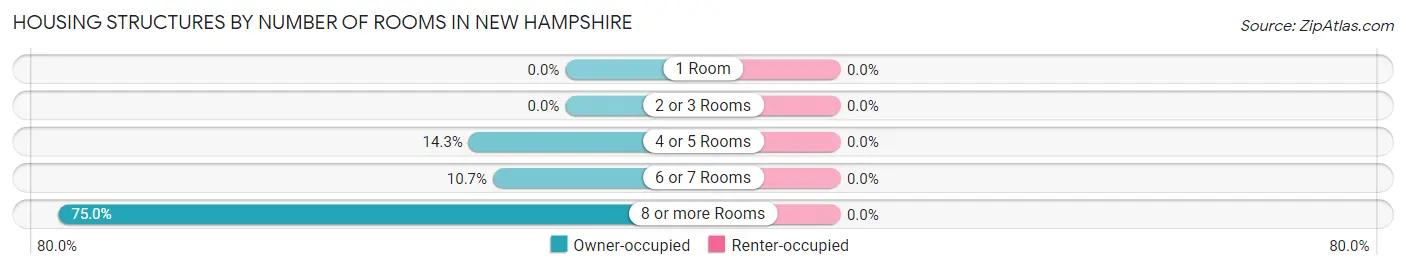
| Number of Rooms | Owner-occupied | Renter-occupied |
| 1 Room | 0 (0.0%) | 0 (0.0%) |
| 2 or 3 Rooms | 0 (0.0%) | 0 (0.0%) |
| 4 or 5 Rooms | 16 (14.3%) | 0 (0.0%) |
| 6 or 7 Rooms | 12 (10.7%) | 0 (0.0%) |
| 8 or more Rooms | 84 (75.0%) | 0 (0.0%) |
| Total | 112 (100.0%) | 0 (0.0%) |
Housing Structure by Heating Type in New Hampshire
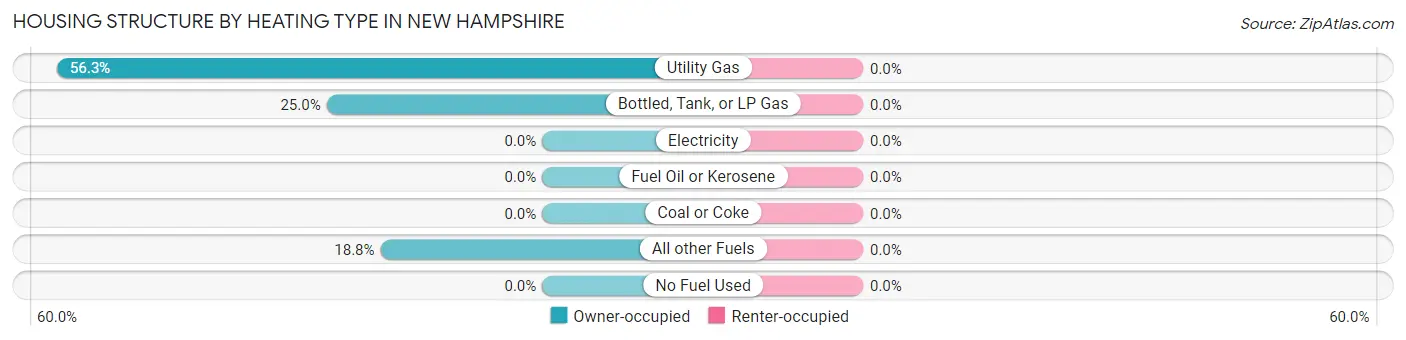
| Heating Type | Owner-occupied | Renter-occupied |
| Utility Gas | 63 (56.2%) | 0 (0.0%) |
| Bottled, Tank, or LP Gas | 28 (25.0%) | 0 (0.0%) |
| Electricity | 0 (0.0%) | 0 (0.0%) |
| Fuel Oil or Kerosene | 0 (0.0%) | 0 (0.0%) |
| Coal or Coke | 0 (0.0%) | 0 (0.0%) |
| All other Fuels | 21 (18.8%) | 0 (0.0%) |
| No Fuel Used | 0 (0.0%) | 0 (0.0%) |
| Total | 112 (100.0%) | 0 (0.0%) |
Household Vehicle Usage in New Hampshire
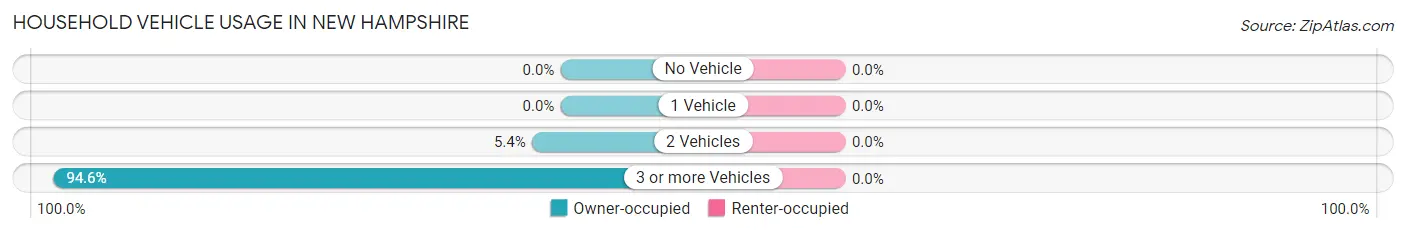
| Vehicles per Household | Owner-occupied | Renter-occupied |
| No Vehicle | 0 (0.0%) | 0 (0.0%) |
| 1 Vehicle | 0 (0.0%) | 0 (0.0%) |
| 2 Vehicles | 6 (5.4%) | 0 (0.0%) |
| 3 or more Vehicles | 106 (94.6%) | 0 (0.0%) |
| Total | 112 (100.0%) | 0 (0.0%) |
Real Estate & Mortgages in New Hampshire
Real Estate and Mortgage Overview in New Hampshire
| Characteristic | Without Mortgage | With Mortgage |
| Housing Units | 37 | 75 |
| Median Property Value | - | - |
| Median Household Income | $121,953 | $63 |
| Monthly Housing Costs | - | - |
| Real Estate Taxes | - | - |
Property Value by Mortgage Status in New Hampshire
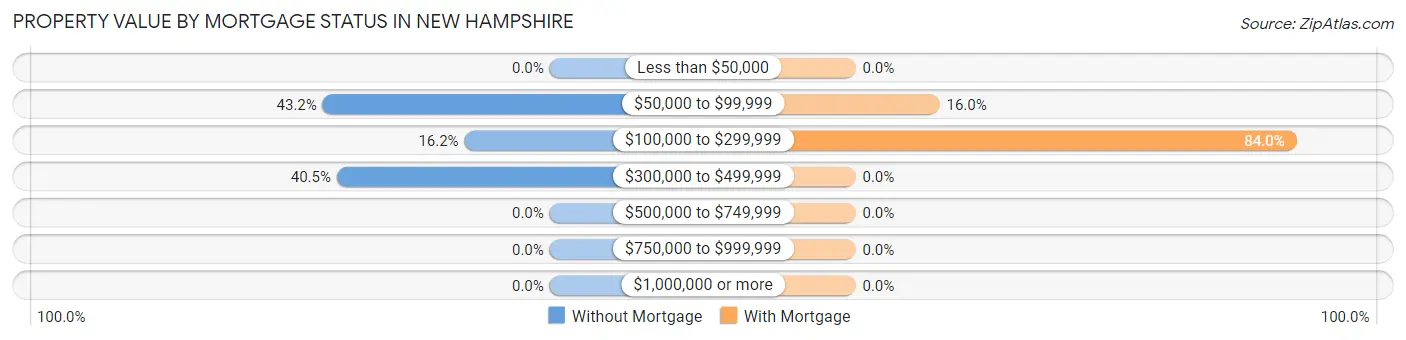
| Property Value | Without Mortgage | With Mortgage |
| Less than $50,000 | 0 (0.0%) | 0 (0.0%) |
| $50,000 to $99,999 | 16 (43.2%) | 12 (16.0%) |
| $100,000 to $299,999 | 6 (16.2%) | 63 (84.0%) |
| $300,000 to $499,999 | 15 (40.5%) | 0 (0.0%) |
| $500,000 to $749,999 | 0 (0.0%) | 0 (0.0%) |
| $750,000 to $999,999 | 0 (0.0%) | 0 (0.0%) |
| $1,000,000 or more | 0 (0.0%) | 0 (0.0%) |
| Total | 37 (100.0%) | 75 (100.0%) |
Household Income by Mortgage Status in New Hampshire
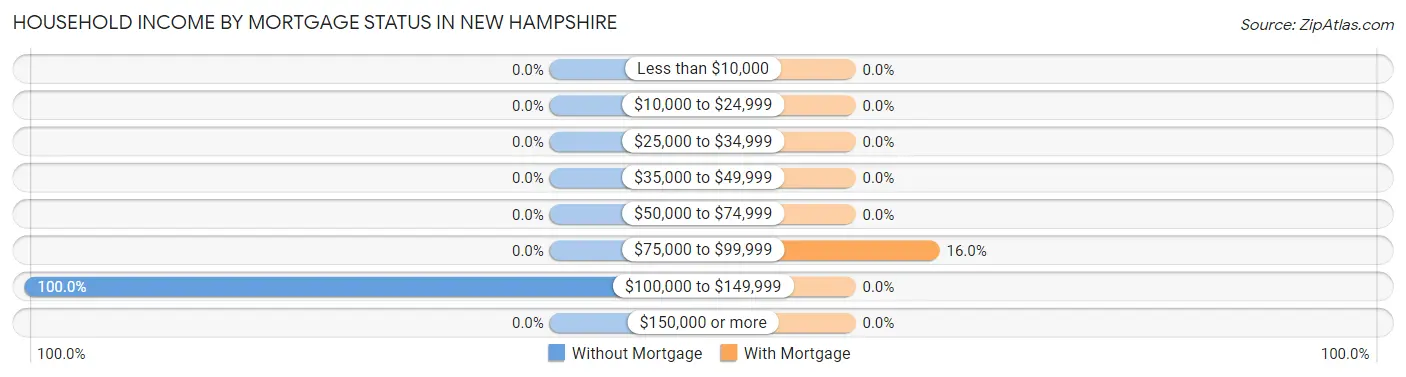
| Household Income | Without Mortgage | With Mortgage |
| Less than $10,000 | 0 (0.0%) | 0 (0.0%) |
| $10,000 to $24,999 | 0 (0.0%) | 0 (0.0%) |
| $25,000 to $34,999 | 0 (0.0%) | 0 (0.0%) |
| $35,000 to $49,999 | 0 (0.0%) | 0 (0.0%) |
| $50,000 to $74,999 | 0 (0.0%) | 0 (0.0%) |
| $75,000 to $99,999 | 0 (0.0%) | 12 (16.0%) |
| $100,000 to $149,999 | 37 (100.0%) | 0 (0.0%) |
| $150,000 or more | 0 (0.0%) | 0 (0.0%) |
| Total | 37 (100.0%) | 75 (100.0%) |
Property Value to Household Income Ratio in New Hampshire
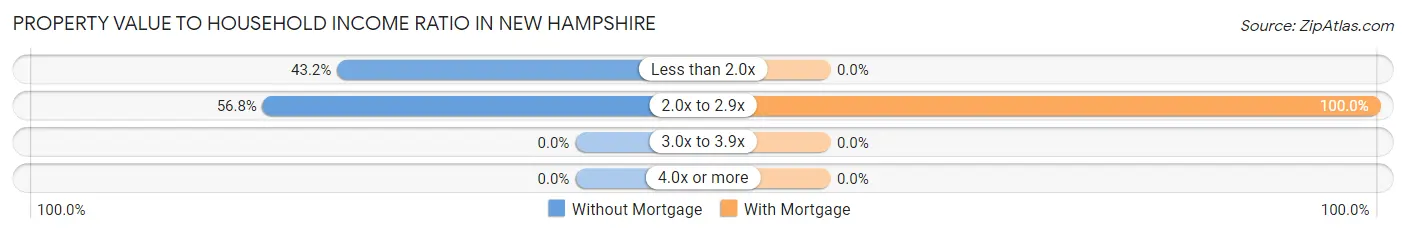
| Value-to-Income Ratio | Without Mortgage | With Mortgage |
| Less than 2.0x | 16 (43.2%) | 0 (0.0%) |
| 2.0x to 2.9x | 21 (56.8%) | 75 (100.0%) |
| 3.0x to 3.9x | 0 (0.0%) | 0 (0.0%) |
| 4.0x or more | 0 (0.0%) | 0 (0.0%) |
| Total | 37 (100.0%) | 75 (100.0%) |
Real Estate Taxes by Mortgage Status in New Hampshire
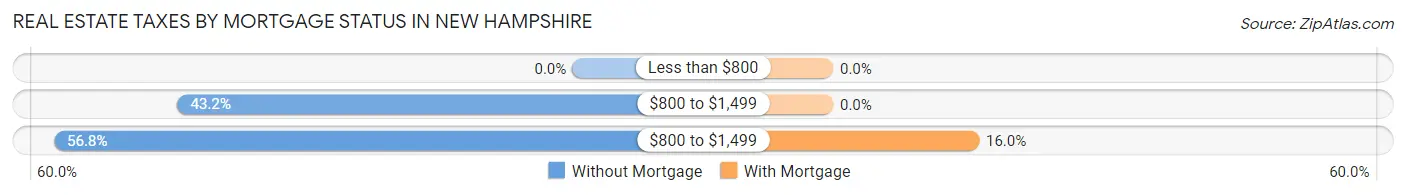
| Property Taxes | Without Mortgage | With Mortgage |
| Less than $800 | 0 (0.0%) | 0 (0.0%) |
| $800 to $1,499 | 16 (43.2%) | 0 (0.0%) |
| $800 to $1,499 | 21 (56.8%) | 12 (16.0%) |
| Total | 37 (100.0%) | 75 (100.0%) |
Health & Disability in New Hampshire
Health Insurance Coverage by Age in New Hampshire
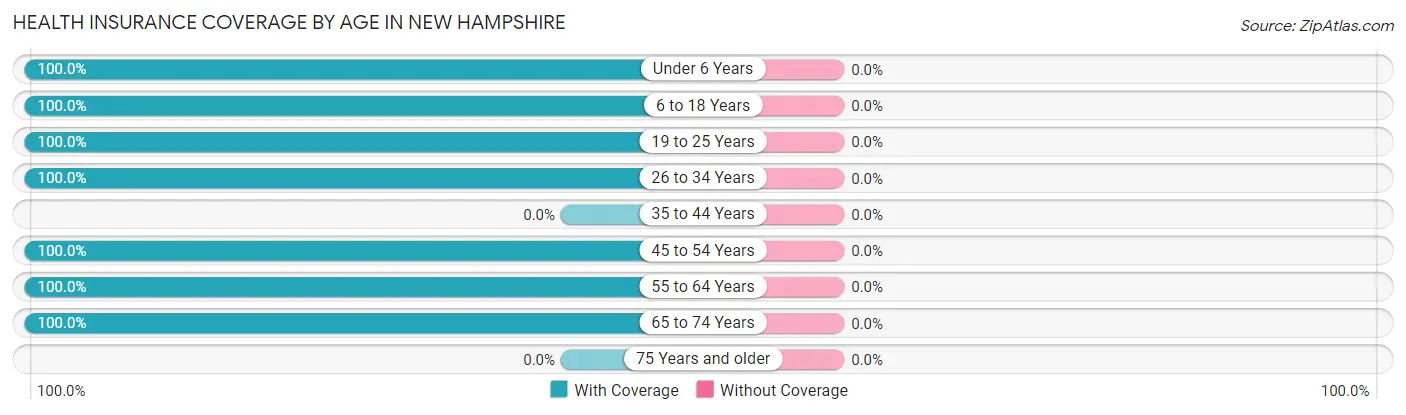
| Age Bracket | With Coverage | Without Coverage |
| Under 6 Years | 45 (100.0%) | 0 (0.0%) |
| 6 to 18 Years | 146 (100.0%) | 0 (0.0%) |
| 19 to 25 Years | 11 (100.0%) | 0 (0.0%) |
| 26 to 34 Years | 38 (100.0%) | 0 (0.0%) |
| 35 to 44 Years | 0 (0.0%) | 0 (0.0%) |
| 45 to 54 Years | 166 (100.0%) | 0 (0.0%) |
| 55 to 64 Years | 27 (100.0%) | 0 (0.0%) |
| 65 to 74 Years | 16 (100.0%) | 0 (0.0%) |
| 75 Years and older | 0 (0.0%) | 0 (0.0%) |
| Total | 449 (100.0%) | 0 (0.0%) |
Health Insurance Coverage by Citizenship Status in New Hampshire
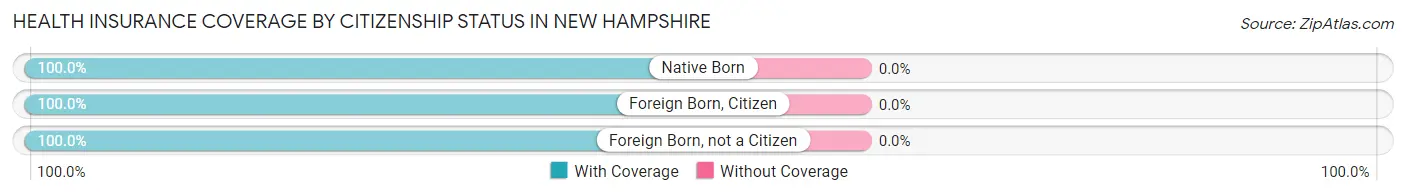
| Citizenship Status | With Coverage | Without Coverage |
| Native Born | 45 (100.0%) | 0 (0.0%) |
| Foreign Born, Citizen | 146 (100.0%) | 0 (0.0%) |
| Foreign Born, not a Citizen | 11 (100.0%) | 0 (0.0%) |
Health Insurance Coverage by Household Income in New Hampshire
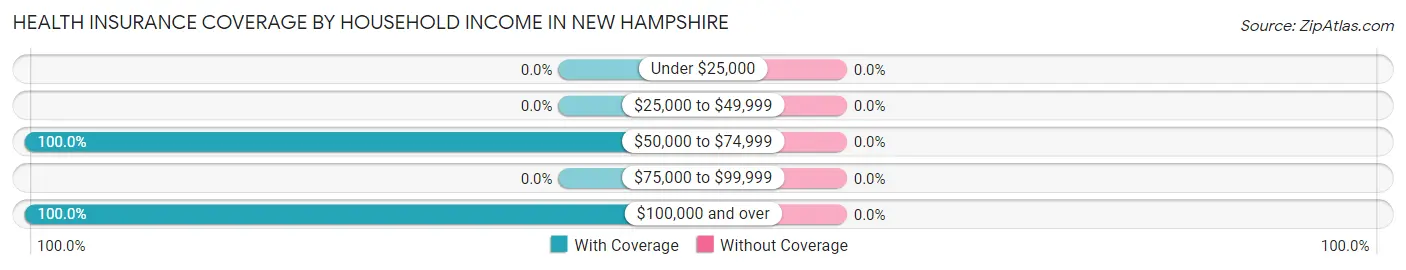
| Household Income | With Coverage | Without Coverage |
| Under $25,000 | 0 (0.0%) | 0 (0.0%) |
| $25,000 to $49,999 | 0 (0.0%) | 0 (0.0%) |
| $50,000 to $74,999 | 69 (100.0%) | 0 (0.0%) |
| $75,000 to $99,999 | 0 (0.0%) | 0 (0.0%) |
| $100,000 and over | 380 (100.0%) | 0 (0.0%) |
Public vs Private Health Insurance Coverage by Age in New Hampshire
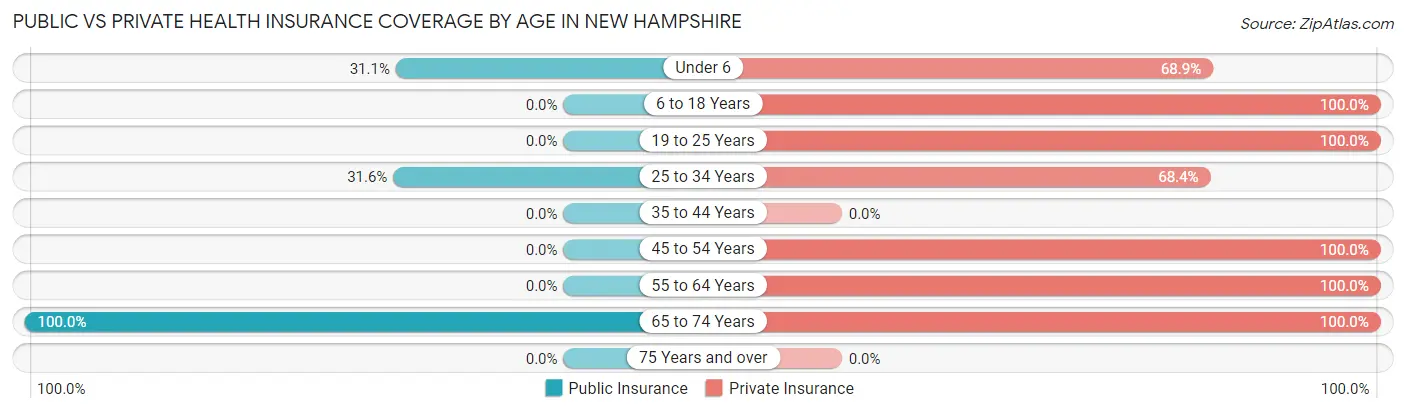
| Age Bracket | Public Insurance | Private Insurance |
| Under 6 | 14 (31.1%) | 31 (68.9%) |
| 6 to 18 Years | 0 (0.0%) | 146 (100.0%) |
| 19 to 25 Years | 0 (0.0%) | 11 (100.0%) |
| 25 to 34 Years | 12 (31.6%) | 26 (68.4%) |
| 35 to 44 Years | 0 (0.0%) | 0 (0.0%) |
| 45 to 54 Years | 0 (0.0%) | 166 (100.0%) |
| 55 to 64 Years | 0 (0.0%) | 27 (100.0%) |
| 65 to 74 Years | 16 (100.0%) | 16 (100.0%) |
| 75 Years and over | 0 (0.0%) | 0 (0.0%) |
| Total | 42 (9.3%) | 423 (94.2%) |
Disability Status by Sex by Age in New Hampshire
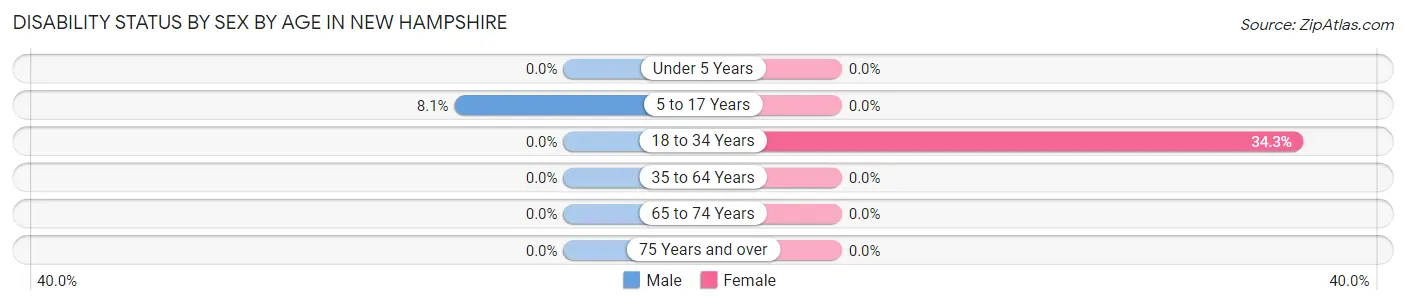
| Age Bracket | Male | Female |
| Under 5 Years | 0 (0.0%) | 0 (0.0%) |
| 5 to 17 Years | 14 (8.1%) | 0 (0.0%) |
| 18 to 34 Years | 0 (0.0%) | 12 (34.3%) |
| 35 to 64 Years | 0 (0.0%) | 0 (0.0%) |
| 65 to 74 Years | 0 (0.0%) | 0 (0.0%) |
| 75 Years and over | 0 (0.0%) | 0 (0.0%) |
Disability Class by Sex by Age in New Hampshire
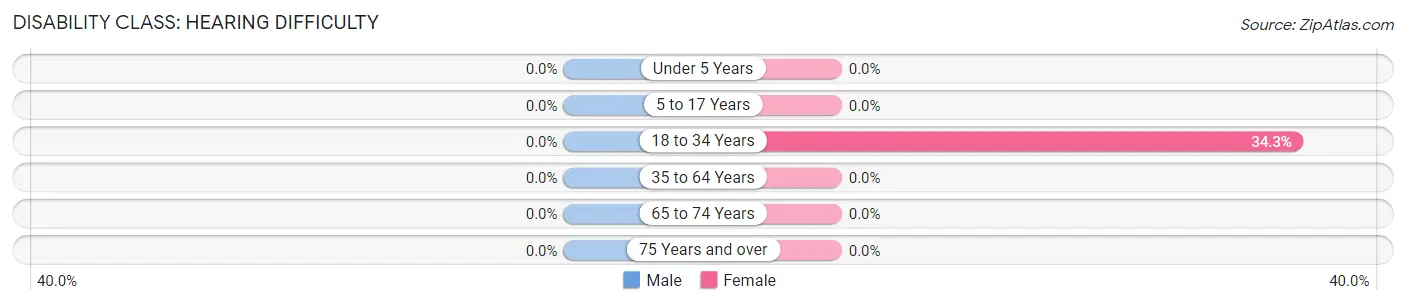
Disability Class: Hearing Difficulty
| Age Bracket | Male | Female |
| Under 5 Years | 0 (0.0%) | 0 (0.0%) |
| 5 to 17 Years | 0 (0.0%) | 0 (0.0%) |
| 18 to 34 Years | 0 (0.0%) | 12 (34.3%) |
| 35 to 64 Years | 0 (0.0%) | 0 (0.0%) |
| 65 to 74 Years | 0 (0.0%) | 0 (0.0%) |
| 75 Years and over | 0 (0.0%) | 0 (0.0%) |
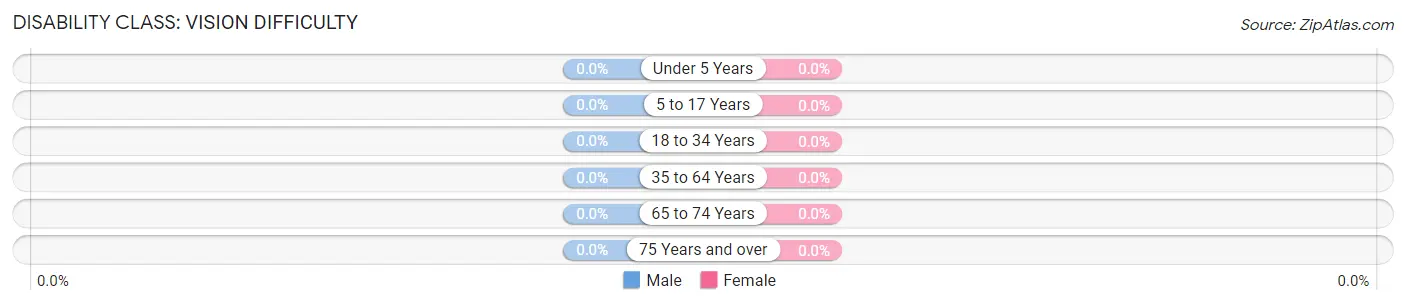
Disability Class: Vision Difficulty
| Age Bracket | Male | Female |
| Under 5 Years | 0 (0.0%) | 0 (0.0%) |
| 5 to 17 Years | 0 (0.0%) | 0 (0.0%) |
| 18 to 34 Years | 0 (0.0%) | 0 (0.0%) |
| 35 to 64 Years | 0 (0.0%) | 0 (0.0%) |
| 65 to 74 Years | 0 (0.0%) | 0 (0.0%) |
| 75 Years and over | 0 (0.0%) | 0 (0.0%) |
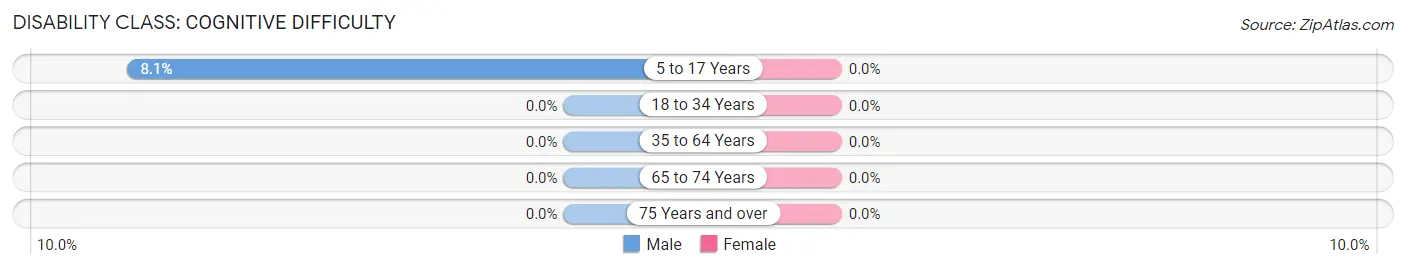
Disability Class: Cognitive Difficulty
| Age Bracket | Male | Female |
| 5 to 17 Years | 14 (8.1%) | 0 (0.0%) |
| 18 to 34 Years | 0 (0.0%) | 0 (0.0%) |
| 35 to 64 Years | 0 (0.0%) | 0 (0.0%) |
| 65 to 74 Years | 0 (0.0%) | 0 (0.0%) |
| 75 Years and over | 0 (0.0%) | 0 (0.0%) |
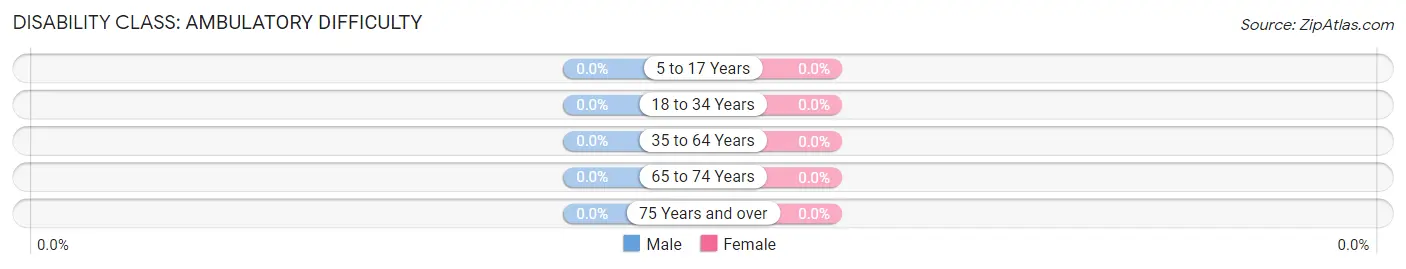
Disability Class: Ambulatory Difficulty
| Age Bracket | Male | Female |
| 5 to 17 Years | 0 (0.0%) | 0 (0.0%) |
| 18 to 34 Years | 0 (0.0%) | 0 (0.0%) |
| 35 to 64 Years | 0 (0.0%) | 0 (0.0%) |
| 65 to 74 Years | 0 (0.0%) | 0 (0.0%) |
| 75 Years and over | 0 (0.0%) | 0 (0.0%) |
Disability Class: Self-Care Difficulty
| Age Bracket | Male | Female |
| 5 to 17 Years | 0 (0.0%) | 0 (0.0%) |
| 18 to 34 Years | 0 (0.0%) | 0 (0.0%) |
| 35 to 64 Years | 0 (0.0%) | 0 (0.0%) |
| 65 to 74 Years | 0 (0.0%) | 0 (0.0%) |
| 75 Years and over | 0 (0.0%) | 0 (0.0%) |
Technology Access in New Hampshire
Computing Device Access in New Hampshire
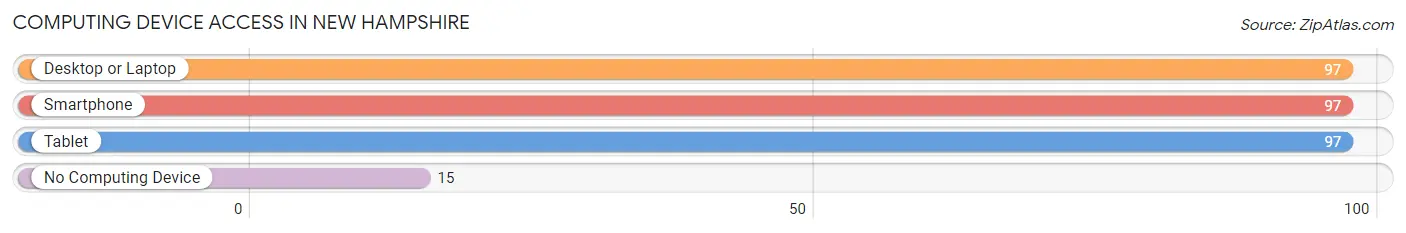
| Device Type | # Households | % Households |
| Desktop or Laptop | 97 | 86.6% |
| Smartphone | 97 | 86.6% |
| Tablet | 97 | 86.6% |
| No Computing Device | 15 | 13.4% |
| Total | 112 | 100.0% |
Internet Access in New Hampshire
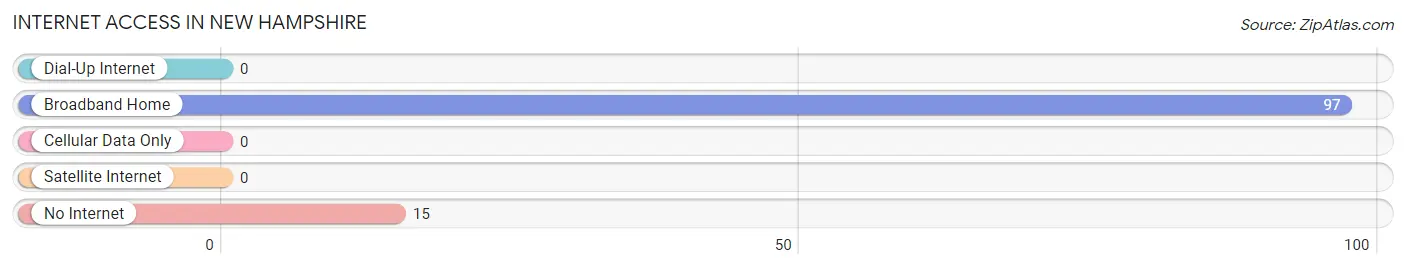
| Internet Type | # Households | % Households |
| Dial-Up Internet | 0 | 0.0% |
| Broadband Home | 97 | 86.6% |
| Cellular Data Only | 0 | 0.0% |
| Satellite Internet | 0 | 0.0% |
| No Internet | 15 | 13.4% |
| Total | 112 | 100.0% |
New Hampshire Summary
New Hampshire is a state located in the New England region of the northeastern United States. It is bordered by Massachusetts to the south, Vermont to the west, Maine and the Atlantic Ocean to the east, and the Canadian province of Quebec to the north. New Hampshire is the 5th smallest by area and the 10th least populous of the 50 states. In January 1776, it became the first of the British North American colonies to establish a government independent of the Kingdom of Great Britain's authority, and it was one of the original 13 states that founded the United States of America.
History
The first inhabitants of New Hampshire were Native Americans, including the Abenaki, Pennacook, and Sokoki. The first European to explore the area was Martin Pring in 1603. The first permanent settlement was established in 1623 at Odiorne's Point in Rye. The first English settlers arrived in 1629 and established the town of Dover. The first permanent settlement in the White Mountains was established in 1769 at Waterville Valley.
New Hampshire was one of the original 13 colonies and was the ninth state to ratify the United States Constitution on June 21, 1788, becoming the first state to do so. During the American Revolution, New Hampshire was the first colony to declare its independence from Great Britain.
Geography
New Hampshire is located in the New England region of the northeastern United States. It is bordered by Massachusetts to the south, Vermont to the west, Maine and the Atlantic Ocean to the east, and the Canadian province of Quebec to the north. The state has a total area of 9,349 square miles, making it the 5th smallest state in the country.
The White Mountains are a major feature of the state, with Mount Washington, the highest peak in the northeastern United States, located in the center of the range. The state also has several major rivers, including the Merrimack, Pemigewasset, and Connecticut.
Economy
New Hampshire's economy is largely based on services, manufacturing, and tourism. The state is home to several major companies, including BAE Systems, Fidelity Investments, and Stonyfield Farm.
The state's largest industries are manufacturing, health care, and tourism. Manufacturing accounts for about 20% of the state's GDP, with products such as electronics, machinery, and paper products. Health care is the second largest industry, accounting for about 15% of the state's GDP. Tourism is also a major industry, with visitors spending over $4 billion annually.
Demographics
As of the 2010 census, the population of New Hampshire was 1,316,470, making it the 10th least populous state in the country. The population is largely concentrated in the southern part of the state, with the largest cities being Manchester, Nashua, and Concord.
The racial makeup of the state is 92.2% White, 2.9% Hispanic or Latino, 2.2% Asian, 1.2% African American, and 0.5% Native American. The median household income is $68,485, and the median age is 42.7 years.
New Hampshire is the least populous state in the country with no significant racial or ethnic minority population. The state is also the second least densely populated state in the country, with a population density of only 147 people per square mile.
Common Questions
What is the Total Population of New Hampshire?
Total Population of New Hampshire is 449.
What is the Total Male Population of New Hampshire?
Total Male Population of New Hampshire is 295.
What is the Total Female Population of New Hampshire?
Total Female Population of New Hampshire is 154.
What is the Ratio of Males per 100 Females in New Hampshire?
There are 191.56 Males per 100 Females in New Hampshire.
What is the Ratio of Females per 100 Males in New Hampshire?
There are 52.20 Females per 100 Males in New Hampshire.
What is the Median Population Age in New Hampshire?
Median Population Age in New Hampshire is 31.9 Years.
What is the Average Family Size in New Hampshire
Average Family Size in New Hampshire is 4.0 People.
What is the Average Household Size in New Hampshire
Average Household Size in New Hampshire is 4.0 People.
What is Per Capita Income in New Hampshire?
Per Capita income in New Hampshire is $34,827.
What is the Median Family Income in New Hampshire?
Median Family Income in New Hampshire is $150,278.
What is the Median Household income in New Hampshire?
Median Household Income in New Hampshire is $150,278.
What is Income or Wage Gap in New Hampshire?
Income or Wage Gap in New Hampshire is 4.7%.
Women in New Hampshire earn 95.3 cents for every dollar earned by a man.
What is Inequality or Gini Index in New Hampshire?
Inequality or Gini Index in New Hampshire is 0.10.
How Large is the Labor Force in New Hampshire?
There are 246 People in the Labor Forcein in New Hampshire.
What is the Percentage of People in the Labor Force in New Hampshire?
95.3% of People are in the Labor Force in New Hampshire.
What is the Unemployment Rate in New Hampshire?
Unemployment Rate in New Hampshire is 35.0%.