Holiday Lakes, OH
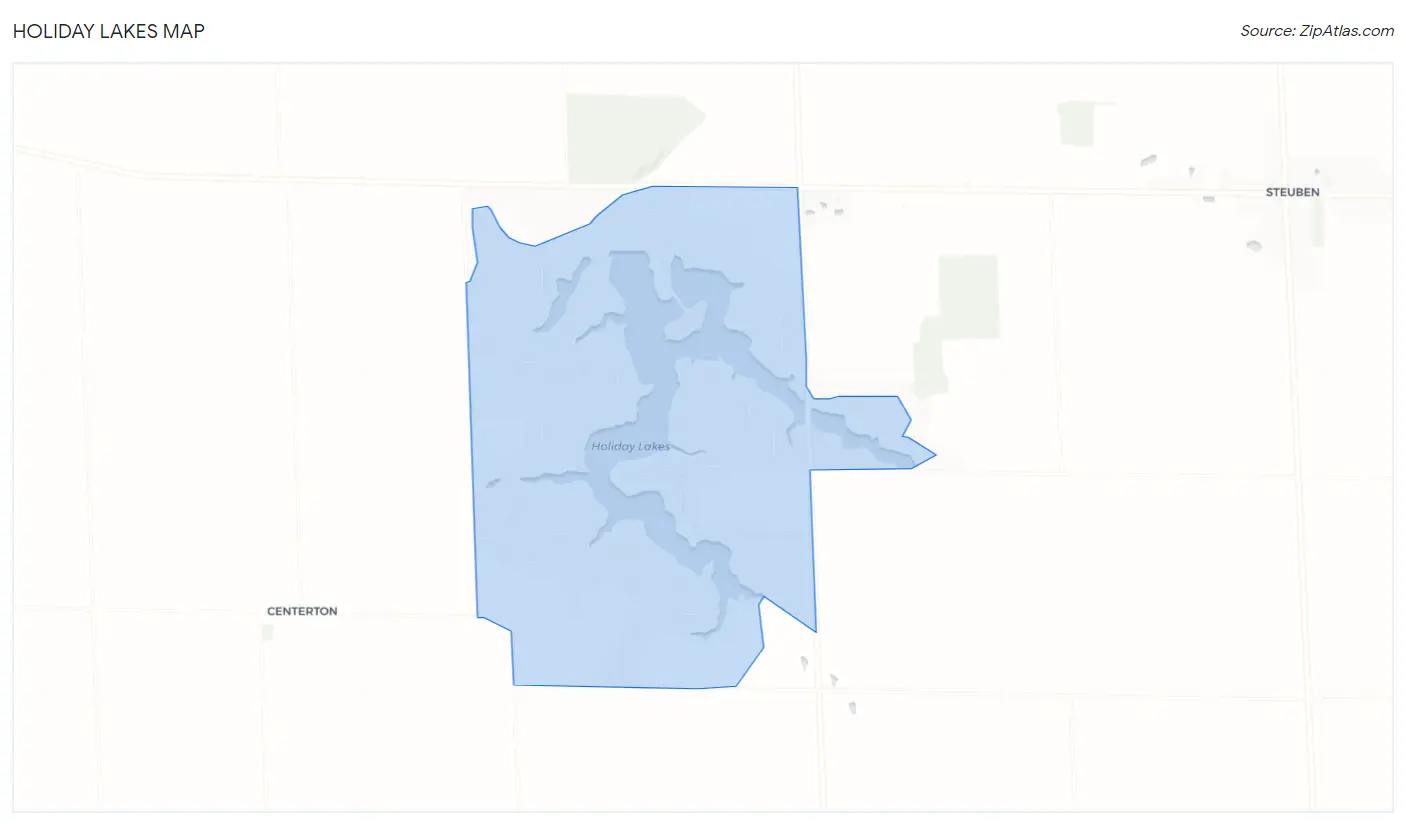
Holiday Lakes Map
Holiday Lakes Overview
700
TOTAL POPULATION
377
MALE POPULATION
323
FEMALE POPULATION
116.72
MALES / 100 FEMALES
85.68
FEMALES / 100 MALES
52.0
MEDIAN AGE
2.4
AVG FAMILY SIZE
2.4
AVG HOUSEHOLD SIZE
$52,806
PER CAPITA INCOME
$97,679
AVG FAMILY INCOME
$122,188
AVG HOUSEHOLD INCOME
0.30
INEQUALITY / GINI INDEX
452
LABOR FORCE [ PEOPLE ]
73.4%
PERCENT IN LABOR FORCE
Race in Holiday Lakes
The most populous races in Holiday Lakes are White / Caucasian (661 | 94.4%), and Two or more Races (39 | 5.6%).
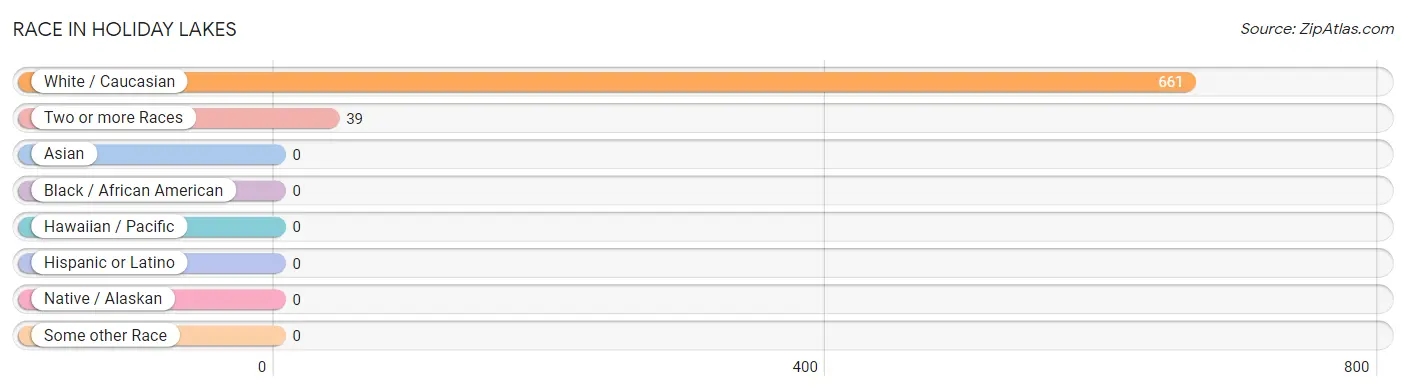
| Race | # Population | % Population |
| Asian | 0 | 0.0% |
| Black / African American | 0 | 0.0% |
| Hawaiian / Pacific | 0 | 0.0% |
| Hispanic or Latino | 0 | 0.0% |
| Native / Alaskan | 0 | 0.0% |
| White / Caucasian | 661 | 94.4% |
| Two or more Races | 39 | 5.6% |
| Some other Race | 0 | 0.0% |
| Total | 700 | 100.0% |
Ancestry in Holiday Lakes
The most populous ancestries reported in Holiday Lakes are German (253 | 36.1%), Dutch (59 | 8.4%), American (46 | 6.6%), English (39 | 5.6%), and Irish (32 | 4.6%), together accounting for 61.3% of all Holiday Lakes residents.
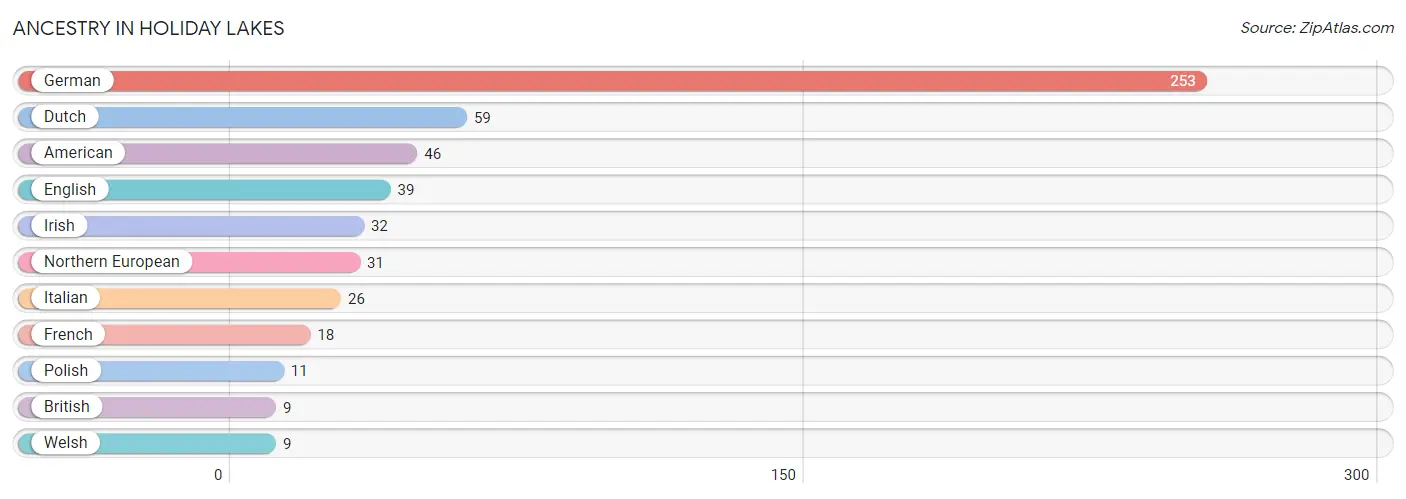
| Ancestry | # Population | % Population |
| American | 46 | 6.6% |
| British | 9 | 1.3% |
| Dutch | 59 | 8.4% |
| English | 39 | 5.6% |
| French | 18 | 2.6% |
| German | 253 | 36.1% |
| Irish | 32 | 4.6% |
| Italian | 26 | 3.7% |
| Northern European | 31 | 4.4% |
| Polish | 11 | 1.6% |
| Welsh | 9 | 1.3% | View All 11 Rows |
Immigrants in Holiday Lakes

| Immigration Origin | # Population | % Population | View All 0 Rows |
Sex and Age in Holiday Lakes
Sex and Age in Holiday Lakes
The most populous age groups in Holiday Lakes are 50 to 54 Years (131 | 34.7%) for men and 55 to 59 Years (65 | 20.1%) for women.
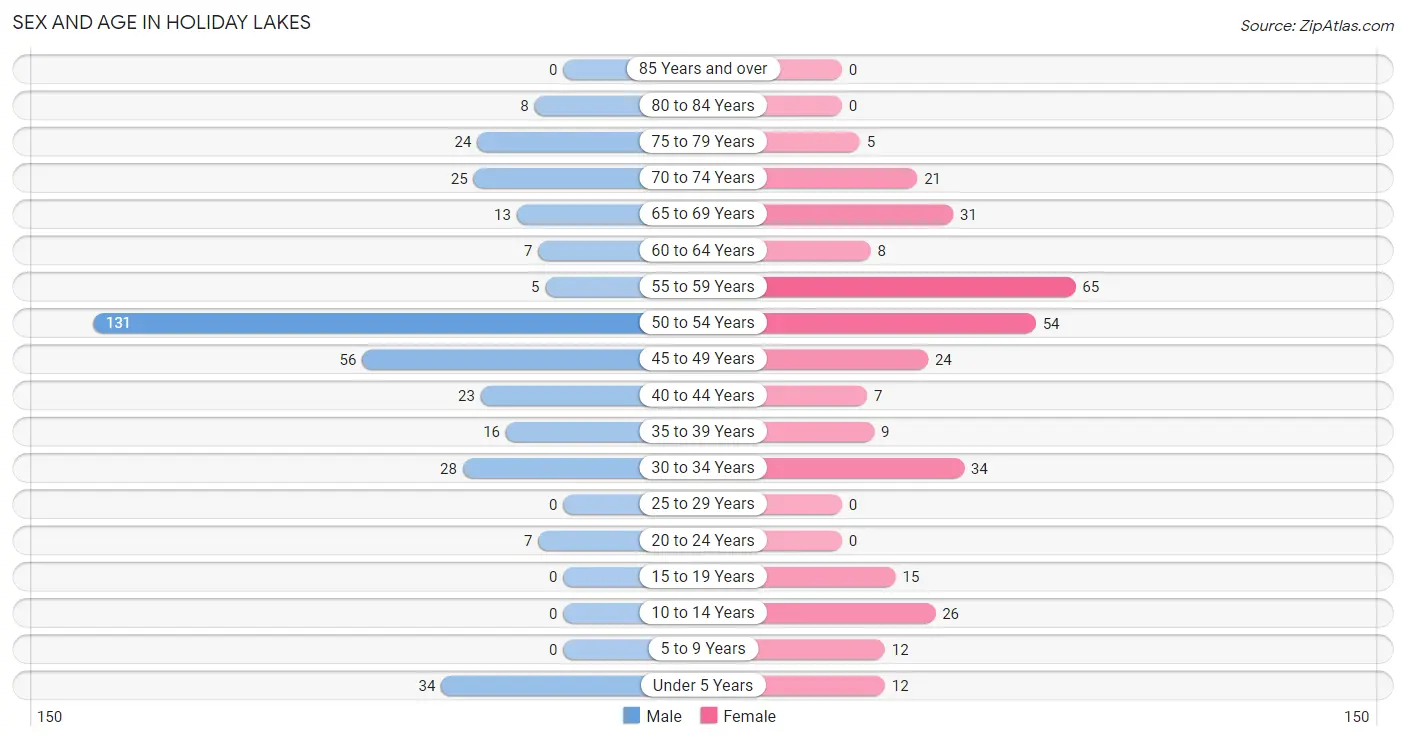
| Age Bracket | Male | Female |
| Under 5 Years | 34 (9.0%) | 12 (3.7%) |
| 5 to 9 Years | 0 (0.0%) | 12 (3.7%) |
| 10 to 14 Years | 0 (0.0%) | 26 (8.1%) |
| 15 to 19 Years | 0 (0.0%) | 15 (4.6%) |
| 20 to 24 Years | 7 (1.9%) | 0 (0.0%) |
| 25 to 29 Years | 0 (0.0%) | 0 (0.0%) |
| 30 to 34 Years | 28 (7.4%) | 34 (10.5%) |
| 35 to 39 Years | 16 (4.2%) | 9 (2.8%) |
| 40 to 44 Years | 23 (6.1%) | 7 (2.2%) |
| 45 to 49 Years | 56 (14.8%) | 24 (7.4%) |
| 50 to 54 Years | 131 (34.7%) | 54 (16.7%) |
| 55 to 59 Years | 5 (1.3%) | 65 (20.1%) |
| 60 to 64 Years | 7 (1.9%) | 8 (2.5%) |
| 65 to 69 Years | 13 (3.5%) | 31 (9.6%) |
| 70 to 74 Years | 25 (6.6%) | 21 (6.5%) |
| 75 to 79 Years | 24 (6.4%) | 5 (1.5%) |
| 80 to 84 Years | 8 (2.1%) | 0 (0.0%) |
| 85 Years and over | 0 (0.0%) | 0 (0.0%) |
| Total | 377 (100.0%) | 323 (100.0%) |
Families and Households in Holiday Lakes
Median Family Size in Holiday Lakes
The median family size in Holiday Lakes is 2.44 persons per family, with single male/father families (7 | 2.9%) accounting for the largest median family size of 3.14 persons per family. On the other hand, single female/mother families (15 | 6.3%) represent the smallest median family size with 2.20 persons per family.
| Family Type | # Families | Family Size |
| Married-Couple | 215 (90.7%) | 2.43 |
| Single Male/Father | 7 (2.9%) | 3.14 |
| Single Female/Mother | 15 (6.3%) | 2.20 |
| Total Families | 237 (100.0%) | 2.44 |
Median Household Size in Holiday Lakes
The median household size in Holiday Lakes is 2.35 persons per household, with single male/father households (7 | 2.4%) accounting for the largest median household size of 3.14 persons per household. non-family households (61 | 20.5%) represent the smallest median household size with 2.00 persons per household.
| Household Type | # Households | Household Size |
| Married-Couple | 215 (72.2%) | 2.43 |
| Single Male/Father | 7 (2.4%) | 3.14 |
| Single Female/Mother | 15 (5.0%) | 2.20 |
| Non-family | 61 (20.5%) | 2.00 |
| Total Households | 298 (100.0%) | 2.35 |
Household Size by Marriage Status in Holiday Lakes
Out of a total of 298 households in Holiday Lakes, 237 (79.5%) are family households, while 61 (20.5%) are nonfamily households. The most numerous type of family households are 2-person households, comprising 181, and the most common type of nonfamily households are 2-person households, comprising 61.
| Household Size | Family Households | Nonfamily Households |
| 1-Person Households | - | 0 (0.0%) |
| 2-Person Households | 181 (60.7%) | 61 (20.5%) |
| 3-Person Households | 22 (7.4%) | 0 (0.0%) |
| 4-Person Households | 26 (8.7%) | 0 (0.0%) |
| 5-Person Households | 8 (2.7%) | 0 (0.0%) |
| 6-Person Households | 0 (0.0%) | 0 (0.0%) |
| 7+ Person Households | 0 (0.0%) | 0 (0.0%) |
| Total | 237 (79.5%) | 61 (20.5%) |
Female Fertility in Holiday Lakes
Fertility by Age in Holiday Lakes
| Age Bracket | Women with Births | Births / 1,000 Women |
| 15 to 19 years | 0 (0.0%) | 0.0 |
| 20 to 34 years | 0 (0.0%) | 0.0 |
| 35 to 50 years | 0 (0.0%) | 0.0 |
| Total | 0 (0.0%) | 0.0 |
Fertility by Age by Marriage Status in Holiday Lakes
| Age Bracket | Married | Unmarried |
| 15 to 19 years | 0 (0.0%) | 0 (0.0%) |
| 20 to 34 years | 0 (0.0%) | 0 (0.0%) |
| 35 to 50 years | 0 (0.0%) | 0 (0.0%) |
| Total | 0 (0.0%) | 0 (0.0%) |
Fertility by Education in Holiday Lakes
| Educational Attainment | Women with Births | Births / 1,000 Women |
| Less than High School | 0 (0.0%) | 0.0 |
| High School Diploma | 0 (0.0%) | 0.0 |
| College or Associate's Degree | 0 (0.0%) | 0.0 |
| Bachelor's Degree | 0 (0.0%) | 0.0 |
| Graduate Degree | 0 (0.0%) | 0.0 |
| Total | 0 (0.0%) | 0.0 |
Fertility by Education by Marriage Status in Holiday Lakes
| Educational Attainment | Married | Unmarried |
| Less than High School | 0 (0.0%) | 0 (0.0%) |
| High School Diploma | 0 (0.0%) | 0 (0.0%) |
| College or Associate's Degree | 0 (0.0%) | 0 (0.0%) |
| Bachelor's Degree | 0 (0.0%) | 0 (0.0%) |
| Graduate Degree | 0 (0.0%) | 0 (0.0%) |
| Total | 0 (0.0%) | 0 (0.0%) |
Income in Holiday Lakes
Income Overview in Holiday Lakes
Per Capita Income in Holiday Lakes is $52,806, while median incomes of families and households are $97,679 and $122,188 respectively.
| Characteristic | Number | Measure |
| Per Capita Income | 700 | $52,806 |
| Median Family Income | 237 | $97,679 |
| Mean Family Income | 237 | $113,554 |
| Median Household Income | 298 | $122,188 |
| Mean Household Income | 298 | $122,696 |
| Income Deficit | 237 | $0 |
| Wage / Income Gap (%) | 700 | 0.00% |
| Wage / Income Gap ($) | 700 | 100.00¢ per $1 |
| Gini / Inequality Index | 700 | 0.30 |
Earnings by Sex in Holiday Lakes
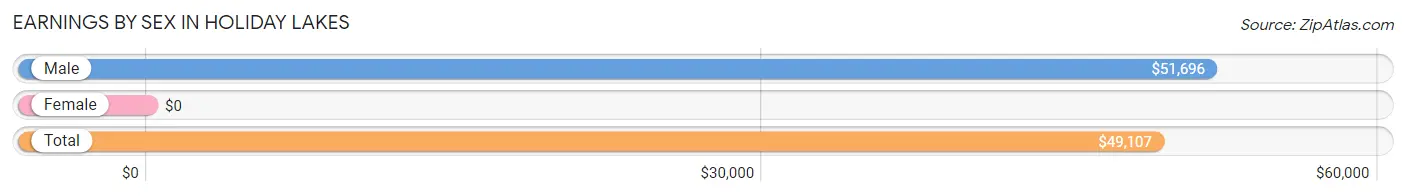
| Sex | Number | Average Earnings |
| Male | 276 (56.9%) | $51,696 |
| Female | 209 (43.1%) | $0 |
| Total | 485 (100.0%) | $49,107 |
Earnings by Sex by Income Bracket in Holiday Lakes
The most common earnings brackets in Holiday Lakes are $35,000 to $39,999 for men (79 | 28.6%) and $25,000 to $29,999 for women (70 | 33.5%).
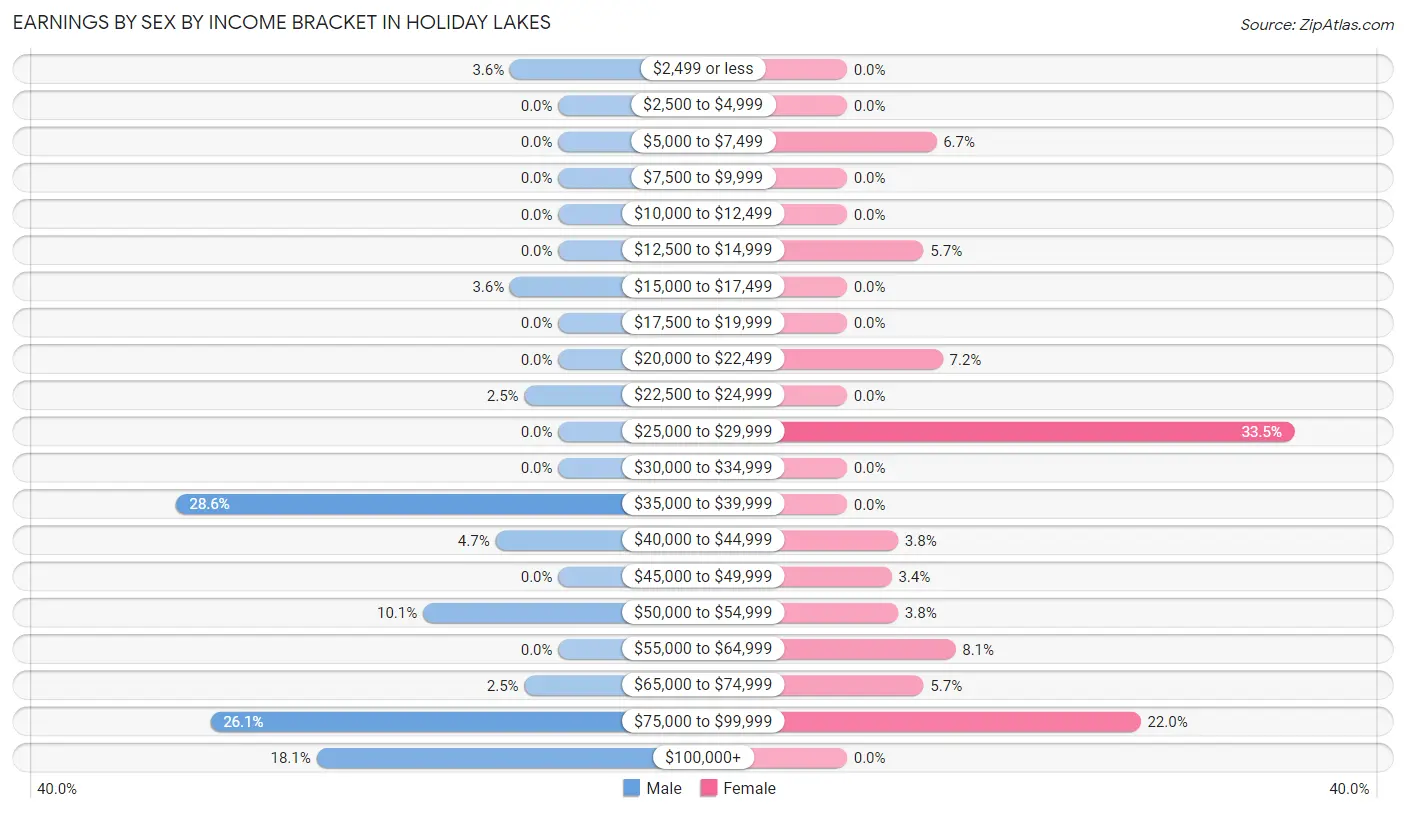
| Income | Male | Female |
| $2,499 or less | 10 (3.6%) | 0 (0.0%) |
| $2,500 to $4,999 | 0 (0.0%) | 0 (0.0%) |
| $5,000 to $7,499 | 0 (0.0%) | 14 (6.7%) |
| $7,500 to $9,999 | 0 (0.0%) | 0 (0.0%) |
| $10,000 to $12,499 | 0 (0.0%) | 0 (0.0%) |
| $12,500 to $14,999 | 0 (0.0%) | 12 (5.7%) |
| $15,000 to $17,499 | 10 (3.6%) | 0 (0.0%) |
| $17,500 to $19,999 | 0 (0.0%) | 0 (0.0%) |
| $20,000 to $22,499 | 0 (0.0%) | 15 (7.2%) |
| $22,500 to $24,999 | 7 (2.5%) | 0 (0.0%) |
| $25,000 to $29,999 | 0 (0.0%) | 70 (33.5%) |
| $30,000 to $34,999 | 0 (0.0%) | 0 (0.0%) |
| $35,000 to $39,999 | 79 (28.6%) | 0 (0.0%) |
| $40,000 to $44,999 | 13 (4.7%) | 8 (3.8%) |
| $45,000 to $49,999 | 0 (0.0%) | 7 (3.4%) |
| $50,000 to $54,999 | 28 (10.1%) | 8 (3.8%) |
| $55,000 to $64,999 | 0 (0.0%) | 17 (8.1%) |
| $65,000 to $74,999 | 7 (2.5%) | 12 (5.7%) |
| $75,000 to $99,999 | 72 (26.1%) | 46 (22.0%) |
| $100,000+ | 50 (18.1%) | 0 (0.0%) |
| Total | 276 (100.0%) | 209 (100.0%) |
Earnings by Sex by Educational Attainment in Holiday Lakes
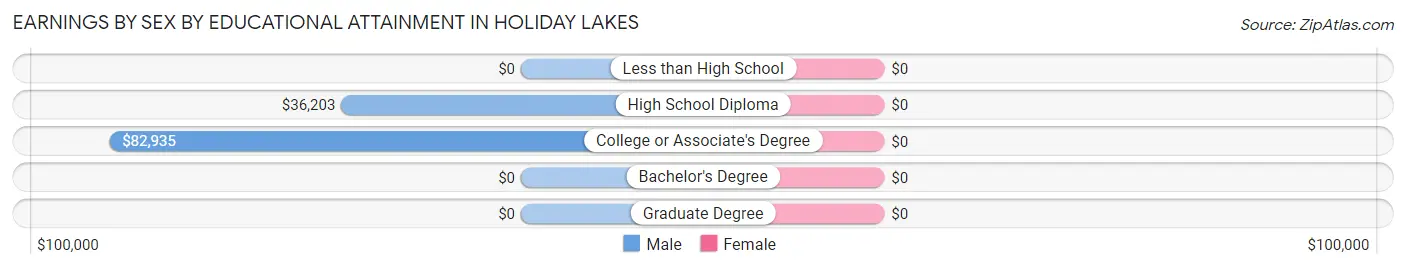
| Educational Attainment | Male Income | Female Income |
| Less than High School | - | - |
| High School Diploma | $36,203 | $0 |
| College or Associate's Degree | $82,935 | $0 |
| Bachelor's Degree | - | - |
| Graduate Degree | - | - |
| Total | $51,384 | $0 |
Family Income in Holiday Lakes
Family Income Brackets in Holiday Lakes
According to the Holiday Lakes family income data, there are 65 families falling into the $50,000 to $74,999 income range, which is the most common income bracket and makes up 27.4% of all families.
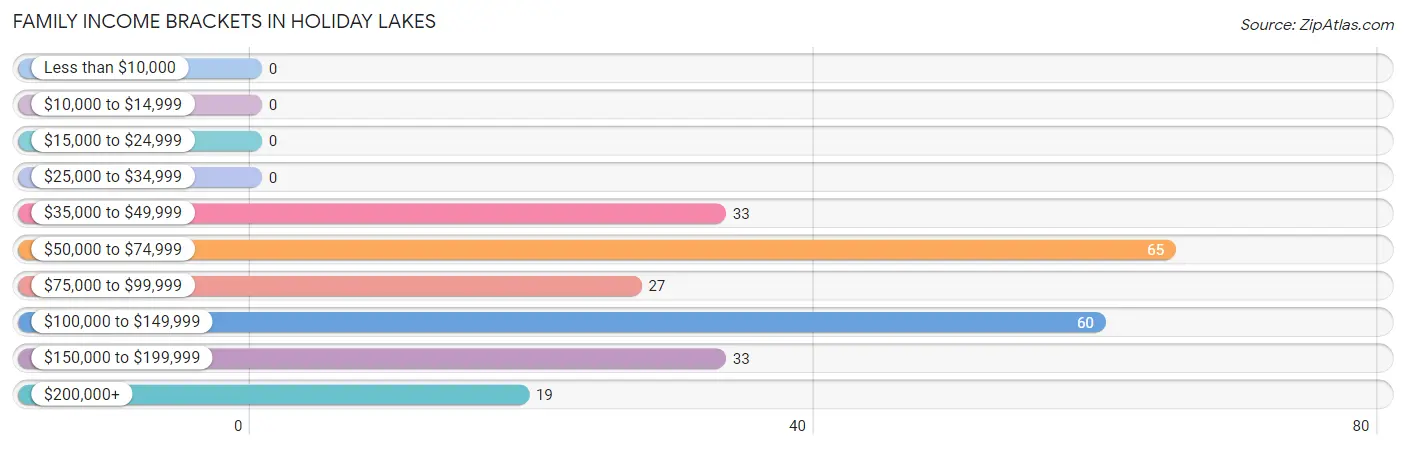
| Income Bracket | # Families | % Families |
| Less than $10,000 | 0 | 0.0% |
| $10,000 to $14,999 | 0 | 0.0% |
| $15,000 to $24,999 | 0 | 0.0% |
| $25,000 to $34,999 | 0 | 0.0% |
| $35,000 to $49,999 | 33 | 13.9% |
| $50,000 to $74,999 | 65 | 27.4% |
| $75,000 to $99,999 | 27 | 11.4% |
| $100,000 to $149,999 | 60 | 25.3% |
| $150,000 to $199,999 | 33 | 13.9% |
| $200,000+ | 19 | 8.0% |
Family Income by Famaliy Size in Holiday Lakes
2-person families (181 | 76.4%) account for the highest median family income in Holiday Lakes with $87,321 per family, while 2-person families (181 | 76.4%) have the highest median income of $43,660 per family member.
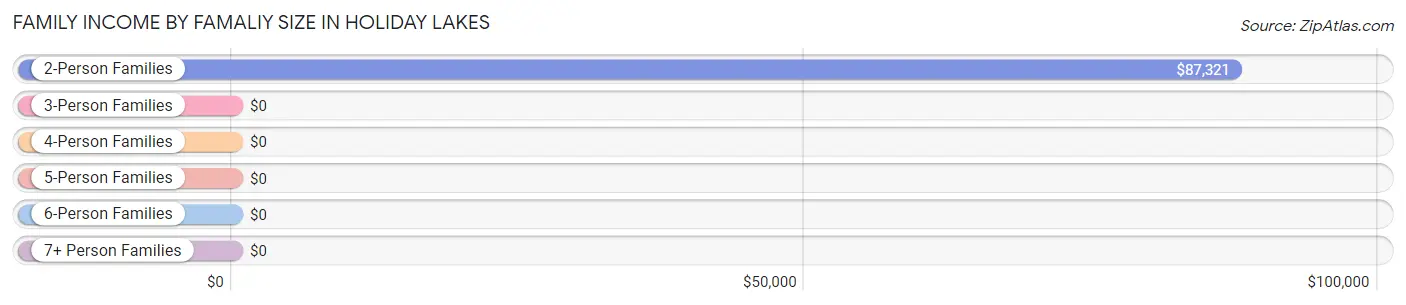
| Income Bracket | # Families | Median Income |
| 2-Person Families | 181 (76.4%) | $87,321 |
| 3-Person Families | 22 (9.3%) | $0 |
| 4-Person Families | 26 (11.0%) | $0 |
| 5-Person Families | 8 (3.4%) | $0 |
| 6-Person Families | 0 (0.0%) | $0 |
| 7+ Person Families | 0 (0.0%) | $0 |
| Total | 237 (100.0%) | $97,679 |
Family Income by Number of Earners in Holiday Lakes
| Number of Earners | # Families | Median Income |
| No Earners | 45 (19.0%) | $0 |
| 1 Earner | 40 (16.9%) | $98,929 |
| 2 Earners | 144 (60.8%) | $0 |
| 3+ Earners | 8 (3.4%) | $0 |
| Total | 237 (100.0%) | $97,679 |
Household Income in Holiday Lakes
Household Income Brackets in Holiday Lakes
With 86 households falling in the category, the $150,000 to $199,999 income range is the most frequent in Holiday Lakes, accounting for 28.9% of all households.
| Income Bracket | # Households | % Households |
| Less than $10,000 | 0 | 0.0% |
| $10,000 to $14,999 | 0 | 0.0% |
| $15,000 to $24,999 | 0 | 0.0% |
| $25,000 to $34,999 | 0 | 0.0% |
| $35,000 to $49,999 | 33 | 11.1% |
| $50,000 to $74,999 | 65 | 21.8% |
| $75,000 to $99,999 | 27 | 9.1% |
| $100,000 to $149,999 | 68 | 22.8% |
| $150,000 to $199,999 | 86 | 28.9% |
| $200,000+ | 19 | 6.4% |
Household Income by Householder Age in Holiday Lakes
The median household income in Holiday Lakes is $122,188, with the highest median household income of $172,609 found in the 25 to 44 years age bracket for the primary householder. A total of 72 households (24.2%) fall into this category.
| Income Bracket | # Households | Median Income |
| 15 to 24 Years | 0 (0.0%) | $0 |
| 25 to 44 Years | 72 (24.2%) | $172,609 |
| 45 to 64 Years | 155 (52.0%) | $119,926 |
| 65+ Years | 71 (23.8%) | $83,750 |
| Total | 298 (100.0%) | $122,188 |
Poverty in Holiday Lakes
Income Below Poverty by Sex and Age in Holiday Lakes
| Age Bracket | Male | Female |
| Under 5 Years | 0 (0.0%) | 0 (0.0%) |
| 5 Years | 0 (0.0%) | 0 (0.0%) |
| 6 to 11 Years | 0 (0.0%) | 0 (0.0%) |
| 12 to 14 Years | 0 (0.0%) | 0 (0.0%) |
| 15 Years | 0 (0.0%) | 0 (0.0%) |
| 16 and 17 Years | 0 (0.0%) | 0 (0.0%) |
| 18 to 24 Years | 0 (0.0%) | 0 (0.0%) |
| 25 to 34 Years | 0 (0.0%) | 0 (0.0%) |
| 35 to 44 Years | 0 (0.0%) | 0 (0.0%) |
| 45 to 54 Years | 0 (0.0%) | 0 (0.0%) |
| 55 to 64 Years | 0 (0.0%) | 0 (0.0%) |
| 65 to 74 Years | 0 (0.0%) | 0 (0.0%) |
| 75 Years and over | 0 (0.0%) | 0 (0.0%) |
| Total | 0 (0.0%) | 0 (0.0%) |
Income Above Poverty by Sex and Age in Holiday Lakes
According to the poverty statistics in Holiday Lakes, males aged under 5 years and females aged under 5 years are the age groups that are most secure financially, with 100.0% of males and 100.0% of females in these age groups living above the poverty line.
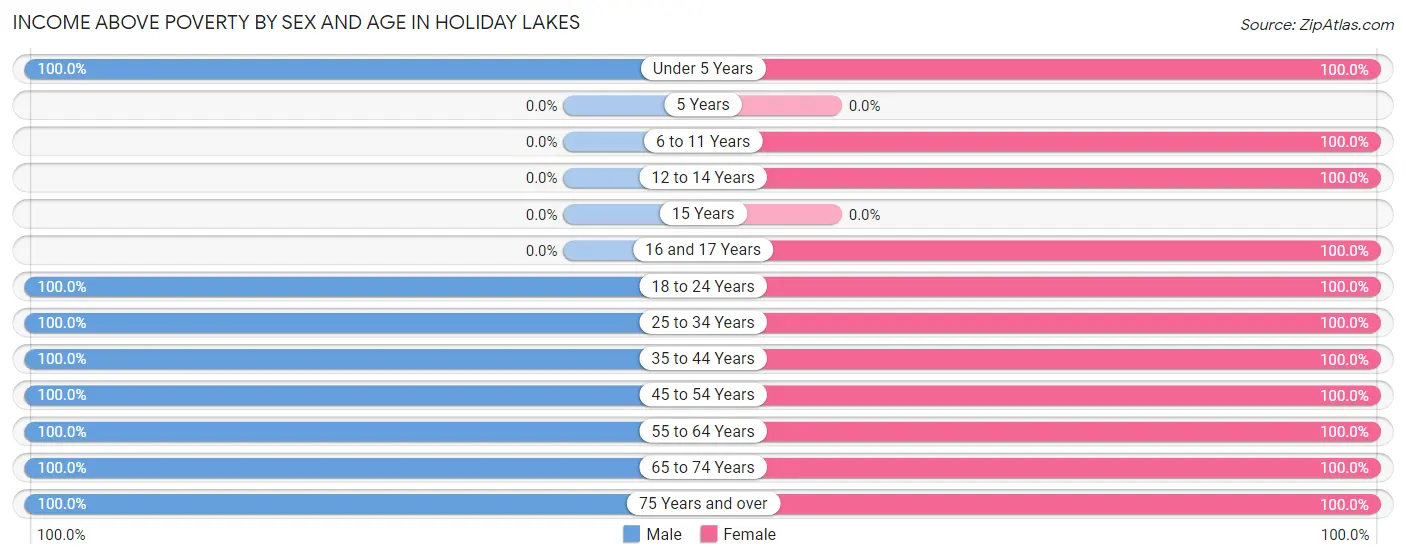
| Age Bracket | Male | Female |
| Under 5 Years | 34 (100.0%) | 12 (100.0%) |
| 5 Years | 0 (0.0%) | 0 (0.0%) |
| 6 to 11 Years | 0 (0.0%) | 12 (100.0%) |
| 12 to 14 Years | 0 (0.0%) | 26 (100.0%) |
| 15 Years | 0 (0.0%) | 0 (0.0%) |
| 16 and 17 Years | 0 (0.0%) | 9 (100.0%) |
| 18 to 24 Years | 7 (100.0%) | 6 (100.0%) |
| 25 to 34 Years | 28 (100.0%) | 34 (100.0%) |
| 35 to 44 Years | 39 (100.0%) | 16 (100.0%) |
| 45 to 54 Years | 187 (100.0%) | 78 (100.0%) |
| 55 to 64 Years | 12 (100.0%) | 73 (100.0%) |
| 65 to 74 Years | 38 (100.0%) | 52 (100.0%) |
| 75 Years and over | 32 (100.0%) | 5 (100.0%) |
| Total | 377 (100.0%) | 323 (100.0%) |
Income Below Poverty Among Married-Couple Families in Holiday Lakes
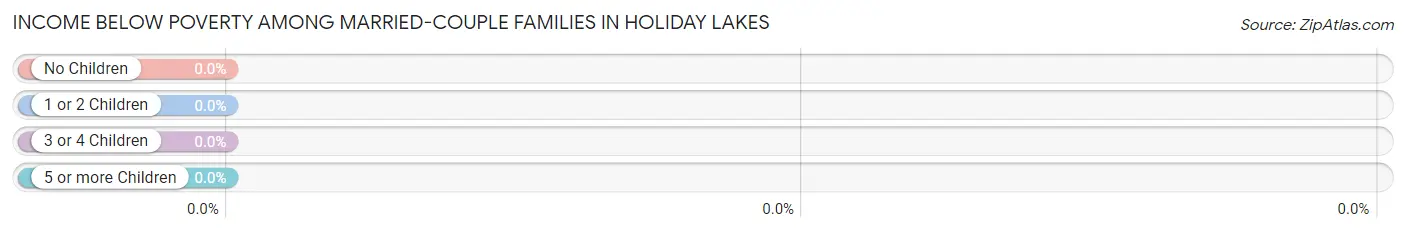
| Children | Above Poverty | Below Poverty |
| No Children | 166 (100.0%) | 0 (0.0%) |
| 1 or 2 Children | 49 (100.0%) | 0 (0.0%) |
| 3 or 4 Children | 0 (0.0%) | 0 (0.0%) |
| 5 or more Children | 0 (0.0%) | 0 (0.0%) |
| Total | 215 (100.0%) | 0 (0.0%) |
Income Below Poverty Among Single-Parent Households in Holiday Lakes
| Children | Single Father | Single Mother |
| No Children | 0 (0.0%) | 0 (0.0%) |
| 1 or 2 Children | 0 (0.0%) | 0 (0.0%) |
| 3 or 4 Children | 0 (0.0%) | 0 (0.0%) |
| 5 or more Children | 0 (0.0%) | 0 (0.0%) |
| Total | 0 (0.0%) | 0 (0.0%) |
Income Below Poverty Among Married-Couple vs Single-Parent Households in Holiday Lakes
| Children | Married-Couple Families | Single-Parent Households |
| No Children | 0 (0.0%) | 0 (0.0%) |
| 1 or 2 Children | 0 (0.0%) | 0 (0.0%) |
| 3 or 4 Children | 0 (0.0%) | 0 (0.0%) |
| 5 or more Children | 0 (0.0%) | 0 (0.0%) |
| Total | 0 (0.0%) | 0 (0.0%) |
Employment Characteristics in Holiday Lakes
Employment by Class of Employer in Holiday Lakes
Among the 452 employed individuals in Holiday Lakes, private company employees (272 | 60.2%), local government employees (114 | 25.2%), and self-employed (not incorporated) (27 | 6.0%) make up the most common classes of employment.
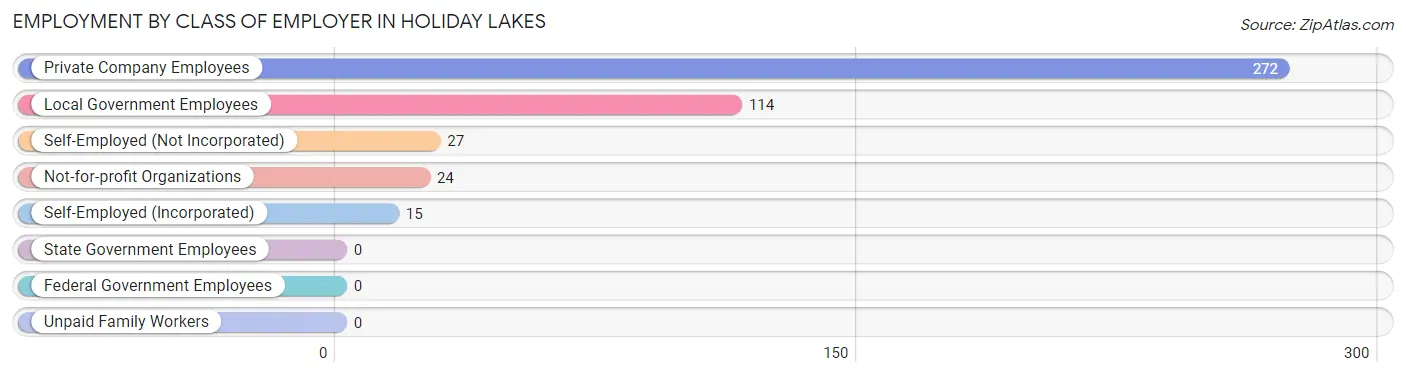
| Employer Class | # Employees | % Employees |
| Private Company Employees | 272 | 60.2% |
| Self-Employed (Incorporated) | 15 | 3.3% |
| Self-Employed (Not Incorporated) | 27 | 6.0% |
| Not-for-profit Organizations | 24 | 5.3% |
| Local Government Employees | 114 | 25.2% |
| State Government Employees | 0 | 0.0% |
| Federal Government Employees | 0 | 0.0% |
| Unpaid Family Workers | 0 | 0.0% |
| Total | 452 | 100.0% |
Employment Status by Age in Holiday Lakes
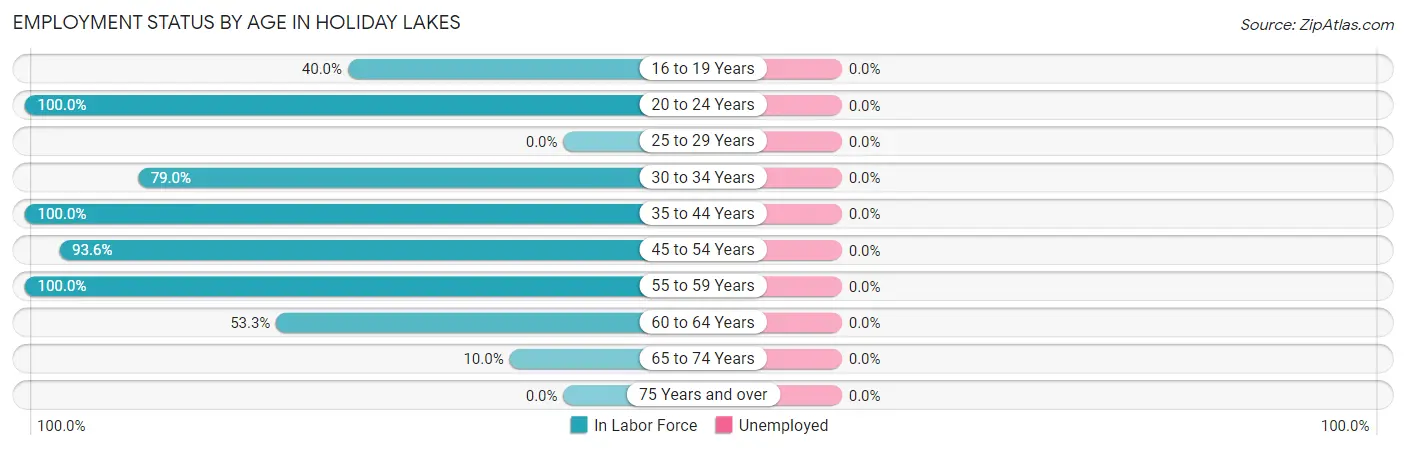
| Age Bracket | In Labor Force | Unemployed |
| 16 to 19 Years | 6 (40.0%) | 0 (0.0%) |
| 20 to 24 Years | 7 (100.0%) | 0 (0.0%) |
| 25 to 29 Years | 0 (0.0%) | 0 (0.0%) |
| 30 to 34 Years | 49 (79.0%) | 0 (0.0%) |
| 35 to 44 Years | 55 (100.0%) | 0 (0.0%) |
| 45 to 54 Years | 248 (93.6%) | 0 (0.0%) |
| 55 to 59 Years | 70 (100.0%) | 0 (0.0%) |
| 60 to 64 Years | 8 (53.3%) | 0 (0.0%) |
| 65 to 74 Years | 9 (10.0%) | 0 (0.0%) |
| 75 Years and over | 0 (0.0%) | 0 (0.0%) |
| Total | 452 (73.4%) | 0 (0.0%) |
Employment Status by Educational Attainment in Holiday Lakes
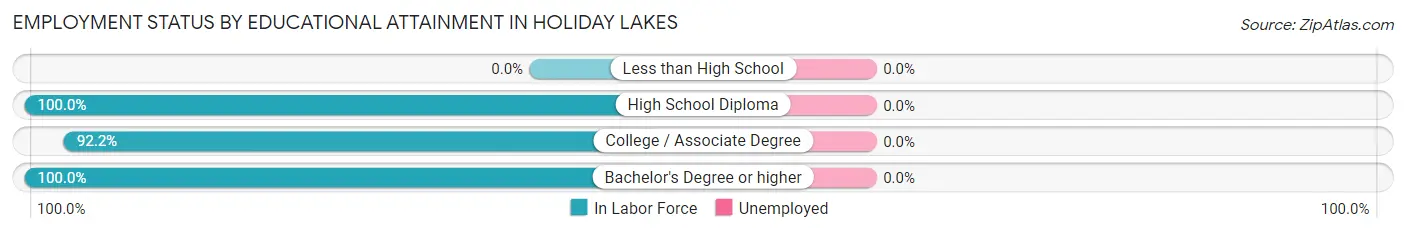
| Educational Attainment | In Labor Force | Unemployed |
| Less than High School | 0 (0.0%) | 0 (0.0%) |
| High School Diploma | 73 (100.0%) | 0 (0.0%) |
| College / Associate Degree | 282 (92.2%) | 0 (0.0%) |
| Bachelor's Degree or higher | 75 (100.0%) | 0 (0.0%) |
| Total | 430 (92.1%) | 0 (0.0%) |
Employment Occupations by Sex in Holiday Lakes
Management, Business, Science and Arts Occupations
The most common Management, Business, Science and Arts occupations in Holiday Lakes are Community & Social Service (55 | 12.2%), Management (51 | 11.3%), Education Instruction & Library (45 | 10.0%), Business & Financial (20 | 4.4%), and Arts, Media & Entertainment (10 | 2.2%).
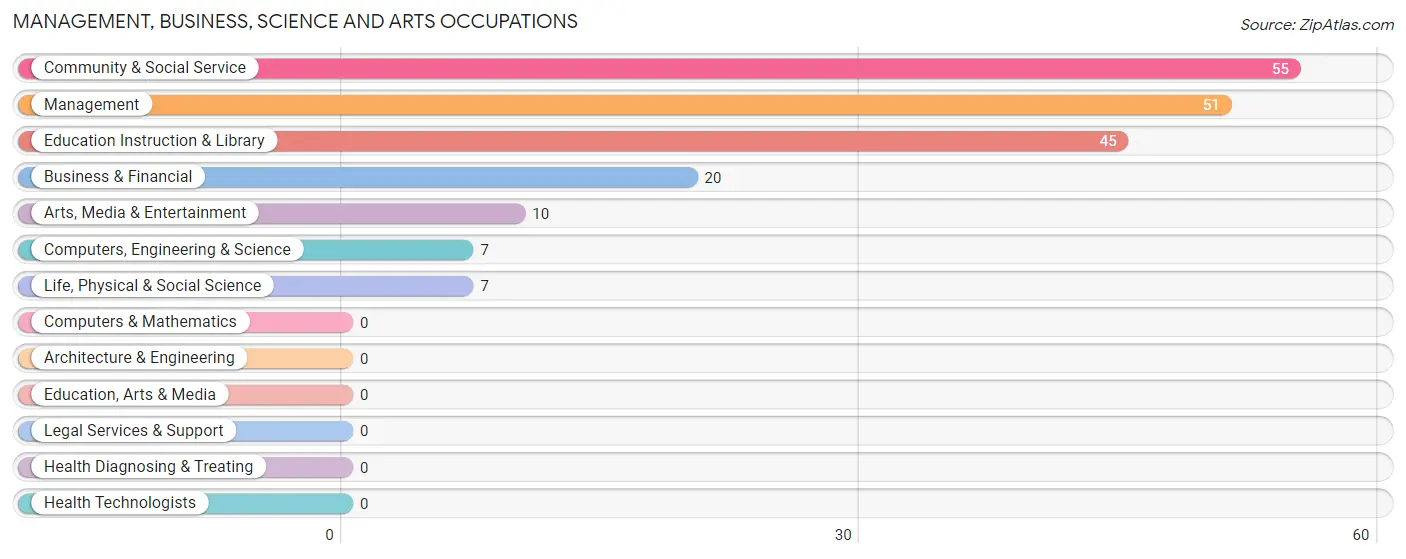
Management, Business, Science and Arts Occupations by Sex
Within the Management, Business, Science and Arts occupations in Holiday Lakes, the most male-oriented occupations are Computers, Engineering & Science (100.0%), Life, Physical & Social Science (100.0%), and Arts, Media & Entertainment (100.0%), while the most female-oriented occupations are Business & Financial (100.0%), Management (45.1%), and Education Instruction & Library (42.2%).
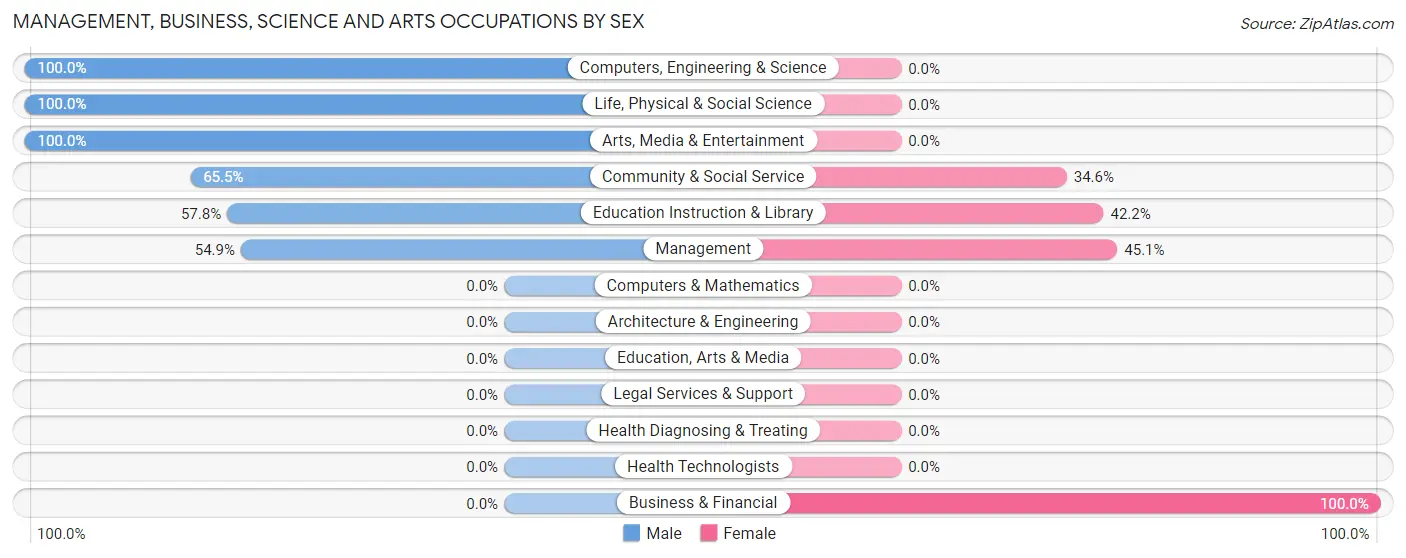
| Occupation | Male | Female |
| Management | 28 (54.9%) | 23 (45.1%) |
| Business & Financial | 0 (0.0%) | 20 (100.0%) |
| Computers, Engineering & Science | 7 (100.0%) | 0 (0.0%) |
| Computers & Mathematics | 0 (0.0%) | 0 (0.0%) |
| Architecture & Engineering | 0 (0.0%) | 0 (0.0%) |
| Life, Physical & Social Science | 7 (100.0%) | 0 (0.0%) |
| Community & Social Service | 36 (65.4%) | 19 (34.5%) |
| Education, Arts & Media | 0 (0.0%) | 0 (0.0%) |
| Legal Services & Support | 0 (0.0%) | 0 (0.0%) |
| Education Instruction & Library | 26 (57.8%) | 19 (42.2%) |
| Arts, Media & Entertainment | 10 (100.0%) | 0 (0.0%) |
| Health Diagnosing & Treating | 0 (0.0%) | 0 (0.0%) |
| Health Technologists | 0 (0.0%) | 0 (0.0%) |
| Total (Category) | 71 (53.4%) | 62 (46.6%) |
| Total (Overall) | 243 (53.8%) | 209 (46.2%) |
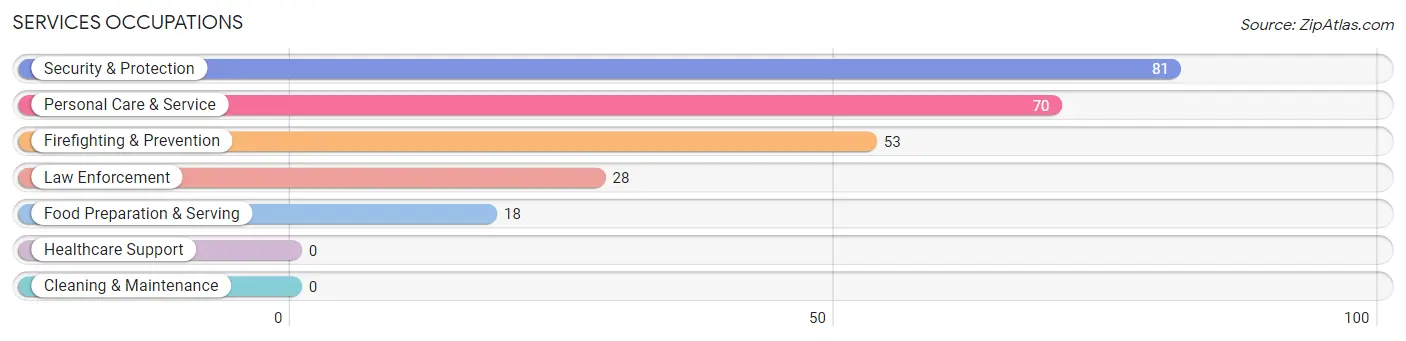
Services Occupations
The most common Services occupations in Holiday Lakes are Security & Protection (81 | 17.9%), Personal Care & Service (70 | 15.5%), Firefighting & Prevention (53 | 11.7%), Law Enforcement (28 | 6.2%), and Food Preparation & Serving (18 | 4.0%).
Services Occupations by Sex
Within the Services occupations in Holiday Lakes, the most male-oriented occupations are Security & Protection (100.0%), Firefighting & Prevention (100.0%), and Law Enforcement (100.0%), while the most female-oriented occupations are Food Preparation & Serving (100.0%), and Personal Care & Service (88.6%).
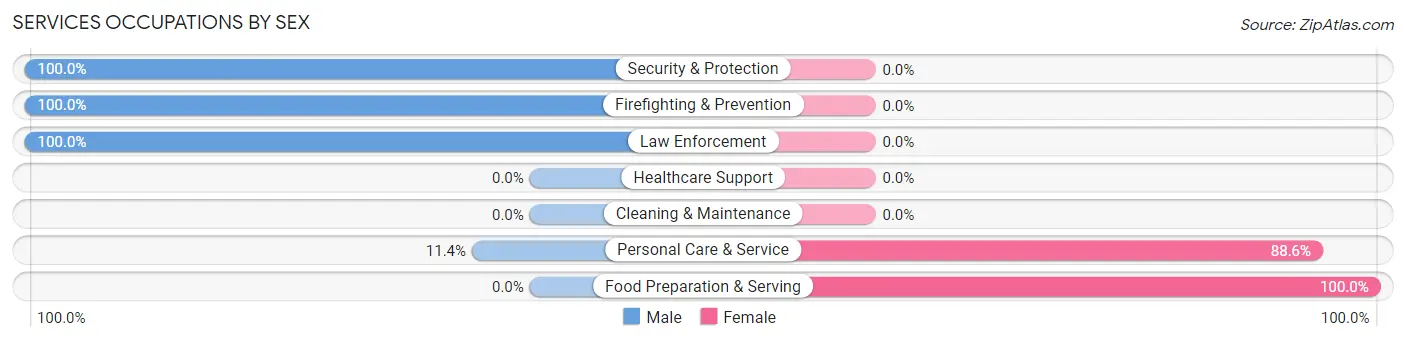
| Occupation | Male | Female |
| Healthcare Support | 0 (0.0%) | 0 (0.0%) |
| Security & Protection | 81 (100.0%) | 0 (0.0%) |
| Firefighting & Prevention | 53 (100.0%) | 0 (0.0%) |
| Law Enforcement | 28 (100.0%) | 0 (0.0%) |
| Food Preparation & Serving | 0 (0.0%) | 18 (100.0%) |
| Cleaning & Maintenance | 0 (0.0%) | 0 (0.0%) |
| Personal Care & Service | 8 (11.4%) | 62 (88.6%) |
| Total (Category) | 89 (52.7%) | 80 (47.3%) |
| Total (Overall) | 243 (53.8%) | 209 (46.2%) |
Sales and Office Occupations
The most common Sales and Office occupations in Holiday Lakes are , and Office & Administration (67 | 14.8%).
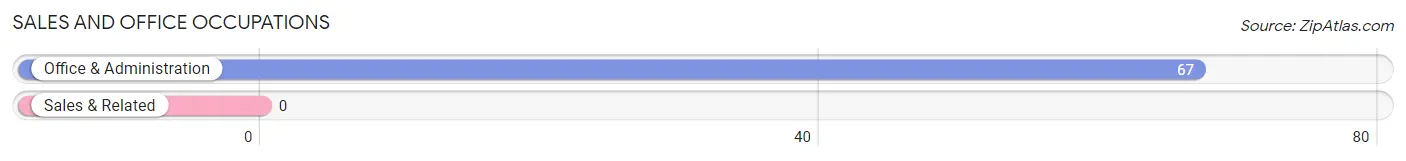
Sales and Office Occupations by Sex
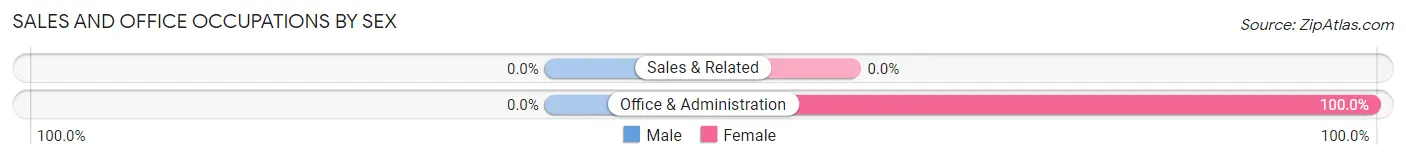
| Occupation | Male | Female |
| Sales & Related | 0 (0.0%) | 0 (0.0%) |
| Office & Administration | 0 (0.0%) | 67 (100.0%) |
| Total (Category) | 0 (0.0%) | 67 (100.0%) |
| Total (Overall) | 243 (53.8%) | 209 (46.2%) |
Natural Resources, Construction and Maintenance Occupations
The most common Natural Resources, Construction and Maintenance occupations in Holiday Lakes are , and Installation, Maintenance & Repair (23 | 5.1%).
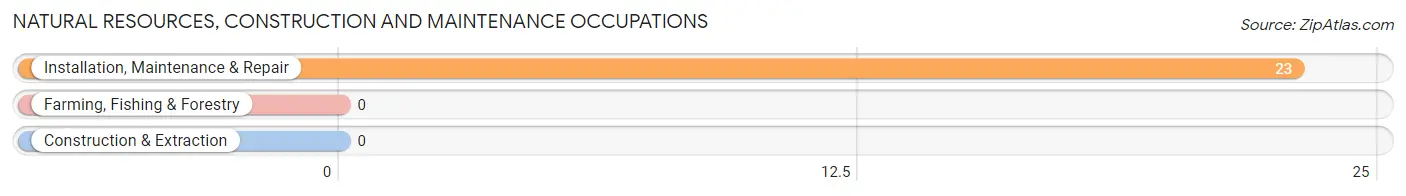
Natural Resources, Construction and Maintenance Occupations by Sex
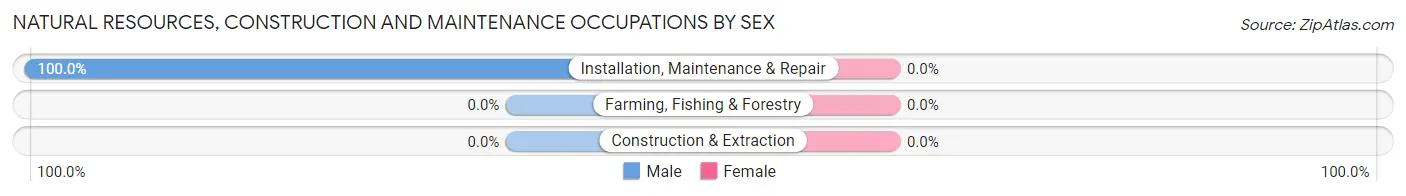
| Occupation | Male | Female |
| Farming, Fishing & Forestry | 0 (0.0%) | 0 (0.0%) |
| Construction & Extraction | 0 (0.0%) | 0 (0.0%) |
| Installation, Maintenance & Repair | 23 (100.0%) | 0 (0.0%) |
| Total (Category) | 23 (100.0%) | 0 (0.0%) |
| Total (Overall) | 243 (53.8%) | 209 (46.2%) |
Production, Transportation and Moving Occupations
The most common Production, Transportation and Moving occupations in Holiday Lakes are , and Transportation (60 | 13.3%).
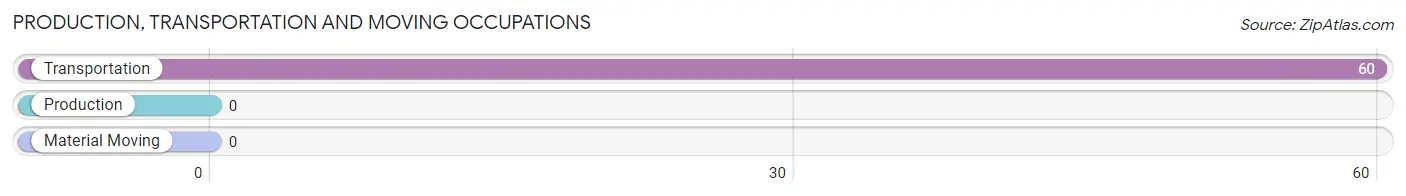
Production, Transportation and Moving Occupations by Sex
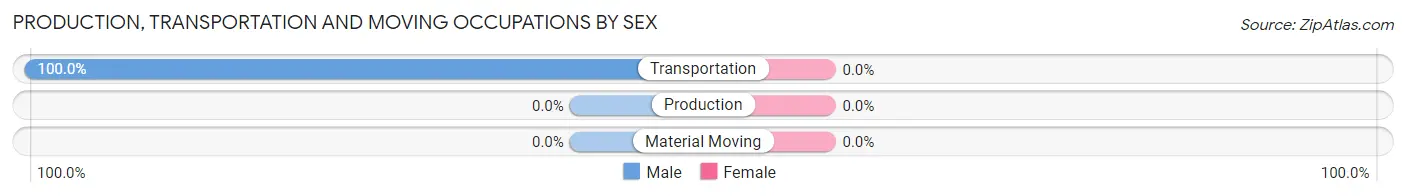
| Occupation | Male | Female |
| Production | 0 (0.0%) | 0 (0.0%) |
| Transportation | 60 (100.0%) | 0 (0.0%) |
| Material Moving | 0 (0.0%) | 0 (0.0%) |
| Total (Category) | 60 (100.0%) | 0 (0.0%) |
| Total (Overall) | 243 (53.8%) | 209 (46.2%) |
Employment Industries by Sex in Holiday Lakes
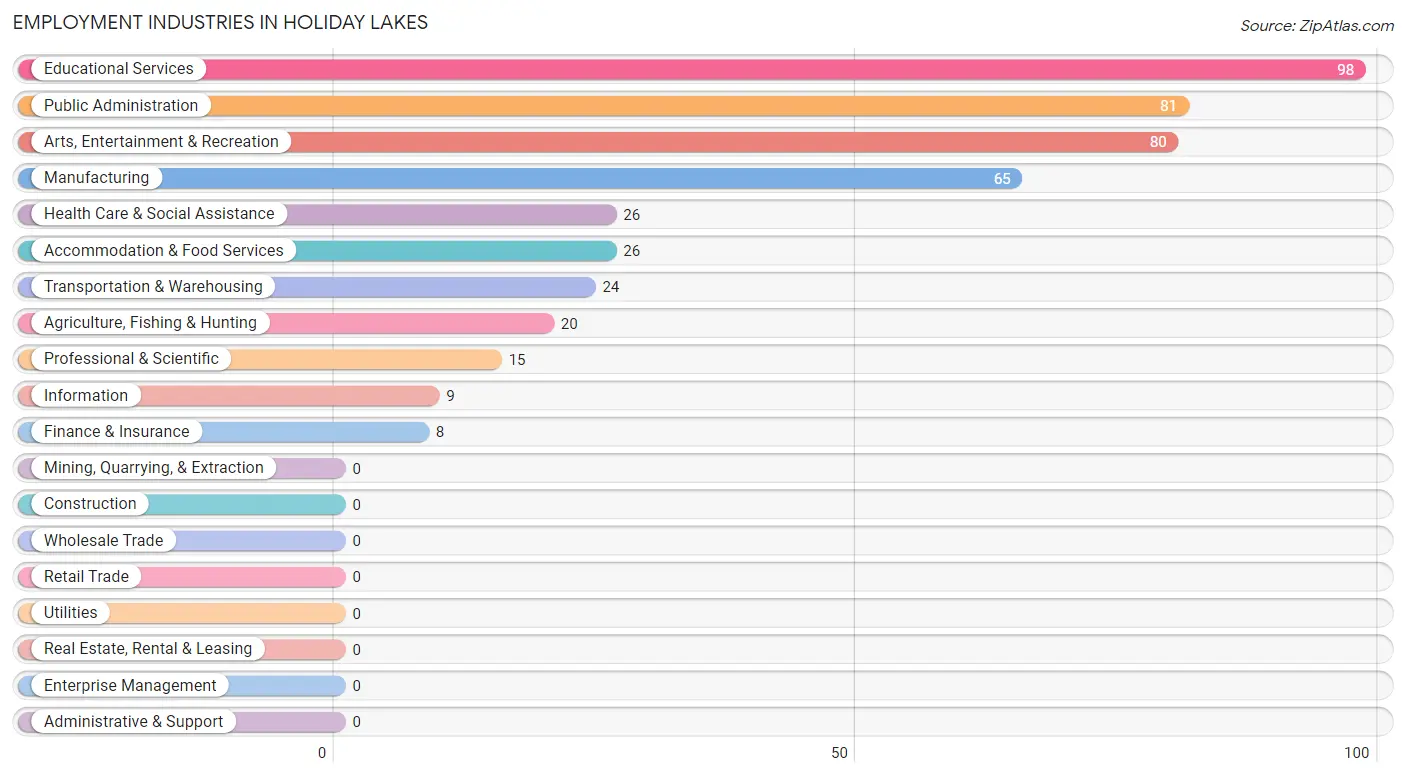
Employment Industries in Holiday Lakes
The major employment industries in Holiday Lakes include Educational Services (98 | 21.7%), Public Administration (81 | 17.9%), Arts, Entertainment & Recreation (80 | 17.7%), Manufacturing (65 | 14.4%), and Health Care & Social Assistance (26 | 5.8%).
Employment Industries by Sex in Holiday Lakes
The Holiday Lakes industries that see more men than women are Agriculture, Fishing & Hunting (100.0%), Public Administration (100.0%), and Educational Services (80.6%), whereas the industries that tend to have a higher number of women are Information (100.0%), Finance & Insurance (100.0%), and Health Care & Social Assistance (100.0%).
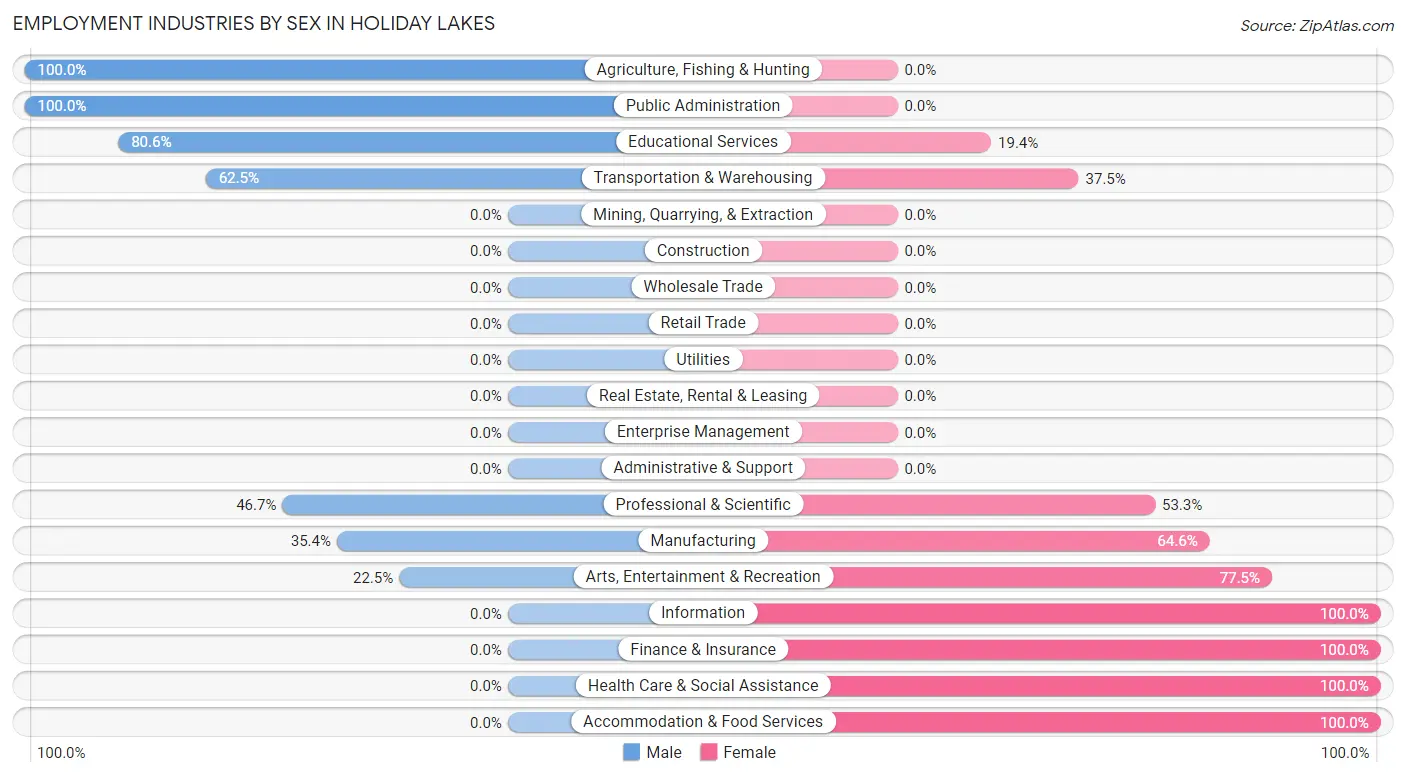
| Industry | Male | Female |
| Agriculture, Fishing & Hunting | 20 (100.0%) | 0 (0.0%) |
| Mining, Quarrying, & Extraction | 0 (0.0%) | 0 (0.0%) |
| Construction | 0 (0.0%) | 0 (0.0%) |
| Manufacturing | 23 (35.4%) | 42 (64.6%) |
| Wholesale Trade | 0 (0.0%) | 0 (0.0%) |
| Retail Trade | 0 (0.0%) | 0 (0.0%) |
| Transportation & Warehousing | 15 (62.5%) | 9 (37.5%) |
| Utilities | 0 (0.0%) | 0 (0.0%) |
| Information | 0 (0.0%) | 9 (100.0%) |
| Finance & Insurance | 0 (0.0%) | 8 (100.0%) |
| Real Estate, Rental & Leasing | 0 (0.0%) | 0 (0.0%) |
| Professional & Scientific | 7 (46.7%) | 8 (53.3%) |
| Enterprise Management | 0 (0.0%) | 0 (0.0%) |
| Administrative & Support | 0 (0.0%) | 0 (0.0%) |
| Educational Services | 79 (80.6%) | 19 (19.4%) |
| Health Care & Social Assistance | 0 (0.0%) | 26 (100.0%) |
| Arts, Entertainment & Recreation | 18 (22.5%) | 62 (77.5%) |
| Accommodation & Food Services | 0 (0.0%) | 26 (100.0%) |
| Public Administration | 81 (100.0%) | 0 (0.0%) |
| Total | 243 (53.8%) | 209 (46.2%) |
Education in Holiday Lakes
School Enrollment in Holiday Lakes
The most common levels of schooling among the 70 students in Holiday Lakes are nursery / preschool (18 | 25.7%), middle school (18 | 25.7%), and elementary school (12 | 17.1%).
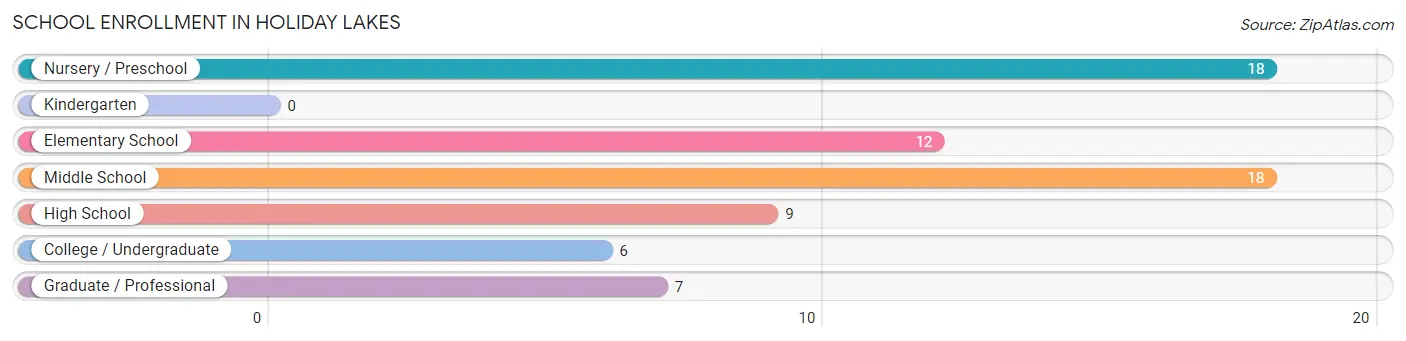
| School Level | # Students | % Students |
| Nursery / Preschool | 18 | 25.7% |
| Kindergarten | 0 | 0.0% |
| Elementary School | 12 | 17.1% |
| Middle School | 18 | 25.7% |
| High School | 9 | 12.9% |
| College / Undergraduate | 6 | 8.6% |
| Graduate / Professional | 7 | 10.0% |
| Total | 70 | 100.0% |
School Enrollment by Age by Funding Source in Holiday Lakes
Out of a total of 70 students who are enrolled in schools in Holiday Lakes, 32 (45.7%) attend a private institution, while the remaining 38 (54.3%) are enrolled in public schools. The age group of 3 to 4 year olds has the highest likelihood of being enrolled in private schools, with 18 (100.0% in the age bracket) enrolled. Conversely, the age group of 5 to 9 year old has the lowest likelihood of being enrolled in a private school, with 12 (100.0% in the age bracket) attending a public institution.
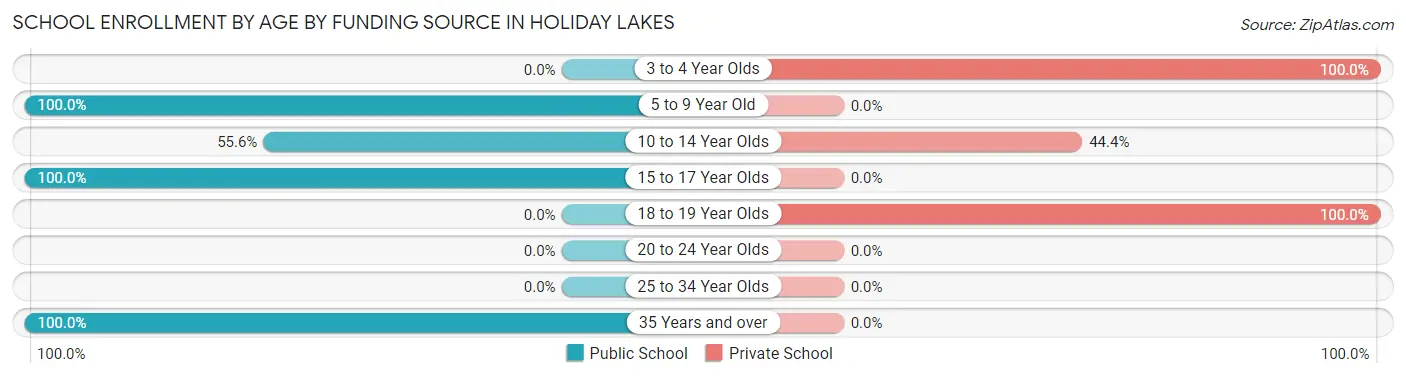
| Age Bracket | Public School | Private School |
| 3 to 4 Year Olds | 0 (0.0%) | 18 (100.0%) |
| 5 to 9 Year Old | 12 (100.0%) | 0 (0.0%) |
| 10 to 14 Year Olds | 10 (55.6%) | 8 (44.4%) |
| 15 to 17 Year Olds | 9 (100.0%) | 0 (0.0%) |
| 18 to 19 Year Olds | 0 (0.0%) | 6 (100.0%) |
| 20 to 24 Year Olds | 0 (0.0%) | 0 (0.0%) |
| 25 to 34 Year Olds | 0 (0.0%) | 0 (0.0%) |
| 35 Years and over | 7 (100.0%) | 0 (0.0%) |
| Total | 38 (54.3%) | 32 (45.7%) |
Educational Attainment by Field of Study in Holiday Lakes
Education (38 | 39.2%), business (16 | 16.5%), engineering (15 | 15.5%), science & technology (14 | 14.4%), and liberal arts & history (8 | 8.3%) are the most common fields of study among 97 individuals in Holiday Lakes who have obtained a bachelor's degree or higher.
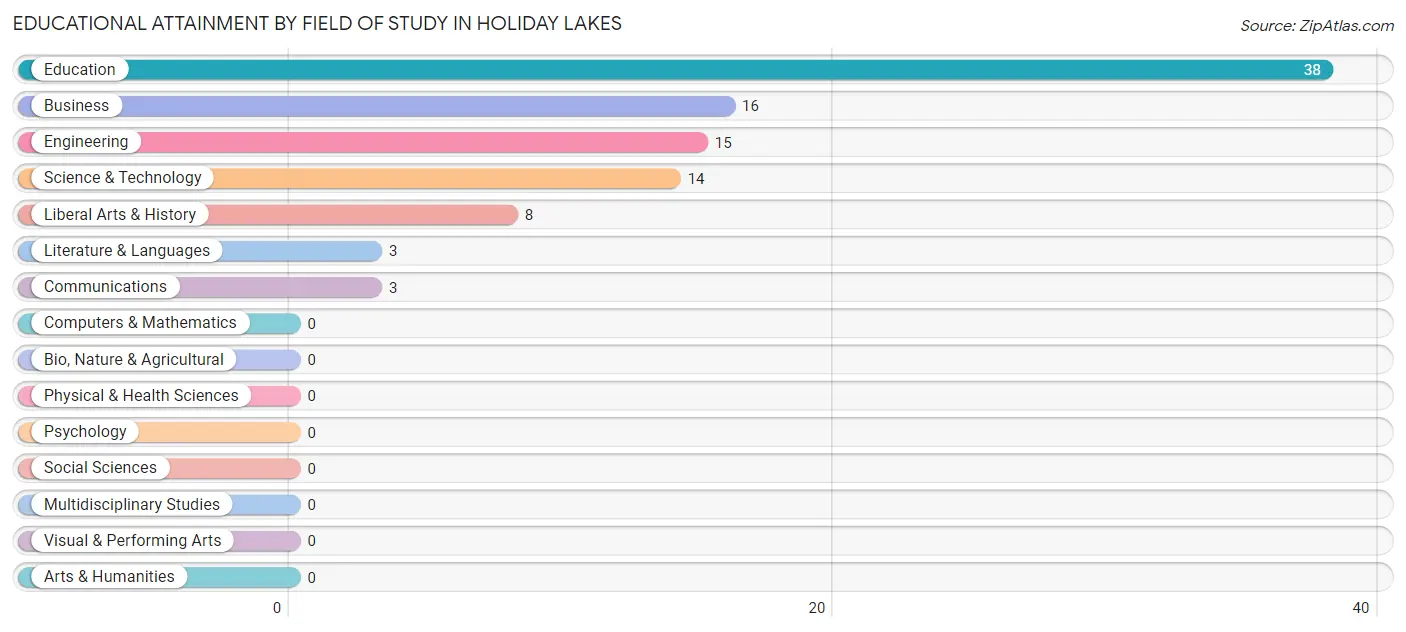
| Field of Study | # Graduates | % Graduates |
| Computers & Mathematics | 0 | 0.0% |
| Bio, Nature & Agricultural | 0 | 0.0% |
| Physical & Health Sciences | 0 | 0.0% |
| Psychology | 0 | 0.0% |
| Social Sciences | 0 | 0.0% |
| Engineering | 15 | 15.5% |
| Multidisciplinary Studies | 0 | 0.0% |
| Science & Technology | 14 | 14.4% |
| Business | 16 | 16.5% |
| Education | 38 | 39.2% |
| Literature & Languages | 3 | 3.1% |
| Liberal Arts & History | 8 | 8.3% |
| Visual & Performing Arts | 0 | 0.0% |
| Communications | 3 | 3.1% |
| Arts & Humanities | 0 | 0.0% |
| Total | 97 | 100.0% |
Transportation & Commute in Holiday Lakes
Vehicle Availability by Sex in Holiday Lakes
The most prevalent vehicle ownership categories in Holiday Lakes are males with 3 vehicles (137, accounting for 56.4%) and females with 3 vehicles (39, making up 65.5%).
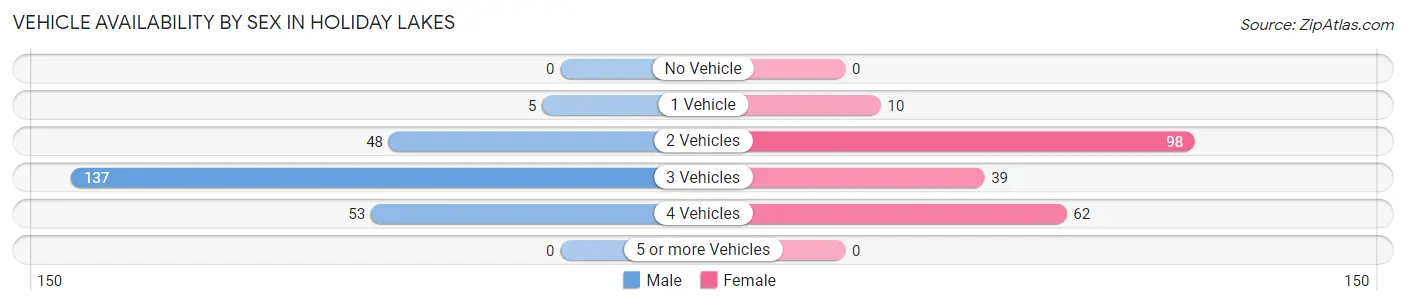
| Vehicles Available | Male | Female |
| No Vehicle | 0 (0.0%) | 0 (0.0%) |
| 1 Vehicle | 5 (2.1%) | 10 (4.8%) |
| 2 Vehicles | 48 (19.8%) | 98 (46.9%) |
| 3 Vehicles | 137 (56.4%) | 39 (18.7%) |
| 4 Vehicles | 53 (21.8%) | 62 (29.7%) |
| 5 or more Vehicles | 0 (0.0%) | 0 (0.0%) |
| Total | 243 (100.0%) | 209 (100.0%) |
Commute Time in Holiday Lakes
The most frequently occuring commute durations in Holiday Lakes are 10 to 14 minutes (228 commuters, 53.1%), 20 to 24 minutes (47 commuters, 11.0%), and 35 to 39 minutes (42 commuters, 9.8%).
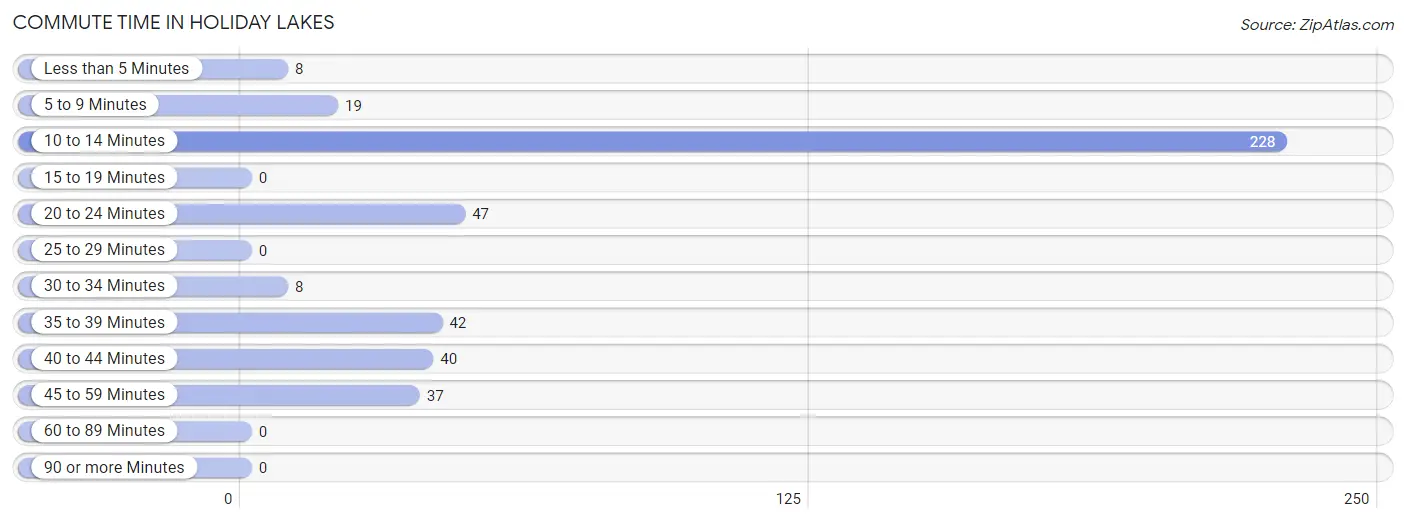
| Commute Time | # Commuters | % Commuters |
| Less than 5 Minutes | 8 | 1.9% |
| 5 to 9 Minutes | 19 | 4.4% |
| 10 to 14 Minutes | 228 | 53.1% |
| 15 to 19 Minutes | 0 | 0.0% |
| 20 to 24 Minutes | 47 | 11.0% |
| 25 to 29 Minutes | 0 | 0.0% |
| 30 to 34 Minutes | 8 | 1.9% |
| 35 to 39 Minutes | 42 | 9.8% |
| 40 to 44 Minutes | 40 | 9.3% |
| 45 to 59 Minutes | 37 | 8.6% |
| 60 to 89 Minutes | 0 | 0.0% |
| 90 or more Minutes | 0 | 0.0% |
Commute Time by Sex in Holiday Lakes
The most common commute times in Holiday Lakes are 10 to 14 minutes (149 commuters, 61.3%) for males and 10 to 14 minutes (79 commuters, 42.5%) for females.
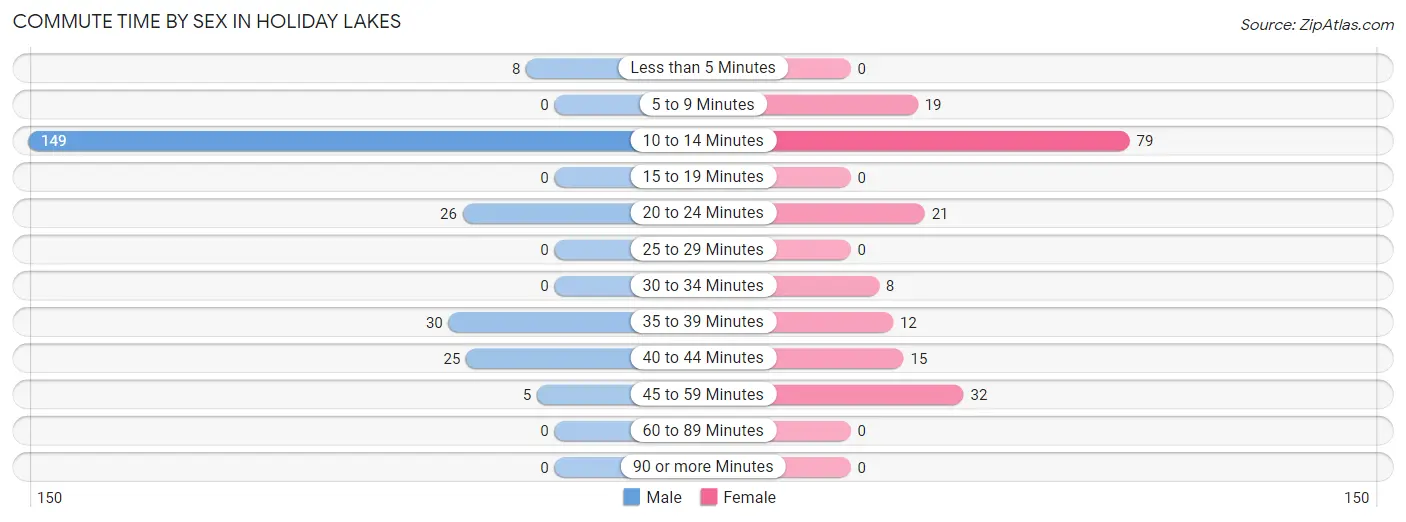
| Commute Time | Male | Female |
| Less than 5 Minutes | 8 (3.3%) | 0 (0.0%) |
| 5 to 9 Minutes | 0 (0.0%) | 19 (10.2%) |
| 10 to 14 Minutes | 149 (61.3%) | 79 (42.5%) |
| 15 to 19 Minutes | 0 (0.0%) | 0 (0.0%) |
| 20 to 24 Minutes | 26 (10.7%) | 21 (11.3%) |
| 25 to 29 Minutes | 0 (0.0%) | 0 (0.0%) |
| 30 to 34 Minutes | 0 (0.0%) | 8 (4.3%) |
| 35 to 39 Minutes | 30 (12.3%) | 12 (6.5%) |
| 40 to 44 Minutes | 25 (10.3%) | 15 (8.1%) |
| 45 to 59 Minutes | 5 (2.1%) | 32 (17.2%) |
| 60 to 89 Minutes | 0 (0.0%) | 0 (0.0%) |
| 90 or more Minutes | 0 (0.0%) | 0 (0.0%) |
Time of Departure to Work by Sex in Holiday Lakes
The most frequent times of departure to work in Holiday Lakes are 6:00 AM to 6:29 AM (83, 34.2%) for males and 5:00 AM to 5:29 AM (86, 46.2%) for females.
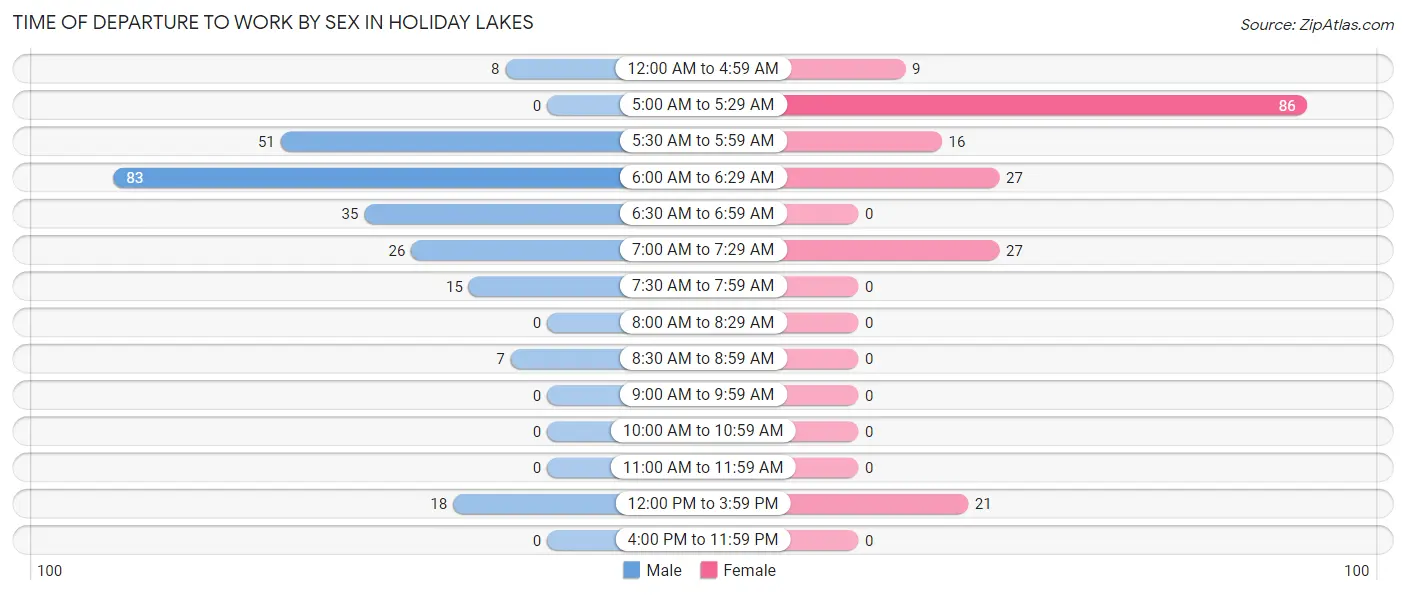
| Time of Departure | Male | Female |
| 12:00 AM to 4:59 AM | 8 (3.3%) | 9 (4.8%) |
| 5:00 AM to 5:29 AM | 0 (0.0%) | 86 (46.2%) |
| 5:30 AM to 5:59 AM | 51 (21.0%) | 16 (8.6%) |
| 6:00 AM to 6:29 AM | 83 (34.2%) | 27 (14.5%) |
| 6:30 AM to 6:59 AM | 35 (14.4%) | 0 (0.0%) |
| 7:00 AM to 7:29 AM | 26 (10.7%) | 27 (14.5%) |
| 7:30 AM to 7:59 AM | 15 (6.2%) | 0 (0.0%) |
| 8:00 AM to 8:29 AM | 0 (0.0%) | 0 (0.0%) |
| 8:30 AM to 8:59 AM | 7 (2.9%) | 0 (0.0%) |
| 9:00 AM to 9:59 AM | 0 (0.0%) | 0 (0.0%) |
| 10:00 AM to 10:59 AM | 0 (0.0%) | 0 (0.0%) |
| 11:00 AM to 11:59 AM | 0 (0.0%) | 0 (0.0%) |
| 12:00 PM to 3:59 PM | 18 (7.4%) | 21 (11.3%) |
| 4:00 PM to 11:59 PM | 0 (0.0%) | 0 (0.0%) |
| Total | 243 (100.0%) | 186 (100.0%) |
Housing Occupancy in Holiday Lakes
Occupancy by Ownership in Holiday Lakes
Of the total 298 dwellings in Holiday Lakes, owner-occupied units account for 290 (97.3%), while renter-occupied units make up 8 (2.7%).
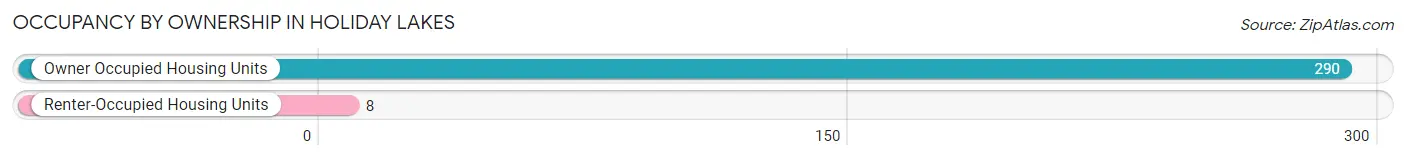
| Occupancy | # Housing Units | % Housing Units |
| Owner Occupied Housing Units | 290 | 97.3% |
| Renter-Occupied Housing Units | 8 | 2.7% |
| Total Occupied Housing Units | 298 | 100.0% |
Occupancy by Household Size in Holiday Lakes
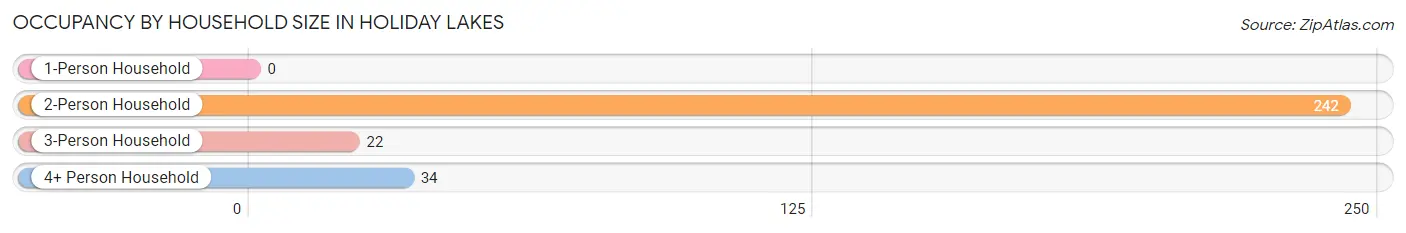
| Household Size | # Housing Units | % Housing Units |
| 1-Person Household | 0 | 0.0% |
| 2-Person Household | 242 | 81.2% |
| 3-Person Household | 22 | 7.4% |
| 4+ Person Household | 34 | 11.4% |
| Total Housing Units | 298 | 100.0% |
Occupancy by Ownership by Household Size in Holiday Lakes
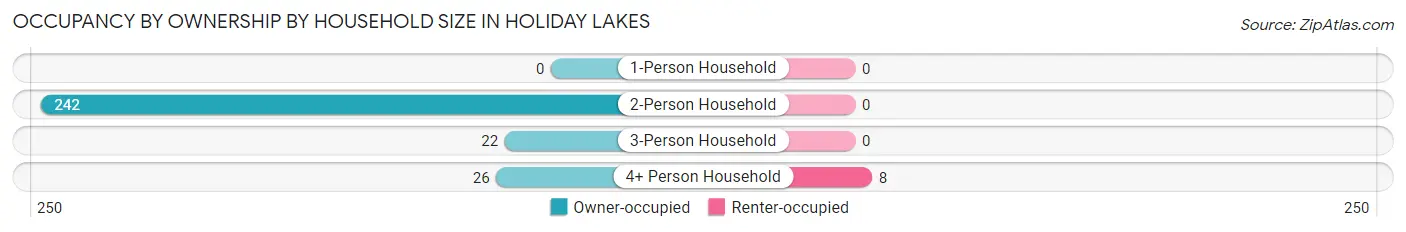
| Household Size | Owner-occupied | Renter-occupied |
| 1-Person Household | 0 (0.0%) | 0 (0.0%) |
| 2-Person Household | 242 (100.0%) | 0 (0.0%) |
| 3-Person Household | 22 (100.0%) | 0 (0.0%) |
| 4+ Person Household | 26 (76.5%) | 8 (23.5%) |
| Total Housing Units | 290 (97.3%) | 8 (2.7%) |
Occupancy by Educational Attainment in Holiday Lakes
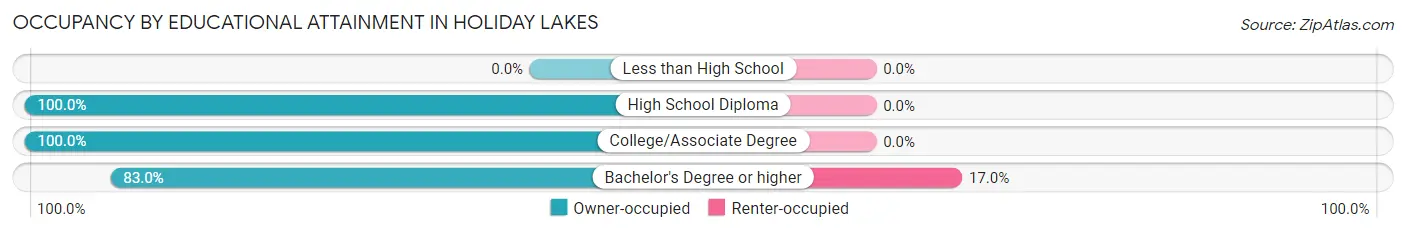
| Household Size | Owner-occupied | Renter-occupied |
| Less than High School | 0 (0.0%) | 0 (0.0%) |
| High School Diploma | 90 (100.0%) | 0 (0.0%) |
| College/Associate Degree | 161 (100.0%) | 0 (0.0%) |
| Bachelor's Degree or higher | 39 (83.0%) | 8 (17.0%) |
Occupancy by Age of Householder in Holiday Lakes
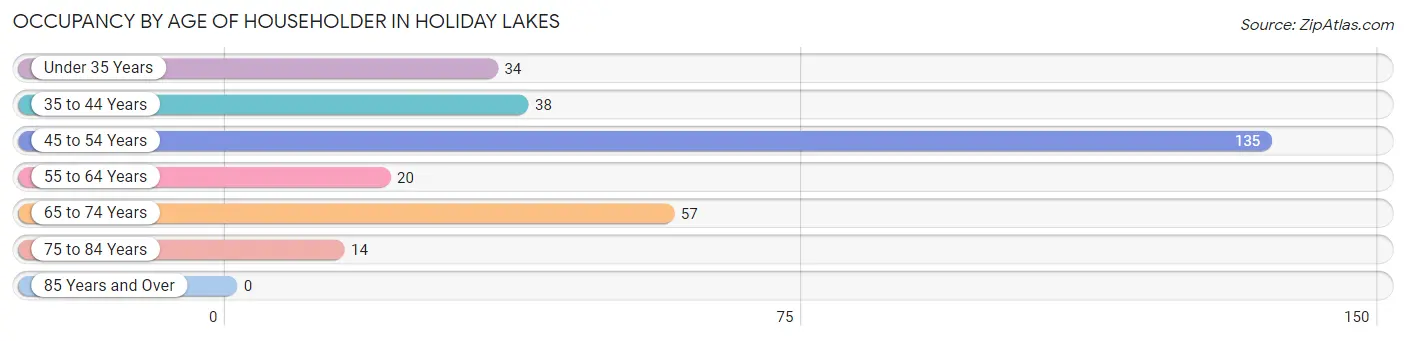
| Age Bracket | # Households | % Households |
| Under 35 Years | 34 | 11.4% |
| 35 to 44 Years | 38 | 12.8% |
| 45 to 54 Years | 135 | 45.3% |
| 55 to 64 Years | 20 | 6.7% |
| 65 to 74 Years | 57 | 19.1% |
| 75 to 84 Years | 14 | 4.7% |
| 85 Years and Over | 0 | 0.0% |
| Total | 298 | 100.0% |
Housing Finances in Holiday Lakes
Median Income by Occupancy in Holiday Lakes
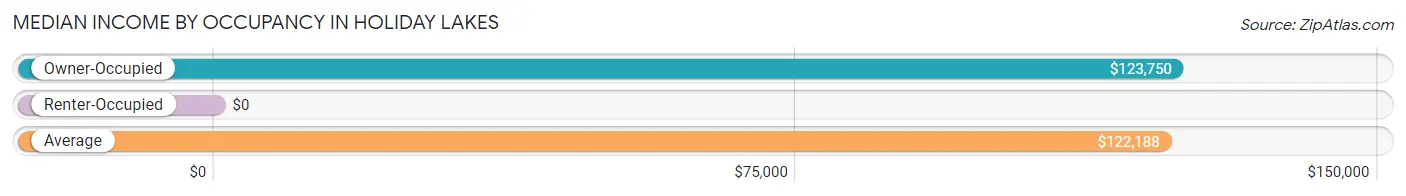
| Occupancy Type | # Households | Median Income |
| Owner-Occupied | 290 (97.3%) | $123,750 |
| Renter-Occupied | 8 (2.7%) | $0 |
| Average | 298 (100.0%) | $122,188 |
Occupancy by Householder Income Bracket in Holiday Lakes
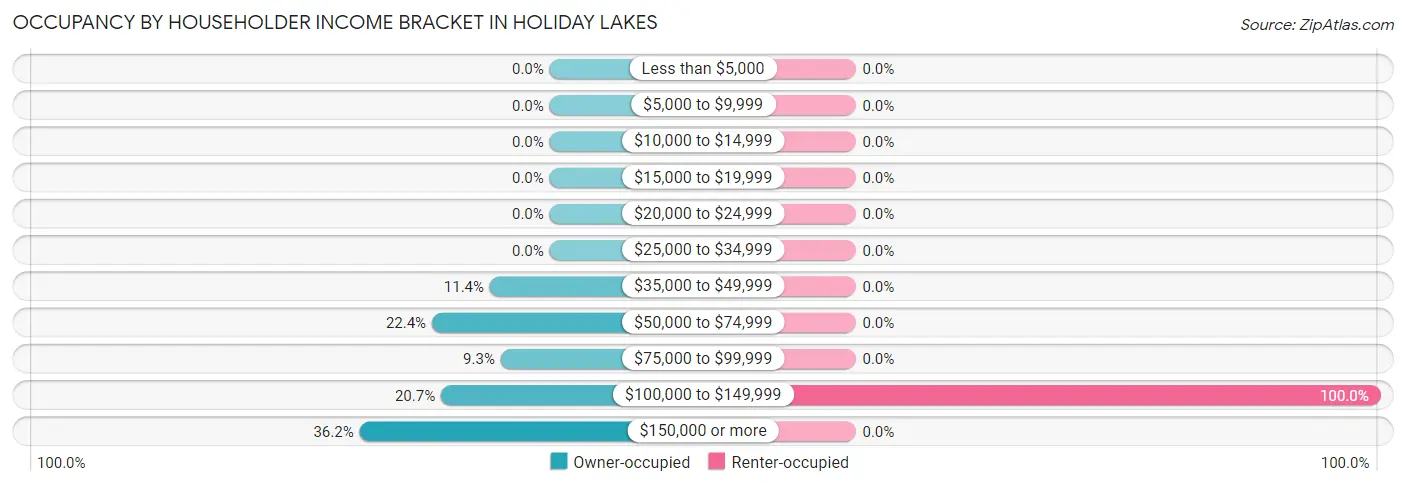
| Income Bracket | Owner-occupied | Renter-occupied |
| Less than $5,000 | 0 (0.0%) | 0 (0.0%) |
| $5,000 to $9,999 | 0 (0.0%) | 0 (0.0%) |
| $10,000 to $14,999 | 0 (0.0%) | 0 (0.0%) |
| $15,000 to $19,999 | 0 (0.0%) | 0 (0.0%) |
| $20,000 to $24,999 | 0 (0.0%) | 0 (0.0%) |
| $25,000 to $34,999 | 0 (0.0%) | 0 (0.0%) |
| $35,000 to $49,999 | 33 (11.4%) | 0 (0.0%) |
| $50,000 to $74,999 | 65 (22.4%) | 0 (0.0%) |
| $75,000 to $99,999 | 27 (9.3%) | 0 (0.0%) |
| $100,000 to $149,999 | 60 (20.7%) | 8 (100.0%) |
| $150,000 or more | 105 (36.2%) | 0 (0.0%) |
| Total | 290 (100.0%) | 8 (100.0%) |
Monthly Housing Cost Tiers in Holiday Lakes
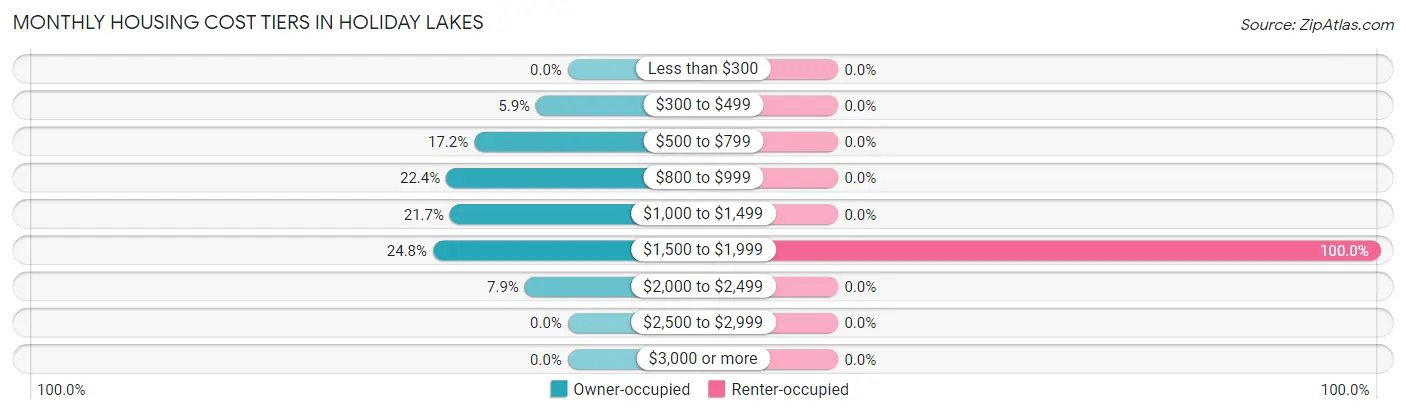
| Monthly Cost | Owner-occupied | Renter-occupied |
| Less than $300 | 0 (0.0%) | 0 (0.0%) |
| $300 to $499 | 17 (5.9%) | 0 (0.0%) |
| $500 to $799 | 50 (17.2%) | 0 (0.0%) |
| $800 to $999 | 65 (22.4%) | 0 (0.0%) |
| $1,000 to $1,499 | 63 (21.7%) | 0 (0.0%) |
| $1,500 to $1,999 | 72 (24.8%) | 8 (100.0%) |
| $2,000 to $2,499 | 23 (7.9%) | 0 (0.0%) |
| $2,500 to $2,999 | 0 (0.0%) | 0 (0.0%) |
| $3,000 or more | 0 (0.0%) | 0 (0.0%) |
| Total | 290 (100.0%) | 8 (100.0%) |
Physical Housing Characteristics in Holiday Lakes
Housing Structures in Holiday Lakes
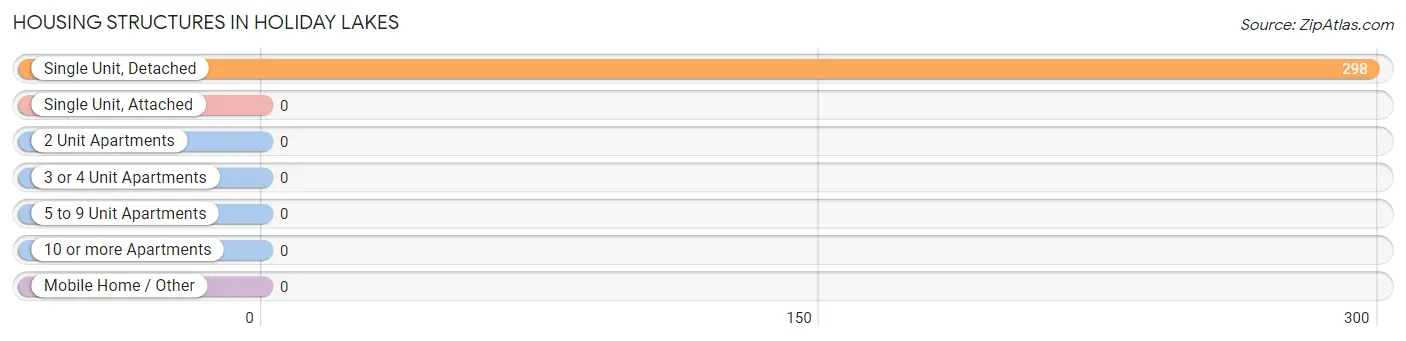
| Structure Type | # Housing Units | % Housing Units |
| Single Unit, Detached | 298 | 100.0% |
| Single Unit, Attached | 0 | 0.0% |
| 2 Unit Apartments | 0 | 0.0% |
| 3 or 4 Unit Apartments | 0 | 0.0% |
| 5 to 9 Unit Apartments | 0 | 0.0% |
| 10 or more Apartments | 0 | 0.0% |
| Mobile Home / Other | 0 | 0.0% |
| Total | 298 | 100.0% |
Housing Structures by Occupancy in Holiday Lakes
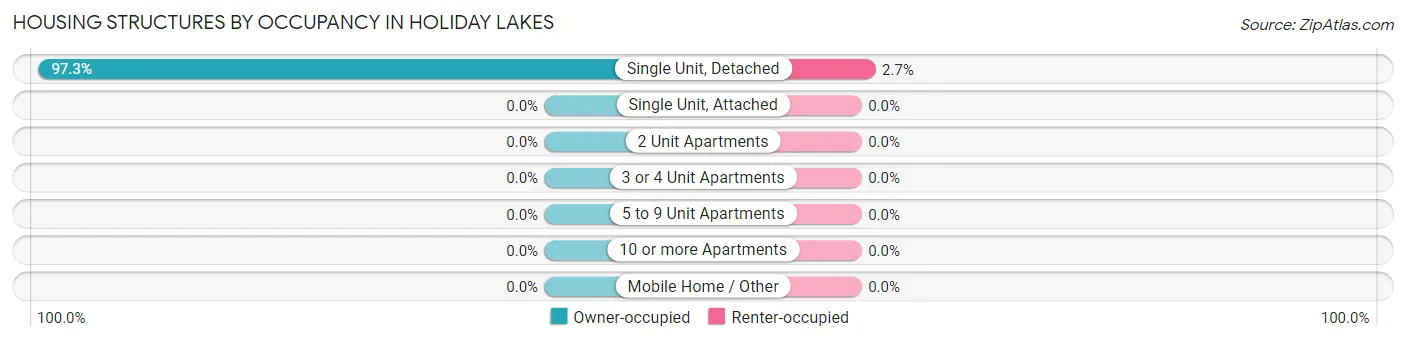
| Structure Type | Owner-occupied | Renter-occupied |
| Single Unit, Detached | 290 (97.3%) | 8 (2.7%) |
| Single Unit, Attached | 0 (0.0%) | 0 (0.0%) |
| 2 Unit Apartments | 0 (0.0%) | 0 (0.0%) |
| 3 or 4 Unit Apartments | 0 (0.0%) | 0 (0.0%) |
| 5 to 9 Unit Apartments | 0 (0.0%) | 0 (0.0%) |
| 10 or more Apartments | 0 (0.0%) | 0 (0.0%) |
| Mobile Home / Other | 0 (0.0%) | 0 (0.0%) |
| Total | 290 (97.3%) | 8 (2.7%) |
Housing Structures by Number of Rooms in Holiday Lakes
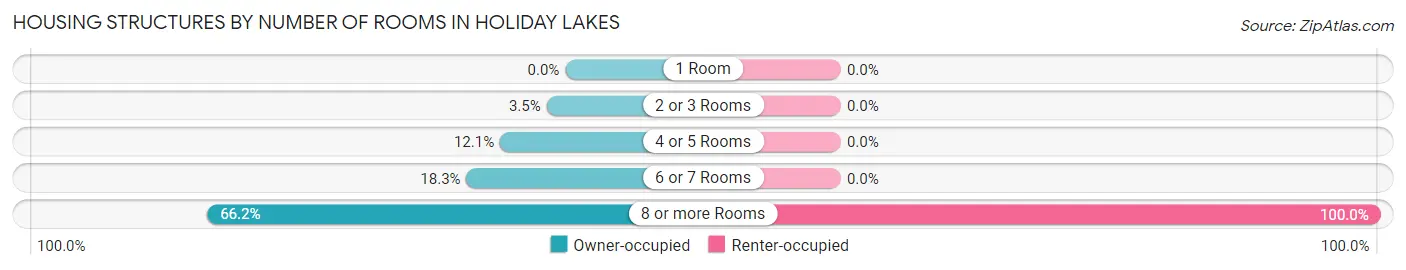
| Number of Rooms | Owner-occupied | Renter-occupied |
| 1 Room | 0 (0.0%) | 0 (0.0%) |
| 2 or 3 Rooms | 10 (3.5%) | 0 (0.0%) |
| 4 or 5 Rooms | 35 (12.1%) | 0 (0.0%) |
| 6 or 7 Rooms | 53 (18.3%) | 0 (0.0%) |
| 8 or more Rooms | 192 (66.2%) | 8 (100.0%) |
| Total | 290 (100.0%) | 8 (100.0%) |
Housing Structure by Heating Type in Holiday Lakes
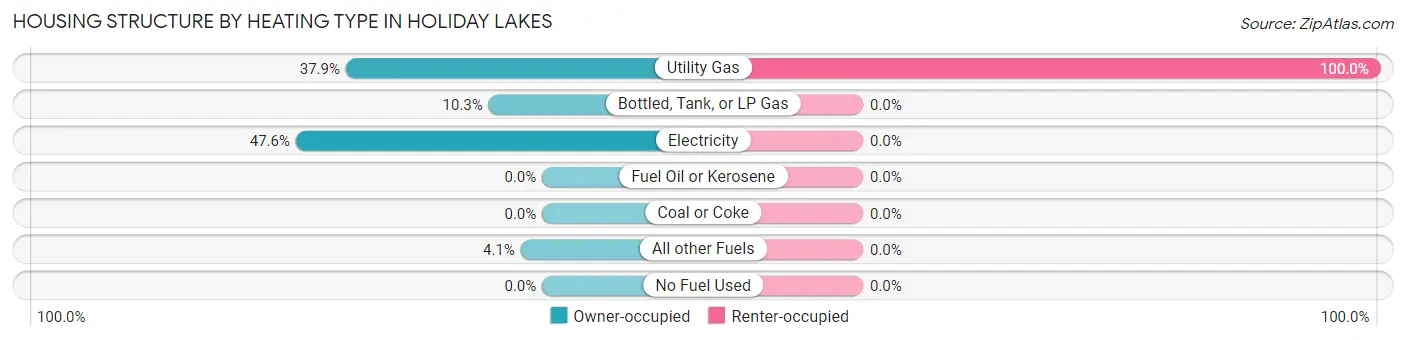
| Heating Type | Owner-occupied | Renter-occupied |
| Utility Gas | 110 (37.9%) | 8 (100.0%) |
| Bottled, Tank, or LP Gas | 30 (10.3%) | 0 (0.0%) |
| Electricity | 138 (47.6%) | 0 (0.0%) |
| Fuel Oil or Kerosene | 0 (0.0%) | 0 (0.0%) |
| Coal or Coke | 0 (0.0%) | 0 (0.0%) |
| All other Fuels | 12 (4.1%) | 0 (0.0%) |
| No Fuel Used | 0 (0.0%) | 0 (0.0%) |
| Total | 290 (100.0%) | 8 (100.0%) |
Household Vehicle Usage in Holiday Lakes
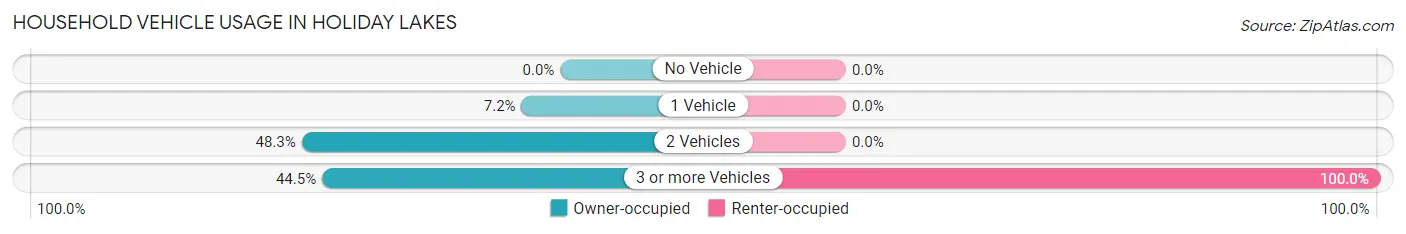
| Vehicles per Household | Owner-occupied | Renter-occupied |
| No Vehicle | 0 (0.0%) | 0 (0.0%) |
| 1 Vehicle | 21 (7.2%) | 0 (0.0%) |
| 2 Vehicles | 140 (48.3%) | 0 (0.0%) |
| 3 or more Vehicles | 129 (44.5%) | 8 (100.0%) |
| Total | 290 (100.0%) | 8 (100.0%) |
Real Estate & Mortgages in Holiday Lakes
Real Estate and Mortgage Overview in Holiday Lakes
| Characteristic | Without Mortgage | With Mortgage |
| Housing Units | 50 | 240 |
| Median Property Value | $223,500 | $206,400 |
| Median Household Income | $130,000 | $90 |
| Monthly Housing Costs | $580 | $0 |
| Real Estate Taxes | $2,714 | $0 |
Property Value by Mortgage Status in Holiday Lakes
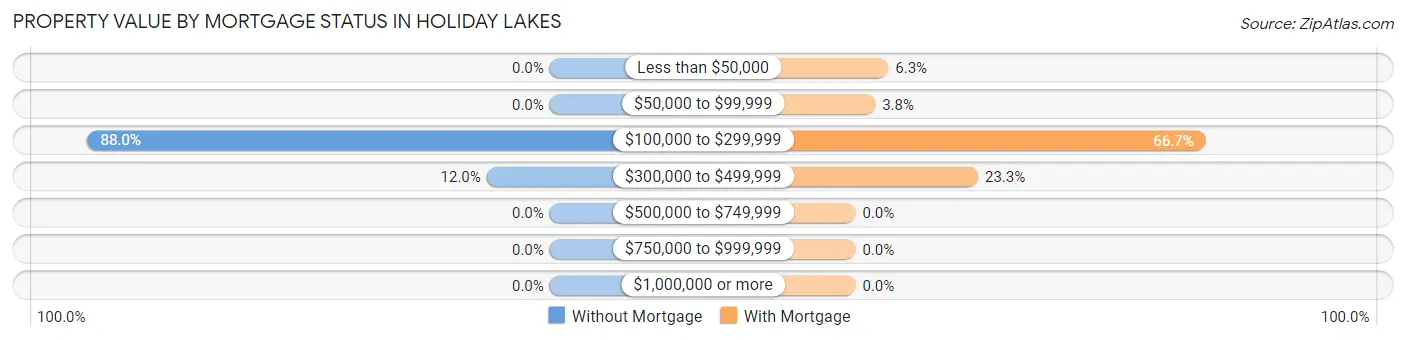
| Property Value | Without Mortgage | With Mortgage |
| Less than $50,000 | 0 (0.0%) | 15 (6.2%) |
| $50,000 to $99,999 | 0 (0.0%) | 9 (3.7%) |
| $100,000 to $299,999 | 44 (88.0%) | 160 (66.7%) |
| $300,000 to $499,999 | 6 (12.0%) | 56 (23.3%) |
| $500,000 to $749,999 | 0 (0.0%) | 0 (0.0%) |
| $750,000 to $999,999 | 0 (0.0%) | 0 (0.0%) |
| $1,000,000 or more | 0 (0.0%) | 0 (0.0%) |
| Total | 50 (100.0%) | 240 (100.0%) |
Household Income by Mortgage Status in Holiday Lakes
| Household Income | Without Mortgage | With Mortgage |
| Less than $10,000 | 0 (0.0%) | 9 (3.7%) |
| $10,000 to $24,999 | 0 (0.0%) | 0 (0.0%) |
| $25,000 to $34,999 | 0 (0.0%) | 0 (0.0%) |
| $35,000 to $49,999 | 0 (0.0%) | 0 (0.0%) |
| $50,000 to $74,999 | 0 (0.0%) | 33 (13.8%) |
| $75,000 to $99,999 | 12 (24.0%) | 65 (27.1%) |
| $100,000 to $149,999 | 23 (46.0%) | 15 (6.2%) |
| $150,000 or more | 15 (30.0%) | 37 (15.4%) |
| Total | 50 (100.0%) | 240 (100.0%) |
Property Value to Household Income Ratio in Holiday Lakes
| Value-to-Income Ratio | Without Mortgage | With Mortgage |
| Less than 2.0x | 39 (78.0%) | 119,250 (49,687.5%) |
| 2.0x to 2.9x | 0 (0.0%) | 108 (45.0%) |
| 3.0x to 3.9x | 11 (22.0%) | 123 (51.2%) |
| 4.0x or more | 0 (0.0%) | 9 (3.7%) |
| Total | 50 (100.0%) | 240 (100.0%) |
Real Estate Taxes by Mortgage Status in Holiday Lakes
| Property Taxes | Without Mortgage | With Mortgage |
| Less than $800 | 0 (0.0%) | 0 (0.0%) |
| $800 to $1,499 | 10 (20.0%) | 15 (6.2%) |
| $800 to $1,499 | 40 (80.0%) | 79 (32.9%) |
| Total | 50 (100.0%) | 240 (100.0%) |
Health & Disability in Holiday Lakes
Health Insurance Coverage by Age in Holiday Lakes
| Age Bracket | With Coverage | Without Coverage |
| Under 6 Years | 46 (100.0%) | 0 (0.0%) |
| 6 to 18 Years | 47 (100.0%) | 0 (0.0%) |
| 19 to 25 Years | 13 (100.0%) | 0 (0.0%) |
| 26 to 34 Years | 62 (100.0%) | 0 (0.0%) |
| 35 to 44 Years | 55 (100.0%) | 0 (0.0%) |
| 45 to 54 Years | 265 (100.0%) | 0 (0.0%) |
| 55 to 64 Years | 85 (100.0%) | 0 (0.0%) |
| 65 to 74 Years | 90 (100.0%) | 0 (0.0%) |
| 75 Years and older | 37 (100.0%) | 0 (0.0%) |
| Total | 700 (100.0%) | 0 (0.0%) |
Health Insurance Coverage by Citizenship Status in Holiday Lakes
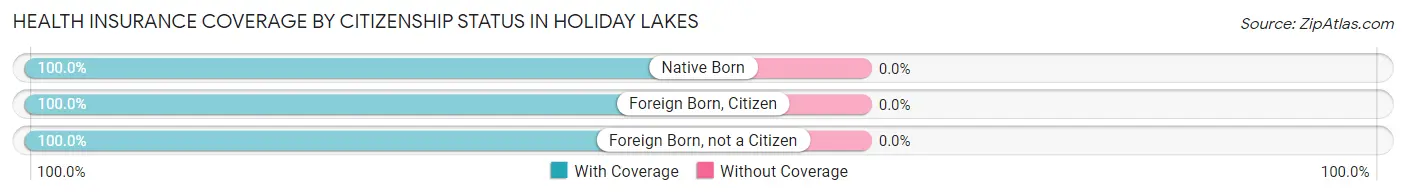
| Citizenship Status | With Coverage | Without Coverage |
| Native Born | 46 (100.0%) | 0 (0.0%) |
| Foreign Born, Citizen | 47 (100.0%) | 0 (0.0%) |
| Foreign Born, not a Citizen | 13 (100.0%) | 0 (0.0%) |
Health Insurance Coverage by Household Income in Holiday Lakes
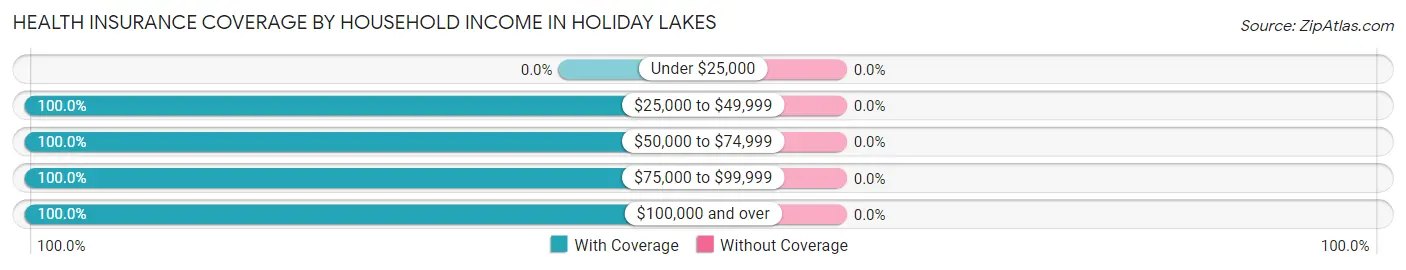
| Household Income | With Coverage | Without Coverage |
| Under $25,000 | 0 (0.0%) | 0 (0.0%) |
| $25,000 to $49,999 | 70 (100.0%) | 0 (0.0%) |
| $50,000 to $74,999 | 170 (100.0%) | 0 (0.0%) |
| $75,000 to $99,999 | 65 (100.0%) | 0 (0.0%) |
| $100,000 and over | 395 (100.0%) | 0 (0.0%) |
Public vs Private Health Insurance Coverage by Age in Holiday Lakes
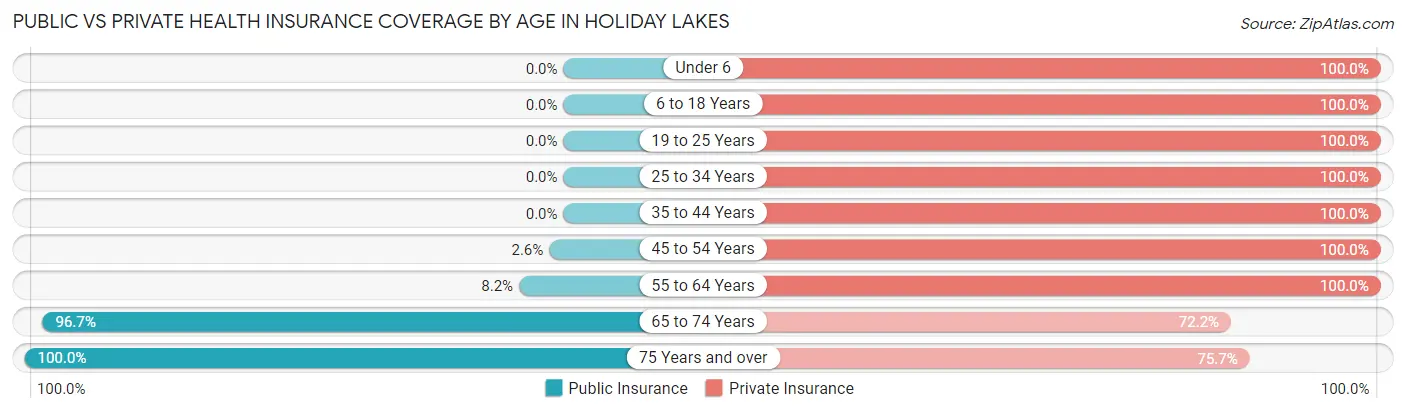
| Age Bracket | Public Insurance | Private Insurance |
| Under 6 | 0 (0.0%) | 46 (100.0%) |
| 6 to 18 Years | 0 (0.0%) | 47 (100.0%) |
| 19 to 25 Years | 0 (0.0%) | 13 (100.0%) |
| 25 to 34 Years | 0 (0.0%) | 62 (100.0%) |
| 35 to 44 Years | 0 (0.0%) | 55 (100.0%) |
| 45 to 54 Years | 7 (2.6%) | 265 (100.0%) |
| 55 to 64 Years | 7 (8.2%) | 85 (100.0%) |
| 65 to 74 Years | 87 (96.7%) | 65 (72.2%) |
| 75 Years and over | 37 (100.0%) | 28 (75.7%) |
| Total | 138 (19.7%) | 666 (95.1%) |
Disability Status by Sex by Age in Holiday Lakes
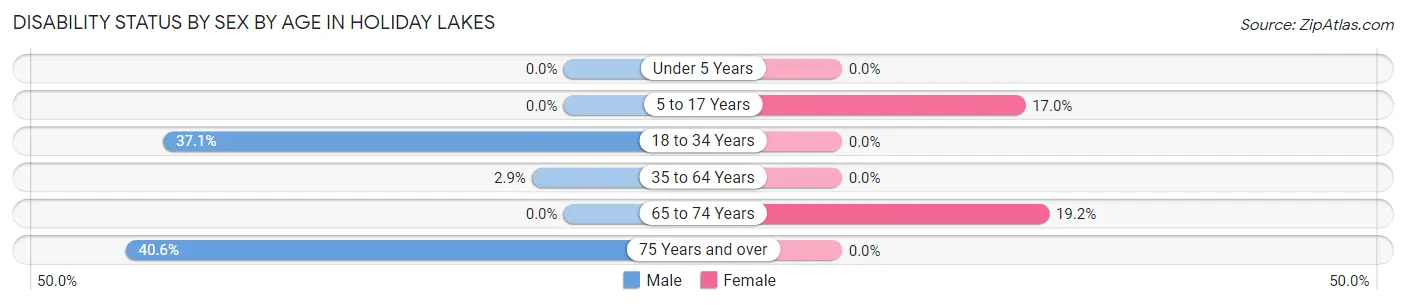
| Age Bracket | Male | Female |
| Under 5 Years | 0 (0.0%) | 0 (0.0%) |
| 5 to 17 Years | 0 (0.0%) | 8 (17.0%) |
| 18 to 34 Years | 13 (37.1%) | 0 (0.0%) |
| 35 to 64 Years | 7 (2.9%) | 0 (0.0%) |
| 65 to 74 Years | 0 (0.0%) | 10 (19.2%) |
| 75 Years and over | 13 (40.6%) | 0 (0.0%) |
Disability Class by Sex by Age in Holiday Lakes
Disability Class: Hearing Difficulty
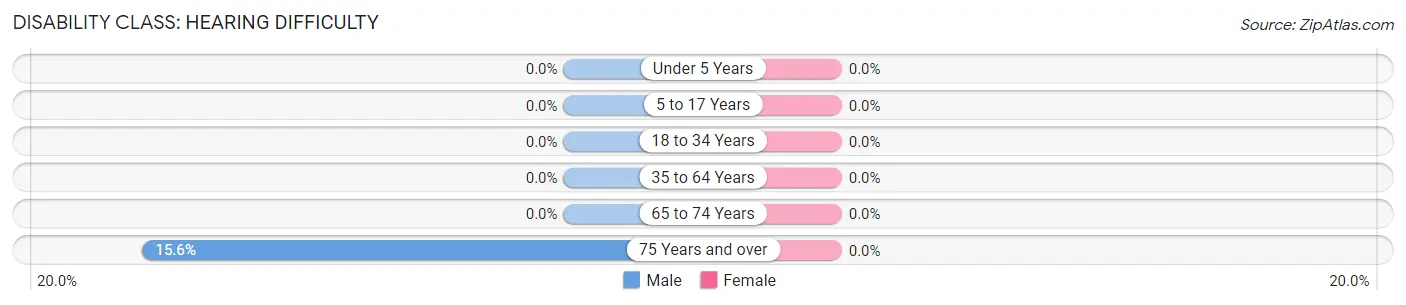
| Age Bracket | Male | Female |
| Under 5 Years | 0 (0.0%) | 0 (0.0%) |
| 5 to 17 Years | 0 (0.0%) | 0 (0.0%) |
| 18 to 34 Years | 0 (0.0%) | 0 (0.0%) |
| 35 to 64 Years | 0 (0.0%) | 0 (0.0%) |
| 65 to 74 Years | 0 (0.0%) | 0 (0.0%) |
| 75 Years and over | 5 (15.6%) | 0 (0.0%) |
Disability Class: Vision Difficulty
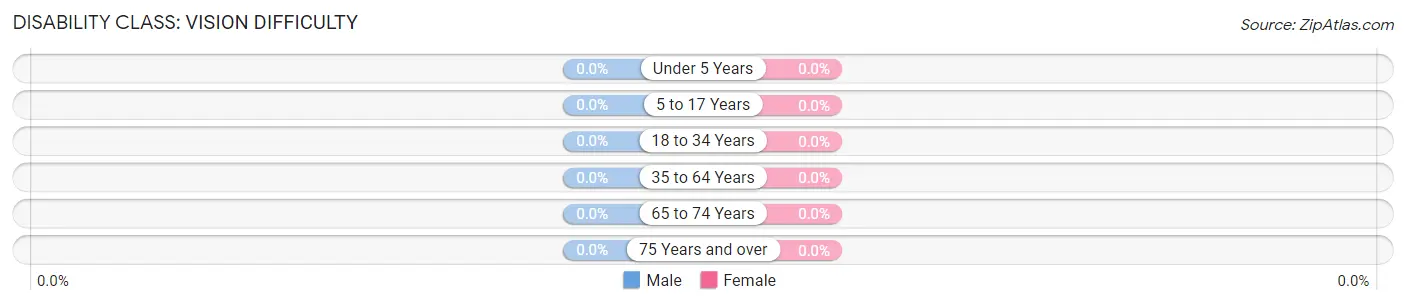
| Age Bracket | Male | Female |
| Under 5 Years | 0 (0.0%) | 0 (0.0%) |
| 5 to 17 Years | 0 (0.0%) | 0 (0.0%) |
| 18 to 34 Years | 0 (0.0%) | 0 (0.0%) |
| 35 to 64 Years | 0 (0.0%) | 0 (0.0%) |
| 65 to 74 Years | 0 (0.0%) | 0 (0.0%) |
| 75 Years and over | 0 (0.0%) | 0 (0.0%) |
Disability Class: Cognitive Difficulty
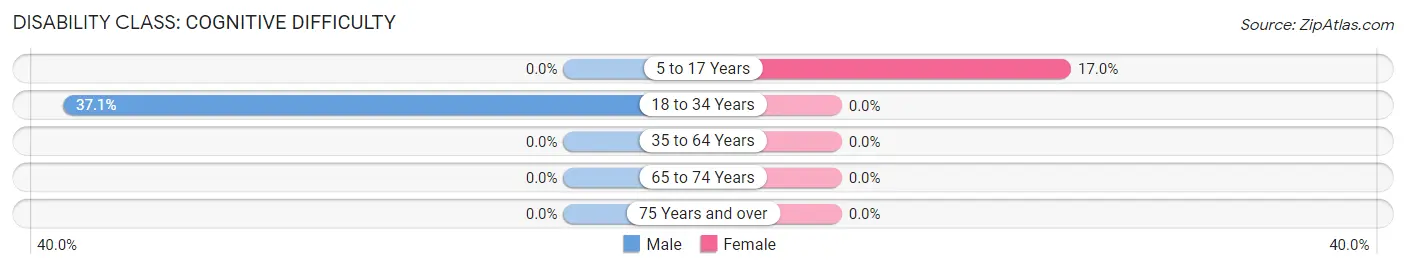
| Age Bracket | Male | Female |
| 5 to 17 Years | 0 (0.0%) | 8 (17.0%) |
| 18 to 34 Years | 13 (37.1%) | 0 (0.0%) |
| 35 to 64 Years | 0 (0.0%) | 0 (0.0%) |
| 65 to 74 Years | 0 (0.0%) | 0 (0.0%) |
| 75 Years and over | 0 (0.0%) | 0 (0.0%) |
Disability Class: Ambulatory Difficulty
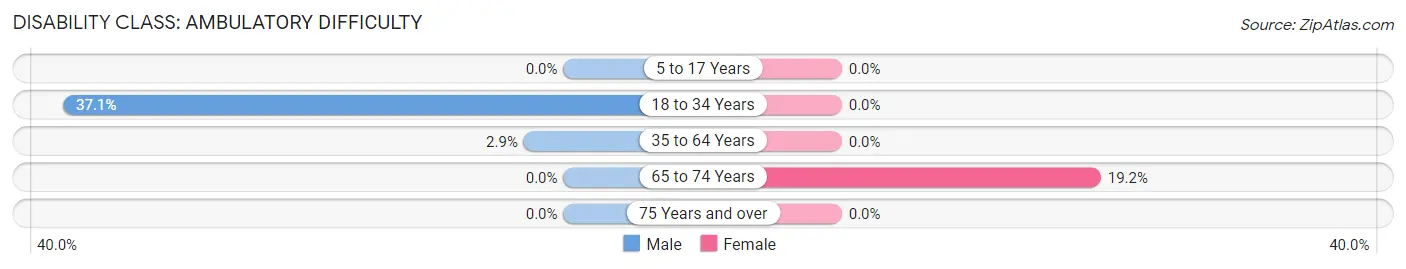
| Age Bracket | Male | Female |
| 5 to 17 Years | 0 (0.0%) | 0 (0.0%) |
| 18 to 34 Years | 13 (37.1%) | 0 (0.0%) |
| 35 to 64 Years | 7 (2.9%) | 0 (0.0%) |
| 65 to 74 Years | 0 (0.0%) | 10 (19.2%) |
| 75 Years and over | 0 (0.0%) | 0 (0.0%) |
Disability Class: Self-Care Difficulty
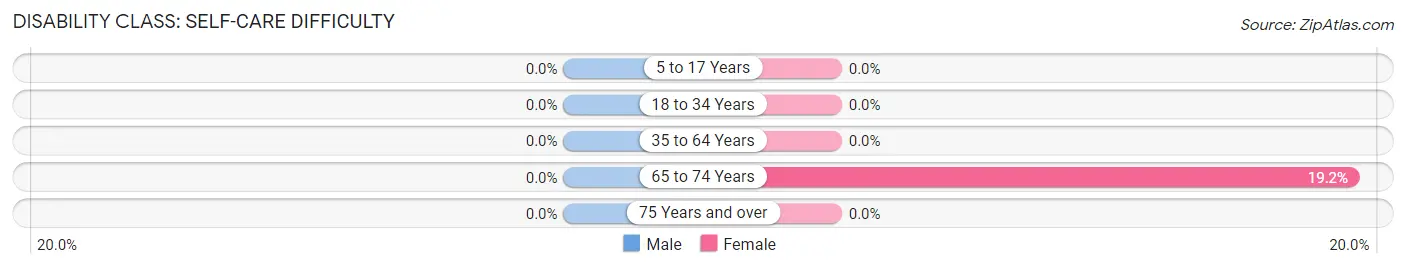
| Age Bracket | Male | Female |
| 5 to 17 Years | 0 (0.0%) | 0 (0.0%) |
| 18 to 34 Years | 0 (0.0%) | 0 (0.0%) |
| 35 to 64 Years | 0 (0.0%) | 0 (0.0%) |
| 65 to 74 Years | 0 (0.0%) | 10 (19.2%) |
| 75 Years and over | 0 (0.0%) | 0 (0.0%) |
Technology Access in Holiday Lakes
Computing Device Access in Holiday Lakes
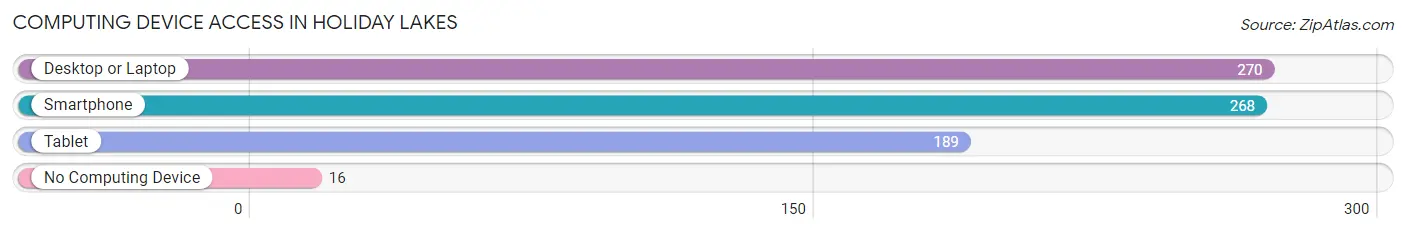
| Device Type | # Households | % Households |
| Desktop or Laptop | 270 | 90.6% |
| Smartphone | 268 | 89.9% |
| Tablet | 189 | 63.4% |
| No Computing Device | 16 | 5.4% |
| Total | 298 | 100.0% |
Internet Access in Holiday Lakes
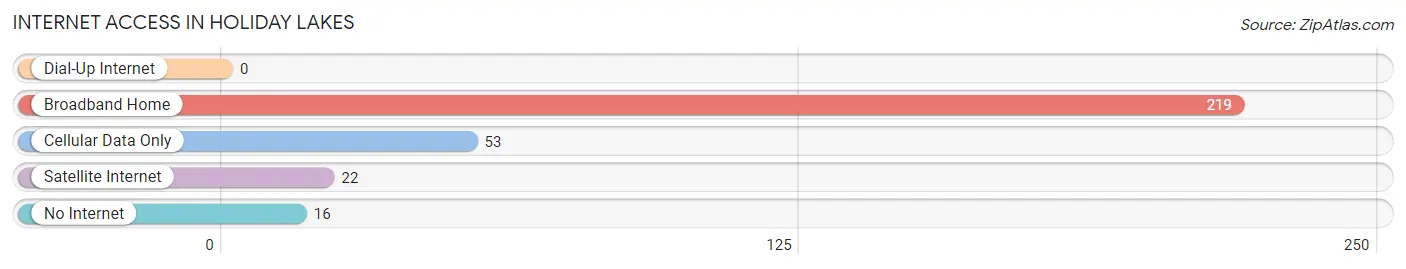
| Internet Type | # Households | % Households |
| Dial-Up Internet | 0 | 0.0% |
| Broadband Home | 219 | 73.5% |
| Cellular Data Only | 53 | 17.8% |
| Satellite Internet | 22 | 7.4% |
| No Internet | 16 | 5.4% |
| Total | 298 | 100.0% |
Holiday Lakes Summary
Holiday Lakes is a small village located in the state of Ohio, United States. It is situated in the southeastern part of the state, in the county of Cuyahoga. The village is located on the banks of the Cuyahoga River, and is part of the Cleveland-Akron-Canton metropolitan area. The population of Holiday Lakes was 1,845 at the 2010 census.
History
Holiday Lakes was founded in 1820 by a group of settlers from New England. The village was originally known as “Holiday’s Lake”, named after the first settler, John Holiday. The village was incorporated in 1837, and the name was changed to Holiday Lakes in 1845.
The village was a popular destination for vacationers in the late 19th and early 20th centuries. The village was home to several resorts, including the Holiday Lakes Hotel, which was built in 1887. The hotel was a popular destination for wealthy Clevelanders, who would come to the village to enjoy the lake and the surrounding countryside.
The village was also home to a number of factories, including a paper mill, a brickyard, and a sawmill. These factories provided employment for many of the village’s residents.
Geography
Holiday Lakes is located at 41°14'17" North, 81°37'45" West (41.238, -81.629). The village is situated on the banks of the Cuyahoga River, and is part of the Cleveland-Akron-Canton metropolitan area.
The village has a total area of 1.2 square miles, all of which is land. The village is located in a hilly area, and is surrounded by forests and farmland.
Economy
The economy of Holiday Lakes is largely based on tourism and agriculture. The village is home to several resorts, including the Holiday Lakes Hotel, which is a popular destination for vacationers. The village is also home to several farms, which produce a variety of crops, including corn, soybeans, and wheat.
The village is also home to several small businesses, including restaurants, shops, and a grocery store.
Demographics
As of the 2010 census, the population of Holiday Lakes was 1,845. The racial makeup of the village was 97.3% White, 0.7% African American, 0.2% Native American, 0.3% Asian, 0.1% from other races, and 1.4% from two or more races. Hispanic or Latino of any race were 0.7% of the population.
The median income for a household in the village was $45,938, and the median income for a family was $51,250. The per capita income for the village was $20,945. About 5.2% of families and 6.7% of the population were below the poverty line, including 8.3% of those under age 18 and 4.2% of those age 65 or over.
Common Questions
What is the Total Population of Holiday Lakes?
Total Population of Holiday Lakes is 700.
What is the Total Male Population of Holiday Lakes?
Total Male Population of Holiday Lakes is 377.
What is the Total Female Population of Holiday Lakes?
Total Female Population of Holiday Lakes is 323.
What is the Ratio of Males per 100 Females in Holiday Lakes?
There are 116.72 Males per 100 Females in Holiday Lakes.
What is the Ratio of Females per 100 Males in Holiday Lakes?
There are 85.68 Females per 100 Males in Holiday Lakes.
What is the Median Population Age in Holiday Lakes?
Median Population Age in Holiday Lakes is 52.0 Years.
What is the Average Family Size in Holiday Lakes
Average Family Size in Holiday Lakes is 2.4 People.
What is the Average Household Size in Holiday Lakes
Average Household Size in Holiday Lakes is 2.4 People.
What is Per Capita Income in Holiday Lakes?
Per Capita income in Holiday Lakes is $52,806.
What is the Median Family Income in Holiday Lakes?
Median Family Income in Holiday Lakes is $97,679.
What is the Median Household income in Holiday Lakes?
Median Household Income in Holiday Lakes is $122,188.
What is Inequality or Gini Index in Holiday Lakes?
Inequality or Gini Index in Holiday Lakes is 0.30.
How Large is the Labor Force in Holiday Lakes?
There are 452 People in the Labor Forcein in Holiday Lakes.
What is the Percentage of People in the Labor Force in Holiday Lakes?
73.4% of People are in the Labor Force in Holiday Lakes.