Green Meadows, OH
Green Meadows Map
Green Meadows Overview
2,191
TOTAL POPULATION
1,143
MALE POPULATION
1,048
FEMALE POPULATION
109.06
MALES / 100 FEMALES
91.69
FEMALES / 100 MALES
38.9
MEDIAN AGE
2.9
AVG FAMILY SIZE
2.4
AVG HOUSEHOLD SIZE
$32,472
PER CAPITA INCOME
$82,268
AVG FAMILY INCOME
$76,083
AVG HOUSEHOLD INCOME
42.9%
WAGE / INCOME GAP [ % ]
57.1¢/ $1
WAGE / INCOME GAP [ $ ]
0.31
INEQUALITY / GINI INDEX
1,178
LABOR FORCE [ PEOPLE ]
68.0%
PERCENT IN LABOR FORCE
7.1%
UNEMPLOYMENT RATE
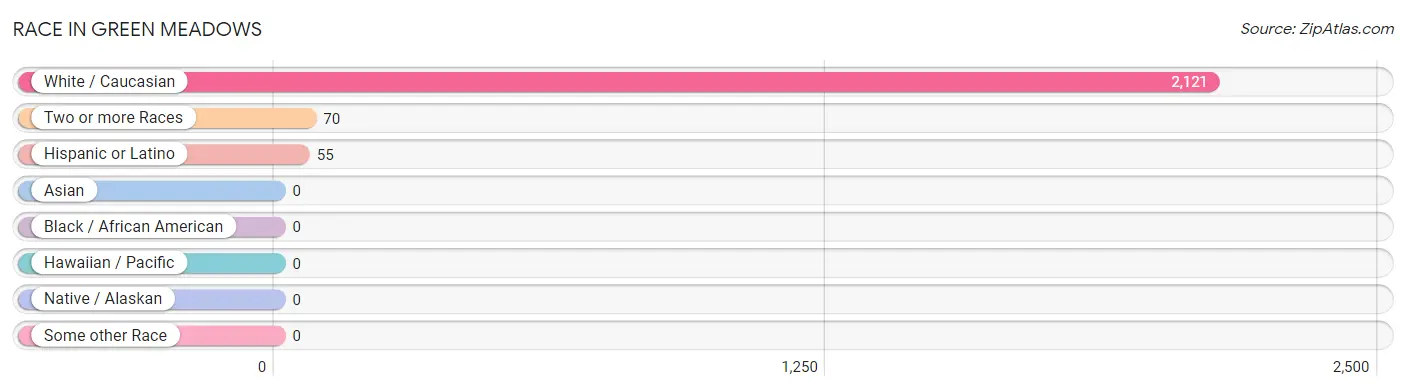
Race in Green Meadows
The most populous races in Green Meadows are White / Caucasian (2,121 | 96.8%), Two or more Races (70 | 3.2%), and Hispanic or Latino (55 | 2.5%).
| Race | # Population | % Population |
| Asian | 0 | 0.0% |
| Black / African American | 0 | 0.0% |
| Hawaiian / Pacific | 0 | 0.0% |
| Hispanic or Latino | 55 | 2.5% |
| Native / Alaskan | 0 | 0.0% |
| White / Caucasian | 2,121 | 96.8% |
| Two or more Races | 70 | 3.2% |
| Some other Race | 0 | 0.0% |
| Total | 2,191 | 100.0% |
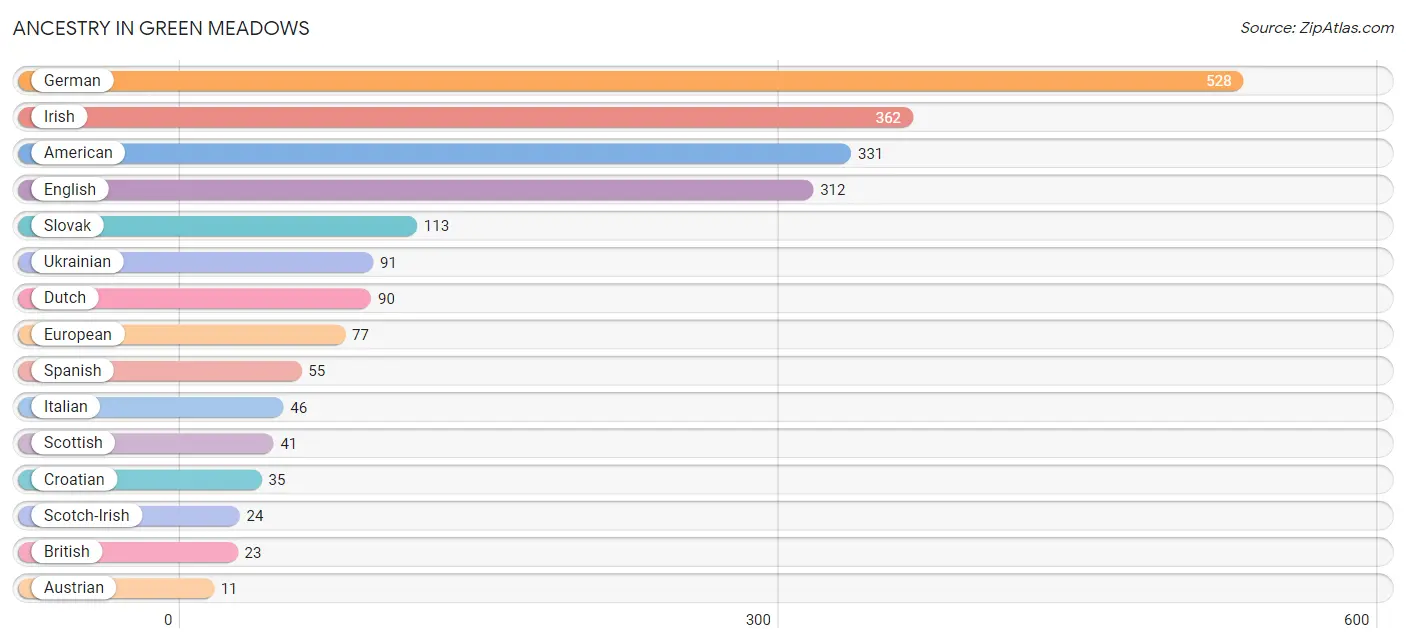
Ancestry in Green Meadows
The most populous ancestries reported in Green Meadows are German (528 | 24.1%), Irish (362 | 16.5%), American (331 | 15.1%), English (312 | 14.2%), and Slovak (113 | 5.2%), together accounting for 75.1% of all Green Meadows residents.
| Ancestry | # Population | % Population |
| American | 331 | 15.1% |
| Austrian | 11 | 0.5% |
| British | 23 | 1.1% |
| Croatian | 35 | 1.6% |
| Dutch | 90 | 4.1% |
| English | 312 | 14.2% |
| European | 77 | 3.5% |
| French | 6 | 0.3% |
| German | 528 | 24.1% |
| Irish | 362 | 16.5% |
| Italian | 46 | 2.1% |
| Polish | 9 | 0.4% |
| Scotch-Irish | 24 | 1.1% |
| Scottish | 41 | 1.9% |
| Slovak | 113 | 5.2% |
| Spanish | 55 | 2.5% |
| Ukrainian | 91 | 4.2% |
| Welsh | 6 | 0.3% | View All 18 Rows |
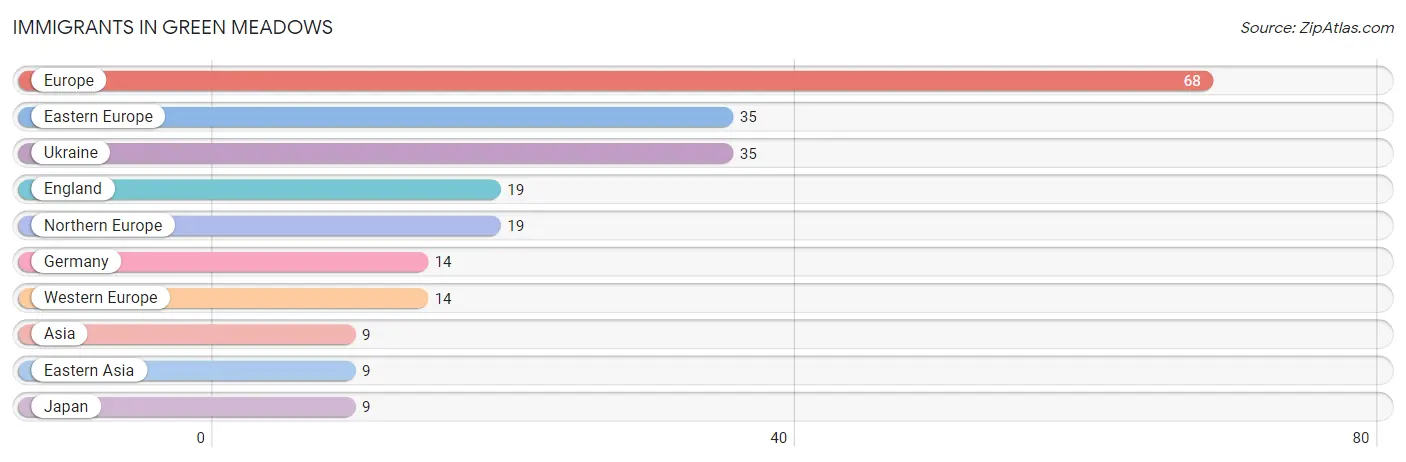
Immigrants in Green Meadows
The most numerous immigrant groups reported in Green Meadows came from Europe (68 | 3.1%), Eastern Europe (35 | 1.6%), Ukraine (35 | 1.6%), England (19 | 0.9%), and Northern Europe (19 | 0.9%), together accounting for 8.0% of all Green Meadows residents.
| Immigration Origin | # Population | % Population |
| Asia | 9 | 0.4% |
| Eastern Asia | 9 | 0.4% |
| Eastern Europe | 35 | 1.6% |
| England | 19 | 0.9% |
| Europe | 68 | 3.1% |
| Germany | 14 | 0.6% |
| Japan | 9 | 0.4% |
| Northern Europe | 19 | 0.9% |
| Ukraine | 35 | 1.6% |
| Western Europe | 14 | 0.6% | View All 10 Rows |
Sex and Age in Green Meadows
Sex and Age in Green Meadows
The most populous age groups in Green Meadows are 25 to 29 Years (104 | 9.1%) for men and 10 to 14 Years (97 | 9.3%) for women.
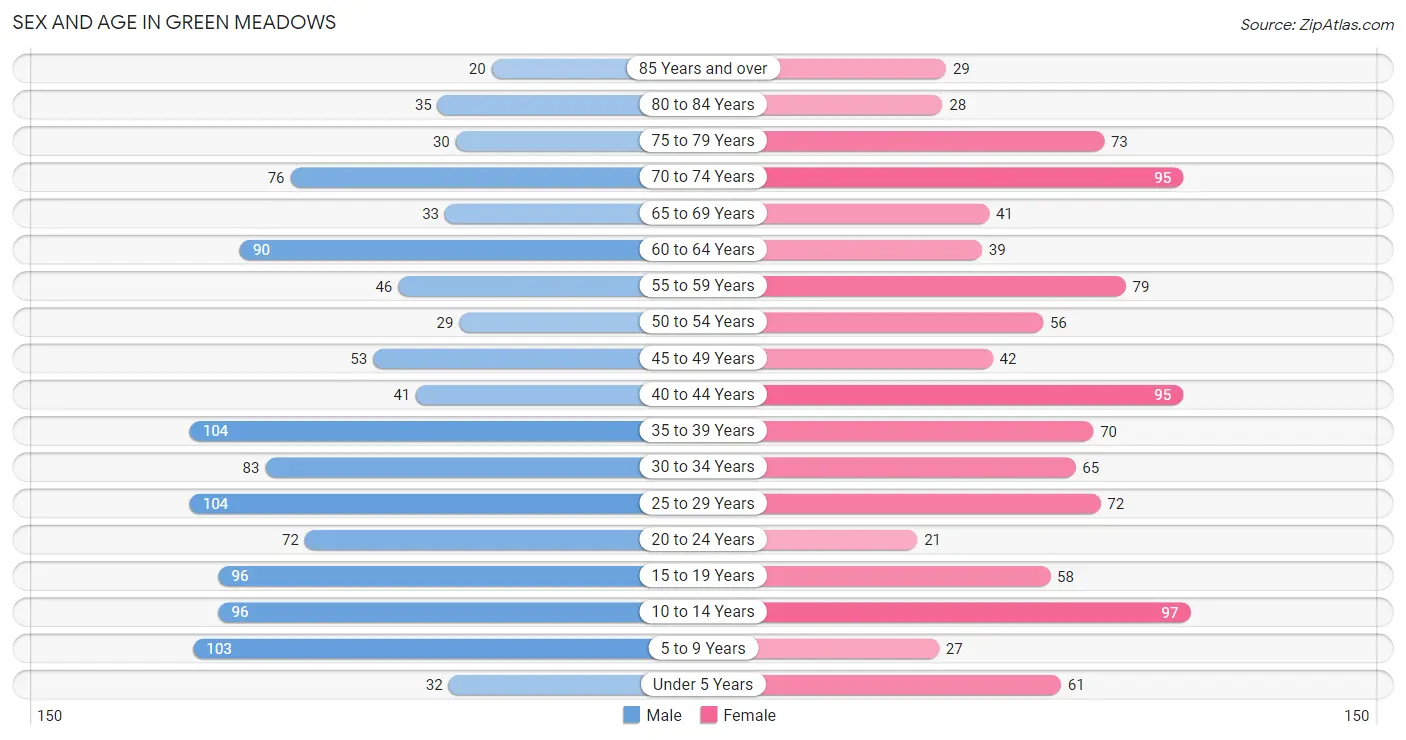
| Age Bracket | Male | Female |
| Under 5 Years | 32 (2.8%) | 61 (5.8%) |
| 5 to 9 Years | 103 (9.0%) | 27 (2.6%) |
| 10 to 14 Years | 96 (8.4%) | 97 (9.3%) |
| 15 to 19 Years | 96 (8.4%) | 58 (5.5%) |
| 20 to 24 Years | 72 (6.3%) | 21 (2.0%) |
| 25 to 29 Years | 104 (9.1%) | 72 (6.9%) |
| 30 to 34 Years | 83 (7.3%) | 65 (6.2%) |
| 35 to 39 Years | 104 (9.1%) | 70 (6.7%) |
| 40 to 44 Years | 41 (3.6%) | 95 (9.1%) |
| 45 to 49 Years | 53 (4.6%) | 42 (4.0%) |
| 50 to 54 Years | 29 (2.5%) | 56 (5.3%) |
| 55 to 59 Years | 46 (4.0%) | 79 (7.5%) |
| 60 to 64 Years | 90 (7.9%) | 39 (3.7%) |
| 65 to 69 Years | 33 (2.9%) | 41 (3.9%) |
| 70 to 74 Years | 76 (6.7%) | 95 (9.1%) |
| 75 to 79 Years | 30 (2.6%) | 73 (7.0%) |
| 80 to 84 Years | 35 (3.1%) | 28 (2.7%) |
| 85 Years and over | 20 (1.8%) | 29 (2.8%) |
| Total | 1,143 (100.0%) | 1,048 (100.0%) |
Families and Households in Green Meadows
Median Family Size in Green Meadows
The median family size in Green Meadows is 2.94 persons per family, with single female/mother families (133 | 21.1%) accounting for the largest median family size of 2.98 persons per family. On the other hand, single male/father families (26 | 4.1%) represent the smallest median family size with 2.31 persons per family.
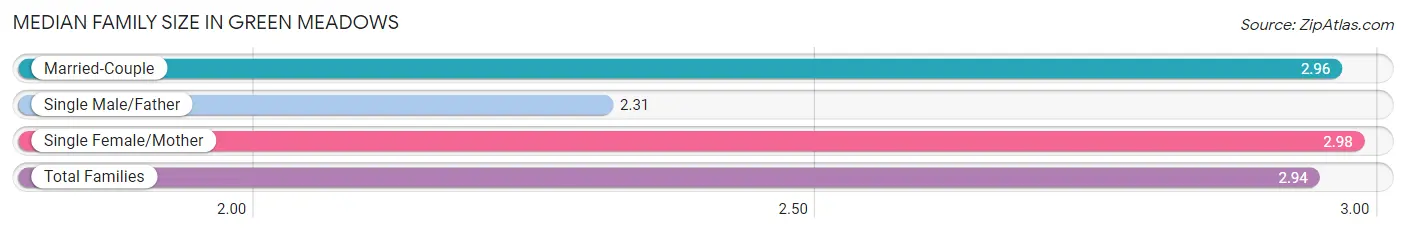
| Family Type | # Families | Family Size |
| Married-Couple | 470 (74.7%) | 2.96 |
| Single Male/Father | 26 (4.1%) | 2.31 |
| Single Female/Mother | 133 (21.1%) | 2.98 |
| Total Families | 629 (100.0%) | 2.94 |
Median Household Size in Green Meadows
The median household size in Green Meadows is 2.42 persons per household, with single female/mother households (133 | 14.7%) accounting for the largest median household size of 2.98 persons per household. non-family households (278 | 30.6%) represent the smallest median household size with 1.18 persons per household.
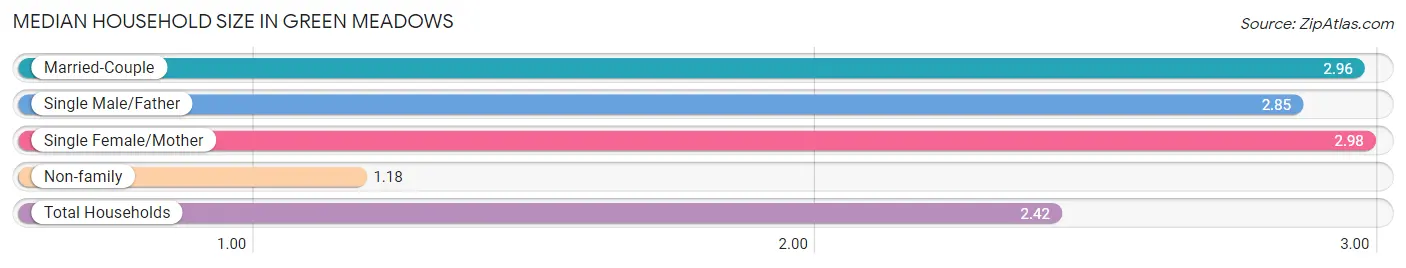
| Household Type | # Households | Household Size |
| Married-Couple | 470 (51.8%) | 2.96 |
| Single Male/Father | 26 (2.9%) | 2.85 |
| Single Female/Mother | 133 (14.7%) | 2.98 |
| Non-family | 278 (30.6%) | 1.18 |
| Total Households | 907 (100.0%) | 2.42 |
Household Size by Marriage Status in Green Meadows
Out of a total of 907 households in Green Meadows, 629 (69.4%) are family households, while 278 (30.6%) are nonfamily households. The most numerous type of family households are 2-person households, comprising 285, and the most common type of nonfamily households are 1-person households, comprising 230.
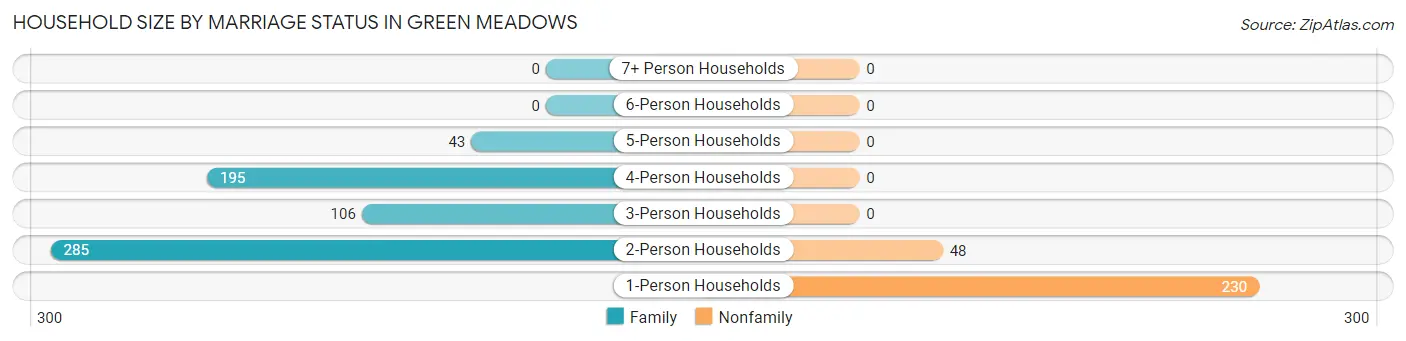
| Household Size | Family Households | Nonfamily Households |
| 1-Person Households | - | 230 (25.4%) |
| 2-Person Households | 285 (31.4%) | 48 (5.3%) |
| 3-Person Households | 106 (11.7%) | 0 (0.0%) |
| 4-Person Households | 195 (21.5%) | 0 (0.0%) |
| 5-Person Households | 43 (4.7%) | 0 (0.0%) |
| 6-Person Households | 0 (0.0%) | 0 (0.0%) |
| 7+ Person Households | 0 (0.0%) | 0 (0.0%) |
| Total | 629 (69.4%) | 278 (30.6%) |
Female Fertility in Green Meadows
Fertility by Age in Green Meadows
Average fertility rate in Green Meadows is 86.0 births per 1,000 women. Women in the age bracket of 35 to 50 years have the highest fertility rate with 136.0 births per 1,000 women. Women in the age bracket of 35 to 50 years acount for 78.4% of all women with births.
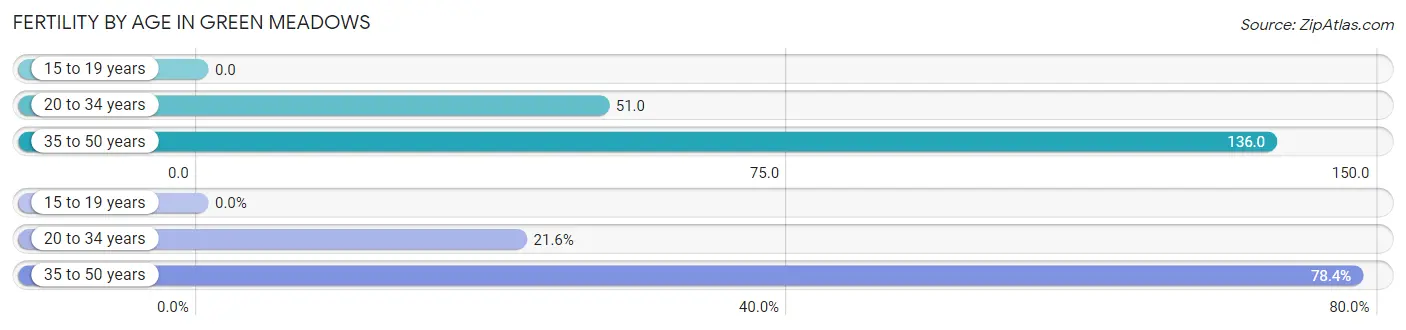
| Age Bracket | Women with Births | Births / 1,000 Women |
| 15 to 19 years | 0 (0.0%) | 0.0 |
| 20 to 34 years | 8 (21.6%) | 51.0 |
| 35 to 50 years | 29 (78.4%) | 136.0 |
| Total | 37 (100.0%) | 86.0 |
Fertility by Age by Marriage Status in Green Meadows
21.6% of women with births (37) in Green Meadows are married. The highest percentage of unmarried women with births falls into 35 to 50 years age bracket with 100.0% of them unmarried at the time of birth, while the lowest percentage of unmarried women with births belong to 20 to 34 years age bracket with 0.0% of them unmarried.
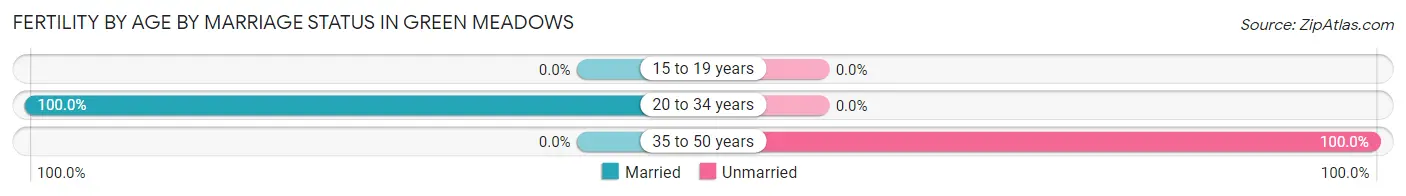
| Age Bracket | Married | Unmarried |
| 15 to 19 years | 0 (0.0%) | 0 (0.0%) |
| 20 to 34 years | 8 (100.0%) | 0 (0.0%) |
| 35 to 50 years | 0 (0.0%) | 29 (100.0%) |
| Total | 8 (21.6%) | 29 (78.4%) |
Fertility by Education in Green Meadows
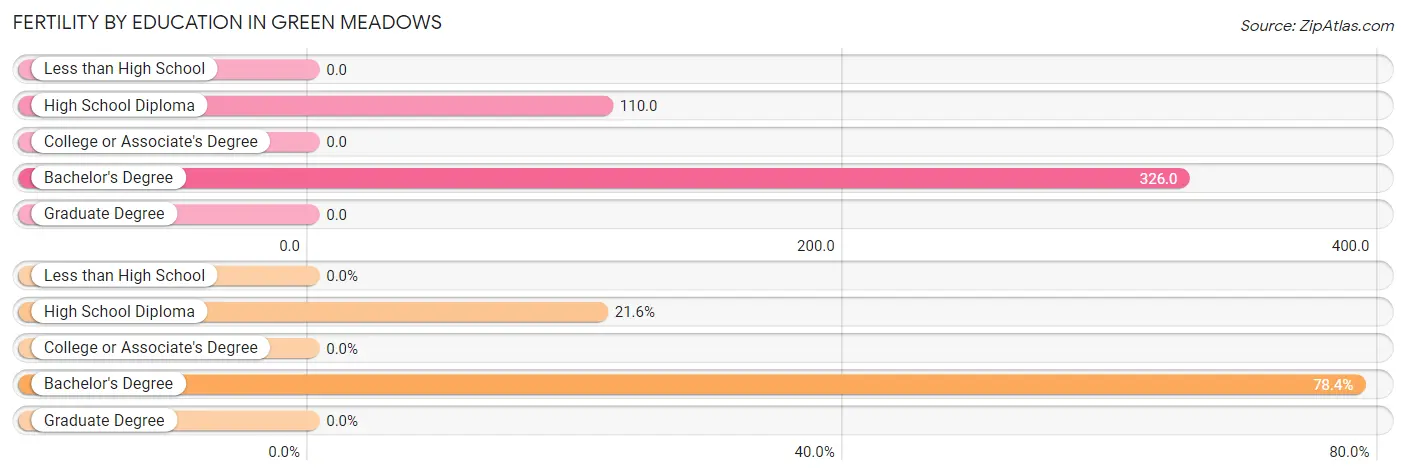
| Educational Attainment | Women with Births | Births / 1,000 Women |
| Less than High School | 0 (0.0%) | 0.0 |
| High School Diploma | 8 (21.6%) | 110.0 |
| College or Associate's Degree | 0 (0.0%) | 0.0 |
| Bachelor's Degree | 29 (78.4%) | 326.0 |
| Graduate Degree | 0 (0.0%) | 0.0 |
| Total | 37 (100.0%) | 86.0 |
Fertility by Education by Marriage Status in Green Meadows
78.4% of women with births in Green Meadows are unmarried. Women with the educational attainment of high school diploma are most likely to be married with 100.0% of them married at childbirth, while women with the educational attainment of bachelor's degree are least likely to be married with 100.0% of them unmarried at childbirth.
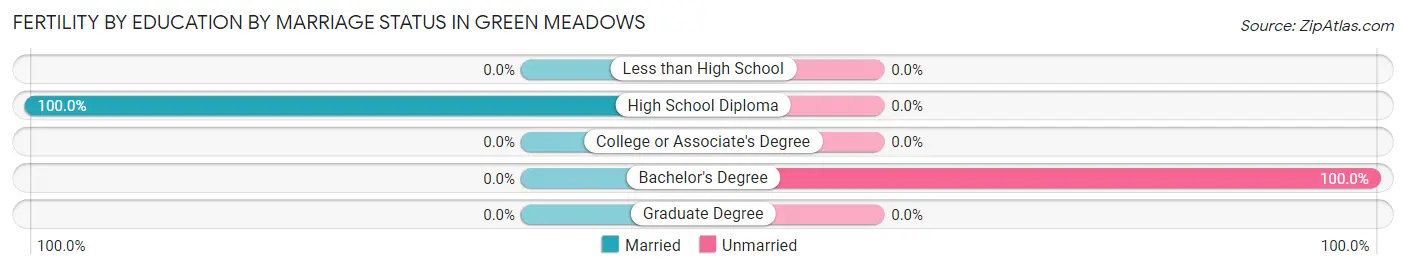
| Educational Attainment | Married | Unmarried |
| Less than High School | 0 (0.0%) | 0 (0.0%) |
| High School Diploma | 8 (100.0%) | 0 (0.0%) |
| College or Associate's Degree | 0 (0.0%) | 0 (0.0%) |
| Bachelor's Degree | 0 (0.0%) | 29 (100.0%) |
| Graduate Degree | 0 (0.0%) | 0 (0.0%) |
| Total | 8 (21.6%) | 29 (78.4%) |
Income in Green Meadows
Income Overview in Green Meadows
Per Capita Income in Green Meadows is $32,472, while median incomes of families and households are $82,268 and $76,083 respectively.
| Characteristic | Number | Measure |
| Per Capita Income | 2,191 | $32,472 |
| Median Family Income | 629 | $82,268 |
| Mean Family Income | 629 | $89,842 |
| Median Household Income | 907 | $76,083 |
| Mean Household Income | 907 | $77,796 |
| Income Deficit | 629 | $0 |
| Wage / Income Gap (%) | 2,191 | 42.86% |
| Wage / Income Gap ($) | 2,191 | 57.14¢ per $1 |
| Gini / Inequality Index | 2,191 | 0.31 |
Earnings by Sex in Green Meadows
Average Earnings in Green Meadows are $44,770, $56,375 for men and $32,214 for women, a difference of 42.9%.
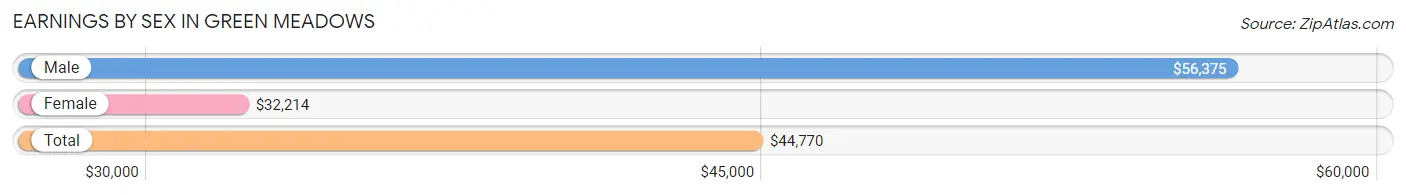
| Sex | Number | Average Earnings |
| Male | 653 (54.9%) | $56,375 |
| Female | 536 (45.1%) | $32,214 |
| Total | 1,189 (100.0%) | $44,770 |
Earnings by Sex by Income Bracket in Green Meadows
The most common earnings brackets in Green Meadows are $55,000 to $64,999 for men (105 | 16.1%) and $45,000 to $49,999 for women (115 | 21.5%).
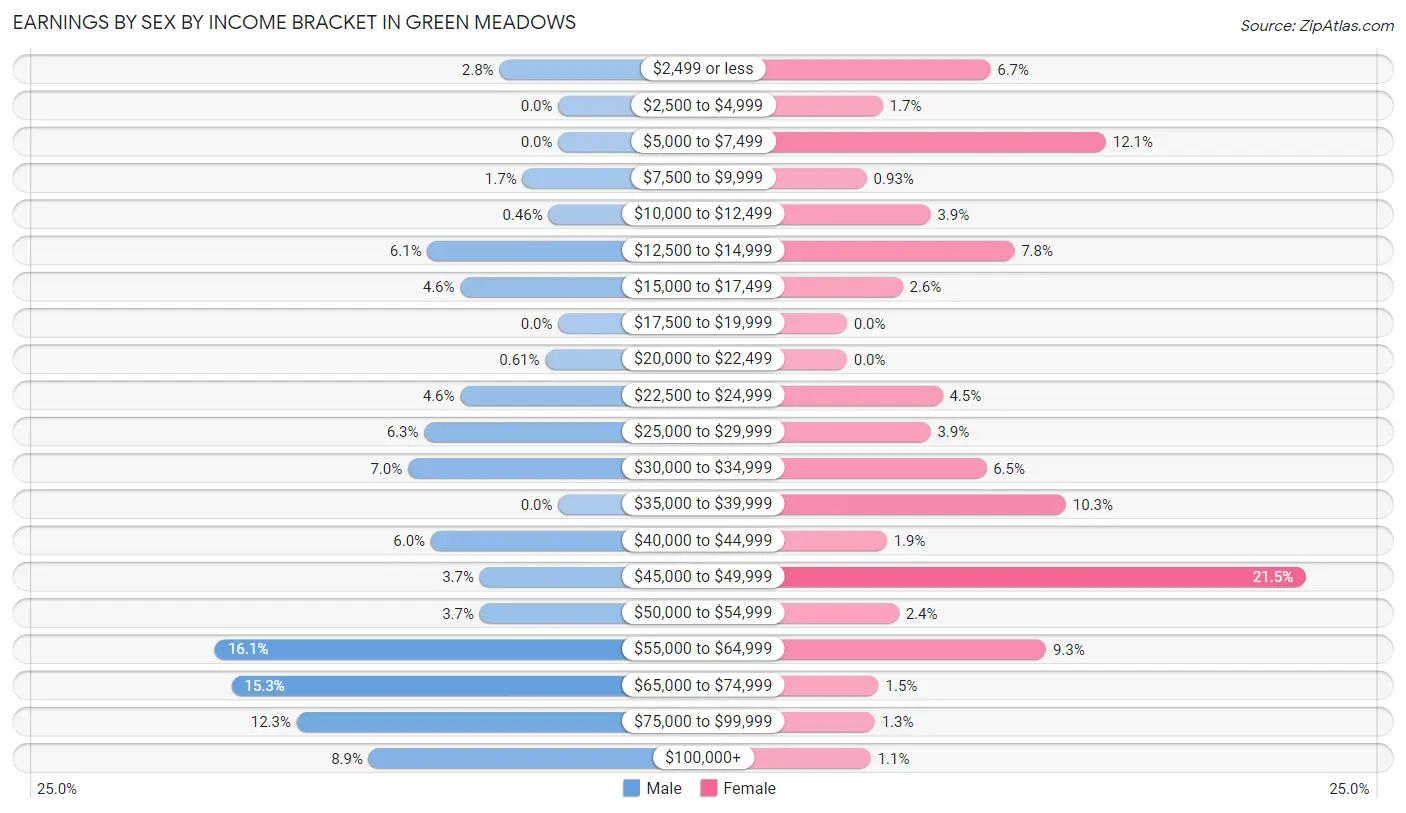
| Income | Male | Female |
| $2,499 or less | 18 (2.8%) | 36 (6.7%) |
| $2,500 to $4,999 | 0 (0.0%) | 9 (1.7%) |
| $5,000 to $7,499 | 0 (0.0%) | 65 (12.1%) |
| $7,500 to $9,999 | 11 (1.7%) | 5 (0.9%) |
| $10,000 to $12,499 | 3 (0.5%) | 21 (3.9%) |
| $12,500 to $14,999 | 40 (6.1%) | 42 (7.8%) |
| $15,000 to $17,499 | 30 (4.6%) | 14 (2.6%) |
| $17,500 to $19,999 | 0 (0.0%) | 0 (0.0%) |
| $20,000 to $22,499 | 4 (0.6%) | 0 (0.0%) |
| $22,500 to $24,999 | 30 (4.6%) | 24 (4.5%) |
| $25,000 to $29,999 | 41 (6.3%) | 21 (3.9%) |
| $30,000 to $34,999 | 46 (7.0%) | 35 (6.5%) |
| $35,000 to $39,999 | 0 (0.0%) | 55 (10.3%) |
| $40,000 to $44,999 | 39 (6.0%) | 10 (1.9%) |
| $45,000 to $49,999 | 24 (3.7%) | 115 (21.5%) |
| $50,000 to $54,999 | 24 (3.7%) | 13 (2.4%) |
| $55,000 to $64,999 | 105 (16.1%) | 50 (9.3%) |
| $65,000 to $74,999 | 100 (15.3%) | 8 (1.5%) |
| $75,000 to $99,999 | 80 (12.2%) | 7 (1.3%) |
| $100,000+ | 58 (8.9%) | 6 (1.1%) |
| Total | 653 (100.0%) | 536 (100.0%) |
Earnings by Sex by Educational Attainment in Green Meadows
Average earnings in Green Meadows are $60,638 for men and $32,107 for women, a difference of 47.0%. Men with an educational attainment of college or associate's degree enjoy the highest average annual earnings of $66,382, while those with high school diploma education earn the least with $58,906. Women with an educational attainment of bachelor's degree earn the most with the average annual earnings of $48,192, while those with college or associate's degree education have the smallest earnings of $35,511.
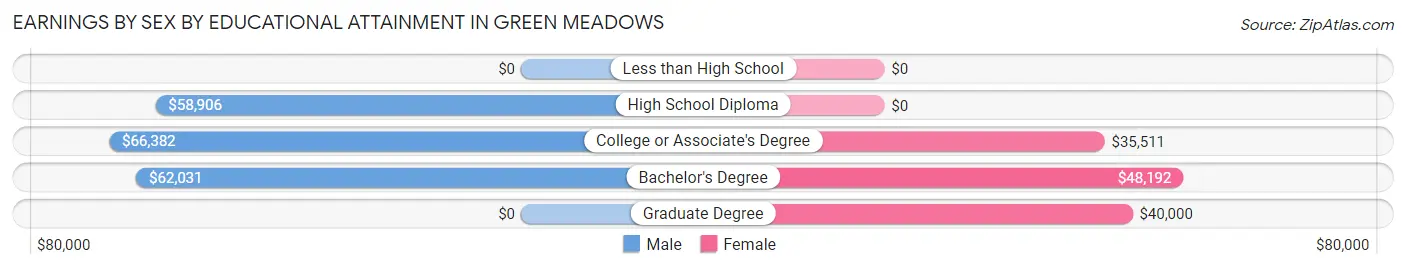
| Educational Attainment | Male Income | Female Income |
| Less than High School | - | - |
| High School Diploma | $58,906 | $0 |
| College or Associate's Degree | $66,382 | $35,511 |
| Bachelor's Degree | $62,031 | $48,192 |
| Graduate Degree | - | - |
| Total | $60,638 | $32,107 |
Family Income in Green Meadows
Family Income Brackets in Green Meadows
According to the Green Meadows family income data, there are 178 families falling into the $100,000 to $149,999 income range, which is the most common income bracket and makes up 28.3% of all families.
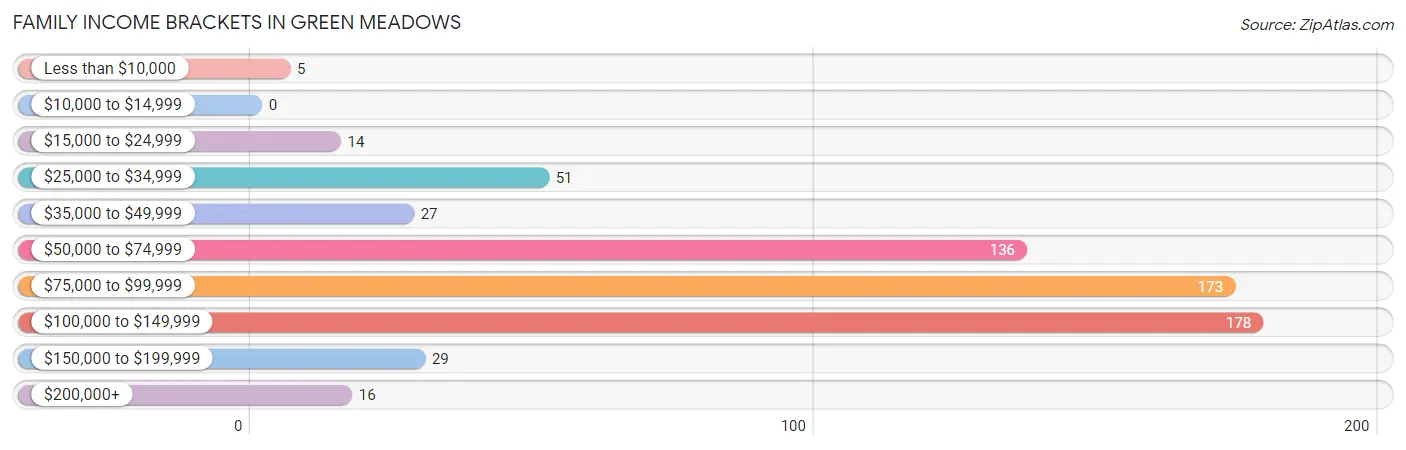
| Income Bracket | # Families | % Families |
| Less than $10,000 | 5 | 0.8% |
| $10,000 to $14,999 | 0 | 0.0% |
| $15,000 to $24,999 | 14 | 2.2% |
| $25,000 to $34,999 | 51 | 8.1% |
| $35,000 to $49,999 | 27 | 4.3% |
| $50,000 to $74,999 | 136 | 21.6% |
| $75,000 to $99,999 | 173 | 27.5% |
| $100,000 to $149,999 | 178 | 28.3% |
| $150,000 to $199,999 | 29 | 4.6% |
| $200,000+ | 16 | 2.5% |
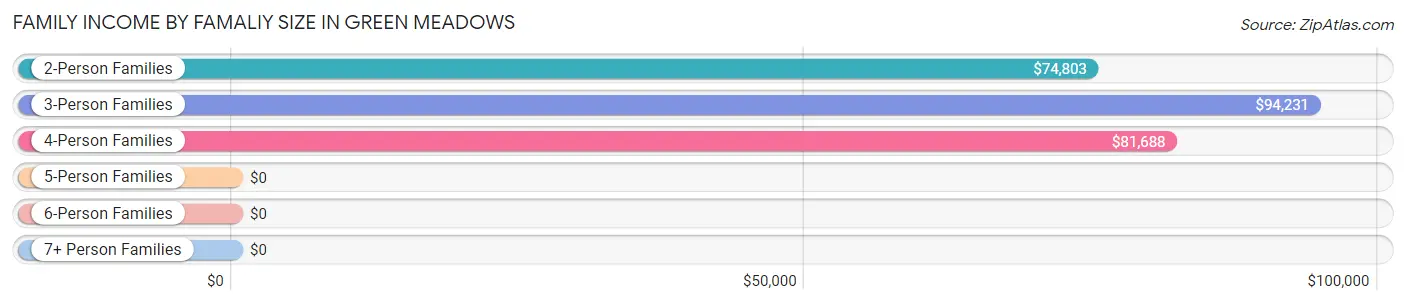
Family Income by Famaliy Size in Green Meadows
3-person families (92 | 14.6%) account for the highest median family income in Green Meadows with $94,231 per family, while 2-person families (299 | 47.5%) have the highest median income of $37,402 per family member.
| Income Bracket | # Families | Median Income |
| 2-Person Families | 299 (47.5%) | $74,803 |
| 3-Person Families | 92 (14.6%) | $94,231 |
| 4-Person Families | 195 (31.0%) | $81,688 |
| 5-Person Families | 43 (6.8%) | $0 |
| 6-Person Families | 0 (0.0%) | $0 |
| 7+ Person Families | 0 (0.0%) | $0 |
| Total | 629 (100.0%) | $82,268 |
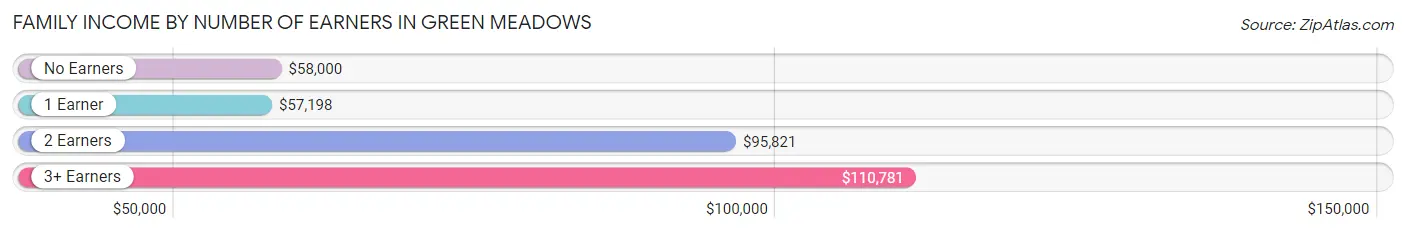
Family Income by Number of Earners in Green Meadows
The median family income in Green Meadows is $82,268, with families comprising 3+ earners (53) having the highest median family income of $110,781, while families with 1 earner (191) have the lowest median family income of $57,198, accounting for 8.4% and 30.4% of families, respectively.
| Number of Earners | # Families | Median Income |
| No Earners | 74 (11.8%) | $58,000 |
| 1 Earner | 191 (30.4%) | $57,198 |
| 2 Earners | 311 (49.4%) | $95,821 |
| 3+ Earners | 53 (8.4%) | $110,781 |
| Total | 629 (100.0%) | $82,268 |
Household Income in Green Meadows
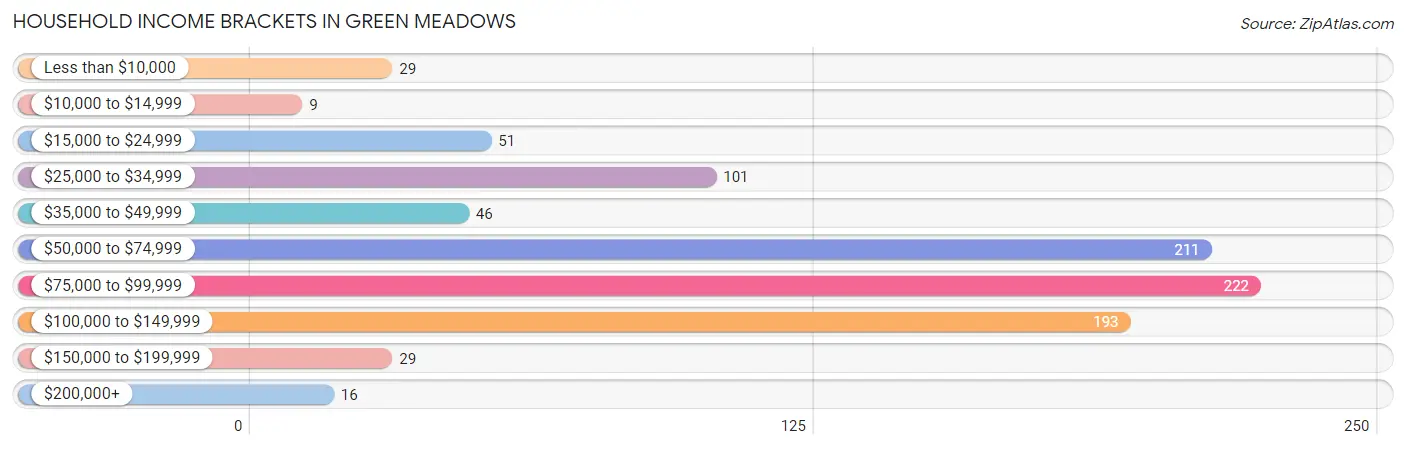
Household Income Brackets in Green Meadows
With 222 households falling in the category, the $75,000 to $99,999 income range is the most frequent in Green Meadows, accounting for 24.5% of all households. In contrast, only 9 households (1.0%) fall into the $10,000 to $14,999 income bracket, making it the least populous group.
| Income Bracket | # Households | % Households |
| Less than $10,000 | 29 | 3.2% |
| $10,000 to $14,999 | 9 | 1.0% |
| $15,000 to $24,999 | 51 | 5.6% |
| $25,000 to $34,999 | 101 | 11.1% |
| $35,000 to $49,999 | 46 | 5.1% |
| $50,000 to $74,999 | 211 | 23.3% |
| $75,000 to $99,999 | 222 | 24.5% |
| $100,000 to $149,999 | 193 | 21.3% |
| $150,000 to $199,999 | 29 | 3.2% |
| $200,000+ | 16 | 1.8% |
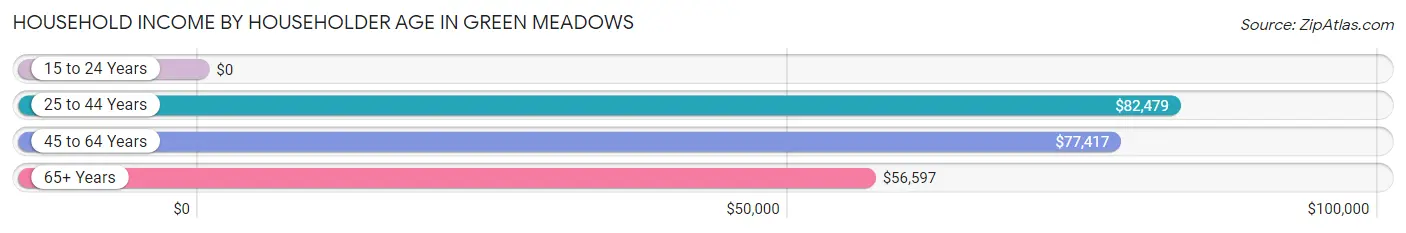
Household Income by Householder Age in Green Meadows
The median household income in Green Meadows is $76,083, with the highest median household income of $82,479 found in the 25 to 44 years age bracket for the primary householder. A total of 345 households (38.0%) fall into this category. Meanwhile, the 15 to 24 years age bracket for the primary householder has the lowest median household income of $0, with 22 households (2.4%) in this group.
| Income Bracket | # Households | Median Income |
| 15 to 24 Years | 22 (2.4%) | $0 |
| 25 to 44 Years | 345 (38.0%) | $82,479 |
| 45 to 64 Years | 227 (25.0%) | $77,417 |
| 65+ Years | 313 (34.5%) | $56,597 |
| Total | 907 (100.0%) | $76,083 |
Poverty in Green Meadows
Income Below Poverty by Sex and Age in Green Meadows
With 5.9% poverty level for males and 6.2% for females among the residents of Green Meadows, 6 to 11 year old males and 12 to 14 year old females are the most vulnerable to poverty, with 40 males (28.2%) and 19 females (29.2%) in their respective age groups living below the poverty level.
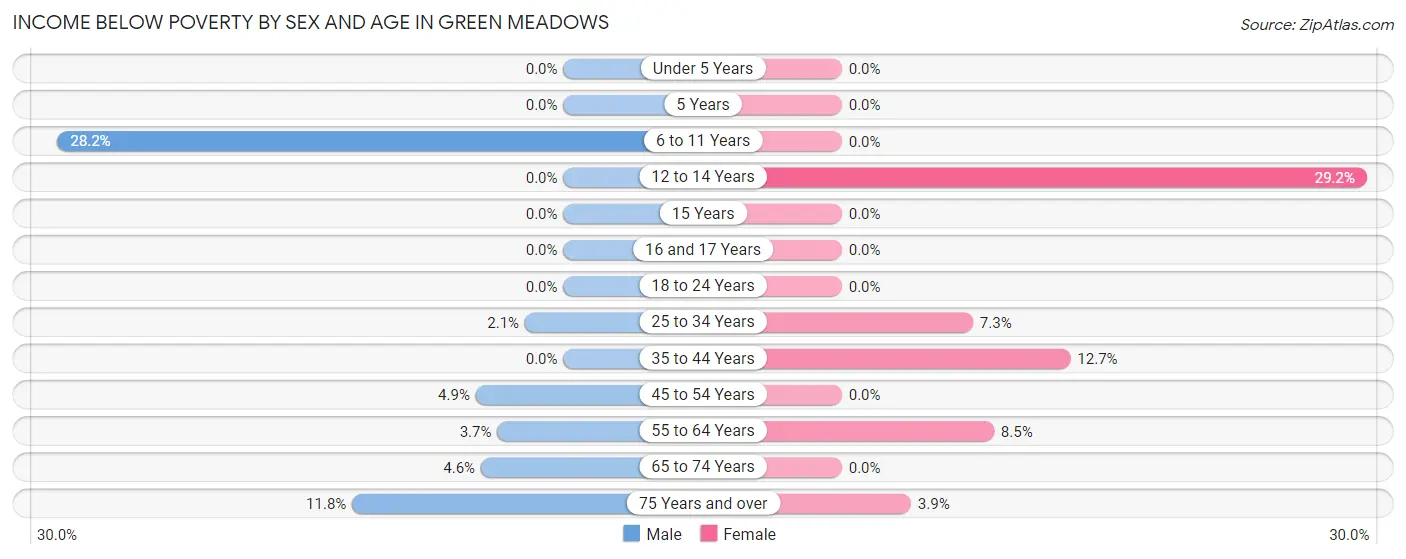
| Age Bracket | Male | Female |
| Under 5 Years | 0 (0.0%) | 0 (0.0%) |
| 5 Years | 0 (0.0%) | 0 (0.0%) |
| 6 to 11 Years | 40 (28.2%) | 0 (0.0%) |
| 12 to 14 Years | 0 (0.0%) | 19 (29.2%) |
| 15 Years | 0 (0.0%) | 0 (0.0%) |
| 16 and 17 Years | 0 (0.0%) | 0 (0.0%) |
| 18 to 24 Years | 0 (0.0%) | 0 (0.0%) |
| 25 to 34 Years | 4 (2.1%) | 10 (7.3%) |
| 35 to 44 Years | 0 (0.0%) | 21 (12.7%) |
| 45 to 54 Years | 4 (4.9%) | 0 (0.0%) |
| 55 to 64 Years | 5 (3.7%) | 10 (8.5%) |
| 65 to 74 Years | 5 (4.6%) | 0 (0.0%) |
| 75 Years and over | 10 (11.8%) | 5 (3.8%) |
| Total | 68 (5.9%) | 65 (6.2%) |
Income Above Poverty by Sex and Age in Green Meadows
According to the poverty statistics in Green Meadows, males aged under 5 years and females aged under 5 years are the age groups that are most secure financially, with 100.0% of males and 100.0% of females in these age groups living above the poverty line.
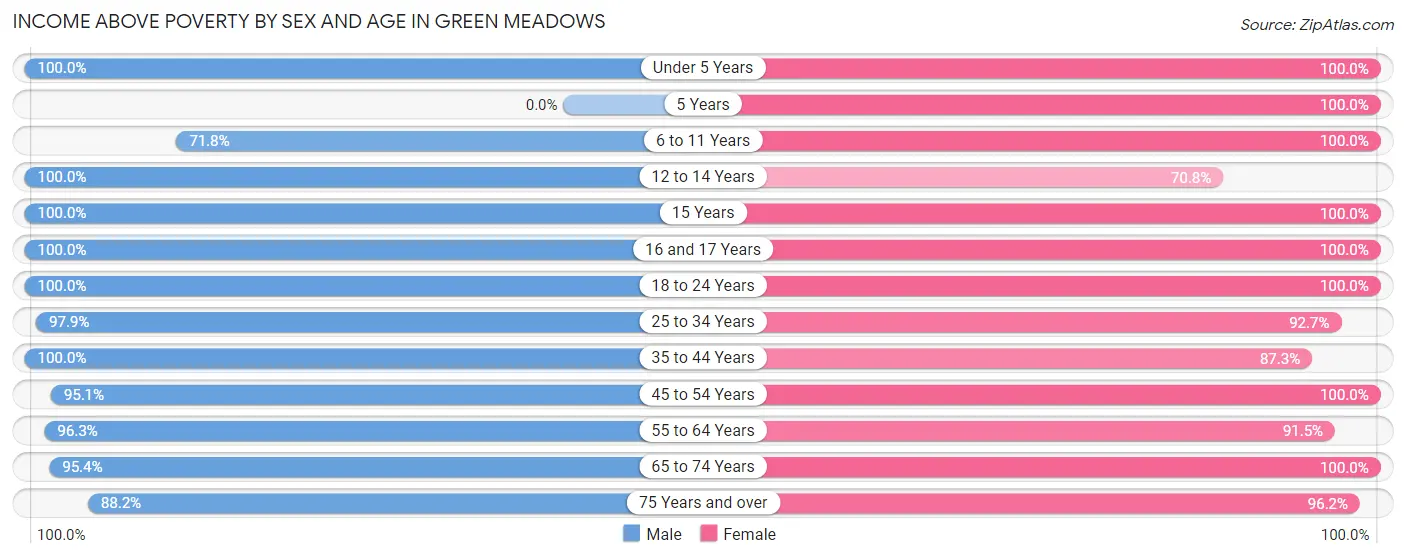
| Age Bracket | Male | Female |
| Under 5 Years | 32 (100.0%) | 61 (100.0%) |
| 5 Years | 0 (0.0%) | 10 (100.0%) |
| 6 to 11 Years | 102 (71.8%) | 49 (100.0%) |
| 12 to 14 Years | 57 (100.0%) | 46 (70.8%) |
| 15 Years | 28 (100.0%) | 15 (100.0%) |
| 16 and 17 Years | 54 (100.0%) | 29 (100.0%) |
| 18 to 24 Years | 86 (100.0%) | 35 (100.0%) |
| 25 to 34 Years | 183 (97.9%) | 127 (92.7%) |
| 35 to 44 Years | 145 (100.0%) | 144 (87.3%) |
| 45 to 54 Years | 78 (95.1%) | 98 (100.0%) |
| 55 to 64 Years | 131 (96.3%) | 108 (91.5%) |
| 65 to 74 Years | 104 (95.4%) | 136 (100.0%) |
| 75 Years and over | 75 (88.2%) | 125 (96.2%) |
| Total | 1,075 (94.1%) | 983 (93.8%) |
Income Below Poverty Among Married-Couple Families in Green Meadows
The poverty statistics for married-couple families in Green Meadows show that 1.1% or 5 of the total 470 families live below the poverty line. Families with no children have the highest poverty rate of 2.1%, comprising of 5 families. On the other hand, families with 1 or 2 children have the lowest poverty rate of 0.0%, which includes 0 families.
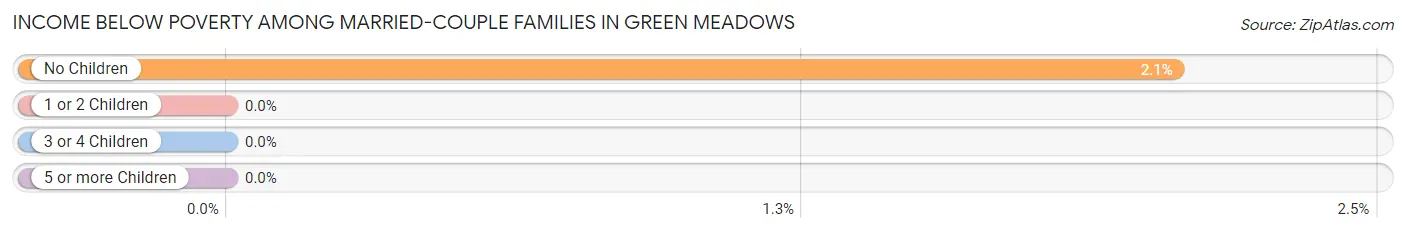
| Children | Above Poverty | Below Poverty |
| No Children | 238 (97.9%) | 5 (2.1%) |
| 1 or 2 Children | 227 (100.0%) | 0 (0.0%) |
| 3 or 4 Children | 0 (0.0%) | 0 (0.0%) |
| 5 or more Children | 0 (0.0%) | 0 (0.0%) |
| Total | 465 (98.9%) | 5 (1.1%) |
Income Below Poverty Among Single-Parent Households in Green Meadows
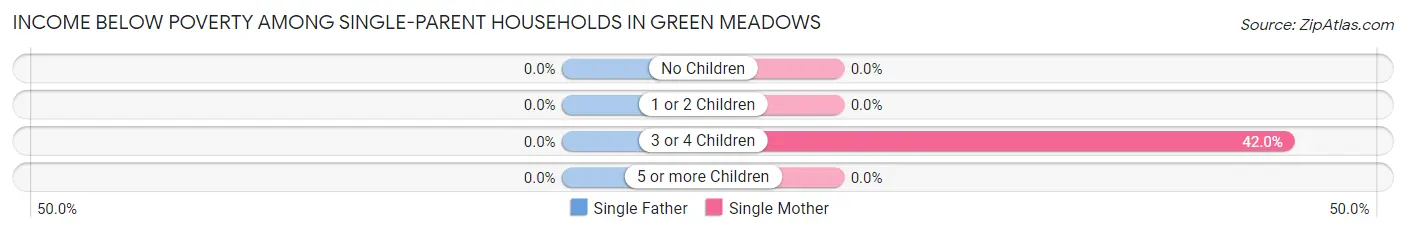
| Children | Single Father | Single Mother |
| No Children | 0 (0.0%) | 0 (0.0%) |
| 1 or 2 Children | 0 (0.0%) | 0 (0.0%) |
| 3 or 4 Children | 0 (0.0%) | 21 (42.0%) |
| 5 or more Children | 0 (0.0%) | 0 (0.0%) |
| Total | 0 (0.0%) | 21 (15.8%) |
Income Below Poverty Among Married-Couple vs Single-Parent Households in Green Meadows
The poverty data for Green Meadows shows that 5 of the married-couple family households (1.1%) and 21 of the single-parent households (13.2%) are living below the poverty level. Within the married-couple family households, those with no children have the highest poverty rate, with 5 households (2.1%) falling below the poverty line. Among the single-parent households, those with 3 or 4 children have the highest poverty rate, with 21 household (42.0%) living below poverty.
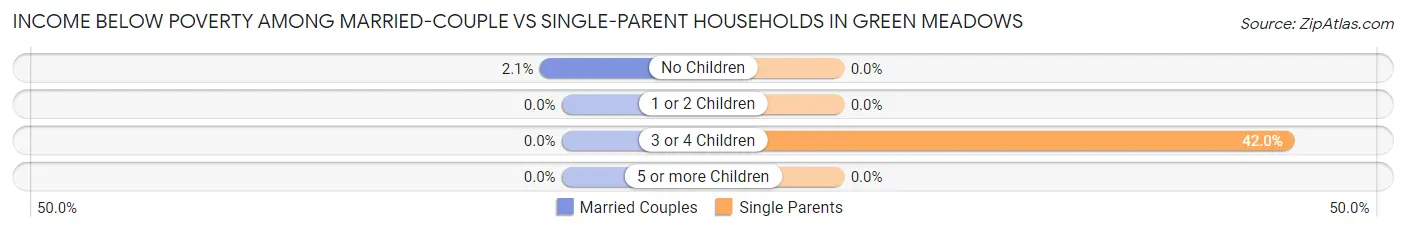
| Children | Married-Couple Families | Single-Parent Households |
| No Children | 5 (2.1%) | 0 (0.0%) |
| 1 or 2 Children | 0 (0.0%) | 0 (0.0%) |
| 3 or 4 Children | 0 (0.0%) | 21 (42.0%) |
| 5 or more Children | 0 (0.0%) | 0 (0.0%) |
| Total | 5 (1.1%) | 21 (13.2%) |
Employment Characteristics in Green Meadows
Employment by Class of Employer in Green Meadows
Among the 1,069 employed individuals in Green Meadows, private company employees (658 | 61.6%), local government employees (239 | 22.4%), and not-for-profit organizations (91 | 8.5%) make up the most common classes of employment.
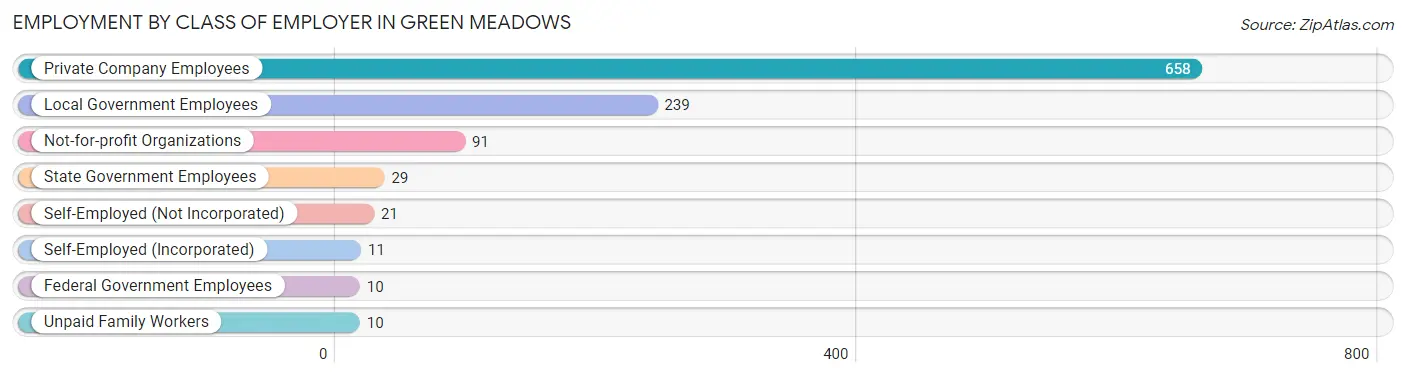
| Employer Class | # Employees | % Employees |
| Private Company Employees | 658 | 61.6% |
| Self-Employed (Incorporated) | 11 | 1.0% |
| Self-Employed (Not Incorporated) | 21 | 2.0% |
| Not-for-profit Organizations | 91 | 8.5% |
| Local Government Employees | 239 | 22.4% |
| State Government Employees | 29 | 2.7% |
| Federal Government Employees | 10 | 0.9% |
| Unpaid Family Workers | 10 | 0.9% |
| Total | 1,069 | 100.0% |
Employment Status by Age in Green Meadows
According to the labor force statistics for Green Meadows, out of the total population over 16 years of age (1,732), 68.0% or 1,178 individuals are in the labor force, with 7.1% or 84 of them unemployed. The age group with the highest labor force participation rate is 20 to 24 years, with 100.0% or 93 individuals in the labor force. Within the labor force, the 16 to 19 years age range has the highest percentage of unemployed individuals, with 66.3% or 63 of them being unemployed.
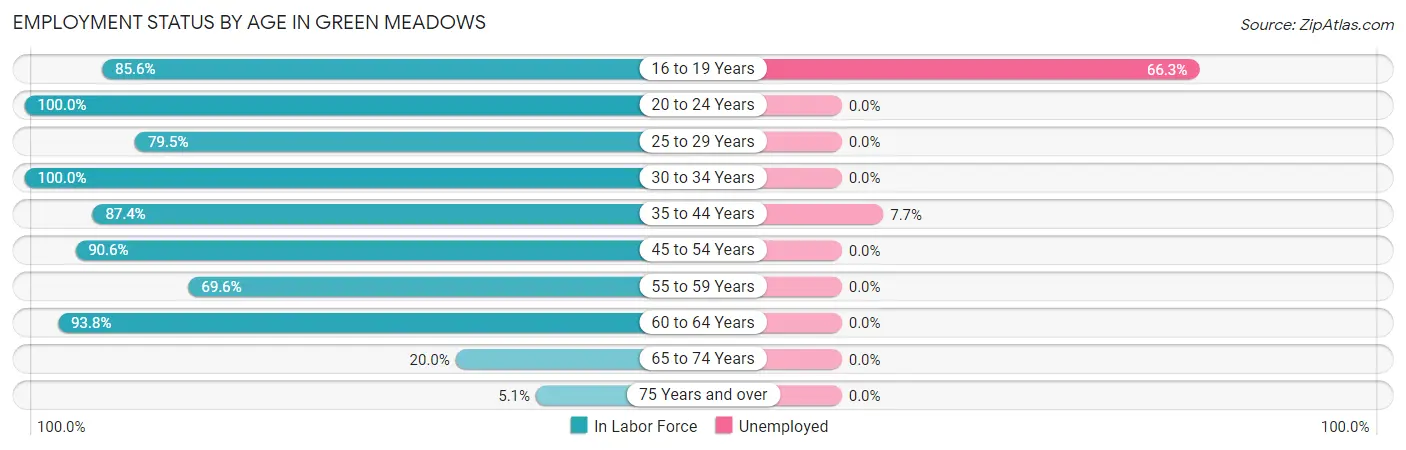
| Age Bracket | In Labor Force | Unemployed |
| 16 to 19 Years | 95 (85.6%) | 63 (66.3%) |
| 20 to 24 Years | 93 (100.0%) | 0 (0.0%) |
| 25 to 29 Years | 140 (79.5%) | 0 (0.0%) |
| 30 to 34 Years | 148 (100.0%) | 0 (0.0%) |
| 35 to 44 Years | 271 (87.4%) | 21 (7.7%) |
| 45 to 54 Years | 163 (90.6%) | 0 (0.0%) |
| 55 to 59 Years | 87 (69.6%) | 0 (0.0%) |
| 60 to 64 Years | 121 (93.8%) | 0 (0.0%) |
| 65 to 74 Years | 49 (20.0%) | 0 (0.0%) |
| 75 Years and over | 11 (5.1%) | 0 (0.0%) |
| Total | 1,178 (68.0%) | 84 (7.1%) |
Employment Status by Educational Attainment in Green Meadows
According to labor force statistics for Green Meadows, 87.1% of individuals (930) out of the total population between 25 and 64 years of age (1,068) are in the labor force, with 2.3% or 21 of them being unemployed. The group with the highest labor force participation rate are those with the educational attainment of bachelor's degree or higher, with 94.5% or 310 individuals in the labor force. Within the labor force, individuals with college / associate degree education have the highest percentage of unemployment, with 4.4% or 21 of them being unemployed.
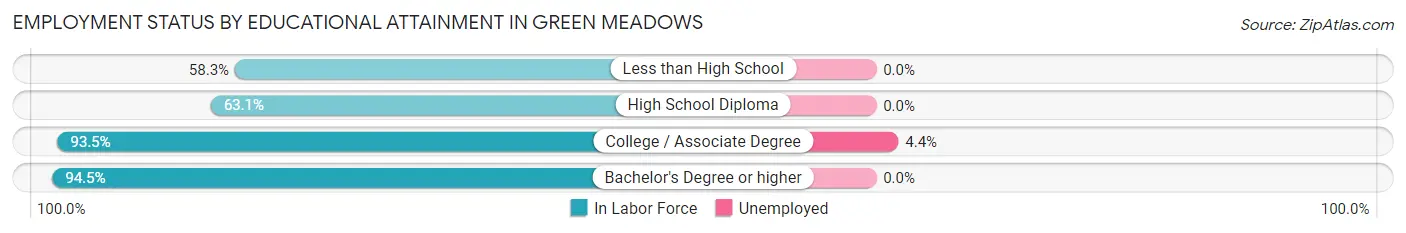
| Educational Attainment | In Labor Force | Unemployed |
| Less than High School | 7 (58.3%) | 0 (0.0%) |
| High School Diploma | 140 (63.1%) | 0 (0.0%) |
| College / Associate Degree | 473 (93.5%) | 22 (4.4%) |
| Bachelor's Degree or higher | 310 (94.5%) | 0 (0.0%) |
| Total | 930 (87.1%) | 25 (2.3%) |
Employment Occupations by Sex in Green Meadows
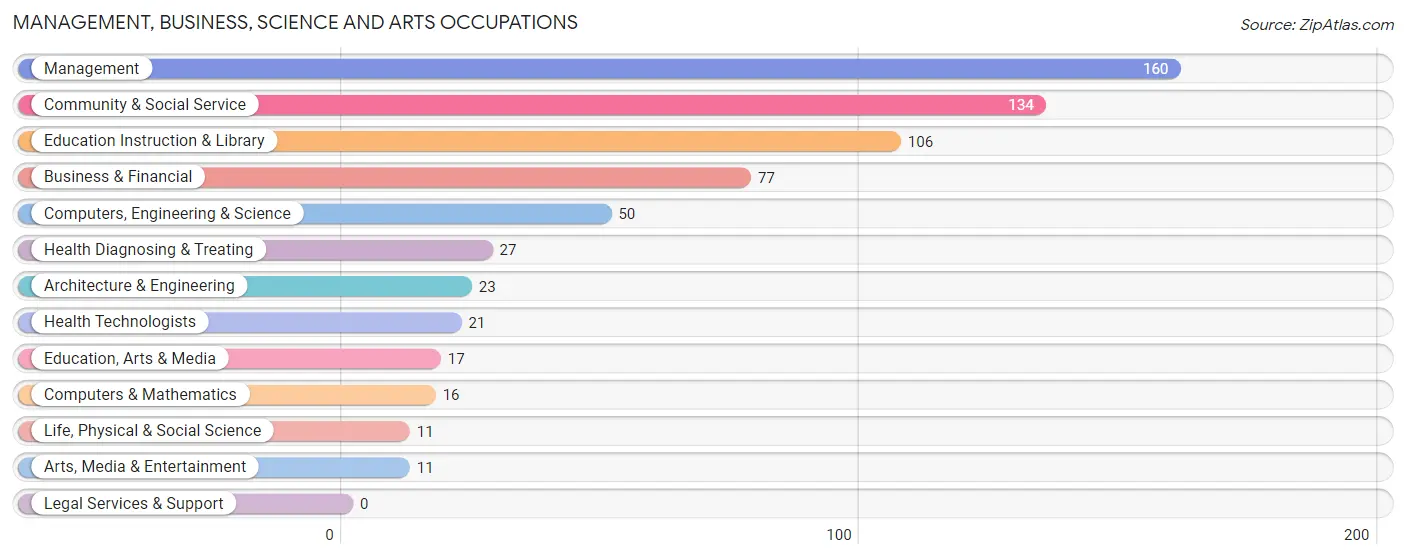
Management, Business, Science and Arts Occupations
The most common Management, Business, Science and Arts occupations in Green Meadows are Management (160 | 14.6%), Community & Social Service (134 | 12.2%), Education Instruction & Library (106 | 9.7%), Business & Financial (77 | 7.0%), and Computers, Engineering & Science (50 | 4.6%).
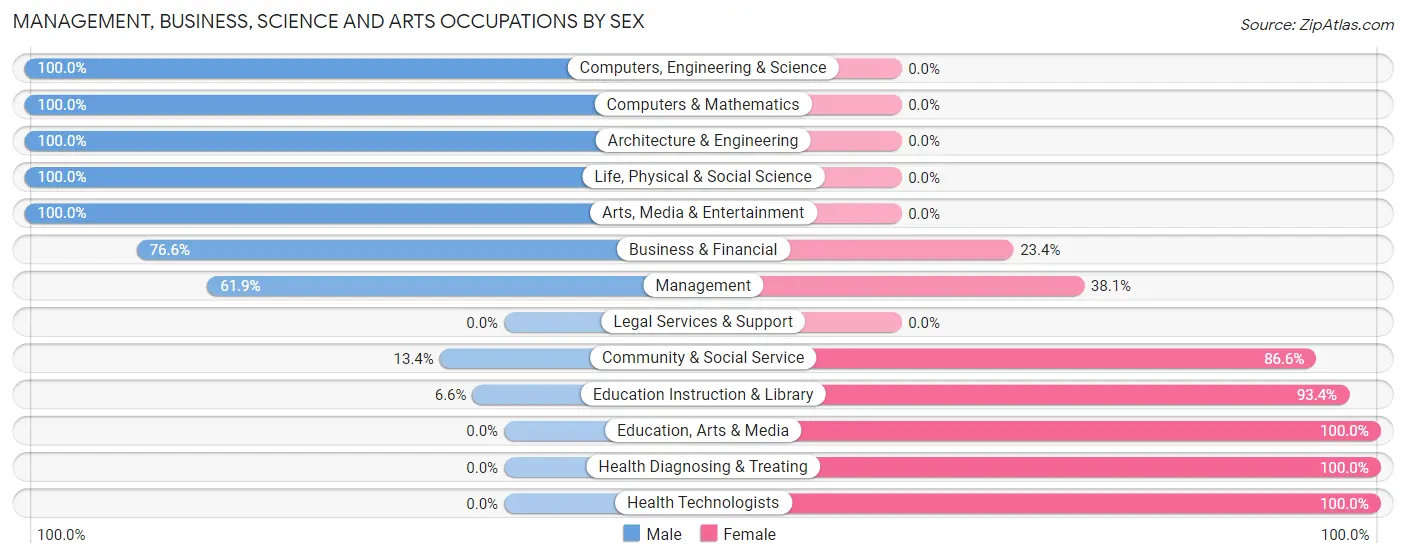
Management, Business, Science and Arts Occupations by Sex
Within the Management, Business, Science and Arts occupations in Green Meadows, the most male-oriented occupations are Computers, Engineering & Science (100.0%), Computers & Mathematics (100.0%), and Architecture & Engineering (100.0%), while the most female-oriented occupations are Education, Arts & Media (100.0%), Health Diagnosing & Treating (100.0%), and Health Technologists (100.0%).
| Occupation | Male | Female |
| Management | 99 (61.9%) | 61 (38.1%) |
| Business & Financial | 59 (76.6%) | 18 (23.4%) |
| Computers, Engineering & Science | 50 (100.0%) | 0 (0.0%) |
| Computers & Mathematics | 16 (100.0%) | 0 (0.0%) |
| Architecture & Engineering | 23 (100.0%) | 0 (0.0%) |
| Life, Physical & Social Science | 11 (100.0%) | 0 (0.0%) |
| Community & Social Service | 18 (13.4%) | 116 (86.6%) |
| Education, Arts & Media | 0 (0.0%) | 17 (100.0%) |
| Legal Services & Support | 0 (0.0%) | 0 (0.0%) |
| Education Instruction & Library | 7 (6.6%) | 99 (93.4%) |
| Arts, Media & Entertainment | 11 (100.0%) | 0 (0.0%) |
| Health Diagnosing & Treating | 0 (0.0%) | 27 (100.0%) |
| Health Technologists | 0 (0.0%) | 21 (100.0%) |
| Total (Category) | 226 (50.4%) | 222 (49.5%) |
| Total (Overall) | 646 (59.1%) | 448 (40.9%) |
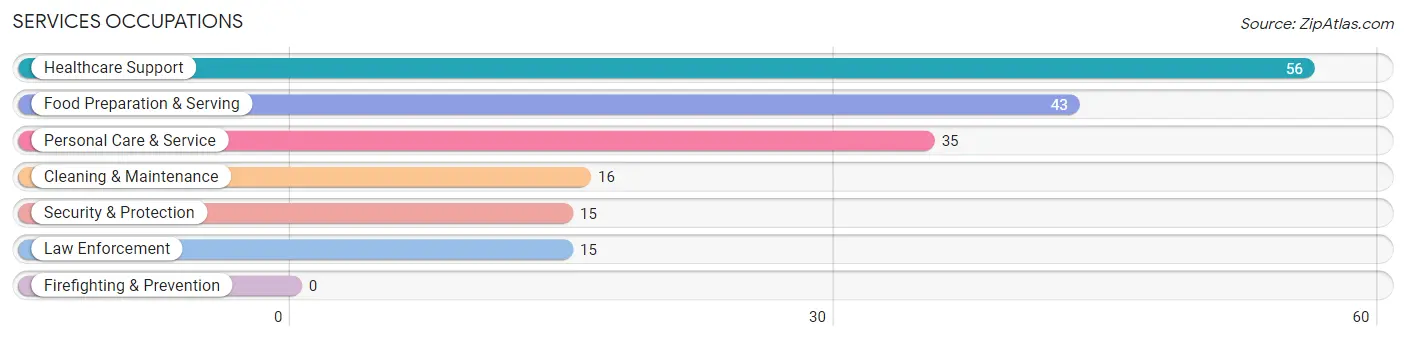
Services Occupations
The most common Services occupations in Green Meadows are Healthcare Support (56 | 5.1%), Food Preparation & Serving (43 | 3.9%), Personal Care & Service (35 | 3.2%), Cleaning & Maintenance (16 | 1.5%), and Security & Protection (15 | 1.4%).
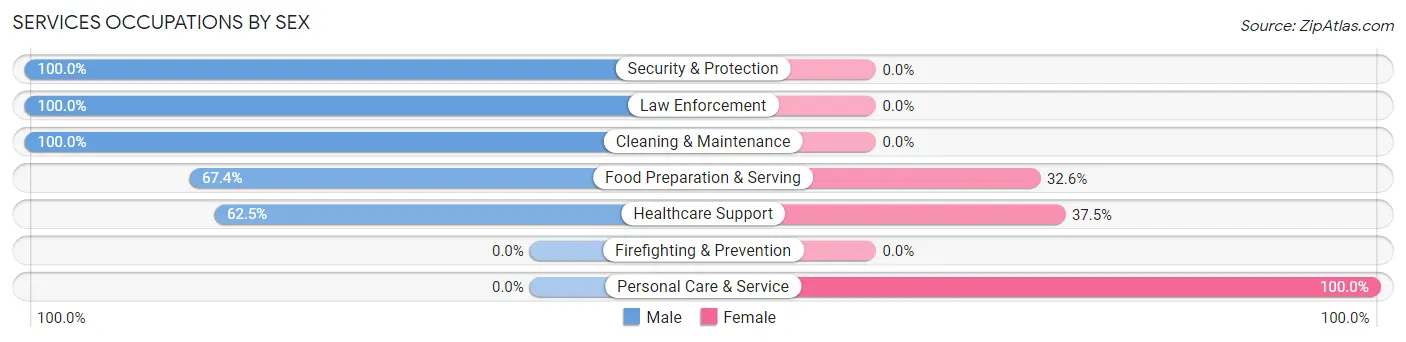
Services Occupations by Sex
Within the Services occupations in Green Meadows, the most male-oriented occupations are Security & Protection (100.0%), Law Enforcement (100.0%), and Cleaning & Maintenance (100.0%), while the most female-oriented occupations are Personal Care & Service (100.0%), Healthcare Support (37.5%), and Food Preparation & Serving (32.6%).
| Occupation | Male | Female |
| Healthcare Support | 35 (62.5%) | 21 (37.5%) |
| Security & Protection | 15 (100.0%) | 0 (0.0%) |
| Firefighting & Prevention | 0 (0.0%) | 0 (0.0%) |
| Law Enforcement | 15 (100.0%) | 0 (0.0%) |
| Food Preparation & Serving | 29 (67.4%) | 14 (32.6%) |
| Cleaning & Maintenance | 16 (100.0%) | 0 (0.0%) |
| Personal Care & Service | 0 (0.0%) | 35 (100.0%) |
| Total (Category) | 95 (57.6%) | 70 (42.4%) |
| Total (Overall) | 646 (59.1%) | 448 (40.9%) |
Sales and Office Occupations
The most common Sales and Office occupations in Green Meadows are Office & Administration (133 | 12.2%), and Sales & Related (44 | 4.0%).
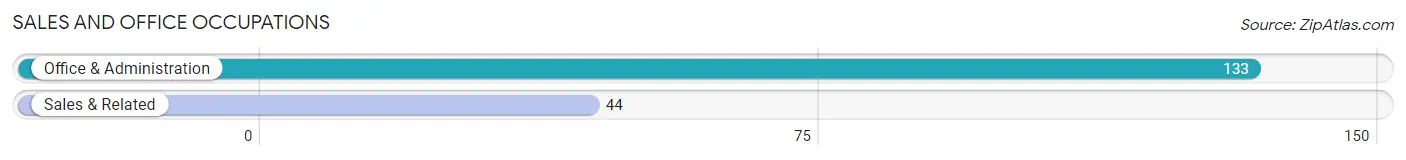
Sales and Office Occupations by Sex
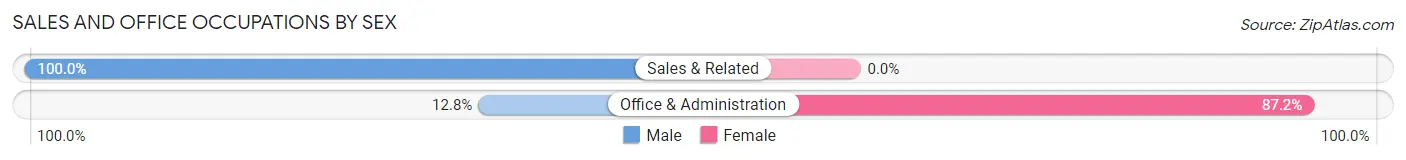
| Occupation | Male | Female |
| Sales & Related | 44 (100.0%) | 0 (0.0%) |
| Office & Administration | 17 (12.8%) | 116 (87.2%) |
| Total (Category) | 61 (34.5%) | 116 (65.5%) |
| Total (Overall) | 646 (59.1%) | 448 (40.9%) |
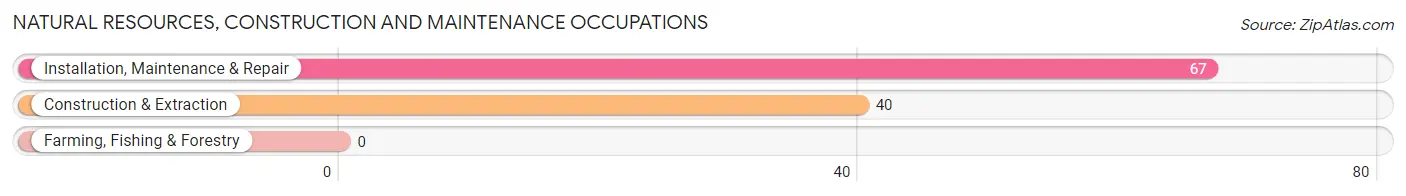
Natural Resources, Construction and Maintenance Occupations
The most common Natural Resources, Construction and Maintenance occupations in Green Meadows are Installation, Maintenance & Repair (67 | 6.1%), and Construction & Extraction (40 | 3.7%).
Natural Resources, Construction and Maintenance Occupations by Sex
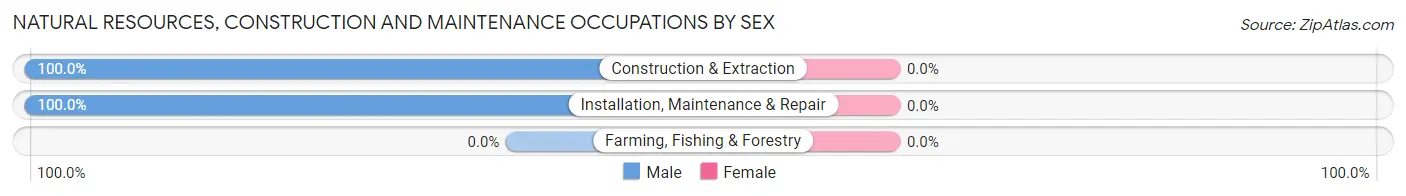
| Occupation | Male | Female |
| Farming, Fishing & Forestry | 0 (0.0%) | 0 (0.0%) |
| Construction & Extraction | 40 (100.0%) | 0 (0.0%) |
| Installation, Maintenance & Repair | 67 (100.0%) | 0 (0.0%) |
| Total (Category) | 107 (100.0%) | 0 (0.0%) |
| Total (Overall) | 646 (59.1%) | 448 (40.9%) |
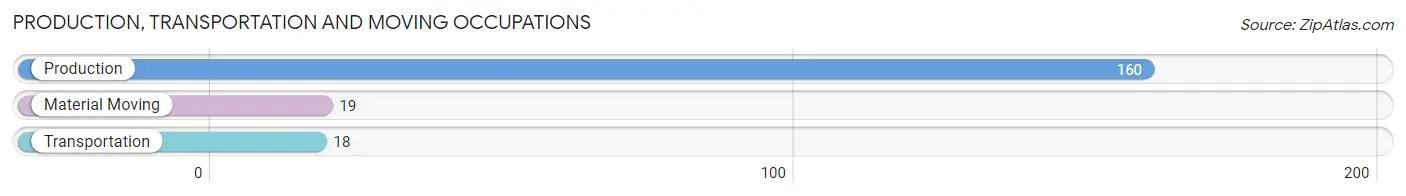
Production, Transportation and Moving Occupations
The most common Production, Transportation and Moving occupations in Green Meadows are Production (160 | 14.6%), Material Moving (19 | 1.7%), and Transportation (18 | 1.7%).
Production, Transportation and Moving Occupations by Sex
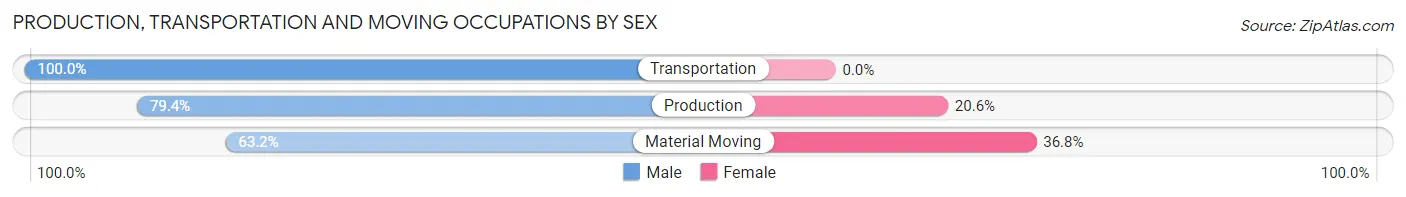
| Occupation | Male | Female |
| Production | 127 (79.4%) | 33 (20.6%) |
| Transportation | 18 (100.0%) | 0 (0.0%) |
| Material Moving | 12 (63.2%) | 7 (36.8%) |
| Total (Category) | 157 (79.7%) | 40 (20.3%) |
| Total (Overall) | 646 (59.1%) | 448 (40.9%) |
Employment Industries by Sex in Green Meadows
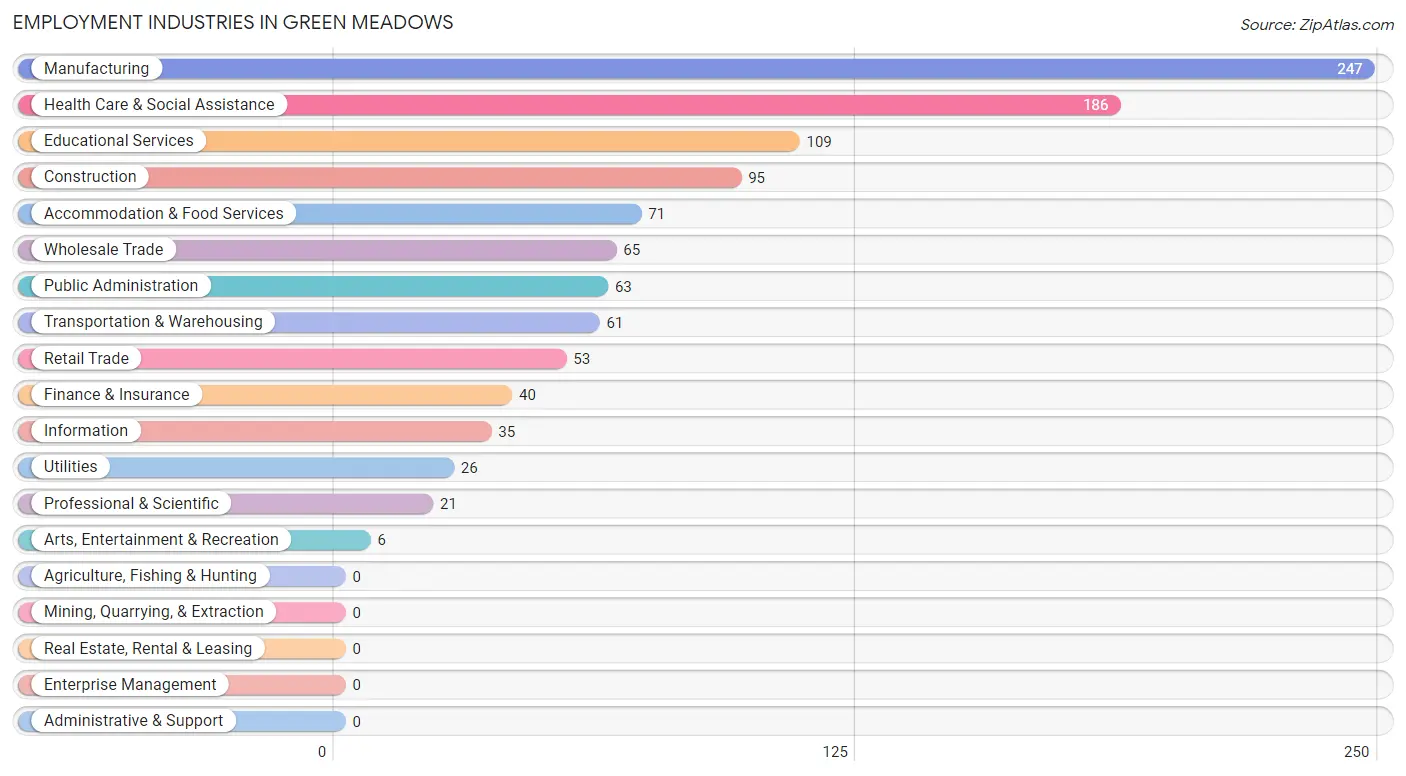
Employment Industries in Green Meadows
The major employment industries in Green Meadows include Manufacturing (247 | 22.6%), Health Care & Social Assistance (186 | 17.0%), Educational Services (109 | 10.0%), Construction (95 | 8.7%), and Accommodation & Food Services (71 | 6.5%).
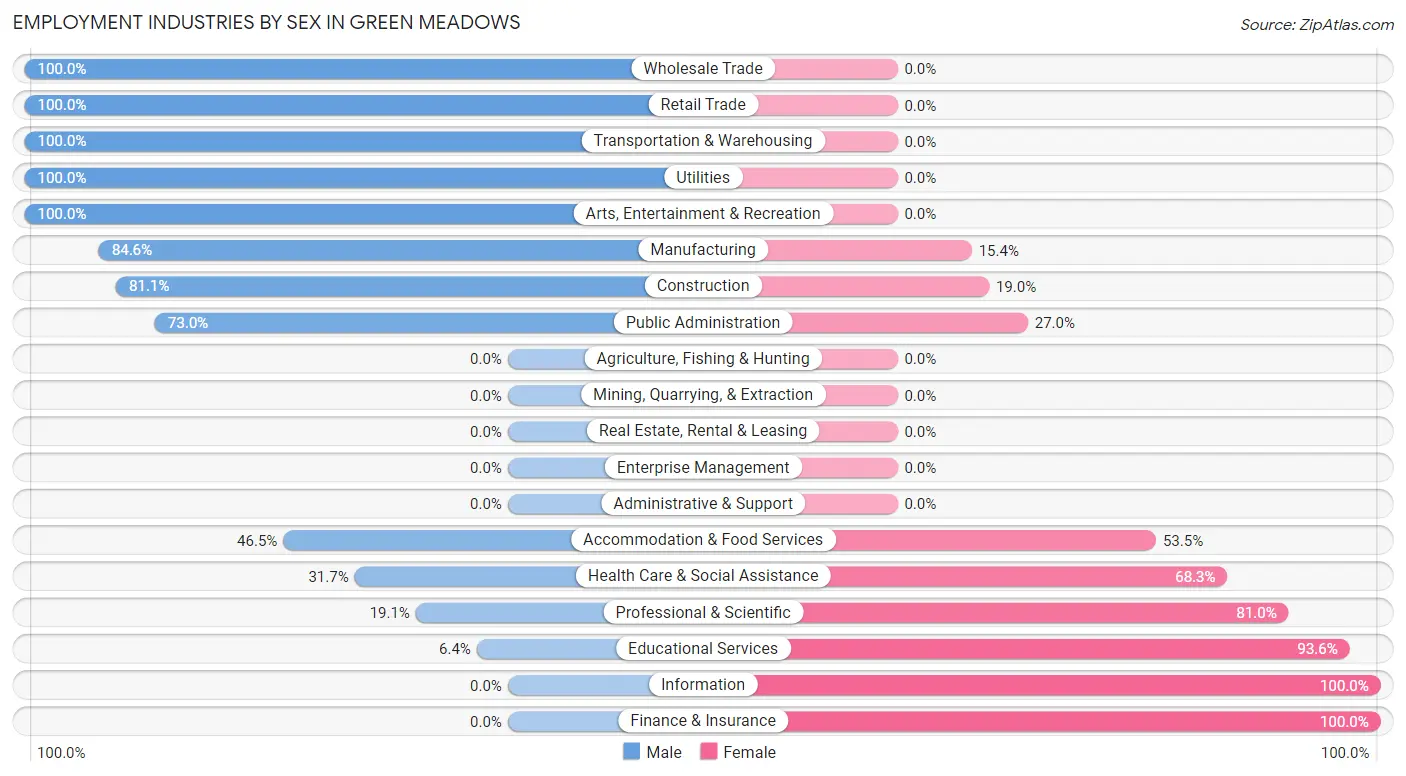
Employment Industries by Sex in Green Meadows
The Green Meadows industries that see more men than women are Wholesale Trade (100.0%), Retail Trade (100.0%), and Transportation & Warehousing (100.0%), whereas the industries that tend to have a higher number of women are Information (100.0%), Finance & Insurance (100.0%), and Educational Services (93.6%).
| Industry | Male | Female |
| Agriculture, Fishing & Hunting | 0 (0.0%) | 0 (0.0%) |
| Mining, Quarrying, & Extraction | 0 (0.0%) | 0 (0.0%) |
| Construction | 77 (81.0%) | 18 (19.0%) |
| Manufacturing | 209 (84.6%) | 38 (15.4%) |
| Wholesale Trade | 65 (100.0%) | 0 (0.0%) |
| Retail Trade | 53 (100.0%) | 0 (0.0%) |
| Transportation & Warehousing | 61 (100.0%) | 0 (0.0%) |
| Utilities | 26 (100.0%) | 0 (0.0%) |
| Information | 0 (0.0%) | 35 (100.0%) |
| Finance & Insurance | 0 (0.0%) | 40 (100.0%) |
| Real Estate, Rental & Leasing | 0 (0.0%) | 0 (0.0%) |
| Professional & Scientific | 4 (19.1%) | 17 (80.9%) |
| Enterprise Management | 0 (0.0%) | 0 (0.0%) |
| Administrative & Support | 0 (0.0%) | 0 (0.0%) |
| Educational Services | 7 (6.4%) | 102 (93.6%) |
| Health Care & Social Assistance | 59 (31.7%) | 127 (68.3%) |
| Arts, Entertainment & Recreation | 6 (100.0%) | 0 (0.0%) |
| Accommodation & Food Services | 33 (46.5%) | 38 (53.5%) |
| Public Administration | 46 (73.0%) | 17 (27.0%) |
| Total | 646 (59.1%) | 448 (40.9%) |
Education in Green Meadows
School Enrollment in Green Meadows
The most common levels of schooling among the 636 students in Green Meadows are high school (170 | 26.7%), elementary school (134 | 21.1%), and college / undergraduate (111 | 17.4%).
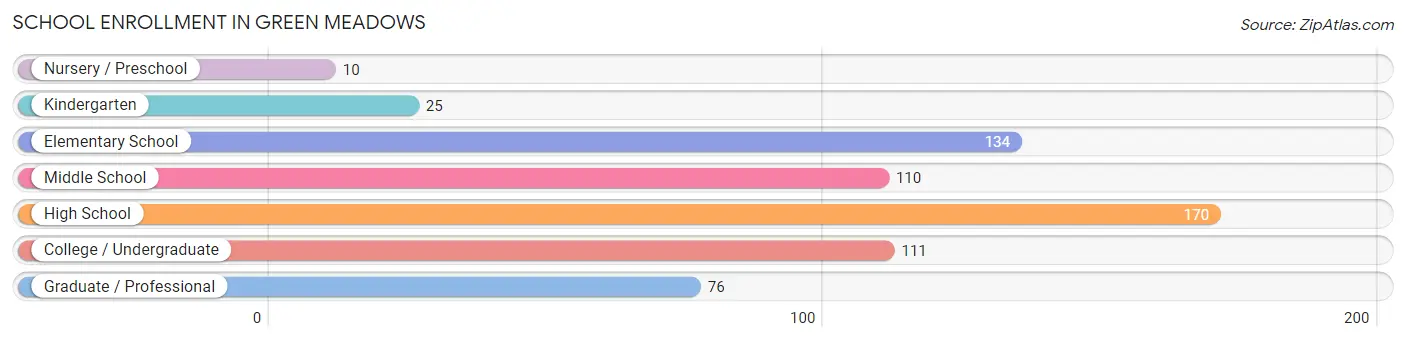
| School Level | # Students | % Students |
| Nursery / Preschool | 10 | 1.6% |
| Kindergarten | 25 | 3.9% |
| Elementary School | 134 | 21.1% |
| Middle School | 110 | 17.3% |
| High School | 170 | 26.7% |
| College / Undergraduate | 111 | 17.4% |
| Graduate / Professional | 76 | 11.9% |
| Total | 636 | 100.0% |
School Enrollment by Age by Funding Source in Green Meadows
Out of a total of 636 students who are enrolled in schools in Green Meadows, 94 (14.8%) attend a private institution, while the remaining 542 (85.2%) are enrolled in public schools. The age group of 10 to 14 year olds has the highest likelihood of being enrolled in private schools, with 55 (28.5% in the age bracket) enrolled. Conversely, the age group of 5 to 9 year old has the lowest likelihood of being enrolled in a private school, with 130 (100.0% in the age bracket) attending a public institution.
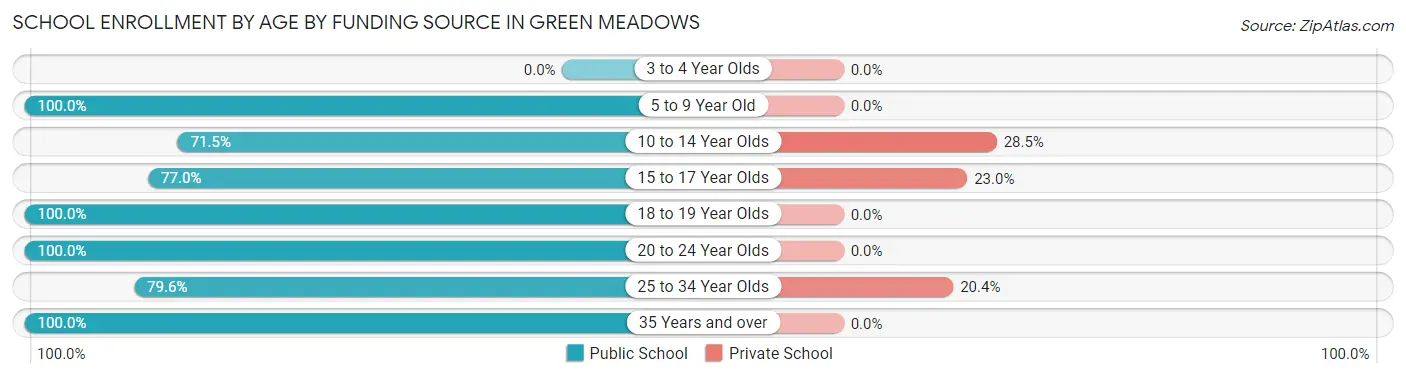
| Age Bracket | Public School | Private School |
| 3 to 4 Year Olds | 0 (0.0%) | 0 (0.0%) |
| 5 to 9 Year Old | 130 (100.0%) | 0 (0.0%) |
| 10 to 14 Year Olds | 138 (71.5%) | 55 (28.5%) |
| 15 to 17 Year Olds | 97 (77.0%) | 29 (23.0%) |
| 18 to 19 Year Olds | 14 (100.0%) | 0 (0.0%) |
| 20 to 24 Year Olds | 18 (100.0%) | 0 (0.0%) |
| 25 to 34 Year Olds | 39 (79.6%) | 10 (20.4%) |
| 35 Years and over | 106 (100.0%) | 0 (0.0%) |
| Total | 542 (85.2%) | 94 (14.8%) |
Educational Attainment by Field of Study in Green Meadows
Business (125 | 30.1%), science & technology (51 | 12.3%), visual & performing arts (47 | 11.3%), social sciences (38 | 9.2%), and education (35 | 8.4%) are the most common fields of study among 415 individuals in Green Meadows who have obtained a bachelor's degree or higher.
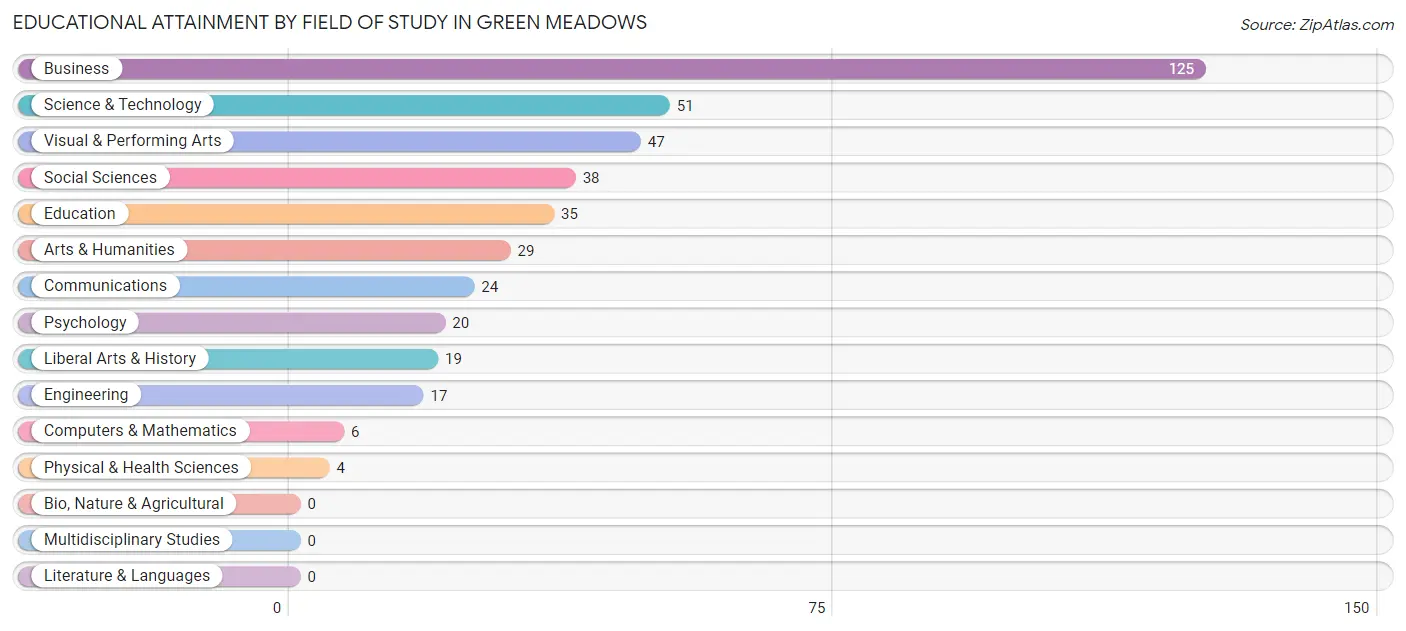
| Field of Study | # Graduates | % Graduates |
| Computers & Mathematics | 6 | 1.5% |
| Bio, Nature & Agricultural | 0 | 0.0% |
| Physical & Health Sciences | 4 | 1.0% |
| Psychology | 20 | 4.8% |
| Social Sciences | 38 | 9.2% |
| Engineering | 17 | 4.1% |
| Multidisciplinary Studies | 0 | 0.0% |
| Science & Technology | 51 | 12.3% |
| Business | 125 | 30.1% |
| Education | 35 | 8.4% |
| Literature & Languages | 0 | 0.0% |
| Liberal Arts & History | 19 | 4.6% |
| Visual & Performing Arts | 47 | 11.3% |
| Communications | 24 | 5.8% |
| Arts & Humanities | 29 | 7.0% |
| Total | 415 | 100.0% |
Transportation & Commute in Green Meadows
Vehicle Availability by Sex in Green Meadows
The most prevalent vehicle ownership categories in Green Meadows are males with 2 vehicles (280, accounting for 45.1%) and females with 2 vehicles (192, making up 62.5%).
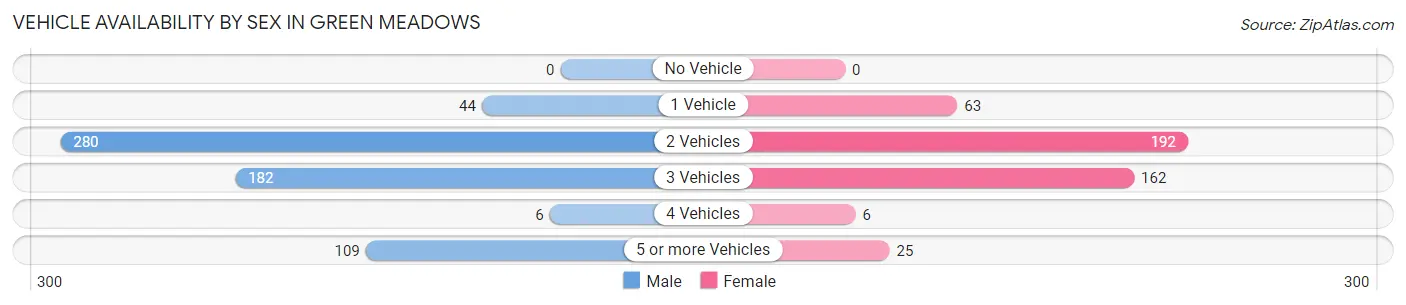
| Vehicles Available | Male | Female |
| No Vehicle | 0 (0.0%) | 0 (0.0%) |
| 1 Vehicle | 44 (7.1%) | 63 (14.1%) |
| 2 Vehicles | 280 (45.1%) | 192 (42.9%) |
| 3 Vehicles | 182 (29.3%) | 162 (36.2%) |
| 4 Vehicles | 6 (1.0%) | 6 (1.3%) |
| 5 or more Vehicles | 109 (17.5%) | 25 (5.6%) |
| Total | 621 (100.0%) | 448 (100.0%) |
Commute Time in Green Meadows
The most frequently occuring commute durations in Green Meadows are 10 to 14 minutes (162 commuters, 16.0%), 20 to 24 minutes (147 commuters, 14.5%), and 15 to 19 minutes (144 commuters, 14.2%).
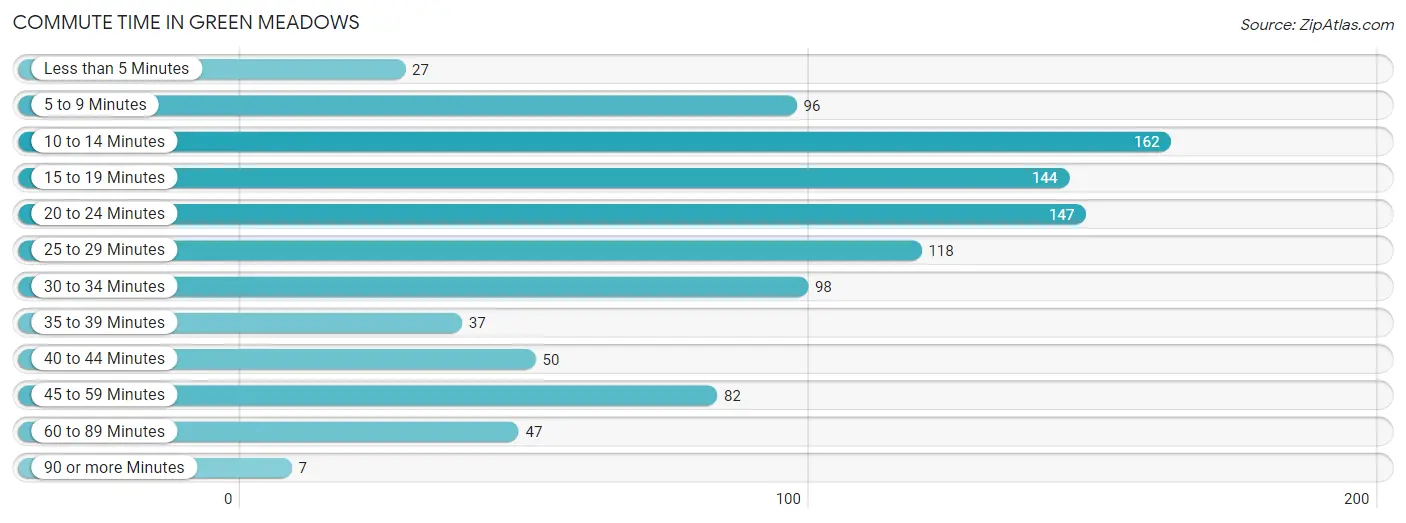
| Commute Time | # Commuters | % Commuters |
| Less than 5 Minutes | 27 | 2.7% |
| 5 to 9 Minutes | 96 | 9.5% |
| 10 to 14 Minutes | 162 | 16.0% |
| 15 to 19 Minutes | 144 | 14.2% |
| 20 to 24 Minutes | 147 | 14.5% |
| 25 to 29 Minutes | 118 | 11.6% |
| 30 to 34 Minutes | 98 | 9.7% |
| 35 to 39 Minutes | 37 | 3.6% |
| 40 to 44 Minutes | 50 | 4.9% |
| 45 to 59 Minutes | 82 | 8.1% |
| 60 to 89 Minutes | 47 | 4.6% |
| 90 or more Minutes | 7 | 0.7% |
Commute Time by Sex in Green Meadows
The most common commute times in Green Meadows are 20 to 24 minutes (99 commuters, 15.9%) for males and 15 to 19 minutes (70 commuters, 17.8%) for females.
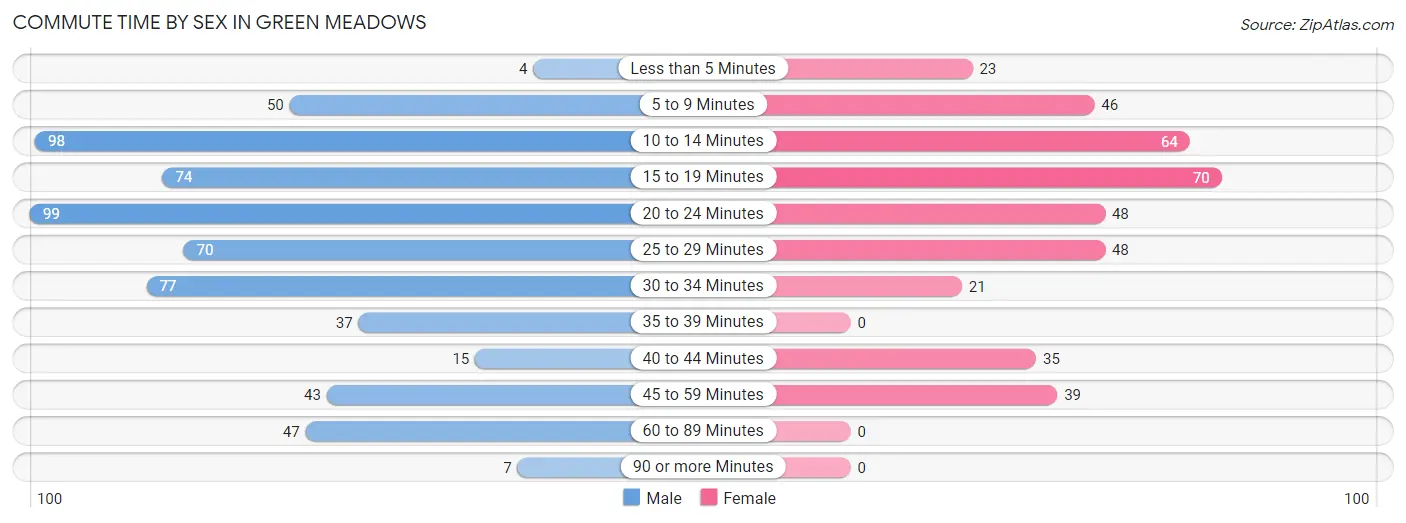
| Commute Time | Male | Female |
| Less than 5 Minutes | 4 (0.6%) | 23 (5.8%) |
| 5 to 9 Minutes | 50 (8.1%) | 46 (11.7%) |
| 10 to 14 Minutes | 98 (15.8%) | 64 (16.2%) |
| 15 to 19 Minutes | 74 (11.9%) | 70 (17.8%) |
| 20 to 24 Minutes | 99 (15.9%) | 48 (12.2%) |
| 25 to 29 Minutes | 70 (11.3%) | 48 (12.2%) |
| 30 to 34 Minutes | 77 (12.4%) | 21 (5.3%) |
| 35 to 39 Minutes | 37 (6.0%) | 0 (0.0%) |
| 40 to 44 Minutes | 15 (2.4%) | 35 (8.9%) |
| 45 to 59 Minutes | 43 (6.9%) | 39 (9.9%) |
| 60 to 89 Minutes | 47 (7.6%) | 0 (0.0%) |
| 90 or more Minutes | 7 (1.1%) | 0 (0.0%) |
Time of Departure to Work by Sex in Green Meadows
The most frequent times of departure to work in Green Meadows are 6:00 AM to 6:29 AM (121, 19.5%) for males and 7:30 AM to 7:59 AM (122, 31.0%) for females.
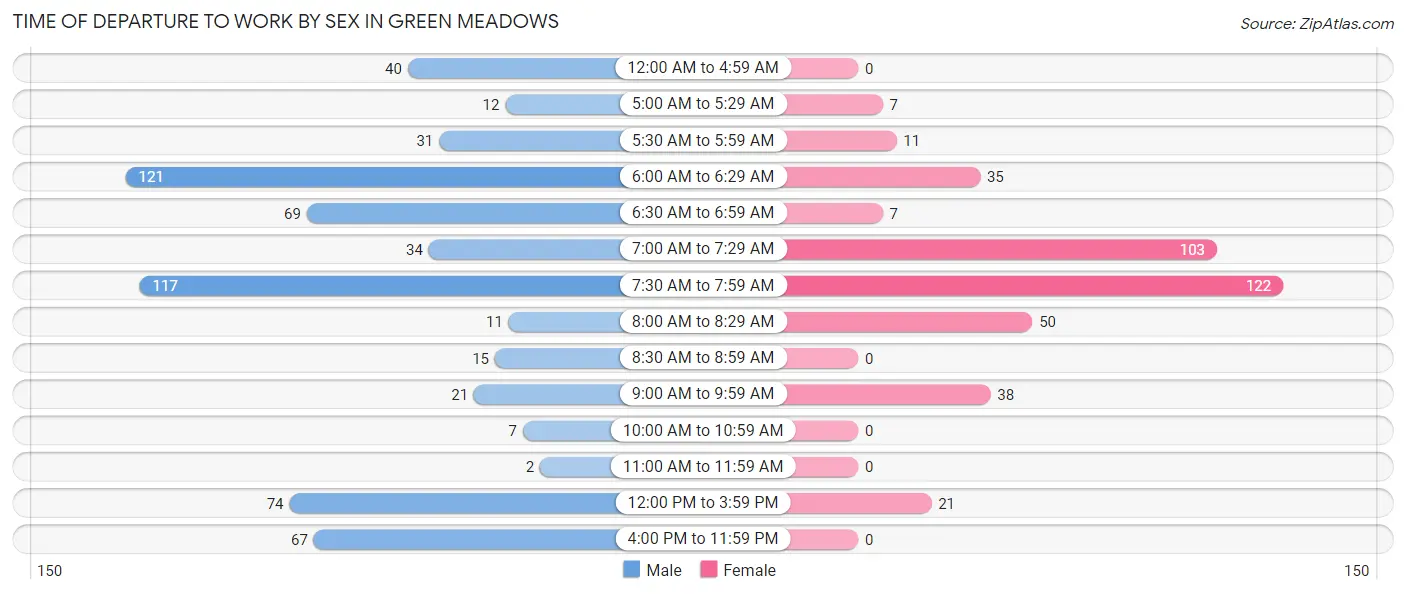
| Time of Departure | Male | Female |
| 12:00 AM to 4:59 AM | 40 (6.4%) | 0 (0.0%) |
| 5:00 AM to 5:29 AM | 12 (1.9%) | 7 (1.8%) |
| 5:30 AM to 5:59 AM | 31 (5.0%) | 11 (2.8%) |
| 6:00 AM to 6:29 AM | 121 (19.5%) | 35 (8.9%) |
| 6:30 AM to 6:59 AM | 69 (11.1%) | 7 (1.8%) |
| 7:00 AM to 7:29 AM | 34 (5.5%) | 103 (26.1%) |
| 7:30 AM to 7:59 AM | 117 (18.8%) | 122 (31.0%) |
| 8:00 AM to 8:29 AM | 11 (1.8%) | 50 (12.7%) |
| 8:30 AM to 8:59 AM | 15 (2.4%) | 0 (0.0%) |
| 9:00 AM to 9:59 AM | 21 (3.4%) | 38 (9.6%) |
| 10:00 AM to 10:59 AM | 7 (1.1%) | 0 (0.0%) |
| 11:00 AM to 11:59 AM | 2 (0.3%) | 0 (0.0%) |
| 12:00 PM to 3:59 PM | 74 (11.9%) | 21 (5.3%) |
| 4:00 PM to 11:59 PM | 67 (10.8%) | 0 (0.0%) |
| Total | 621 (100.0%) | 394 (100.0%) |
Housing Occupancy in Green Meadows
Occupancy by Ownership in Green Meadows
Of the total 907 dwellings in Green Meadows, owner-occupied units account for 766 (84.5%), while renter-occupied units make up 141 (15.5%).
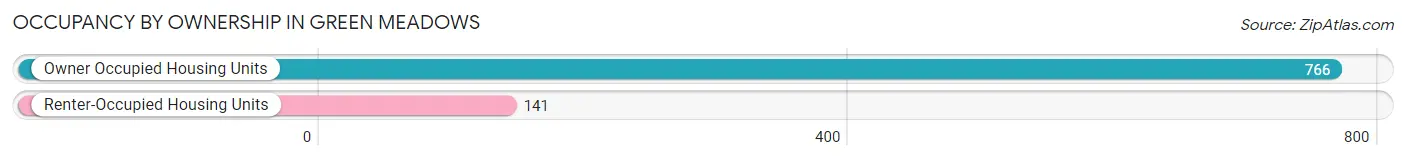
| Occupancy | # Housing Units | % Housing Units |
| Owner Occupied Housing Units | 766 | 84.5% |
| Renter-Occupied Housing Units | 141 | 15.5% |
| Total Occupied Housing Units | 907 | 100.0% |
Occupancy by Household Size in Green Meadows
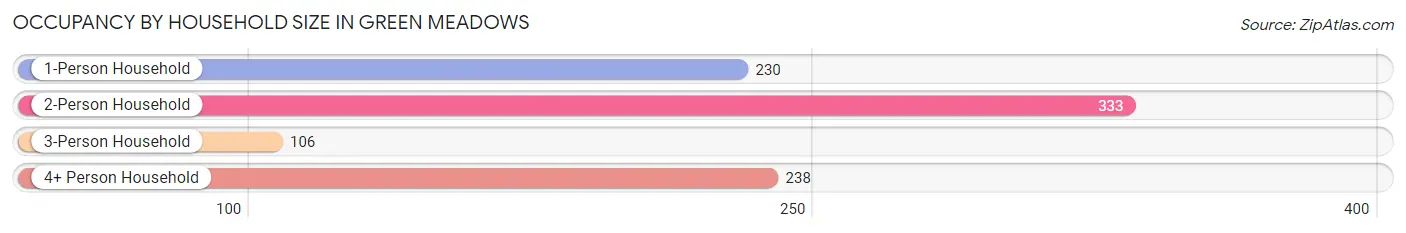
| Household Size | # Housing Units | % Housing Units |
| 1-Person Household | 230 | 25.4% |
| 2-Person Household | 333 | 36.7% |
| 3-Person Household | 106 | 11.7% |
| 4+ Person Household | 238 | 26.2% |
| Total Housing Units | 907 | 100.0% |
Occupancy by Ownership by Household Size in Green Meadows
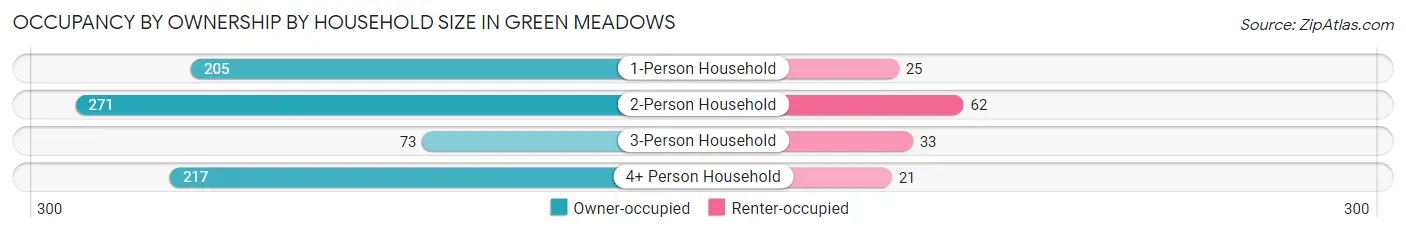
| Household Size | Owner-occupied | Renter-occupied |
| 1-Person Household | 205 (89.1%) | 25 (10.9%) |
| 2-Person Household | 271 (81.4%) | 62 (18.6%) |
| 3-Person Household | 73 (68.9%) | 33 (31.1%) |
| 4+ Person Household | 217 (91.2%) | 21 (8.8%) |
| Total Housing Units | 766 (84.5%) | 141 (15.5%) |
Occupancy by Educational Attainment in Green Meadows
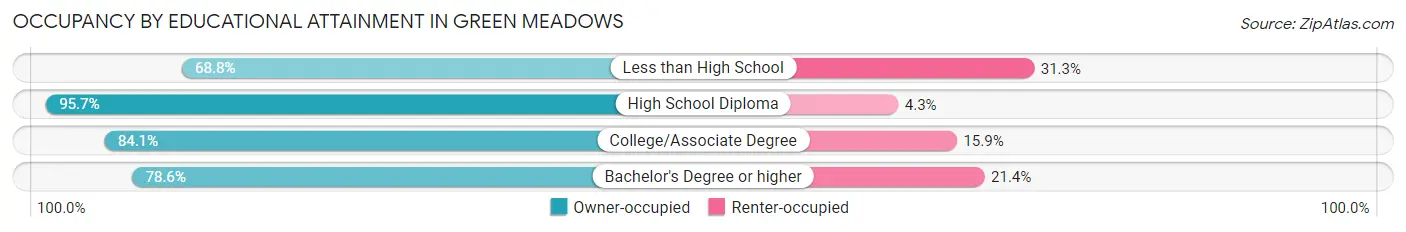
| Household Size | Owner-occupied | Renter-occupied |
| Less than High School | 22 (68.8%) | 10 (31.2%) |
| High School Diploma | 178 (95.7%) | 8 (4.3%) |
| College/Associate Degree | 375 (84.1%) | 71 (15.9%) |
| Bachelor's Degree or higher | 191 (78.6%) | 52 (21.4%) |
Occupancy by Age of Householder in Green Meadows
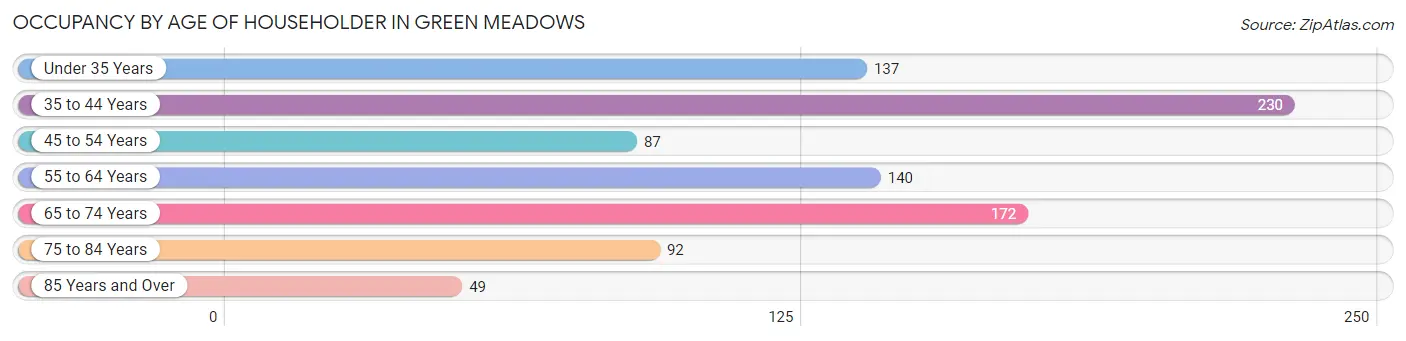
| Age Bracket | # Households | % Households |
| Under 35 Years | 137 | 15.1% |
| 35 to 44 Years | 230 | 25.4% |
| 45 to 54 Years | 87 | 9.6% |
| 55 to 64 Years | 140 | 15.4% |
| 65 to 74 Years | 172 | 19.0% |
| 75 to 84 Years | 92 | 10.1% |
| 85 Years and Over | 49 | 5.4% |
| Total | 907 | 100.0% |
Housing Finances in Green Meadows
Median Income by Occupancy in Green Meadows
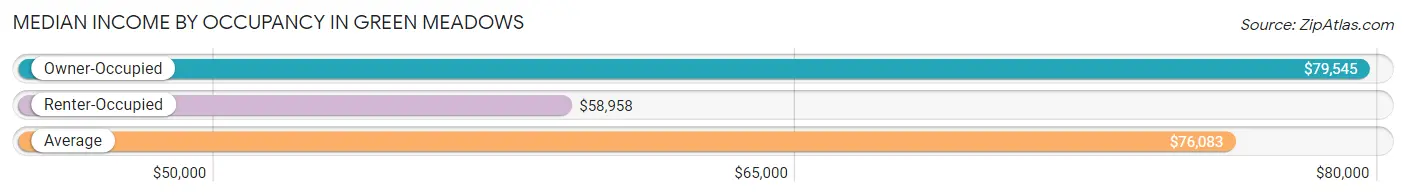
| Occupancy Type | # Households | Median Income |
| Owner-Occupied | 766 (84.5%) | $79,545 |
| Renter-Occupied | 141 (15.5%) | $58,958 |
| Average | 907 (100.0%) | $76,083 |
Occupancy by Householder Income Bracket in Green Meadows
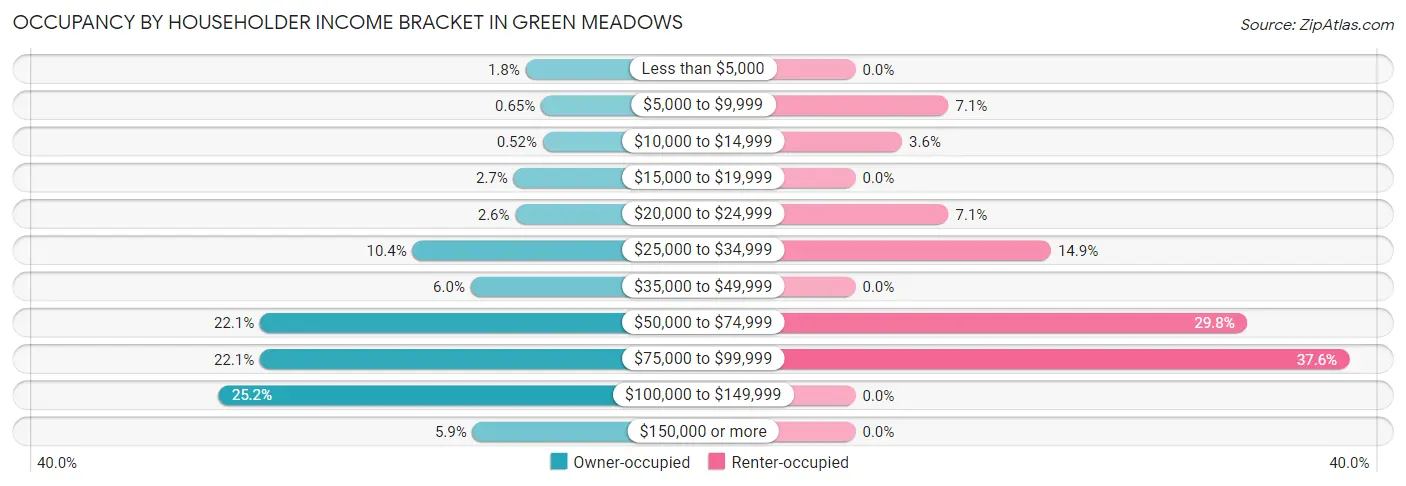
| Income Bracket | Owner-occupied | Renter-occupied |
| Less than $5,000 | 14 (1.8%) | 0 (0.0%) |
| $5,000 to $9,999 | 5 (0.6%) | 10 (7.1%) |
| $10,000 to $14,999 | 4 (0.5%) | 5 (3.5%) |
| $15,000 to $19,999 | 21 (2.7%) | 0 (0.0%) |
| $20,000 to $24,999 | 20 (2.6%) | 10 (7.1%) |
| $25,000 to $34,999 | 80 (10.4%) | 21 (14.9%) |
| $35,000 to $49,999 | 46 (6.0%) | 0 (0.0%) |
| $50,000 to $74,999 | 169 (22.1%) | 42 (29.8%) |
| $75,000 to $99,999 | 169 (22.1%) | 53 (37.6%) |
| $100,000 to $149,999 | 193 (25.2%) | 0 (0.0%) |
| $150,000 or more | 45 (5.9%) | 0 (0.0%) |
| Total | 766 (100.0%) | 141 (100.0%) |
Monthly Housing Cost Tiers in Green Meadows
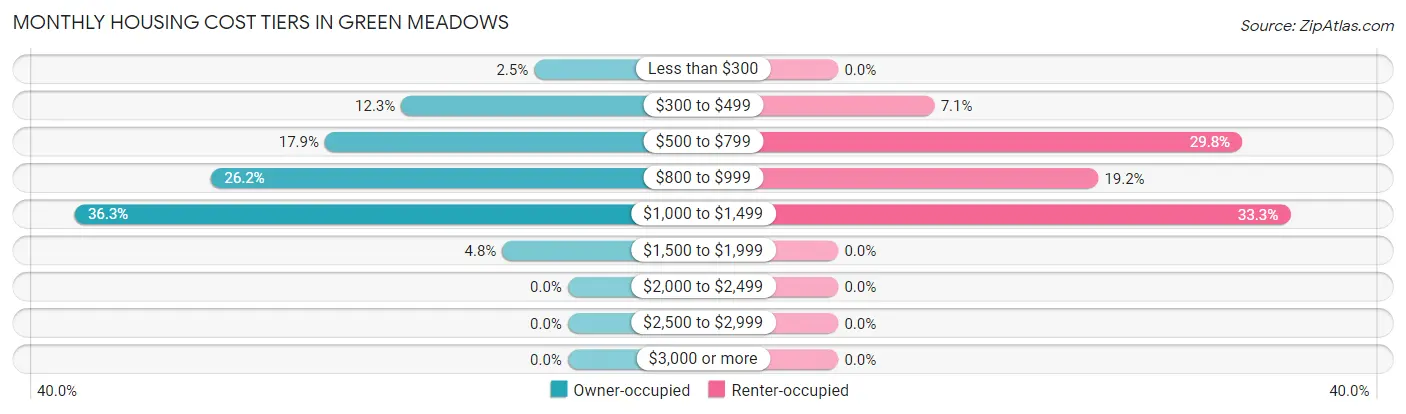
| Monthly Cost | Owner-occupied | Renter-occupied |
| Less than $300 | 19 (2.5%) | 0 (0.0%) |
| $300 to $499 | 94 (12.3%) | 10 (7.1%) |
| $500 to $799 | 137 (17.9%) | 42 (29.8%) |
| $800 to $999 | 201 (26.2%) | 27 (19.2%) |
| $1,000 to $1,499 | 278 (36.3%) | 47 (33.3%) |
| $1,500 to $1,999 | 37 (4.8%) | 0 (0.0%) |
| $2,000 to $2,499 | 0 (0.0%) | 0 (0.0%) |
| $2,500 to $2,999 | 0 (0.0%) | 0 (0.0%) |
| $3,000 or more | 0 (0.0%) | 0 (0.0%) |
| Total | 766 (100.0%) | 141 (100.0%) |
Physical Housing Characteristics in Green Meadows
Housing Structures in Green Meadows
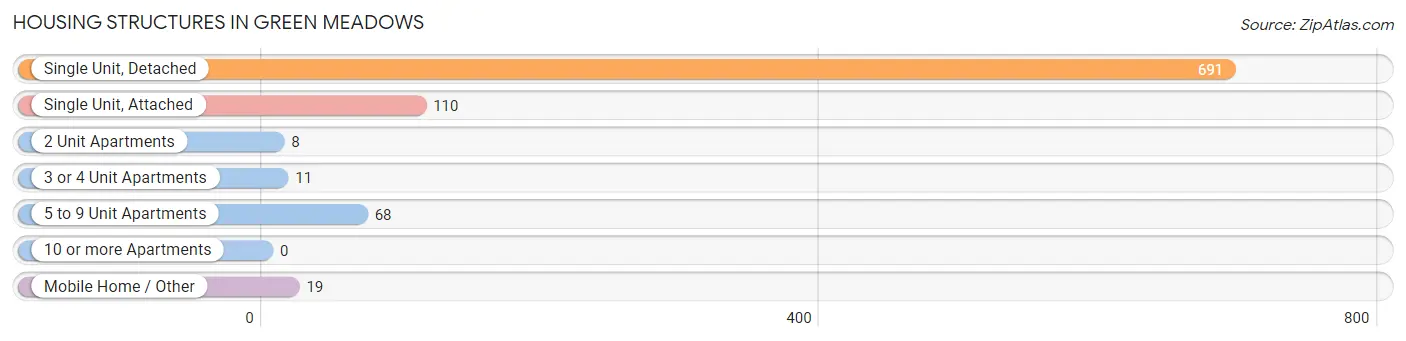
| Structure Type | # Housing Units | % Housing Units |
| Single Unit, Detached | 691 | 76.2% |
| Single Unit, Attached | 110 | 12.1% |
| 2 Unit Apartments | 8 | 0.9% |
| 3 or 4 Unit Apartments | 11 | 1.2% |
| 5 to 9 Unit Apartments | 68 | 7.5% |
| 10 or more Apartments | 0 | 0.0% |
| Mobile Home / Other | 19 | 2.1% |
| Total | 907 | 100.0% |
Housing Structures by Occupancy in Green Meadows
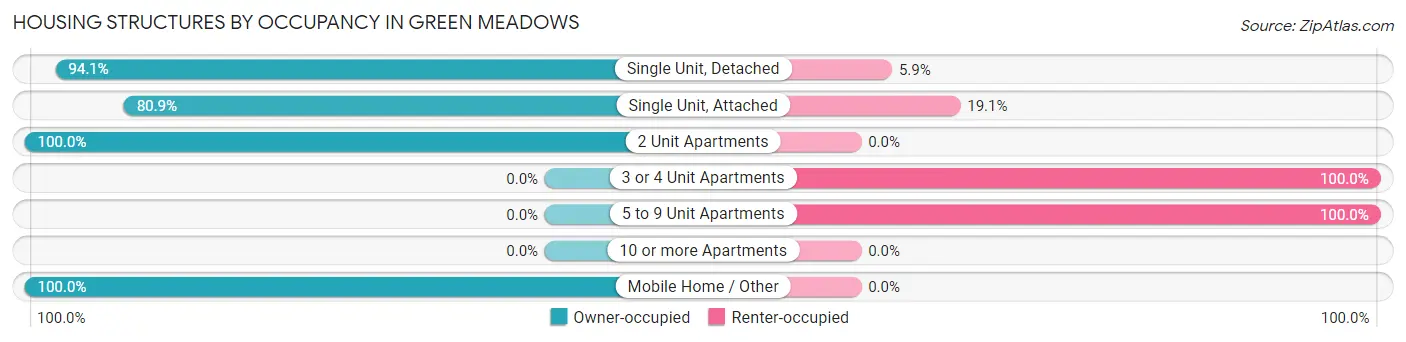
| Structure Type | Owner-occupied | Renter-occupied |
| Single Unit, Detached | 650 (94.1%) | 41 (5.9%) |
| Single Unit, Attached | 89 (80.9%) | 21 (19.1%) |
| 2 Unit Apartments | 8 (100.0%) | 0 (0.0%) |
| 3 or 4 Unit Apartments | 0 (0.0%) | 11 (100.0%) |
| 5 to 9 Unit Apartments | 0 (0.0%) | 68 (100.0%) |
| 10 or more Apartments | 0 (0.0%) | 0 (0.0%) |
| Mobile Home / Other | 19 (100.0%) | 0 (0.0%) |
| Total | 766 (84.5%) | 141 (15.5%) |
Housing Structures by Number of Rooms in Green Meadows
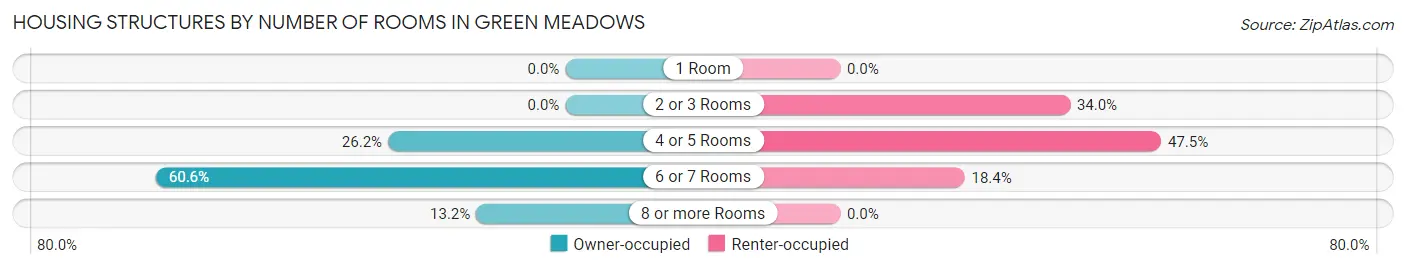
| Number of Rooms | Owner-occupied | Renter-occupied |
| 1 Room | 0 (0.0%) | 0 (0.0%) |
| 2 or 3 Rooms | 0 (0.0%) | 48 (34.0%) |
| 4 or 5 Rooms | 201 (26.2%) | 67 (47.5%) |
| 6 or 7 Rooms | 464 (60.6%) | 26 (18.4%) |
| 8 or more Rooms | 101 (13.2%) | 0 (0.0%) |
| Total | 766 (100.0%) | 141 (100.0%) |
Housing Structure by Heating Type in Green Meadows
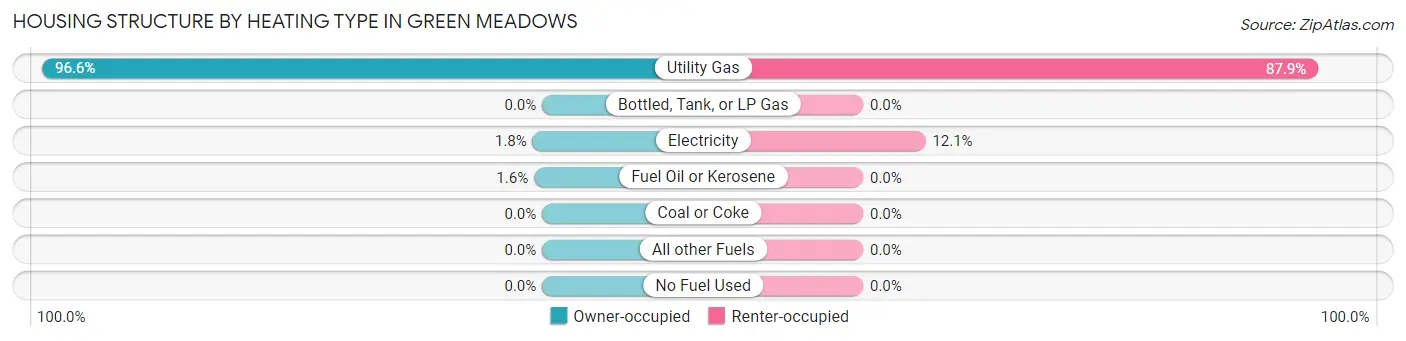
| Heating Type | Owner-occupied | Renter-occupied |
| Utility Gas | 740 (96.6%) | 124 (87.9%) |
| Bottled, Tank, or LP Gas | 0 (0.0%) | 0 (0.0%) |
| Electricity | 14 (1.8%) | 17 (12.1%) |
| Fuel Oil or Kerosene | 12 (1.6%) | 0 (0.0%) |
| Coal or Coke | 0 (0.0%) | 0 (0.0%) |
| All other Fuels | 0 (0.0%) | 0 (0.0%) |
| No Fuel Used | 0 (0.0%) | 0 (0.0%) |
| Total | 766 (100.0%) | 141 (100.0%) |
Household Vehicle Usage in Green Meadows
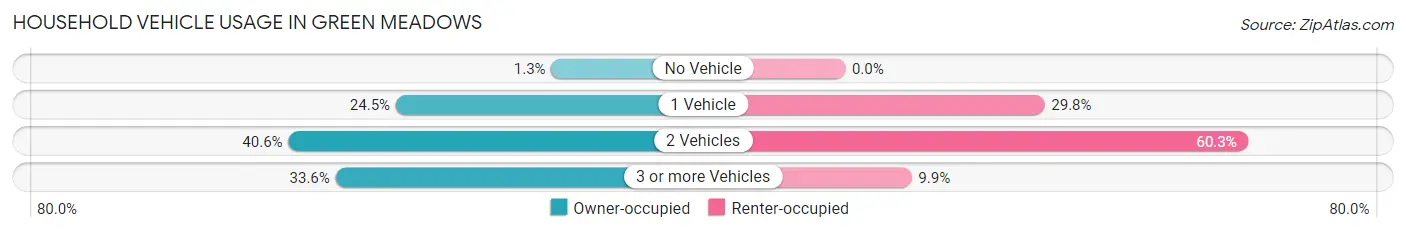
| Vehicles per Household | Owner-occupied | Renter-occupied |
| No Vehicle | 10 (1.3%) | 0 (0.0%) |
| 1 Vehicle | 188 (24.5%) | 42 (29.8%) |
| 2 Vehicles | 311 (40.6%) | 85 (60.3%) |
| 3 or more Vehicles | 257 (33.6%) | 14 (9.9%) |
| Total | 766 (100.0%) | 141 (100.0%) |
Real Estate & Mortgages in Green Meadows
Real Estate and Mortgage Overview in Green Meadows
| Characteristic | Without Mortgage | With Mortgage |
| Housing Units | 243 | 523 |
| Median Property Value | $140,800 | $134,900 |
| Median Household Income | $57,153 | $35 |
| Monthly Housing Costs | $512 | $0 |
| Real Estate Taxes | $2,181 | $29 |
Property Value by Mortgage Status in Green Meadows
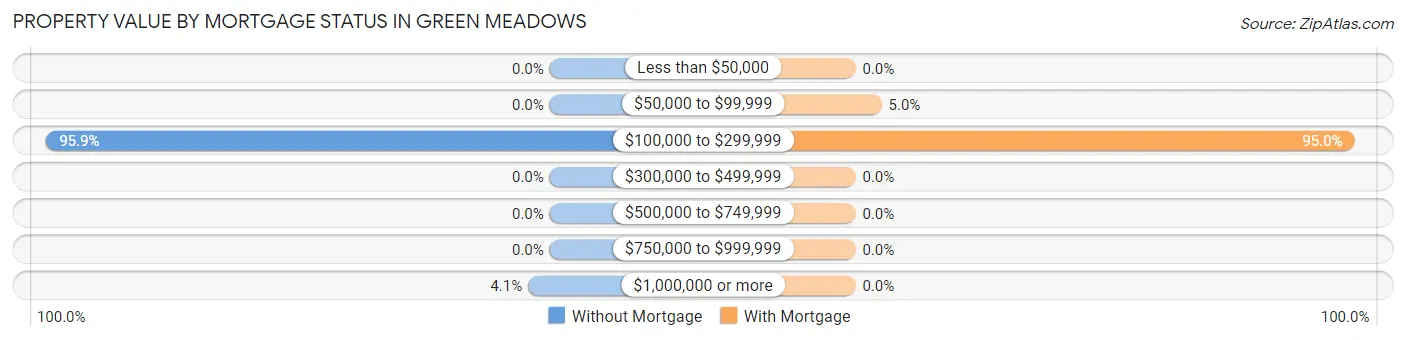
| Property Value | Without Mortgage | With Mortgage |
| Less than $50,000 | 0 (0.0%) | 0 (0.0%) |
| $50,000 to $99,999 | 0 (0.0%) | 26 (5.0%) |
| $100,000 to $299,999 | 233 (95.9%) | 497 (95.0%) |
| $300,000 to $499,999 | 0 (0.0%) | 0 (0.0%) |
| $500,000 to $749,999 | 0 (0.0%) | 0 (0.0%) |
| $750,000 to $999,999 | 0 (0.0%) | 0 (0.0%) |
| $1,000,000 or more | 10 (4.1%) | 0 (0.0%) |
| Total | 243 (100.0%) | 523 (100.0%) |
Household Income by Mortgage Status in Green Meadows
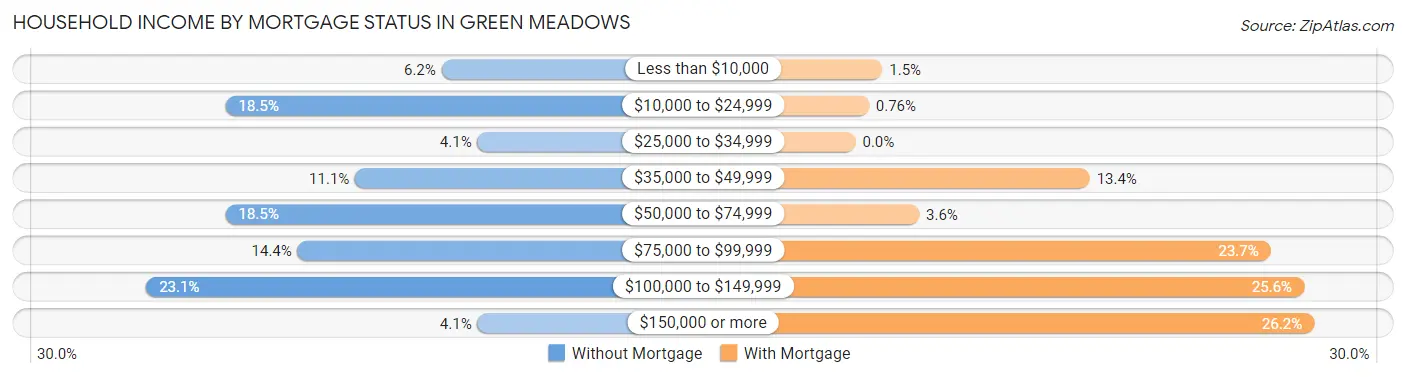
| Household Income | Without Mortgage | With Mortgage |
| Less than $10,000 | 15 (6.2%) | 8 (1.5%) |
| $10,000 to $24,999 | 45 (18.5%) | 4 (0.8%) |
| $25,000 to $34,999 | 10 (4.1%) | 0 (0.0%) |
| $35,000 to $49,999 | 27 (11.1%) | 70 (13.4%) |
| $50,000 to $74,999 | 45 (18.5%) | 19 (3.6%) |
| $75,000 to $99,999 | 35 (14.4%) | 124 (23.7%) |
| $100,000 to $149,999 | 56 (23.1%) | 134 (25.6%) |
| $150,000 or more | 10 (4.1%) | 137 (26.2%) |
| Total | 243 (100.0%) | 523 (100.0%) |
Property Value to Household Income Ratio in Green Meadows
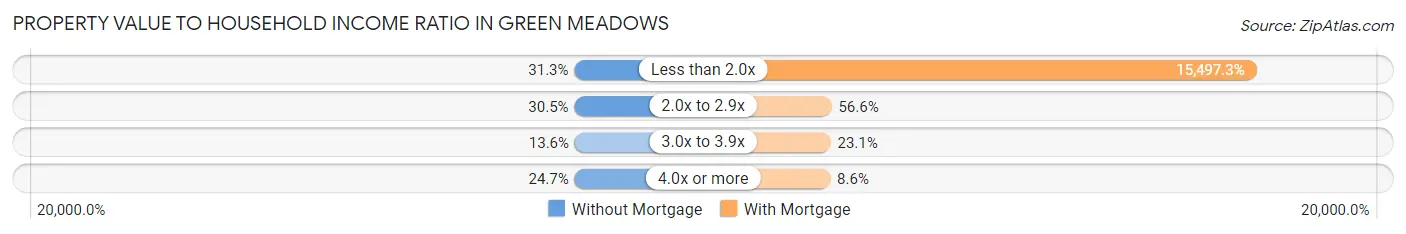
| Value-to-Income Ratio | Without Mortgage | With Mortgage |
| Less than 2.0x | 76 (31.3%) | 81,051 (15,497.3%) |
| 2.0x to 2.9x | 74 (30.4%) | 296 (56.6%) |
| 3.0x to 3.9x | 33 (13.6%) | 121 (23.1%) |
| 4.0x or more | 60 (24.7%) | 45 (8.6%) |
| Total | 243 (100.0%) | 523 (100.0%) |
Real Estate Taxes by Mortgage Status in Green Meadows
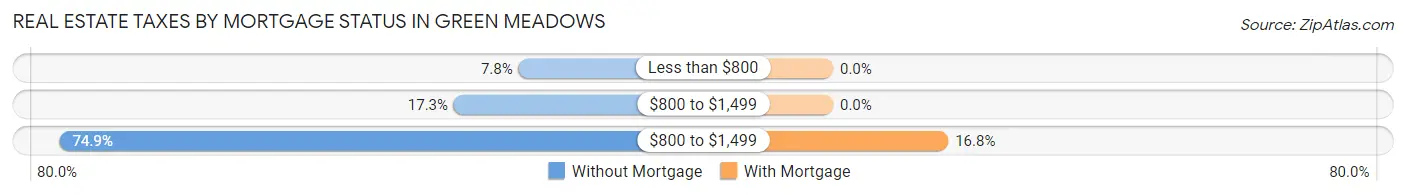
| Property Taxes | Without Mortgage | With Mortgage |
| Less than $800 | 19 (7.8%) | 0 (0.0%) |
| $800 to $1,499 | 42 (17.3%) | 0 (0.0%) |
| $800 to $1,499 | 182 (74.9%) | 88 (16.8%) |
| Total | 243 (100.0%) | 523 (100.0%) |
Health & Disability in Green Meadows
Health Insurance Coverage by Age in Green Meadows
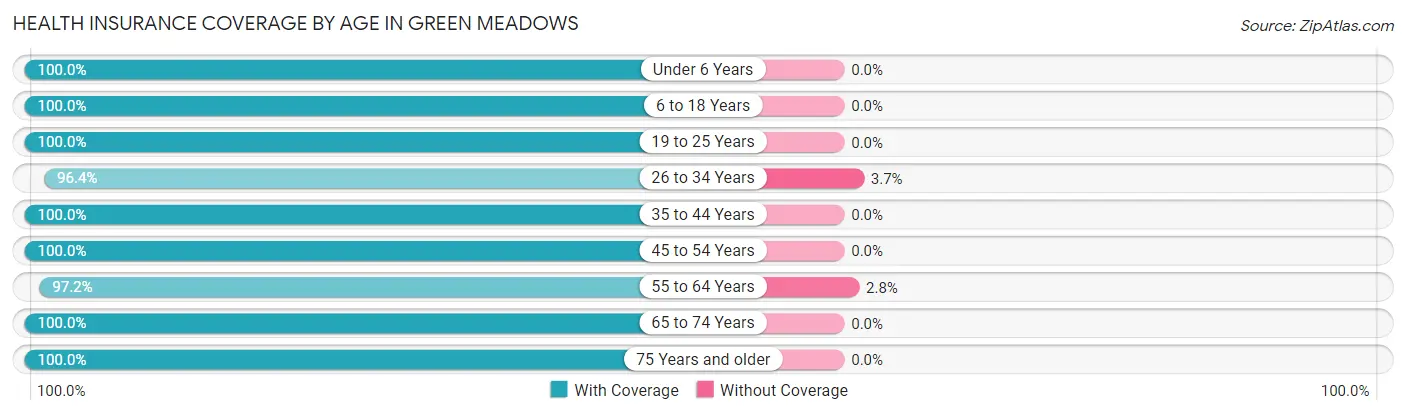
| Age Bracket | With Coverage | Without Coverage |
| Under 6 Years | 103 (100.0%) | 0 (0.0%) |
| 6 to 18 Years | 453 (100.0%) | 0 (0.0%) |
| 19 to 25 Years | 157 (100.0%) | 0 (0.0%) |
| 26 to 34 Years | 264 (96.4%) | 10 (3.6%) |
| 35 to 44 Years | 310 (100.0%) | 0 (0.0%) |
| 45 to 54 Years | 180 (100.0%) | 0 (0.0%) |
| 55 to 64 Years | 247 (97.2%) | 7 (2.8%) |
| 65 to 74 Years | 245 (100.0%) | 0 (0.0%) |
| 75 Years and older | 215 (100.0%) | 0 (0.0%) |
| Total | 2,174 (99.2%) | 17 (0.8%) |
Health Insurance Coverage by Citizenship Status in Green Meadows
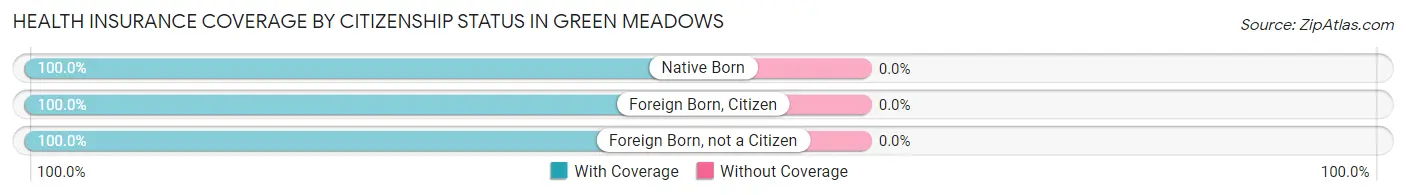
| Citizenship Status | With Coverage | Without Coverage |
| Native Born | 103 (100.0%) | 0 (0.0%) |
| Foreign Born, Citizen | 453 (100.0%) | 0 (0.0%) |
| Foreign Born, not a Citizen | 157 (100.0%) | 0 (0.0%) |
Health Insurance Coverage by Household Income in Green Meadows
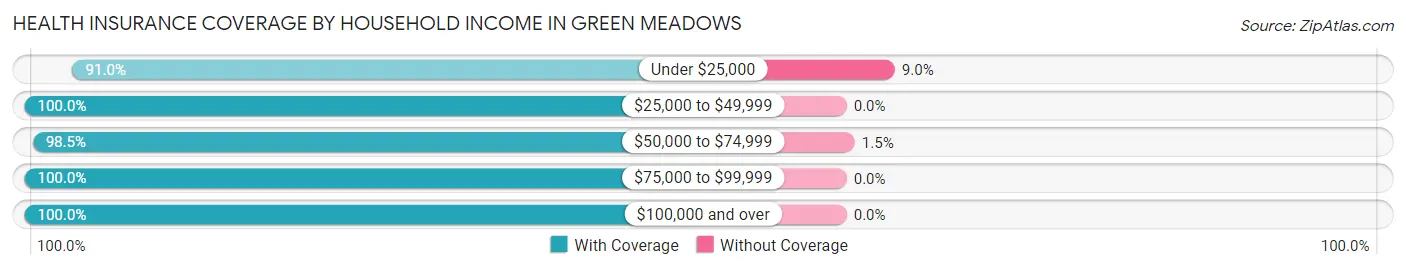
| Household Income | With Coverage | Without Coverage |
| Under $25,000 | 101 (91.0%) | 10 (9.0%) |
| $25,000 to $49,999 | 284 (100.0%) | 0 (0.0%) |
| $50,000 to $74,999 | 455 (98.5%) | 7 (1.5%) |
| $75,000 to $99,999 | 595 (100.0%) | 0 (0.0%) |
| $100,000 and over | 739 (100.0%) | 0 (0.0%) |
Public vs Private Health Insurance Coverage by Age in Green Meadows
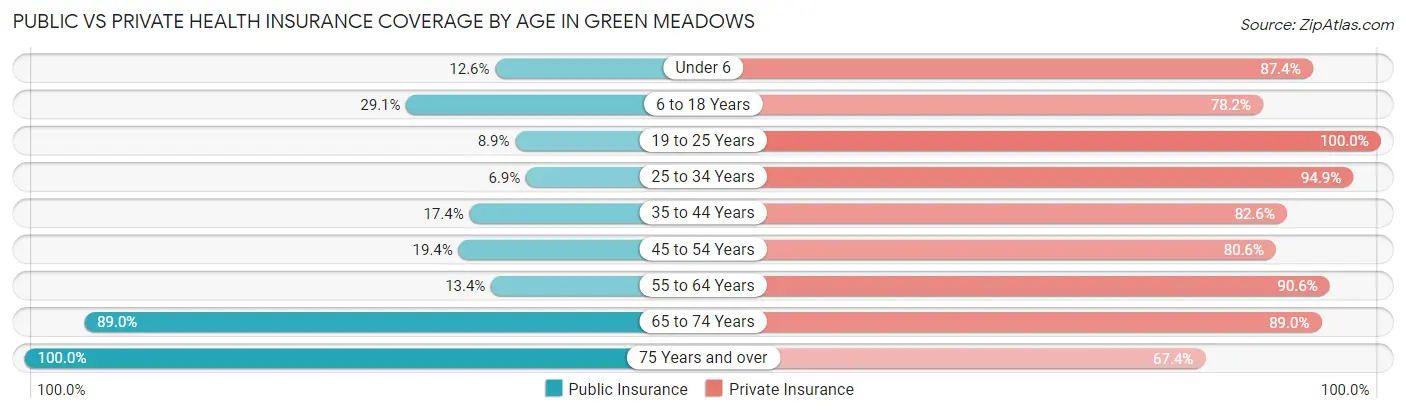
| Age Bracket | Public Insurance | Private Insurance |
| Under 6 | 13 (12.6%) | 90 (87.4%) |
| 6 to 18 Years | 132 (29.1%) | 354 (78.1%) |
| 19 to 25 Years | 14 (8.9%) | 157 (100.0%) |
| 25 to 34 Years | 19 (6.9%) | 260 (94.9%) |
| 35 to 44 Years | 54 (17.4%) | 256 (82.6%) |
| 45 to 54 Years | 35 (19.4%) | 145 (80.6%) |
| 55 to 64 Years | 34 (13.4%) | 230 (90.5%) |
| 65 to 74 Years | 218 (89.0%) | 218 (89.0%) |
| 75 Years and over | 215 (100.0%) | 145 (67.4%) |
| Total | 734 (33.5%) | 1,855 (84.7%) |
Disability Status by Sex by Age in Green Meadows
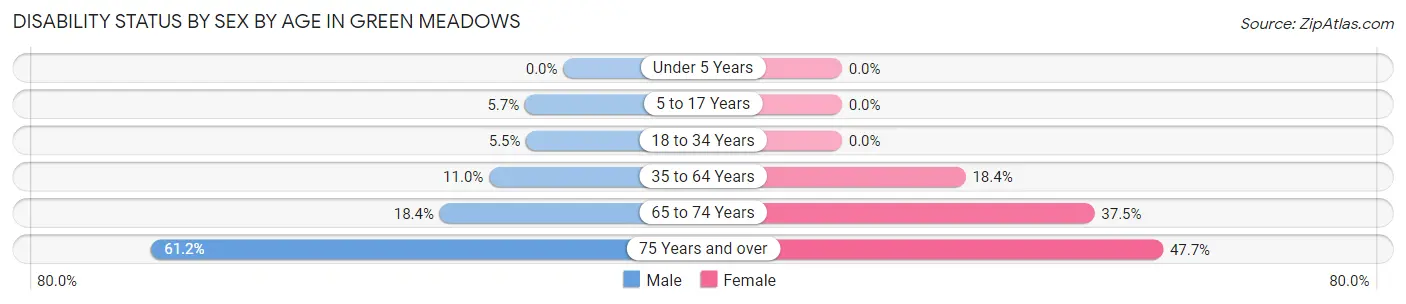
| Age Bracket | Male | Female |
| Under 5 Years | 0 (0.0%) | 0 (0.0%) |
| 5 to 17 Years | 16 (5.7%) | 0 (0.0%) |
| 18 to 34 Years | 15 (5.5%) | 0 (0.0%) |
| 35 to 64 Years | 40 (11.0%) | 70 (18.4%) |
| 65 to 74 Years | 20 (18.3%) | 51 (37.5%) |
| 75 Years and over | 52 (61.2%) | 62 (47.7%) |
Disability Class by Sex by Age in Green Meadows
Disability Class: Hearing Difficulty
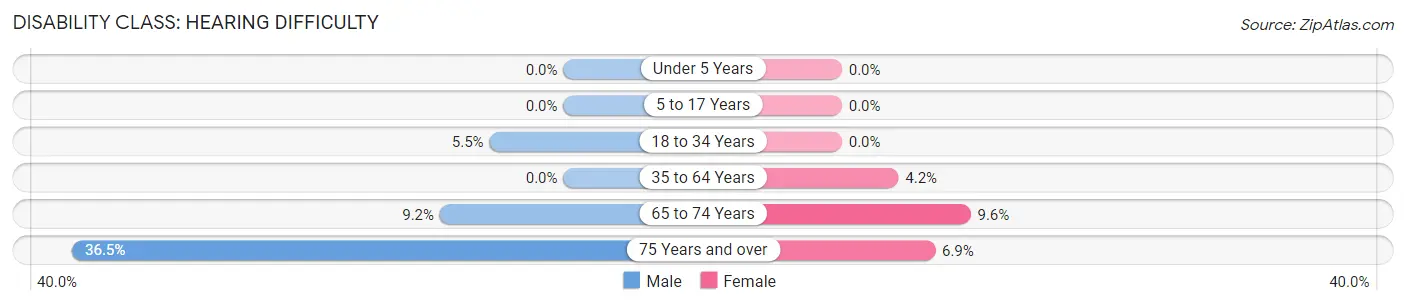
| Age Bracket | Male | Female |
| Under 5 Years | 0 (0.0%) | 0 (0.0%) |
| 5 to 17 Years | 0 (0.0%) | 0 (0.0%) |
| 18 to 34 Years | 15 (5.5%) | 0 (0.0%) |
| 35 to 64 Years | 0 (0.0%) | 16 (4.2%) |
| 65 to 74 Years | 10 (9.2%) | 13 (9.6%) |
| 75 Years and over | 31 (36.5%) | 9 (6.9%) |
Disability Class: Vision Difficulty
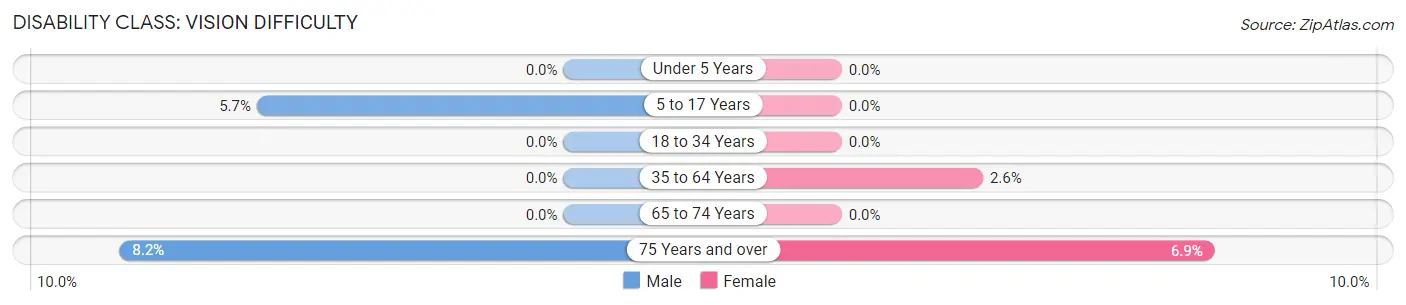
| Age Bracket | Male | Female |
| Under 5 Years | 0 (0.0%) | 0 (0.0%) |
| 5 to 17 Years | 16 (5.7%) | 0 (0.0%) |
| 18 to 34 Years | 0 (0.0%) | 0 (0.0%) |
| 35 to 64 Years | 0 (0.0%) | 10 (2.6%) |
| 65 to 74 Years | 0 (0.0%) | 0 (0.0%) |
| 75 Years and over | 7 (8.2%) | 9 (6.9%) |
Disability Class: Cognitive Difficulty
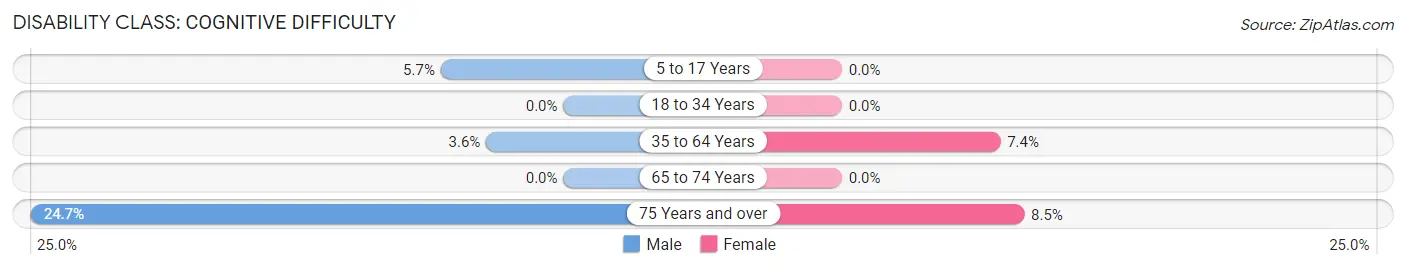
| Age Bracket | Male | Female |
| 5 to 17 Years | 16 (5.7%) | 0 (0.0%) |
| 18 to 34 Years | 0 (0.0%) | 0 (0.0%) |
| 35 to 64 Years | 13 (3.6%) | 28 (7.3%) |
| 65 to 74 Years | 0 (0.0%) | 0 (0.0%) |
| 75 Years and over | 21 (24.7%) | 11 (8.5%) |
Disability Class: Ambulatory Difficulty
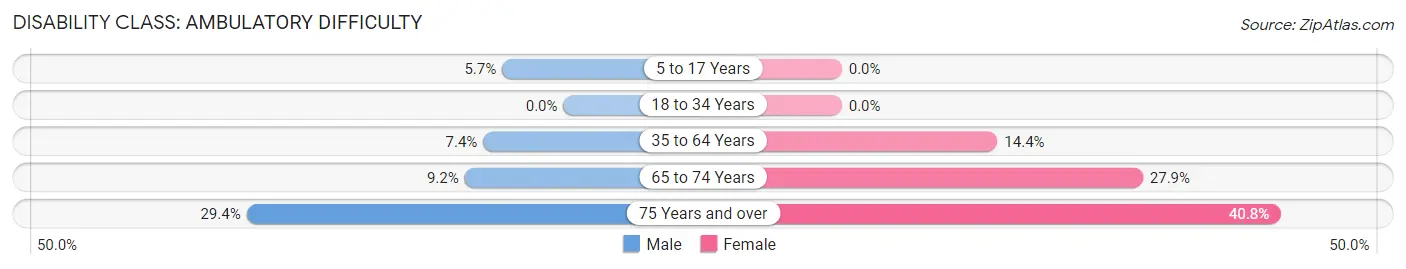
| Age Bracket | Male | Female |
| 5 to 17 Years | 16 (5.7%) | 0 (0.0%) |
| 18 to 34 Years | 0 (0.0%) | 0 (0.0%) |
| 35 to 64 Years | 27 (7.4%) | 55 (14.4%) |
| 65 to 74 Years | 10 (9.2%) | 38 (27.9%) |
| 75 Years and over | 25 (29.4%) | 53 (40.8%) |
Disability Class: Self-Care Difficulty
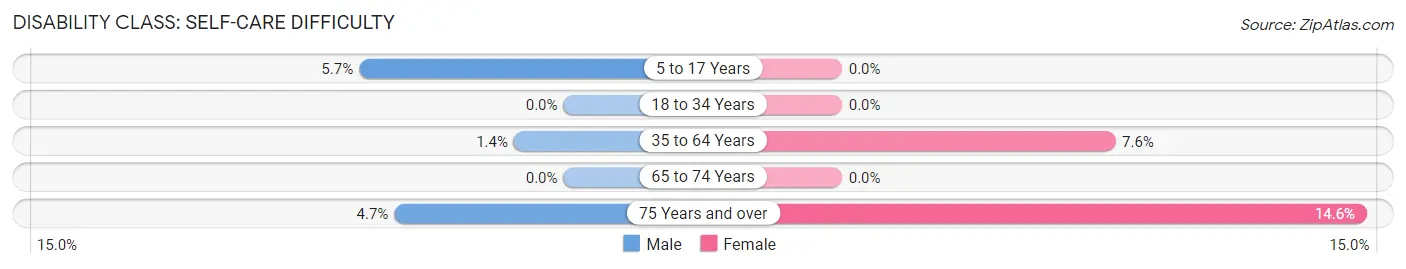
| Age Bracket | Male | Female |
| 5 to 17 Years | 16 (5.7%) | 0 (0.0%) |
| 18 to 34 Years | 0 (0.0%) | 0 (0.0%) |
| 35 to 64 Years | 5 (1.4%) | 29 (7.6%) |
| 65 to 74 Years | 0 (0.0%) | 0 (0.0%) |
| 75 Years and over | 4 (4.7%) | 19 (14.6%) |
Technology Access in Green Meadows
Computing Device Access in Green Meadows
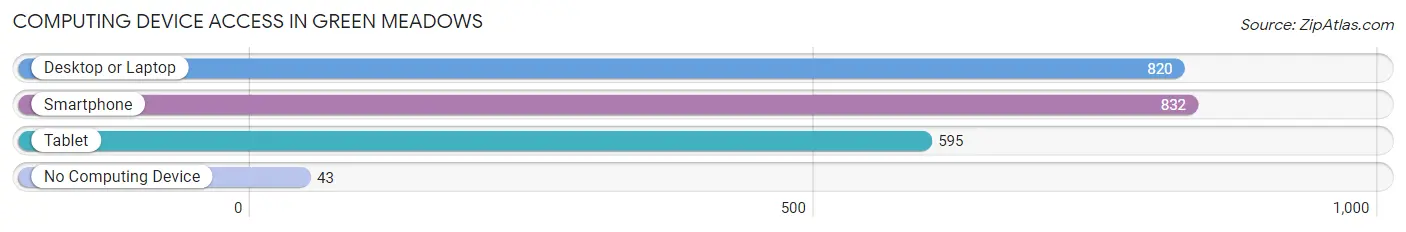
| Device Type | # Households | % Households |
| Desktop or Laptop | 820 | 90.4% |
| Smartphone | 832 | 91.7% |
| Tablet | 595 | 65.6% |
| No Computing Device | 43 | 4.7% |
| Total | 907 | 100.0% |
Internet Access in Green Meadows
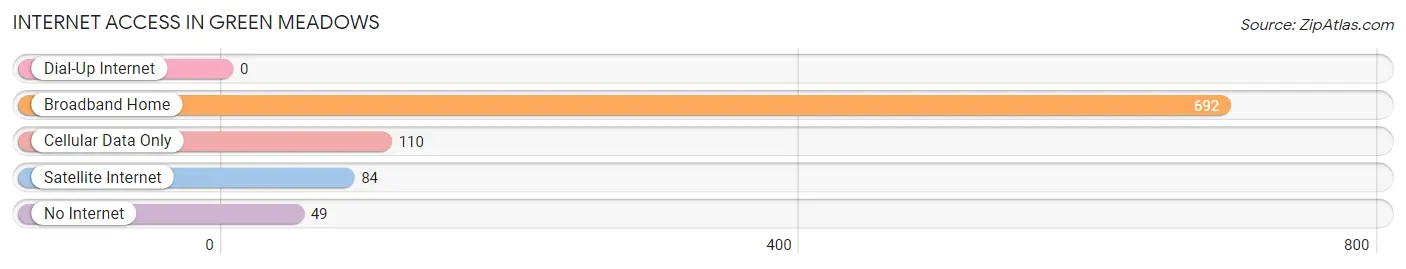
| Internet Type | # Households | % Households |
| Dial-Up Internet | 0 | 0.0% |
| Broadband Home | 692 | 76.3% |
| Cellular Data Only | 110 | 12.1% |
| Satellite Internet | 84 | 9.3% |
| No Internet | 49 | 5.4% |
| Total | 907 | 100.0% |
Green Meadows Summary
History
Green Meadows is a small village located in the state of Ohio, United States. It is situated in the county of Franklin and is part of the Columbus metropolitan area. The village was founded in 1818 by a group of settlers from Pennsylvania. The settlers were attracted to the area due to its fertile soil and abundant natural resources. The village was originally known as “Green Meadows” due to the lush green meadows that surrounded the area.
The village was initially a farming community and the main crops grown were corn, wheat, and oats. The village also had a small sawmill and a gristmill. In the late 19th century, the village began to grow and develop as a result of the construction of the railroad. This allowed for the transportation of goods and people to and from the village.
The village was incorporated in 1891 and the first mayor was elected in 1892. The village continued to grow and develop throughout the 20th century. In the 1950s, the village was home to a number of small businesses, including a grocery store, a hardware store, and a gas station.
Geography
Green Meadows is located in the state of Ohio, United States. It is situated in the county of Franklin and is part of the Columbus metropolitan area. The village is located in the central part of the state, approximately 25 miles south of the city of Columbus. The village is situated on the banks of the Big Darby Creek and is surrounded by rolling hills and lush green meadows.
The village has a total area of 0.7 square miles, all of which is land. The village has a humid continental climate, with hot summers and cold winters. The average temperature in the summer is around 75 degrees Fahrenheit and the average temperature in the winter is around 30 degrees Fahrenheit.
Economy
Green Meadows is a small village with a population of just over 1,000 people. The village is primarily a residential community, with most of the residents employed in the nearby cities of Columbus and Grove City. The village does not have any major industries or businesses.
The village does have a few small businesses, including a grocery store, a hardware store, and a gas station. The village also has a few restaurants and bars. The village is home to a number of small farms, which produce a variety of crops, including corn, wheat, and oats.
Demographics
As of the 2010 census, the population of Green Meadows was 1,072. The racial makeup of the village was 97.3% White, 0.9% African American, 0.3% Native American, 0.3% Asian, and 0.9% from other races. The median household income was $45,000 and the median family income was $50,000. The per capita income was $20,000.
The village has a high rate of homeownership, with over 80% of the population owning their own homes. The village also has a high rate of educational attainment, with over 90% of the population having at least a high school diploma. The village is served by the Big Walnut Local School District.
Common Questions
What is the Total Population of Green Meadows?
Total Population of Green Meadows is 2,191.
What is the Total Male Population of Green Meadows?
Total Male Population of Green Meadows is 1,143.
What is the Total Female Population of Green Meadows?
Total Female Population of Green Meadows is 1,048.
What is the Ratio of Males per 100 Females in Green Meadows?
There are 109.06 Males per 100 Females in Green Meadows.
What is the Ratio of Females per 100 Males in Green Meadows?
There are 91.69 Females per 100 Males in Green Meadows.
What is the Median Population Age in Green Meadows?
Median Population Age in Green Meadows is 38.9 Years.
What is the Average Family Size in Green Meadows
Average Family Size in Green Meadows is 2.9 People.
What is the Average Household Size in Green Meadows
Average Household Size in Green Meadows is 2.4 People.
What is Per Capita Income in Green Meadows?
Per Capita income in Green Meadows is $32,472.
What is the Median Family Income in Green Meadows?
Median Family Income in Green Meadows is $82,268.
What is the Median Household income in Green Meadows?
Median Household Income in Green Meadows is $76,083.
What is Income or Wage Gap in Green Meadows?
Income or Wage Gap in Green Meadows is 42.9%.
Women in Green Meadows earn 57.1 cents for every dollar earned by a man.
What is Inequality or Gini Index in Green Meadows?
Inequality or Gini Index in Green Meadows is 0.31.
How Large is the Labor Force in Green Meadows?
There are 1,178 People in the Labor Forcein in Green Meadows.
What is the Percentage of People in the Labor Force in Green Meadows?
68.0% of People are in the Labor Force in Green Meadows.
What is the Unemployment Rate in Green Meadows?
Unemployment Rate in Green Meadows is 7.1%.