Grandview, OH
Grandview Map
Grandview Overview
1,351
TOTAL POPULATION
663
MALE POPULATION
688
FEMALE POPULATION
96.37
MALES / 100 FEMALES
103.77
FEMALES / 100 MALES
35.7
MEDIAN AGE
4.0
AVG FAMILY SIZE
3.5
AVG HOUSEHOLD SIZE
$43,242
PER CAPITA INCOME
$190,057
AVG FAMILY INCOME
$135,556
AVG HOUSEHOLD INCOME
3.4%
WAGE / INCOME GAP [ % ]
96.6¢/ $1
WAGE / INCOME GAP [ $ ]
0.29
INEQUALITY / GINI INDEX
896
LABOR FORCE [ PEOPLE ]
84.9%
PERCENT IN LABOR FORCE
13.5%
UNEMPLOYMENT RATE
Grandview Area Codes
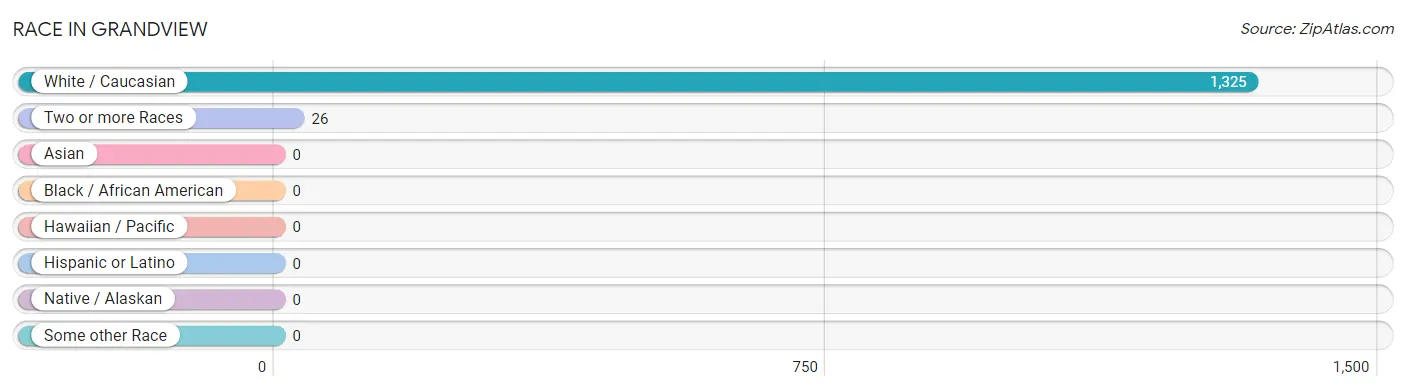
Race in Grandview
The most populous races in Grandview are White / Caucasian (1,325 | 98.1%), and Two or more Races (26 | 1.9%).
| Race | # Population | % Population |
| Asian | 0 | 0.0% |
| Black / African American | 0 | 0.0% |
| Hawaiian / Pacific | 0 | 0.0% |
| Hispanic or Latino | 0 | 0.0% |
| Native / Alaskan | 0 | 0.0% |
| White / Caucasian | 1,325 | 98.1% |
| Two or more Races | 26 | 1.9% |
| Some other Race | 0 | 0.0% |
| Total | 1,351 | 100.0% |
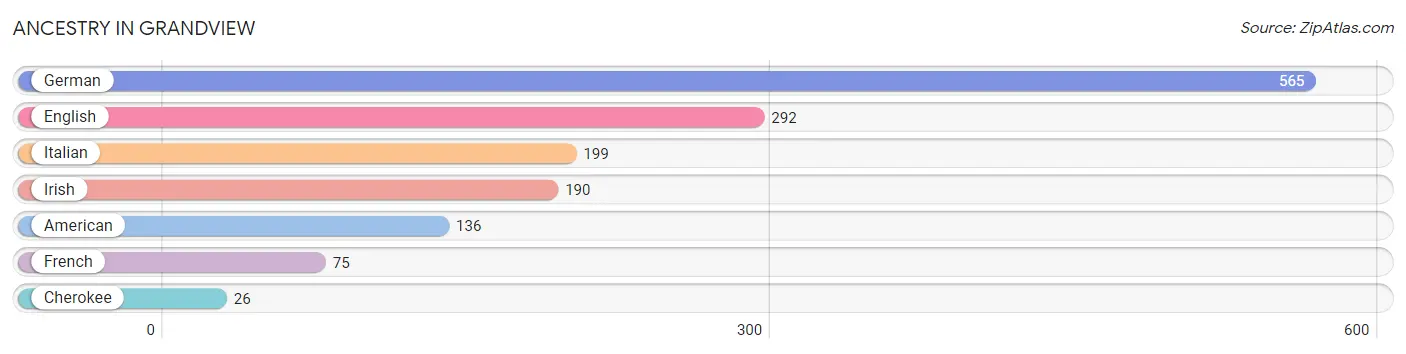
Ancestry in Grandview
The most populous ancestries reported in Grandview are German (565 | 41.8%), English (292 | 21.6%), Italian (199 | 14.7%), Irish (190 | 14.1%), and American (136 | 10.1%), together accounting for 102.3% of all Grandview residents.
| Ancestry | # Population | % Population |
| American | 136 | 10.1% |
| Cherokee | 26 | 1.9% |
| English | 292 | 21.6% |
| French | 75 | 5.6% |
| German | 565 | 41.8% |
| Irish | 190 | 14.1% |
| Italian | 199 | 14.7% | View All 7 Rows |
Immigrants in Grandview

| Immigration Origin | # Population | % Population | View All 0 Rows |
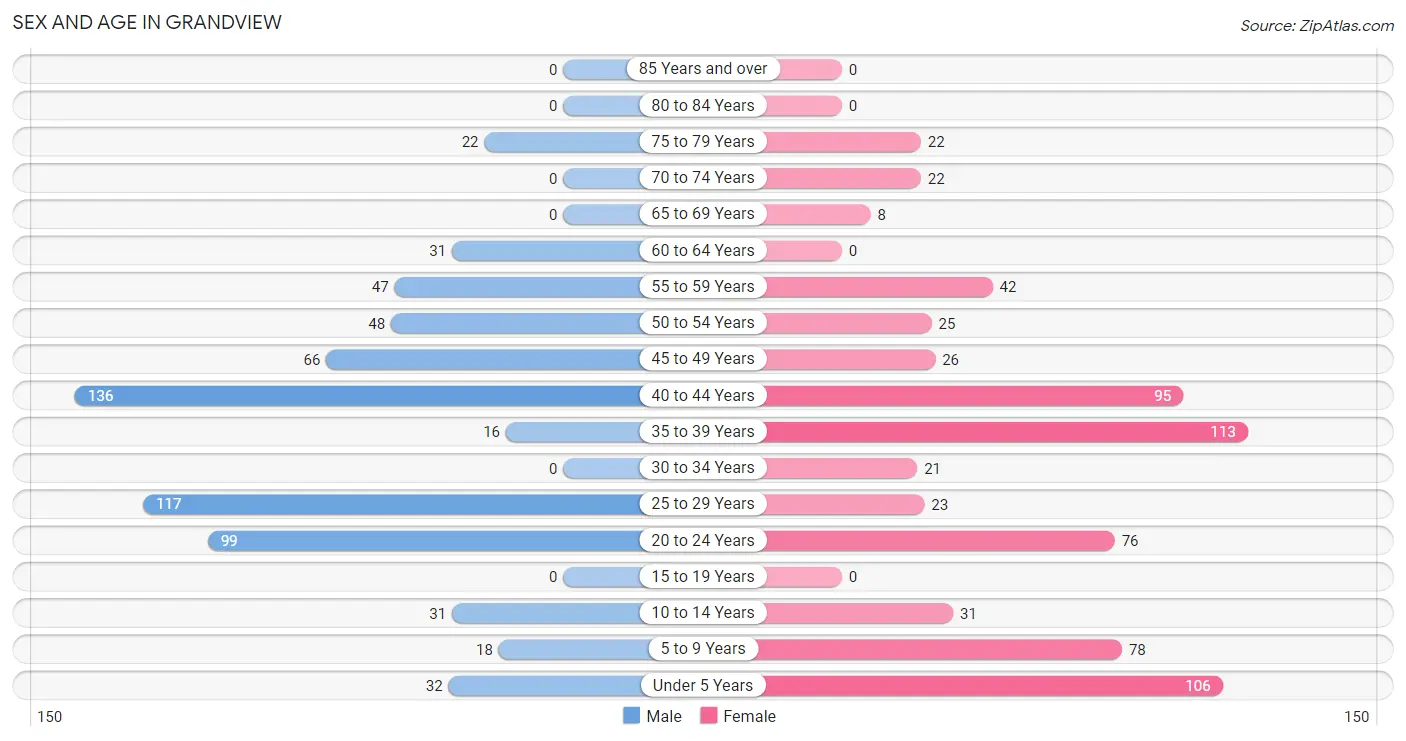
Sex and Age in Grandview
Sex and Age in Grandview
The most populous age groups in Grandview are 40 to 44 Years (136 | 20.5%) for men and 35 to 39 Years (113 | 16.4%) for women.
| Age Bracket | Male | Female |
| Under 5 Years | 32 (4.8%) | 106 (15.4%) |
| 5 to 9 Years | 18 (2.7%) | 78 (11.3%) |
| 10 to 14 Years | 31 (4.7%) | 31 (4.5%) |
| 15 to 19 Years | 0 (0.0%) | 0 (0.0%) |
| 20 to 24 Years | 99 (14.9%) | 76 (11.1%) |
| 25 to 29 Years | 117 (17.6%) | 23 (3.3%) |
| 30 to 34 Years | 0 (0.0%) | 21 (3.0%) |
| 35 to 39 Years | 16 (2.4%) | 113 (16.4%) |
| 40 to 44 Years | 136 (20.5%) | 95 (13.8%) |
| 45 to 49 Years | 66 (10.0%) | 26 (3.8%) |
| 50 to 54 Years | 48 (7.2%) | 25 (3.6%) |
| 55 to 59 Years | 47 (7.1%) | 42 (6.1%) |
| 60 to 64 Years | 31 (4.7%) | 0 (0.0%) |
| 65 to 69 Years | 0 (0.0%) | 8 (1.2%) |
| 70 to 74 Years | 0 (0.0%) | 22 (3.2%) |
| 75 to 79 Years | 22 (3.3%) | 22 (3.2%) |
| 80 to 84 Years | 0 (0.0%) | 0 (0.0%) |
| 85 Years and over | 0 (0.0%) | 0 (0.0%) |
| Total | 663 (100.0%) | 688 (100.0%) |
Families and Households in Grandview
Median Family Size in Grandview
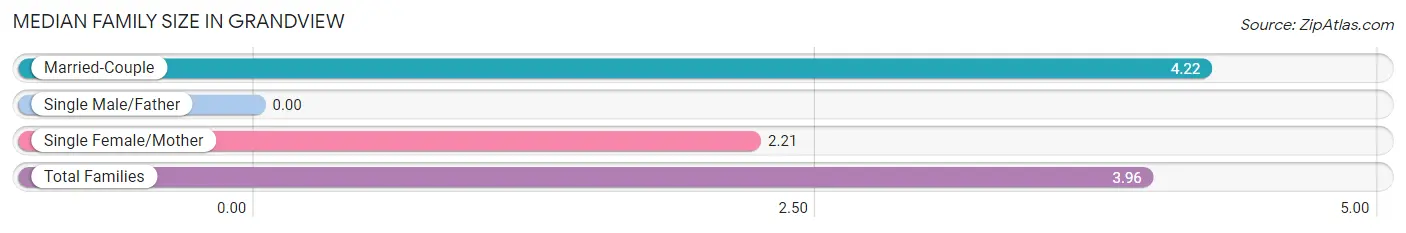
| Family Type | # Families | Family Size |
| Married-Couple | 260 (87.0%) | 4.22 |
| Single Male/Father | 0 (0.0%) | - |
| Single Female/Mother | 39 (13.0%) | 2.21 |
| Total Families | 299 (100.0%) | 3.96 |
Median Household Size in Grandview
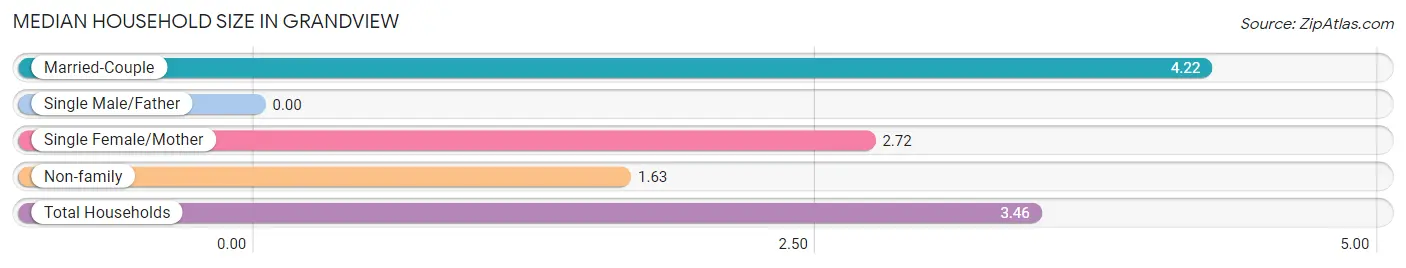
| Household Type | # Households | Household Size |
| Married-Couple | 260 (66.7%) | 4.22 |
| Single Male/Father | 0 (0.0%) | - |
| Single Female/Mother | 39 (10.0%) | 2.72 |
| Non-family | 91 (23.3%) | 1.63 |
| Total Households | 390 (100.0%) | 3.46 |
Household Size by Marriage Status in Grandview
Out of a total of 390 households in Grandview, 299 (76.7%) are family households, while 91 (23.3%) are nonfamily households. The most numerous type of family households are 3-person households, comprising 114, and the most common type of nonfamily households are 2-person households, comprising 57.
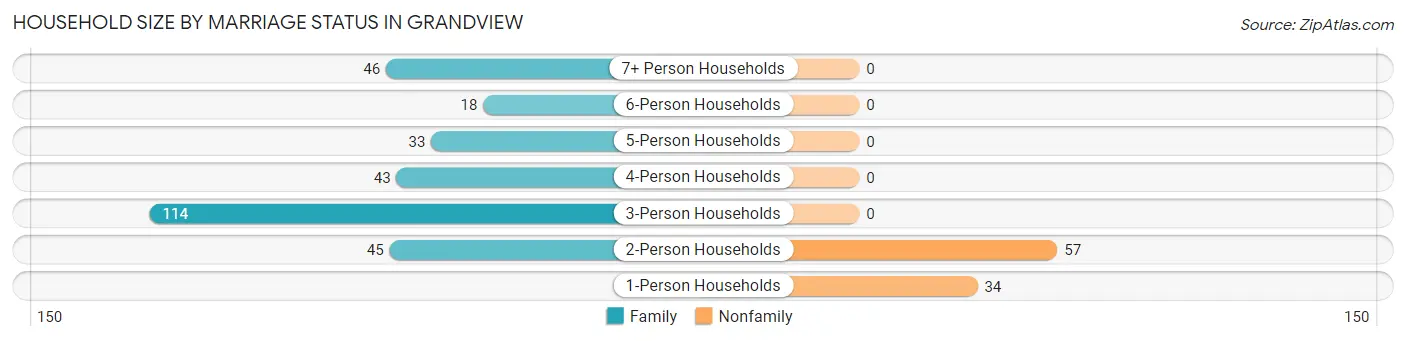
| Household Size | Family Households | Nonfamily Households |
| 1-Person Households | - | 34 (8.7%) |
| 2-Person Households | 45 (11.5%) | 57 (14.6%) |
| 3-Person Households | 114 (29.2%) | 0 (0.0%) |
| 4-Person Households | 43 (11.0%) | 0 (0.0%) |
| 5-Person Households | 33 (8.5%) | 0 (0.0%) |
| 6-Person Households | 18 (4.6%) | 0 (0.0%) |
| 7+ Person Households | 46 (11.8%) | 0 (0.0%) |
| Total | 299 (76.7%) | 91 (23.3%) |
Female Fertility in Grandview
Fertility by Age in Grandview
Average fertility rate in Grandview is 164.0 births per 1,000 women. Women in the age bracket of 20 to 34 years have the highest fertility rate with 483.0 births per 1,000 women. Women in the age bracket of 20 to 34 years acount for 100.0% of all women with births.
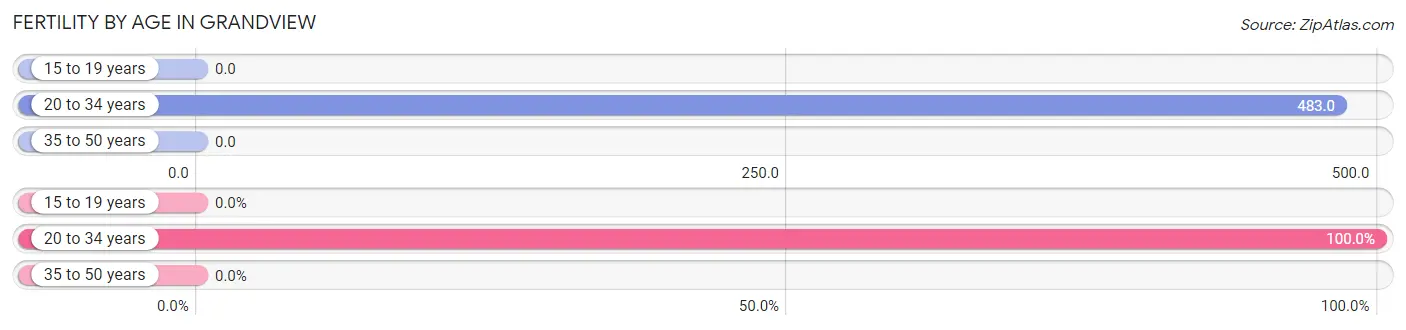
| Age Bracket | Women with Births | Births / 1,000 Women |
| 15 to 19 years | 0 (0.0%) | 0.0 |
| 20 to 34 years | 58 (100.0%) | 483.0 |
| 35 to 50 years | 0 (0.0%) | 0.0 |
| Total | 58 (100.0%) | 164.0 |
Fertility by Age by Marriage Status in Grandview
70.7% of women with births (58) in Grandview are married. The highest percentage of unmarried women with births falls into 20 to 34 years age bracket with 29.3% of them unmarried at the time of birth, while the lowest percentage of unmarried women with births belong to 20 to 34 years age bracket with 29.3% of them unmarried.
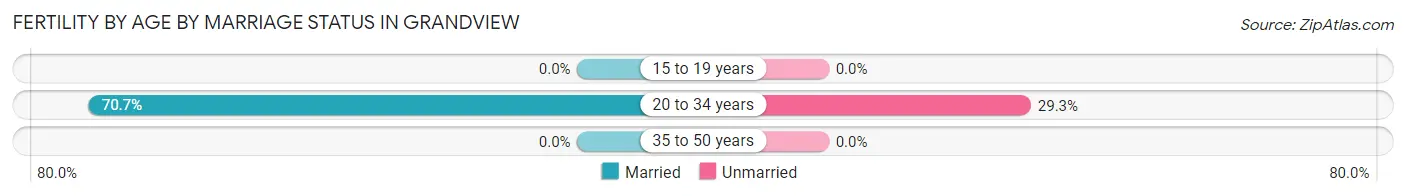
| Age Bracket | Married | Unmarried |
| 15 to 19 years | 0 (0.0%) | 0 (0.0%) |
| 20 to 34 years | 41 (70.7%) | 17 (29.3%) |
| 35 to 50 years | 0 (0.0%) | 0 (0.0%) |
| Total | 41 (70.7%) | 17 (29.3%) |
Fertility by Education in Grandview
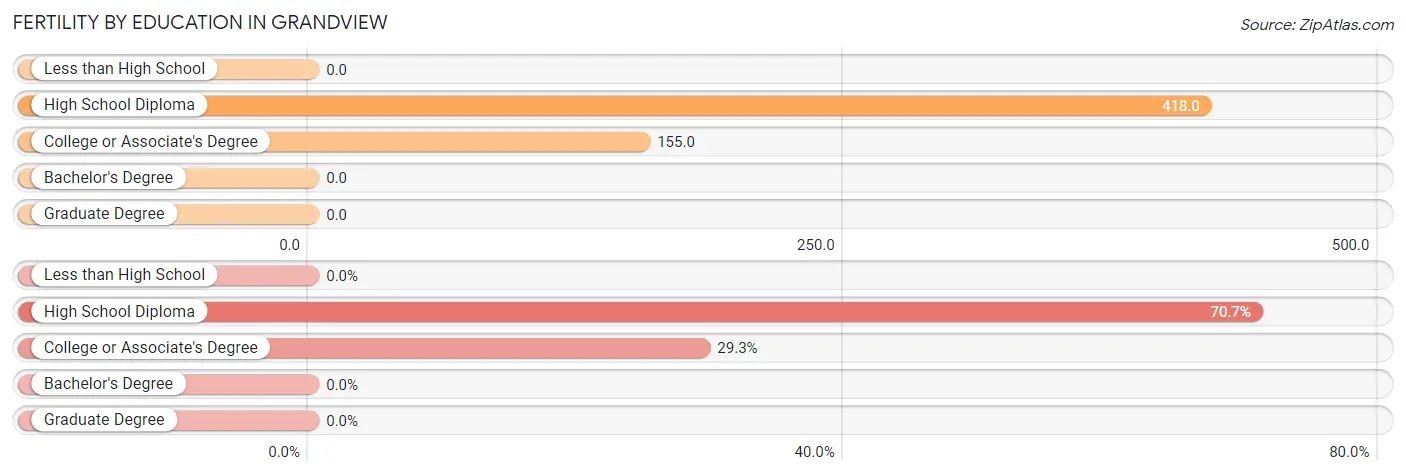
| Educational Attainment | Women with Births | Births / 1,000 Women |
| Less than High School | 0 (0.0%) | 0.0 |
| High School Diploma | 41 (70.7%) | 418.0 |
| College or Associate's Degree | 17 (29.3%) | 155.0 |
| Bachelor's Degree | 0 (0.0%) | 0.0 |
| Graduate Degree | 0 (0.0%) | 0.0 |
| Total | 58 (100.0%) | 164.0 |
Fertility by Education by Marriage Status in Grandview
29.3% of women with births in Grandview are unmarried. Women with the educational attainment of high school diploma are most likely to be married with 100.0% of them married at childbirth, while women with the educational attainment of college or associate's degree are least likely to be married with 100.0% of them unmarried at childbirth.
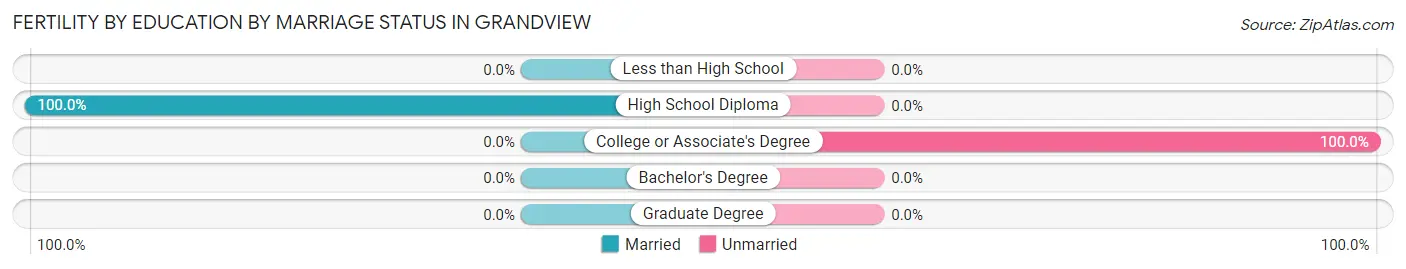
| Educational Attainment | Married | Unmarried |
| Less than High School | 0 (0.0%) | 0 (0.0%) |
| High School Diploma | 41 (100.0%) | 0 (0.0%) |
| College or Associate's Degree | 0 (0.0%) | 17 (100.0%) |
| Bachelor's Degree | 0 (0.0%) | 0 (0.0%) |
| Graduate Degree | 0 (0.0%) | 0 (0.0%) |
| Total | 41 (70.7%) | 17 (29.3%) |
Income in Grandview
Income Overview in Grandview
Per Capita Income in Grandview is $43,242, while median incomes of families and households are $190,057 and $135,556 respectively.
| Characteristic | Number | Measure |
| Per Capita Income | 1,351 | $43,242 |
| Median Family Income | 299 | $190,057 |
| Mean Family Income | 299 | $173,529 |
| Median Household Income | 390 | $135,556 |
| Mean Household Income | 390 | $151,296 |
| Income Deficit | 299 | $0 |
| Wage / Income Gap (%) | 1,351 | 3.45% |
| Wage / Income Gap ($) | 1,351 | 96.55¢ per $1 |
| Gini / Inequality Index | 1,351 | 0.29 |
Earnings by Sex in Grandview
Average Earnings in Grandview are $37,913, $38,212 for men and $36,895 for women, a difference of 3.5%.
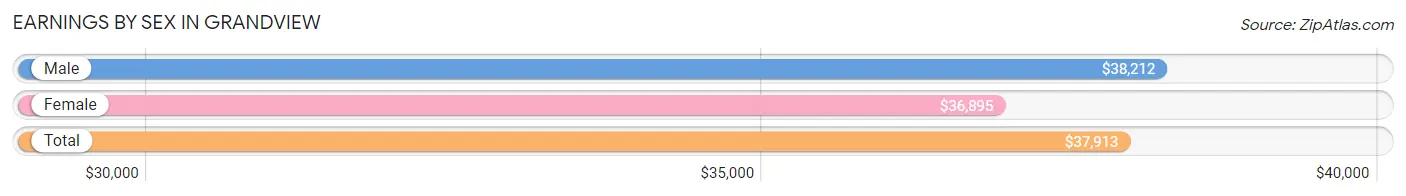
| Sex | Number | Average Earnings |
| Male | 538 (61.1%) | $38,212 |
| Female | 343 (38.9%) | $36,895 |
| Total | 881 (100.0%) | $37,913 |
Earnings by Sex by Income Bracket in Grandview
The most common earnings brackets in Grandview are $35,000 to $39,999 for men (130 | 24.2%) and $100,000+ for women (105 | 30.6%).
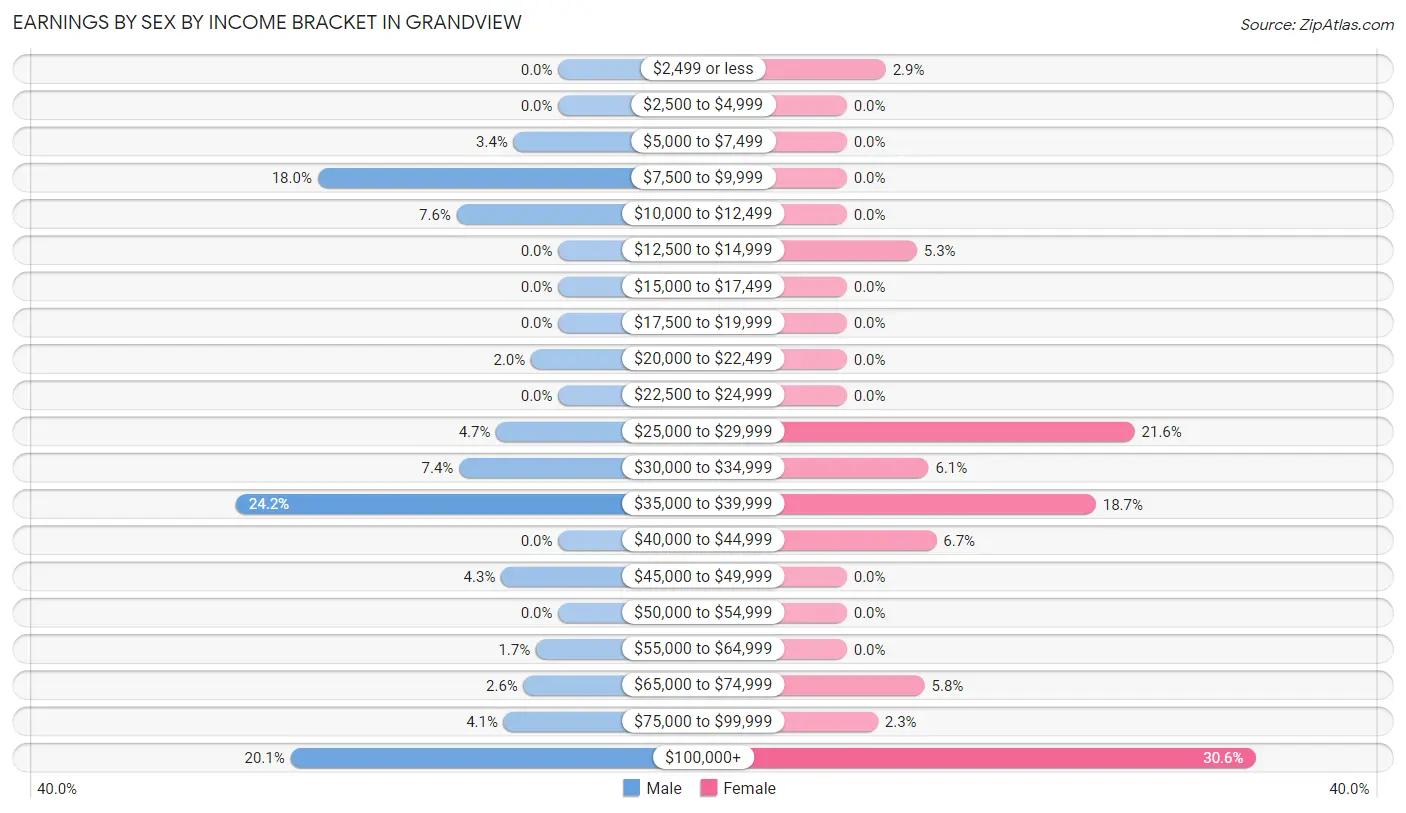
| Income | Male | Female |
| $2,499 or less | 0 (0.0%) | 10 (2.9%) |
| $2,500 to $4,999 | 0 (0.0%) | 0 (0.0%) |
| $5,000 to $7,499 | 18 (3.4%) | 0 (0.0%) |
| $7,500 to $9,999 | 97 (18.0%) | 0 (0.0%) |
| $10,000 to $12,499 | 41 (7.6%) | 0 (0.0%) |
| $12,500 to $14,999 | 0 (0.0%) | 18 (5.2%) |
| $15,000 to $17,499 | 0 (0.0%) | 0 (0.0%) |
| $17,500 to $19,999 | 0 (0.0%) | 0 (0.0%) |
| $20,000 to $22,499 | 11 (2.0%) | 0 (0.0%) |
| $22,500 to $24,999 | 0 (0.0%) | 0 (0.0%) |
| $25,000 to $29,999 | 25 (4.6%) | 74 (21.6%) |
| $30,000 to $34,999 | 40 (7.4%) | 21 (6.1%) |
| $35,000 to $39,999 | 130 (24.2%) | 64 (18.7%) |
| $40,000 to $44,999 | 0 (0.0%) | 23 (6.7%) |
| $45,000 to $49,999 | 23 (4.3%) | 0 (0.0%) |
| $50,000 to $54,999 | 0 (0.0%) | 0 (0.0%) |
| $55,000 to $64,999 | 9 (1.7%) | 0 (0.0%) |
| $65,000 to $74,999 | 14 (2.6%) | 20 (5.8%) |
| $75,000 to $99,999 | 22 (4.1%) | 8 (2.3%) |
| $100,000+ | 108 (20.1%) | 105 (30.6%) |
| Total | 538 (100.0%) | 343 (100.0%) |
Earnings by Sex by Educational Attainment in Grandview
Average earnings in Grandview are $39,163 for men and $40,217 for women, a difference of 2.6%. Men with an educational attainment of bachelor's degree enjoy the highest average annual earnings of $101,181, while those with high school diploma education earn the least with $38,158. Women with an educational attainment of college or associate's degree earn the most with the average annual earnings of $35,996, while those with college or associate's degree education have the smallest earnings of $35,996.
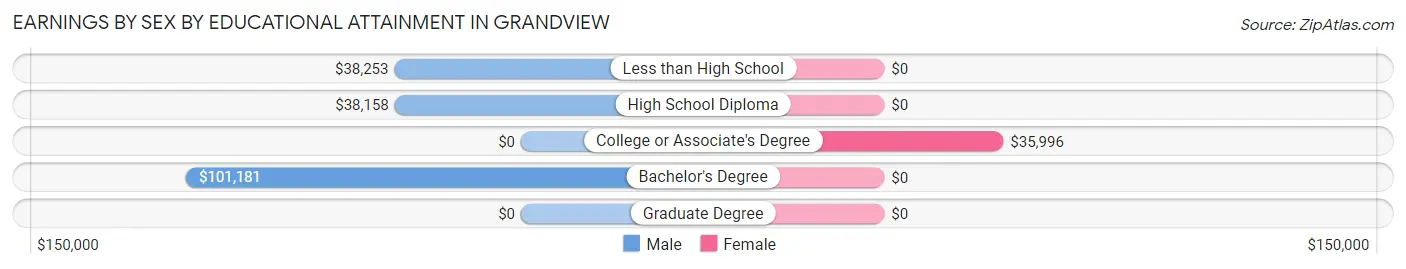
| Educational Attainment | Male Income | Female Income |
| Less than High School | $38,253 | $0 |
| High School Diploma | $38,158 | $0 |
| College or Associate's Degree | - | - |
| Bachelor's Degree | $101,181 | $0 |
| Graduate Degree | - | - |
| Total | $39,163 | $40,217 |
Family Income in Grandview
Family Income Brackets in Grandview
According to the Grandview family income data, there are 118 families falling into the $100,000 to $149,999 income range, which is the most common income bracket and makes up 39.5% of all families.
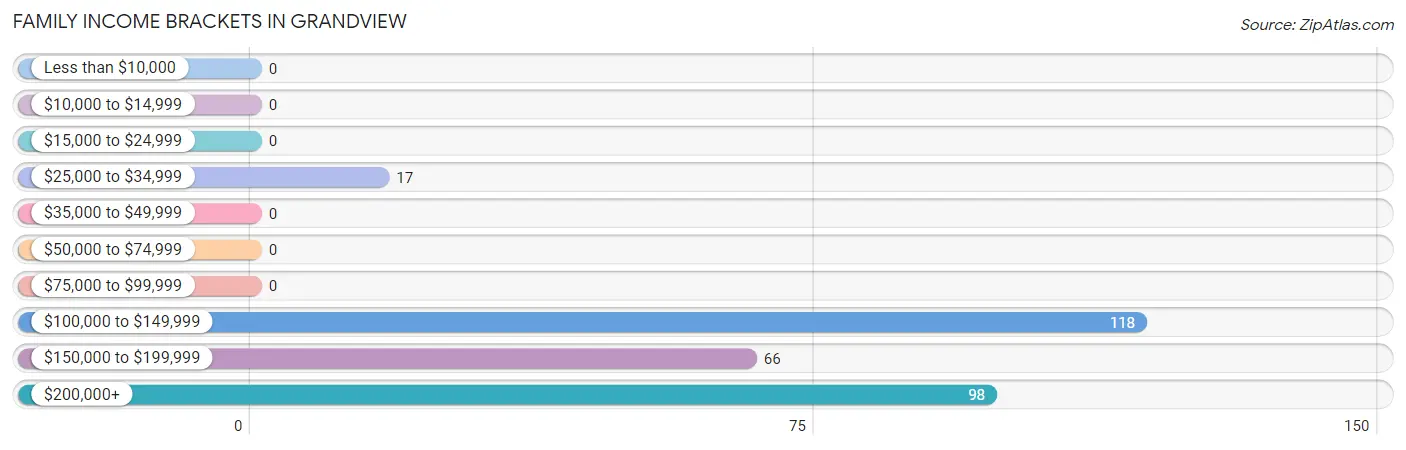
| Income Bracket | # Families | % Families |
| Less than $10,000 | 0 | 0.0% |
| $10,000 to $14,999 | 0 | 0.0% |
| $15,000 to $24,999 | 0 | 0.0% |
| $25,000 to $34,999 | 17 | 5.7% |
| $35,000 to $49,999 | 0 | 0.0% |
| $50,000 to $74,999 | 0 | 0.0% |
| $75,000 to $99,999 | 0 | 0.0% |
| $100,000 to $149,999 | 118 | 39.5% |
| $150,000 to $199,999 | 66 | 22.1% |
| $200,000+ | 98 | 32.8% |
Family Income by Famaliy Size in Grandview
3-person families (97 | 32.4%) account for the highest median family income in Grandview with $195,625 per family, while 3-person families (97 | 32.4%) have the highest median income of $65,208 per family member.
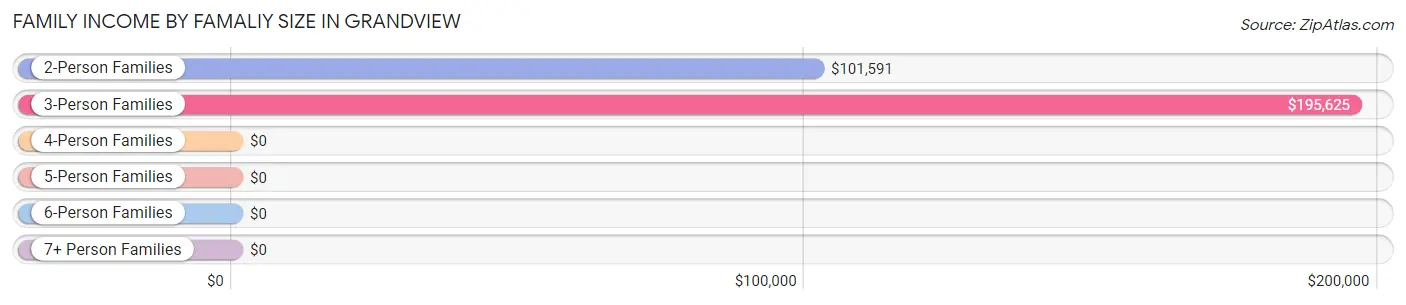
| Income Bracket | # Families | Median Income |
| 2-Person Families | 62 (20.7%) | $101,591 |
| 3-Person Families | 97 (32.4%) | $195,625 |
| 4-Person Families | 43 (14.4%) | $0 |
| 5-Person Families | 33 (11.0%) | $0 |
| 6-Person Families | 18 (6.0%) | $0 |
| 7+ Person Families | 46 (15.4%) | $0 |
| Total | 299 (100.0%) | $190,057 |
Family Income by Number of Earners in Grandview
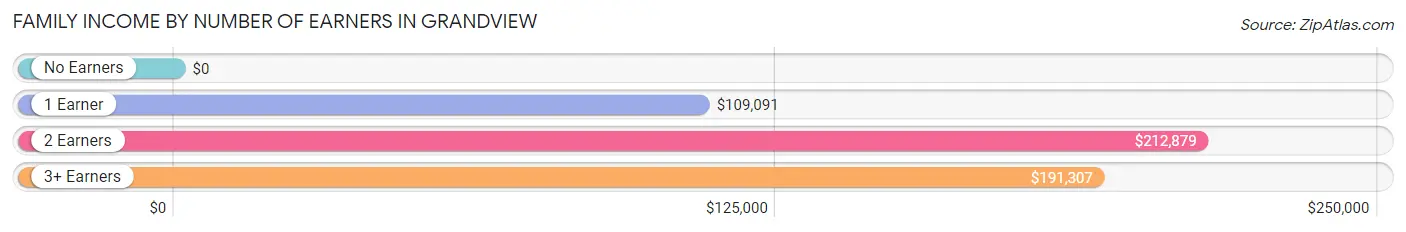
| Number of Earners | # Families | Median Income |
| No Earners | 0 (0.0%) | $0 |
| 1 Earner | 92 (30.8%) | $109,091 |
| 2 Earners | 92 (30.8%) | $212,879 |
| 3+ Earners | 115 (38.5%) | $191,307 |
| Total | 299 (100.0%) | $190,057 |
Household Income in Grandview
Household Income Brackets in Grandview
With 118 households falling in the category, the $100,000 to $149,999 income range is the most frequent in Grandview, accounting for 30.3% of all households.
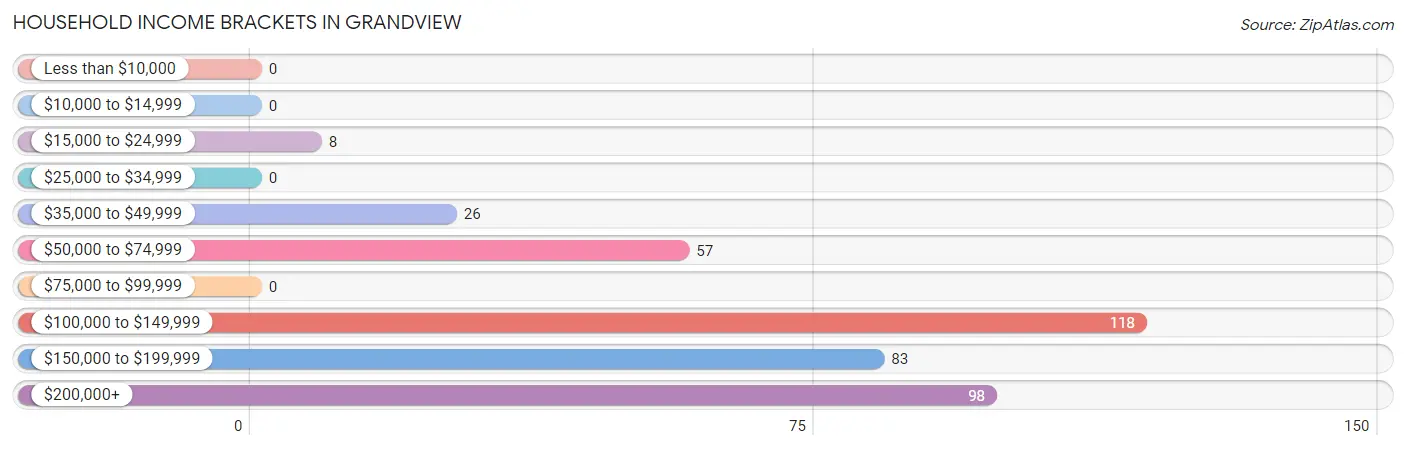
| Income Bracket | # Households | % Households |
| Less than $10,000 | 0 | 0.0% |
| $10,000 to $14,999 | 0 | 0.0% |
| $15,000 to $24,999 | 8 | 2.1% |
| $25,000 to $34,999 | 0 | 0.0% |
| $35,000 to $49,999 | 26 | 6.7% |
| $50,000 to $74,999 | 57 | 14.6% |
| $75,000 to $99,999 | 0 | 0.0% |
| $100,000 to $149,999 | 118 | 30.3% |
| $150,000 to $199,999 | 83 | 21.3% |
| $200,000+ | 98 | 25.1% |
Household Income by Householder Age in Grandview
The median household income in Grandview is $135,556, with the highest median household income of $213,371 found in the 45 to 64 years age bracket for the primary householder. A total of 137 households (35.1%) fall into this category. Meanwhile, the 15 to 24 years age bracket for the primary householder has the lowest median household income of $0, with 17 households (4.4%) in this group.
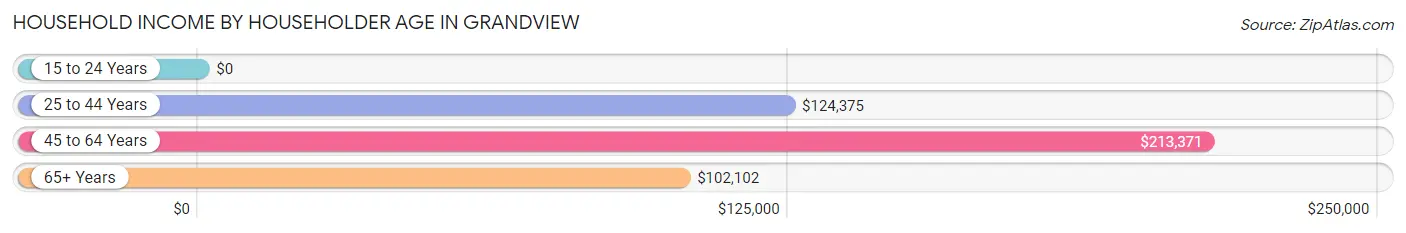
| Income Bracket | # Households | Median Income |
| 15 to 24 Years | 17 (4.4%) | $0 |
| 25 to 44 Years | 183 (46.9%) | $124,375 |
| 45 to 64 Years | 137 (35.1%) | $213,371 |
| 65+ Years | 53 (13.6%) | $102,102 |
| Total | 390 (100.0%) | $135,556 |
Poverty in Grandview
Income Below Poverty by Sex and Age in Grandview
| Age Bracket | Male | Female |
| Under 5 Years | 0 (0.0%) | 0 (0.0%) |
| 5 Years | 0 (0.0%) | 0 (0.0%) |
| 6 to 11 Years | 0 (0.0%) | 0 (0.0%) |
| 12 to 14 Years | 0 (0.0%) | 0 (0.0%) |
| 15 Years | 0 (0.0%) | 0 (0.0%) |
| 16 and 17 Years | 0 (0.0%) | 0 (0.0%) |
| 18 to 24 Years | 0 (0.0%) | 0 (0.0%) |
| 25 to 34 Years | 0 (0.0%) | 0 (0.0%) |
| 35 to 44 Years | 0 (0.0%) | 0 (0.0%) |
| 45 to 54 Years | 0 (0.0%) | 0 (0.0%) |
| 55 to 64 Years | 0 (0.0%) | 0 (0.0%) |
| 65 to 74 Years | 0 (0.0%) | 0 (0.0%) |
| 75 Years and over | 0 (0.0%) | 0 (0.0%) |
| Total | 0 (0.0%) | 0 (0.0%) |
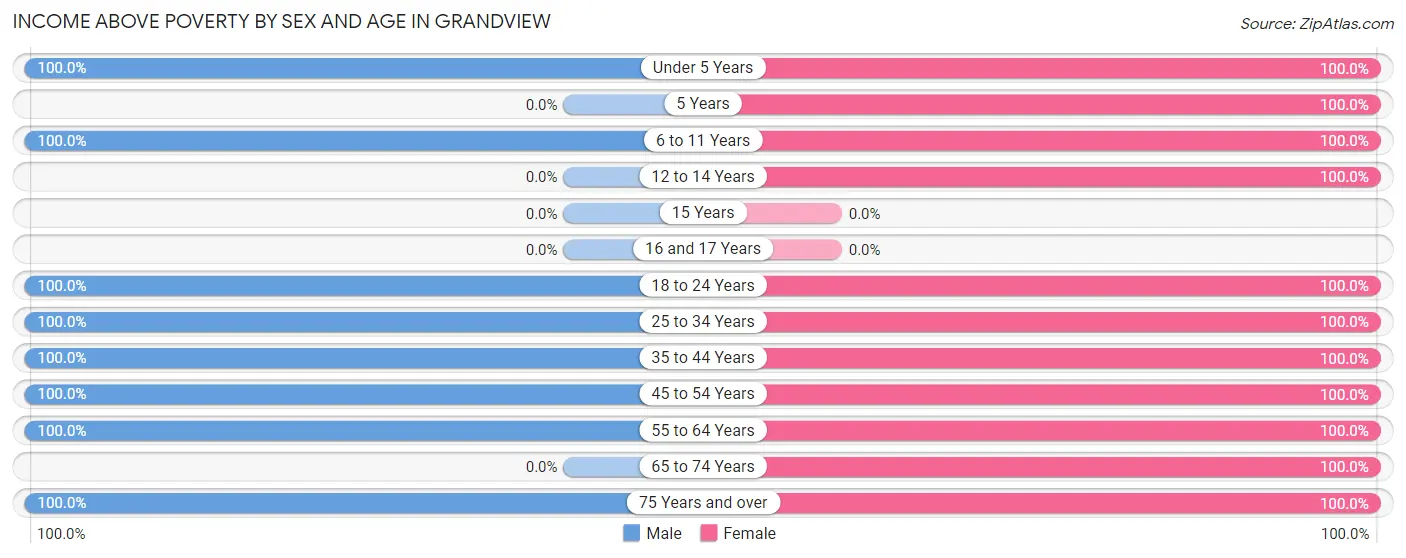
Income Above Poverty by Sex and Age in Grandview
According to the poverty statistics in Grandview, males aged under 5 years and females aged under 5 years are the age groups that are most secure financially, with 100.0% of males and 100.0% of females in these age groups living above the poverty line.
| Age Bracket | Male | Female |
| Under 5 Years | 32 (100.0%) | 106 (100.0%) |
| 5 Years | 0 (0.0%) | 18 (100.0%) |
| 6 to 11 Years | 49 (100.0%) | 60 (100.0%) |
| 12 to 14 Years | 0 (0.0%) | 31 (100.0%) |
| 15 Years | 0 (0.0%) | 0 (0.0%) |
| 16 and 17 Years | 0 (0.0%) | 0 (0.0%) |
| 18 to 24 Years | 99 (100.0%) | 76 (100.0%) |
| 25 to 34 Years | 117 (100.0%) | 44 (100.0%) |
| 35 to 44 Years | 152 (100.0%) | 208 (100.0%) |
| 45 to 54 Years | 114 (100.0%) | 51 (100.0%) |
| 55 to 64 Years | 78 (100.0%) | 42 (100.0%) |
| 65 to 74 Years | 0 (0.0%) | 30 (100.0%) |
| 75 Years and over | 22 (100.0%) | 22 (100.0%) |
| Total | 663 (100.0%) | 688 (100.0%) |
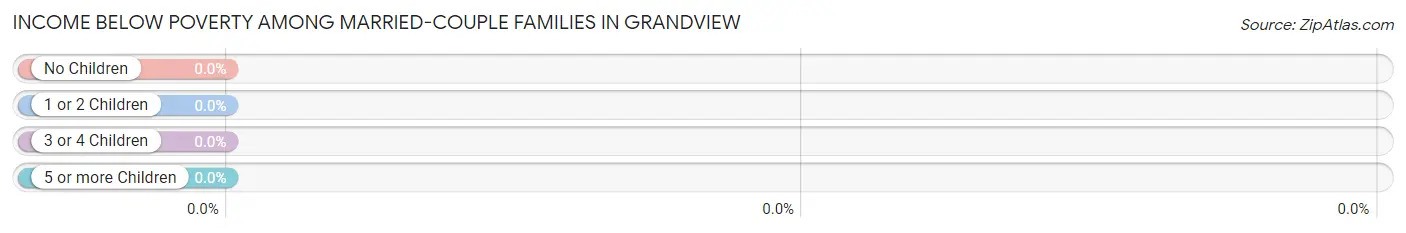
Income Below Poverty Among Married-Couple Families in Grandview
| Children | Above Poverty | Below Poverty |
| No Children | 101 (100.0%) | 0 (0.0%) |
| 1 or 2 Children | 108 (100.0%) | 0 (0.0%) |
| 3 or 4 Children | 51 (100.0%) | 0 (0.0%) |
| 5 or more Children | 0 (0.0%) | 0 (0.0%) |
| Total | 260 (100.0%) | 0 (0.0%) |
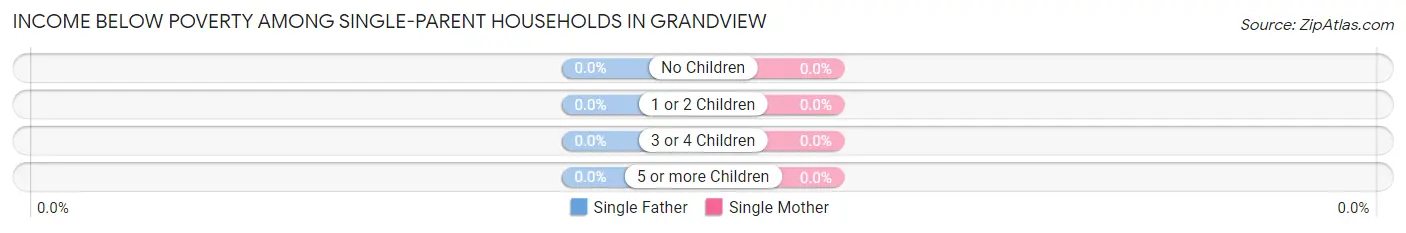
Income Below Poverty Among Single-Parent Households in Grandview
| Children | Single Father | Single Mother |
| No Children | 0 (0.0%) | 0 (0.0%) |
| 1 or 2 Children | 0 (0.0%) | 0 (0.0%) |
| 3 or 4 Children | 0 (0.0%) | 0 (0.0%) |
| 5 or more Children | 0 (0.0%) | 0 (0.0%) |
| Total | 0 (0.0%) | 0 (0.0%) |
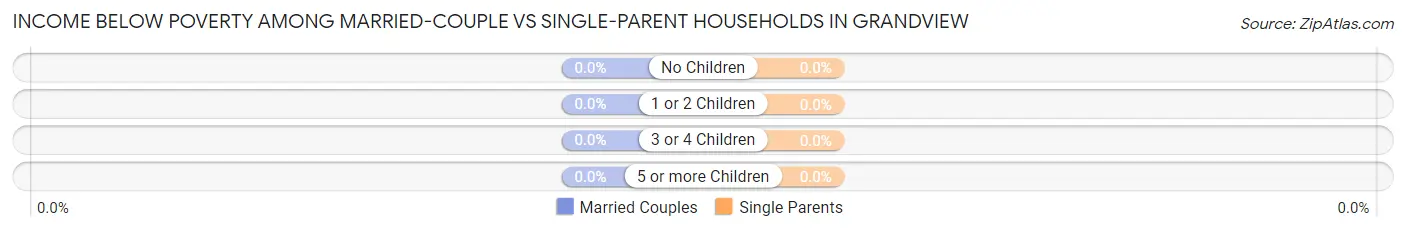
Income Below Poverty Among Married-Couple vs Single-Parent Households in Grandview
| Children | Married-Couple Families | Single-Parent Households |
| No Children | 0 (0.0%) | 0 (0.0%) |
| 1 or 2 Children | 0 (0.0%) | 0 (0.0%) |
| 3 or 4 Children | 0 (0.0%) | 0 (0.0%) |
| 5 or more Children | 0 (0.0%) | 0 (0.0%) |
| Total | 0 (0.0%) | 0 (0.0%) |
Employment Characteristics in Grandview
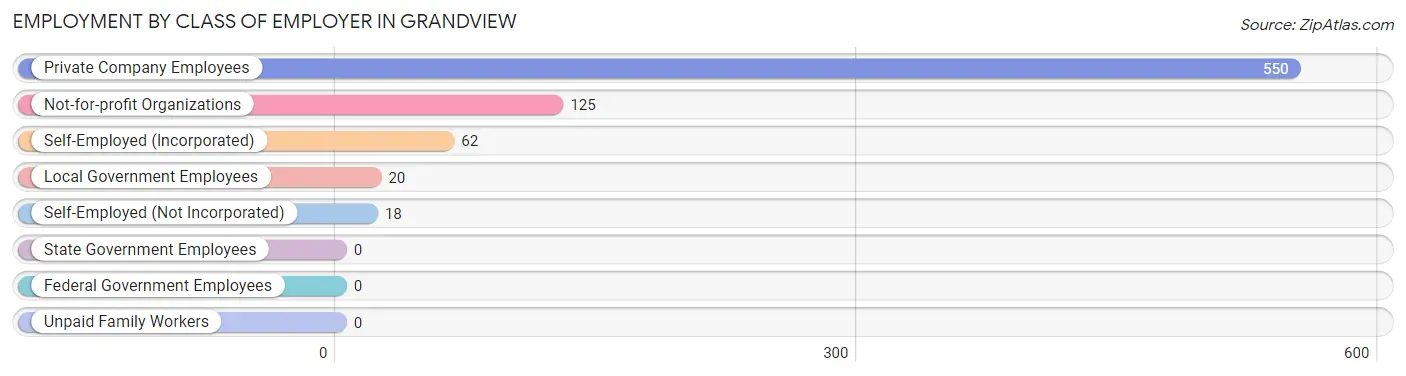
Employment by Class of Employer in Grandview
Among the 775 employed individuals in Grandview, private company employees (550 | 71.0%), not-for-profit organizations (125 | 16.1%), and self-employed (incorporated) (62 | 8.0%) make up the most common classes of employment.
| Employer Class | # Employees | % Employees |
| Private Company Employees | 550 | 71.0% |
| Self-Employed (Incorporated) | 62 | 8.0% |
| Self-Employed (Not Incorporated) | 18 | 2.3% |
| Not-for-profit Organizations | 125 | 16.1% |
| Local Government Employees | 20 | 2.6% |
| State Government Employees | 0 | 0.0% |
| Federal Government Employees | 0 | 0.0% |
| Unpaid Family Workers | 0 | 0.0% |
| Total | 775 | 100.0% |
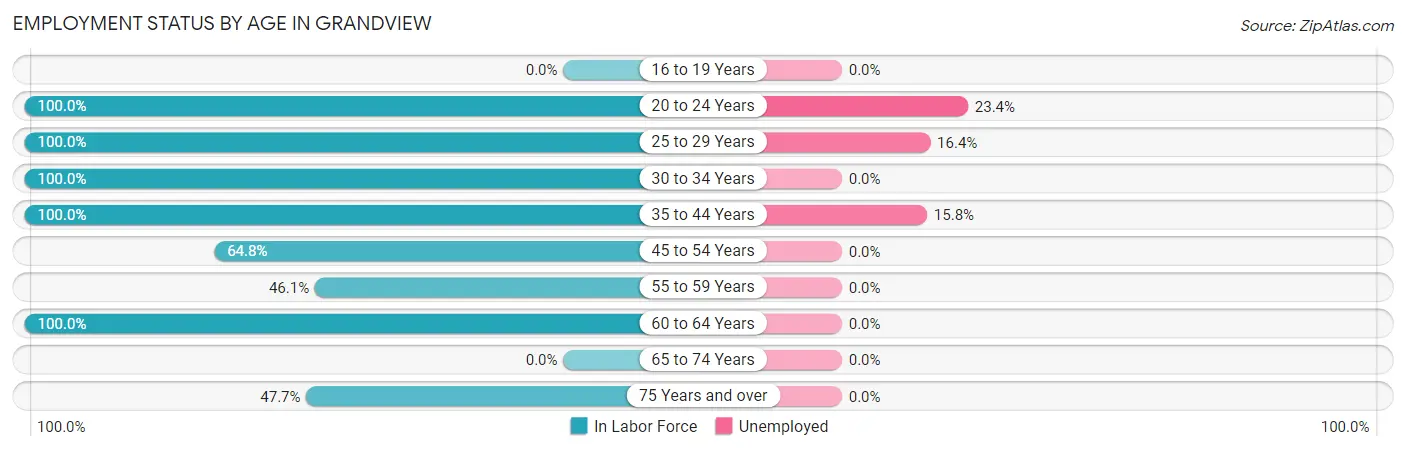
Employment Status by Age in Grandview
According to the labor force statistics for Grandview, out of the total population over 16 years of age (1,055), 84.9% or 896 individuals are in the labor force, with 13.5% or 121 of them unemployed. The age group with the highest labor force participation rate is 20 to 24 years, with 100.0% or 175 individuals in the labor force. Within the labor force, the 20 to 24 years age range has the highest percentage of unemployed individuals, with 23.4% or 41 of them being unemployed.
| Age Bracket | In Labor Force | Unemployed |
| 16 to 19 Years | 0 (0.0%) | 0 (0.0%) |
| 20 to 24 Years | 175 (100.0%) | 41 (23.4%) |
| 25 to 29 Years | 140 (100.0%) | 23 (16.4%) |
| 30 to 34 Years | 21 (100.0%) | 0 (0.0%) |
| 35 to 44 Years | 360 (100.0%) | 57 (15.8%) |
| 45 to 54 Years | 107 (64.8%) | 0 (0.0%) |
| 55 to 59 Years | 41 (46.1%) | 0 (0.0%) |
| 60 to 64 Years | 31 (100.0%) | 0 (0.0%) |
| 65 to 74 Years | 0 (0.0%) | 0 (0.0%) |
| 75 Years and over | 21 (47.7%) | 0 (0.0%) |
| Total | 896 (84.9%) | 121 (13.5%) |
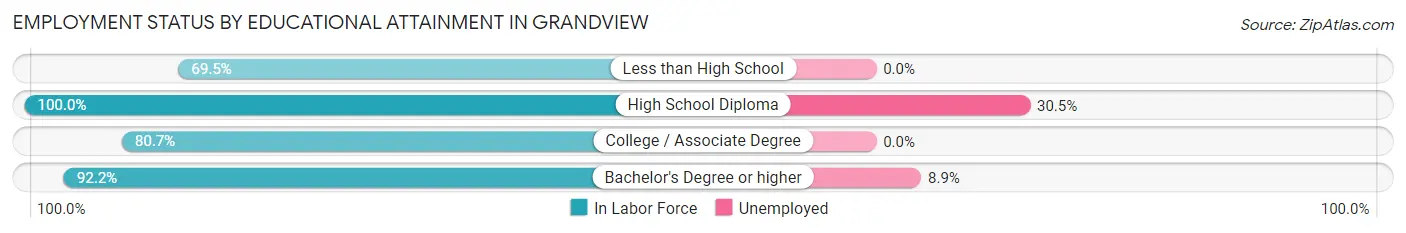
Employment Status by Educational Attainment in Grandview
According to labor force statistics for Grandview, 86.8% of individuals (700) out of the total population between 25 and 64 years of age (806) are in the labor force, with 11.4% or 80 of them being unemployed. The group with the highest labor force participation rate are those with the educational attainment of high school diploma, with 100.0% or 187 individuals in the labor force. Within the labor force, individuals with high school diploma education have the highest percentage of unemployment, with 30.5% or 57 of them being unemployed.
| Educational Attainment | In Labor Force | Unemployed |
| Less than High School | 116 (69.5%) | 0 (0.0%) |
| High School Diploma | 187 (100.0%) | 57 (30.5%) |
| College / Associate Degree | 138 (80.7%) | 0 (0.0%) |
| Bachelor's Degree or higher | 259 (92.2%) | 25 (8.9%) |
| Total | 700 (86.8%) | 92 (11.4%) |
Employment Occupations by Sex in Grandview
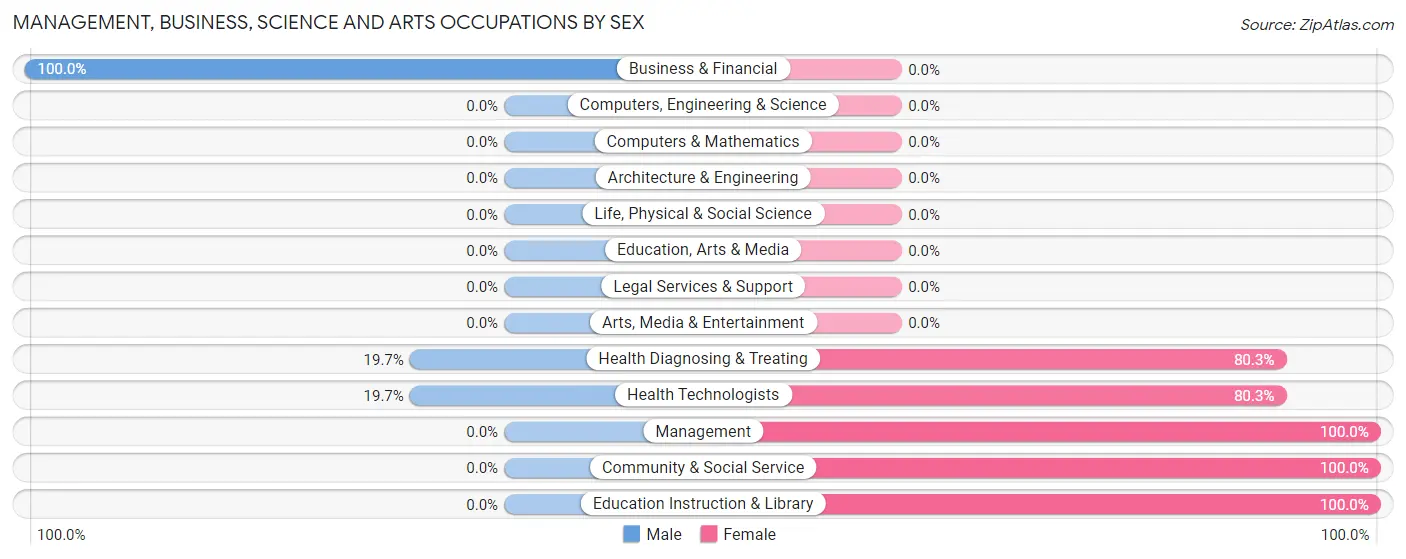
Management, Business, Science and Arts Occupations
The most common Management, Business, Science and Arts occupations in Grandview are Health Diagnosing & Treating (188 | 24.3%), Health Technologists (188 | 24.3%), Management (28 | 3.6%), Business & Financial (18 | 2.3%), and Community & Social Service (10 | 1.3%).
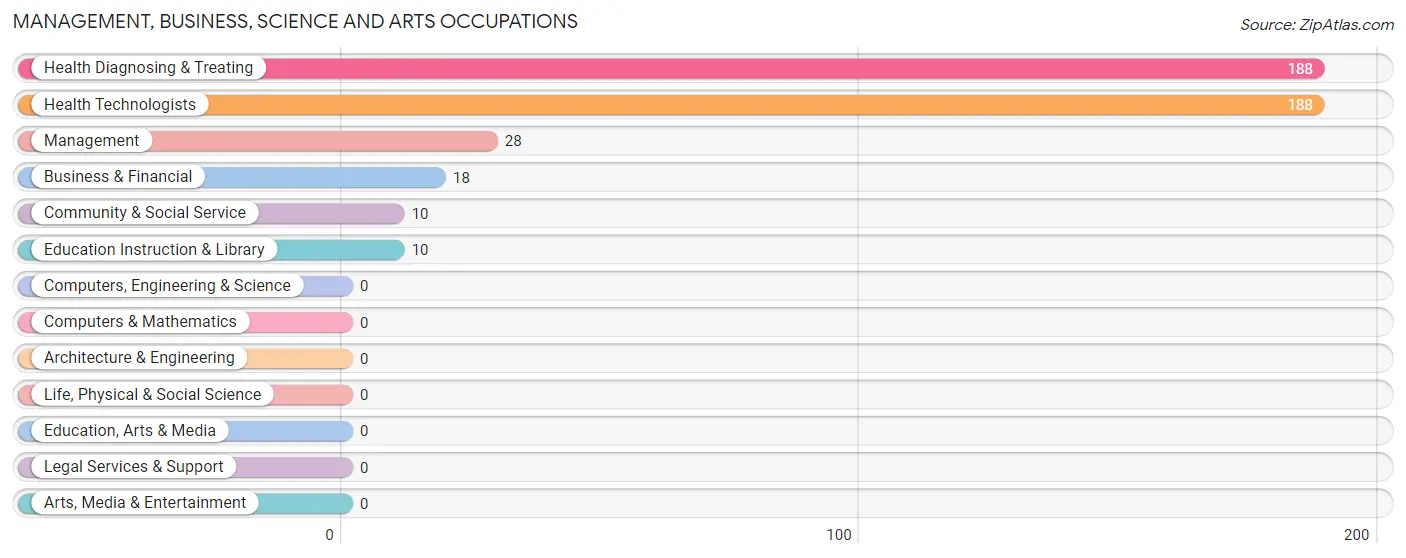
Management, Business, Science and Arts Occupations by Sex
Within the Management, Business, Science and Arts occupations in Grandview, the most male-oriented occupations are Business & Financial (100.0%), Health Diagnosing & Treating (19.7%), and Health Technologists (19.7%), while the most female-oriented occupations are Management (100.0%), Community & Social Service (100.0%), and Education Instruction & Library (100.0%).
| Occupation | Male | Female |
| Management | 0 (0.0%) | 28 (100.0%) |
| Business & Financial | 18 (100.0%) | 0 (0.0%) |
| Computers, Engineering & Science | 0 (0.0%) | 0 (0.0%) |
| Computers & Mathematics | 0 (0.0%) | 0 (0.0%) |
| Architecture & Engineering | 0 (0.0%) | 0 (0.0%) |
| Life, Physical & Social Science | 0 (0.0%) | 0 (0.0%) |
| Community & Social Service | 0 (0.0%) | 10 (100.0%) |
| Education, Arts & Media | 0 (0.0%) | 0 (0.0%) |
| Legal Services & Support | 0 (0.0%) | 0 (0.0%) |
| Education Instruction & Library | 0 (0.0%) | 10 (100.0%) |
| Arts, Media & Entertainment | 0 (0.0%) | 0 (0.0%) |
| Health Diagnosing & Treating | 37 (19.7%) | 151 (80.3%) |
| Health Technologists | 37 (19.7%) | 151 (80.3%) |
| Total (Category) | 55 (22.5%) | 189 (77.5%) |
| Total (Overall) | 432 (55.7%) | 343 (44.3%) |
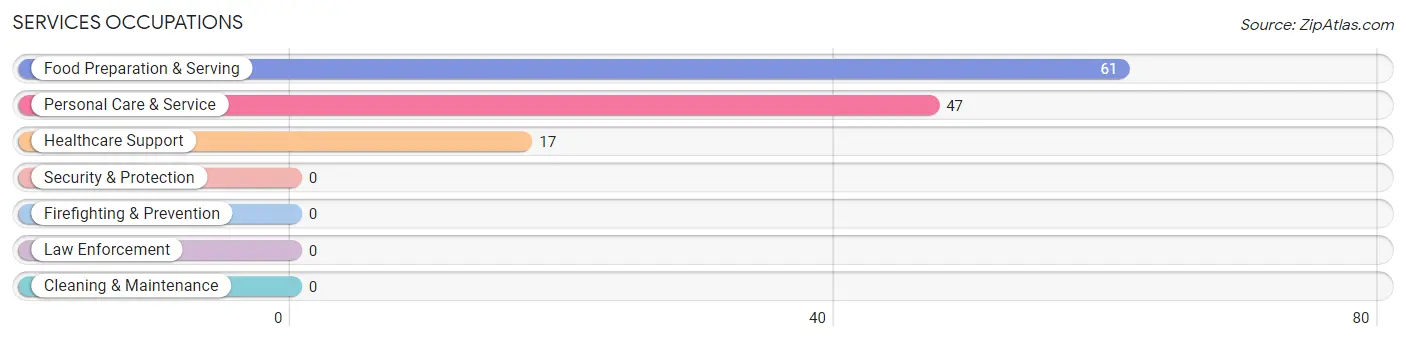
Services Occupations
The most common Services occupations in Grandview are Food Preparation & Serving (61 | 7.9%), Personal Care & Service (47 | 6.1%), and Healthcare Support (17 | 2.2%).
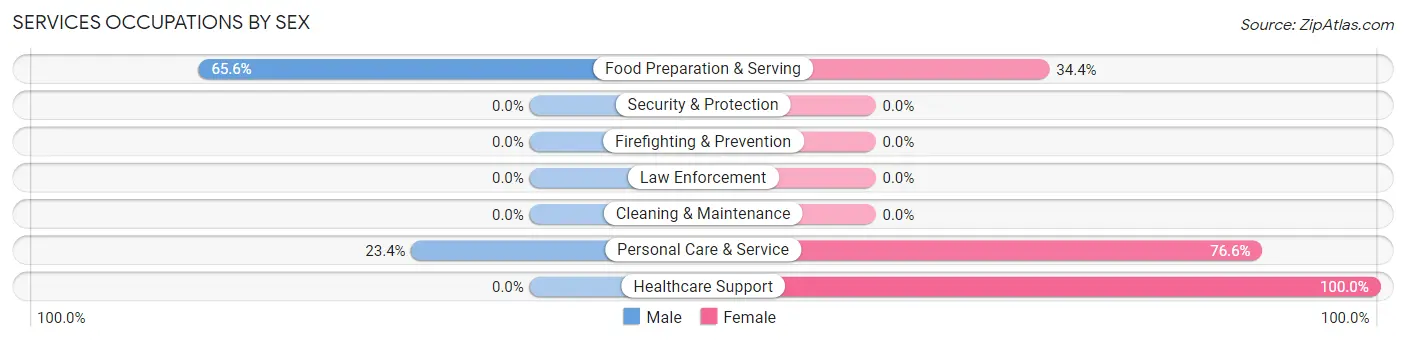
Services Occupations by Sex
Within the Services occupations in Grandview, the most male-oriented occupations are Food Preparation & Serving (65.6%), and Personal Care & Service (23.4%), while the most female-oriented occupations are Healthcare Support (100.0%), Personal Care & Service (76.6%), and Food Preparation & Serving (34.4%).
| Occupation | Male | Female |
| Healthcare Support | 0 (0.0%) | 17 (100.0%) |
| Security & Protection | 0 (0.0%) | 0 (0.0%) |
| Firefighting & Prevention | 0 (0.0%) | 0 (0.0%) |
| Law Enforcement | 0 (0.0%) | 0 (0.0%) |
| Food Preparation & Serving | 40 (65.6%) | 21 (34.4%) |
| Cleaning & Maintenance | 0 (0.0%) | 0 (0.0%) |
| Personal Care & Service | 11 (23.4%) | 36 (76.6%) |
| Total (Category) | 51 (40.8%) | 74 (59.2%) |
| Total (Overall) | 432 (55.7%) | 343 (44.3%) |
Sales and Office Occupations
The most common Sales and Office occupations in Grandview are , and Sales & Related (99 | 12.8%).

Sales and Office Occupations by Sex

| Occupation | Male | Female |
| Sales & Related | 76 (76.8%) | 23 (23.2%) |
| Office & Administration | 0 (0.0%) | 0 (0.0%) |
| Total (Category) | 76 (76.8%) | 23 (23.2%) |
| Total (Overall) | 432 (55.7%) | 343 (44.3%) |
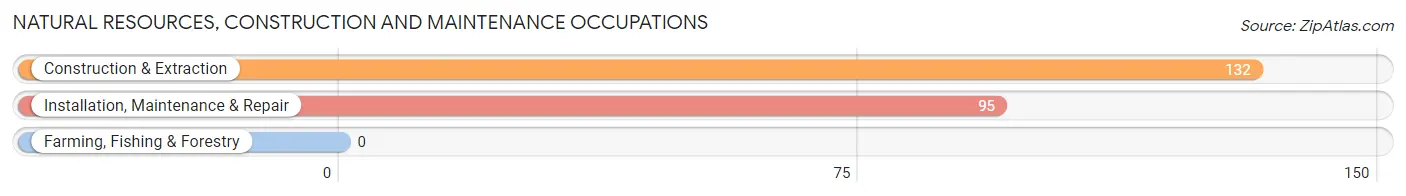
Natural Resources, Construction and Maintenance Occupations
The most common Natural Resources, Construction and Maintenance occupations in Grandview are Construction & Extraction (132 | 17.0%), and Installation, Maintenance & Repair (95 | 12.3%).
Natural Resources, Construction and Maintenance Occupations by Sex

| Occupation | Male | Female |
| Farming, Fishing & Forestry | 0 (0.0%) | 0 (0.0%) |
| Construction & Extraction | 132 (100.0%) | 0 (0.0%) |
| Installation, Maintenance & Repair | 95 (100.0%) | 0 (0.0%) |
| Total (Category) | 227 (100.0%) | 0 (0.0%) |
| Total (Overall) | 432 (55.7%) | 343 (44.3%) |
Production, Transportation and Moving Occupations
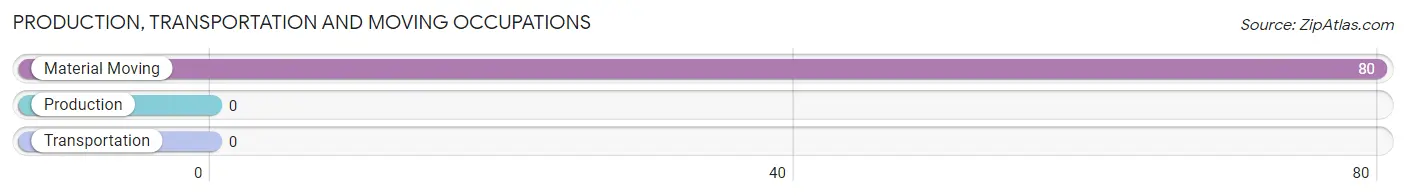
The most common Production, Transportation and Moving occupations in Grandview are , and Material Moving (80 | 10.3%).
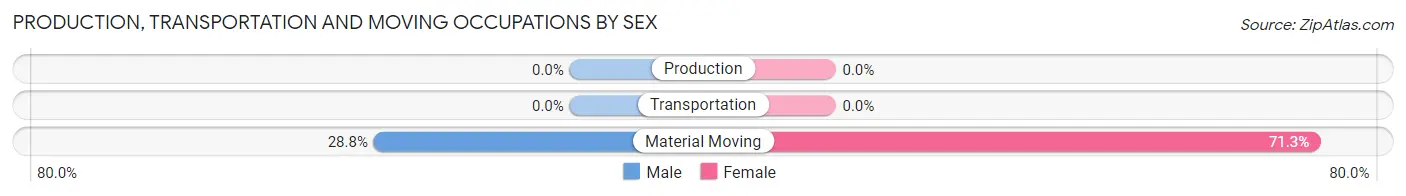
Production, Transportation and Moving Occupations by Sex
| Occupation | Male | Female |
| Production | 0 (0.0%) | 0 (0.0%) |
| Transportation | 0 (0.0%) | 0 (0.0%) |
| Material Moving | 23 (28.7%) | 57 (71.3%) |
| Total (Category) | 23 (28.7%) | 57 (71.3%) |
| Total (Overall) | 432 (55.7%) | 343 (44.3%) |
Employment Industries by Sex in Grandview
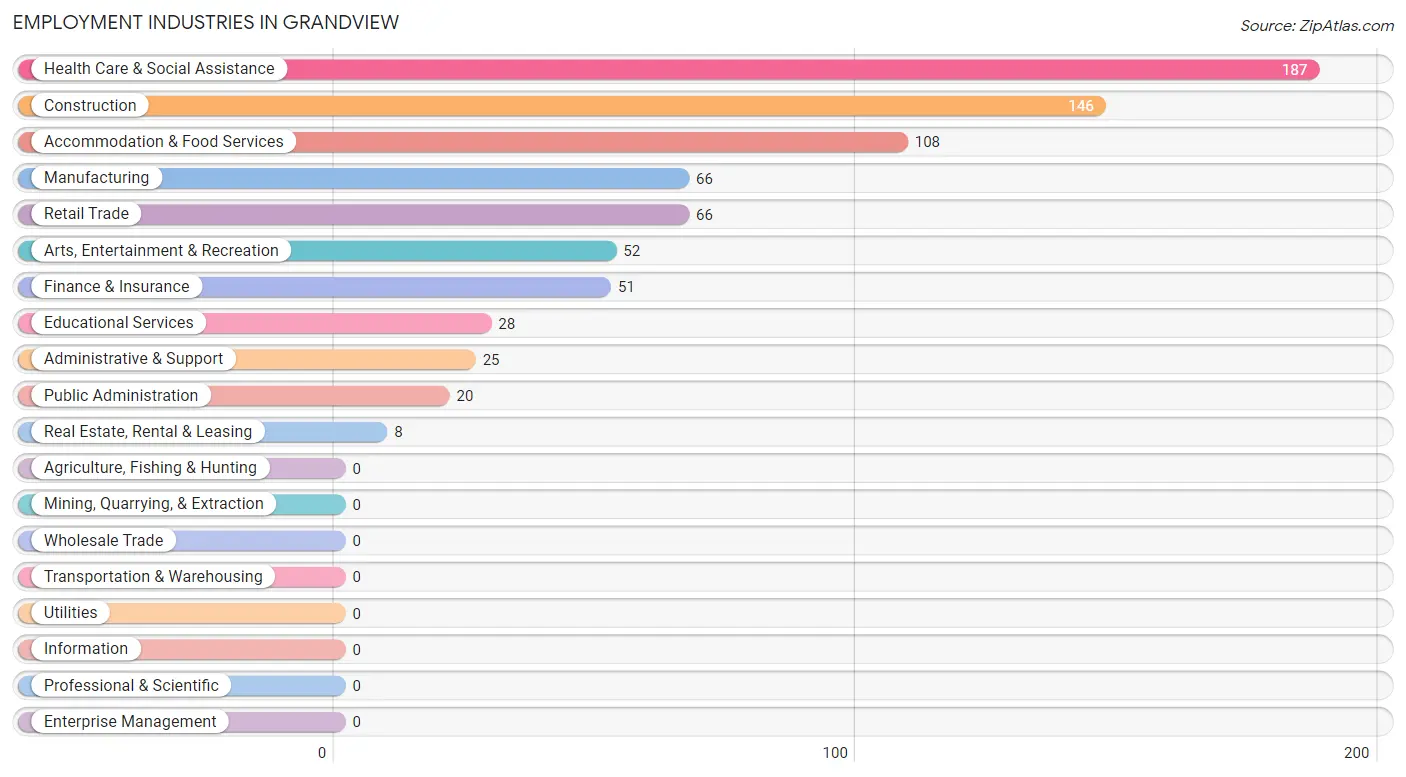
Employment Industries in Grandview
The major employment industries in Grandview include Health Care & Social Assistance (187 | 24.1%), Construction (146 | 18.8%), Accommodation & Food Services (108 | 13.9%), Manufacturing (66 | 8.5%), and Retail Trade (66 | 8.5%).
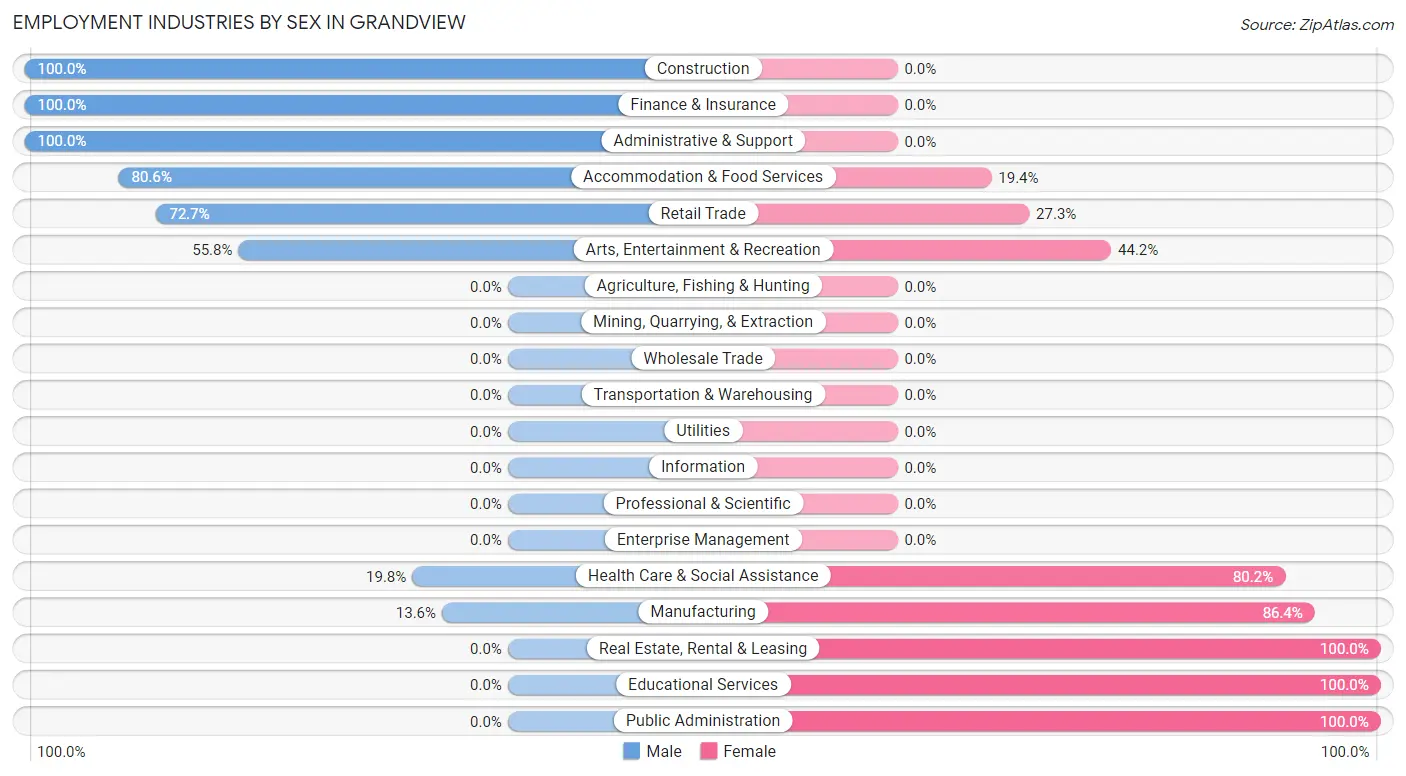
Employment Industries by Sex in Grandview
The Grandview industries that see more men than women are Construction (100.0%), Finance & Insurance (100.0%), and Administrative & Support (100.0%), whereas the industries that tend to have a higher number of women are Real Estate, Rental & Leasing (100.0%), Educational Services (100.0%), and Public Administration (100.0%).
| Industry | Male | Female |
| Agriculture, Fishing & Hunting | 0 (0.0%) | 0 (0.0%) |
| Mining, Quarrying, & Extraction | 0 (0.0%) | 0 (0.0%) |
| Construction | 146 (100.0%) | 0 (0.0%) |
| Manufacturing | 9 (13.6%) | 57 (86.4%) |
| Wholesale Trade | 0 (0.0%) | 0 (0.0%) |
| Retail Trade | 48 (72.7%) | 18 (27.3%) |
| Transportation & Warehousing | 0 (0.0%) | 0 (0.0%) |
| Utilities | 0 (0.0%) | 0 (0.0%) |
| Information | 0 (0.0%) | 0 (0.0%) |
| Finance & Insurance | 51 (100.0%) | 0 (0.0%) |
| Real Estate, Rental & Leasing | 0 (0.0%) | 8 (100.0%) |
| Professional & Scientific | 0 (0.0%) | 0 (0.0%) |
| Enterprise Management | 0 (0.0%) | 0 (0.0%) |
| Administrative & Support | 25 (100.0%) | 0 (0.0%) |
| Educational Services | 0 (0.0%) | 28 (100.0%) |
| Health Care & Social Assistance | 37 (19.8%) | 150 (80.2%) |
| Arts, Entertainment & Recreation | 29 (55.8%) | 23 (44.2%) |
| Accommodation & Food Services | 87 (80.6%) | 21 (19.4%) |
| Public Administration | 0 (0.0%) | 20 (100.0%) |
| Total | 432 (55.7%) | 343 (44.3%) |
Education in Grandview
School Enrollment in Grandview
The most common levels of schooling among the 259 students in Grandview are elementary school (109 | 42.1%), nursery / preschool (66 | 25.5%), and college / undergraduate (35 | 13.5%).
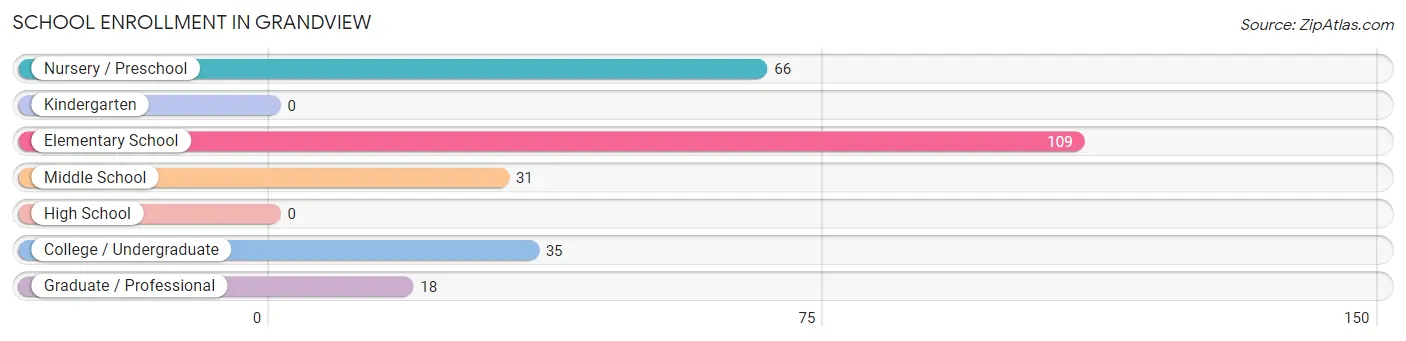
| School Level | # Students | % Students |
| Nursery / Preschool | 66 | 25.5% |
| Kindergarten | 0 | 0.0% |
| Elementary School | 109 | 42.1% |
| Middle School | 31 | 12.0% |
| High School | 0 | 0.0% |
| College / Undergraduate | 35 | 13.5% |
| Graduate / Professional | 18 | 7.0% |
| Total | 259 | 100.0% |
School Enrollment by Age by Funding Source in Grandview
Out of a total of 259 students who are enrolled in schools in Grandview, 173 (66.8%) attend a private institution, while the remaining 86 (33.2%) are enrolled in public schools. The age group of 10 to 14 year olds has the highest likelihood of being enrolled in private schools, with 62 (100.0% in the age bracket) enrolled. Conversely, the age group of 3 to 4 year olds has the lowest likelihood of being enrolled in a private school, with 33 (68.8% in the age bracket) attending a public institution.
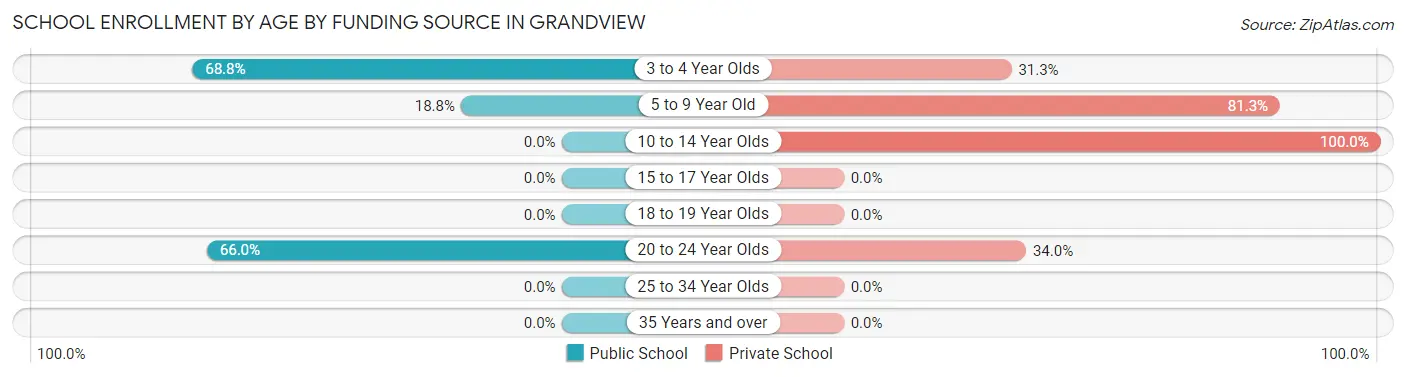
| Age Bracket | Public School | Private School |
| 3 to 4 Year Olds | 33 (68.8%) | 15 (31.2%) |
| 5 to 9 Year Old | 18 (18.8%) | 78 (81.2%) |
| 10 to 14 Year Olds | 0 (0.0%) | 62 (100.0%) |
| 15 to 17 Year Olds | 0 (0.0%) | 0 (0.0%) |
| 18 to 19 Year Olds | 0 (0.0%) | 0 (0.0%) |
| 20 to 24 Year Olds | 35 (66.0%) | 18 (34.0%) |
| 25 to 34 Year Olds | 0 (0.0%) | 0 (0.0%) |
| 35 Years and over | 0 (0.0%) | 0 (0.0%) |
| Total | 86 (33.2%) | 173 (66.8%) |
Educational Attainment by Field of Study in Grandview
Science & technology (116 | 35.3%), business (97 | 29.5%), psychology (44 | 13.4%), bio, nature & agricultural (41 | 12.5%), and communications (20 | 6.1%) are the most common fields of study among 329 individuals in Grandview who have obtained a bachelor's degree or higher.
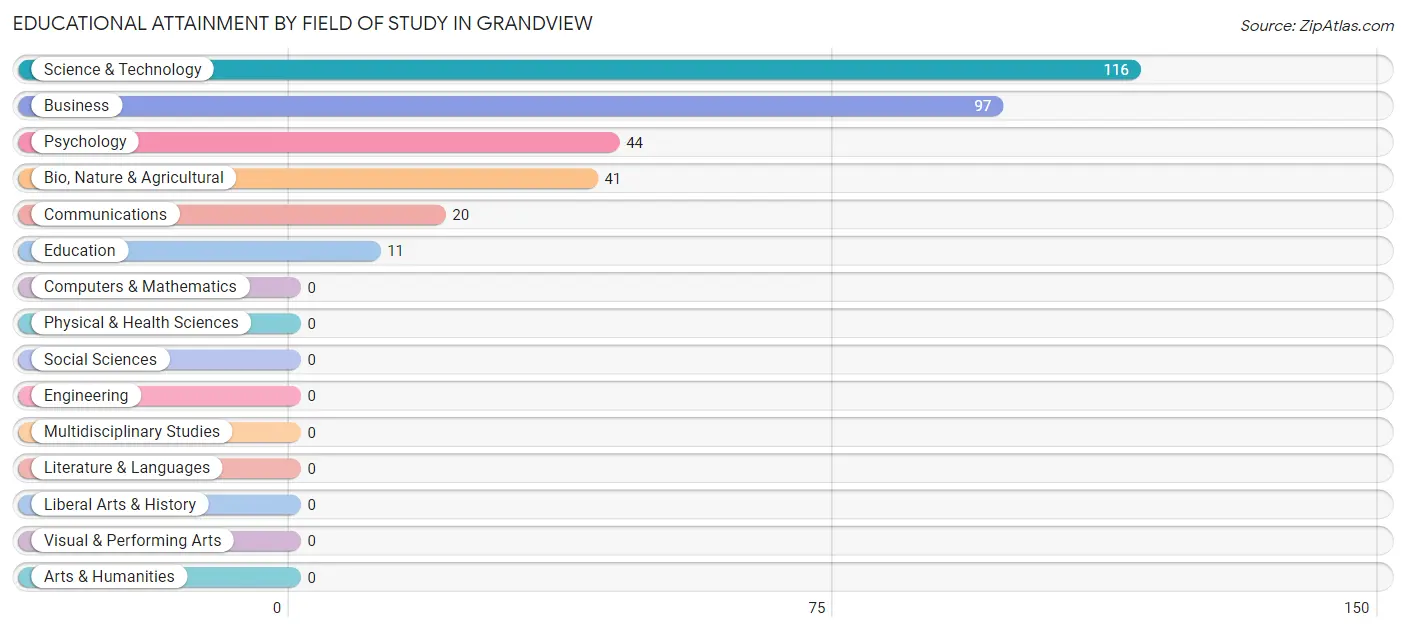
| Field of Study | # Graduates | % Graduates |
| Computers & Mathematics | 0 | 0.0% |
| Bio, Nature & Agricultural | 41 | 12.5% |
| Physical & Health Sciences | 0 | 0.0% |
| Psychology | 44 | 13.4% |
| Social Sciences | 0 | 0.0% |
| Engineering | 0 | 0.0% |
| Multidisciplinary Studies | 0 | 0.0% |
| Science & Technology | 116 | 35.3% |
| Business | 97 | 29.5% |
| Education | 11 | 3.3% |
| Literature & Languages | 0 | 0.0% |
| Liberal Arts & History | 0 | 0.0% |
| Visual & Performing Arts | 0 | 0.0% |
| Communications | 20 | 6.1% |
| Arts & Humanities | 0 | 0.0% |
| Total | 329 | 100.0% |
Transportation & Commute in Grandview
Vehicle Availability by Sex in Grandview
The most prevalent vehicle ownership categories in Grandview are males with 5 or more vehicles (247, accounting for 57.2%) and females with 5 or more vehicles (95, making up 72.0%).
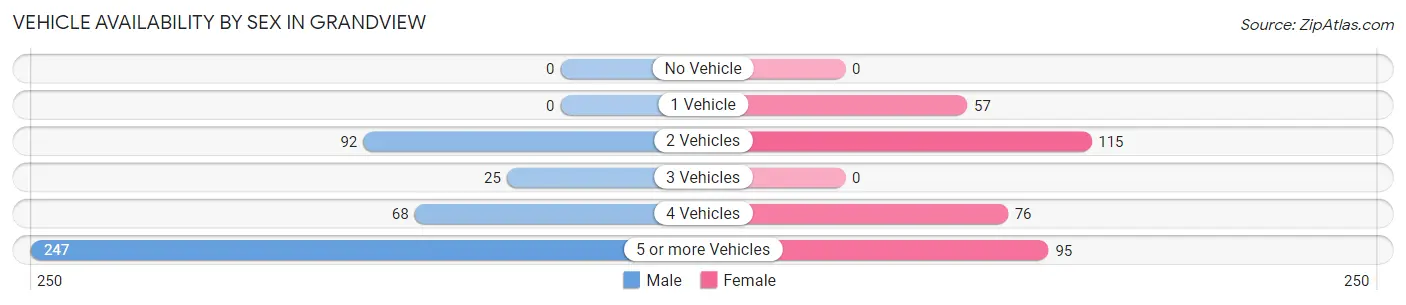
| Vehicles Available | Male | Female |
| No Vehicle | 0 (0.0%) | 0 (0.0%) |
| 1 Vehicle | 0 (0.0%) | 57 (16.6%) |
| 2 Vehicles | 92 (21.3%) | 115 (33.5%) |
| 3 Vehicles | 25 (5.8%) | 0 (0.0%) |
| 4 Vehicles | 68 (15.7%) | 76 (22.2%) |
| 5 or more Vehicles | 247 (57.2%) | 95 (27.7%) |
| Total | 432 (100.0%) | 343 (100.0%) |
Commute Time in Grandview
The most frequently occuring commute durations in Grandview are 30 to 34 minutes (213 commuters, 30.3%), 35 to 39 minutes (126 commuters, 17.9%), and 15 to 19 minutes (111 commuters, 15.8%).
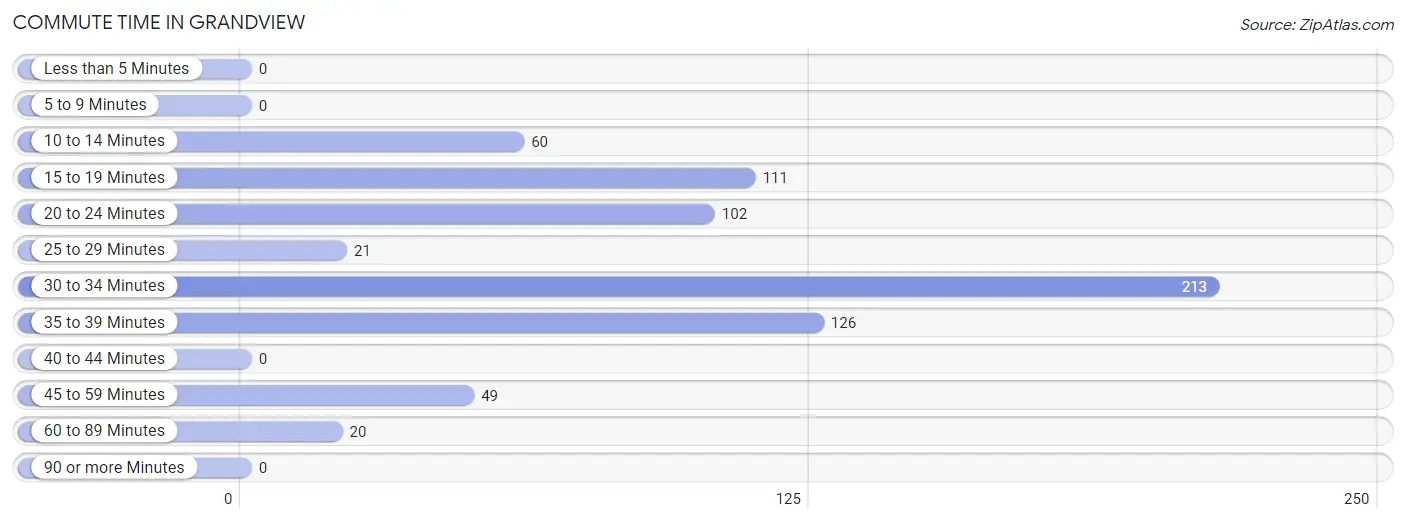
| Commute Time | # Commuters | % Commuters |
| Less than 5 Minutes | 0 | 0.0% |
| 5 to 9 Minutes | 0 | 0.0% |
| 10 to 14 Minutes | 60 | 8.6% |
| 15 to 19 Minutes | 111 | 15.8% |
| 20 to 24 Minutes | 102 | 14.5% |
| 25 to 29 Minutes | 21 | 3.0% |
| 30 to 34 Minutes | 213 | 30.3% |
| 35 to 39 Minutes | 126 | 17.9% |
| 40 to 44 Minutes | 0 | 0.0% |
| 45 to 59 Minutes | 49 | 7.0% |
| 60 to 89 Minutes | 20 | 2.9% |
| 90 or more Minutes | 0 | 0.0% |
Commute Time by Sex in Grandview
The most common commute times in Grandview are 35 to 39 minutes (126 commuters, 32.7%) for males and 30 to 34 minutes (96 commuters, 30.3%) for females.
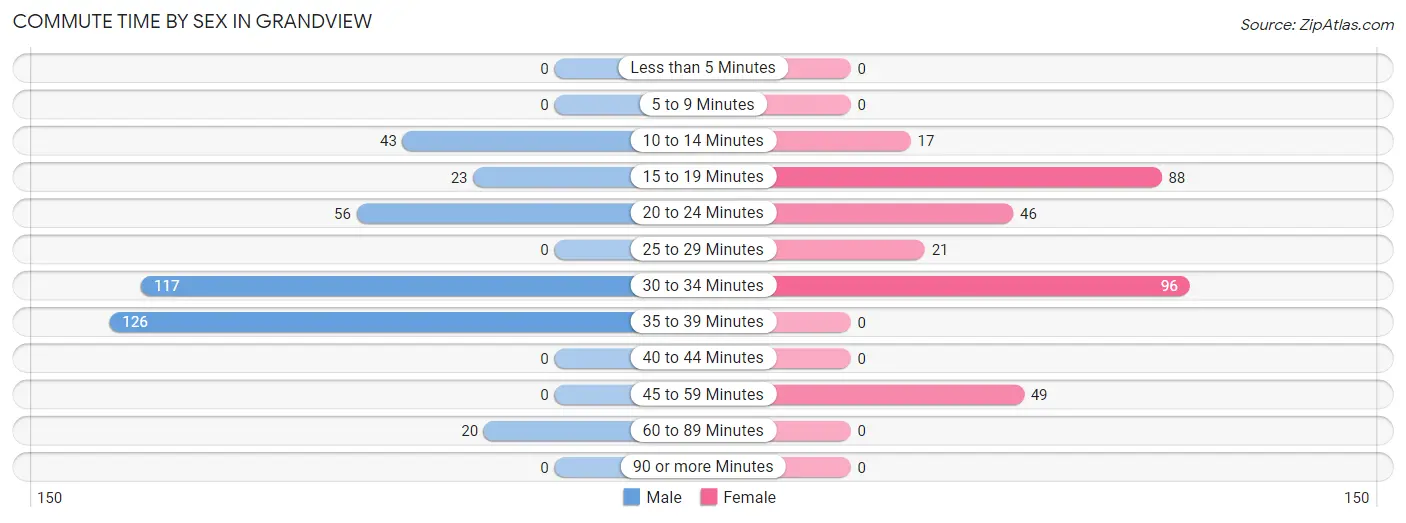
| Commute Time | Male | Female |
| Less than 5 Minutes | 0 (0.0%) | 0 (0.0%) |
| 5 to 9 Minutes | 0 (0.0%) | 0 (0.0%) |
| 10 to 14 Minutes | 43 (11.2%) | 17 (5.4%) |
| 15 to 19 Minutes | 23 (6.0%) | 88 (27.8%) |
| 20 to 24 Minutes | 56 (14.5%) | 46 (14.5%) |
| 25 to 29 Minutes | 0 (0.0%) | 21 (6.6%) |
| 30 to 34 Minutes | 117 (30.4%) | 96 (30.3%) |
| 35 to 39 Minutes | 126 (32.7%) | 0 (0.0%) |
| 40 to 44 Minutes | 0 (0.0%) | 0 (0.0%) |
| 45 to 59 Minutes | 0 (0.0%) | 49 (15.5%) |
| 60 to 89 Minutes | 20 (5.2%) | 0 (0.0%) |
| 90 or more Minutes | 0 (0.0%) | 0 (0.0%) |
Time of Departure to Work by Sex in Grandview
The most frequent times of departure to work in Grandview are 6:00 AM to 6:29 AM (67, 17.4%) for males and 4:00 PM to 11:59 PM (86, 27.1%) for females.
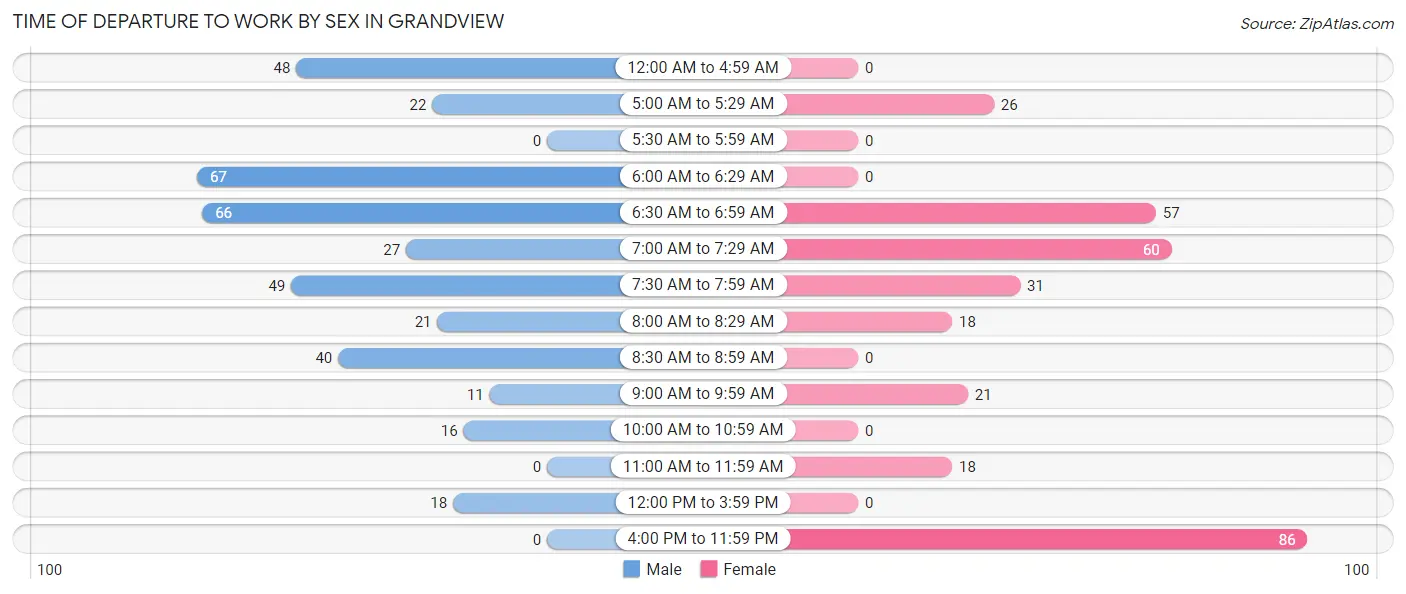
| Time of Departure | Male | Female |
| 12:00 AM to 4:59 AM | 48 (12.5%) | 0 (0.0%) |
| 5:00 AM to 5:29 AM | 22 (5.7%) | 26 (8.2%) |
| 5:30 AM to 5:59 AM | 0 (0.0%) | 0 (0.0%) |
| 6:00 AM to 6:29 AM | 67 (17.4%) | 0 (0.0%) |
| 6:30 AM to 6:59 AM | 66 (17.1%) | 57 (18.0%) |
| 7:00 AM to 7:29 AM | 27 (7.0%) | 60 (18.9%) |
| 7:30 AM to 7:59 AM | 49 (12.7%) | 31 (9.8%) |
| 8:00 AM to 8:29 AM | 21 (5.4%) | 18 (5.7%) |
| 8:30 AM to 8:59 AM | 40 (10.4%) | 0 (0.0%) |
| 9:00 AM to 9:59 AM | 11 (2.9%) | 21 (6.6%) |
| 10:00 AM to 10:59 AM | 16 (4.2%) | 0 (0.0%) |
| 11:00 AM to 11:59 AM | 0 (0.0%) | 18 (5.7%) |
| 12:00 PM to 3:59 PM | 18 (4.7%) | 0 (0.0%) |
| 4:00 PM to 11:59 PM | 0 (0.0%) | 86 (27.1%) |
| Total | 385 (100.0%) | 317 (100.0%) |
Housing Occupancy in Grandview
Occupancy by Ownership in Grandview
Of the total 390 dwellings in Grandview, owner-occupied units account for 325 (83.3%), while renter-occupied units make up 65 (16.7%).
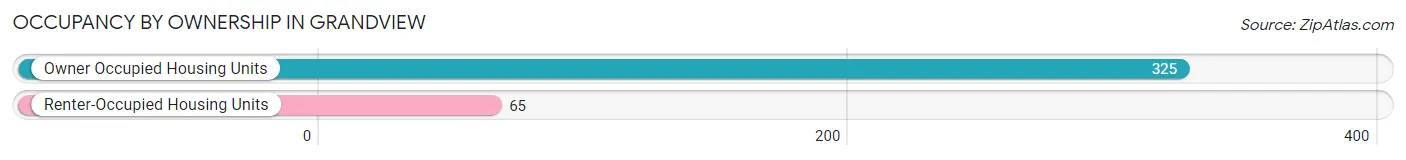
| Occupancy | # Housing Units | % Housing Units |
| Owner Occupied Housing Units | 325 | 83.3% |
| Renter-Occupied Housing Units | 65 | 16.7% |
| Total Occupied Housing Units | 390 | 100.0% |
Occupancy by Household Size in Grandview
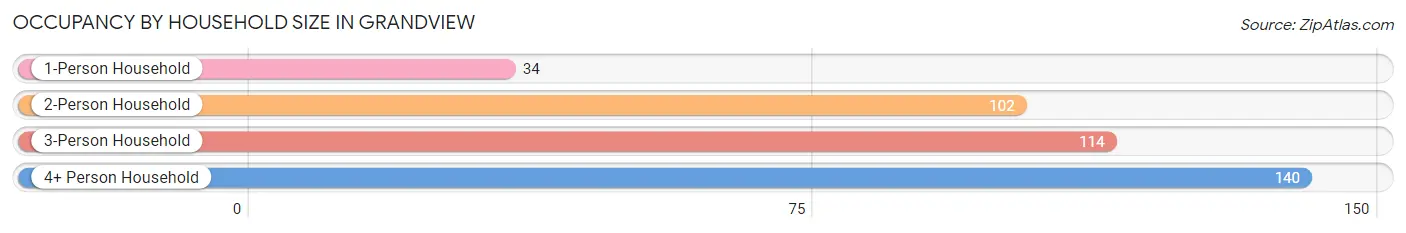
| Household Size | # Housing Units | % Housing Units |
| 1-Person Household | 34 | 8.7% |
| 2-Person Household | 102 | 26.2% |
| 3-Person Household | 114 | 29.2% |
| 4+ Person Household | 140 | 35.9% |
| Total Housing Units | 390 | 100.0% |
Occupancy by Ownership by Household Size in Grandview
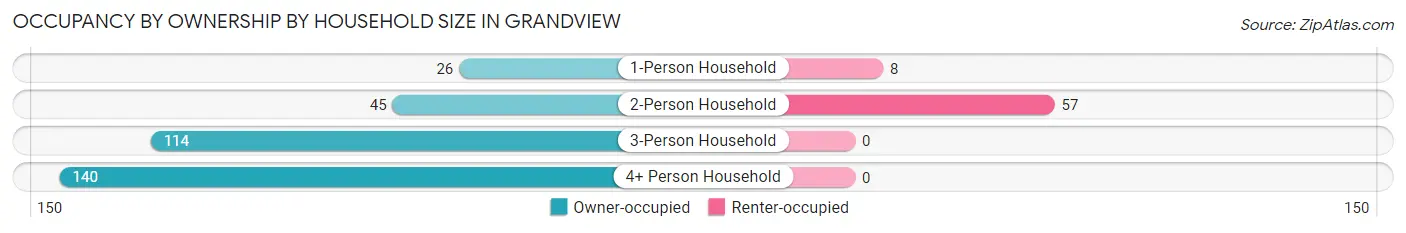
| Household Size | Owner-occupied | Renter-occupied |
| 1-Person Household | 26 (76.5%) | 8 (23.5%) |
| 2-Person Household | 45 (44.1%) | 57 (55.9%) |
| 3-Person Household | 114 (100.0%) | 0 (0.0%) |
| 4+ Person Household | 140 (100.0%) | 0 (0.0%) |
| Total Housing Units | 325 (83.3%) | 65 (16.7%) |
Occupancy by Educational Attainment in Grandview
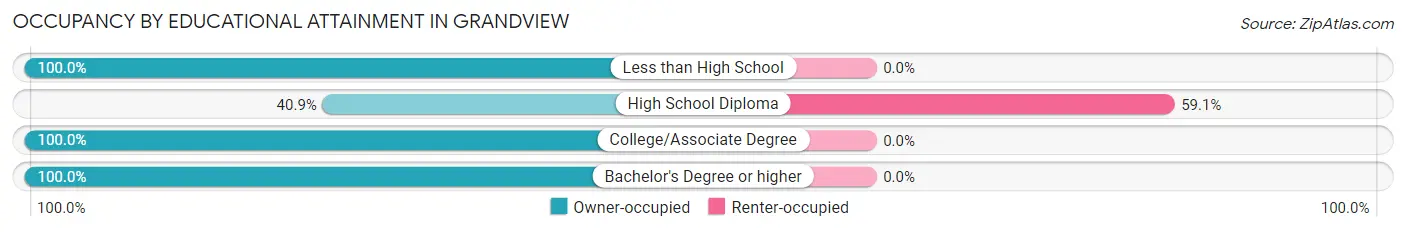
| Household Size | Owner-occupied | Renter-occupied |
| Less than High School | 26 (100.0%) | 0 (0.0%) |
| High School Diploma | 45 (40.9%) | 65 (59.1%) |
| College/Associate Degree | 97 (100.0%) | 0 (0.0%) |
| Bachelor's Degree or higher | 157 (100.0%) | 0 (0.0%) |
Occupancy by Age of Householder in Grandview
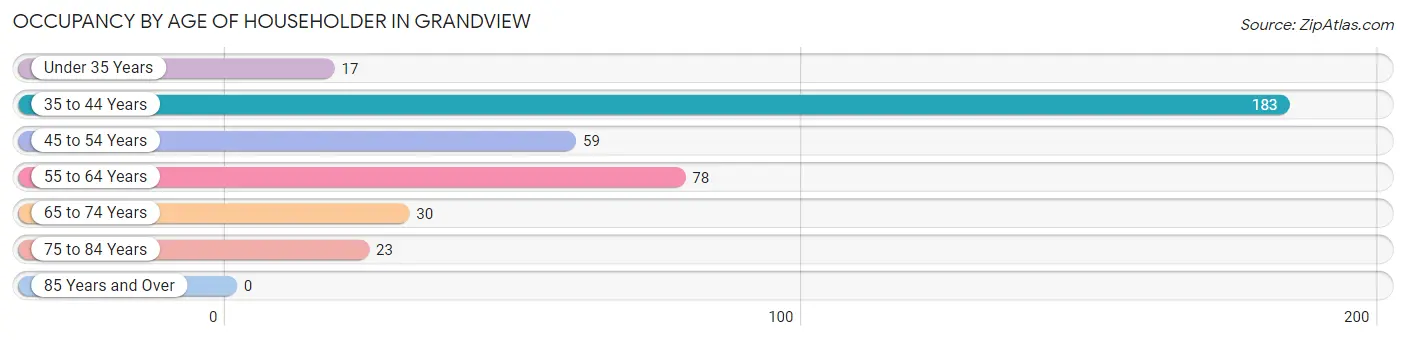
| Age Bracket | # Households | % Households |
| Under 35 Years | 17 | 4.4% |
| 35 to 44 Years | 183 | 46.9% |
| 45 to 54 Years | 59 | 15.1% |
| 55 to 64 Years | 78 | 20.0% |
| 65 to 74 Years | 30 | 7.7% |
| 75 to 84 Years | 23 | 5.9% |
| 85 Years and Over | 0 | 0.0% |
| Total | 390 | 100.0% |
Housing Finances in Grandview
Median Income by Occupancy in Grandview

| Occupancy Type | # Households | Median Income |
| Owner-Occupied | 325 (83.3%) | $165,268 |
| Renter-Occupied | 65 (16.7%) | $0 |
| Average | 390 (100.0%) | $135,556 |
Occupancy by Householder Income Bracket in Grandview
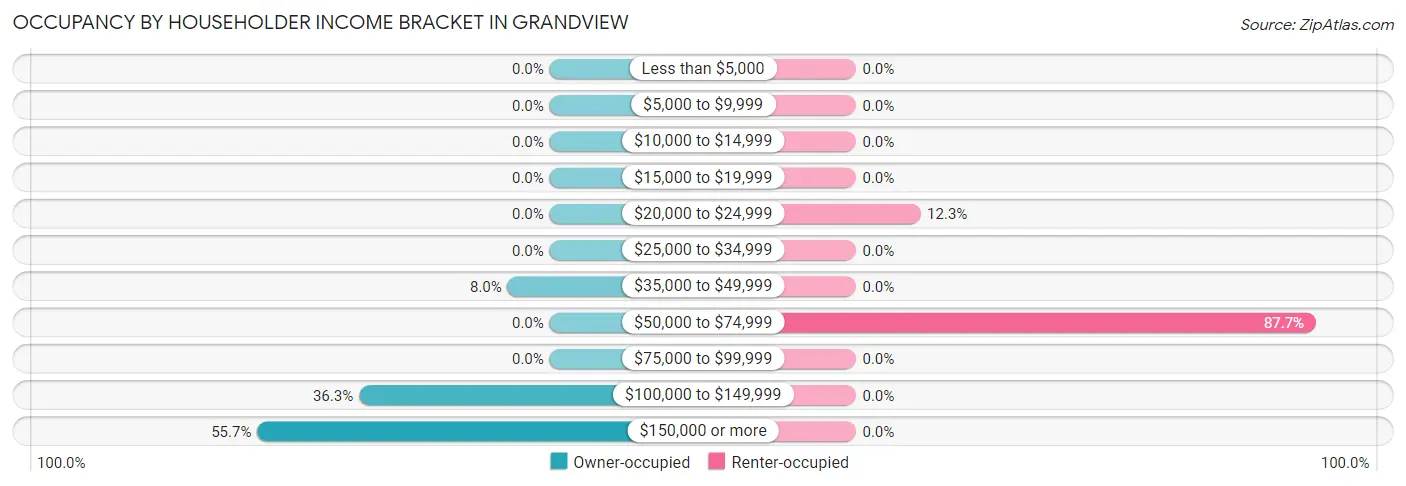
| Income Bracket | Owner-occupied | Renter-occupied |
| Less than $5,000 | 0 (0.0%) | 0 (0.0%) |
| $5,000 to $9,999 | 0 (0.0%) | 0 (0.0%) |
| $10,000 to $14,999 | 0 (0.0%) | 0 (0.0%) |
| $15,000 to $19,999 | 0 (0.0%) | 0 (0.0%) |
| $20,000 to $24,999 | 0 (0.0%) | 8 (12.3%) |
| $25,000 to $34,999 | 0 (0.0%) | 0 (0.0%) |
| $35,000 to $49,999 | 26 (8.0%) | 0 (0.0%) |
| $50,000 to $74,999 | 0 (0.0%) | 57 (87.7%) |
| $75,000 to $99,999 | 0 (0.0%) | 0 (0.0%) |
| $100,000 to $149,999 | 118 (36.3%) | 0 (0.0%) |
| $150,000 or more | 181 (55.7%) | 0 (0.0%) |
| Total | 325 (100.0%) | 65 (100.0%) |
Monthly Housing Cost Tiers in Grandview
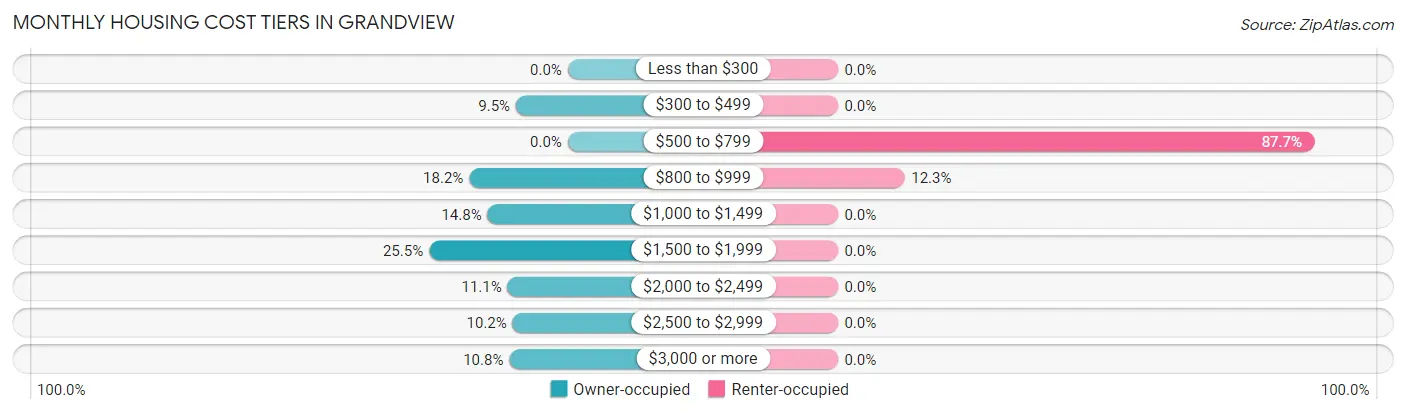
| Monthly Cost | Owner-occupied | Renter-occupied |
| Less than $300 | 0 (0.0%) | 0 (0.0%) |
| $300 to $499 | 31 (9.5%) | 0 (0.0%) |
| $500 to $799 | 0 (0.0%) | 57 (87.7%) |
| $800 to $999 | 59 (18.1%) | 8 (12.3%) |
| $1,000 to $1,499 | 48 (14.8%) | 0 (0.0%) |
| $1,500 to $1,999 | 83 (25.5%) | 0 (0.0%) |
| $2,000 to $2,499 | 36 (11.1%) | 0 (0.0%) |
| $2,500 to $2,999 | 33 (10.2%) | 0 (0.0%) |
| $3,000 or more | 35 (10.8%) | 0 (0.0%) |
| Total | 325 (100.0%) | 65 (100.0%) |
Physical Housing Characteristics in Grandview
Housing Structures in Grandview
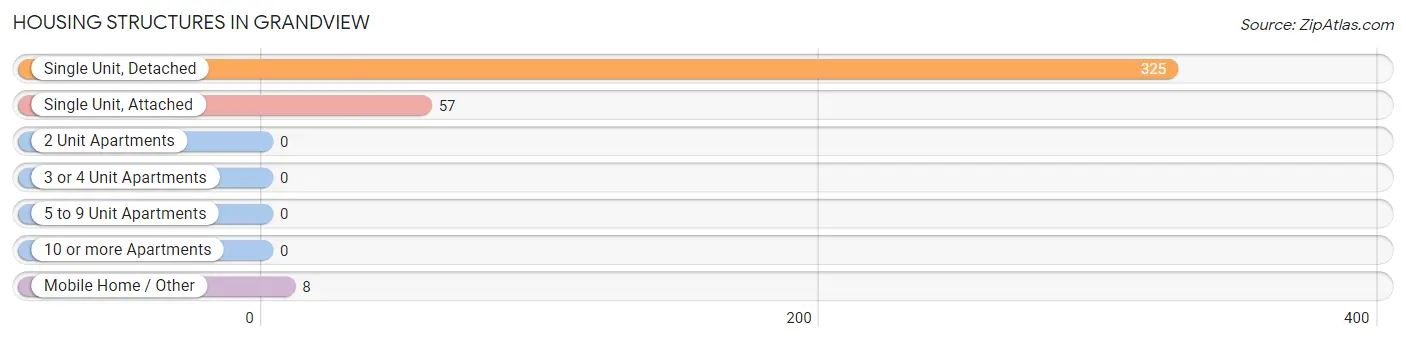
| Structure Type | # Housing Units | % Housing Units |
| Single Unit, Detached | 325 | 83.3% |
| Single Unit, Attached | 57 | 14.6% |
| 2 Unit Apartments | 0 | 0.0% |
| 3 or 4 Unit Apartments | 0 | 0.0% |
| 5 to 9 Unit Apartments | 0 | 0.0% |
| 10 or more Apartments | 0 | 0.0% |
| Mobile Home / Other | 8 | 2.1% |
| Total | 390 | 100.0% |
Housing Structures by Occupancy in Grandview
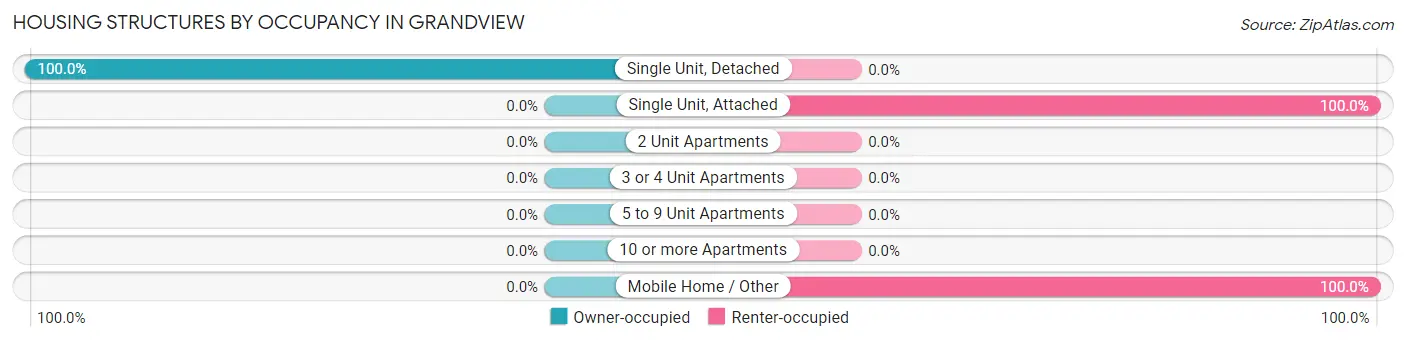
| Structure Type | Owner-occupied | Renter-occupied |
| Single Unit, Detached | 325 (100.0%) | 0 (0.0%) |
| Single Unit, Attached | 0 (0.0%) | 57 (100.0%) |
| 2 Unit Apartments | 0 (0.0%) | 0 (0.0%) |
| 3 or 4 Unit Apartments | 0 (0.0%) | 0 (0.0%) |
| 5 to 9 Unit Apartments | 0 (0.0%) | 0 (0.0%) |
| 10 or more Apartments | 0 (0.0%) | 0 (0.0%) |
| Mobile Home / Other | 0 (0.0%) | 8 (100.0%) |
| Total | 325 (83.3%) | 65 (16.7%) |
Housing Structures by Number of Rooms in Grandview
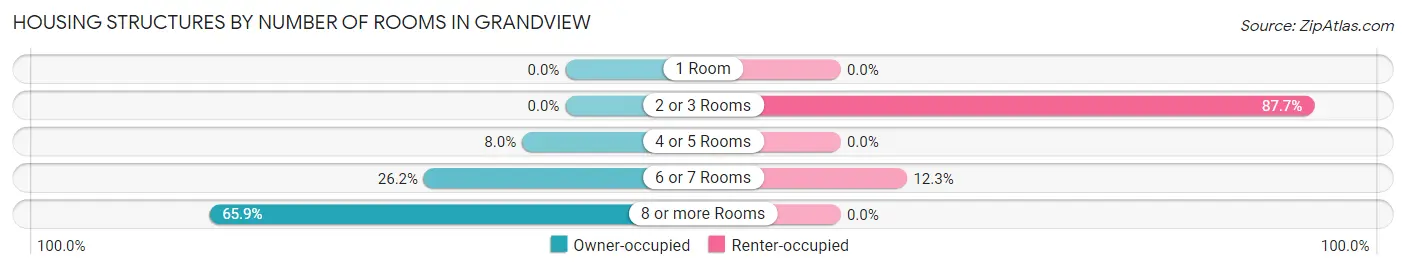
| Number of Rooms | Owner-occupied | Renter-occupied |
| 1 Room | 0 (0.0%) | 0 (0.0%) |
| 2 or 3 Rooms | 0 (0.0%) | 57 (87.7%) |
| 4 or 5 Rooms | 26 (8.0%) | 0 (0.0%) |
| 6 or 7 Rooms | 85 (26.2%) | 8 (12.3%) |
| 8 or more Rooms | 214 (65.8%) | 0 (0.0%) |
| Total | 325 (100.0%) | 65 (100.0%) |
Housing Structure by Heating Type in Grandview
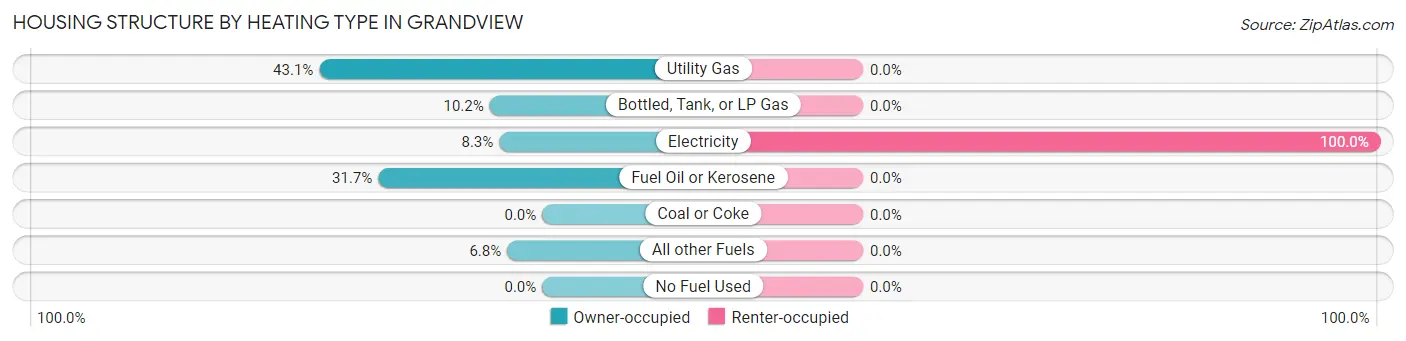
| Heating Type | Owner-occupied | Renter-occupied |
| Utility Gas | 140 (43.1%) | 0 (0.0%) |
| Bottled, Tank, or LP Gas | 33 (10.2%) | 0 (0.0%) |
| Electricity | 27 (8.3%) | 65 (100.0%) |
| Fuel Oil or Kerosene | 103 (31.7%) | 0 (0.0%) |
| Coal or Coke | 0 (0.0%) | 0 (0.0%) |
| All other Fuels | 22 (6.8%) | 0 (0.0%) |
| No Fuel Used | 0 (0.0%) | 0 (0.0%) |
| Total | 325 (100.0%) | 65 (100.0%) |
Household Vehicle Usage in Grandview
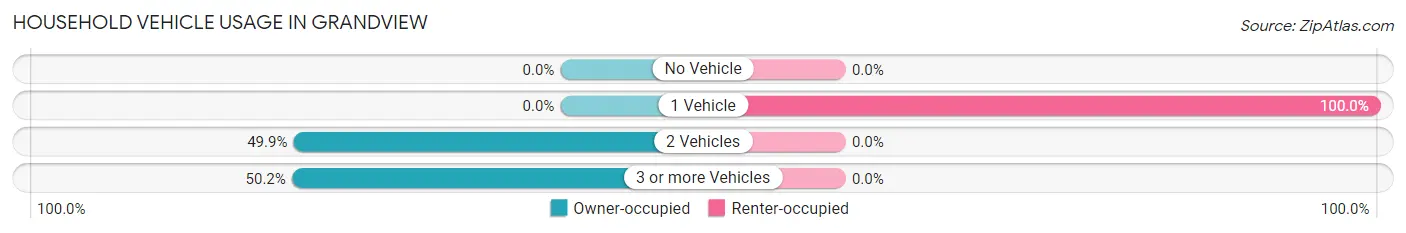
| Vehicles per Household | Owner-occupied | Renter-occupied |
| No Vehicle | 0 (0.0%) | 0 (0.0%) |
| 1 Vehicle | 0 (0.0%) | 65 (100.0%) |
| 2 Vehicles | 162 (49.8%) | 0 (0.0%) |
| 3 or more Vehicles | 163 (50.1%) | 0 (0.0%) |
| Total | 325 (100.0%) | 65 (100.0%) |
Real Estate & Mortgages in Grandview
Real Estate and Mortgage Overview in Grandview
| Characteristic | Without Mortgage | With Mortgage |
| Housing Units | 121 | 204 |
| Median Property Value | $386,800 | $311,100 |
| Median Household Income | $191,989 | $103 |
| Monthly Housing Costs | $970 | $35 |
| Real Estate Taxes | $6,458 | $17 |
Property Value by Mortgage Status in Grandview
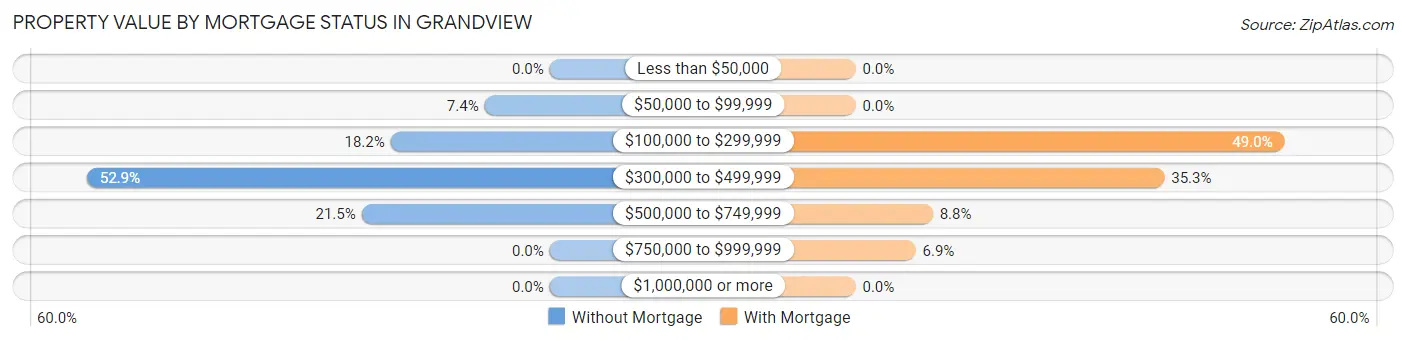
| Property Value | Without Mortgage | With Mortgage |
| Less than $50,000 | 0 (0.0%) | 0 (0.0%) |
| $50,000 to $99,999 | 9 (7.4%) | 0 (0.0%) |
| $100,000 to $299,999 | 22 (18.2%) | 100 (49.0%) |
| $300,000 to $499,999 | 64 (52.9%) | 72 (35.3%) |
| $500,000 to $749,999 | 26 (21.5%) | 18 (8.8%) |
| $750,000 to $999,999 | 0 (0.0%) | 14 (6.9%) |
| $1,000,000 or more | 0 (0.0%) | 0 (0.0%) |
| Total | 121 (100.0%) | 204 (100.0%) |
Household Income by Mortgage Status in Grandview
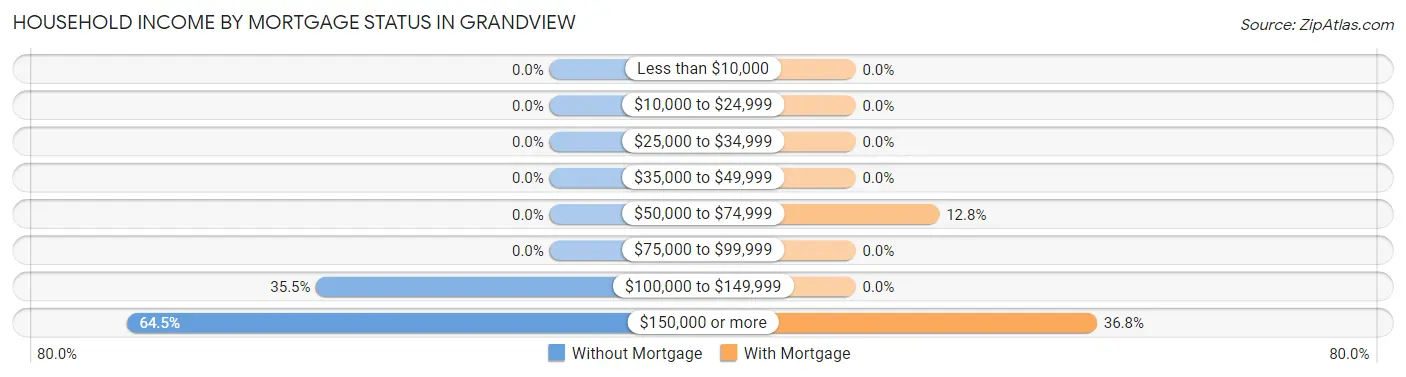
| Household Income | Without Mortgage | With Mortgage |
| Less than $10,000 | 0 (0.0%) | 0 (0.0%) |
| $10,000 to $24,999 | 0 (0.0%) | 0 (0.0%) |
| $25,000 to $34,999 | 0 (0.0%) | 0 (0.0%) |
| $35,000 to $49,999 | 0 (0.0%) | 0 (0.0%) |
| $50,000 to $74,999 | 0 (0.0%) | 26 (12.8%) |
| $75,000 to $99,999 | 0 (0.0%) | 0 (0.0%) |
| $100,000 to $149,999 | 43 (35.5%) | 0 (0.0%) |
| $150,000 or more | 78 (64.5%) | 75 (36.8%) |
| Total | 121 (100.0%) | 204 (100.0%) |
Property Value to Household Income Ratio in Grandview
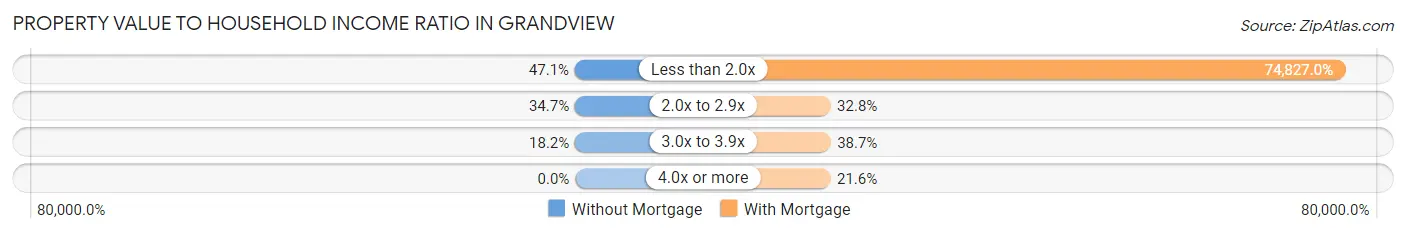
| Value-to-Income Ratio | Without Mortgage | With Mortgage |
| Less than 2.0x | 57 (47.1%) | 152,647 (74,827.0%) |
| 2.0x to 2.9x | 42 (34.7%) | 67 (32.8%) |
| 3.0x to 3.9x | 22 (18.2%) | 79 (38.7%) |
| 4.0x or more | 0 (0.0%) | 44 (21.6%) |
| Total | 121 (100.0%) | 204 (100.0%) |
Real Estate Taxes by Mortgage Status in Grandview
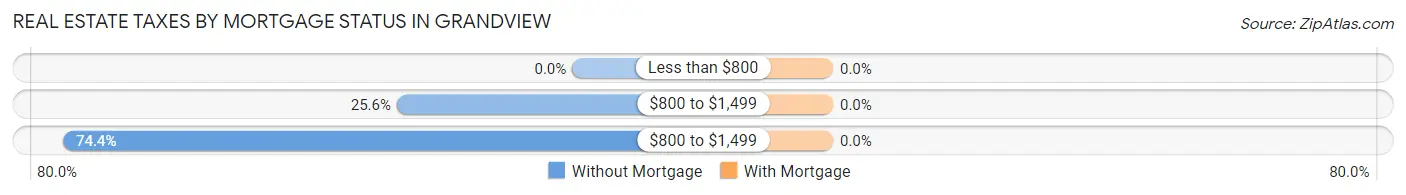
| Property Taxes | Without Mortgage | With Mortgage |
| Less than $800 | 0 (0.0%) | 0 (0.0%) |
| $800 to $1,499 | 31 (25.6%) | 0 (0.0%) |
| $800 to $1,499 | 90 (74.4%) | 0 (0.0%) |
| Total | 121 (100.0%) | 204 (100.0%) |
Health & Disability in Grandview
Health Insurance Coverage by Age in Grandview
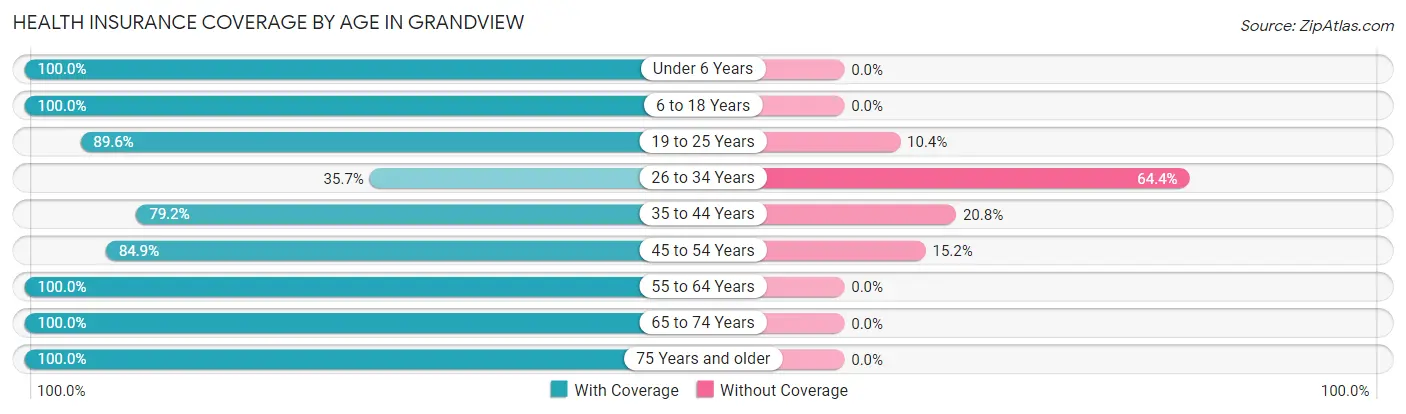
| Age Bracket | With Coverage | Without Coverage |
| Under 6 Years | 156 (100.0%) | 0 (0.0%) |
| 6 to 18 Years | 140 (100.0%) | 0 (0.0%) |
| 19 to 25 Years | 198 (89.6%) | 23 (10.4%) |
| 26 to 34 Years | 41 (35.6%) | 74 (64.3%) |
| 35 to 44 Years | 285 (79.2%) | 75 (20.8%) |
| 45 to 54 Years | 140 (84.9%) | 25 (15.1%) |
| 55 to 64 Years | 120 (100.0%) | 0 (0.0%) |
| 65 to 74 Years | 30 (100.0%) | 0 (0.0%) |
| 75 Years and older | 44 (100.0%) | 0 (0.0%) |
| Total | 1,154 (85.4%) | 197 (14.6%) |
Health Insurance Coverage by Citizenship Status in Grandview
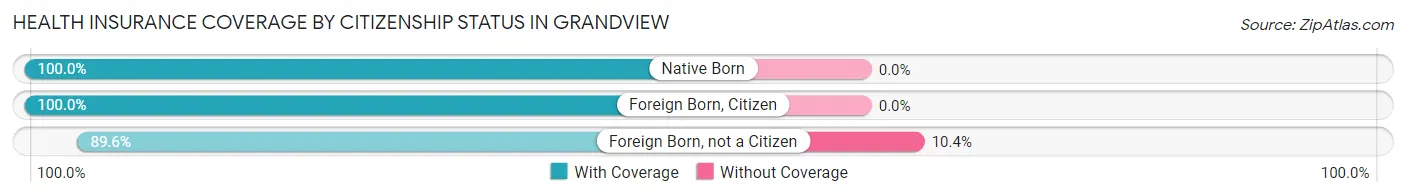
| Citizenship Status | With Coverage | Without Coverage |
| Native Born | 156 (100.0%) | 0 (0.0%) |
| Foreign Born, Citizen | 140 (100.0%) | 0 (0.0%) |
| Foreign Born, not a Citizen | 198 (89.6%) | 23 (10.4%) |
Health Insurance Coverage by Household Income in Grandview
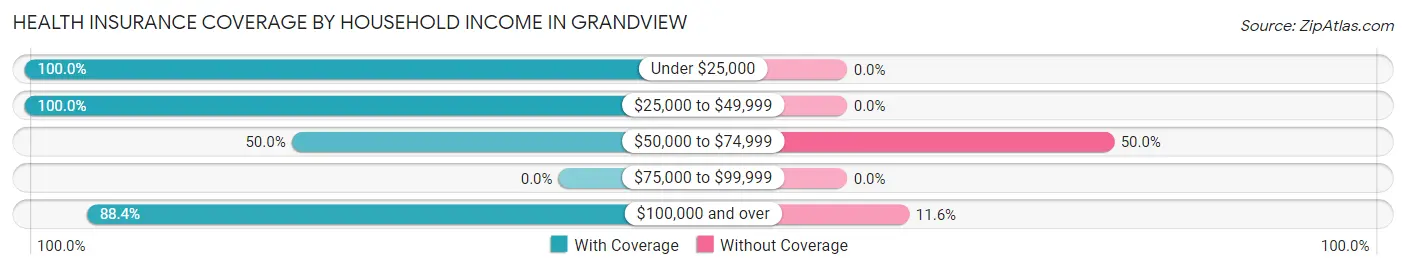
| Household Income | With Coverage | Without Coverage |
| Under $25,000 | 8 (100.0%) | 0 (0.0%) |
| $25,000 to $49,999 | 26 (100.0%) | 0 (0.0%) |
| $50,000 to $74,999 | 57 (50.0%) | 57 (50.0%) |
| $75,000 to $99,999 | 0 (0.0%) | 0 (0.0%) |
| $100,000 and over | 1,063 (88.4%) | 140 (11.6%) |
Public vs Private Health Insurance Coverage by Age in Grandview
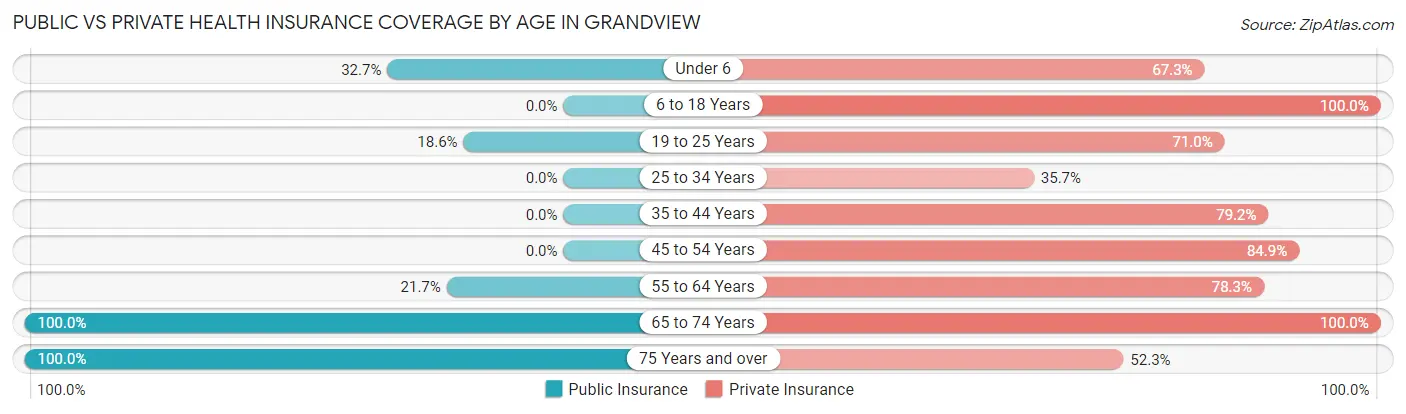
| Age Bracket | Public Insurance | Private Insurance |
| Under 6 | 51 (32.7%) | 105 (67.3%) |
| 6 to 18 Years | 0 (0.0%) | 140 (100.0%) |
| 19 to 25 Years | 41 (18.5%) | 157 (71.0%) |
| 25 to 34 Years | 0 (0.0%) | 41 (35.6%) |
| 35 to 44 Years | 0 (0.0%) | 285 (79.2%) |
| 45 to 54 Years | 0 (0.0%) | 140 (84.9%) |
| 55 to 64 Years | 26 (21.7%) | 94 (78.3%) |
| 65 to 74 Years | 30 (100.0%) | 30 (100.0%) |
| 75 Years and over | 44 (100.0%) | 23 (52.3%) |
| Total | 192 (14.2%) | 1,015 (75.1%) |
Disability Status by Sex by Age in Grandview
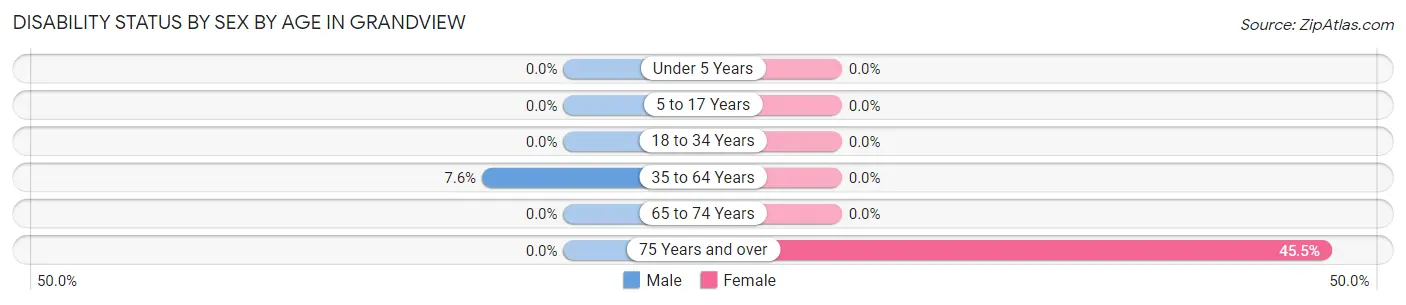
| Age Bracket | Male | Female |
| Under 5 Years | 0 (0.0%) | 0 (0.0%) |
| 5 to 17 Years | 0 (0.0%) | 0 (0.0%) |
| 18 to 34 Years | 0 (0.0%) | 0 (0.0%) |
| 35 to 64 Years | 26 (7.6%) | 0 (0.0%) |
| 65 to 74 Years | 0 (0.0%) | 0 (0.0%) |
| 75 Years and over | 0 (0.0%) | 10 (45.5%) |
Disability Class by Sex by Age in Grandview
Disability Class: Hearing Difficulty
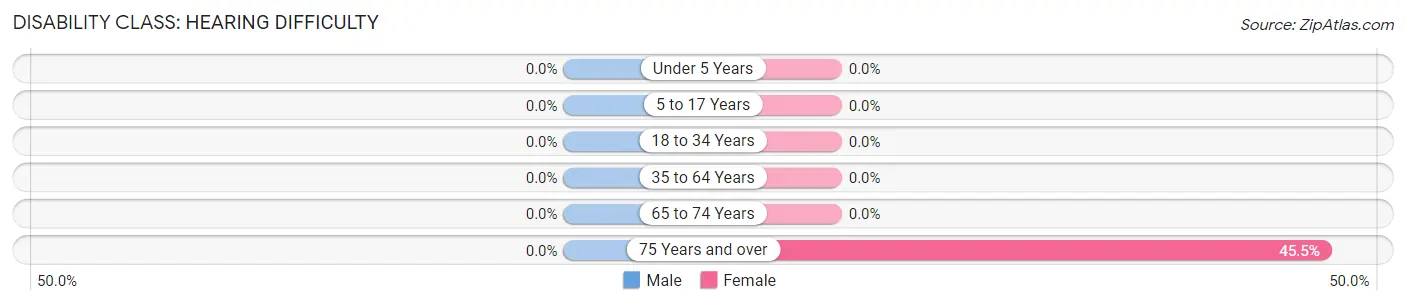
| Age Bracket | Male | Female |
| Under 5 Years | 0 (0.0%) | 0 (0.0%) |
| 5 to 17 Years | 0 (0.0%) | 0 (0.0%) |
| 18 to 34 Years | 0 (0.0%) | 0 (0.0%) |
| 35 to 64 Years | 0 (0.0%) | 0 (0.0%) |
| 65 to 74 Years | 0 (0.0%) | 0 (0.0%) |
| 75 Years and over | 0 (0.0%) | 10 (45.5%) |
Disability Class: Vision Difficulty
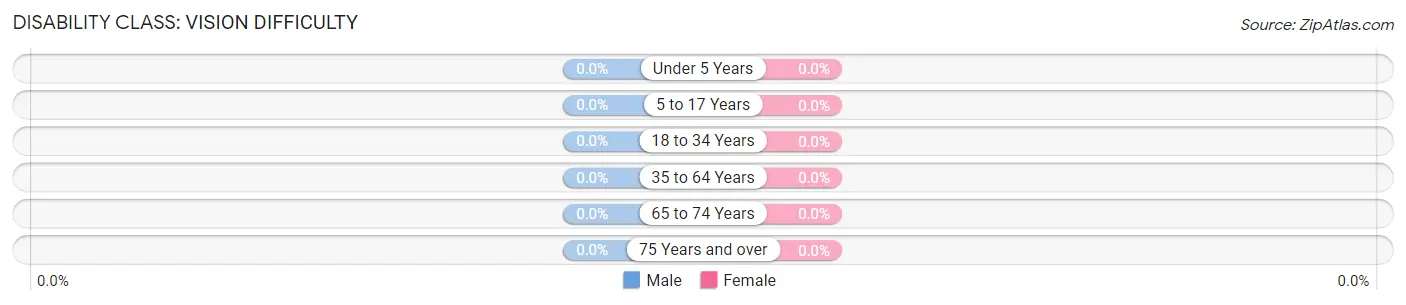
| Age Bracket | Male | Female |
| Under 5 Years | 0 (0.0%) | 0 (0.0%) |
| 5 to 17 Years | 0 (0.0%) | 0 (0.0%) |
| 18 to 34 Years | 0 (0.0%) | 0 (0.0%) |
| 35 to 64 Years | 0 (0.0%) | 0 (0.0%) |
| 65 to 74 Years | 0 (0.0%) | 0 (0.0%) |
| 75 Years and over | 0 (0.0%) | 0 (0.0%) |
Disability Class: Cognitive Difficulty
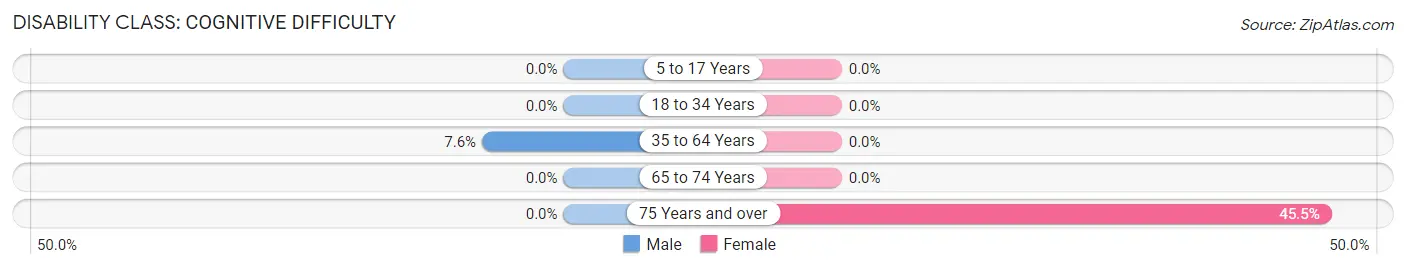
| Age Bracket | Male | Female |
| 5 to 17 Years | 0 (0.0%) | 0 (0.0%) |
| 18 to 34 Years | 0 (0.0%) | 0 (0.0%) |
| 35 to 64 Years | 26 (7.6%) | 0 (0.0%) |
| 65 to 74 Years | 0 (0.0%) | 0 (0.0%) |
| 75 Years and over | 0 (0.0%) | 10 (45.5%) |
Disability Class: Ambulatory Difficulty
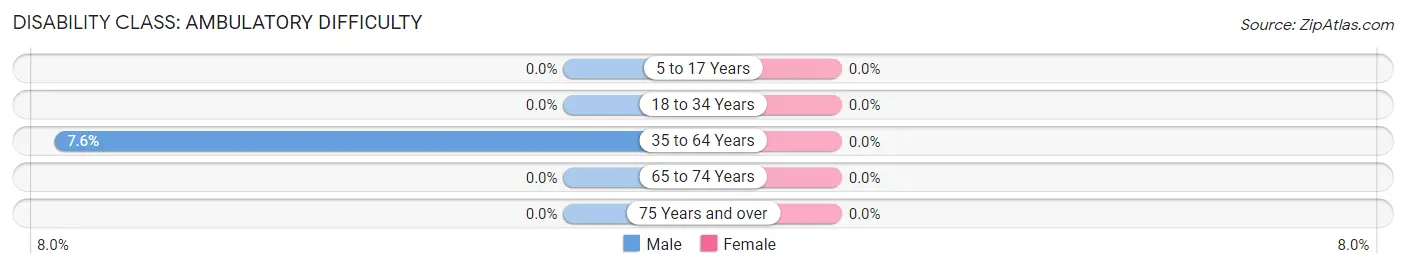
| Age Bracket | Male | Female |
| 5 to 17 Years | 0 (0.0%) | 0 (0.0%) |
| 18 to 34 Years | 0 (0.0%) | 0 (0.0%) |
| 35 to 64 Years | 26 (7.6%) | 0 (0.0%) |
| 65 to 74 Years | 0 (0.0%) | 0 (0.0%) |
| 75 Years and over | 0 (0.0%) | 0 (0.0%) |
Disability Class: Self-Care Difficulty
| Age Bracket | Male | Female |
| 5 to 17 Years | 0 (0.0%) | 0 (0.0%) |
| 18 to 34 Years | 0 (0.0%) | 0 (0.0%) |
| 35 to 64 Years | 0 (0.0%) | 0 (0.0%) |
| 65 to 74 Years | 0 (0.0%) | 0 (0.0%) |
| 75 Years and over | 0 (0.0%) | 0 (0.0%) |
Technology Access in Grandview
Computing Device Access in Grandview
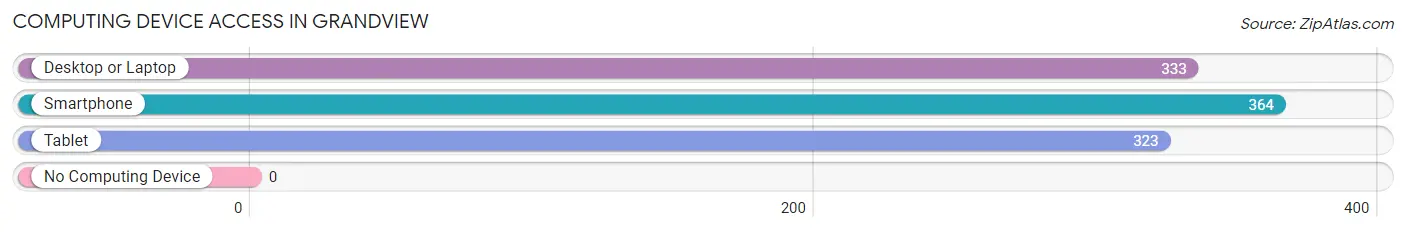
| Device Type | # Households | % Households |
| Desktop or Laptop | 333 | 85.4% |
| Smartphone | 364 | 93.3% |
| Tablet | 323 | 82.8% |
| No Computing Device | 0 | 0.0% |
| Total | 390 | 100.0% |
Internet Access in Grandview
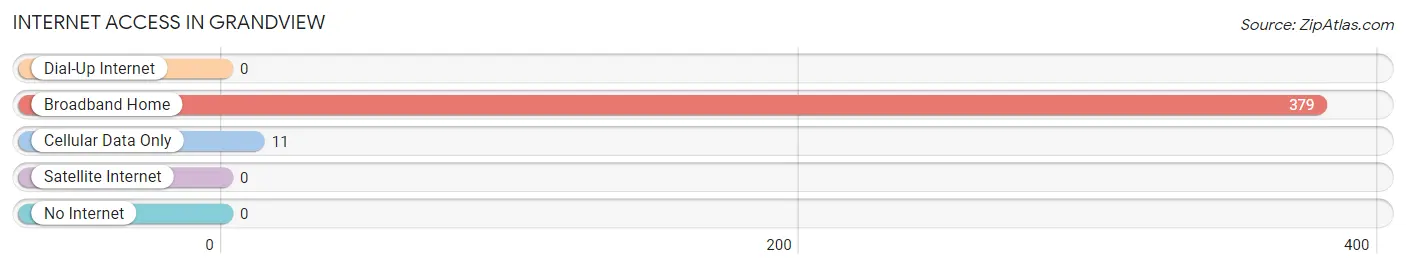
| Internet Type | # Households | % Households |
| Dial-Up Internet | 0 | 0.0% |
| Broadband Home | 379 | 97.2% |
| Cellular Data Only | 11 | 2.8% |
| Satellite Internet | 0 | 0.0% |
| No Internet | 0 | 0.0% |
| Total | 390 | 100.0% |
Grandview Summary
Geography
Grandview is a city located in Franklin County, Ohio, United States. It is a suburb of Columbus, the state capital and largest city in Ohio. Grandview is located at the intersection of Interstate 270 and State Route 315, approximately 8 miles northwest of downtown Columbus. The city has a total area of 2.3 square miles, all of which is land.
History
Grandview was founded in 1891 by a group of investors from Columbus. The city was named for its view of the Ohio Statehouse in downtown Columbus. The city was incorporated in 1901 and has since grown to become a thriving suburb of Columbus.
Grandview has a long history of being a popular destination for visitors. In the early 1900s, the city was home to a popular amusement park, Grandview Park, which was located on the banks of the Olentangy River. The park was a popular destination for visitors from all over the state and was home to a variety of attractions, including a roller coaster, a carousel, and a dance hall. The park closed in the 1950s, but the city still retains its reputation as a popular destination for visitors.
Economy
Grandview is home to a variety of businesses and industries. The city is home to several large employers, including Nationwide Insurance, Honda of America, and Cardinal Health. The city is also home to a variety of small businesses, including restaurants, retail stores, and professional services.
Grandview is also home to a variety of educational institutions, including Ohio State University, Columbus State Community College, and the Ohio College of Applied Science. The city is also home to a variety of cultural attractions, including the Grandview Heights Public Library, the Grandview Heights Aquatic Center, and the Grandview Heights Historical Society.
Demographics
As of the 2010 census, Grandview had a population of 7,743. The racial makeup of the city was 87.3% White, 8.2% African American, 0.3% Native American, 1.3% Asian, 0.1% Pacific Islander, 0.7% from other races, and 2.1% from two or more races. Hispanic or Latino of any race were 2.3% of the population.
The median household income in Grandview was $60,945 in 2019. The median age of the city was 38.3 years. The city had a poverty rate of 8.3%.
Grandview is a diverse city with a variety of cultures and backgrounds. The city is home to a variety of religious institutions, including churches, synagogues, and mosques. The city is also home to a variety of cultural organizations, including the Grandview Heights Arts Council, the Grandview Heights Historical Society, and the Grandview Heights Public Library.
Common Questions
What is the Total Population of Grandview?
Total Population of Grandview is 1,351.
What is the Total Male Population of Grandview?
Total Male Population of Grandview is 663.
What is the Total Female Population of Grandview?
Total Female Population of Grandview is 688.
What is the Ratio of Males per 100 Females in Grandview?
There are 96.37 Males per 100 Females in Grandview.
What is the Ratio of Females per 100 Males in Grandview?
There are 103.77 Females per 100 Males in Grandview.
What is the Median Population Age in Grandview?
Median Population Age in Grandview is 35.7 Years.
What is the Average Family Size in Grandview
Average Family Size in Grandview is 4.0 People.
What is the Average Household Size in Grandview
Average Household Size in Grandview is 3.5 People.
What is Per Capita Income in Grandview?
Per Capita income in Grandview is $43,242.
What is the Median Family Income in Grandview?
Median Family Income in Grandview is $190,057.
What is the Median Household income in Grandview?
Median Household Income in Grandview is $135,556.
What is Income or Wage Gap in Grandview?
Income or Wage Gap in Grandview is 3.4%.
Women in Grandview earn 96.6 cents for every dollar earned by a man.
What is Inequality or Gini Index in Grandview?
Inequality or Gini Index in Grandview is 0.29.
How Large is the Labor Force in Grandview?
There are 896 People in the Labor Forcein in Grandview.
What is the Percentage of People in the Labor Force in Grandview?
84.9% of People are in the Labor Force in Grandview.
What is the Unemployment Rate in Grandview?
Unemployment Rate in Grandview is 13.5%.