Gloria Glens Park, OH
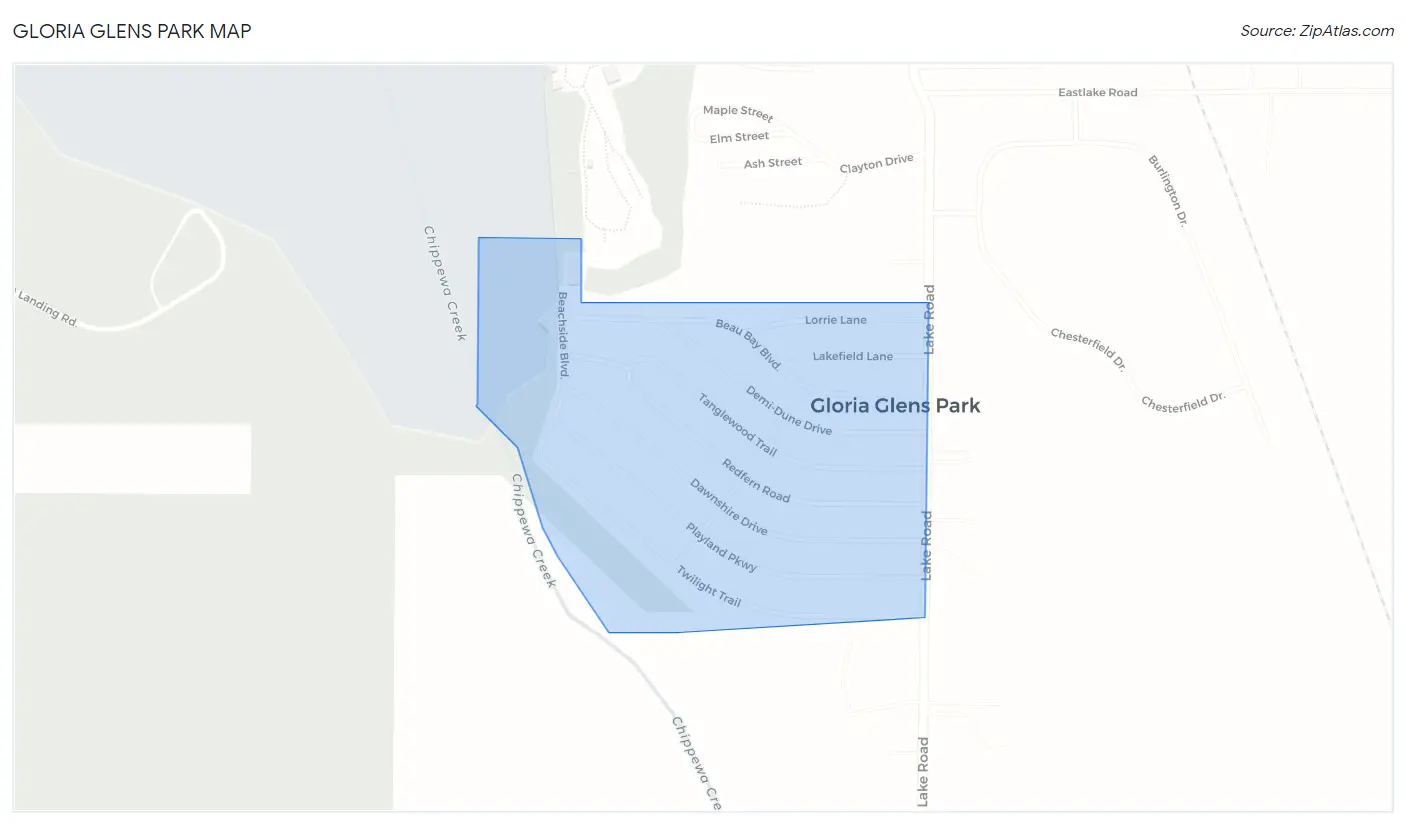
Gloria Glens Park Map
Gloria Glens Park Overview
414
TOTAL POPULATION
176
MALE POPULATION
238
FEMALE POPULATION
73.95
MALES / 100 FEMALES
135.23
FEMALES / 100 MALES
45.2
MEDIAN AGE
3.1
AVG FAMILY SIZE
2.2
AVG HOUSEHOLD SIZE
$32,774
PER CAPITA INCOME
$85,952
AVG FAMILY INCOME
$64,167
AVG HOUSEHOLD INCOME
0.33
INEQUALITY / GINI INDEX
297
LABOR FORCE [ PEOPLE ]
74.6%
PERCENT IN LABOR FORCE
6.1%
UNEMPLOYMENT RATE
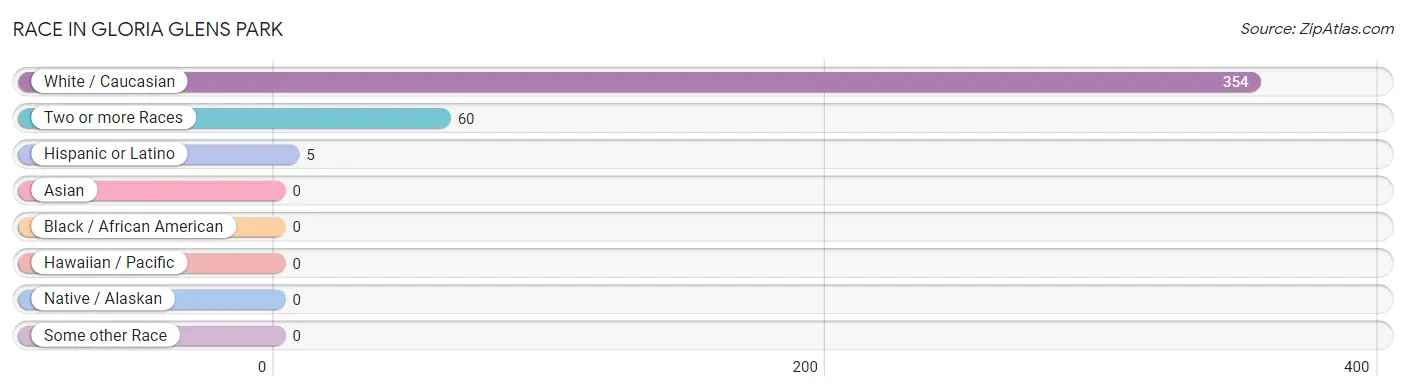
Race in Gloria Glens Park
The most populous races in Gloria Glens Park are White / Caucasian (354 | 85.5%), Two or more Races (60 | 14.5%), and Hispanic or Latino (5 | 1.2%).
| Race | # Population | % Population |
| Asian | 0 | 0.0% |
| Black / African American | 0 | 0.0% |
| Hawaiian / Pacific | 0 | 0.0% |
| Hispanic or Latino | 5 | 1.2% |
| Native / Alaskan | 0 | 0.0% |
| White / Caucasian | 354 | 85.5% |
| Two or more Races | 60 | 14.5% |
| Some other Race | 0 | 0.0% |
| Total | 414 | 100.0% |
Ancestry in Gloria Glens Park
The most populous ancestries reported in Gloria Glens Park are German (77 | 18.6%), Irish (76 | 18.4%), Polish (37 | 8.9%), English (26 | 6.3%), and Italian (22 | 5.3%), together accounting for 57.5% of all Gloria Glens Park residents.
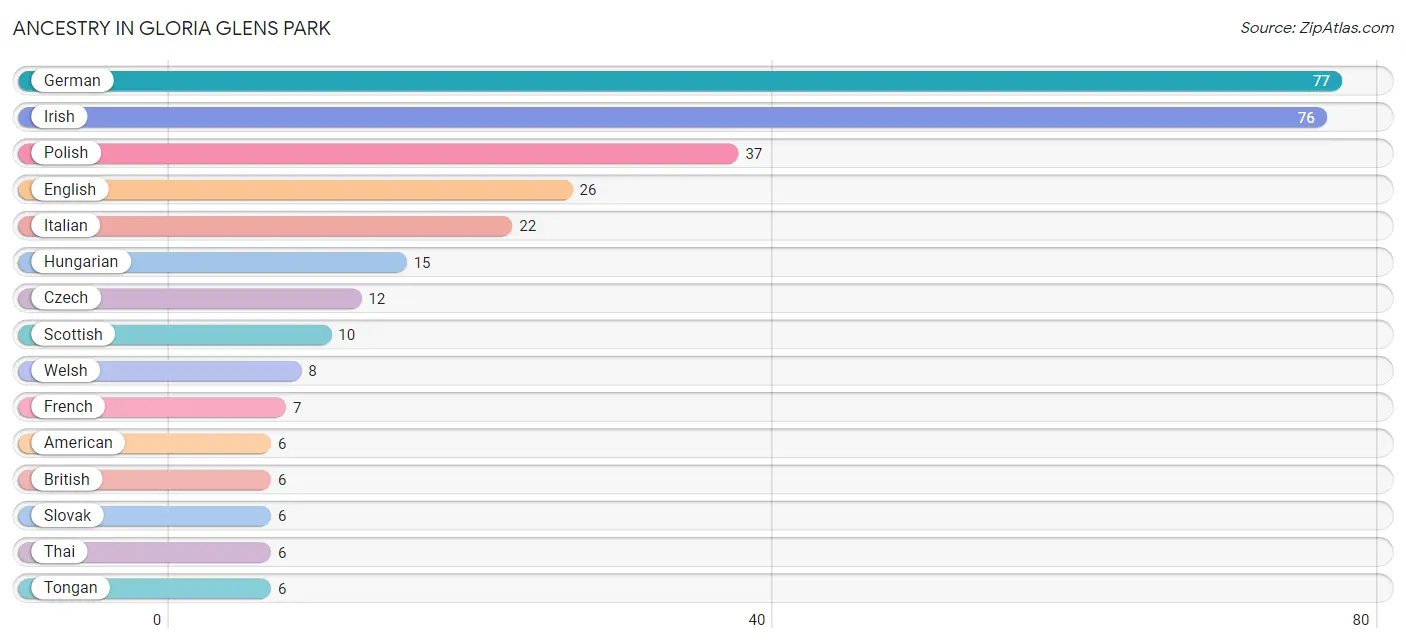
| Ancestry | # Population | % Population |
| American | 6 | 1.5% |
| Austrian | 5 | 1.2% |
| British | 6 | 1.5% |
| Czech | 12 | 2.9% |
| Dutch | 3 | 0.7% |
| English | 26 | 6.3% |
| Finnish | 2 | 0.5% |
| French | 7 | 1.7% |
| German | 77 | 18.6% |
| Hungarian | 15 | 3.6% |
| Irish | 76 | 18.4% |
| Italian | 22 | 5.3% |
| Polish | 37 | 8.9% |
| Puerto Rican | 1 | 0.2% |
| Romanian | 4 | 1.0% |
| Scotch-Irish | 2 | 0.5% |
| Scottish | 10 | 2.4% |
| Slovak | 6 | 1.5% |
| Slovene | 3 | 0.7% |
| Spanish | 4 | 1.0% |
| Swedish | 2 | 0.5% |
| Swiss | 3 | 0.7% |
| Thai | 6 | 1.5% |
| Tongan | 6 | 1.5% |
| Ukrainian | 1 | 0.2% |
| Welsh | 8 | 1.9% | View All 26 Rows |
Immigrants in Gloria Glens Park

| Immigration Origin | # Population | % Population | View All 0 Rows |
Sex and Age in Gloria Glens Park
Sex and Age in Gloria Glens Park
The most populous age groups in Gloria Glens Park are 50 to 54 Years (37 | 21.0%) for men and 15 to 19 Years (73 | 30.7%) for women.
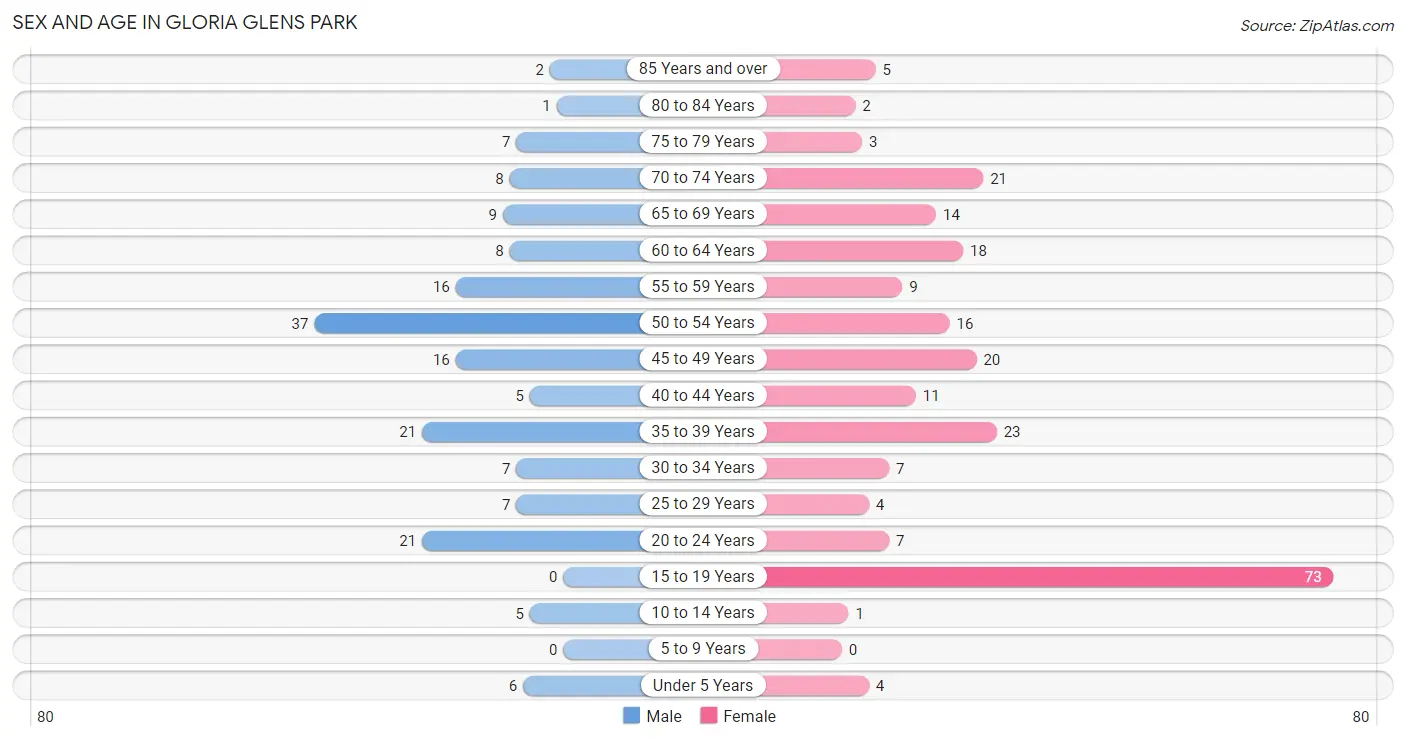
| Age Bracket | Male | Female |
| Under 5 Years | 6 (3.4%) | 4 (1.7%) |
| 5 to 9 Years | 0 (0.0%) | 0 (0.0%) |
| 10 to 14 Years | 5 (2.8%) | 1 (0.4%) |
| 15 to 19 Years | 0 (0.0%) | 73 (30.7%) |
| 20 to 24 Years | 21 (11.9%) | 7 (2.9%) |
| 25 to 29 Years | 7 (4.0%) | 4 (1.7%) |
| 30 to 34 Years | 7 (4.0%) | 7 (2.9%) |
| 35 to 39 Years | 21 (11.9%) | 23 (9.7%) |
| 40 to 44 Years | 5 (2.8%) | 11 (4.6%) |
| 45 to 49 Years | 16 (9.1%) | 20 (8.4%) |
| 50 to 54 Years | 37 (21.0%) | 16 (6.7%) |
| 55 to 59 Years | 16 (9.1%) | 9 (3.8%) |
| 60 to 64 Years | 8 (4.5%) | 18 (7.6%) |
| 65 to 69 Years | 9 (5.1%) | 14 (5.9%) |
| 70 to 74 Years | 8 (4.5%) | 21 (8.8%) |
| 75 to 79 Years | 7 (4.0%) | 3 (1.3%) |
| 80 to 84 Years | 1 (0.6%) | 2 (0.8%) |
| 85 Years and over | 2 (1.1%) | 5 (2.1%) |
| Total | 176 (100.0%) | 238 (100.0%) |
Families and Households in Gloria Glens Park
Median Family Size in Gloria Glens Park
The median family size in Gloria Glens Park is 3.11 persons per family, with married-couple families (88 | 89.8%) accounting for the largest median family size of 3.23 persons per family. On the other hand, single female/mother families (6 | 6.1%) represent the smallest median family size with 1.83 persons per family.
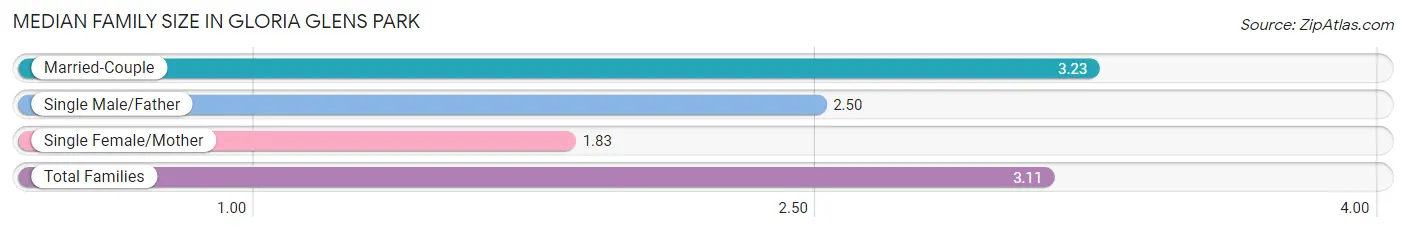
| Family Type | # Families | Family Size |
| Married-Couple | 88 (89.8%) | 3.23 |
| Single Male/Father | 4 (4.1%) | 2.50 |
| Single Female/Mother | 6 (6.1%) | 1.83 |
| Total Families | 98 (100.0%) | 3.11 |
Median Household Size in Gloria Glens Park
The median household size in Gloria Glens Park is 2.18 persons per household, with married-couple households (88 | 46.3%) accounting for the largest median household size of 3.24 persons per household. non-family households (92 | 48.4%) represent the smallest median household size with 1.14 persons per household.
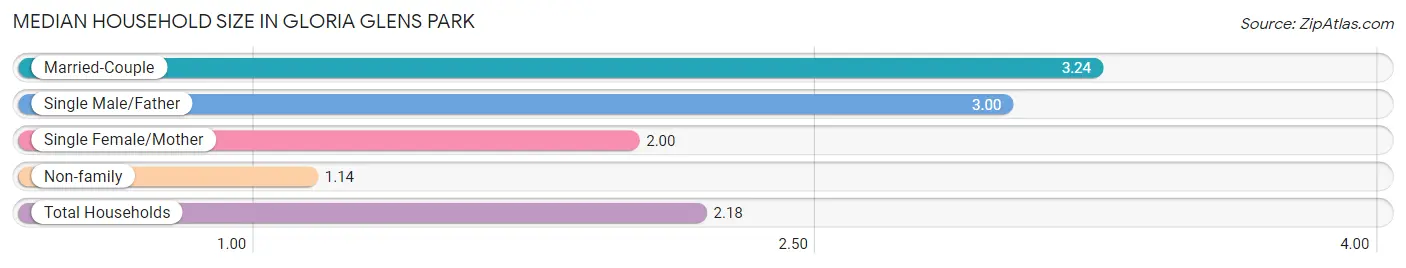
| Household Type | # Households | Household Size |
| Married-Couple | 88 (46.3%) | 3.24 |
| Single Male/Father | 4 (2.1%) | 3.00 |
| Single Female/Mother | 6 (3.2%) | 2.00 |
| Non-family | 92 (48.4%) | 1.14 |
| Total Households | 190 (100.0%) | 2.18 |
Household Size by Marriage Status in Gloria Glens Park
Out of a total of 190 households in Gloria Glens Park, 98 (51.6%) are family households, while 92 (48.4%) are nonfamily households. The most numerous type of family households are 2-person households, comprising 45, and the most common type of nonfamily households are 1-person households, comprising 82.
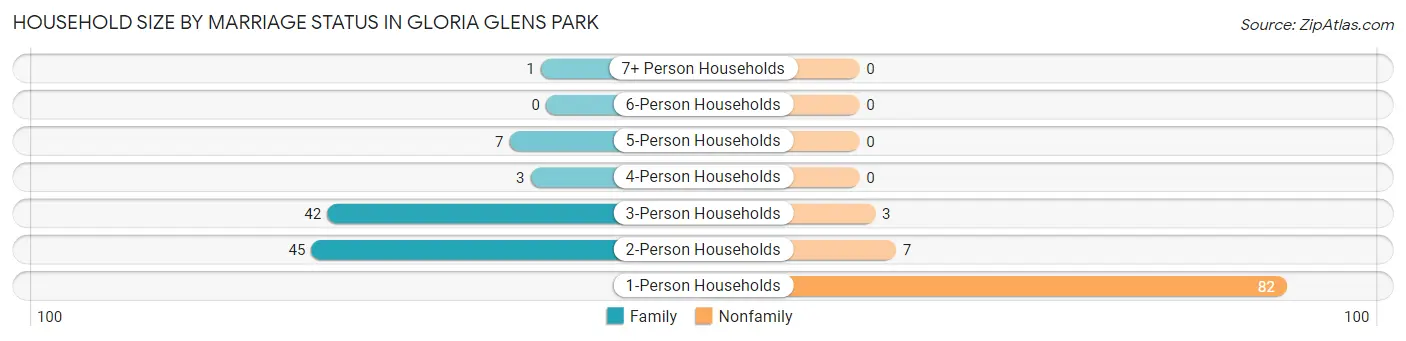
| Household Size | Family Households | Nonfamily Households |
| 1-Person Households | - | 82 (43.2%) |
| 2-Person Households | 45 (23.7%) | 7 (3.7%) |
| 3-Person Households | 42 (22.1%) | 3 (1.6%) |
| 4-Person Households | 3 (1.6%) | 0 (0.0%) |
| 5-Person Households | 7 (3.7%) | 0 (0.0%) |
| 6-Person Households | 0 (0.0%) | 0 (0.0%) |
| 7+ Person Households | 1 (0.5%) | 0 (0.0%) |
| Total | 98 (51.6%) | 92 (48.4%) |
Female Fertility in Gloria Glens Park
Fertility by Age in Gloria Glens Park
Average fertility rate in Gloria Glens Park is 68.0 births per 1,000 women. Women in the age bracket of 35 to 50 years have the highest fertility rate with 143.0 births per 1,000 women. Women in the age bracket of 35 to 50 years acount for 80.0% of all women with births.
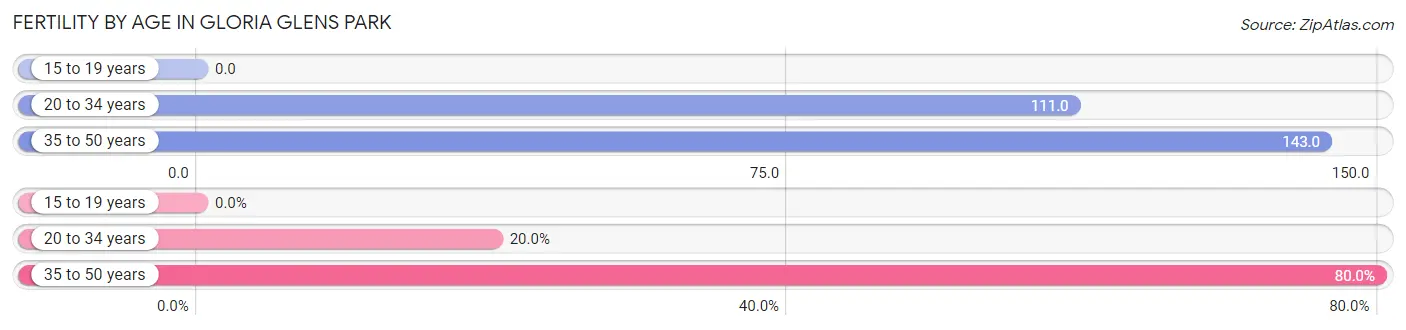
| Age Bracket | Women with Births | Births / 1,000 Women |
| 15 to 19 years | 0 (0.0%) | 0.0 |
| 20 to 34 years | 2 (20.0%) | 111.0 |
| 35 to 50 years | 8 (80.0%) | 143.0 |
| Total | 10 (100.0%) | 68.0 |
Fertility by Age by Marriage Status in Gloria Glens Park
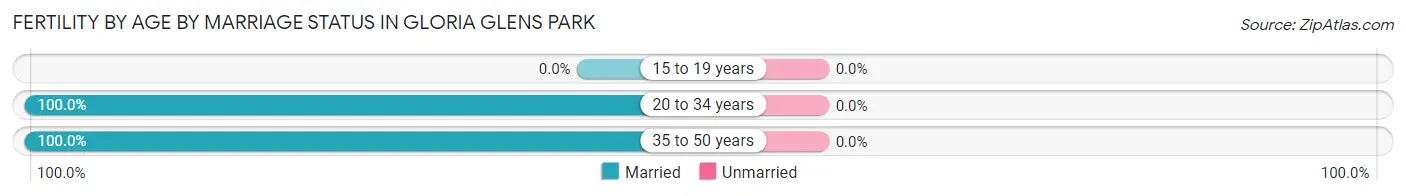
| Age Bracket | Married | Unmarried |
| 15 to 19 years | 0 (0.0%) | 0 (0.0%) |
| 20 to 34 years | 2 (100.0%) | 0 (0.0%) |
| 35 to 50 years | 8 (100.0%) | 0 (0.0%) |
| Total | 10 (100.0%) | 0 (0.0%) |
Fertility by Education in Gloria Glens Park
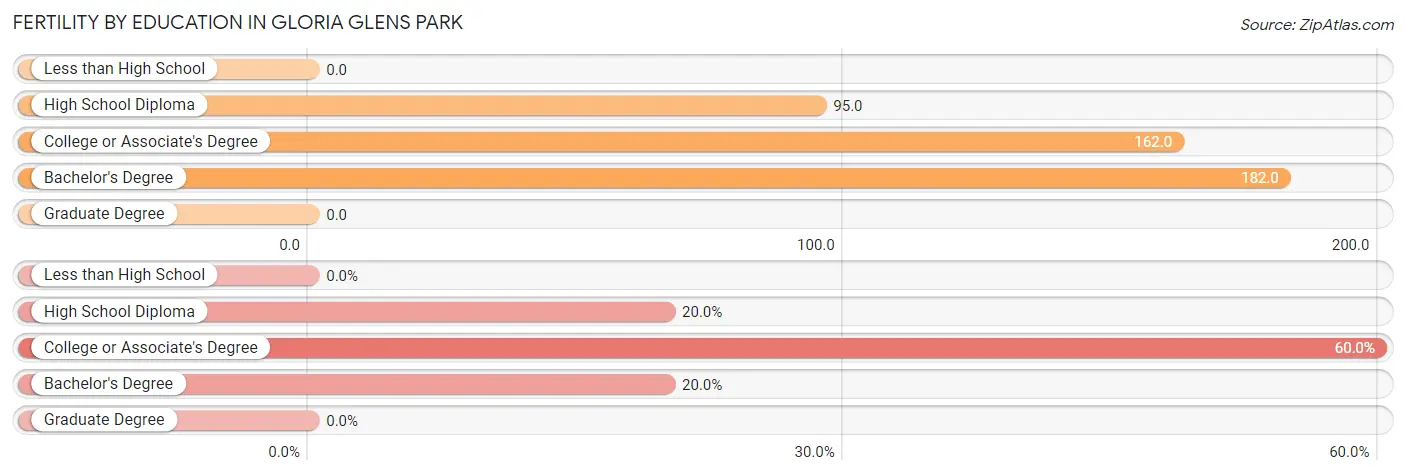
| Educational Attainment | Women with Births | Births / 1,000 Women |
| Less than High School | 0 (0.0%) | 0.0 |
| High School Diploma | 2 (20.0%) | 95.0 |
| College or Associate's Degree | 6 (60.0%) | 162.0 |
| Bachelor's Degree | 2 (20.0%) | 182.0 |
| Graduate Degree | 0 (0.0%) | 0.0 |
| Total | 10 (100.0%) | 68.0 |
Fertility by Education by Marriage Status in Gloria Glens Park
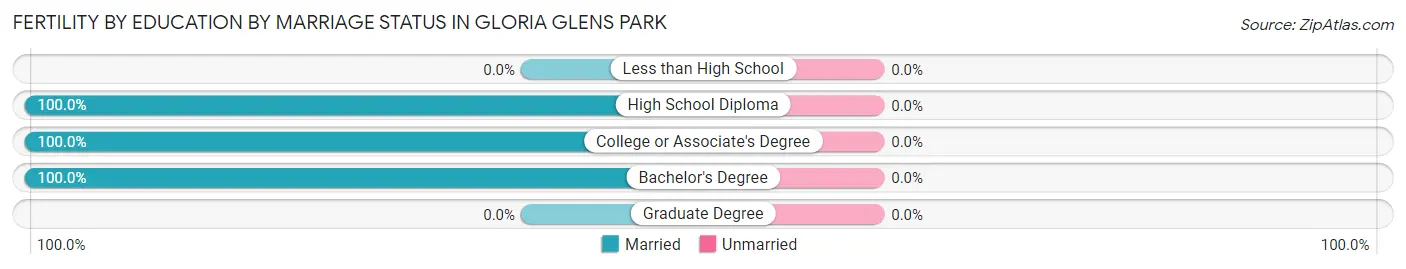
| Educational Attainment | Married | Unmarried |
| Less than High School | 0 (0.0%) | 0 (0.0%) |
| High School Diploma | 2 (100.0%) | 0 (0.0%) |
| College or Associate's Degree | 6 (100.0%) | 0 (0.0%) |
| Bachelor's Degree | 2 (100.0%) | 0 (0.0%) |
| Graduate Degree | 0 (0.0%) | 0 (0.0%) |
| Total | 10 (100.0%) | 0 (0.0%) |
Income in Gloria Glens Park
Income Overview in Gloria Glens Park
Per Capita Income in Gloria Glens Park is $32,774, while median incomes of families and households are $85,952 and $64,167 respectively.
| Characteristic | Number | Measure |
| Per Capita Income | 414 | $32,774 |
| Median Family Income | 98 | $85,952 |
| Mean Family Income | 98 | $88,033 |
| Median Household Income | 190 | $64,167 |
| Mean Household Income | 190 | $68,770 |
| Income Deficit | 98 | $0 |
| Wage / Income Gap (%) | 414 | 0.00% |
| Wage / Income Gap ($) | 414 | 100.00¢ per $1 |
| Gini / Inequality Index | 414 | 0.33 |
Earnings by Sex in Gloria Glens Park
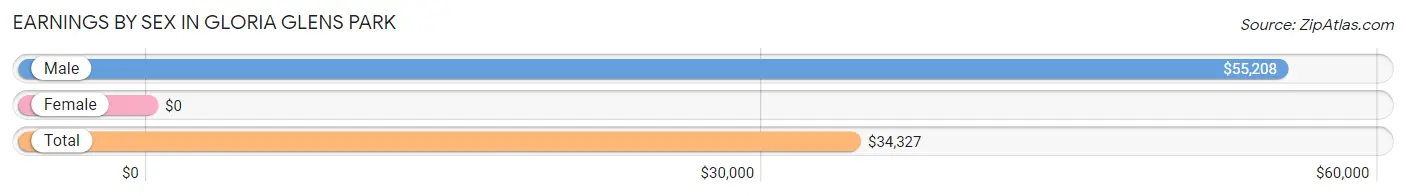
| Sex | Number | Average Earnings |
| Male | 134 (45.4%) | $55,208 |
| Female | 161 (54.6%) | $0 |
| Total | 295 (100.0%) | $34,327 |
Earnings by Sex by Income Bracket in Gloria Glens Park
The most common earnings brackets in Gloria Glens Park are $55,000 to $64,999 for men (27 | 20.2%) and $2,499 or less for women (61 | 37.9%).
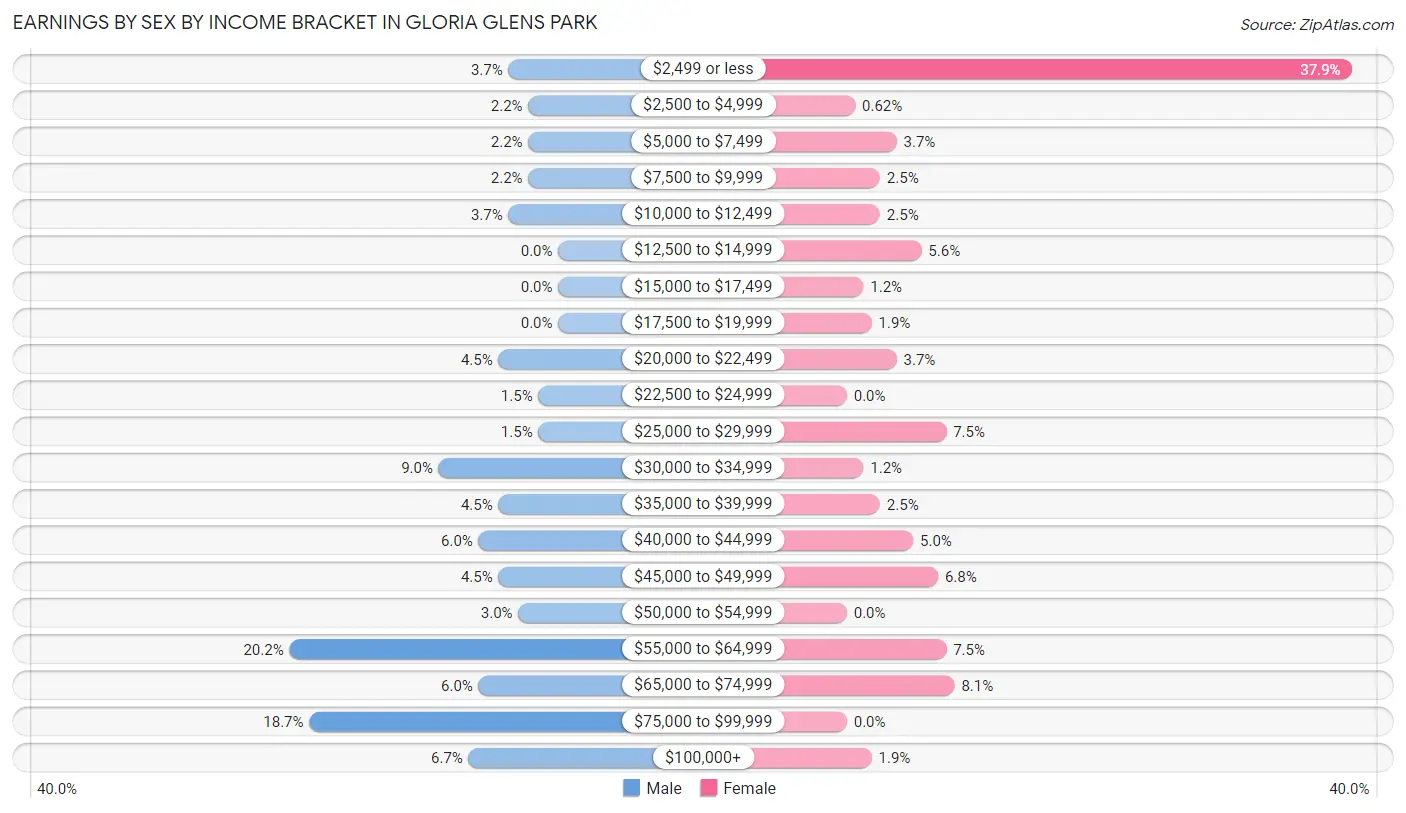
| Income | Male | Female |
| $2,499 or less | 5 (3.7%) | 61 (37.9%) |
| $2,500 to $4,999 | 3 (2.2%) | 1 (0.6%) |
| $5,000 to $7,499 | 3 (2.2%) | 6 (3.7%) |
| $7,500 to $9,999 | 3 (2.2%) | 4 (2.5%) |
| $10,000 to $12,499 | 5 (3.7%) | 4 (2.5%) |
| $12,500 to $14,999 | 0 (0.0%) | 9 (5.6%) |
| $15,000 to $17,499 | 0 (0.0%) | 2 (1.2%) |
| $17,500 to $19,999 | 0 (0.0%) | 3 (1.9%) |
| $20,000 to $22,499 | 6 (4.5%) | 6 (3.7%) |
| $22,500 to $24,999 | 2 (1.5%) | 0 (0.0%) |
| $25,000 to $29,999 | 2 (1.5%) | 12 (7.4%) |
| $30,000 to $34,999 | 12 (9.0%) | 2 (1.2%) |
| $35,000 to $39,999 | 6 (4.5%) | 4 (2.5%) |
| $40,000 to $44,999 | 8 (6.0%) | 8 (5.0%) |
| $45,000 to $49,999 | 6 (4.5%) | 11 (6.8%) |
| $50,000 to $54,999 | 4 (3.0%) | 0 (0.0%) |
| $55,000 to $64,999 | 27 (20.2%) | 12 (7.4%) |
| $65,000 to $74,999 | 8 (6.0%) | 13 (8.1%) |
| $75,000 to $99,999 | 25 (18.7%) | 0 (0.0%) |
| $100,000+ | 9 (6.7%) | 3 (1.9%) |
| Total | 134 (100.0%) | 161 (100.0%) |
Earnings by Sex by Educational Attainment in Gloria Glens Park
Average earnings in Gloria Glens Park are $56,302 for men and $41,000 for women, a difference of 27.2%. Men with an educational attainment of high school diploma enjoy the highest average annual earnings of $68,000, while those with less than high school education earn the least with $40,000. Women with an educational attainment of bachelor's degree earn the most with the average annual earnings of $49,375, while those with high school diploma education have the smallest earnings of $18,333.

| Educational Attainment | Male Income | Female Income |
| Less than High School | $40,000 | $0 |
| High School Diploma | $68,000 | $18,333 |
| College or Associate's Degree | $58,125 | $41,250 |
| Bachelor's Degree | $56,250 | $49,375 |
| Graduate Degree | - | - |
| Total | $56,302 | $41,000 |
Family Income in Gloria Glens Park
Family Income Brackets in Gloria Glens Park
According to the Gloria Glens Park family income data, there are 31 families falling into the $75,000 to $99,999 income range, which is the most common income bracket and makes up 31.6% of all families. Conversely, the less than $10,000 income bracket is the least frequent group with only 1 families (1.0%) belonging to this category.
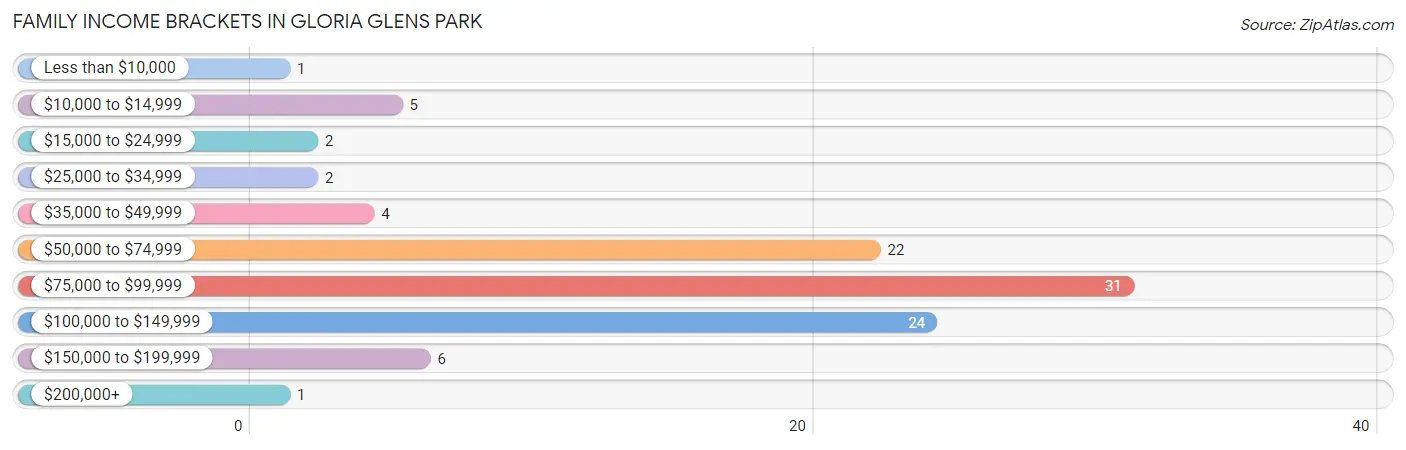
| Income Bracket | # Families | % Families |
| Less than $10,000 | 1 | 1.0% |
| $10,000 to $14,999 | 5 | 5.1% |
| $15,000 to $24,999 | 2 | 2.0% |
| $25,000 to $34,999 | 2 | 2.0% |
| $35,000 to $49,999 | 4 | 4.1% |
| $50,000 to $74,999 | 22 | 22.4% |
| $75,000 to $99,999 | 31 | 31.6% |
| $100,000 to $149,999 | 24 | 24.5% |
| $150,000 to $199,999 | 6 | 6.1% |
| $200,000+ | 1 | 1.0% |
Family Income by Famaliy Size in Gloria Glens Park
3-person families (40 | 40.8%) account for the highest median family income in Gloria Glens Park with $86,625 per family, while 2-person families (47 | 48.0%) have the highest median income of $31,719 per family member.
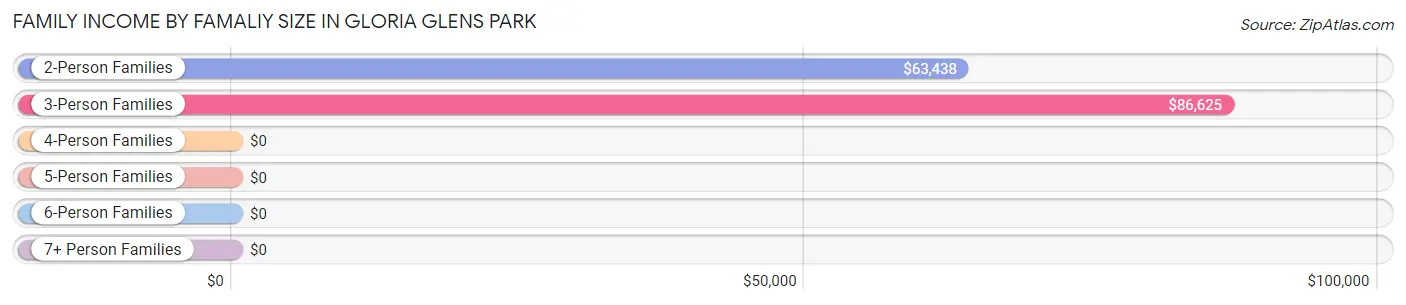
| Income Bracket | # Families | Median Income |
| 2-Person Families | 47 (48.0%) | $63,438 |
| 3-Person Families | 40 (40.8%) | $86,625 |
| 4-Person Families | 3 (3.1%) | $0 |
| 5-Person Families | 7 (7.1%) | $0 |
| 6-Person Families | 1 (1.0%) | $0 |
| 7+ Person Families | 0 (0.0%) | $0 |
| Total | 98 (100.0%) | $85,952 |
Family Income by Number of Earners in Gloria Glens Park
The median family income in Gloria Glens Park is $85,952, with families comprising 3+ earners (15) having the highest median family income of $122,292, while families with no earners (15) have the lowest median family income of $43,750, accounting for 15.3% and 15.3% of families, respectively.
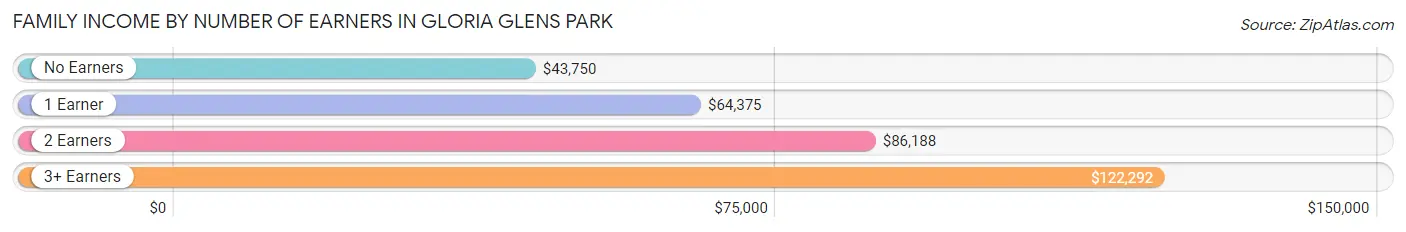
| Number of Earners | # Families | Median Income |
| No Earners | 15 (15.3%) | $43,750 |
| 1 Earner | 15 (15.3%) | $64,375 |
| 2 Earners | 53 (54.1%) | $86,188 |
| 3+ Earners | 15 (15.3%) | $122,292 |
| Total | 98 (100.0%) | $85,952 |
Household Income in Gloria Glens Park
Household Income Brackets in Gloria Glens Park
With 43 households falling in the category, the $75,000 to $99,999 income range is the most frequent in Gloria Glens Park, accounting for 22.6% of all households. In contrast, only 1 households (0.5%) fall into the $200,000+ income bracket, making it the least populous group.
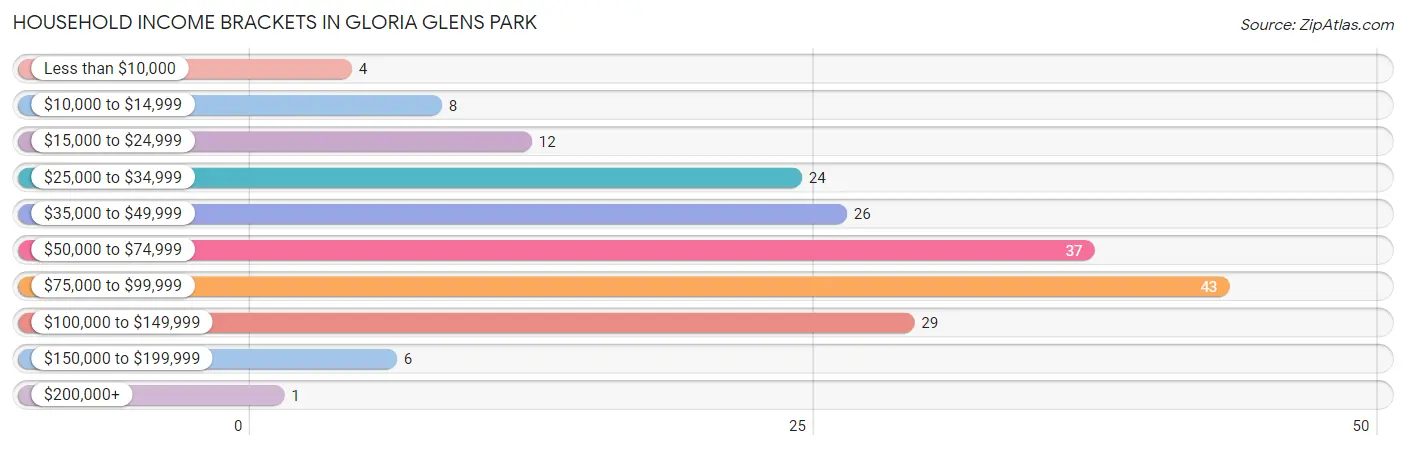
| Income Bracket | # Households | % Households |
| Less than $10,000 | 4 | 2.1% |
| $10,000 to $14,999 | 8 | 4.2% |
| $15,000 to $24,999 | 12 | 6.3% |
| $25,000 to $34,999 | 24 | 12.6% |
| $35,000 to $49,999 | 26 | 13.7% |
| $50,000 to $74,999 | 37 | 19.5% |
| $75,000 to $99,999 | 43 | 22.6% |
| $100,000 to $149,999 | 29 | 15.3% |
| $150,000 to $199,999 | 6 | 3.2% |
| $200,000+ | 1 | 0.5% |
Household Income by Householder Age in Gloria Glens Park
The median household income in Gloria Glens Park is $64,167, with the highest median household income of $82,250 found in the 45 to 64 years age bracket for the primary householder. A total of 83 households (43.7%) fall into this category. Meanwhile, the 15 to 24 years age bracket for the primary householder has the lowest median household income of $33,333, with 10 households (5.3%) in this group.
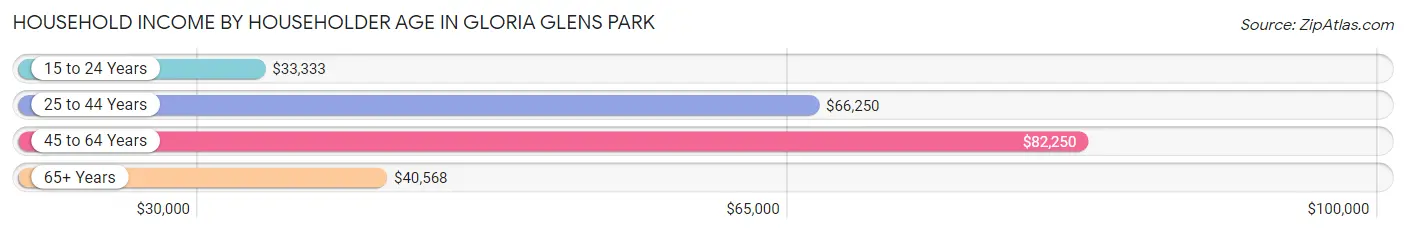
| Income Bracket | # Households | Median Income |
| 15 to 24 Years | 10 (5.3%) | $33,333 |
| 25 to 44 Years | 46 (24.2%) | $66,250 |
| 45 to 64 Years | 83 (43.7%) | $82,250 |
| 65+ Years | 51 (26.8%) | $40,568 |
| Total | 190 (100.0%) | $64,167 |
Poverty in Gloria Glens Park
Income Below Poverty by Sex and Age in Gloria Glens Park
With 8.5% poverty level for males and 7.1% for females among the residents of Gloria Glens Park, 18 to 24 year old males and 6 to 11 year old females are the most vulnerable to poverty, with 5 males (23.8%) and 1 females (100.0%) in their respective age groups living below the poverty level.
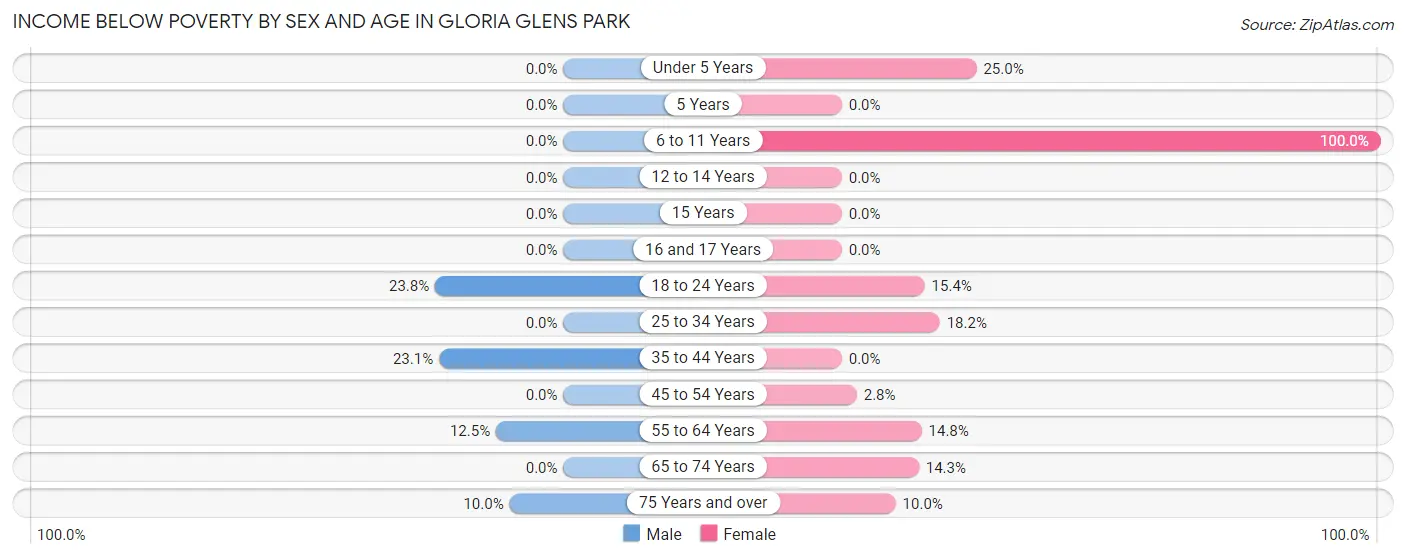
| Age Bracket | Male | Female |
| Under 5 Years | 0 (0.0%) | 1 (25.0%) |
| 5 Years | 0 (0.0%) | 0 (0.0%) |
| 6 to 11 Years | 0 (0.0%) | 1 (100.0%) |
| 12 to 14 Years | 0 (0.0%) | 0 (0.0%) |
| 15 Years | 0 (0.0%) | 0 (0.0%) |
| 16 and 17 Years | 0 (0.0%) | 0 (0.0%) |
| 18 to 24 Years | 5 (23.8%) | 2 (15.4%) |
| 25 to 34 Years | 0 (0.0%) | 2 (18.2%) |
| 35 to 44 Years | 6 (23.1%) | 0 (0.0%) |
| 45 to 54 Years | 0 (0.0%) | 1 (2.8%) |
| 55 to 64 Years | 3 (12.5%) | 4 (14.8%) |
| 65 to 74 Years | 0 (0.0%) | 5 (14.3%) |
| 75 Years and over | 1 (10.0%) | 1 (10.0%) |
| Total | 15 (8.5%) | 17 (7.1%) |
Income Above Poverty by Sex and Age in Gloria Glens Park
According to the poverty statistics in Gloria Glens Park, males aged under 5 years and females aged 16 and 17 years are the age groups that are most secure financially, with 100.0% of males and 100.0% of females in these age groups living above the poverty line.
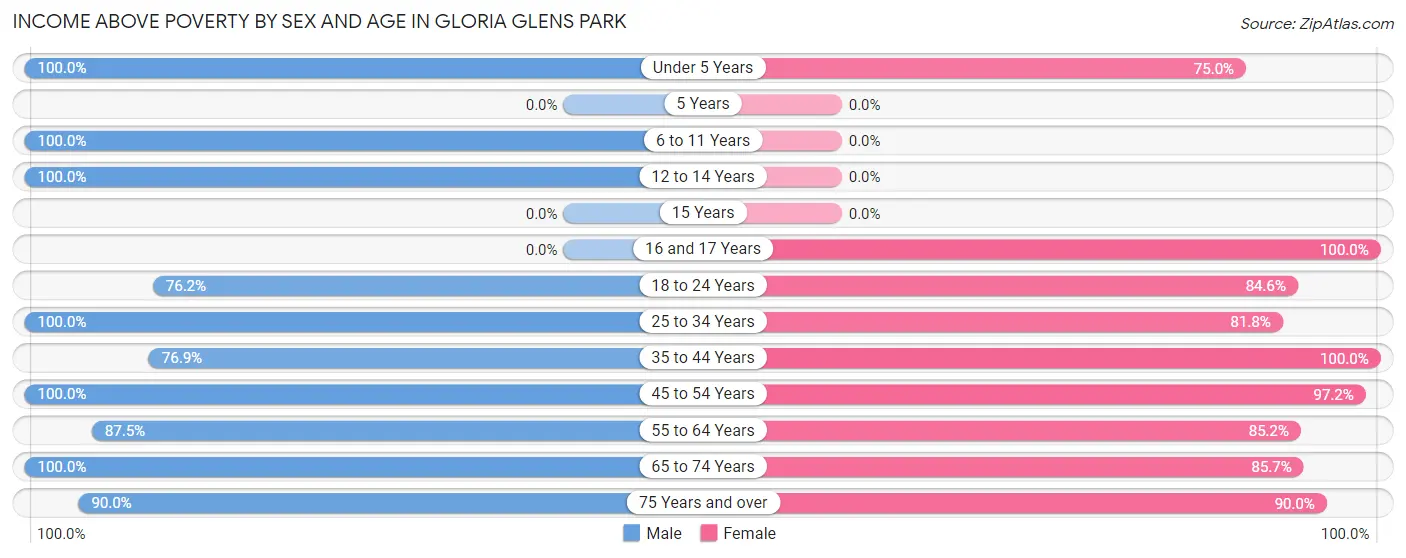
| Age Bracket | Male | Female |
| Under 5 Years | 6 (100.0%) | 3 (75.0%) |
| 5 Years | 0 (0.0%) | 0 (0.0%) |
| 6 to 11 Years | 3 (100.0%) | 0 (0.0%) |
| 12 to 14 Years | 2 (100.0%) | 0 (0.0%) |
| 15 Years | 0 (0.0%) | 0 (0.0%) |
| 16 and 17 Years | 0 (0.0%) | 67 (100.0%) |
| 18 to 24 Years | 16 (76.2%) | 11 (84.6%) |
| 25 to 34 Years | 14 (100.0%) | 9 (81.8%) |
| 35 to 44 Years | 20 (76.9%) | 34 (100.0%) |
| 45 to 54 Years | 53 (100.0%) | 35 (97.2%) |
| 55 to 64 Years | 21 (87.5%) | 23 (85.2%) |
| 65 to 74 Years | 17 (100.0%) | 30 (85.7%) |
| 75 Years and over | 9 (90.0%) | 9 (90.0%) |
| Total | 161 (91.5%) | 221 (92.9%) |
Income Below Poverty Among Married-Couple Families in Gloria Glens Park
The poverty statistics for married-couple families in Gloria Glens Park show that 3.4% or 3 of the total 88 families live below the poverty line. Families with no children have the highest poverty rate of 6.2%, comprising of 3 families. On the other hand, families with 1 or 2 children have the lowest poverty rate of 0.0%, which includes 0 families.
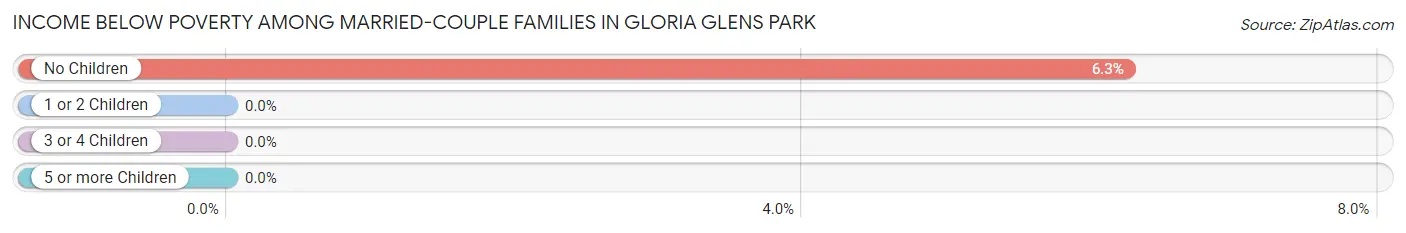
| Children | Above Poverty | Below Poverty |
| No Children | 45 (93.8%) | 3 (6.2%) |
| 1 or 2 Children | 39 (100.0%) | 0 (0.0%) |
| 3 or 4 Children | 1 (100.0%) | 0 (0.0%) |
| 5 or more Children | 0 (0.0%) | 0 (0.0%) |
| Total | 85 (96.6%) | 3 (3.4%) |
Income Below Poverty Among Single-Parent Households in Gloria Glens Park
According to the poverty data in Gloria Glens Park, 25.0% or 1 single-father households and 33.3% or 2 single-mother households are living below the poverty line. Among single-father households, those with 1 or 2 children have the highest poverty rate, with 1 households (33.3%) experiencing poverty. Likewise, among single-mother households, those with 1 or 2 children have the highest poverty rate, with 2 households (100.0%) falling below the poverty line.
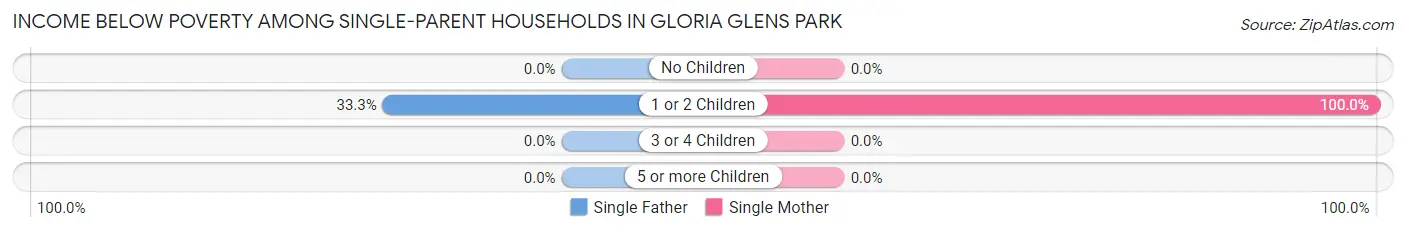
| Children | Single Father | Single Mother |
| No Children | 0 (0.0%) | 0 (0.0%) |
| 1 or 2 Children | 1 (33.3%) | 2 (100.0%) |
| 3 or 4 Children | 0 (0.0%) | 0 (0.0%) |
| 5 or more Children | 0 (0.0%) | 0 (0.0%) |
| Total | 1 (25.0%) | 2 (33.3%) |
Income Below Poverty Among Married-Couple vs Single-Parent Households in Gloria Glens Park
The poverty data for Gloria Glens Park shows that 3 of the married-couple family households (3.4%) and 3 of the single-parent households (30.0%) are living below the poverty level. Within the married-couple family households, those with no children have the highest poverty rate, with 3 households (6.2%) falling below the poverty line. Among the single-parent households, those with 1 or 2 children have the highest poverty rate, with 3 household (60.0%) living below poverty.
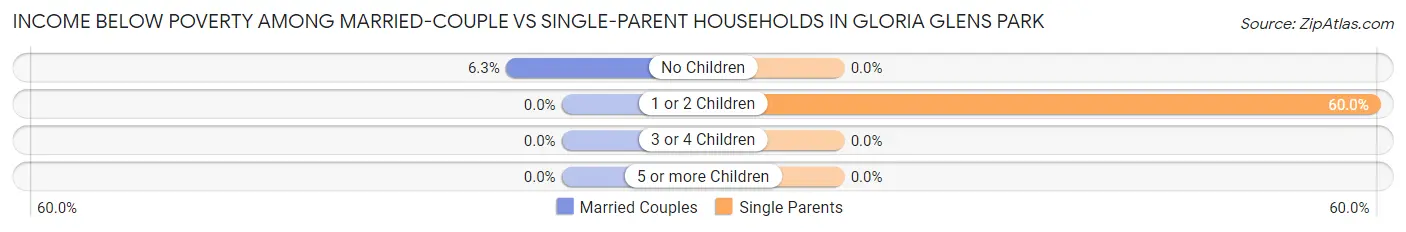
| Children | Married-Couple Families | Single-Parent Households |
| No Children | 3 (6.2%) | 0 (0.0%) |
| 1 or 2 Children | 0 (0.0%) | 3 (60.0%) |
| 3 or 4 Children | 0 (0.0%) | 0 (0.0%) |
| 5 or more Children | 0 (0.0%) | 0 (0.0%) |
| Total | 3 (3.4%) | 3 (30.0%) |
Employment Characteristics in Gloria Glens Park
Employment by Class of Employer in Gloria Glens Park
Among the 274 employed individuals in Gloria Glens Park, private company employees (148 | 54.0%), self-employed (incorporated) (56 | 20.4%), and self-employed (not incorporated) (39 | 14.2%) make up the most common classes of employment.
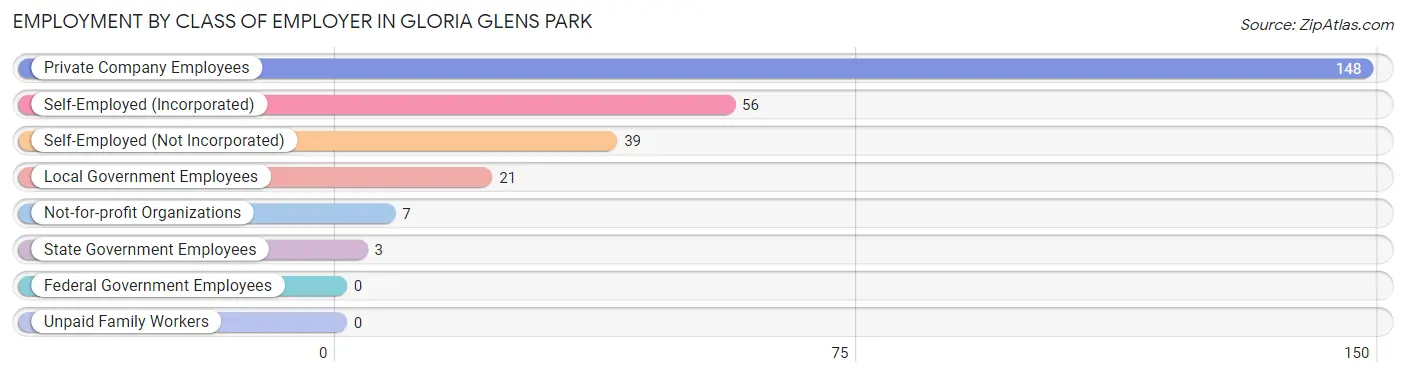
| Employer Class | # Employees | % Employees |
| Private Company Employees | 148 | 54.0% |
| Self-Employed (Incorporated) | 56 | 20.4% |
| Self-Employed (Not Incorporated) | 39 | 14.2% |
| Not-for-profit Organizations | 7 | 2.5% |
| Local Government Employees | 21 | 7.7% |
| State Government Employees | 3 | 1.1% |
| Federal Government Employees | 0 | 0.0% |
| Unpaid Family Workers | 0 | 0.0% |
| Total | 274 | 100.0% |
Employment Status by Age in Gloria Glens Park
According to the labor force statistics for Gloria Glens Park, out of the total population over 16 years of age (398), 74.6% or 297 individuals are in the labor force, with 6.1% or 18 of them unemployed. The age group with the highest labor force participation rate is 20 to 24 years, with 100.0% or 28 individuals in the labor force. Within the labor force, the 30 to 34 years age range has the highest percentage of unemployed individuals, with 21.4% or 3 of them being unemployed.
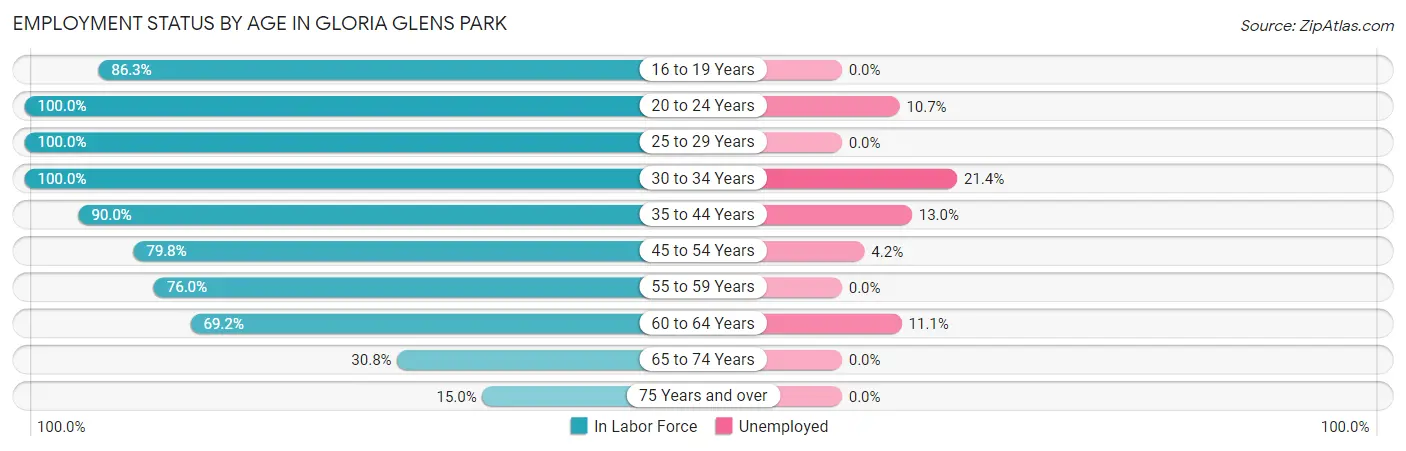
| Age Bracket | In Labor Force | Unemployed |
| 16 to 19 Years | 63 (86.3%) | 0 (0.0%) |
| 20 to 24 Years | 28 (100.0%) | 3 (10.7%) |
| 25 to 29 Years | 11 (100.0%) | 0 (0.0%) |
| 30 to 34 Years | 14 (100.0%) | 3 (21.4%) |
| 35 to 44 Years | 54 (90.0%) | 7 (13.0%) |
| 45 to 54 Years | 71 (79.8%) | 3 (4.2%) |
| 55 to 59 Years | 19 (76.0%) | 0 (0.0%) |
| 60 to 64 Years | 18 (69.2%) | 2 (11.1%) |
| 65 to 74 Years | 16 (30.8%) | 0 (0.0%) |
| 75 Years and over | 3 (15.0%) | 0 (0.0%) |
| Total | 297 (74.6%) | 18 (6.1%) |
Employment Status by Educational Attainment in Gloria Glens Park
According to labor force statistics for Gloria Glens Park, 83.1% of individuals (187) out of the total population between 25 and 64 years of age (225) are in the labor force, with 8.0% or 15 of them being unemployed. The group with the highest labor force participation rate are those with the educational attainment of bachelor's degree or higher, with 94.5% or 52 individuals in the labor force. Within the labor force, individuals with less than high school education have the highest percentage of unemployment, with 18.2% or 2 of them being unemployed.
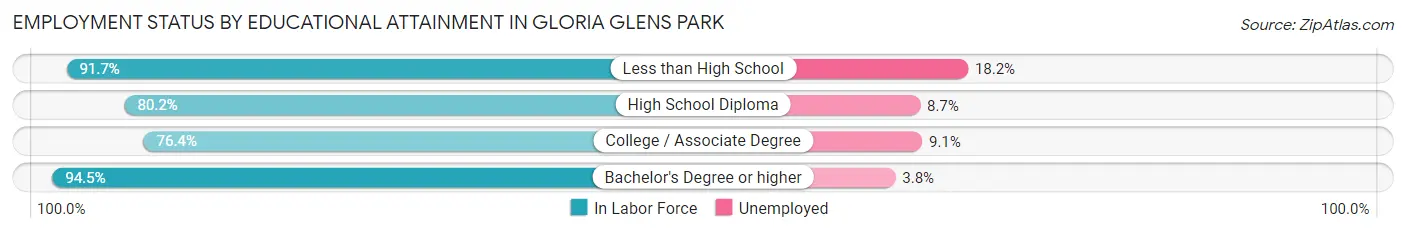
| Educational Attainment | In Labor Force | Unemployed |
| Less than High School | 11 (91.7%) | 2 (18.2%) |
| High School Diploma | 69 (80.2%) | 7 (8.7%) |
| College / Associate Degree | 55 (76.4%) | 7 (9.1%) |
| Bachelor's Degree or higher | 52 (94.5%) | 2 (3.8%) |
| Total | 187 (83.1%) | 18 (8.0%) |
Employment Occupations by Sex in Gloria Glens Park
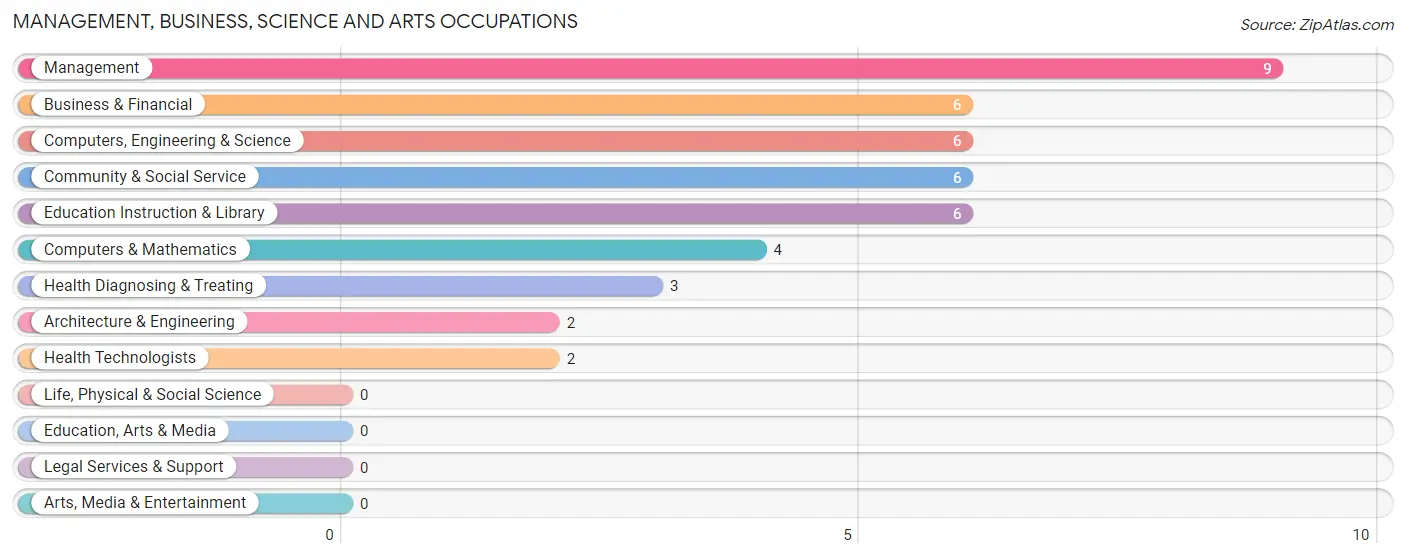
Management, Business, Science and Arts Occupations
The most common Management, Business, Science and Arts occupations in Gloria Glens Park are Management (9 | 3.2%), Business & Financial (6 | 2.1%), Computers, Engineering & Science (6 | 2.1%), Community & Social Service (6 | 2.1%), and Education Instruction & Library (6 | 2.1%).
Management, Business, Science and Arts Occupations by Sex
Within the Management, Business, Science and Arts occupations in Gloria Glens Park, the most male-oriented occupations are Architecture & Engineering (100.0%), Management (77.8%), and Business & Financial (66.7%), while the most female-oriented occupations are Computers & Mathematics (100.0%), Health Technologists (100.0%), and Computers, Engineering & Science (66.7%).
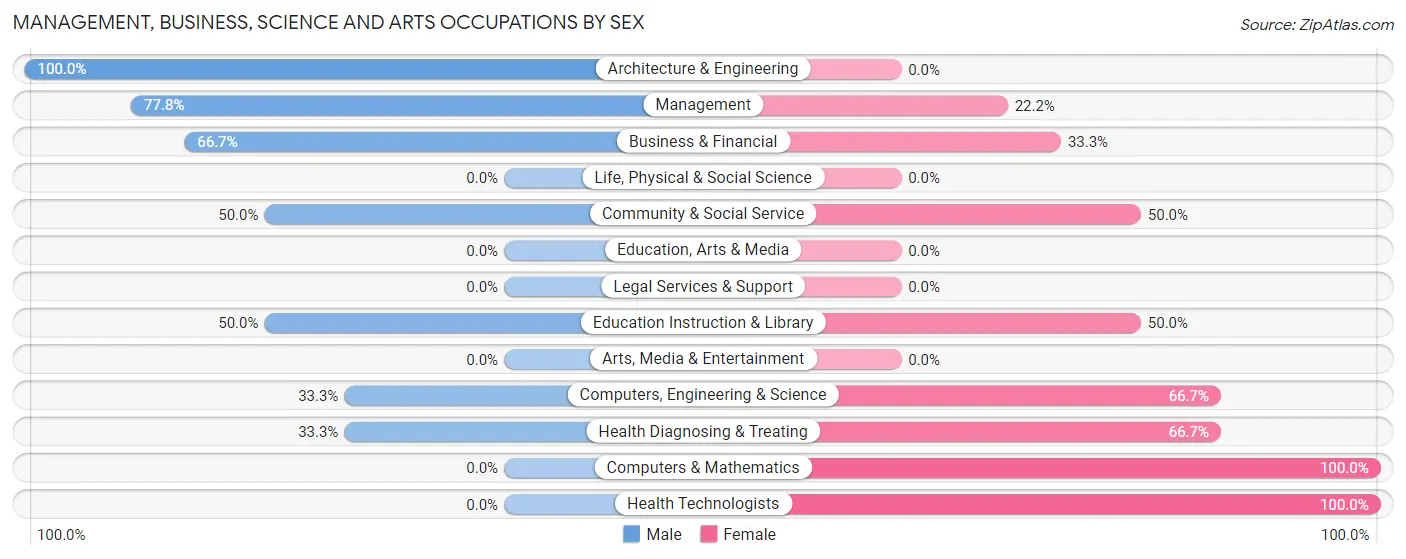
| Occupation | Male | Female |
| Management | 7 (77.8%) | 2 (22.2%) |
| Business & Financial | 4 (66.7%) | 2 (33.3%) |
| Computers, Engineering & Science | 2 (33.3%) | 4 (66.7%) |
| Computers & Mathematics | 0 (0.0%) | 4 (100.0%) |
| Architecture & Engineering | 2 (100.0%) | 0 (0.0%) |
| Life, Physical & Social Science | 0 (0.0%) | 0 (0.0%) |
| Community & Social Service | 3 (50.0%) | 3 (50.0%) |
| Education, Arts & Media | 0 (0.0%) | 0 (0.0%) |
| Legal Services & Support | 0 (0.0%) | 0 (0.0%) |
| Education Instruction & Library | 3 (50.0%) | 3 (50.0%) |
| Arts, Media & Entertainment | 0 (0.0%) | 0 (0.0%) |
| Health Diagnosing & Treating | 1 (33.3%) | 2 (66.7%) |
| Health Technologists | 0 (0.0%) | 2 (100.0%) |
| Total (Category) | 17 (56.7%) | 13 (43.3%) |
| Total (Overall) | 127 (45.5%) | 152 (54.5%) |
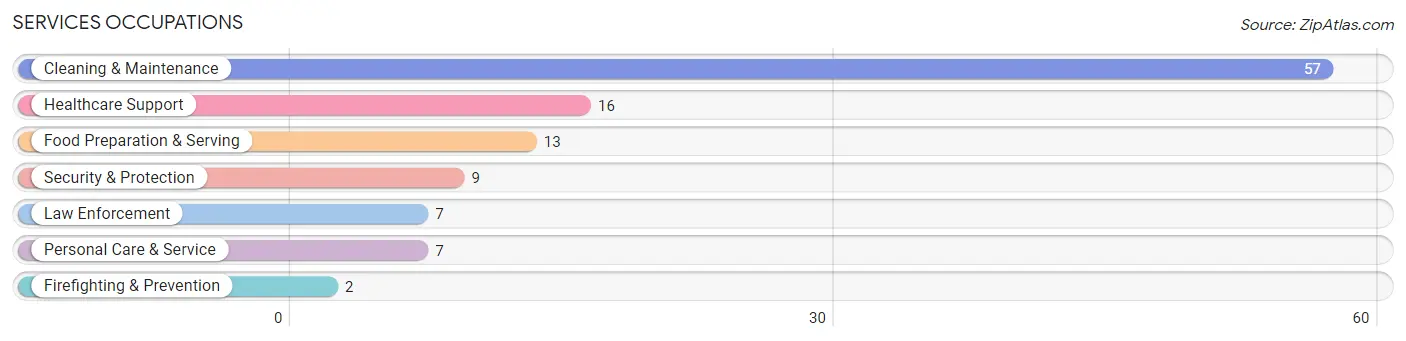
Services Occupations
The most common Services occupations in Gloria Glens Park are Cleaning & Maintenance (57 | 20.4%), Healthcare Support (16 | 5.7%), Food Preparation & Serving (13 | 4.7%), Security & Protection (9 | 3.2%), and Law Enforcement (7 | 2.5%).
Services Occupations by Sex
Within the Services occupations in Gloria Glens Park, the most male-oriented occupations are Firefighting & Prevention (100.0%), Security & Protection (77.8%), and Law Enforcement (71.4%), while the most female-oriented occupations are Healthcare Support (100.0%), Personal Care & Service (100.0%), and Cleaning & Maintenance (94.7%).
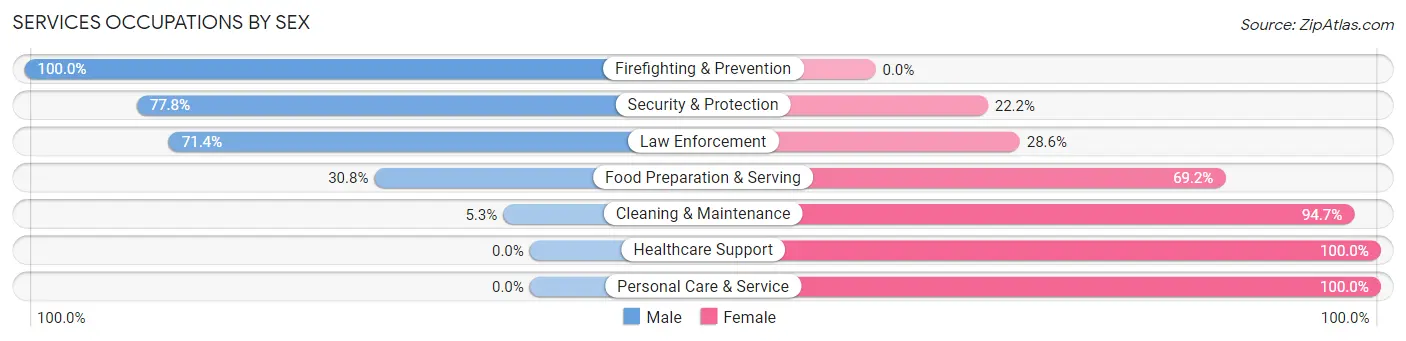
| Occupation | Male | Female |
| Healthcare Support | 0 (0.0%) | 16 (100.0%) |
| Security & Protection | 7 (77.8%) | 2 (22.2%) |
| Firefighting & Prevention | 2 (100.0%) | 0 (0.0%) |
| Law Enforcement | 5 (71.4%) | 2 (28.6%) |
| Food Preparation & Serving | 4 (30.8%) | 9 (69.2%) |
| Cleaning & Maintenance | 3 (5.3%) | 54 (94.7%) |
| Personal Care & Service | 0 (0.0%) | 7 (100.0%) |
| Total (Category) | 14 (13.7%) | 88 (86.3%) |
| Total (Overall) | 127 (45.5%) | 152 (54.5%) |
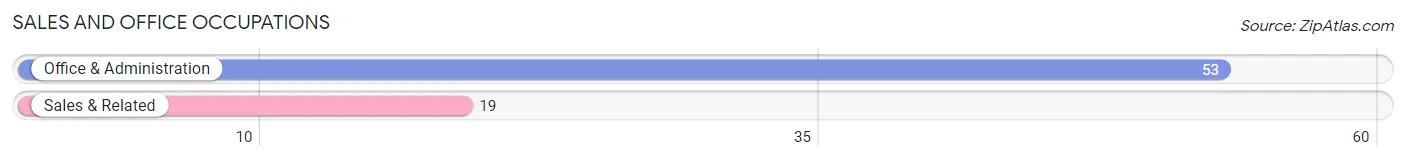
Sales and Office Occupations
The most common Sales and Office occupations in Gloria Glens Park are Office & Administration (53 | 19.0%), and Sales & Related (19 | 6.8%).
Sales and Office Occupations by Sex
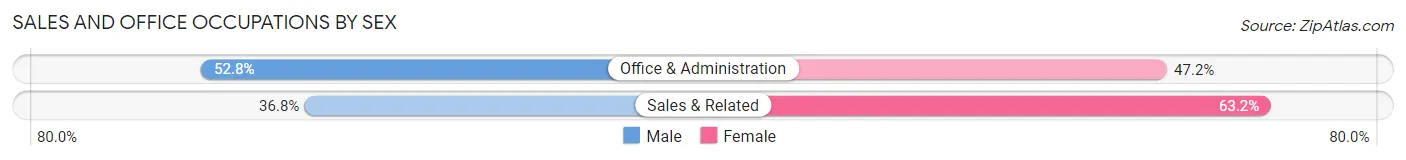
| Occupation | Male | Female |
| Sales & Related | 7 (36.8%) | 12 (63.2%) |
| Office & Administration | 28 (52.8%) | 25 (47.2%) |
| Total (Category) | 35 (48.6%) | 37 (51.4%) |
| Total (Overall) | 127 (45.5%) | 152 (54.5%) |
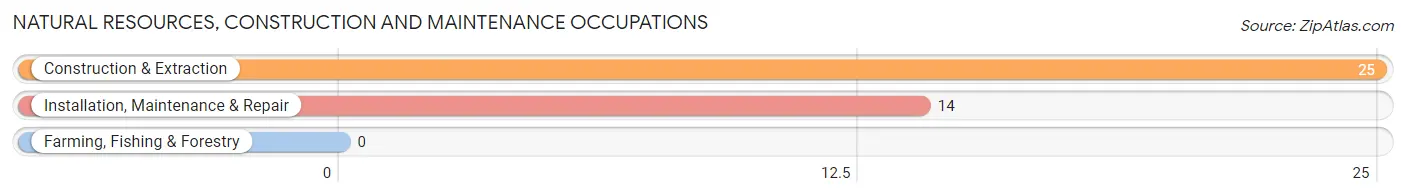
Natural Resources, Construction and Maintenance Occupations
The most common Natural Resources, Construction and Maintenance occupations in Gloria Glens Park are Construction & Extraction (25 | 9.0%), and Installation, Maintenance & Repair (14 | 5.0%).
Natural Resources, Construction and Maintenance Occupations by Sex
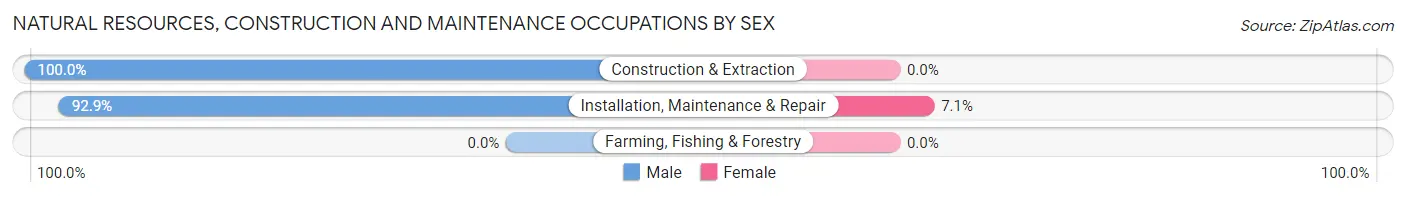
| Occupation | Male | Female |
| Farming, Fishing & Forestry | 0 (0.0%) | 0 (0.0%) |
| Construction & Extraction | 25 (100.0%) | 0 (0.0%) |
| Installation, Maintenance & Repair | 13 (92.9%) | 1 (7.1%) |
| Total (Category) | 38 (97.4%) | 1 (2.6%) |
| Total (Overall) | 127 (45.5%) | 152 (54.5%) |
Production, Transportation and Moving Occupations
The most common Production, Transportation and Moving occupations in Gloria Glens Park are Production (16 | 5.7%), Material Moving (11 | 3.9%), and Transportation (9 | 3.2%).
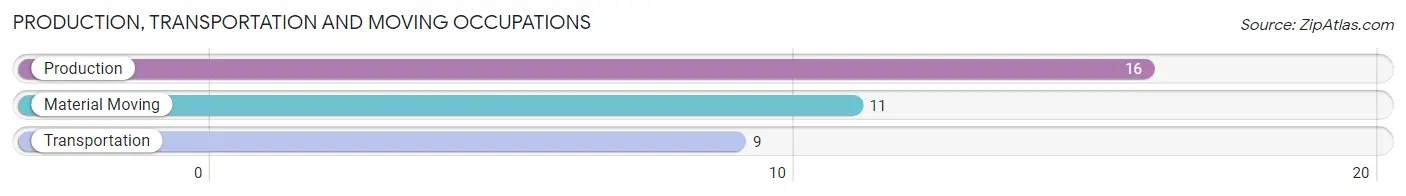
Production, Transportation and Moving Occupations by Sex
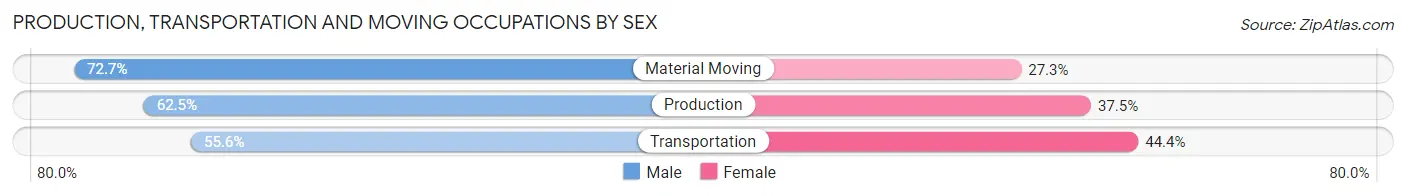
| Occupation | Male | Female |
| Production | 10 (62.5%) | 6 (37.5%) |
| Transportation | 5 (55.6%) | 4 (44.4%) |
| Material Moving | 8 (72.7%) | 3 (27.3%) |
| Total (Category) | 23 (63.9%) | 13 (36.1%) |
| Total (Overall) | 127 (45.5%) | 152 (54.5%) |
Employment Industries by Sex in Gloria Glens Park
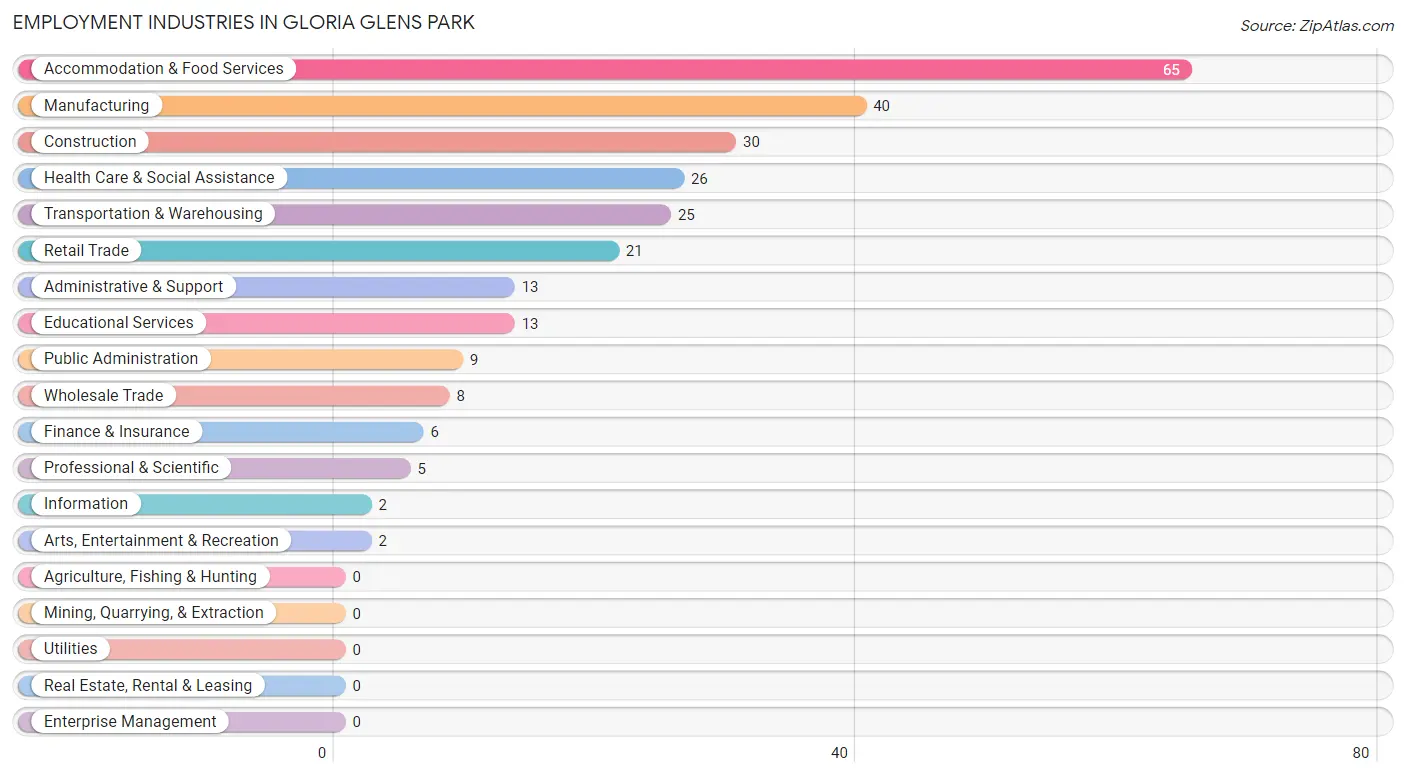
Employment Industries in Gloria Glens Park
The major employment industries in Gloria Glens Park include Accommodation & Food Services (65 | 23.3%), Manufacturing (40 | 14.3%), Construction (30 | 10.7%), Health Care & Social Assistance (26 | 9.3%), and Transportation & Warehousing (25 | 9.0%).
Employment Industries by Sex in Gloria Glens Park
The Gloria Glens Park industries that see more men than women are Construction (100.0%), Information (100.0%), and Administrative & Support (92.3%), whereas the industries that tend to have a higher number of women are Professional & Scientific (100.0%), Arts, Entertainment & Recreation (100.0%), and Accommodation & Food Services (93.9%).
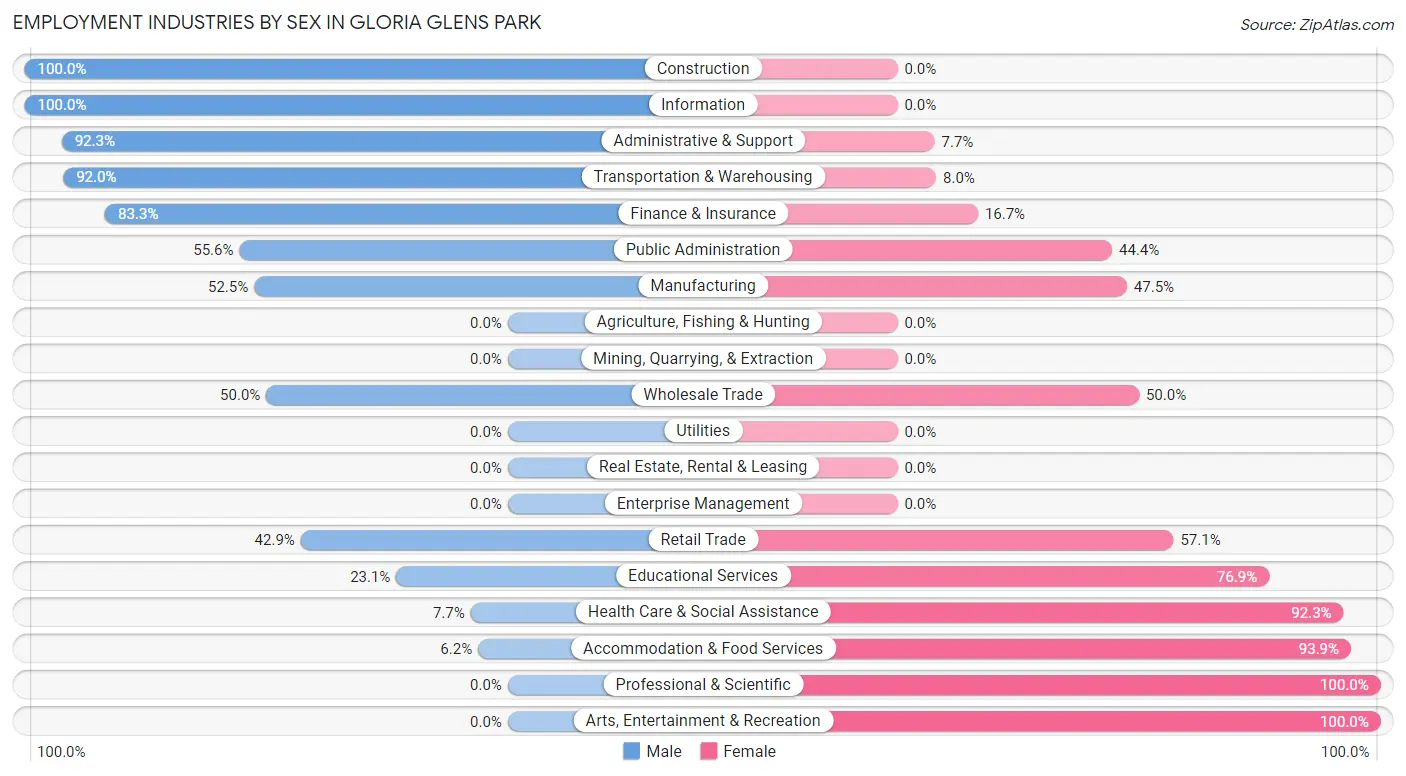
| Industry | Male | Female |
| Agriculture, Fishing & Hunting | 0 (0.0%) | 0 (0.0%) |
| Mining, Quarrying, & Extraction | 0 (0.0%) | 0 (0.0%) |
| Construction | 30 (100.0%) | 0 (0.0%) |
| Manufacturing | 21 (52.5%) | 19 (47.5%) |
| Wholesale Trade | 4 (50.0%) | 4 (50.0%) |
| Retail Trade | 9 (42.9%) | 12 (57.1%) |
| Transportation & Warehousing | 23 (92.0%) | 2 (8.0%) |
| Utilities | 0 (0.0%) | 0 (0.0%) |
| Information | 2 (100.0%) | 0 (0.0%) |
| Finance & Insurance | 5 (83.3%) | 1 (16.7%) |
| Real Estate, Rental & Leasing | 0 (0.0%) | 0 (0.0%) |
| Professional & Scientific | 0 (0.0%) | 5 (100.0%) |
| Enterprise Management | 0 (0.0%) | 0 (0.0%) |
| Administrative & Support | 12 (92.3%) | 1 (7.7%) |
| Educational Services | 3 (23.1%) | 10 (76.9%) |
| Health Care & Social Assistance | 2 (7.7%) | 24 (92.3%) |
| Arts, Entertainment & Recreation | 0 (0.0%) | 2 (100.0%) |
| Accommodation & Food Services | 4 (6.1%) | 61 (93.9%) |
| Public Administration | 5 (55.6%) | 4 (44.4%) |
| Total | 127 (45.5%) | 152 (54.5%) |
Education in Gloria Glens Park
School Enrollment in Gloria Glens Park
The most common levels of schooling among the 84 students in Gloria Glens Park are high school (72 | 85.7%), college / undergraduate (6 | 7.1%), and middle school (4 | 4.8%).
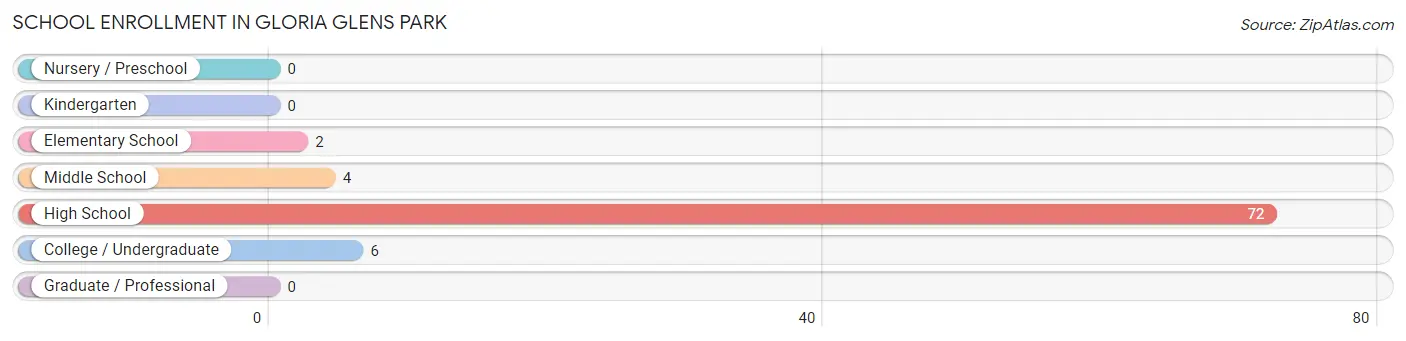
| School Level | # Students | % Students |
| Nursery / Preschool | 0 | 0.0% |
| Kindergarten | 0 | 0.0% |
| Elementary School | 2 | 2.4% |
| Middle School | 4 | 4.8% |
| High School | 72 | 85.7% |
| College / Undergraduate | 6 | 7.1% |
| Graduate / Professional | 0 | 0.0% |
| Total | 84 | 100.0% |
School Enrollment by Age by Funding Source in Gloria Glens Park
Out of a total of 84 students who are enrolled in schools in Gloria Glens Park, 1 (1.2%) attend a private institution, while the remaining 83 (98.8%) are enrolled in public schools. The age group of 15 to 17 year olds has the highest likelihood of being enrolled in private schools, with 1 (1.5% in the age bracket) enrolled. Conversely, the age group of 10 to 14 year olds has the lowest likelihood of being enrolled in a private school, with 6 (100.0% in the age bracket) attending a public institution.
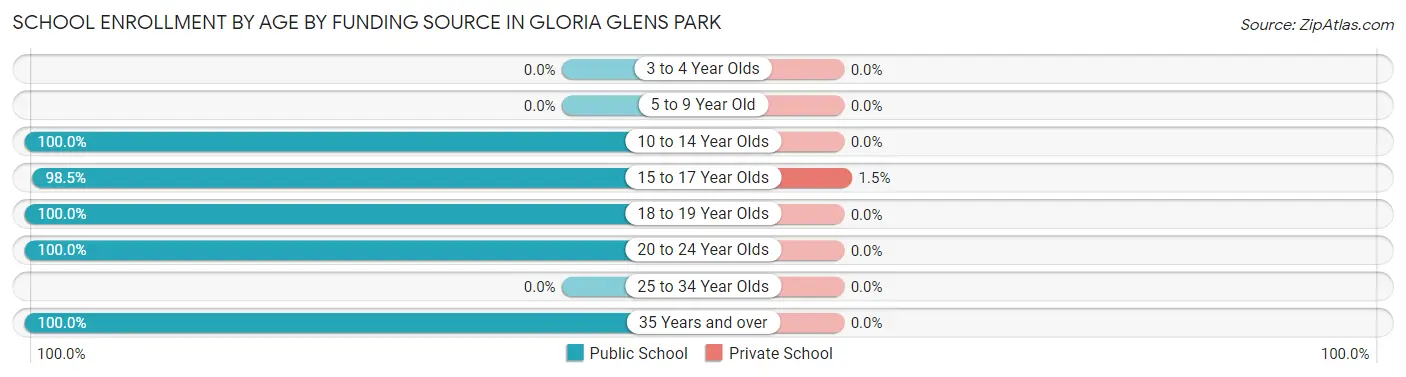
| Age Bracket | Public School | Private School |
| 3 to 4 Year Olds | 0 (0.0%) | 0 (0.0%) |
| 5 to 9 Year Old | 0 (0.0%) | 0 (0.0%) |
| 10 to 14 Year Olds | 6 (100.0%) | 0 (0.0%) |
| 15 to 17 Year Olds | 66 (98.5%) | 1 (1.5%) |
| 18 to 19 Year Olds | 5 (100.0%) | 0 (0.0%) |
| 20 to 24 Year Olds | 4 (100.0%) | 0 (0.0%) |
| 25 to 34 Year Olds | 0 (0.0%) | 0 (0.0%) |
| 35 Years and over | 2 (100.0%) | 0 (0.0%) |
| Total | 83 (98.8%) | 1 (1.2%) |
Educational Attainment by Field of Study in Gloria Glens Park
Arts & humanities (25 | 35.2%), education (15 | 21.1%), business (6 | 8.5%), communications (6 | 8.5%), and social sciences (4 | 5.6%) are the most common fields of study among 71 individuals in Gloria Glens Park who have obtained a bachelor's degree or higher.
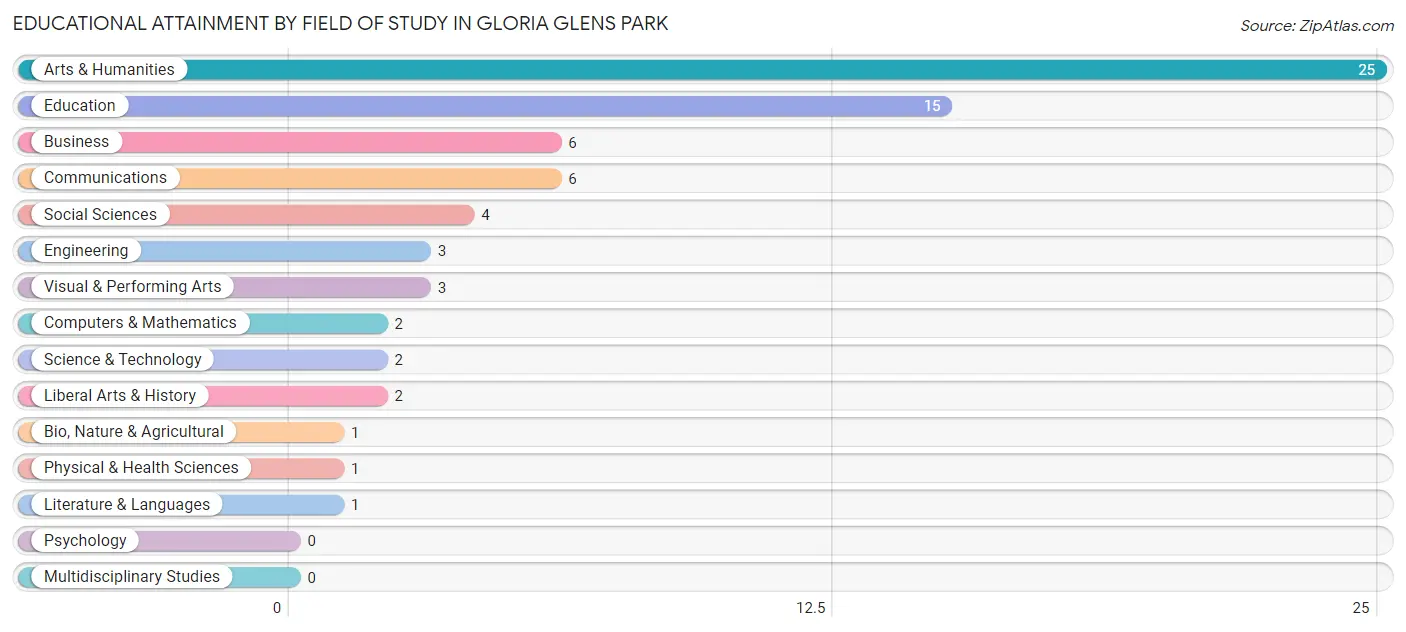
| Field of Study | # Graduates | % Graduates |
| Computers & Mathematics | 2 | 2.8% |
| Bio, Nature & Agricultural | 1 | 1.4% |
| Physical & Health Sciences | 1 | 1.4% |
| Psychology | 0 | 0.0% |
| Social Sciences | 4 | 5.6% |
| Engineering | 3 | 4.2% |
| Multidisciplinary Studies | 0 | 0.0% |
| Science & Technology | 2 | 2.8% |
| Business | 6 | 8.5% |
| Education | 15 | 21.1% |
| Literature & Languages | 1 | 1.4% |
| Liberal Arts & History | 2 | 2.8% |
| Visual & Performing Arts | 3 | 4.2% |
| Communications | 6 | 8.5% |
| Arts & Humanities | 25 | 35.2% |
| Total | 71 | 100.0% |
Transportation & Commute in Gloria Glens Park
Vehicle Availability by Sex in Gloria Glens Park
The most prevalent vehicle ownership categories in Gloria Glens Park are males with 2 vehicles (68, accounting for 53.5%) and females with 2 vehicles (89, making up 46.3%).
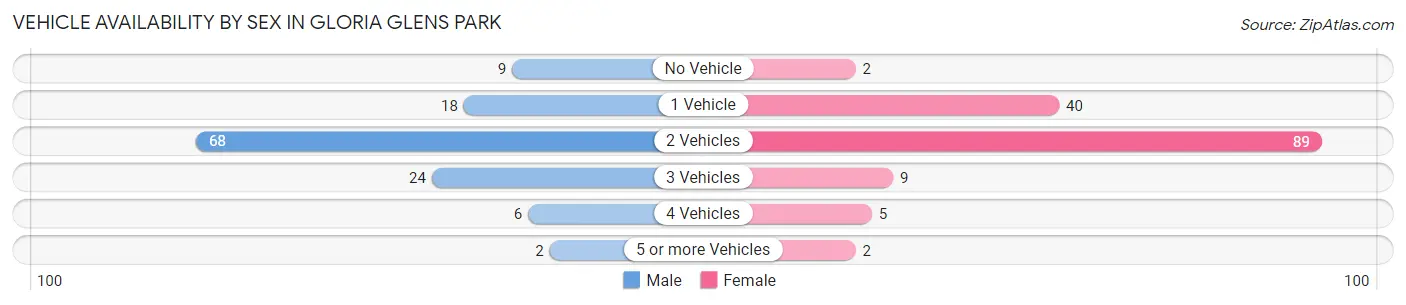
| Vehicles Available | Male | Female |
| No Vehicle | 9 (7.1%) | 2 (1.4%) |
| 1 Vehicle | 18 (14.2%) | 40 (27.2%) |
| 2 Vehicles | 68 (53.5%) | 89 (60.5%) |
| 3 Vehicles | 24 (18.9%) | 9 (6.1%) |
| 4 Vehicles | 6 (4.7%) | 5 (3.4%) |
| 5 or more Vehicles | 2 (1.6%) | 2 (1.4%) |
| Total | 127 (100.0%) | 147 (100.0%) |
Commute Time in Gloria Glens Park
The most frequently occuring commute durations in Gloria Glens Park are 15 to 19 minutes (84 commuters, 31.8%), 45 to 59 minutes (48 commuters, 18.2%), and 10 to 14 minutes (36 commuters, 13.6%).
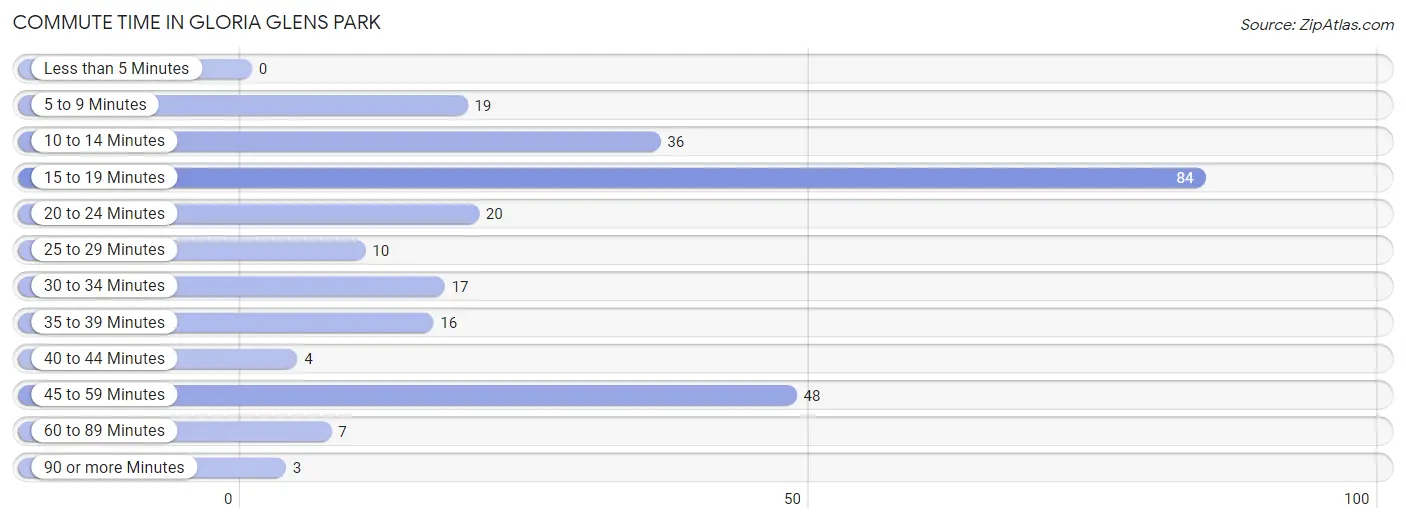
| Commute Time | # Commuters | % Commuters |
| Less than 5 Minutes | 0 | 0.0% |
| 5 to 9 Minutes | 19 | 7.2% |
| 10 to 14 Minutes | 36 | 13.6% |
| 15 to 19 Minutes | 84 | 31.8% |
| 20 to 24 Minutes | 20 | 7.6% |
| 25 to 29 Minutes | 10 | 3.8% |
| 30 to 34 Minutes | 17 | 6.4% |
| 35 to 39 Minutes | 16 | 6.1% |
| 40 to 44 Minutes | 4 | 1.5% |
| 45 to 59 Minutes | 48 | 18.2% |
| 60 to 89 Minutes | 7 | 2.6% |
| 90 or more Minutes | 3 | 1.1% |
Commute Time by Sex in Gloria Glens Park
The most common commute times in Gloria Glens Park are 45 to 59 minutes (43 commuters, 35.0%) for males and 15 to 19 minutes (65 commuters, 46.1%) for females.
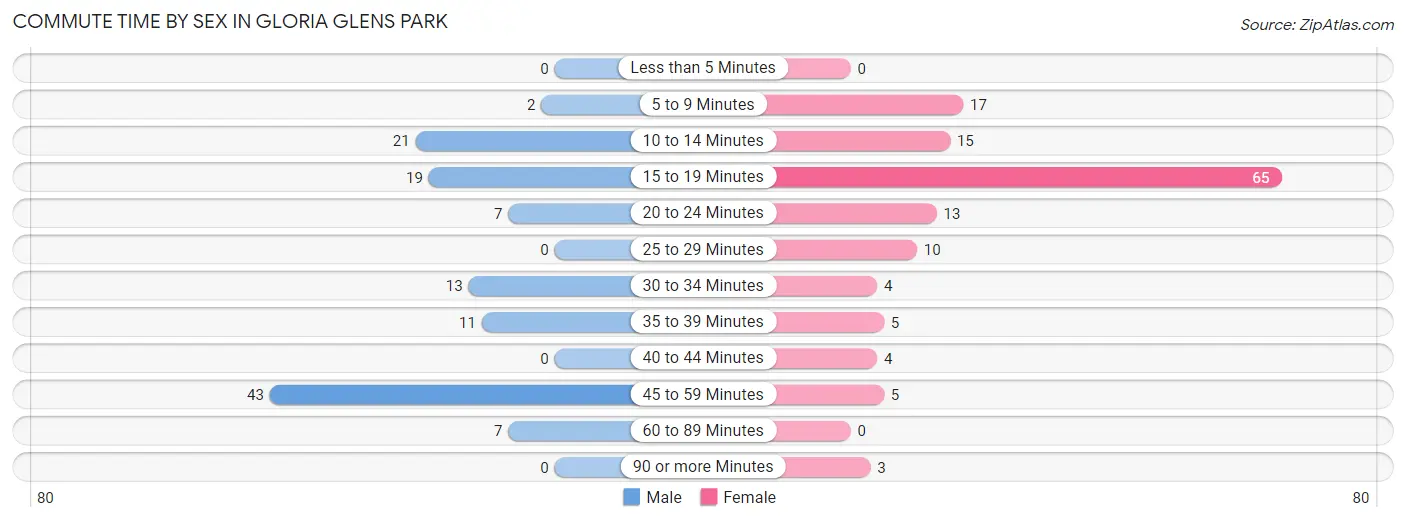
| Commute Time | Male | Female |
| Less than 5 Minutes | 0 (0.0%) | 0 (0.0%) |
| 5 to 9 Minutes | 2 (1.6%) | 17 (12.1%) |
| 10 to 14 Minutes | 21 (17.1%) | 15 (10.6%) |
| 15 to 19 Minutes | 19 (15.4%) | 65 (46.1%) |
| 20 to 24 Minutes | 7 (5.7%) | 13 (9.2%) |
| 25 to 29 Minutes | 0 (0.0%) | 10 (7.1%) |
| 30 to 34 Minutes | 13 (10.6%) | 4 (2.8%) |
| 35 to 39 Minutes | 11 (8.9%) | 5 (3.5%) |
| 40 to 44 Minutes | 0 (0.0%) | 4 (2.8%) |
| 45 to 59 Minutes | 43 (35.0%) | 5 (3.5%) |
| 60 to 89 Minutes | 7 (5.7%) | 0 (0.0%) |
| 90 or more Minutes | 0 (0.0%) | 3 (2.1%) |
Time of Departure to Work by Sex in Gloria Glens Park
The most frequent times of departure to work in Gloria Glens Park are 9:00 AM to 9:59 AM (22, 17.9%) for males and 12:00 PM to 3:59 PM (85, 60.3%) for females.
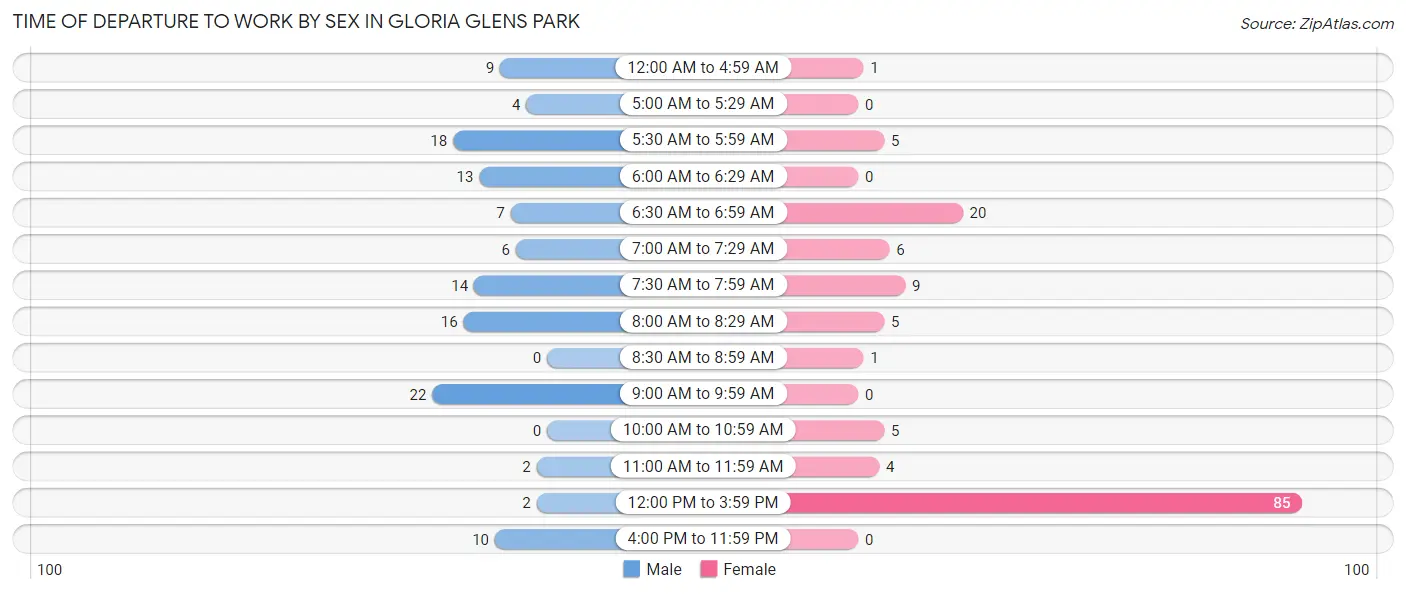
| Time of Departure | Male | Female |
| 12:00 AM to 4:59 AM | 9 (7.3%) | 1 (0.7%) |
| 5:00 AM to 5:29 AM | 4 (3.3%) | 0 (0.0%) |
| 5:30 AM to 5:59 AM | 18 (14.6%) | 5 (3.5%) |
| 6:00 AM to 6:29 AM | 13 (10.6%) | 0 (0.0%) |
| 6:30 AM to 6:59 AM | 7 (5.7%) | 20 (14.2%) |
| 7:00 AM to 7:29 AM | 6 (4.9%) | 6 (4.3%) |
| 7:30 AM to 7:59 AM | 14 (11.4%) | 9 (6.4%) |
| 8:00 AM to 8:29 AM | 16 (13.0%) | 5 (3.5%) |
| 8:30 AM to 8:59 AM | 0 (0.0%) | 1 (0.7%) |
| 9:00 AM to 9:59 AM | 22 (17.9%) | 0 (0.0%) |
| 10:00 AM to 10:59 AM | 0 (0.0%) | 5 (3.5%) |
| 11:00 AM to 11:59 AM | 2 (1.6%) | 4 (2.8%) |
| 12:00 PM to 3:59 PM | 2 (1.6%) | 85 (60.3%) |
| 4:00 PM to 11:59 PM | 10 (8.1%) | 0 (0.0%) |
| Total | 123 (100.0%) | 141 (100.0%) |
Housing Occupancy in Gloria Glens Park
Occupancy by Ownership in Gloria Glens Park
Of the total 190 dwellings in Gloria Glens Park, owner-occupied units account for 157 (82.6%), while renter-occupied units make up 33 (17.4%).
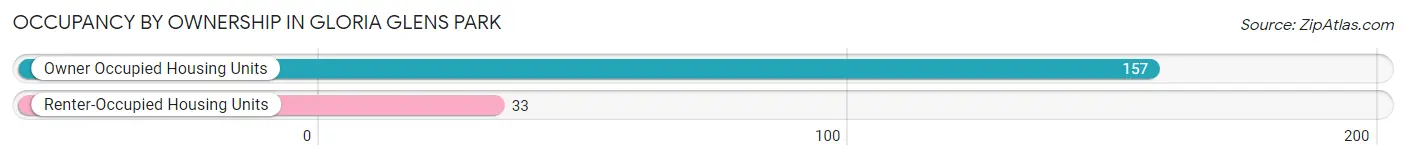
| Occupancy | # Housing Units | % Housing Units |
| Owner Occupied Housing Units | 157 | 82.6% |
| Renter-Occupied Housing Units | 33 | 17.4% |
| Total Occupied Housing Units | 190 | 100.0% |
Occupancy by Household Size in Gloria Glens Park
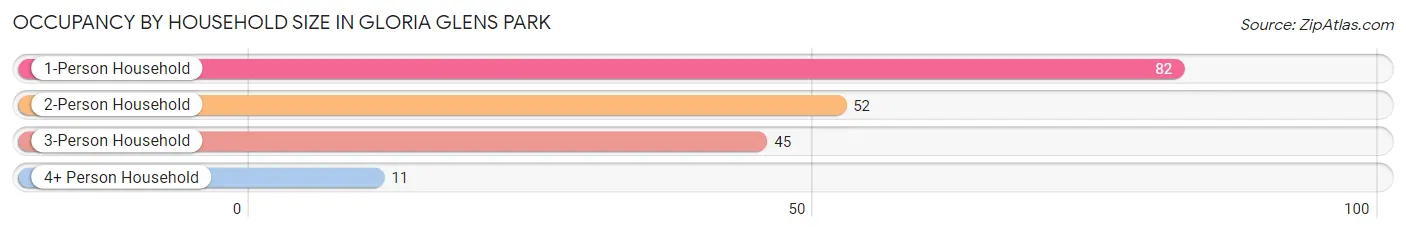
| Household Size | # Housing Units | % Housing Units |
| 1-Person Household | 82 | 43.2% |
| 2-Person Household | 52 | 27.4% |
| 3-Person Household | 45 | 23.7% |
| 4+ Person Household | 11 | 5.8% |
| Total Housing Units | 190 | 100.0% |
Occupancy by Ownership by Household Size in Gloria Glens Park
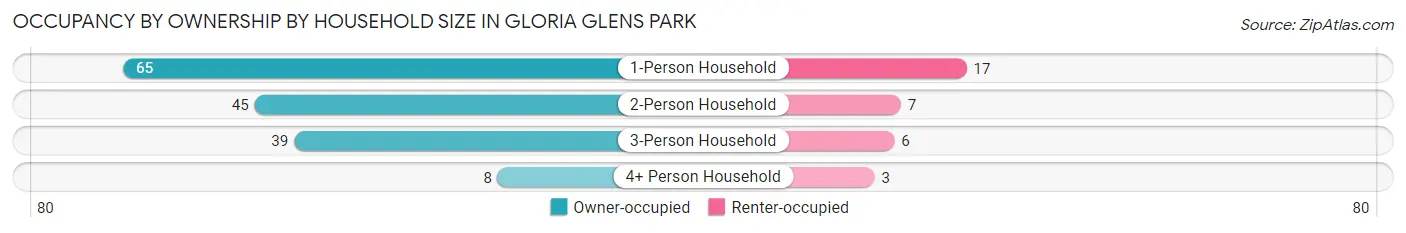
| Household Size | Owner-occupied | Renter-occupied |
| 1-Person Household | 65 (79.3%) | 17 (20.7%) |
| 2-Person Household | 45 (86.5%) | 7 (13.5%) |
| 3-Person Household | 39 (86.7%) | 6 (13.3%) |
| 4+ Person Household | 8 (72.7%) | 3 (27.3%) |
| Total Housing Units | 157 (82.6%) | 33 (17.4%) |
Occupancy by Educational Attainment in Gloria Glens Park
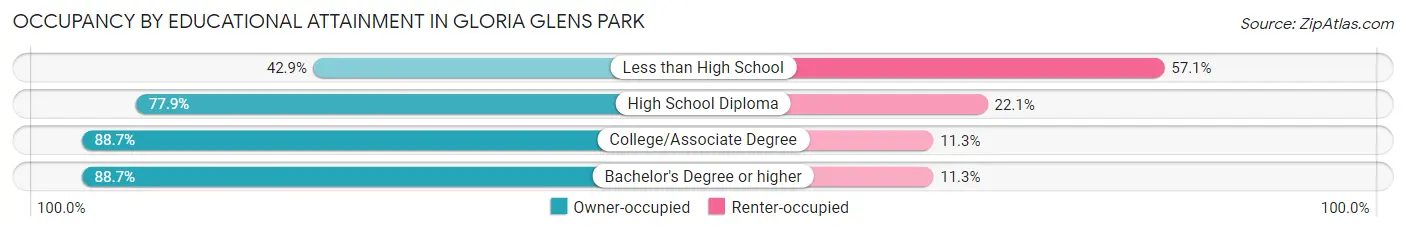
| Household Size | Owner-occupied | Renter-occupied |
| Less than High School | 3 (42.9%) | 4 (57.1%) |
| High School Diploma | 60 (77.9%) | 17 (22.1%) |
| College/Associate Degree | 47 (88.7%) | 6 (11.3%) |
| Bachelor's Degree or higher | 47 (88.7%) | 6 (11.3%) |
Occupancy by Age of Householder in Gloria Glens Park
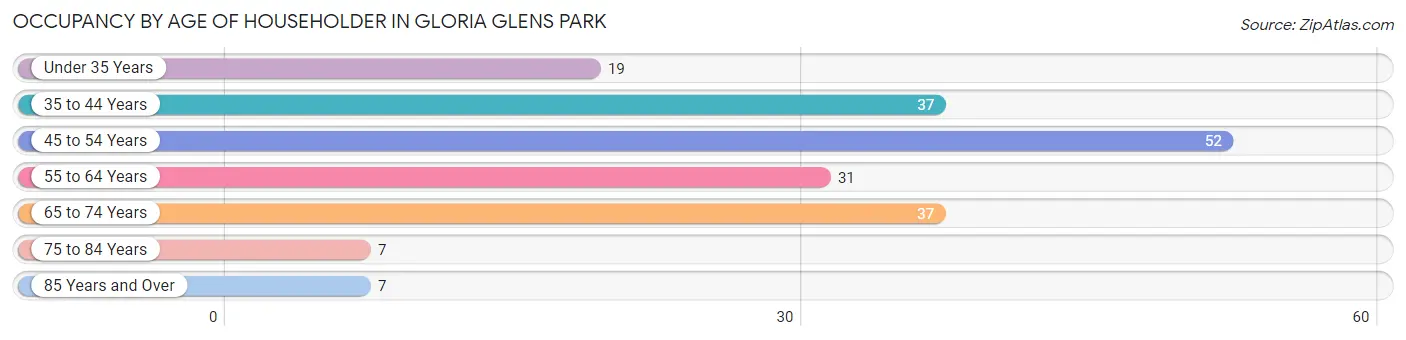
| Age Bracket | # Households | % Households |
| Under 35 Years | 19 | 10.0% |
| 35 to 44 Years | 37 | 19.5% |
| 45 to 54 Years | 52 | 27.4% |
| 55 to 64 Years | 31 | 16.3% |
| 65 to 74 Years | 37 | 19.5% |
| 75 to 84 Years | 7 | 3.7% |
| 85 Years and Over | 7 | 3.7% |
| Total | 190 | 100.0% |
Housing Finances in Gloria Glens Park
Median Income by Occupancy in Gloria Glens Park
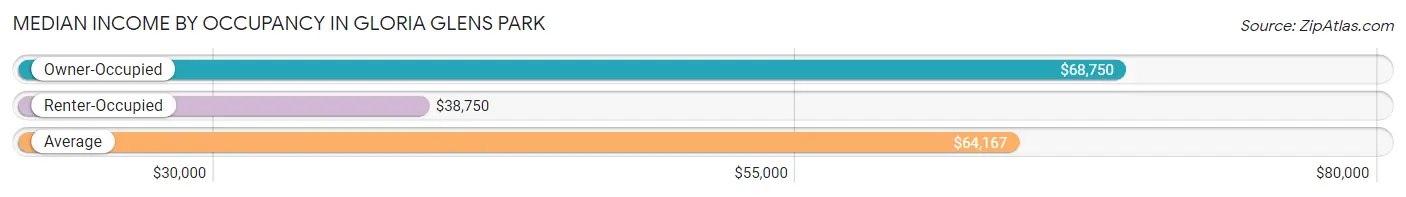
| Occupancy Type | # Households | Median Income |
| Owner-Occupied | 157 (82.6%) | $68,750 |
| Renter-Occupied | 33 (17.4%) | $38,750 |
| Average | 190 (100.0%) | $64,167 |
Occupancy by Householder Income Bracket in Gloria Glens Park
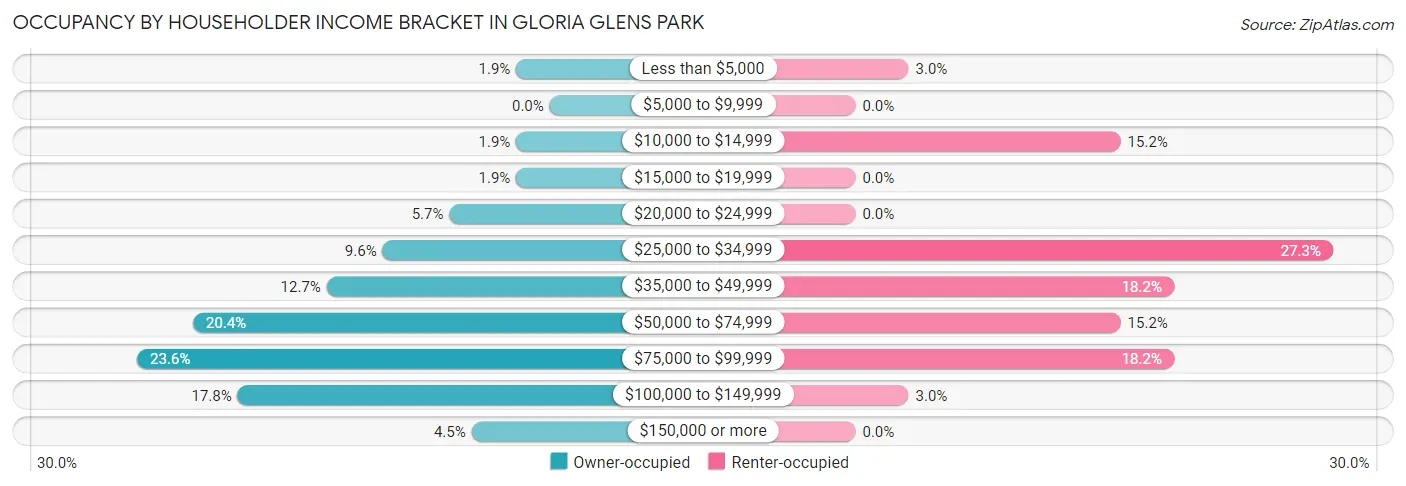
| Income Bracket | Owner-occupied | Renter-occupied |
| Less than $5,000 | 3 (1.9%) | 1 (3.0%) |
| $5,000 to $9,999 | 0 (0.0%) | 0 (0.0%) |
| $10,000 to $14,999 | 3 (1.9%) | 5 (15.1%) |
| $15,000 to $19,999 | 3 (1.9%) | 0 (0.0%) |
| $20,000 to $24,999 | 9 (5.7%) | 0 (0.0%) |
| $25,000 to $34,999 | 15 (9.6%) | 9 (27.3%) |
| $35,000 to $49,999 | 20 (12.7%) | 6 (18.2%) |
| $50,000 to $74,999 | 32 (20.4%) | 5 (15.1%) |
| $75,000 to $99,999 | 37 (23.6%) | 6 (18.2%) |
| $100,000 to $149,999 | 28 (17.8%) | 1 (3.0%) |
| $150,000 or more | 7 (4.5%) | 0 (0.0%) |
| Total | 157 (100.0%) | 33 (100.0%) |
Monthly Housing Cost Tiers in Gloria Glens Park
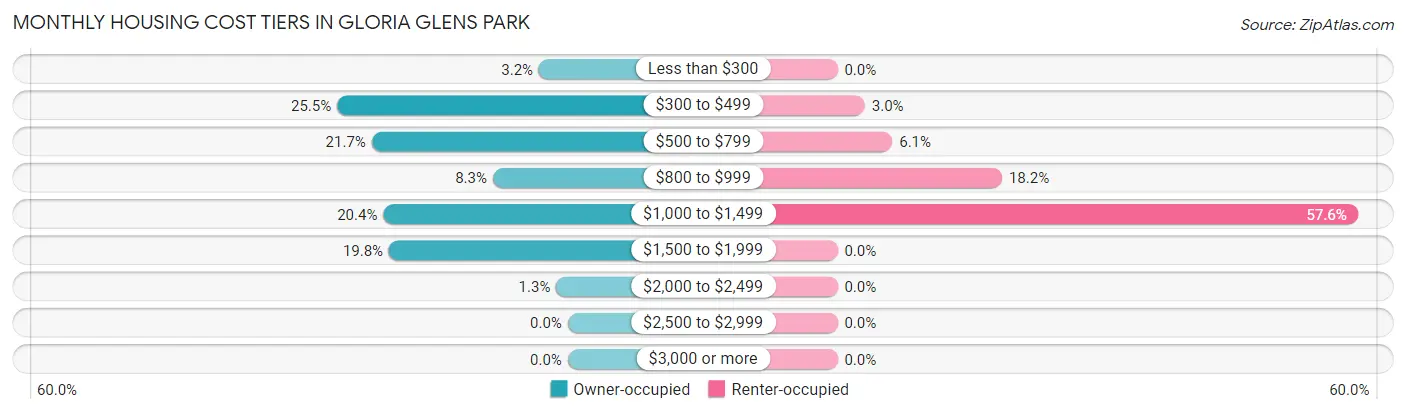
| Monthly Cost | Owner-occupied | Renter-occupied |
| Less than $300 | 5 (3.2%) | 0 (0.0%) |
| $300 to $499 | 40 (25.5%) | 1 (3.0%) |
| $500 to $799 | 34 (21.7%) | 2 (6.1%) |
| $800 to $999 | 13 (8.3%) | 6 (18.2%) |
| $1,000 to $1,499 | 32 (20.4%) | 19 (57.6%) |
| $1,500 to $1,999 | 31 (19.8%) | 0 (0.0%) |
| $2,000 to $2,499 | 2 (1.3%) | 0 (0.0%) |
| $2,500 to $2,999 | 0 (0.0%) | 0 (0.0%) |
| $3,000 or more | 0 (0.0%) | 0 (0.0%) |
| Total | 157 (100.0%) | 33 (100.0%) |
Physical Housing Characteristics in Gloria Glens Park
Housing Structures in Gloria Glens Park
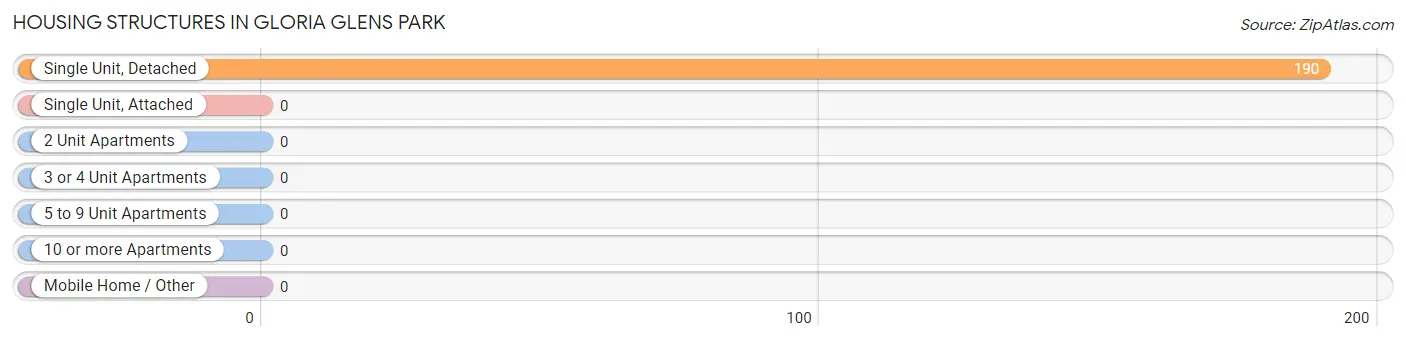
| Structure Type | # Housing Units | % Housing Units |
| Single Unit, Detached | 190 | 100.0% |
| Single Unit, Attached | 0 | 0.0% |
| 2 Unit Apartments | 0 | 0.0% |
| 3 or 4 Unit Apartments | 0 | 0.0% |
| 5 to 9 Unit Apartments | 0 | 0.0% |
| 10 or more Apartments | 0 | 0.0% |
| Mobile Home / Other | 0 | 0.0% |
| Total | 190 | 100.0% |
Housing Structures by Occupancy in Gloria Glens Park
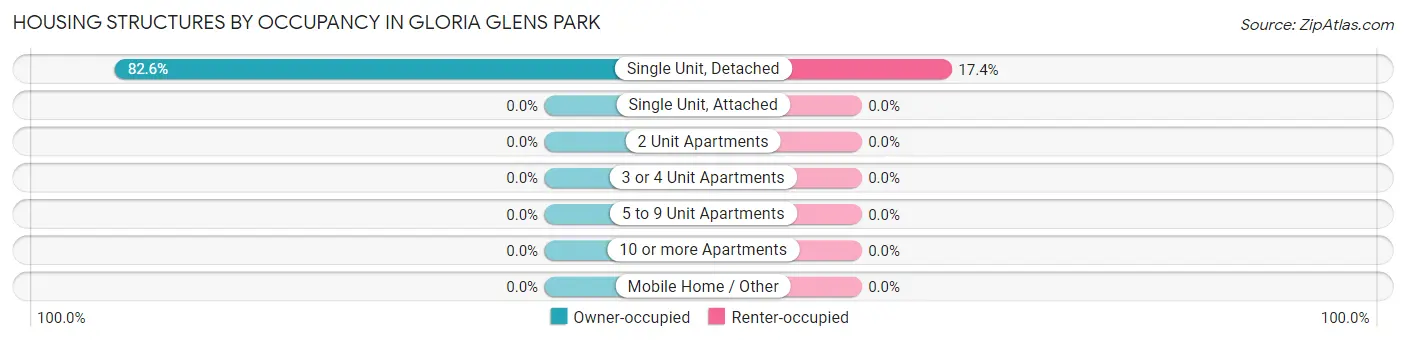
| Structure Type | Owner-occupied | Renter-occupied |
| Single Unit, Detached | 157 (82.6%) | 33 (17.4%) |
| Single Unit, Attached | 0 (0.0%) | 0 (0.0%) |
| 2 Unit Apartments | 0 (0.0%) | 0 (0.0%) |
| 3 or 4 Unit Apartments | 0 (0.0%) | 0 (0.0%) |
| 5 to 9 Unit Apartments | 0 (0.0%) | 0 (0.0%) |
| 10 or more Apartments | 0 (0.0%) | 0 (0.0%) |
| Mobile Home / Other | 0 (0.0%) | 0 (0.0%) |
| Total | 157 (82.6%) | 33 (17.4%) |
Housing Structures by Number of Rooms in Gloria Glens Park
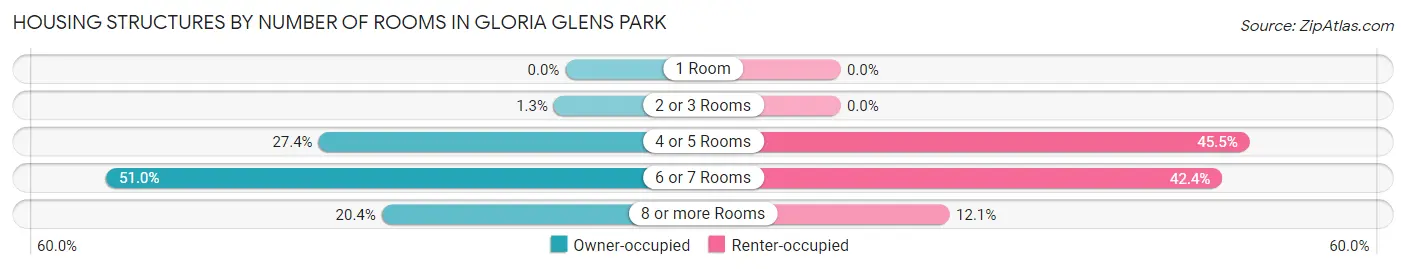
| Number of Rooms | Owner-occupied | Renter-occupied |
| 1 Room | 0 (0.0%) | 0 (0.0%) |
| 2 or 3 Rooms | 2 (1.3%) | 0 (0.0%) |
| 4 or 5 Rooms | 43 (27.4%) | 15 (45.5%) |
| 6 or 7 Rooms | 80 (51.0%) | 14 (42.4%) |
| 8 or more Rooms | 32 (20.4%) | 4 (12.1%) |
| Total | 157 (100.0%) | 33 (100.0%) |
Housing Structure by Heating Type in Gloria Glens Park
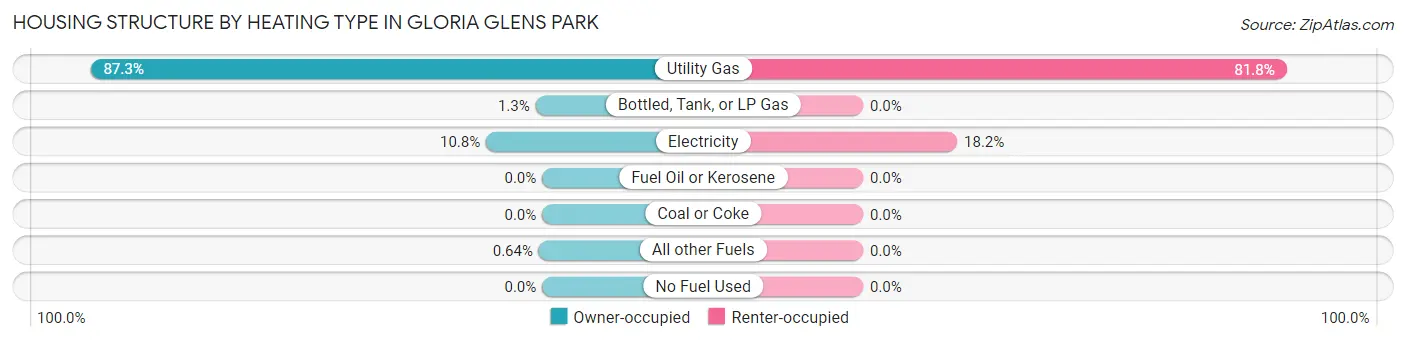
| Heating Type | Owner-occupied | Renter-occupied |
| Utility Gas | 137 (87.3%) | 27 (81.8%) |
| Bottled, Tank, or LP Gas | 2 (1.3%) | 0 (0.0%) |
| Electricity | 17 (10.8%) | 6 (18.2%) |
| Fuel Oil or Kerosene | 0 (0.0%) | 0 (0.0%) |
| Coal or Coke | 0 (0.0%) | 0 (0.0%) |
| All other Fuels | 1 (0.6%) | 0 (0.0%) |
| No Fuel Used | 0 (0.0%) | 0 (0.0%) |
| Total | 157 (100.0%) | 33 (100.0%) |
Household Vehicle Usage in Gloria Glens Park
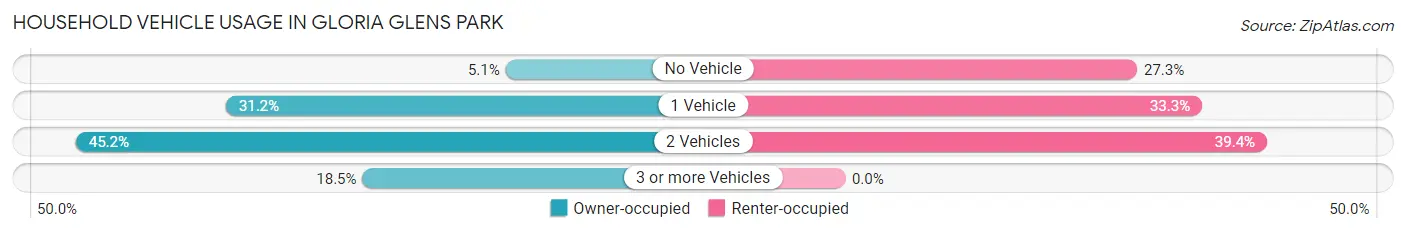
| Vehicles per Household | Owner-occupied | Renter-occupied |
| No Vehicle | 8 (5.1%) | 9 (27.3%) |
| 1 Vehicle | 49 (31.2%) | 11 (33.3%) |
| 2 Vehicles | 71 (45.2%) | 13 (39.4%) |
| 3 or more Vehicles | 29 (18.5%) | 0 (0.0%) |
| Total | 157 (100.0%) | 33 (100.0%) |
Real Estate & Mortgages in Gloria Glens Park
Real Estate and Mortgage Overview in Gloria Glens Park
| Characteristic | Without Mortgage | With Mortgage |
| Housing Units | 70 | 87 |
| Median Property Value | $165,000 | $135,900 |
| Median Household Income | $45,000 | $4 |
| Monthly Housing Costs | $471 | $0 |
| Real Estate Taxes | $1,793 | $0 |
Property Value by Mortgage Status in Gloria Glens Park
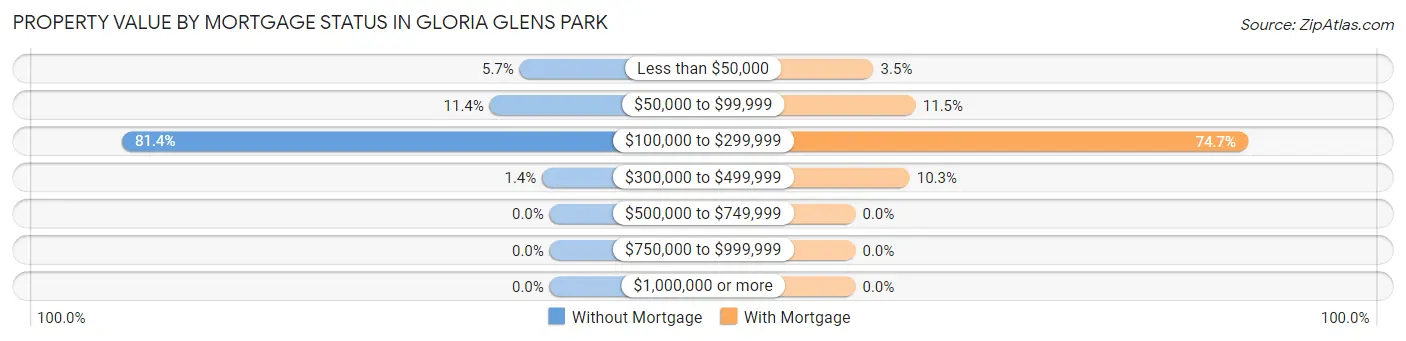
| Property Value | Without Mortgage | With Mortgage |
| Less than $50,000 | 4 (5.7%) | 3 (3.5%) |
| $50,000 to $99,999 | 8 (11.4%) | 10 (11.5%) |
| $100,000 to $299,999 | 57 (81.4%) | 65 (74.7%) |
| $300,000 to $499,999 | 1 (1.4%) | 9 (10.3%) |
| $500,000 to $749,999 | 0 (0.0%) | 0 (0.0%) |
| $750,000 to $999,999 | 0 (0.0%) | 0 (0.0%) |
| $1,000,000 or more | 0 (0.0%) | 0 (0.0%) |
| Total | 70 (100.0%) | 87 (100.0%) |
Household Income by Mortgage Status in Gloria Glens Park
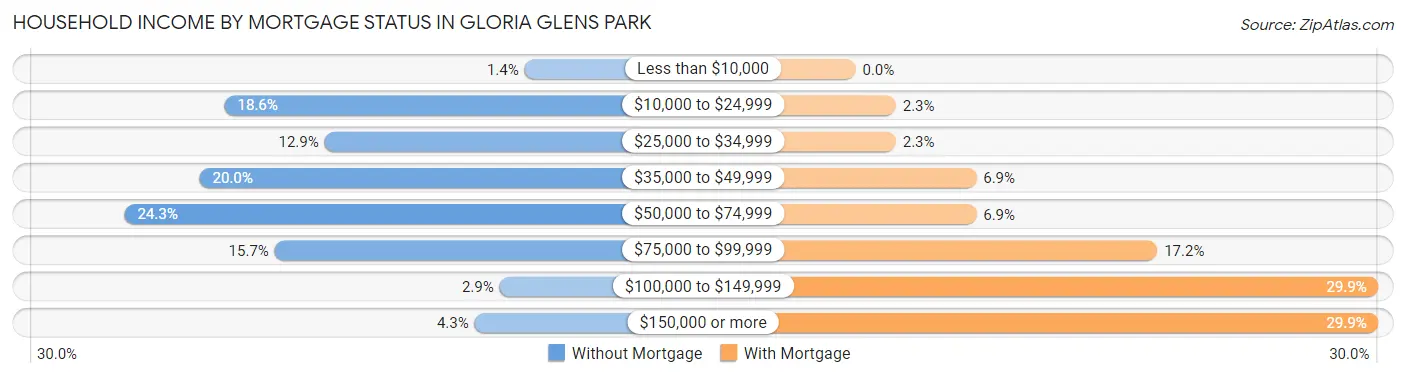
| Household Income | Without Mortgage | With Mortgage |
| Less than $10,000 | 1 (1.4%) | 0 (0.0%) |
| $10,000 to $24,999 | 13 (18.6%) | 2 (2.3%) |
| $25,000 to $34,999 | 9 (12.9%) | 2 (2.3%) |
| $35,000 to $49,999 | 14 (20.0%) | 6 (6.9%) |
| $50,000 to $74,999 | 17 (24.3%) | 6 (6.9%) |
| $75,000 to $99,999 | 11 (15.7%) | 15 (17.2%) |
| $100,000 to $149,999 | 2 (2.9%) | 26 (29.9%) |
| $150,000 or more | 3 (4.3%) | 26 (29.9%) |
| Total | 70 (100.0%) | 87 (100.0%) |
Property Value to Household Income Ratio in Gloria Glens Park
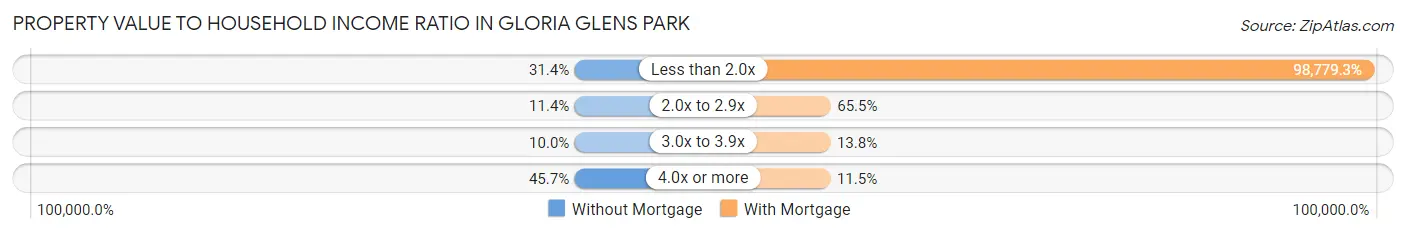
| Value-to-Income Ratio | Without Mortgage | With Mortgage |
| Less than 2.0x | 22 (31.4%) | 85,938 (98,779.3%) |
| 2.0x to 2.9x | 8 (11.4%) | 57 (65.5%) |
| 3.0x to 3.9x | 7 (10.0%) | 12 (13.8%) |
| 4.0x or more | 32 (45.7%) | 10 (11.5%) |
| Total | 70 (100.0%) | 87 (100.0%) |
Real Estate Taxes by Mortgage Status in Gloria Glens Park
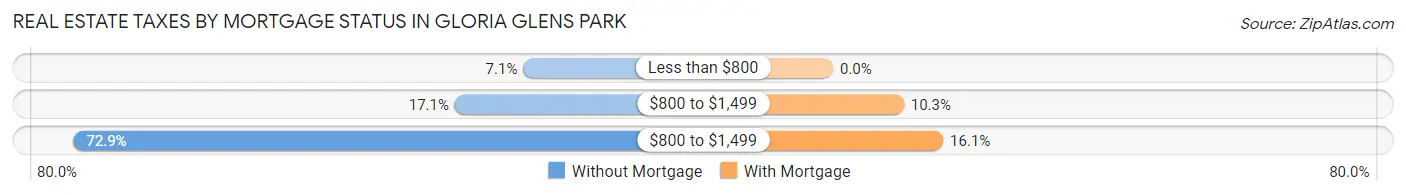
| Property Taxes | Without Mortgage | With Mortgage |
| Less than $800 | 5 (7.1%) | 0 (0.0%) |
| $800 to $1,499 | 12 (17.1%) | 9 (10.3%) |
| $800 to $1,499 | 51 (72.9%) | 14 (16.1%) |
| Total | 70 (100.0%) | 87 (100.0%) |
Health & Disability in Gloria Glens Park
Health Insurance Coverage by Age in Gloria Glens Park
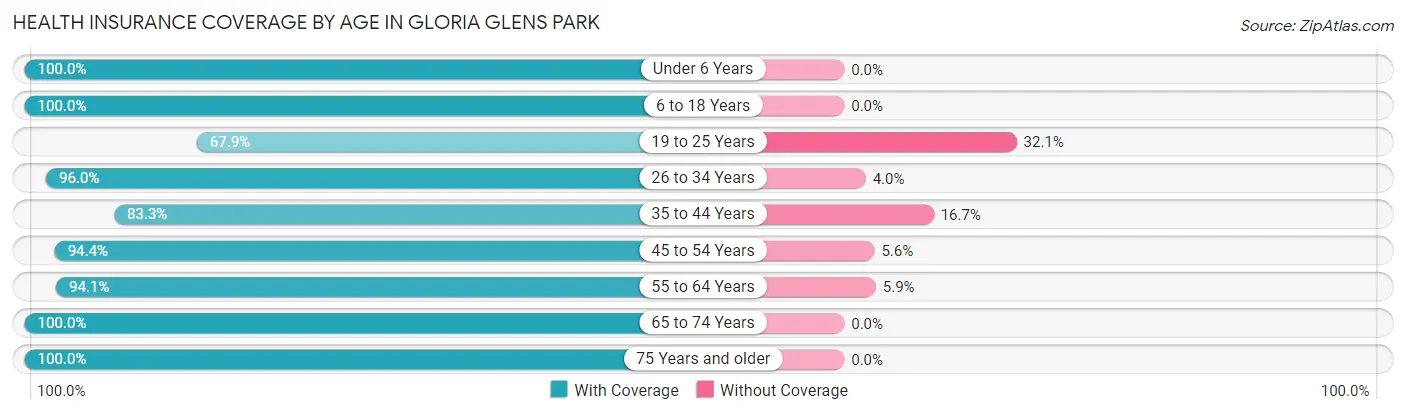
| Age Bracket | With Coverage | Without Coverage |
| Under 6 Years | 10 (100.0%) | 0 (0.0%) |
| 6 to 18 Years | 79 (100.0%) | 0 (0.0%) |
| 19 to 25 Years | 19 (67.9%) | 9 (32.1%) |
| 26 to 34 Years | 24 (96.0%) | 1 (4.0%) |
| 35 to 44 Years | 50 (83.3%) | 10 (16.7%) |
| 45 to 54 Years | 84 (94.4%) | 5 (5.6%) |
| 55 to 64 Years | 48 (94.1%) | 3 (5.9%) |
| 65 to 74 Years | 52 (100.0%) | 0 (0.0%) |
| 75 Years and older | 20 (100.0%) | 0 (0.0%) |
| Total | 386 (93.2%) | 28 (6.8%) |
Health Insurance Coverage by Citizenship Status in Gloria Glens Park
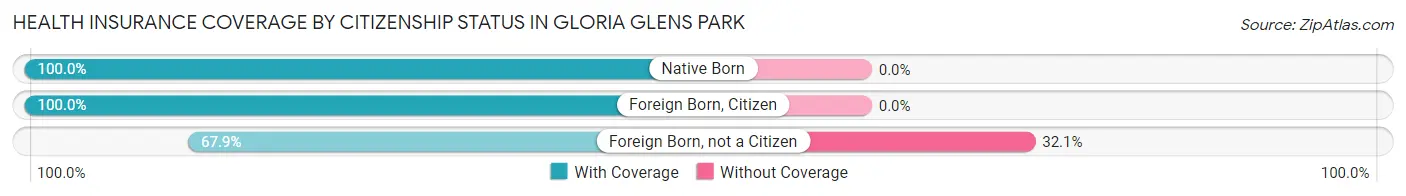
| Citizenship Status | With Coverage | Without Coverage |
| Native Born | 10 (100.0%) | 0 (0.0%) |
| Foreign Born, Citizen | 79 (100.0%) | 0 (0.0%) |
| Foreign Born, not a Citizen | 19 (67.9%) | 9 (32.1%) |
Health Insurance Coverage by Household Income in Gloria Glens Park
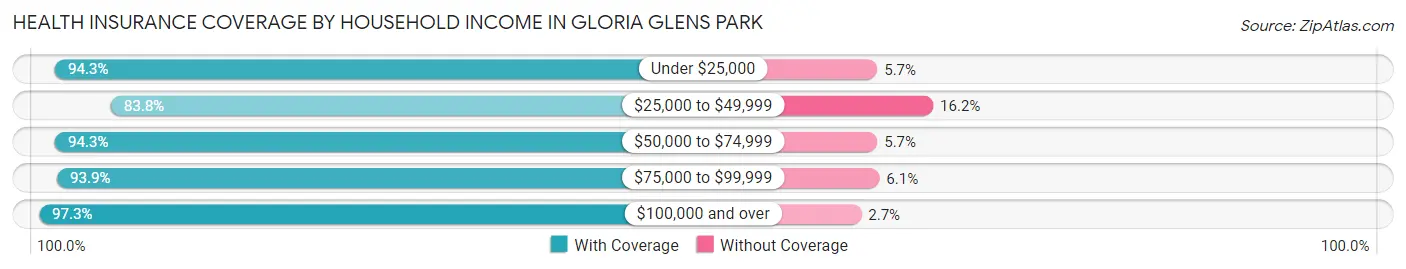
| Household Income | With Coverage | Without Coverage |
| Under $25,000 | 33 (94.3%) | 2 (5.7%) |
| $25,000 to $49,999 | 57 (83.8%) | 11 (16.2%) |
| $50,000 to $74,999 | 66 (94.3%) | 4 (5.7%) |
| $75,000 to $99,999 | 123 (93.9%) | 8 (6.1%) |
| $100,000 and over | 107 (97.3%) | 3 (2.7%) |
Public vs Private Health Insurance Coverage by Age in Gloria Glens Park
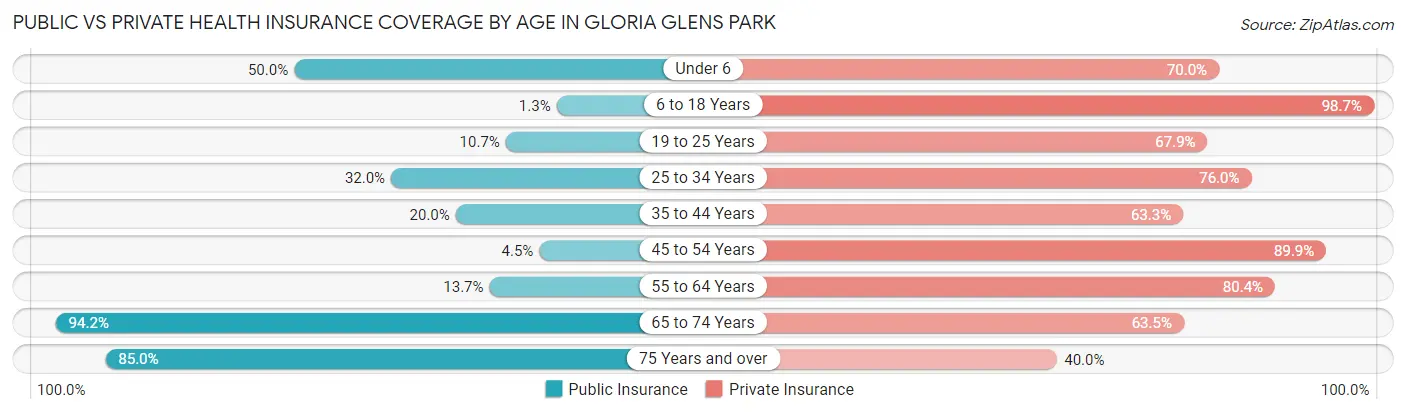
| Age Bracket | Public Insurance | Private Insurance |
| Under 6 | 5 (50.0%) | 7 (70.0%) |
| 6 to 18 Years | 1 (1.3%) | 78 (98.7%) |
| 19 to 25 Years | 3 (10.7%) | 19 (67.9%) |
| 25 to 34 Years | 8 (32.0%) | 19 (76.0%) |
| 35 to 44 Years | 12 (20.0%) | 38 (63.3%) |
| 45 to 54 Years | 4 (4.5%) | 80 (89.9%) |
| 55 to 64 Years | 7 (13.7%) | 41 (80.4%) |
| 65 to 74 Years | 49 (94.2%) | 33 (63.5%) |
| 75 Years and over | 17 (85.0%) | 8 (40.0%) |
| Total | 106 (25.6%) | 323 (78.0%) |
Disability Status by Sex by Age in Gloria Glens Park
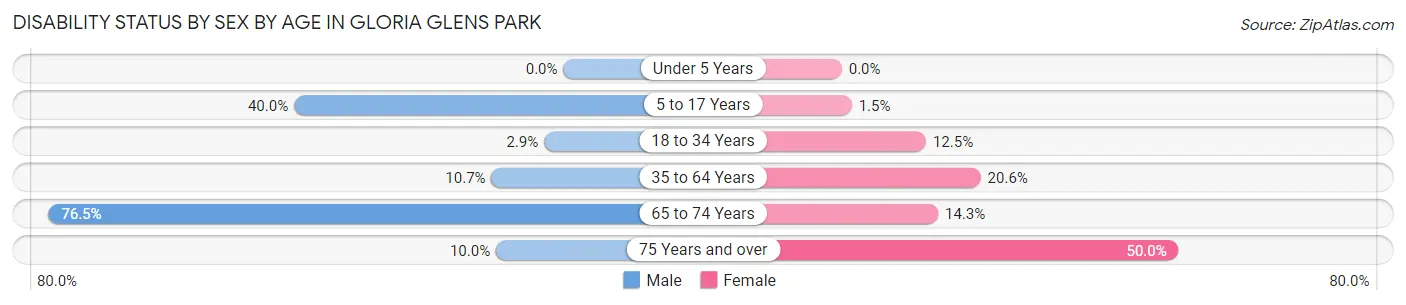
| Age Bracket | Male | Female |
| Under 5 Years | 0 (0.0%) | 0 (0.0%) |
| 5 to 17 Years | 2 (40.0%) | 1 (1.5%) |
| 18 to 34 Years | 1 (2.9%) | 3 (12.5%) |
| 35 to 64 Years | 11 (10.7%) | 20 (20.6%) |
| 65 to 74 Years | 13 (76.5%) | 5 (14.3%) |
| 75 Years and over | 1 (10.0%) | 5 (50.0%) |
Disability Class by Sex by Age in Gloria Glens Park
Disability Class: Hearing Difficulty
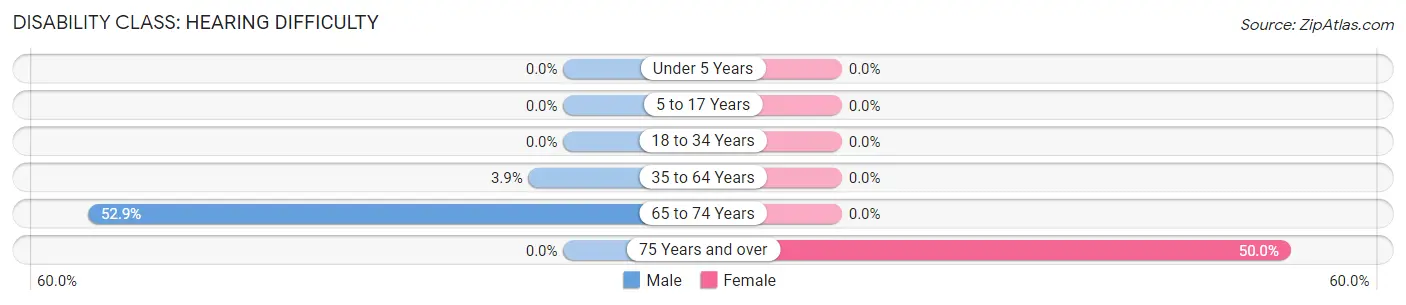
| Age Bracket | Male | Female |
| Under 5 Years | 0 (0.0%) | 0 (0.0%) |
| 5 to 17 Years | 0 (0.0%) | 0 (0.0%) |
| 18 to 34 Years | 0 (0.0%) | 0 (0.0%) |
| 35 to 64 Years | 4 (3.9%) | 0 (0.0%) |
| 65 to 74 Years | 9 (52.9%) | 0 (0.0%) |
| 75 Years and over | 0 (0.0%) | 5 (50.0%) |
Disability Class: Vision Difficulty
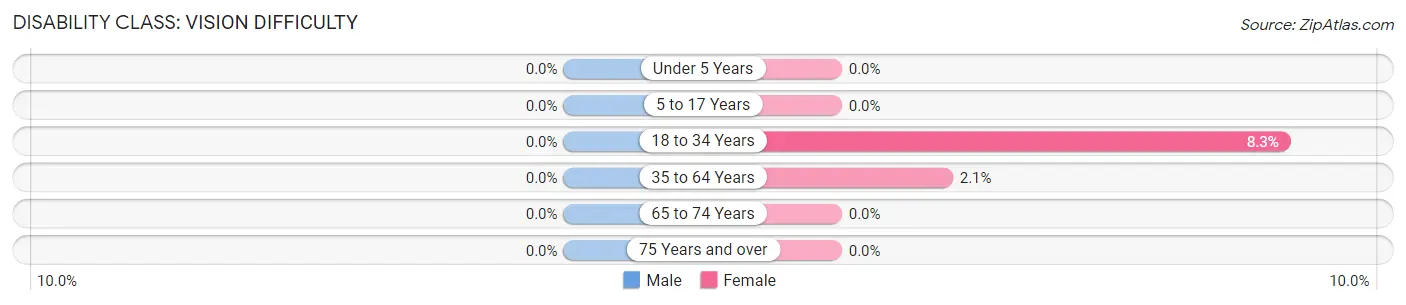
| Age Bracket | Male | Female |
| Under 5 Years | 0 (0.0%) | 0 (0.0%) |
| 5 to 17 Years | 0 (0.0%) | 0 (0.0%) |
| 18 to 34 Years | 0 (0.0%) | 2 (8.3%) |
| 35 to 64 Years | 0 (0.0%) | 2 (2.1%) |
| 65 to 74 Years | 0 (0.0%) | 0 (0.0%) |
| 75 Years and over | 0 (0.0%) | 0 (0.0%) |
Disability Class: Cognitive Difficulty
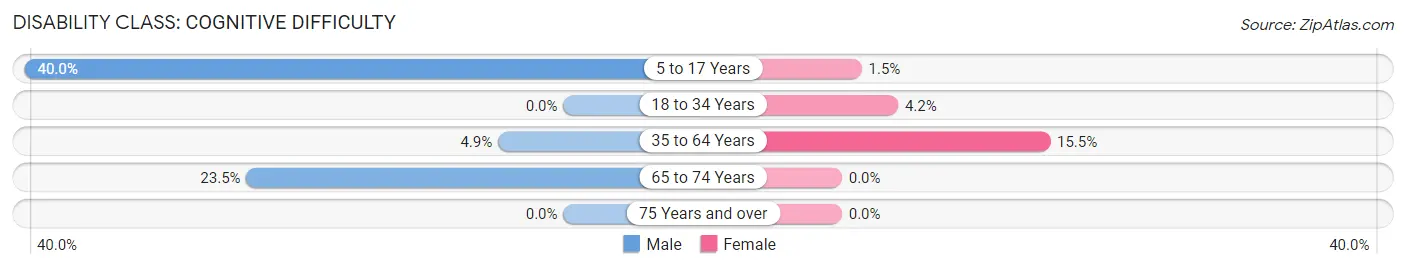
| Age Bracket | Male | Female |
| 5 to 17 Years | 2 (40.0%) | 1 (1.5%) |
| 18 to 34 Years | 0 (0.0%) | 1 (4.2%) |
| 35 to 64 Years | 5 (4.9%) | 15 (15.5%) |
| 65 to 74 Years | 4 (23.5%) | 0 (0.0%) |
| 75 Years and over | 0 (0.0%) | 0 (0.0%) |
Disability Class: Ambulatory Difficulty
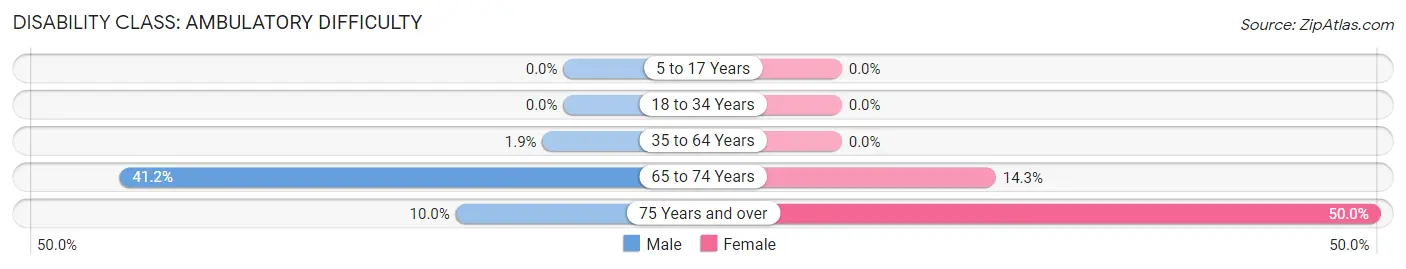
| Age Bracket | Male | Female |
| 5 to 17 Years | 0 (0.0%) | 0 (0.0%) |
| 18 to 34 Years | 0 (0.0%) | 0 (0.0%) |
| 35 to 64 Years | 2 (1.9%) | 0 (0.0%) |
| 65 to 74 Years | 7 (41.2%) | 5 (14.3%) |
| 75 Years and over | 1 (10.0%) | 5 (50.0%) |
Disability Class: Self-Care Difficulty
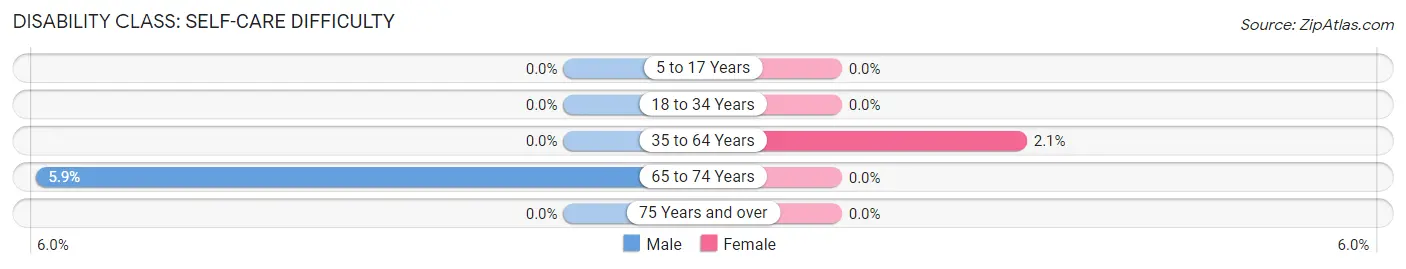
| Age Bracket | Male | Female |
| 5 to 17 Years | 0 (0.0%) | 0 (0.0%) |
| 18 to 34 Years | 0 (0.0%) | 0 (0.0%) |
| 35 to 64 Years | 0 (0.0%) | 2 (2.1%) |
| 65 to 74 Years | 1 (5.9%) | 0 (0.0%) |
| 75 Years and over | 0 (0.0%) | 0 (0.0%) |
Technology Access in Gloria Glens Park
Computing Device Access in Gloria Glens Park
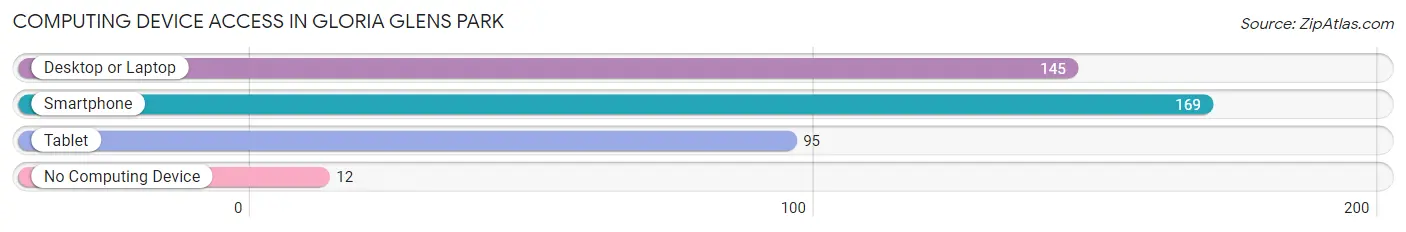
| Device Type | # Households | % Households |
| Desktop or Laptop | 145 | 76.3% |
| Smartphone | 169 | 88.9% |
| Tablet | 95 | 50.0% |
| No Computing Device | 12 | 6.3% |
| Total | 190 | 100.0% |
Internet Access in Gloria Glens Park
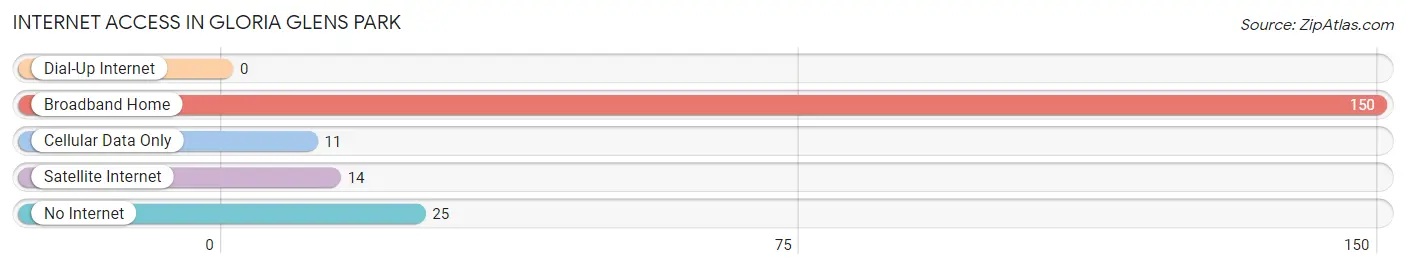
| Internet Type | # Households | % Households |
| Dial-Up Internet | 0 | 0.0% |
| Broadband Home | 150 | 78.9% |
| Cellular Data Only | 11 | 5.8% |
| Satellite Internet | 14 | 7.4% |
| No Internet | 25 | 13.2% |
| Total | 190 | 100.0% |
Gloria Glens Park Summary
Gloria Glens Park, Ohio is a small village located in the southeastern corner of Cuyahoga County, Ohio. The village is situated on the banks of the Cuyahoga River and is bordered by the cities of Cleveland and Parma. The village was founded in 1820 and is named after the daughter of the first settler, John Glens.
History
Gloria Glens Park was founded in 1820 by John Glens, a settler from Pennsylvania. Glens had purchased the land from the Connecticut Land Company and named the village after his daughter, Gloria. The village was originally a farming community, but by the late 19th century, it had become a popular summer resort destination for Clevelanders. The village was incorporated in 1891 and was home to a variety of businesses, including a hotel, a general store, a post office, and a blacksmith shop.
In the early 20th century, the village began to experience a decline in population as many of its residents moved to the nearby cities of Cleveland and Parma. The village was also affected by the Great Depression, and many of its businesses closed. In the 1950s, the village began to experience a resurgence in population as many of its former residents returned to the area.
Geography
Gloria Glens Park is located in the southeastern corner of Cuyahoga County, Ohio. The village is situated on the banks of the Cuyahoga River and is bordered by the cities of Cleveland and Parma. The village covers an area of 0.7 square miles and has a population of approximately 1,500 people.
The village is located in a predominantly residential area and is home to a variety of parks and recreational facilities. The village is also home to a number of historic buildings, including the Gloria Glens Park Community Center, which was built in 1891.
Economy
Gloria Glens Park is a predominantly residential community and does not have a large commercial or industrial base. The village is home to a variety of small businesses, including restaurants, retail stores, and professional services. The village is also home to a number of small manufacturing companies, including a furniture manufacturer and a printing company.
Demographics
Gloria Glens Park has a population of approximately 1,500 people. The village is predominantly white, with approximately 90% of the population identifying as Caucasian. The village also has a small African American population, with approximately 5% of the population identifying as African American. The village also has a small Hispanic population, with approximately 3% of the population identifying as Hispanic or Latino. The median household income in the village is approximately $50,000.
Common Questions
What is the Total Population of Gloria Glens Park?
Total Population of Gloria Glens Park is 414.
What is the Total Male Population of Gloria Glens Park?
Total Male Population of Gloria Glens Park is 176.
What is the Total Female Population of Gloria Glens Park?
Total Female Population of Gloria Glens Park is 238.
What is the Ratio of Males per 100 Females in Gloria Glens Park?
There are 73.95 Males per 100 Females in Gloria Glens Park.
What is the Ratio of Females per 100 Males in Gloria Glens Park?
There are 135.23 Females per 100 Males in Gloria Glens Park.
What is the Median Population Age in Gloria Glens Park?
Median Population Age in Gloria Glens Park is 45.2 Years.
What is the Average Family Size in Gloria Glens Park
Average Family Size in Gloria Glens Park is 3.1 People.
What is the Average Household Size in Gloria Glens Park
Average Household Size in Gloria Glens Park is 2.2 People.
What is Per Capita Income in Gloria Glens Park?
Per Capita income in Gloria Glens Park is $32,774.
What is the Median Family Income in Gloria Glens Park?
Median Family Income in Gloria Glens Park is $85,952.
What is the Median Household income in Gloria Glens Park?
Median Household Income in Gloria Glens Park is $64,167.
What is Inequality or Gini Index in Gloria Glens Park?
Inequality or Gini Index in Gloria Glens Park is 0.33.
How Large is the Labor Force in Gloria Glens Park?
There are 297 People in the Labor Forcein in Gloria Glens Park.
What is the Percentage of People in the Labor Force in Gloria Glens Park?
74.6% of People are in the Labor Force in Gloria Glens Park.
What is the Unemployment Rate in Gloria Glens Park?
Unemployment Rate in Gloria Glens Park is 6.1%.