Galion, OH
Galion Map
Galion Overview
10,378
TOTAL POPULATION
4,877
MALE POPULATION
5,501
FEMALE POPULATION
88.66
MALES / 100 FEMALES
112.79
FEMALES / 100 MALES
41.8
MEDIAN AGE
2.7
AVG FAMILY SIZE
2.2
AVG HOUSEHOLD SIZE
$24,849
PER CAPITA INCOME
$57,401
AVG FAMILY INCOME
$44,458
AVG HOUSEHOLD INCOME
23.1%
WAGE / INCOME GAP [ % ]
76.9¢/ $1
WAGE / INCOME GAP [ $ ]
0.41
INEQUALITY / GINI INDEX
4,890
LABOR FORCE [ PEOPLE ]
57.8%
PERCENT IN LABOR FORCE
7.2%
UNEMPLOYMENT RATE
Galion Zip Codes
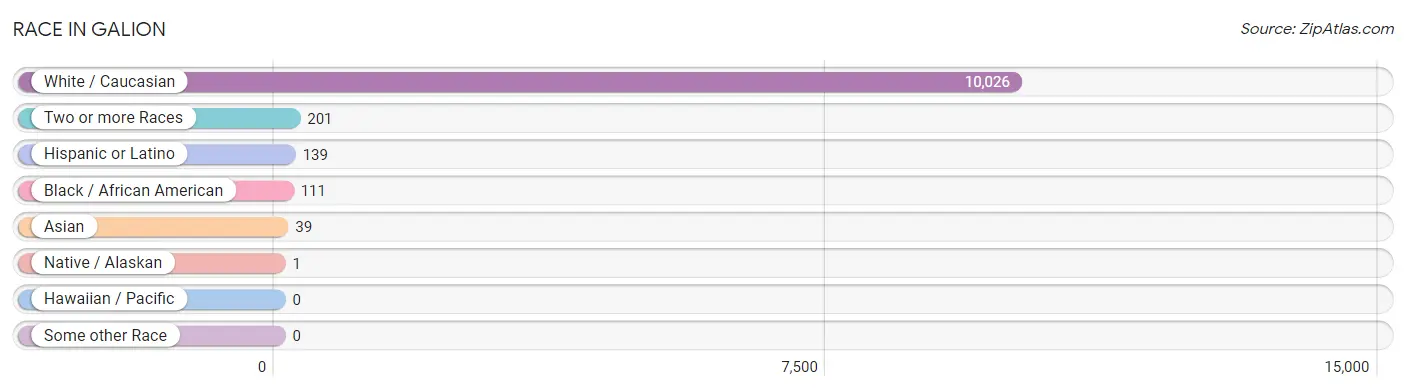
Race in Galion
The most populous races in Galion are White / Caucasian (10,026 | 96.6%), Two or more Races (201 | 1.9%), and Hispanic or Latino (139 | 1.3%).
| Race | # Population | % Population |
| Asian | 39 | 0.4% |
| Black / African American | 111 | 1.1% |
| Hawaiian / Pacific | 0 | 0.0% |
| Hispanic or Latino | 139 | 1.3% |
| Native / Alaskan | 1 | 0.0% |
| White / Caucasian | 10,026 | 96.6% |
| Two or more Races | 201 | 1.9% |
| Some other Race | 0 | 0.0% |
| Total | 10,378 | 100.0% |
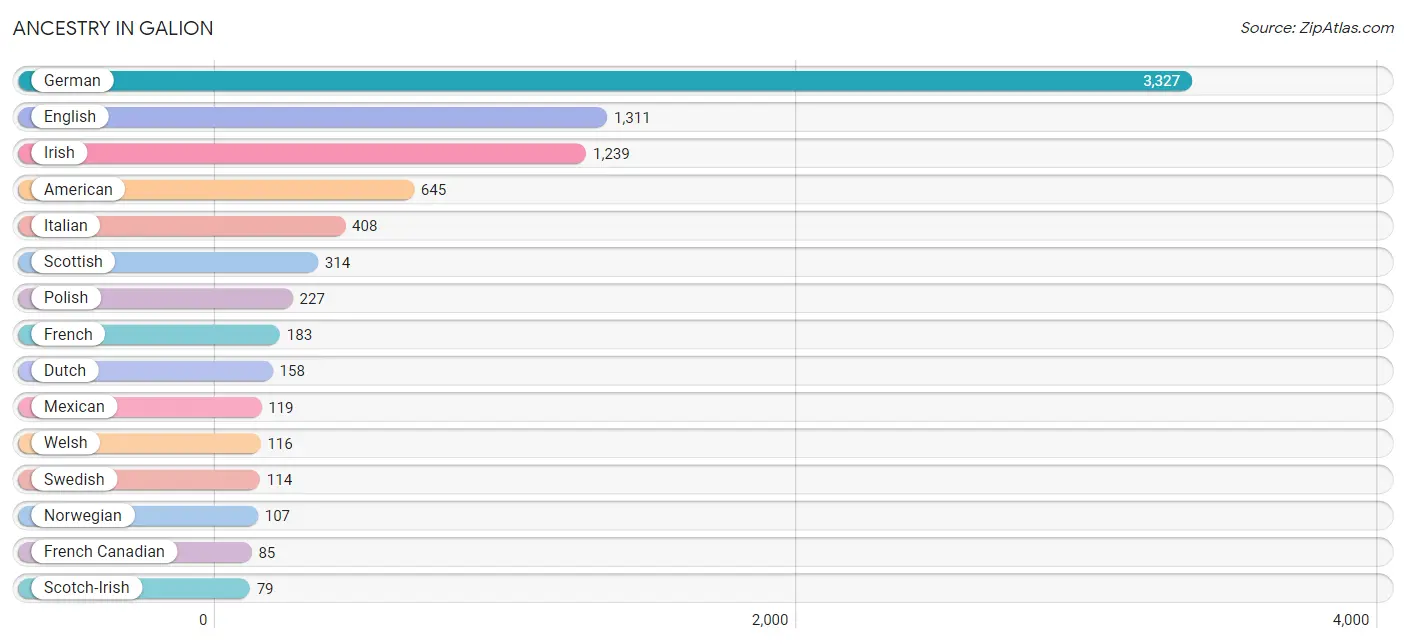
Ancestry in Galion
The most populous ancestries reported in Galion are German (3,327 | 32.1%), English (1,311 | 12.6%), Irish (1,239 | 11.9%), American (645 | 6.2%), and Italian (408 | 3.9%), together accounting for 66.8% of all Galion residents.
| Ancestry | # Population | % Population |
| American | 645 | 6.2% |
| Austrian | 70 | 0.7% |
| British | 34 | 0.3% |
| Burmese | 22 | 0.2% |
| Canadian | 64 | 0.6% |
| Celtic | 4 | 0.0% |
| Cherokee | 45 | 0.4% |
| Colombian | 1 | 0.0% |
| Czech | 29 | 0.3% |
| Dominican | 19 | 0.2% |
| Dutch | 158 | 1.5% |
| Eastern European | 72 | 0.7% |
| English | 1,311 | 12.6% |
| European | 42 | 0.4% |
| French | 183 | 1.8% |
| French Canadian | 85 | 0.8% |
| German | 3,327 | 32.1% |
| Hungarian | 59 | 0.6% |
| Indian (Asian) | 39 | 0.4% |
| Irish | 1,239 | 11.9% |
| Italian | 408 | 3.9% |
| Mexican | 119 | 1.1% |
| Mexican American Indian | 1 | 0.0% |
| Northern European | 31 | 0.3% |
| Norwegian | 107 | 1.0% |
| Pennsylvania German | 9 | 0.1% |
| Polish | 227 | 2.2% |
| Portuguese | 21 | 0.2% |
| Russian | 48 | 0.5% |
| Scotch-Irish | 79 | 0.8% |
| Scottish | 314 | 3.0% |
| Slavic | 5 | 0.1% |
| Slovak | 1 | 0.0% |
| South American | 1 | 0.0% |
| Subsaharan African | 1 | 0.0% |
| Swedish | 114 | 1.1% |
| Swiss | 10 | 0.1% |
| Thai | 7 | 0.1% |
| Ugandan | 1 | 0.0% |
| Welsh | 116 | 1.1% | View All 40 Rows |
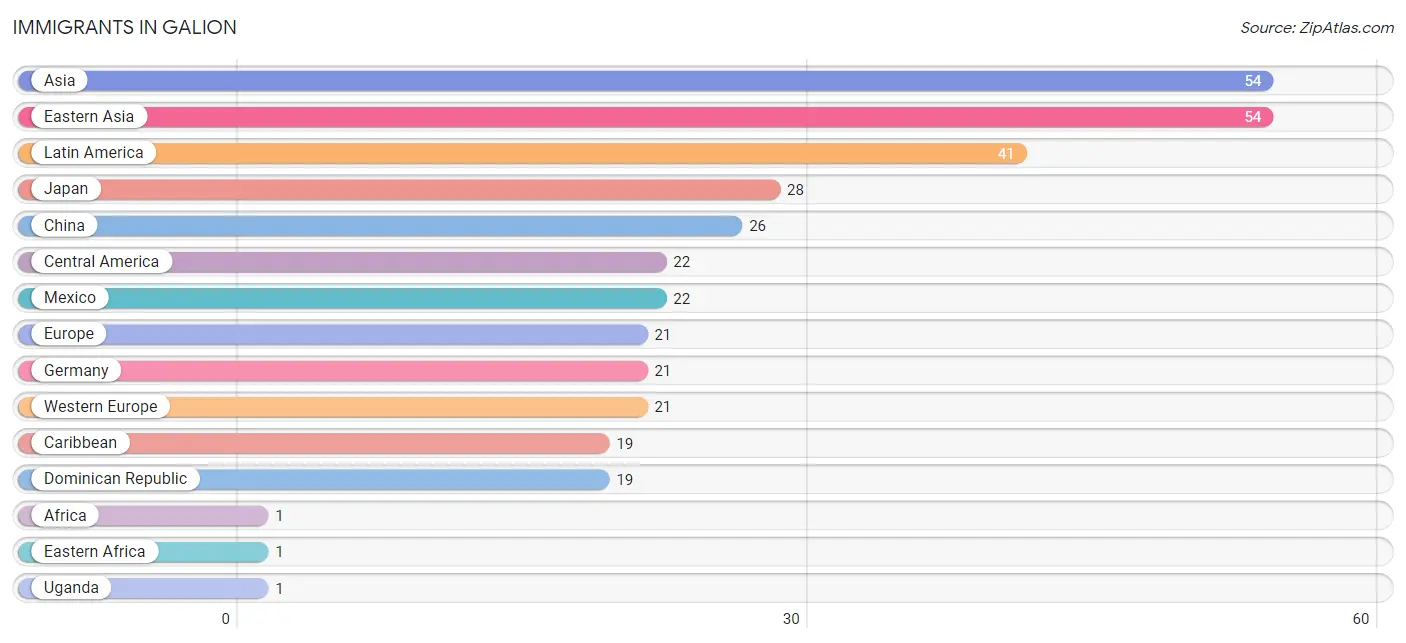
Immigrants in Galion
The most numerous immigrant groups reported in Galion came from Asia (54 | 0.5%), Eastern Asia (54 | 0.5%), Latin America (41 | 0.4%), Japan (28 | 0.3%), and China (26 | 0.3%), together accounting for 2.0% of all Galion residents.
| Immigration Origin | # Population | % Population |
| Africa | 1 | 0.0% |
| Asia | 54 | 0.5% |
| Caribbean | 19 | 0.2% |
| Central America | 22 | 0.2% |
| China | 26 | 0.3% |
| Dominican Republic | 19 | 0.2% |
| Eastern Africa | 1 | 0.0% |
| Eastern Asia | 54 | 0.5% |
| Europe | 21 | 0.2% |
| Germany | 21 | 0.2% |
| Japan | 28 | 0.3% |
| Latin America | 41 | 0.4% |
| Mexico | 22 | 0.2% |
| Uganda | 1 | 0.0% |
| Western Europe | 21 | 0.2% | View All 15 Rows |
Sex and Age in Galion
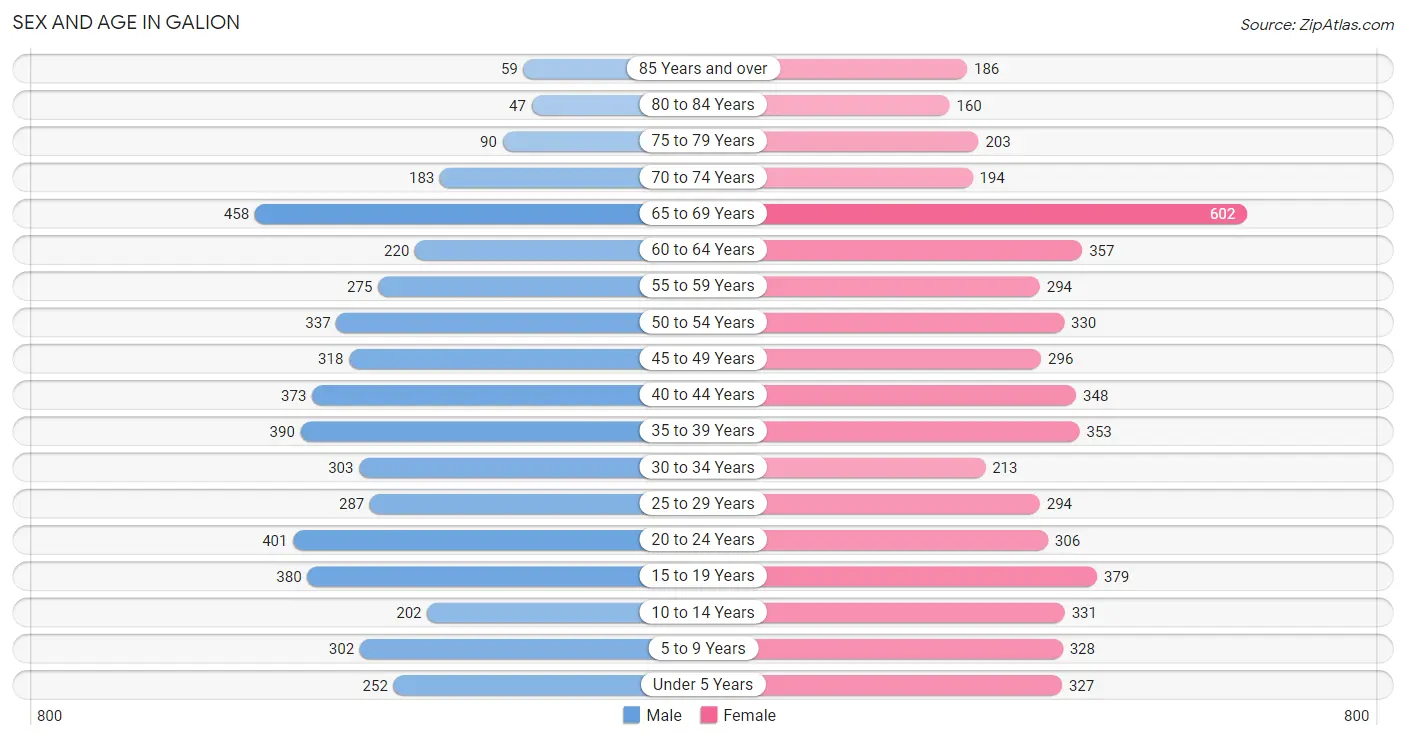
Sex and Age in Galion
The most populous age groups in Galion are 65 to 69 Years (458 | 9.4%) for men and 65 to 69 Years (602 | 10.9%) for women.
| Age Bracket | Male | Female |
| Under 5 Years | 252 (5.2%) | 327 (5.9%) |
| 5 to 9 Years | 302 (6.2%) | 328 (6.0%) |
| 10 to 14 Years | 202 (4.1%) | 331 (6.0%) |
| 15 to 19 Years | 380 (7.8%) | 379 (6.9%) |
| 20 to 24 Years | 401 (8.2%) | 306 (5.6%) |
| 25 to 29 Years | 287 (5.9%) | 294 (5.3%) |
| 30 to 34 Years | 303 (6.2%) | 213 (3.9%) |
| 35 to 39 Years | 390 (8.0%) | 353 (6.4%) |
| 40 to 44 Years | 373 (7.6%) | 348 (6.3%) |
| 45 to 49 Years | 318 (6.5%) | 296 (5.4%) |
| 50 to 54 Years | 337 (6.9%) | 330 (6.0%) |
| 55 to 59 Years | 275 (5.6%) | 294 (5.3%) |
| 60 to 64 Years | 220 (4.5%) | 357 (6.5%) |
| 65 to 69 Years | 458 (9.4%) | 602 (10.9%) |
| 70 to 74 Years | 183 (3.7%) | 194 (3.5%) |
| 75 to 79 Years | 90 (1.8%) | 203 (3.7%) |
| 80 to 84 Years | 47 (1.0%) | 160 (2.9%) |
| 85 Years and over | 59 (1.2%) | 186 (3.4%) |
| Total | 4,877 (100.0%) | 5,501 (100.0%) |
Families and Households in Galion
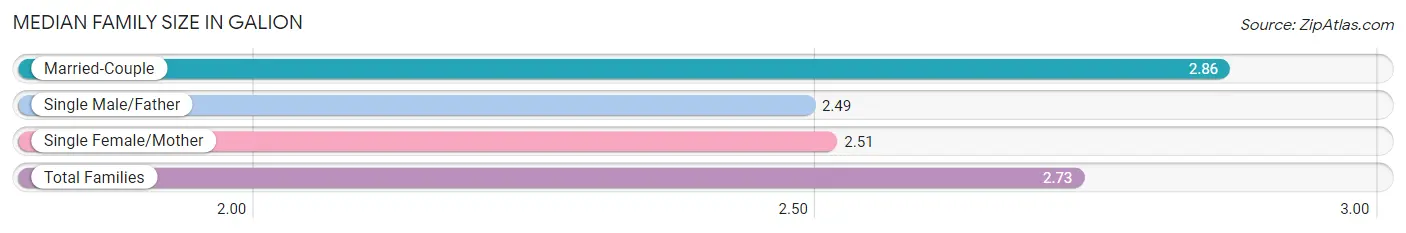
Median Family Size in Galion
The median family size in Galion is 2.73 persons per family, with married-couple families (1,835 | 65.4%) accounting for the largest median family size of 2.86 persons per family. On the other hand, single male/father families (279 | 10.0%) represent the smallest median family size with 2.49 persons per family.
| Family Type | # Families | Family Size |
| Married-Couple | 1,835 (65.4%) | 2.86 |
| Single Male/Father | 279 (10.0%) | 2.49 |
| Single Female/Mother | 690 (24.6%) | 2.51 |
| Total Families | 2,804 (100.0%) | 2.73 |
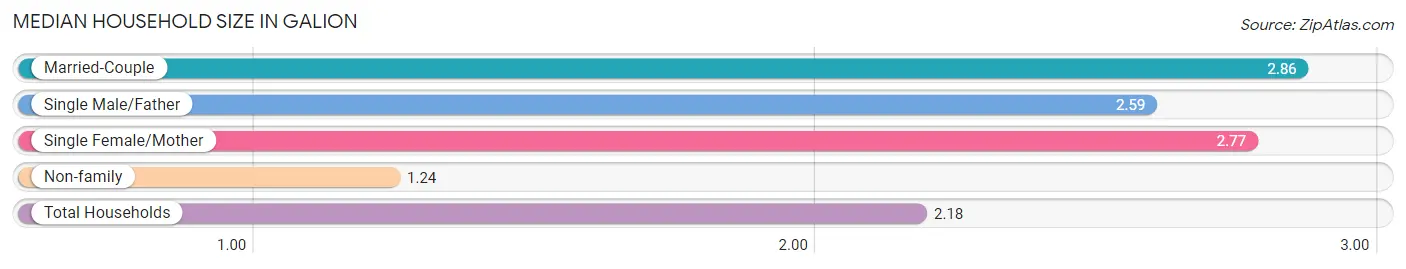
Median Household Size in Galion
The median household size in Galion is 2.18 persons per household, with married-couple households (1,835 | 39.2%) accounting for the largest median household size of 2.86 persons per household. non-family households (1,880 | 40.1%) represent the smallest median household size with 1.24 persons per household.
| Household Type | # Households | Household Size |
| Married-Couple | 1,835 (39.2%) | 2.86 |
| Single Male/Father | 279 (6.0%) | 2.59 |
| Single Female/Mother | 690 (14.7%) | 2.77 |
| Non-family | 1,880 (40.1%) | 1.24 |
| Total Households | 4,684 (100.0%) | 2.18 |
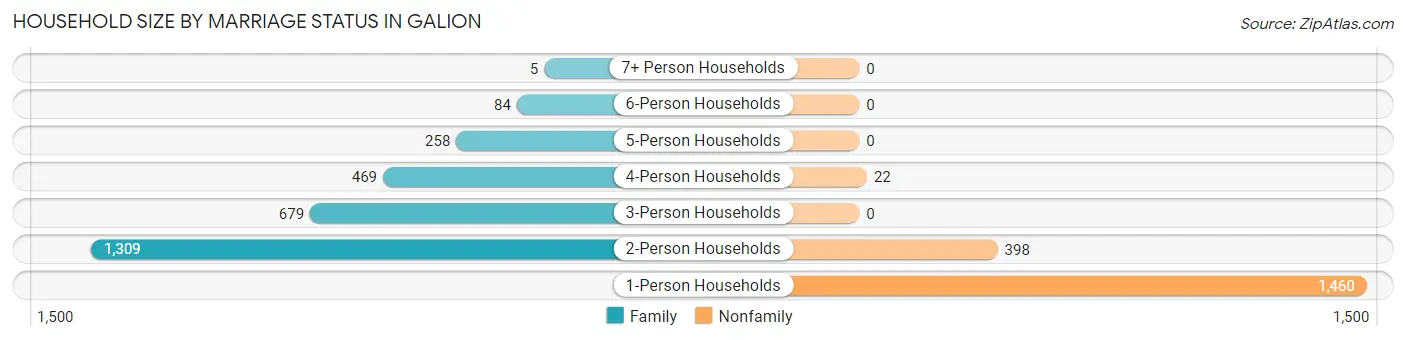
Household Size by Marriage Status in Galion
Out of a total of 4,684 households in Galion, 2,804 (59.9%) are family households, while 1,880 (40.1%) are nonfamily households. The most numerous type of family households are 2-person households, comprising 1,309, and the most common type of nonfamily households are 1-person households, comprising 1,460.
| Household Size | Family Households | Nonfamily Households |
| 1-Person Households | - | 1,460 (31.2%) |
| 2-Person Households | 1,309 (28.0%) | 398 (8.5%) |
| 3-Person Households | 679 (14.5%) | 0 (0.0%) |
| 4-Person Households | 469 (10.0%) | 22 (0.5%) |
| 5-Person Households | 258 (5.5%) | 0 (0.0%) |
| 6-Person Households | 84 (1.8%) | 0 (0.0%) |
| 7+ Person Households | 5 (0.1%) | 0 (0.0%) |
| Total | 2,804 (59.9%) | 1,880 (40.1%) |
Female Fertility in Galion
Fertility by Age in Galion
Average fertility rate in Galion is 74.0 births per 1,000 women. Women in the age bracket of 20 to 34 years have the highest fertility rate with 150.0 births per 1,000 women. Women in the age bracket of 20 to 34 years acount for 74.4% of all women with births.
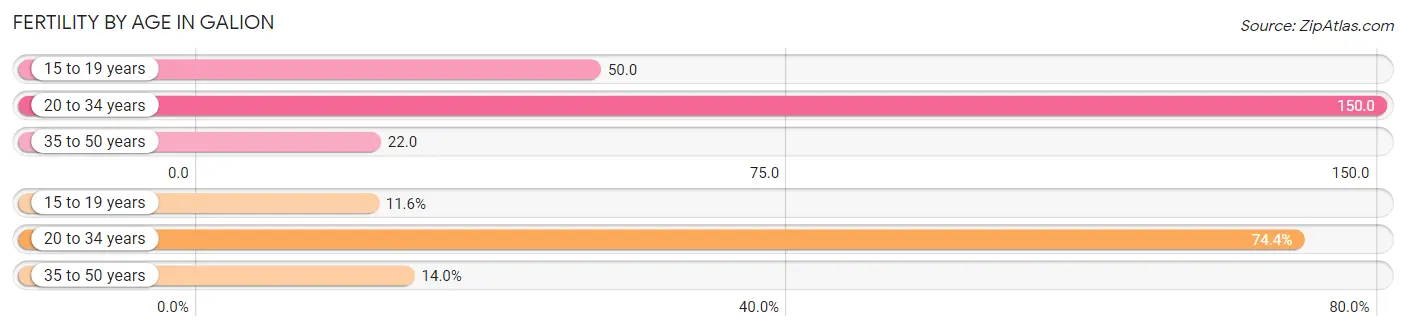
| Age Bracket | Women with Births | Births / 1,000 Women |
| 15 to 19 years | 19 (11.6%) | 50.0 |
| 20 to 34 years | 122 (74.4%) | 150.0 |
| 35 to 50 years | 23 (14.0%) | 22.0 |
| Total | 164 (100.0%) | 74.0 |
Fertility by Age by Marriage Status in Galion
66.5% of women with births (164) in Galion are married. The highest percentage of unmarried women with births falls into 15 to 19 years age bracket with 100.0% of them unmarried at the time of birth, while the lowest percentage of unmarried women with births belong to 20 to 34 years age bracket with 10.7% of them unmarried.
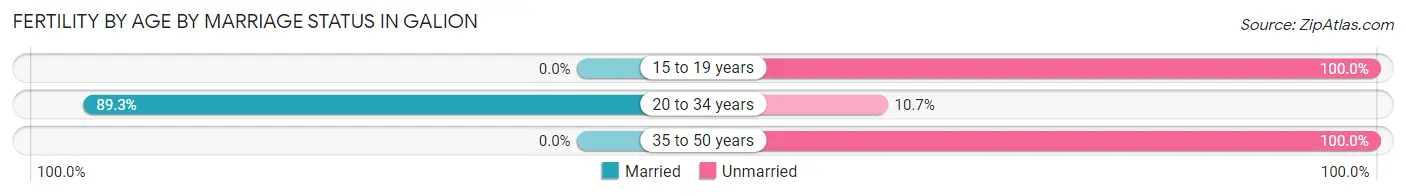
| Age Bracket | Married | Unmarried |
| 15 to 19 years | 0 (0.0%) | 19 (100.0%) |
| 20 to 34 years | 109 (89.3%) | 13 (10.7%) |
| 35 to 50 years | 0 (0.0%) | 23 (100.0%) |
| Total | 109 (66.5%) | 55 (33.5%) |
Fertility by Education in Galion
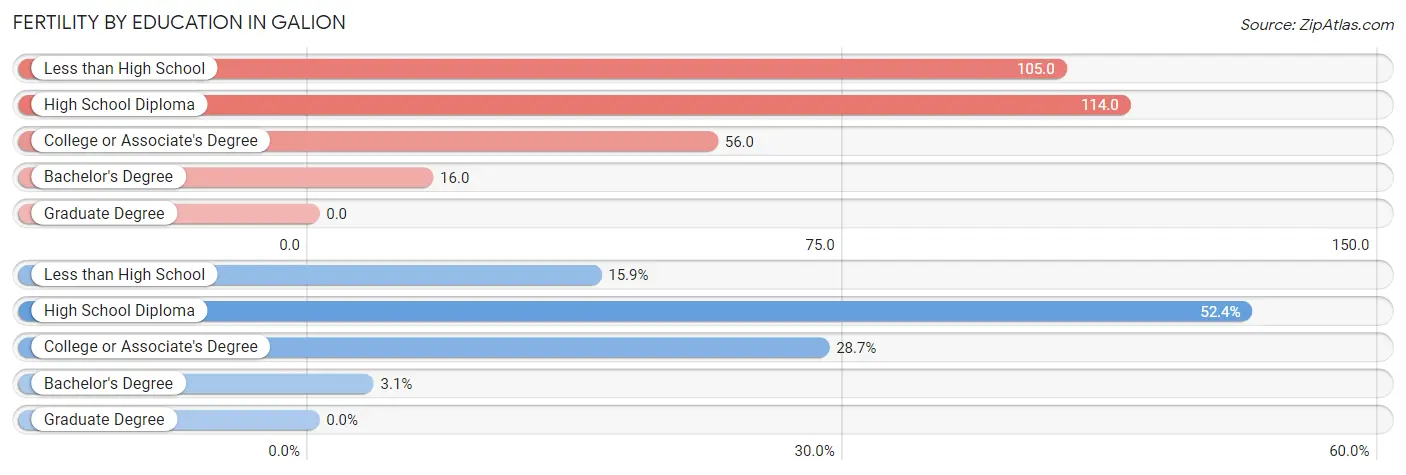
| Educational Attainment | Women with Births | Births / 1,000 Women |
| Less than High School | 26 (15.9%) | 105.0 |
| High School Diploma | 86 (52.4%) | 114.0 |
| College or Associate's Degree | 47 (28.7%) | 56.0 |
| Bachelor's Degree | 5 (3.0%) | 16.0 |
| Graduate Degree | 0 (0.0%) | 0.0 |
| Total | 164 (100.0%) | 74.0 |
Fertility by Education by Marriage Status in Galion
33.5% of women with births in Galion are unmarried. Women with the educational attainment of high school diploma are most likely to be married with 100.0% of them married at childbirth, while women with the educational attainment of less than high school are least likely to be married with 100.0% of them unmarried at childbirth.
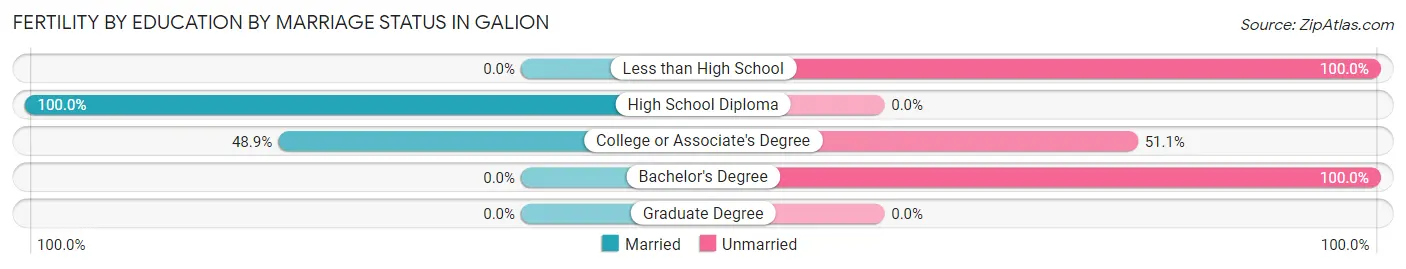
| Educational Attainment | Married | Unmarried |
| Less than High School | 0 (0.0%) | 26 (100.0%) |
| High School Diploma | 86 (100.0%) | 0 (0.0%) |
| College or Associate's Degree | 23 (48.9%) | 24 (51.1%) |
| Bachelor's Degree | 0 (0.0%) | 5 (100.0%) |
| Graduate Degree | 0 (0.0%) | 0 (0.0%) |
| Total | 109 (66.5%) | 55 (33.5%) |
Income in Galion
Income Overview in Galion
Per Capita Income in Galion is $24,849, while median incomes of families and households are $57,401 and $44,458 respectively.
| Characteristic | Number | Measure |
| Per Capita Income | 10,378 | $24,849 |
| Median Family Income | 2,804 | $57,401 |
| Mean Family Income | 2,804 | $68,015 |
| Median Household Income | 4,684 | $44,458 |
| Mean Household Income | 4,684 | $56,645 |
| Income Deficit | 2,804 | $0 |
| Wage / Income Gap (%) | 10,378 | 23.11% |
| Wage / Income Gap ($) | 10,378 | 76.89¢ per $1 |
| Gini / Inequality Index | 10,378 | 0.41 |
Earnings by Sex in Galion
Average Earnings in Galion are $34,111, $37,688 for men and $28,980 for women, a difference of 23.1%.
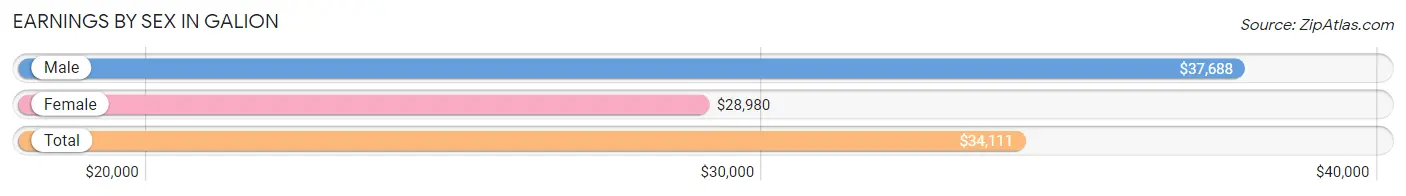
| Sex | Number | Average Earnings |
| Male | 2,775 (55.2%) | $37,688 |
| Female | 2,251 (44.8%) | $28,980 |
| Total | 5,026 (100.0%) | $34,111 |
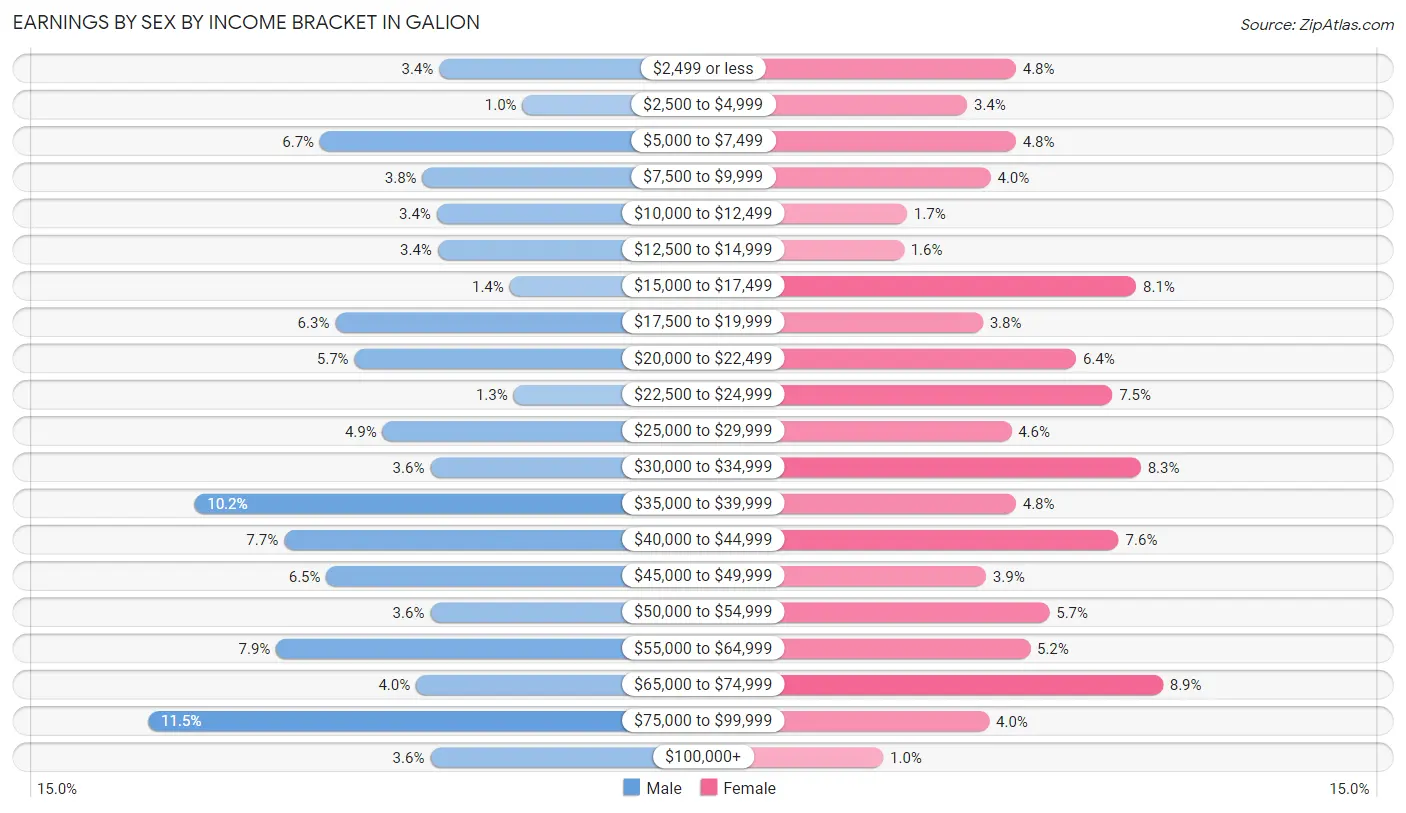
Earnings by Sex by Income Bracket in Galion
The most common earnings brackets in Galion are $75,000 to $99,999 for men (320 | 11.5%) and $65,000 to $74,999 for women (200 | 8.9%).
| Income | Male | Female |
| $2,499 or less | 93 (3.4%) | 107 (4.8%) |
| $2,500 to $4,999 | 28 (1.0%) | 76 (3.4%) |
| $5,000 to $7,499 | 186 (6.7%) | 107 (4.8%) |
| $7,500 to $9,999 | 106 (3.8%) | 91 (4.0%) |
| $10,000 to $12,499 | 95 (3.4%) | 38 (1.7%) |
| $12,500 to $14,999 | 94 (3.4%) | 36 (1.6%) |
| $15,000 to $17,499 | 38 (1.4%) | 183 (8.1%) |
| $17,500 to $19,999 | 174 (6.3%) | 86 (3.8%) |
| $20,000 to $22,499 | 159 (5.7%) | 145 (6.4%) |
| $22,500 to $24,999 | 35 (1.3%) | 168 (7.5%) |
| $25,000 to $29,999 | 137 (4.9%) | 104 (4.6%) |
| $30,000 to $34,999 | 100 (3.6%) | 186 (8.3%) |
| $35,000 to $39,999 | 284 (10.2%) | 107 (4.8%) |
| $40,000 to $44,999 | 214 (7.7%) | 172 (7.6%) |
| $45,000 to $49,999 | 181 (6.5%) | 88 (3.9%) |
| $50,000 to $54,999 | 100 (3.6%) | 128 (5.7%) |
| $55,000 to $64,999 | 220 (7.9%) | 116 (5.1%) |
| $65,000 to $74,999 | 111 (4.0%) | 200 (8.9%) |
| $75,000 to $99,999 | 320 (11.5%) | 90 (4.0%) |
| $100,000+ | 100 (3.6%) | 23 (1.0%) |
| Total | 2,775 (100.0%) | 2,251 (100.0%) |
Earnings by Sex by Educational Attainment in Galion
Average earnings in Galion are $40,088 for men and $30,922 for women, a difference of 22.9%. Men with an educational attainment of graduate degree enjoy the highest average annual earnings of $82,591, while those with bachelor's degree education earn the least with $29,063. Women with an educational attainment of graduate degree earn the most with the average annual earnings of $53,958, while those with high school diploma education have the smallest earnings of $22,482.
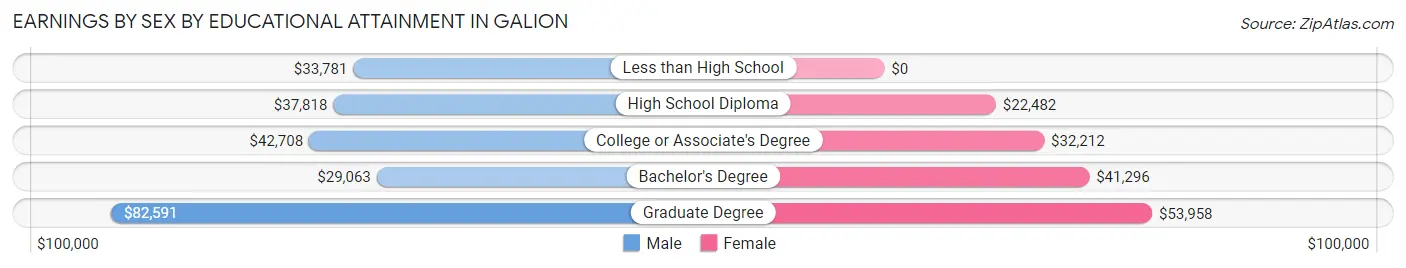
| Educational Attainment | Male Income | Female Income |
| Less than High School | $33,781 | $0 |
| High School Diploma | $37,818 | $22,482 |
| College or Associate's Degree | $42,708 | $32,212 |
| Bachelor's Degree | $29,063 | $41,296 |
| Graduate Degree | $82,591 | $53,958 |
| Total | $40,088 | $30,922 |
Family Income in Galion
Family Income Brackets in Galion
According to the Galion family income data, there are 721 families falling into the $50,000 to $74,999 income range, which is the most common income bracket and makes up 25.7% of all families. Conversely, the $10,000 to $14,999 income bracket is the least frequent group with only 48 families (1.7%) belonging to this category.
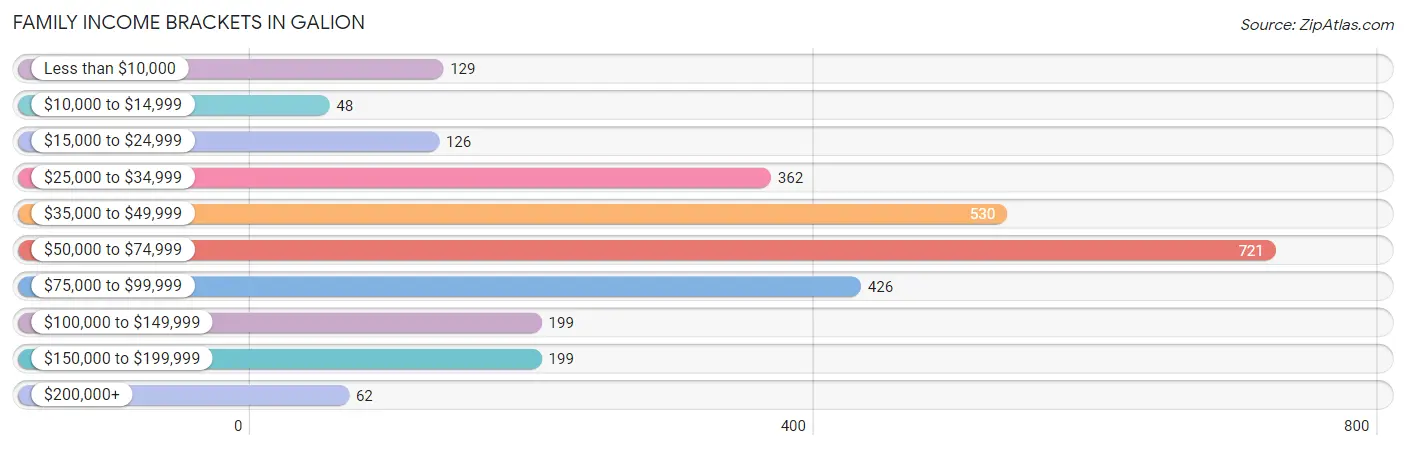
| Income Bracket | # Families | % Families |
| Less than $10,000 | 129 | 4.6% |
| $10,000 to $14,999 | 48 | 1.7% |
| $15,000 to $24,999 | 126 | 4.5% |
| $25,000 to $34,999 | 362 | 12.9% |
| $35,000 to $49,999 | 530 | 18.9% |
| $50,000 to $74,999 | 721 | 25.7% |
| $75,000 to $99,999 | 426 | 15.2% |
| $100,000 to $149,999 | 199 | 7.1% |
| $150,000 to $199,999 | 199 | 7.1% |
| $200,000+ | 62 | 2.2% |
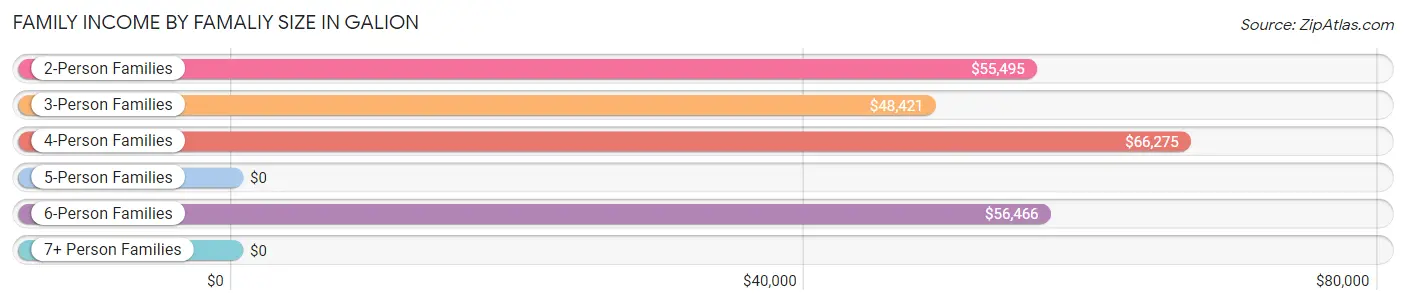
Family Income by Famaliy Size in Galion
4-person families (441 | 15.7%) account for the highest median family income in Galion with $66,275 per family, while 2-person families (1,415 | 50.5%) have the highest median income of $27,748 per family member.
| Income Bracket | # Families | Median Income |
| 2-Person Families | 1,415 (50.5%) | $55,495 |
| 3-Person Families | 622 (22.2%) | $48,421 |
| 4-Person Families | 441 (15.7%) | $66,275 |
| 5-Person Families | 267 (9.5%) | $0 |
| 6-Person Families | 54 (1.9%) | $56,466 |
| 7+ Person Families | 5 (0.2%) | $0 |
| Total | 2,804 (100.0%) | $57,401 |
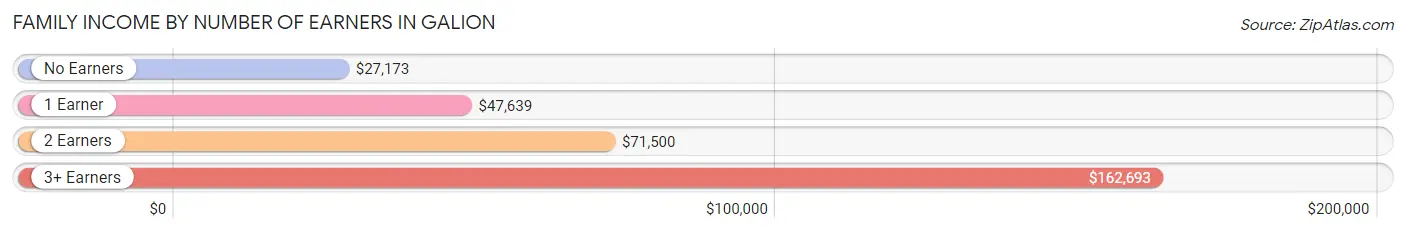
Family Income by Number of Earners in Galion
The median family income in Galion is $57,401, with families comprising 3+ earners (293) having the highest median family income of $162,693, while families with no earners (491) have the lowest median family income of $27,173, accounting for 10.4% and 17.5% of families, respectively.
| Number of Earners | # Families | Median Income |
| No Earners | 491 (17.5%) | $27,173 |
| 1 Earner | 1,024 (36.5%) | $47,639 |
| 2 Earners | 996 (35.5%) | $71,500 |
| 3+ Earners | 293 (10.4%) | $162,693 |
| Total | 2,804 (100.0%) | $57,401 |
Household Income in Galion
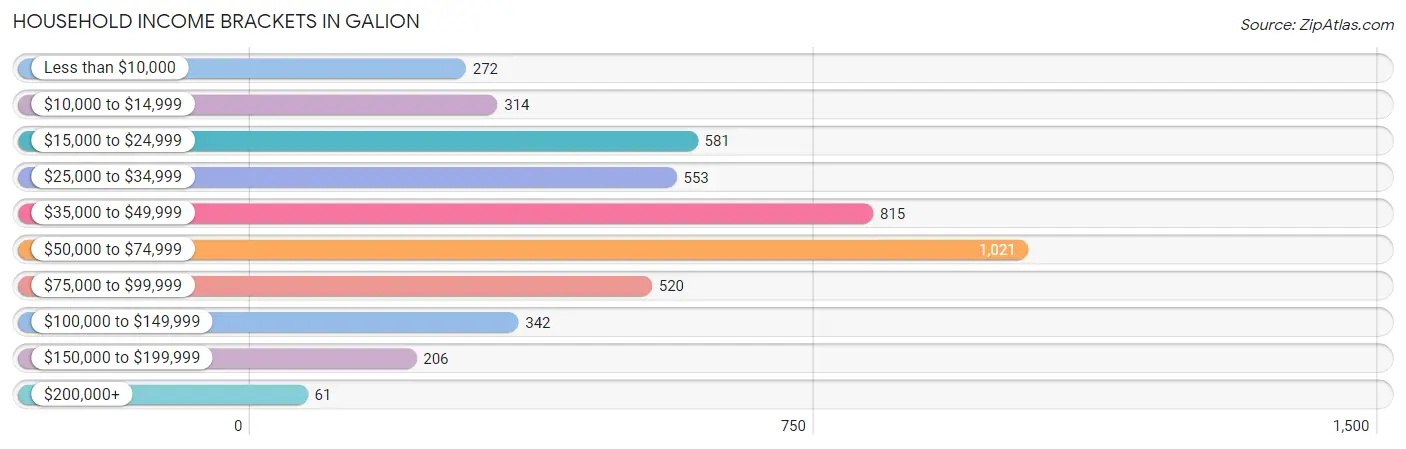
Household Income Brackets in Galion
With 1,021 households falling in the category, the $50,000 to $74,999 income range is the most frequent in Galion, accounting for 21.8% of all households. In contrast, only 61 households (1.3%) fall into the $200,000+ income bracket, making it the least populous group.
| Income Bracket | # Households | % Households |
| Less than $10,000 | 272 | 5.8% |
| $10,000 to $14,999 | 314 | 6.7% |
| $15,000 to $24,999 | 581 | 12.4% |
| $25,000 to $34,999 | 553 | 11.8% |
| $35,000 to $49,999 | 815 | 17.4% |
| $50,000 to $74,999 | 1,021 | 21.8% |
| $75,000 to $99,999 | 520 | 11.1% |
| $100,000 to $149,999 | 342 | 7.3% |
| $150,000 to $199,999 | 206 | 4.4% |
| $200,000+ | 61 | 1.3% |
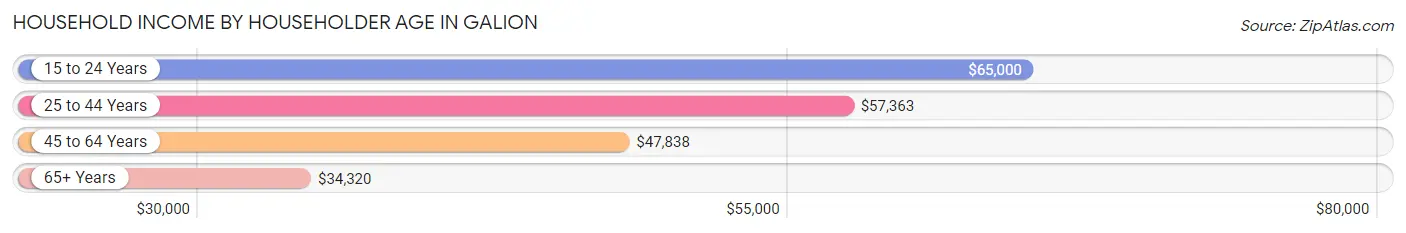
Household Income by Householder Age in Galion
The median household income in Galion is $44,458, with the highest median household income of $65,000 found in the 15 to 24 years age bracket for the primary householder. A total of 350 households (7.5%) fall into this category. Meanwhile, the 65+ years age bracket for the primary householder has the lowest median household income of $34,320, with 1,493 households (31.9%) in this group.
| Income Bracket | # Households | Median Income |
| 15 to 24 Years | 350 (7.5%) | $65,000 |
| 25 to 44 Years | 1,417 (30.2%) | $57,363 |
| 45 to 64 Years | 1,424 (30.4%) | $47,838 |
| 65+ Years | 1,493 (31.9%) | $34,320 |
| Total | 4,684 (100.0%) | $44,458 |
Poverty in Galion
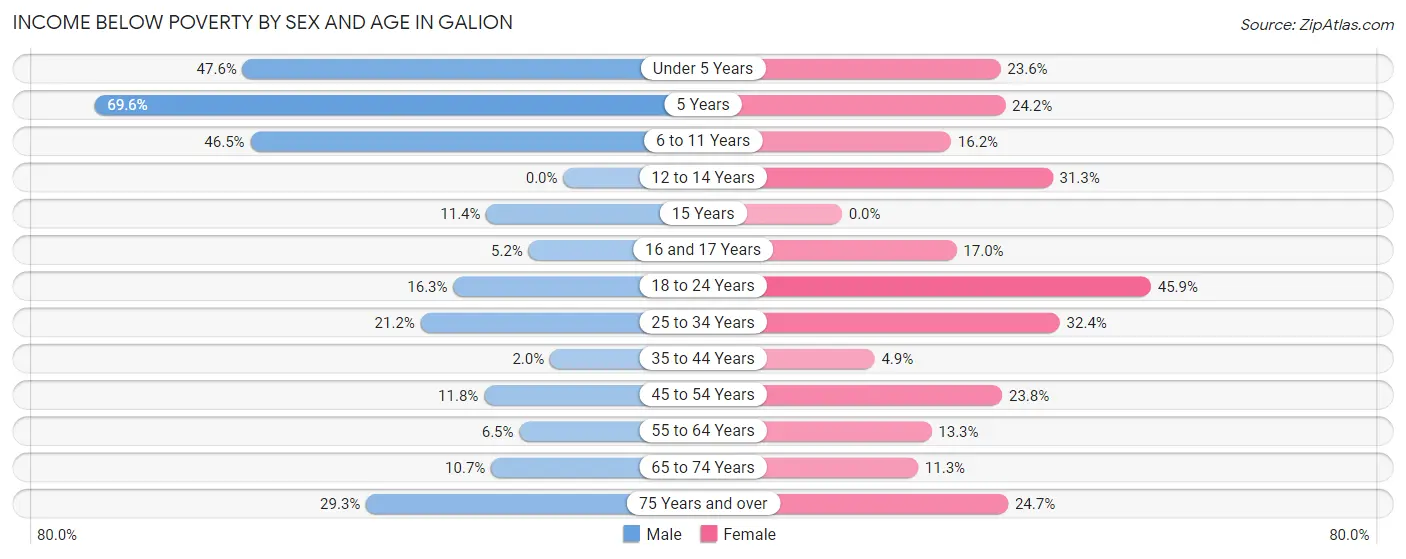
Income Below Poverty by Sex and Age in Galion
With 16.8% poverty level for males and 20.2% for females among the residents of Galion, 5 year old males and 18 to 24 year old females are the most vulnerable to poverty, with 39 males (69.6%) and 217 females (45.9%) in their respective age groups living below the poverty level.
| Age Bracket | Male | Female |
| Under 5 Years | 120 (47.6%) | 77 (23.5%) |
| 5 Years | 39 (69.6%) | 8 (24.2%) |
| 6 to 11 Years | 171 (46.5%) | 75 (16.2%) |
| 12 to 14 Years | 0 (0.0%) | 51 (31.3%) |
| 15 Years | 12 (11.4%) | 0 (0.0%) |
| 16 and 17 Years | 7 (5.1%) | 24 (17.0%) |
| 18 to 24 Years | 88 (16.3%) | 217 (45.9%) |
| 25 to 34 Years | 125 (21.2%) | 164 (32.4%) |
| 35 to 44 Years | 15 (2.0%) | 34 (4.9%) |
| 45 to 54 Years | 77 (11.8%) | 149 (23.8%) |
| 55 to 64 Years | 32 (6.5%) | 81 (13.3%) |
| 65 to 74 Years | 67 (10.7%) | 88 (11.3%) |
| 75 Years and over | 53 (29.3%) | 116 (24.7%) |
| Total | 806 (16.8%) | 1,084 (20.2%) |
Income Above Poverty by Sex and Age in Galion
According to the poverty statistics in Galion, males aged 12 to 14 years and females aged 15 years are the age groups that are most secure financially, with 100.0% of males and 100.0% of females in these age groups living above the poverty line.

| Age Bracket | Male | Female |
| Under 5 Years | 132 (52.4%) | 250 (76.4%) |
| 5 Years | 17 (30.4%) | 25 (75.8%) |
| 6 to 11 Years | 197 (53.5%) | 388 (83.8%) |
| 12 to 14 Years | 28 (100.0%) | 112 (68.7%) |
| 15 Years | 93 (88.6%) | 71 (100.0%) |
| 16 and 17 Years | 129 (94.9%) | 117 (83.0%) |
| 18 to 24 Years | 451 (83.7%) | 256 (54.1%) |
| 25 to 34 Years | 465 (78.8%) | 343 (67.6%) |
| 35 to 44 Years | 748 (98.0%) | 667 (95.2%) |
| 45 to 54 Years | 578 (88.2%) | 477 (76.2%) |
| 55 to 64 Years | 458 (93.5%) | 528 (86.7%) |
| 65 to 74 Years | 558 (89.3%) | 691 (88.7%) |
| 75 Years and over | 128 (70.7%) | 354 (75.3%) |
| Total | 3,982 (83.2%) | 4,279 (79.8%) |
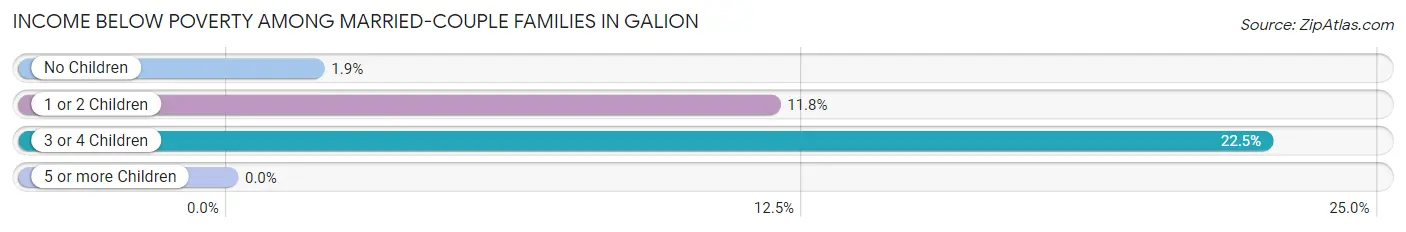
Income Below Poverty Among Married-Couple Families in Galion
The poverty statistics for married-couple families in Galion show that 6.7% or 123 of the total 1,835 families live below the poverty line. Families with 3 or 4 children have the highest poverty rate of 22.5%, comprising of 25 families. On the other hand, families with no children have the lowest poverty rate of 1.9%, which includes 20 families.
| Children | Above Poverty | Below Poverty |
| No Children | 1,043 (98.1%) | 20 (1.9%) |
| 1 or 2 Children | 583 (88.2%) | 78 (11.8%) |
| 3 or 4 Children | 86 (77.5%) | 25 (22.5%) |
| 5 or more Children | 0 (0.0%) | 0 (0.0%) |
| Total | 1,712 (93.3%) | 123 (6.7%) |
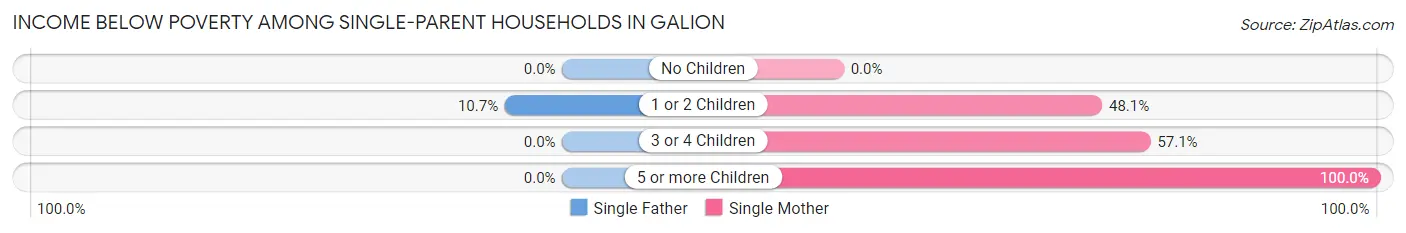
Income Below Poverty Among Single-Parent Households in Galion
According to the poverty data in Galion, 6.5% or 18 single-father households and 32.2% or 222 single-mother households are living below the poverty line. Among single-father households, those with 1 or 2 children have the highest poverty rate, with 18 households (10.7%) experiencing poverty. Likewise, among single-mother households, those with 5 or more children have the highest poverty rate, with 5 households (100.0%) falling below the poverty line.
| Children | Single Father | Single Mother |
| No Children | 0 (0.0%) | 0 (0.0%) |
| 1 or 2 Children | 18 (10.7%) | 193 (48.1%) |
| 3 or 4 Children | 0 (0.0%) | 24 (57.1%) |
| 5 or more Children | 0 (0.0%) | 5 (100.0%) |
| Total | 18 (6.5%) | 222 (32.2%) |
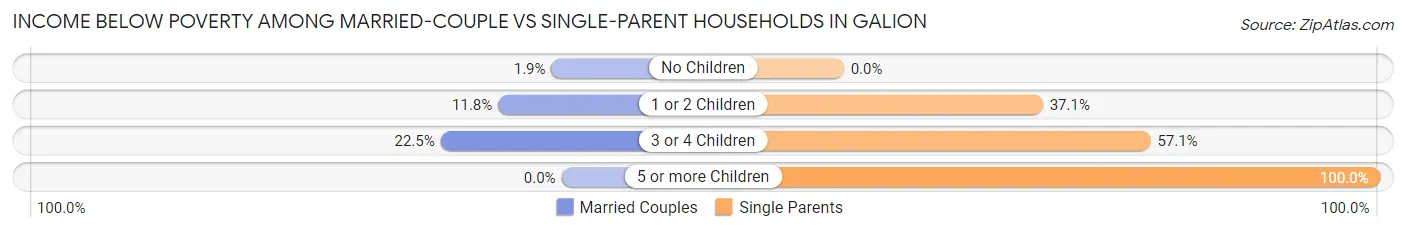
Income Below Poverty Among Married-Couple vs Single-Parent Households in Galion
The poverty data for Galion shows that 123 of the married-couple family households (6.7%) and 240 of the single-parent households (24.8%) are living below the poverty level. Within the married-couple family households, those with 3 or 4 children have the highest poverty rate, with 25 households (22.5%) falling below the poverty line. Among the single-parent households, those with 5 or more children have the highest poverty rate, with 5 household (100.0%) living below poverty.
| Children | Married-Couple Families | Single-Parent Households |
| No Children | 20 (1.9%) | 0 (0.0%) |
| 1 or 2 Children | 78 (11.8%) | 211 (37.1%) |
| 3 or 4 Children | 25 (22.5%) | 24 (57.1%) |
| 5 or more Children | 0 (0.0%) | 5 (100.0%) |
| Total | 123 (6.7%) | 240 (24.8%) |
Employment Characteristics in Galion
Employment by Class of Employer in Galion
Among the 4,408 employed individuals in Galion, private company employees (3,422 | 77.6%), local government employees (328 | 7.4%), and not-for-profit organizations (263 | 6.0%) make up the most common classes of employment.
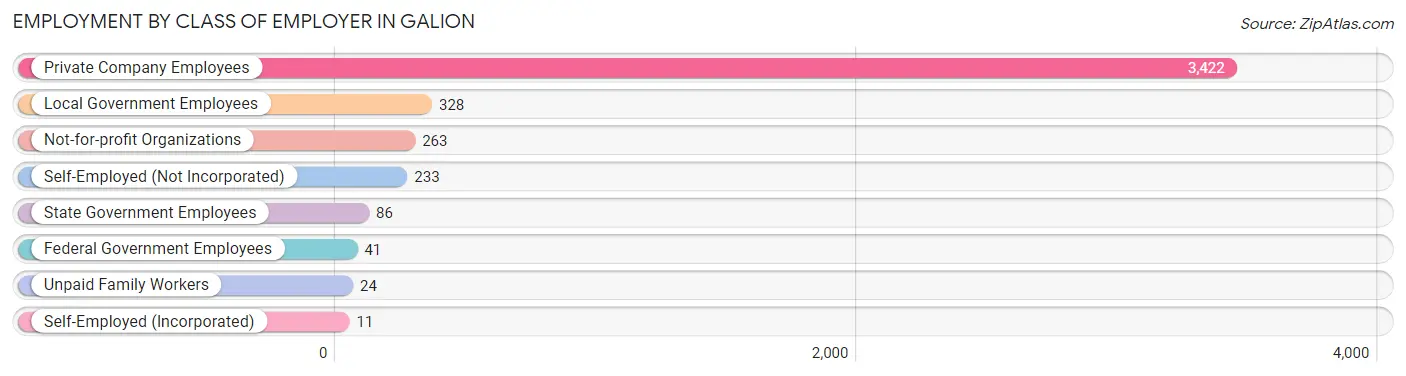
| Employer Class | # Employees | % Employees |
| Private Company Employees | 3,422 | 77.6% |
| Self-Employed (Incorporated) | 11 | 0.3% |
| Self-Employed (Not Incorporated) | 233 | 5.3% |
| Not-for-profit Organizations | 263 | 6.0% |
| Local Government Employees | 328 | 7.4% |
| State Government Employees | 86 | 1.9% |
| Federal Government Employees | 41 | 0.9% |
| Unpaid Family Workers | 24 | 0.5% |
| Total | 4,408 | 100.0% |
Employment Status by Age in Galion
According to the labor force statistics for Galion, out of the total population over 16 years of age (8,460), 57.8% or 4,890 individuals are in the labor force, with 7.2% or 352 of them unemployed. The age group with the highest labor force participation rate is 35 to 44 years, with 87.7% or 1,284 individuals in the labor force. Within the labor force, the 16 to 19 years age range has the highest percentage of unemployed individuals, with 33.8% or 94 of them being unemployed.
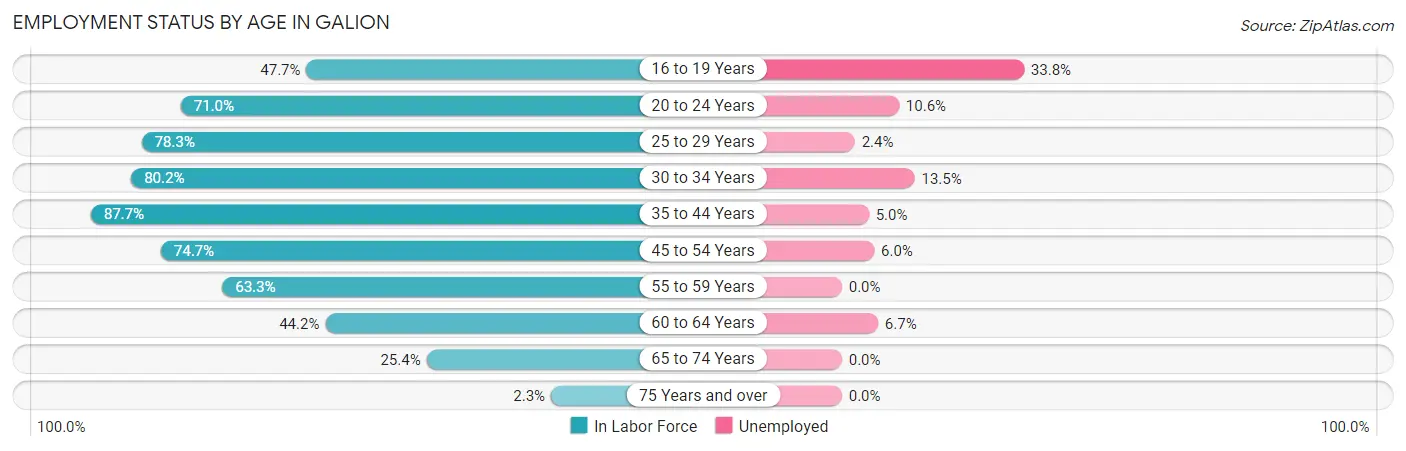
| Age Bracket | In Labor Force | Unemployed |
| 16 to 19 Years | 278 (47.7%) | 94 (33.8%) |
| 20 to 24 Years | 502 (71.0%) | 53 (10.6%) |
| 25 to 29 Years | 455 (78.3%) | 11 (2.4%) |
| 30 to 34 Years | 414 (80.2%) | 56 (13.5%) |
| 35 to 44 Years | 1,284 (87.7%) | 64 (5.0%) |
| 45 to 54 Years | 957 (74.7%) | 57 (6.0%) |
| 55 to 59 Years | 360 (63.3%) | 0 (0.0%) |
| 60 to 64 Years | 255 (44.2%) | 17 (6.7%) |
| 65 to 74 Years | 365 (25.4%) | 0 (0.0%) |
| 75 Years and over | 17 (2.3%) | 0 (0.0%) |
| Total | 4,890 (57.8%) | 352 (7.2%) |
Employment Status by Educational Attainment in Galion
According to labor force statistics for Galion, 74.7% of individuals (3,726) out of the total population between 25 and 64 years of age (4,988) are in the labor force, with 5.5% or 205 of them being unemployed. The group with the highest labor force participation rate are those with the educational attainment of bachelor's degree or higher, with 85.4% or 613 individuals in the labor force. Within the labor force, individuals with less than high school education have the highest percentage of unemployment, with 14.4% or 42 of them being unemployed.
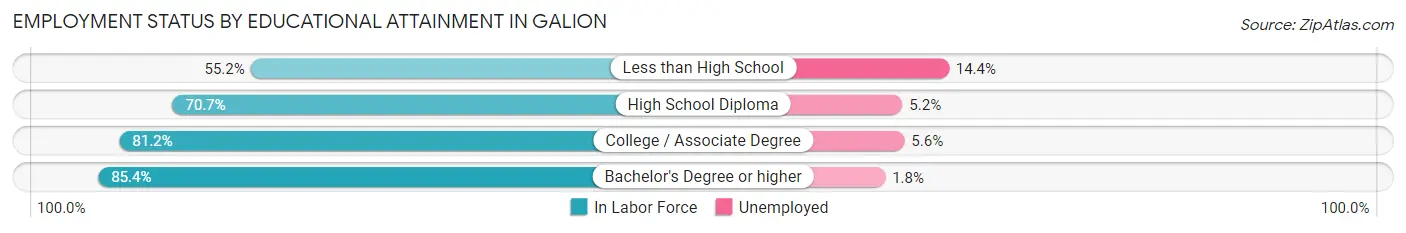
| Educational Attainment | In Labor Force | Unemployed |
| Less than High School | 292 (55.2%) | 76 (14.4%) |
| High School Diploma | 1,468 (70.7%) | 108 (5.2%) |
| College / Associate Degree | 1,352 (81.2%) | 93 (5.6%) |
| Bachelor's Degree or higher | 613 (85.4%) | 13 (1.8%) |
| Total | 3,726 (74.7%) | 274 (5.5%) |
Employment Occupations by Sex in Galion
Management, Business, Science and Arts Occupations
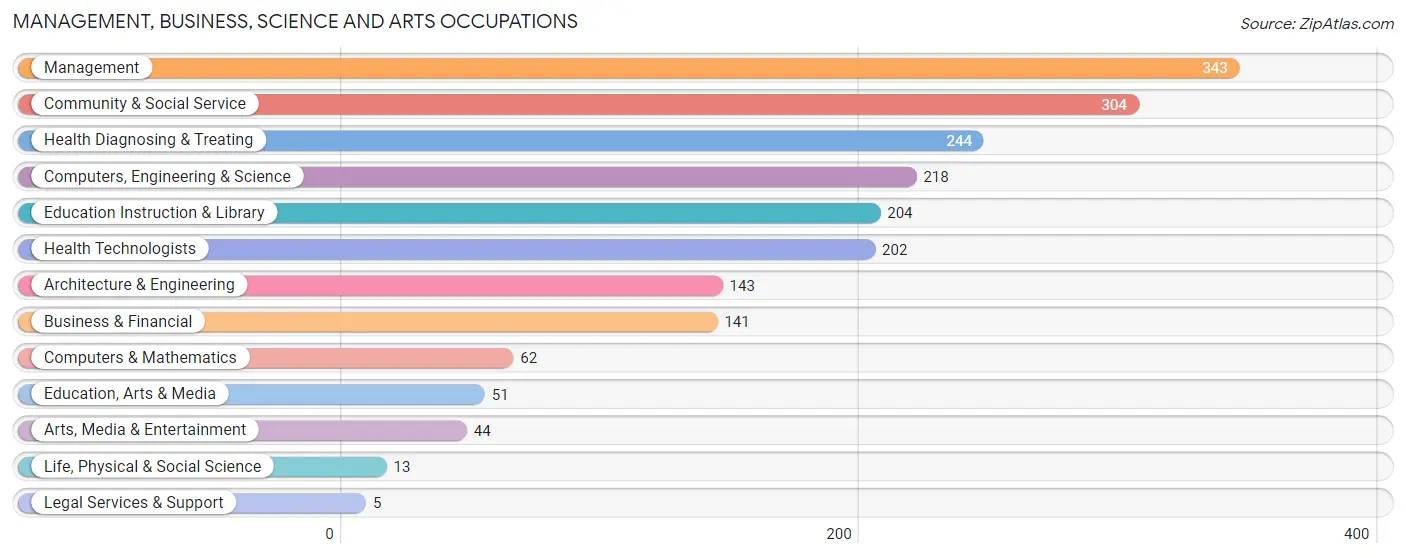
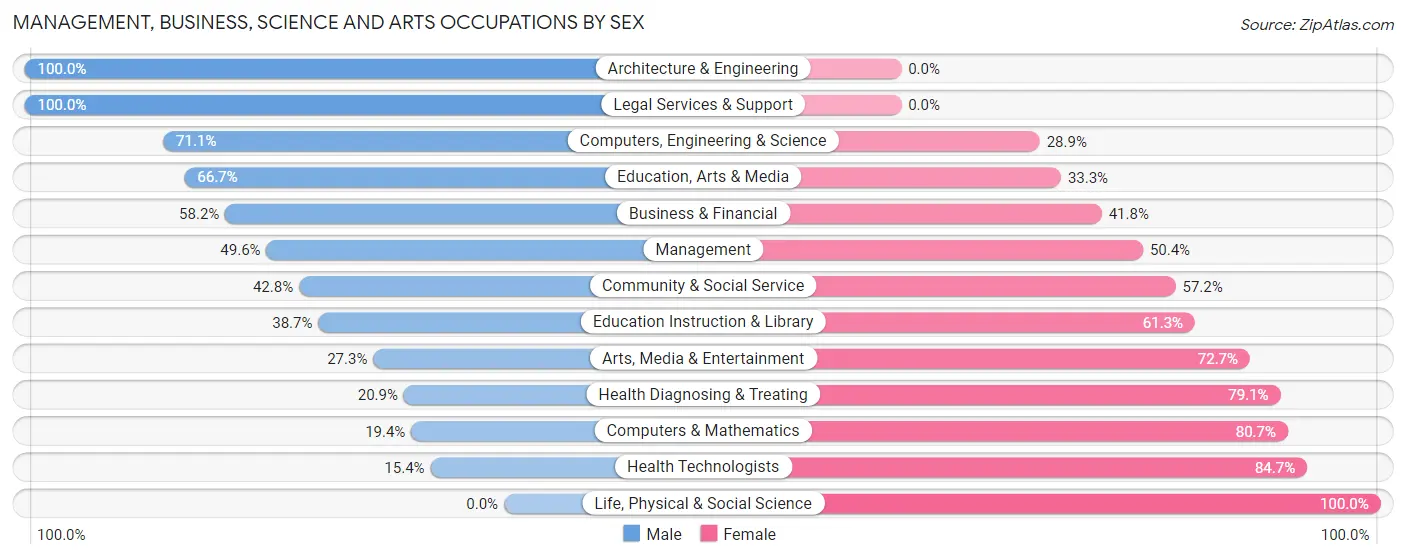
The most common Management, Business, Science and Arts occupations in Galion are Management (343 | 7.6%), Community & Social Service (304 | 6.7%), Health Diagnosing & Treating (244 | 5.4%), Computers, Engineering & Science (218 | 4.8%), and Education Instruction & Library (204 | 4.5%).
Management, Business, Science and Arts Occupations by Sex
Within the Management, Business, Science and Arts occupations in Galion, the most male-oriented occupations are Architecture & Engineering (100.0%), Legal Services & Support (100.0%), and Computers, Engineering & Science (71.1%), while the most female-oriented occupations are Life, Physical & Social Science (100.0%), Health Technologists (84.7%), and Computers & Mathematics (80.6%).
| Occupation | Male | Female |
| Management | 170 (49.6%) | 173 (50.4%) |
| Business & Financial | 82 (58.2%) | 59 (41.8%) |
| Computers, Engineering & Science | 155 (71.1%) | 63 (28.9%) |
| Computers & Mathematics | 12 (19.4%) | 50 (80.6%) |
| Architecture & Engineering | 143 (100.0%) | 0 (0.0%) |
| Life, Physical & Social Science | 0 (0.0%) | 13 (100.0%) |
| Community & Social Service | 130 (42.8%) | 174 (57.2%) |
| Education, Arts & Media | 34 (66.7%) | 17 (33.3%) |
| Legal Services & Support | 5 (100.0%) | 0 (0.0%) |
| Education Instruction & Library | 79 (38.7%) | 125 (61.3%) |
| Arts, Media & Entertainment | 12 (27.3%) | 32 (72.7%) |
| Health Diagnosing & Treating | 51 (20.9%) | 193 (79.1%) |
| Health Technologists | 31 (15.3%) | 171 (84.7%) |
| Total (Category) | 588 (47.0%) | 662 (53.0%) |
| Total (Overall) | 2,517 (55.5%) | 2,018 (44.5%) |
Services Occupations
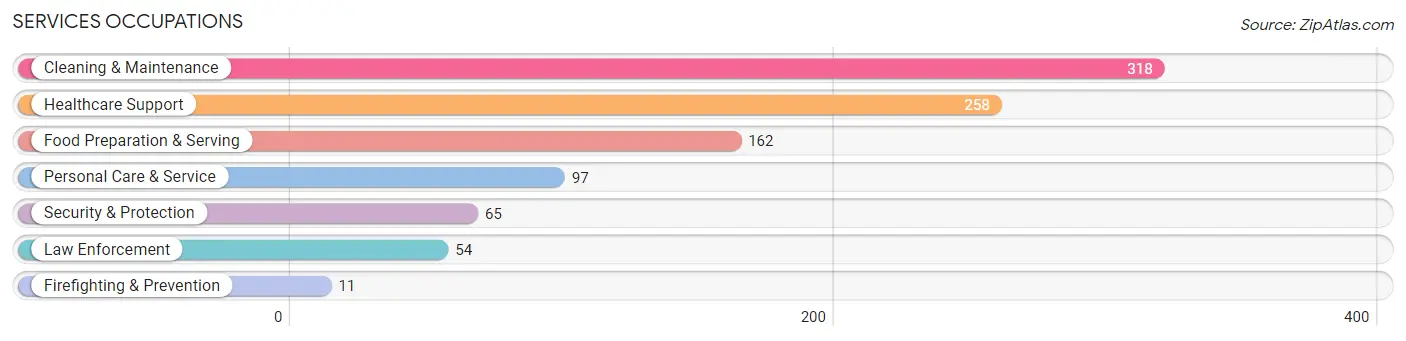
The most common Services occupations in Galion are Cleaning & Maintenance (318 | 7.0%), Healthcare Support (258 | 5.7%), Food Preparation & Serving (162 | 3.6%), Personal Care & Service (97 | 2.1%), and Security & Protection (65 | 1.4%).
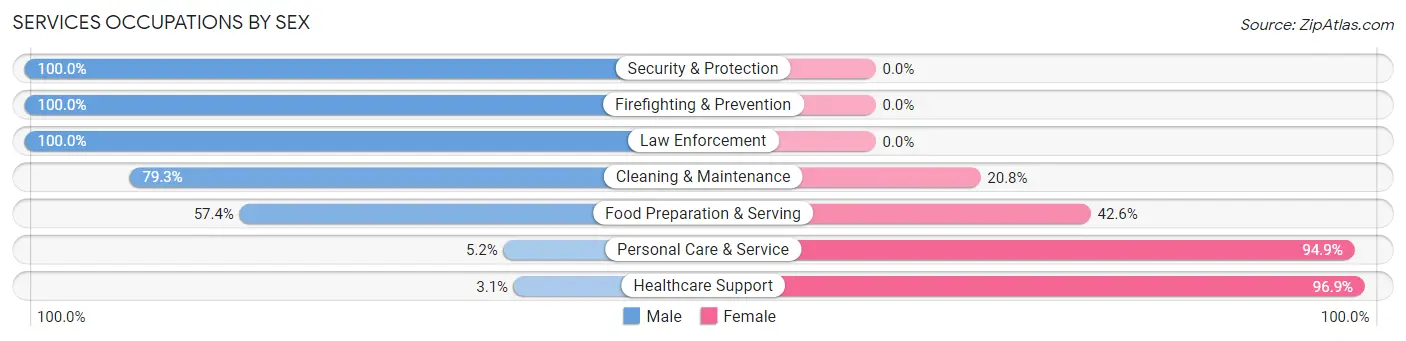
Services Occupations by Sex
Within the Services occupations in Galion, the most male-oriented occupations are Security & Protection (100.0%), Firefighting & Prevention (100.0%), and Law Enforcement (100.0%), while the most female-oriented occupations are Healthcare Support (96.9%), Personal Care & Service (94.9%), and Food Preparation & Serving (42.6%).
| Occupation | Male | Female |
| Healthcare Support | 8 (3.1%) | 250 (96.9%) |
| Security & Protection | 65 (100.0%) | 0 (0.0%) |
| Firefighting & Prevention | 11 (100.0%) | 0 (0.0%) |
| Law Enforcement | 54 (100.0%) | 0 (0.0%) |
| Food Preparation & Serving | 93 (57.4%) | 69 (42.6%) |
| Cleaning & Maintenance | 252 (79.2%) | 66 (20.7%) |
| Personal Care & Service | 5 (5.1%) | 92 (94.9%) |
| Total (Category) | 423 (47.0%) | 477 (53.0%) |
| Total (Overall) | 2,517 (55.5%) | 2,018 (44.5%) |
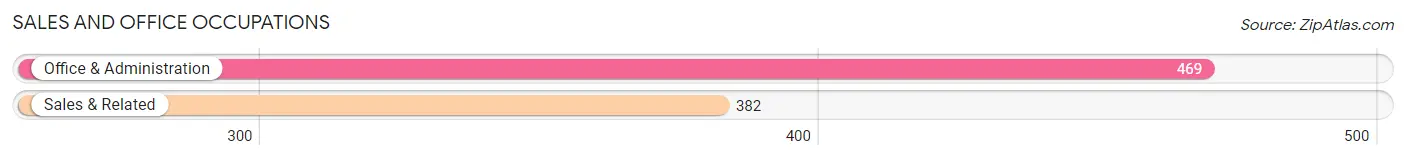
Sales and Office Occupations
The most common Sales and Office occupations in Galion are Office & Administration (469 | 10.3%), and Sales & Related (382 | 8.4%).
Sales and Office Occupations by Sex
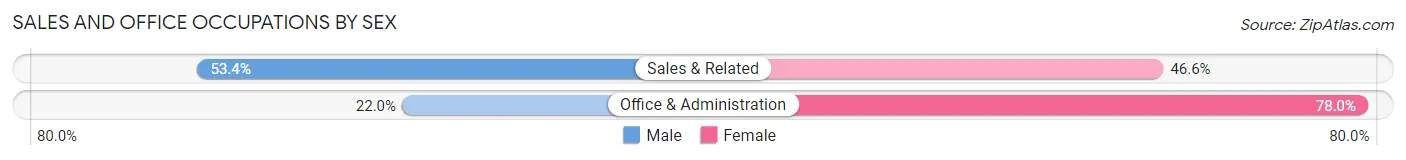
| Occupation | Male | Female |
| Sales & Related | 204 (53.4%) | 178 (46.6%) |
| Office & Administration | 103 (22.0%) | 366 (78.0%) |
| Total (Category) | 307 (36.1%) | 544 (63.9%) |
| Total (Overall) | 2,517 (55.5%) | 2,018 (44.5%) |
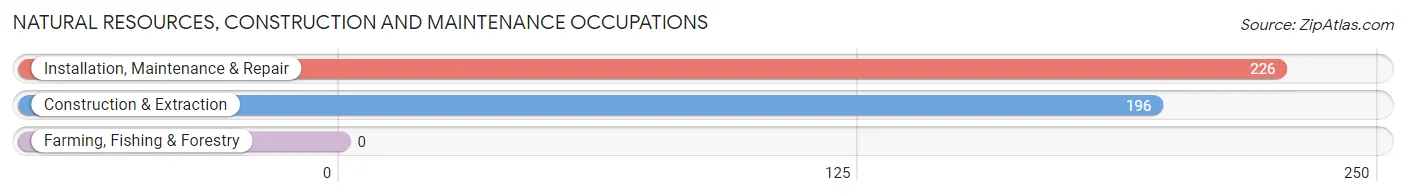
Natural Resources, Construction and Maintenance Occupations
The most common Natural Resources, Construction and Maintenance occupations in Galion are Installation, Maintenance & Repair (226 | 5.0%), and Construction & Extraction (196 | 4.3%).
Natural Resources, Construction and Maintenance Occupations by Sex
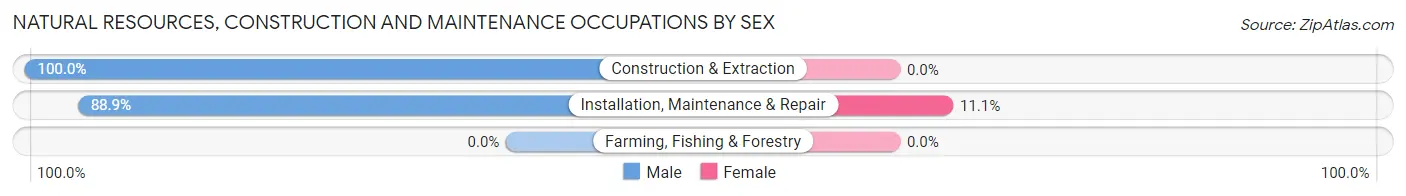
| Occupation | Male | Female |
| Farming, Fishing & Forestry | 0 (0.0%) | 0 (0.0%) |
| Construction & Extraction | 196 (100.0%) | 0 (0.0%) |
| Installation, Maintenance & Repair | 201 (88.9%) | 25 (11.1%) |
| Total (Category) | 397 (94.1%) | 25 (5.9%) |
| Total (Overall) | 2,517 (55.5%) | 2,018 (44.5%) |
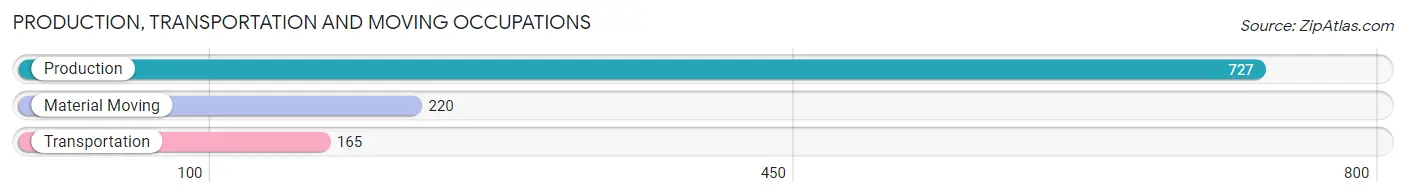
Production, Transportation and Moving Occupations
The most common Production, Transportation and Moving occupations in Galion are Production (727 | 16.0%), Material Moving (220 | 4.9%), and Transportation (165 | 3.6%).
Production, Transportation and Moving Occupations by Sex
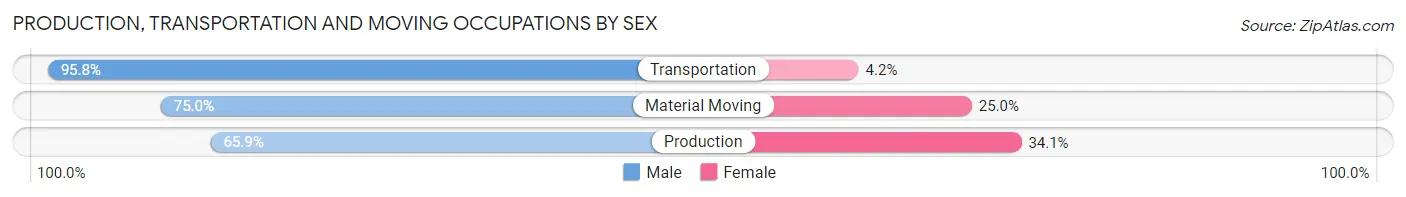
| Occupation | Male | Female |
| Production | 479 (65.9%) | 248 (34.1%) |
| Transportation | 158 (95.8%) | 7 (4.2%) |
| Material Moving | 165 (75.0%) | 55 (25.0%) |
| Total (Category) | 802 (72.1%) | 310 (27.9%) |
| Total (Overall) | 2,517 (55.5%) | 2,018 (44.5%) |
Employment Industries by Sex in Galion
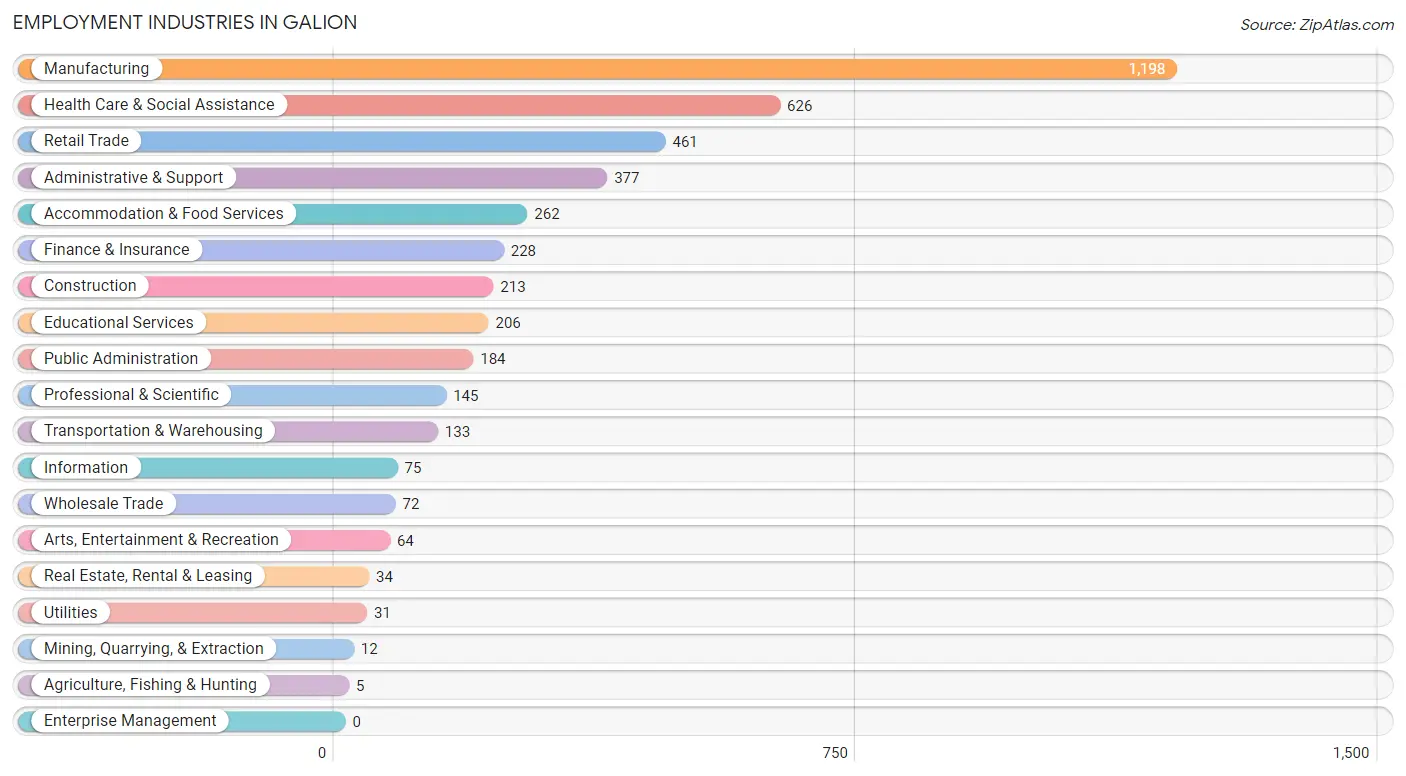
Employment Industries in Galion
The major employment industries in Galion include Manufacturing (1,198 | 26.4%), Health Care & Social Assistance (626 | 13.8%), Retail Trade (461 | 10.2%), Administrative & Support (377 | 8.3%), and Accommodation & Food Services (262 | 5.8%).
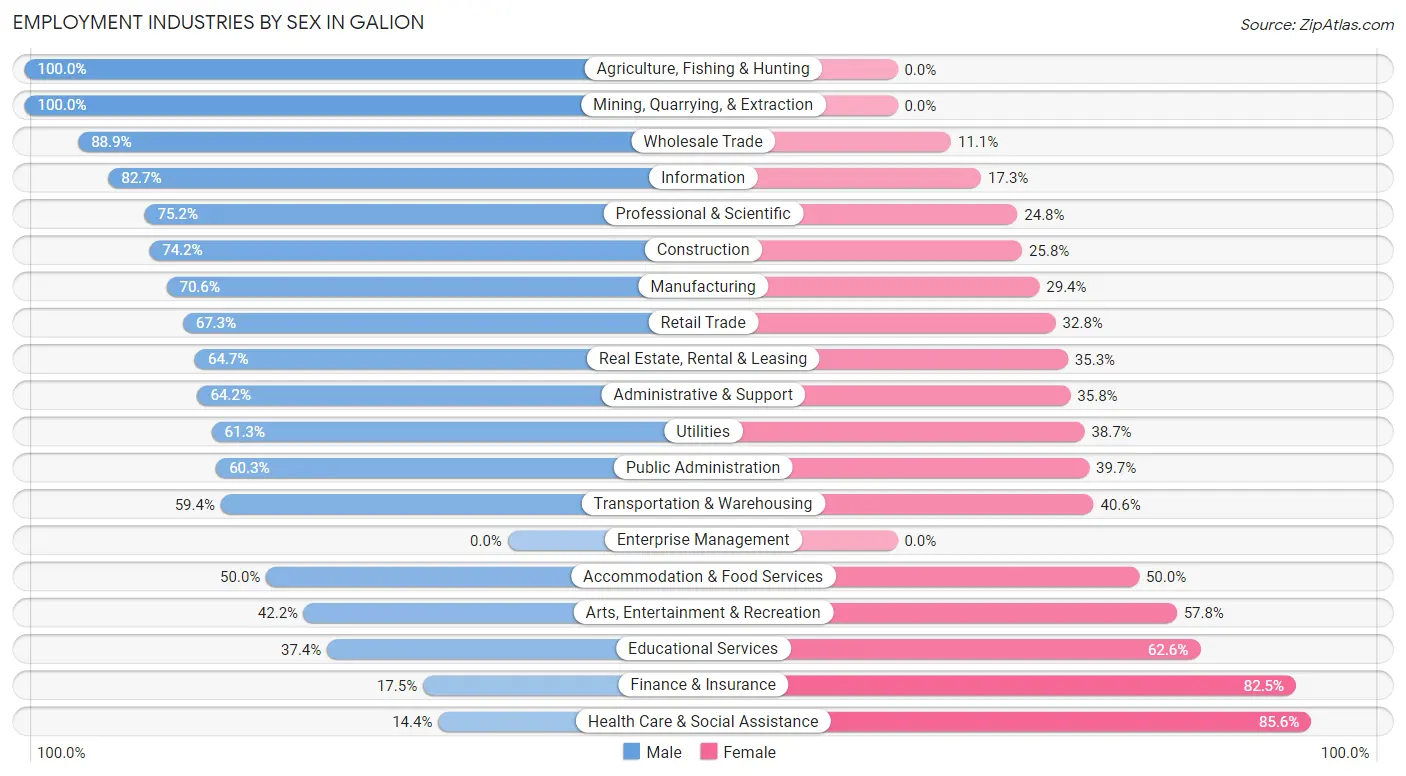
Employment Industries by Sex in Galion
The Galion industries that see more men than women are Agriculture, Fishing & Hunting (100.0%), Mining, Quarrying, & Extraction (100.0%), and Wholesale Trade (88.9%), whereas the industries that tend to have a higher number of women are Health Care & Social Assistance (85.6%), Finance & Insurance (82.5%), and Educational Services (62.6%).
| Industry | Male | Female |
| Agriculture, Fishing & Hunting | 5 (100.0%) | 0 (0.0%) |
| Mining, Quarrying, & Extraction | 12 (100.0%) | 0 (0.0%) |
| Construction | 158 (74.2%) | 55 (25.8%) |
| Manufacturing | 846 (70.6%) | 352 (29.4%) |
| Wholesale Trade | 64 (88.9%) | 8 (11.1%) |
| Retail Trade | 310 (67.2%) | 151 (32.8%) |
| Transportation & Warehousing | 79 (59.4%) | 54 (40.6%) |
| Utilities | 19 (61.3%) | 12 (38.7%) |
| Information | 62 (82.7%) | 13 (17.3%) |
| Finance & Insurance | 40 (17.5%) | 188 (82.5%) |
| Real Estate, Rental & Leasing | 22 (64.7%) | 12 (35.3%) |
| Professional & Scientific | 109 (75.2%) | 36 (24.8%) |
| Enterprise Management | 0 (0.0%) | 0 (0.0%) |
| Administrative & Support | 242 (64.2%) | 135 (35.8%) |
| Educational Services | 77 (37.4%) | 129 (62.6%) |
| Health Care & Social Assistance | 90 (14.4%) | 536 (85.6%) |
| Arts, Entertainment & Recreation | 27 (42.2%) | 37 (57.8%) |
| Accommodation & Food Services | 131 (50.0%) | 131 (50.0%) |
| Public Administration | 111 (60.3%) | 73 (39.7%) |
| Total | 2,517 (55.5%) | 2,018 (44.5%) |
Education in Galion
School Enrollment in Galion
The most common levels of schooling among the 1,994 students in Galion are elementary school (619 | 31.0%), high school (561 | 28.1%), and middle school (364 | 18.2%).

| School Level | # Students | % Students |
| Nursery / Preschool | 78 | 3.9% |
| Kindergarten | 64 | 3.2% |
| Elementary School | 619 | 31.0% |
| Middle School | 364 | 18.2% |
| High School | 561 | 28.1% |
| College / Undergraduate | 283 | 14.2% |
| Graduate / Professional | 25 | 1.3% |
| Total | 1,994 | 100.0% |
School Enrollment by Age by Funding Source in Galion
Out of a total of 1,994 students who are enrolled in schools in Galion, 249 (12.5%) attend a private institution, while the remaining 1,745 (87.5%) are enrolled in public schools. The age group of 35 years and over has the highest likelihood of being enrolled in private schools, with 22 (21.4% in the age bracket) enrolled. Conversely, the age group of 18 to 19 year olds has the lowest likelihood of being enrolled in a private school, with 152 (93.8% in the age bracket) attending a public institution.

| Age Bracket | Public School | Private School |
| 3 to 4 Year Olds | 20 (80.0%) | 5 (20.0%) |
| 5 to 9 Year Old | 500 (83.2%) | 101 (16.8%) |
| 10 to 14 Year Olds | 476 (90.3%) | 51 (9.7%) |
| 15 to 17 Year Olds | 416 (91.8%) | 37 (8.2%) |
| 18 to 19 Year Olds | 152 (93.8%) | 10 (6.2%) |
| 20 to 24 Year Olds | 51 (83.6%) | 10 (16.4%) |
| 25 to 34 Year Olds | 49 (79.0%) | 13 (21.0%) |
| 35 Years and over | 81 (78.6%) | 22 (21.4%) |
| Total | 1,745 (87.5%) | 249 (12.5%) |
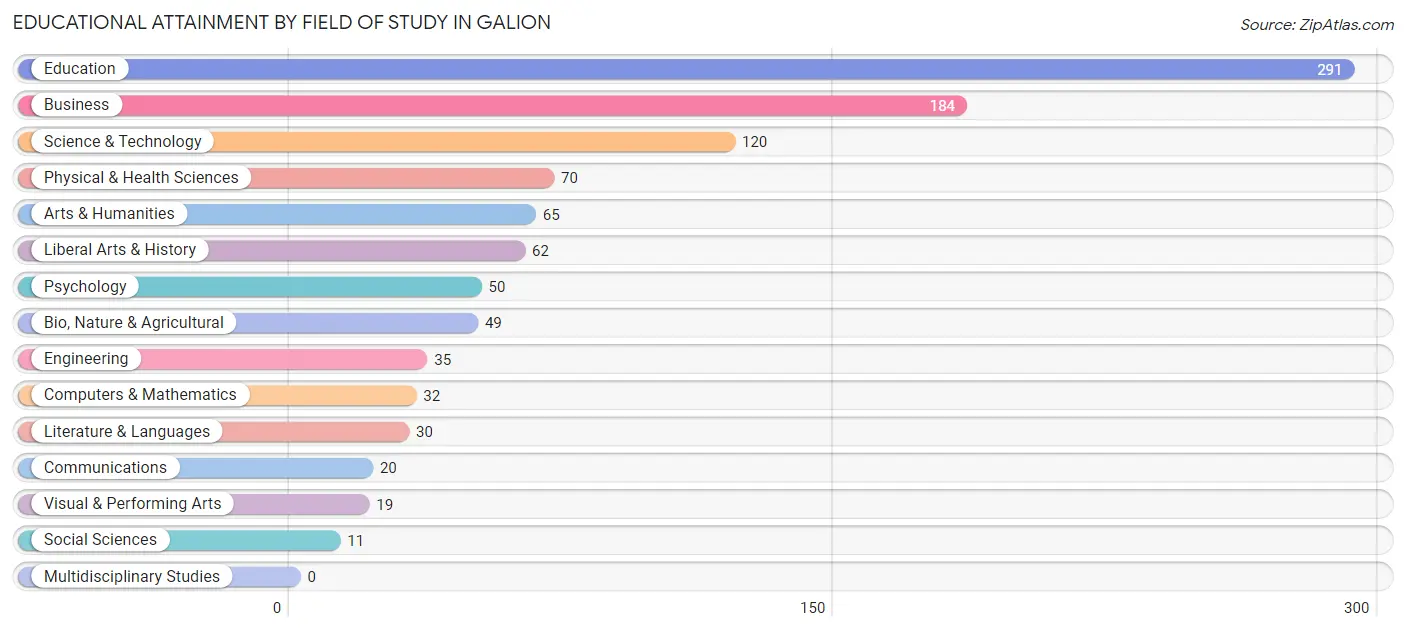
Educational Attainment by Field of Study in Galion
Education (291 | 28.0%), business (184 | 17.7%), science & technology (120 | 11.6%), physical & health sciences (70 | 6.7%), and arts & humanities (65 | 6.3%) are the most common fields of study among 1,038 individuals in Galion who have obtained a bachelor's degree or higher.
| Field of Study | # Graduates | % Graduates |
| Computers & Mathematics | 32 | 3.1% |
| Bio, Nature & Agricultural | 49 | 4.7% |
| Physical & Health Sciences | 70 | 6.7% |
| Psychology | 50 | 4.8% |
| Social Sciences | 11 | 1.1% |
| Engineering | 35 | 3.4% |
| Multidisciplinary Studies | 0 | 0.0% |
| Science & Technology | 120 | 11.6% |
| Business | 184 | 17.7% |
| Education | 291 | 28.0% |
| Literature & Languages | 30 | 2.9% |
| Liberal Arts & History | 62 | 6.0% |
| Visual & Performing Arts | 19 | 1.8% |
| Communications | 20 | 1.9% |
| Arts & Humanities | 65 | 6.3% |
| Total | 1,038 | 100.0% |
Transportation & Commute in Galion
Vehicle Availability by Sex in Galion
The most prevalent vehicle ownership categories in Galion are males with 2 vehicles (995, accounting for 40.7%) and females with 2 vehicles (832, making up 50.8%).
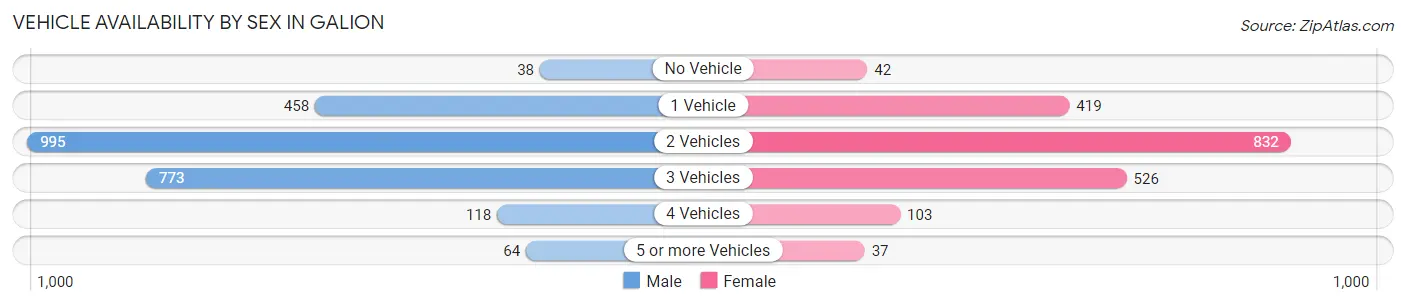
| Vehicles Available | Male | Female |
| No Vehicle | 38 (1.5%) | 42 (2.1%) |
| 1 Vehicle | 458 (18.7%) | 419 (21.4%) |
| 2 Vehicles | 995 (40.7%) | 832 (42.5%) |
| 3 Vehicles | 773 (31.6%) | 526 (26.9%) |
| 4 Vehicles | 118 (4.8%) | 103 (5.3%) |
| 5 or more Vehicles | 64 (2.6%) | 37 (1.9%) |
| Total | 2,446 (100.0%) | 1,959 (100.0%) |
Commute Time in Galion
The most frequently occuring commute durations in Galion are 15 to 19 minutes (761 commuters, 18.4%), 5 to 9 minutes (566 commuters, 13.7%), and 20 to 24 minutes (487 commuters, 11.8%).
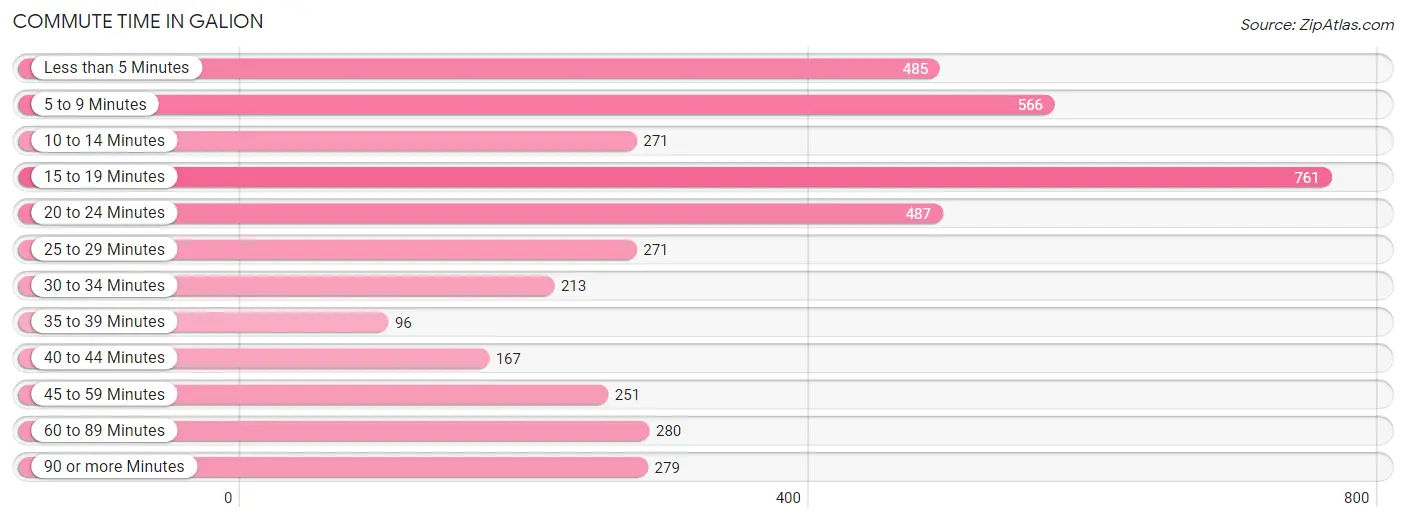
| Commute Time | # Commuters | % Commuters |
| Less than 5 Minutes | 485 | 11.7% |
| 5 to 9 Minutes | 566 | 13.7% |
| 10 to 14 Minutes | 271 | 6.6% |
| 15 to 19 Minutes | 761 | 18.4% |
| 20 to 24 Minutes | 487 | 11.8% |
| 25 to 29 Minutes | 271 | 6.6% |
| 30 to 34 Minutes | 213 | 5.2% |
| 35 to 39 Minutes | 96 | 2.3% |
| 40 to 44 Minutes | 167 | 4.1% |
| 45 to 59 Minutes | 251 | 6.1% |
| 60 to 89 Minutes | 280 | 6.8% |
| 90 or more Minutes | 279 | 6.8% |
Commute Time by Sex in Galion
The most common commute times in Galion are less than 5 minutes (378 commuters, 15.9%) for males and 15 to 19 minutes (463 commuters, 26.4%) for females.
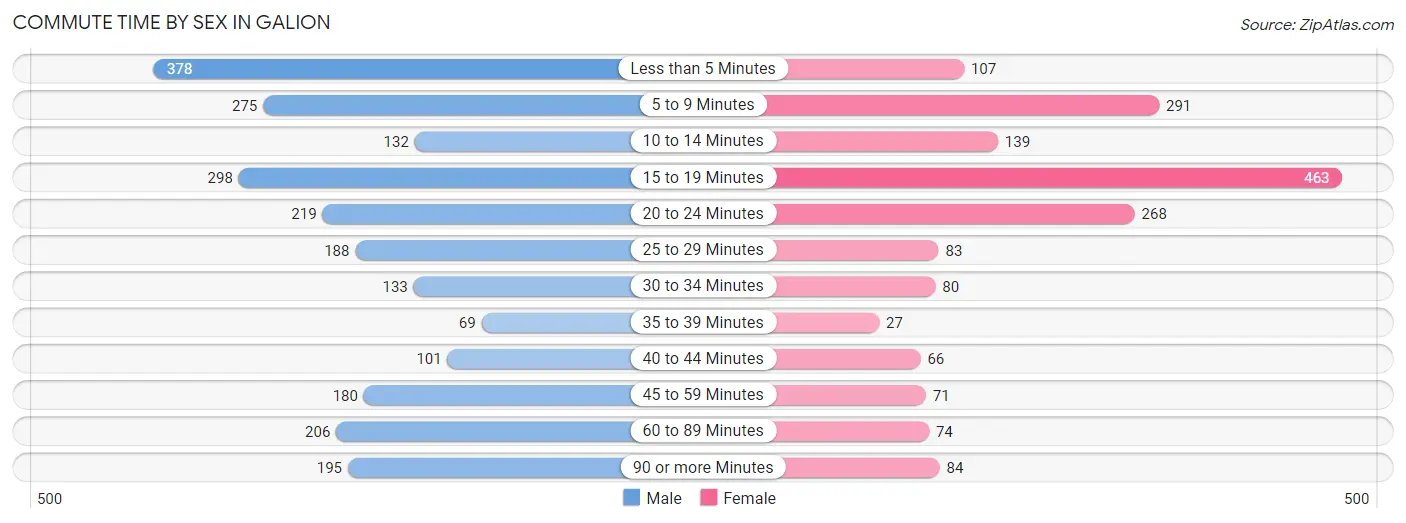
| Commute Time | Male | Female |
| Less than 5 Minutes | 378 (15.9%) | 107 (6.1%) |
| 5 to 9 Minutes | 275 (11.6%) | 291 (16.6%) |
| 10 to 14 Minutes | 132 (5.6%) | 139 (7.9%) |
| 15 to 19 Minutes | 298 (12.6%) | 463 (26.4%) |
| 20 to 24 Minutes | 219 (9.2%) | 268 (15.3%) |
| 25 to 29 Minutes | 188 (7.9%) | 83 (4.7%) |
| 30 to 34 Minutes | 133 (5.6%) | 80 (4.6%) |
| 35 to 39 Minutes | 69 (2.9%) | 27 (1.5%) |
| 40 to 44 Minutes | 101 (4.3%) | 66 (3.8%) |
| 45 to 59 Minutes | 180 (7.6%) | 71 (4.1%) |
| 60 to 89 Minutes | 206 (8.7%) | 74 (4.2%) |
| 90 or more Minutes | 195 (8.2%) | 84 (4.8%) |
Time of Departure to Work by Sex in Galion
The most frequent times of departure to work in Galion are 12:00 PM to 3:59 PM (376, 15.8%) for males and 7:30 AM to 7:59 AM (286, 16.3%) for females.
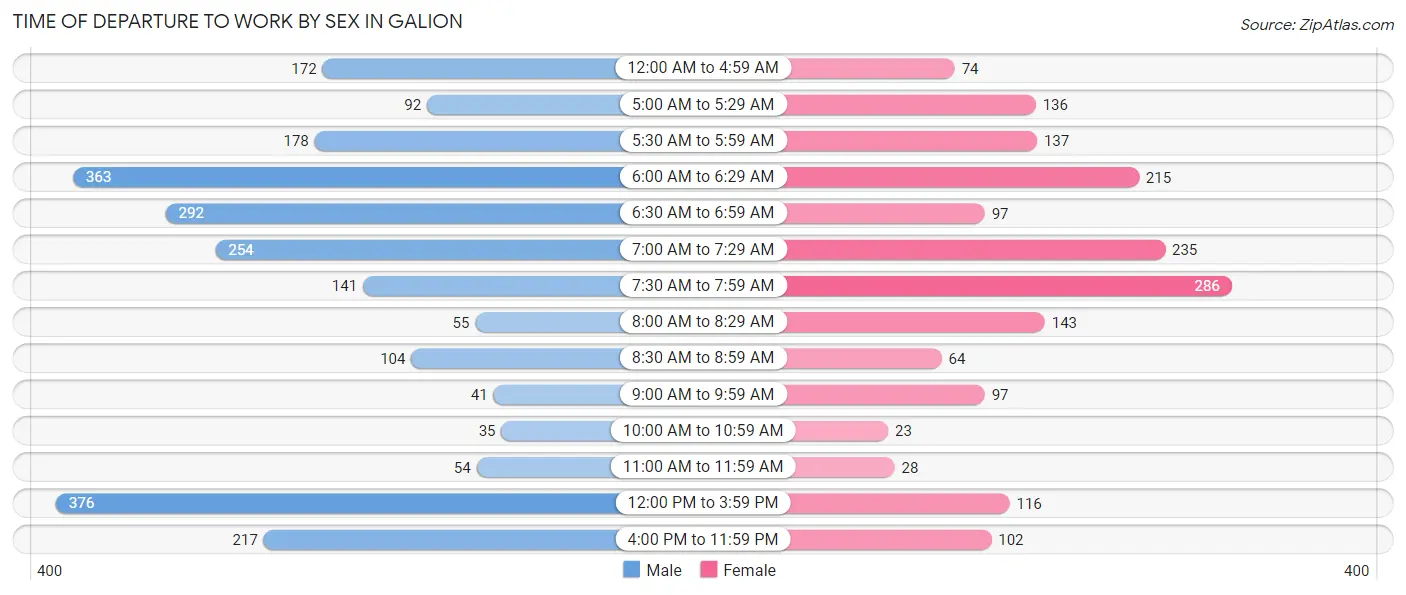
| Time of Departure | Male | Female |
| 12:00 AM to 4:59 AM | 172 (7.2%) | 74 (4.2%) |
| 5:00 AM to 5:29 AM | 92 (3.9%) | 136 (7.8%) |
| 5:30 AM to 5:59 AM | 178 (7.5%) | 137 (7.8%) |
| 6:00 AM to 6:29 AM | 363 (15.3%) | 215 (12.3%) |
| 6:30 AM to 6:59 AM | 292 (12.3%) | 97 (5.5%) |
| 7:00 AM to 7:29 AM | 254 (10.7%) | 235 (13.4%) |
| 7:30 AM to 7:59 AM | 141 (5.9%) | 286 (16.3%) |
| 8:00 AM to 8:29 AM | 55 (2.3%) | 143 (8.2%) |
| 8:30 AM to 8:59 AM | 104 (4.4%) | 64 (3.6%) |
| 9:00 AM to 9:59 AM | 41 (1.7%) | 97 (5.5%) |
| 10:00 AM to 10:59 AM | 35 (1.5%) | 23 (1.3%) |
| 11:00 AM to 11:59 AM | 54 (2.3%) | 28 (1.6%) |
| 12:00 PM to 3:59 PM | 376 (15.8%) | 116 (6.6%) |
| 4:00 PM to 11:59 PM | 217 (9.1%) | 102 (5.8%) |
| Total | 2,374 (100.0%) | 1,753 (100.0%) |
Housing Occupancy in Galion
Occupancy by Ownership in Galion
Of the total 4,684 dwellings in Galion, owner-occupied units account for 2,510 (53.6%), while renter-occupied units make up 2,174 (46.4%).
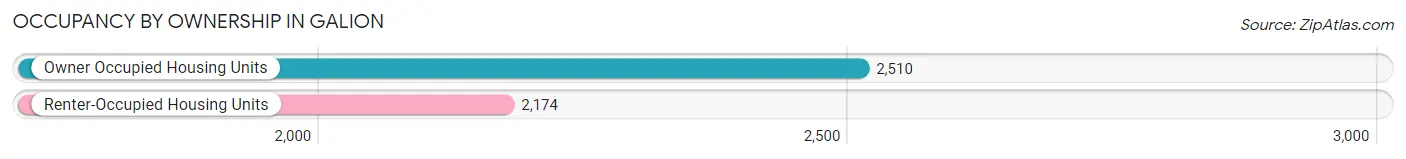
| Occupancy | # Housing Units | % Housing Units |
| Owner Occupied Housing Units | 2,510 | 53.6% |
| Renter-Occupied Housing Units | 2,174 | 46.4% |
| Total Occupied Housing Units | 4,684 | 100.0% |
Occupancy by Household Size in Galion
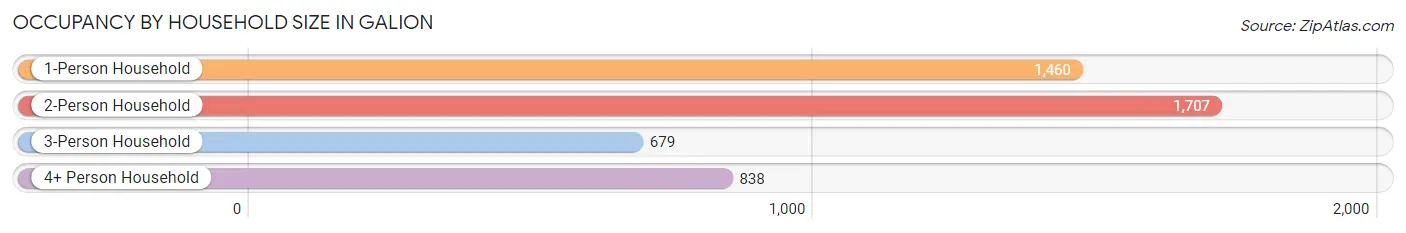
| Household Size | # Housing Units | % Housing Units |
| 1-Person Household | 1,460 | 31.2% |
| 2-Person Household | 1,707 | 36.4% |
| 3-Person Household | 679 | 14.5% |
| 4+ Person Household | 838 | 17.9% |
| Total Housing Units | 4,684 | 100.0% |
Occupancy by Ownership by Household Size in Galion
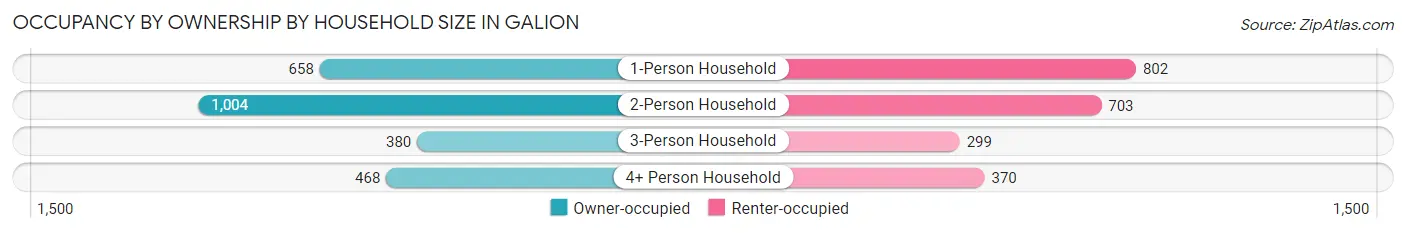
| Household Size | Owner-occupied | Renter-occupied |
| 1-Person Household | 658 (45.1%) | 802 (54.9%) |
| 2-Person Household | 1,004 (58.8%) | 703 (41.2%) |
| 3-Person Household | 380 (56.0%) | 299 (44.0%) |
| 4+ Person Household | 468 (55.8%) | 370 (44.2%) |
| Total Housing Units | 2,510 (53.6%) | 2,174 (46.4%) |
Occupancy by Educational Attainment in Galion
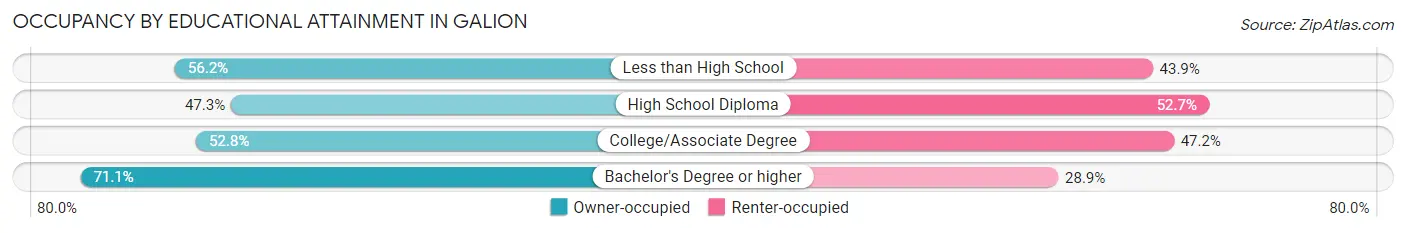
| Household Size | Owner-occupied | Renter-occupied |
| Less than High School | 283 (56.1%) | 221 (43.9%) |
| High School Diploma | 904 (47.3%) | 1,009 (52.7%) |
| College/Associate Degree | 835 (52.8%) | 746 (47.2%) |
| Bachelor's Degree or higher | 488 (71.1%) | 198 (28.9%) |
Occupancy by Age of Householder in Galion
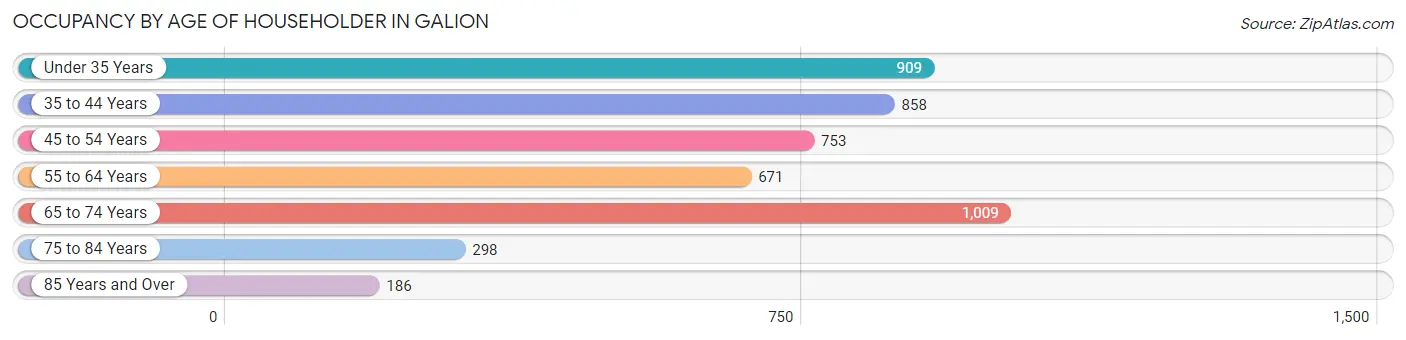
| Age Bracket | # Households | % Households |
| Under 35 Years | 909 | 19.4% |
| 35 to 44 Years | 858 | 18.3% |
| 45 to 54 Years | 753 | 16.1% |
| 55 to 64 Years | 671 | 14.3% |
| 65 to 74 Years | 1,009 | 21.5% |
| 75 to 84 Years | 298 | 6.4% |
| 85 Years and Over | 186 | 4.0% |
| Total | 4,684 | 100.0% |
Housing Finances in Galion
Median Income by Occupancy in Galion
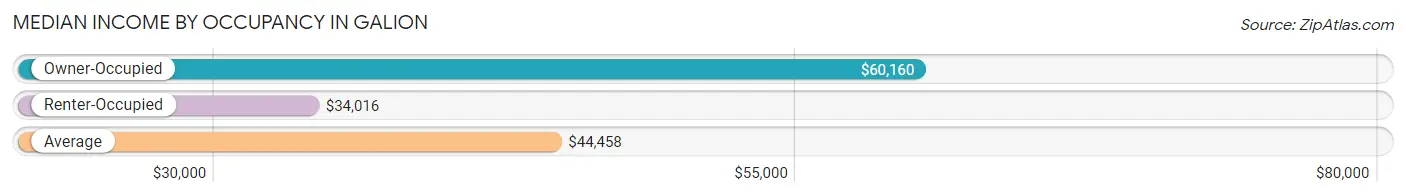
| Occupancy Type | # Households | Median Income |
| Owner-Occupied | 2,510 (53.6%) | $60,160 |
| Renter-Occupied | 2,174 (46.4%) | $34,016 |
| Average | 4,684 (100.0%) | $44,458 |
Occupancy by Householder Income Bracket in Galion
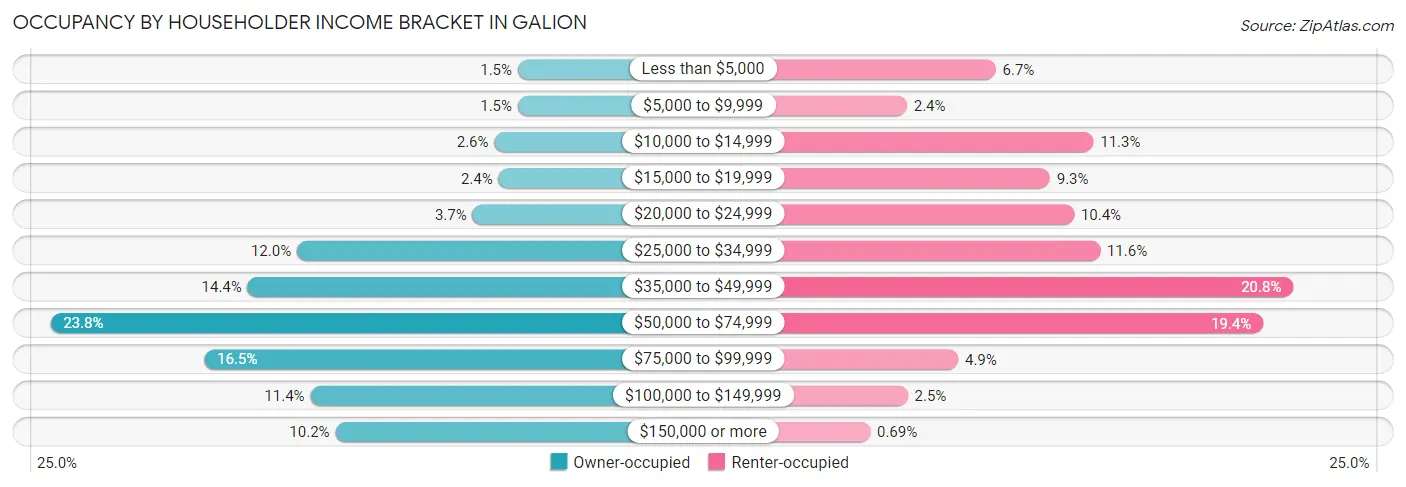
| Income Bracket | Owner-occupied | Renter-occupied |
| Less than $5,000 | 38 (1.5%) | 145 (6.7%) |
| $5,000 to $9,999 | 38 (1.5%) | 53 (2.4%) |
| $10,000 to $14,999 | 66 (2.6%) | 246 (11.3%) |
| $15,000 to $19,999 | 61 (2.4%) | 201 (9.2%) |
| $20,000 to $24,999 | 92 (3.7%) | 226 (10.4%) |
| $25,000 to $34,999 | 302 (12.0%) | 253 (11.6%) |
| $35,000 to $49,999 | 361 (14.4%) | 453 (20.8%) |
| $50,000 to $74,999 | 597 (23.8%) | 422 (19.4%) |
| $75,000 to $99,999 | 413 (16.5%) | 106 (4.9%) |
| $100,000 to $149,999 | 286 (11.4%) | 54 (2.5%) |
| $150,000 or more | 256 (10.2%) | 15 (0.7%) |
| Total | 2,510 (100.0%) | 2,174 (100.0%) |
Monthly Housing Cost Tiers in Galion
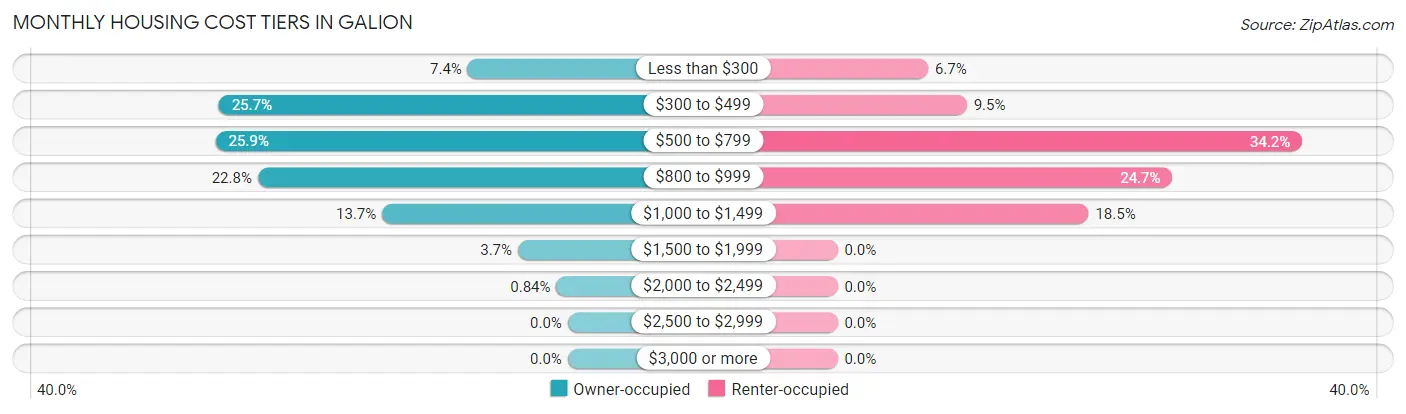
| Monthly Cost | Owner-occupied | Renter-occupied |
| Less than $300 | 185 (7.4%) | 145 (6.7%) |
| $300 to $499 | 645 (25.7%) | 207 (9.5%) |
| $500 to $799 | 651 (25.9%) | 744 (34.2%) |
| $800 to $999 | 573 (22.8%) | 536 (24.7%) |
| $1,000 to $1,499 | 343 (13.7%) | 402 (18.5%) |
| $1,500 to $1,999 | 92 (3.7%) | 0 (0.0%) |
| $2,000 to $2,499 | 21 (0.8%) | 0 (0.0%) |
| $2,500 to $2,999 | 0 (0.0%) | 0 (0.0%) |
| $3,000 or more | 0 (0.0%) | 0 (0.0%) |
| Total | 2,510 (100.0%) | 2,174 (100.0%) |
Physical Housing Characteristics in Galion
Housing Structures in Galion
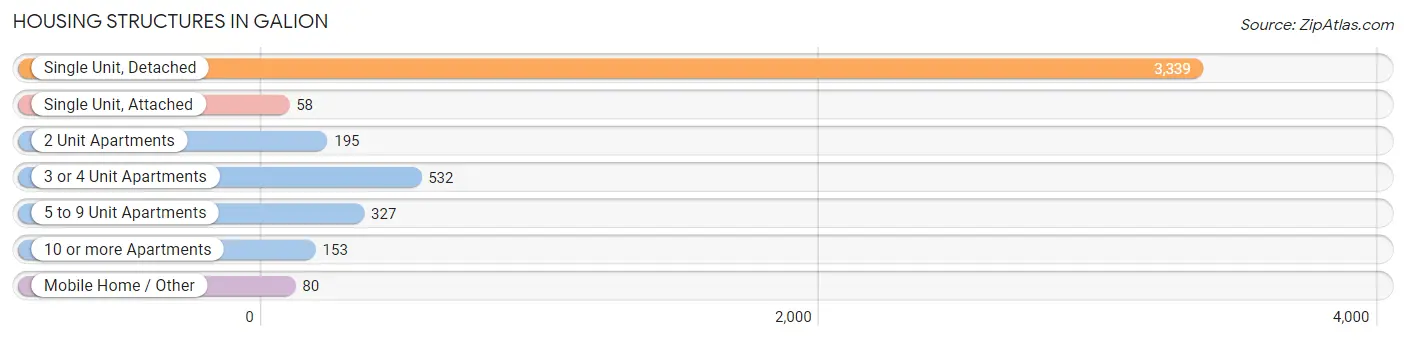
| Structure Type | # Housing Units | % Housing Units |
| Single Unit, Detached | 3,339 | 71.3% |
| Single Unit, Attached | 58 | 1.2% |
| 2 Unit Apartments | 195 | 4.2% |
| 3 or 4 Unit Apartments | 532 | 11.4% |
| 5 to 9 Unit Apartments | 327 | 7.0% |
| 10 or more Apartments | 153 | 3.3% |
| Mobile Home / Other | 80 | 1.7% |
| Total | 4,684 | 100.0% |
Housing Structures by Occupancy in Galion
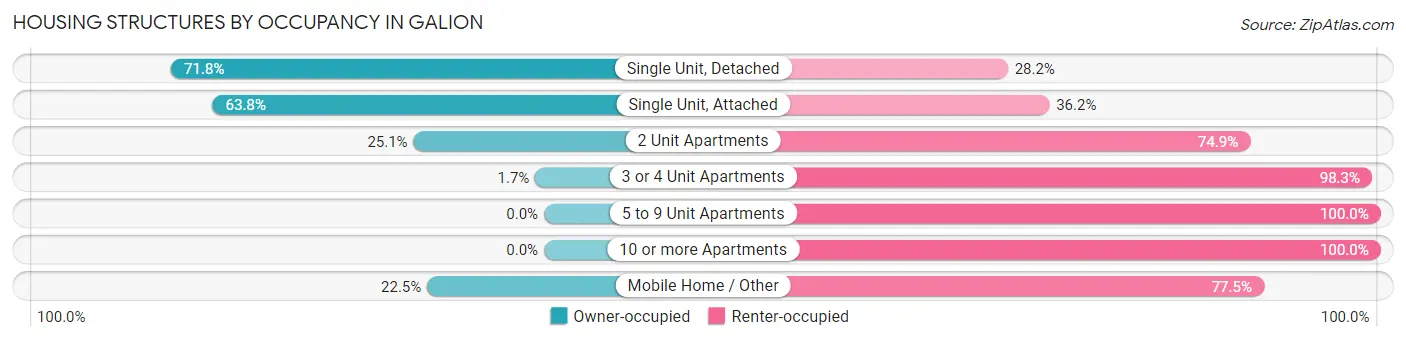
| Structure Type | Owner-occupied | Renter-occupied |
| Single Unit, Detached | 2,397 (71.8%) | 942 (28.2%) |
| Single Unit, Attached | 37 (63.8%) | 21 (36.2%) |
| 2 Unit Apartments | 49 (25.1%) | 146 (74.9%) |
| 3 or 4 Unit Apartments | 9 (1.7%) | 523 (98.3%) |
| 5 to 9 Unit Apartments | 0 (0.0%) | 327 (100.0%) |
| 10 or more Apartments | 0 (0.0%) | 153 (100.0%) |
| Mobile Home / Other | 18 (22.5%) | 62 (77.5%) |
| Total | 2,510 (53.6%) | 2,174 (46.4%) |
Housing Structures by Number of Rooms in Galion
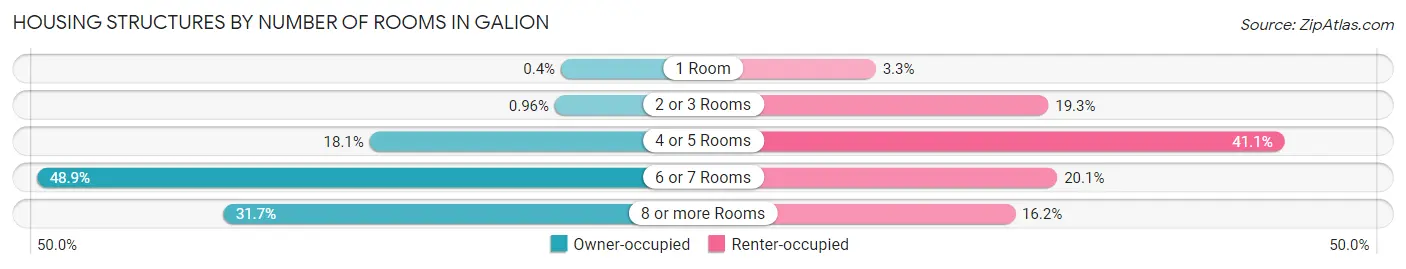
| Number of Rooms | Owner-occupied | Renter-occupied |
| 1 Room | 10 (0.4%) | 72 (3.3%) |
| 2 or 3 Rooms | 24 (1.0%) | 419 (19.3%) |
| 4 or 5 Rooms | 454 (18.1%) | 894 (41.1%) |
| 6 or 7 Rooms | 1,227 (48.9%) | 437 (20.1%) |
| 8 or more Rooms | 795 (31.7%) | 352 (16.2%) |
| Total | 2,510 (100.0%) | 2,174 (100.0%) |
Housing Structure by Heating Type in Galion
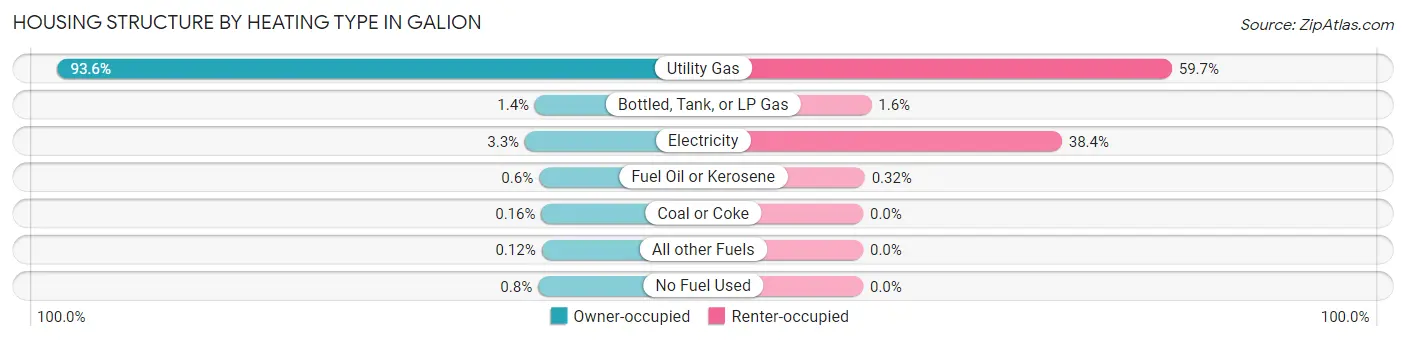
| Heating Type | Owner-occupied | Renter-occupied |
| Utility Gas | 2,350 (93.6%) | 1,297 (59.7%) |
| Bottled, Tank, or LP Gas | 35 (1.4%) | 35 (1.6%) |
| Electricity | 83 (3.3%) | 835 (38.4%) |
| Fuel Oil or Kerosene | 15 (0.6%) | 7 (0.3%) |
| Coal or Coke | 4 (0.2%) | 0 (0.0%) |
| All other Fuels | 3 (0.1%) | 0 (0.0%) |
| No Fuel Used | 20 (0.8%) | 0 (0.0%) |
| Total | 2,510 (100.0%) | 2,174 (100.0%) |
Household Vehicle Usage in Galion
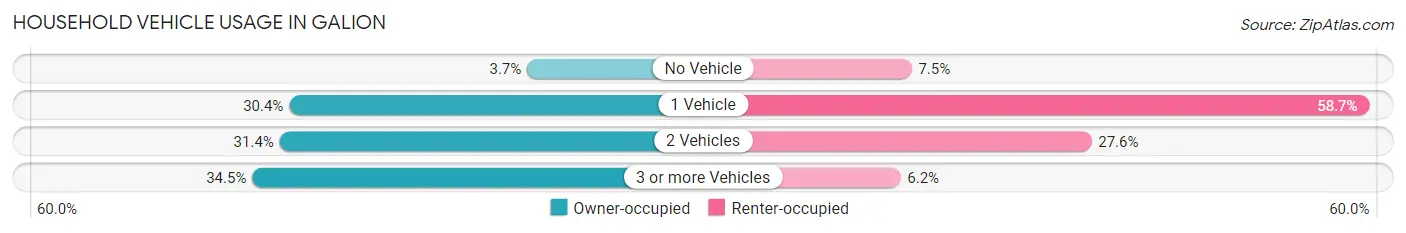
| Vehicles per Household | Owner-occupied | Renter-occupied |
| No Vehicle | 93 (3.7%) | 162 (7.4%) |
| 1 Vehicle | 762 (30.4%) | 1,277 (58.7%) |
| 2 Vehicles | 789 (31.4%) | 600 (27.6%) |
| 3 or more Vehicles | 866 (34.5%) | 135 (6.2%) |
| Total | 2,510 (100.0%) | 2,174 (100.0%) |
Real Estate & Mortgages in Galion
Real Estate and Mortgage Overview in Galion
| Characteristic | Without Mortgage | With Mortgage |
| Housing Units | 1,251 | 1,259 |
| Median Property Value | $91,300 | $95,200 |
| Median Household Income | $48,628 | $221 |
| Monthly Housing Costs | $428 | $0 |
| Real Estate Taxes | $1,149 | $0 |
Property Value by Mortgage Status in Galion
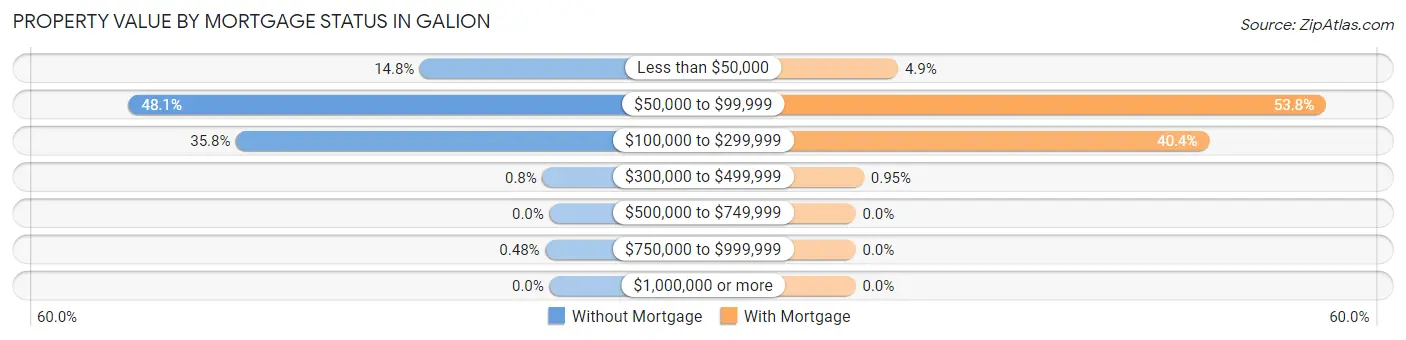
| Property Value | Without Mortgage | With Mortgage |
| Less than $50,000 | 185 (14.8%) | 61 (4.9%) |
| $50,000 to $99,999 | 602 (48.1%) | 677 (53.8%) |
| $100,000 to $299,999 | 448 (35.8%) | 509 (40.4%) |
| $300,000 to $499,999 | 10 (0.8%) | 12 (0.9%) |
| $500,000 to $749,999 | 0 (0.0%) | 0 (0.0%) |
| $750,000 to $999,999 | 6 (0.5%) | 0 (0.0%) |
| $1,000,000 or more | 0 (0.0%) | 0 (0.0%) |
| Total | 1,251 (100.0%) | 1,259 (100.0%) |
Household Income by Mortgage Status in Galion
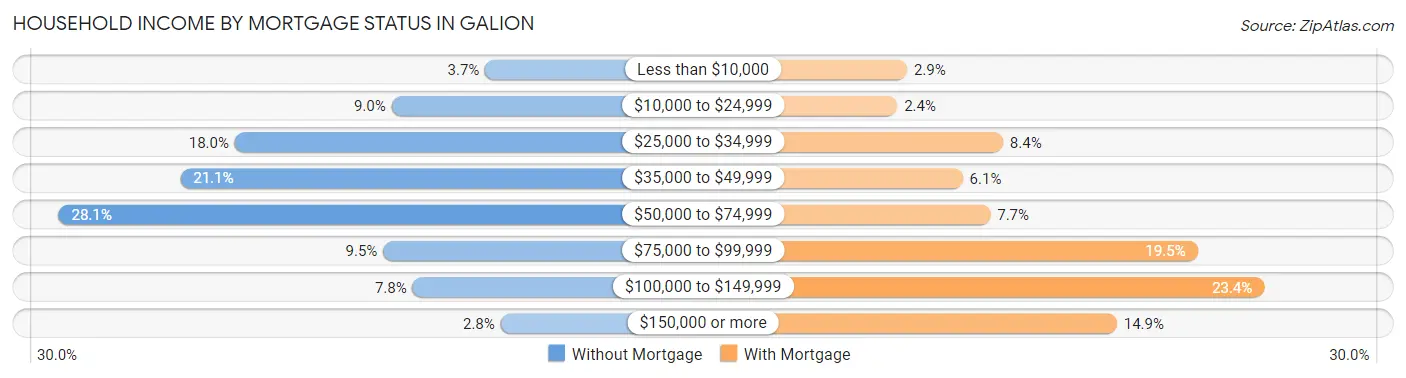
| Household Income | Without Mortgage | With Mortgage |
| Less than $10,000 | 46 (3.7%) | 37 (2.9%) |
| $10,000 to $24,999 | 113 (9.0%) | 30 (2.4%) |
| $25,000 to $34,999 | 225 (18.0%) | 106 (8.4%) |
| $35,000 to $49,999 | 264 (21.1%) | 77 (6.1%) |
| $50,000 to $74,999 | 351 (28.1%) | 97 (7.7%) |
| $75,000 to $99,999 | 119 (9.5%) | 246 (19.5%) |
| $100,000 to $149,999 | 98 (7.8%) | 294 (23.4%) |
| $150,000 or more | 35 (2.8%) | 188 (14.9%) |
| Total | 1,251 (100.0%) | 1,259 (100.0%) |
Property Value to Household Income Ratio in Galion
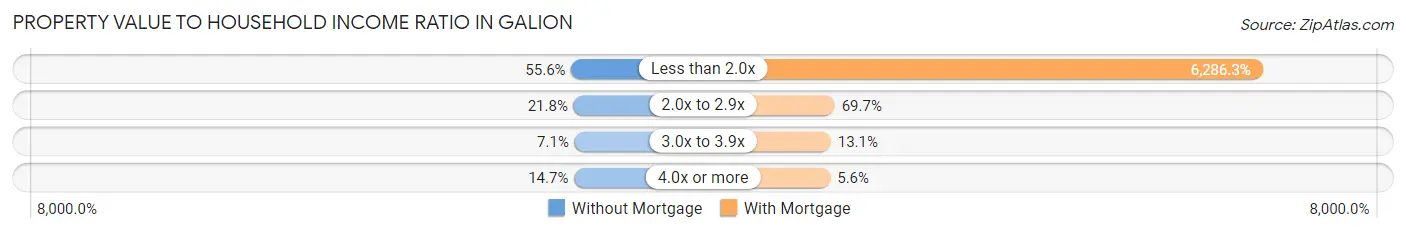
| Value-to-Income Ratio | Without Mortgage | With Mortgage |
| Less than 2.0x | 696 (55.6%) | 79,145 (6,286.3%) |
| 2.0x to 2.9x | 273 (21.8%) | 878 (69.7%) |
| 3.0x to 3.9x | 89 (7.1%) | 165 (13.1%) |
| 4.0x or more | 184 (14.7%) | 71 (5.6%) |
| Total | 1,251 (100.0%) | 1,259 (100.0%) |
Real Estate Taxes by Mortgage Status in Galion
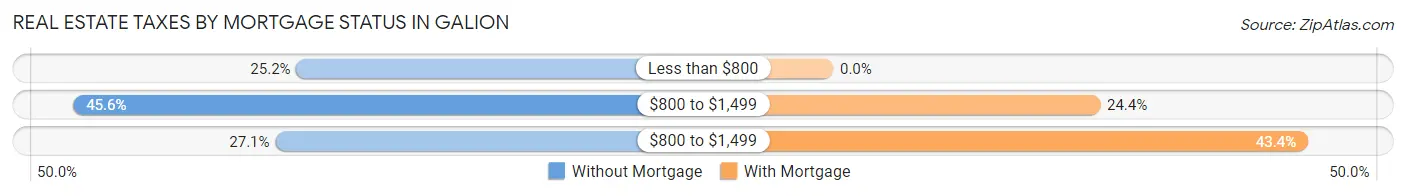
| Property Taxes | Without Mortgage | With Mortgage |
| Less than $800 | 315 (25.2%) | 0 (0.0%) |
| $800 to $1,499 | 570 (45.6%) | 307 (24.4%) |
| $800 to $1,499 | 339 (27.1%) | 546 (43.4%) |
| Total | 1,251 (100.0%) | 1,259 (100.0%) |
Health & Disability in Galion
Health Insurance Coverage by Age in Galion
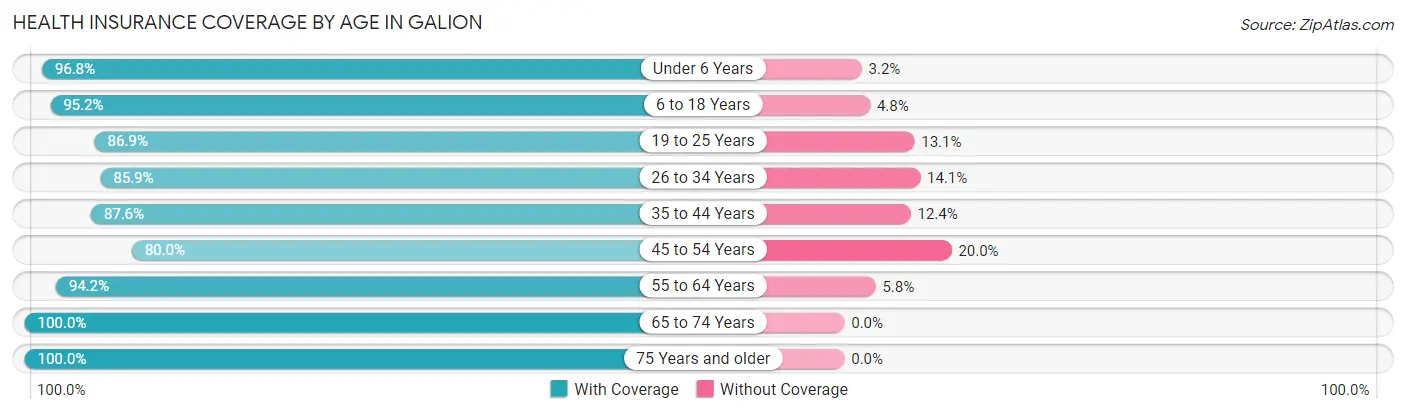
| Age Bracket | With Coverage | Without Coverage |
| Under 6 Years | 660 (96.8%) | 22 (3.2%) |
| 6 to 18 Years | 1,553 (95.2%) | 78 (4.8%) |
| 19 to 25 Years | 852 (86.9%) | 128 (13.1%) |
| 26 to 34 Years | 869 (85.9%) | 143 (14.1%) |
| 35 to 44 Years | 1,283 (87.6%) | 181 (12.4%) |
| 45 to 54 Years | 1,025 (80.0%) | 256 (20.0%) |
| 55 to 64 Years | 1,035 (94.2%) | 64 (5.8%) |
| 65 to 74 Years | 1,404 (100.0%) | 0 (0.0%) |
| 75 Years and older | 651 (100.0%) | 0 (0.0%) |
| Total | 9,332 (91.4%) | 872 (8.6%) |
Health Insurance Coverage by Citizenship Status in Galion
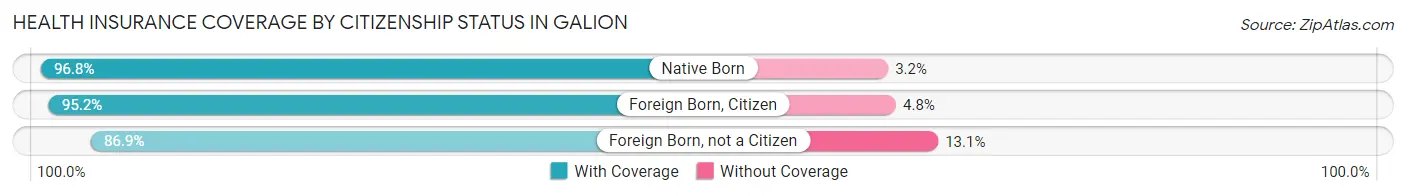
| Citizenship Status | With Coverage | Without Coverage |
| Native Born | 660 (96.8%) | 22 (3.2%) |
| Foreign Born, Citizen | 1,553 (95.2%) | 78 (4.8%) |
| Foreign Born, not a Citizen | 852 (86.9%) | 128 (13.1%) |
Health Insurance Coverage by Household Income in Galion
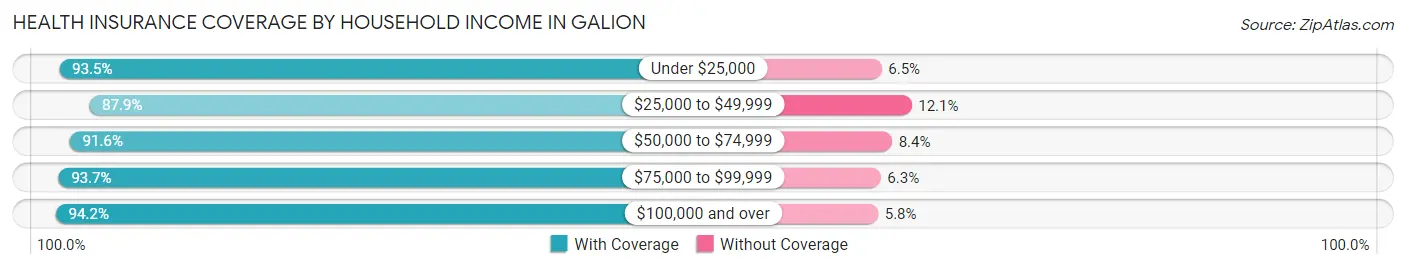
| Household Income | With Coverage | Without Coverage |
| Under $25,000 | 1,678 (93.5%) | 116 (6.5%) |
| $25,000 to $49,999 | 2,745 (87.9%) | 377 (12.1%) |
| $50,000 to $74,999 | 2,295 (91.6%) | 211 (8.4%) |
| $75,000 to $99,999 | 1,070 (93.7%) | 72 (6.3%) |
| $100,000 and over | 1,540 (94.2%) | 95 (5.8%) |
Public vs Private Health Insurance Coverage by Age in Galion
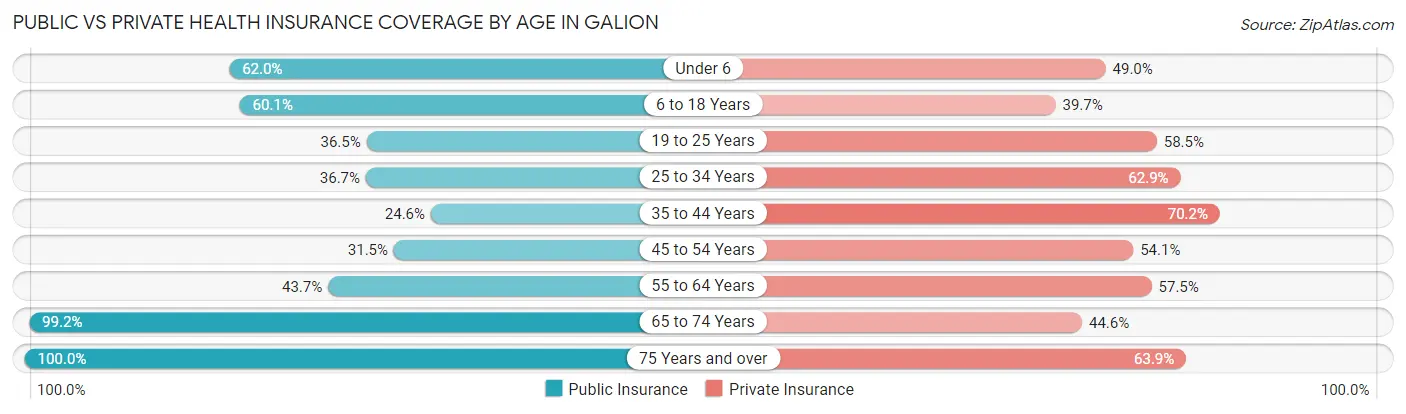
| Age Bracket | Public Insurance | Private Insurance |
| Under 6 | 423 (62.0%) | 334 (49.0%) |
| 6 to 18 Years | 980 (60.1%) | 647 (39.7%) |
| 19 to 25 Years | 358 (36.5%) | 573 (58.5%) |
| 25 to 34 Years | 371 (36.7%) | 636 (62.8%) |
| 35 to 44 Years | 360 (24.6%) | 1,027 (70.2%) |
| 45 to 54 Years | 403 (31.5%) | 693 (54.1%) |
| 55 to 64 Years | 480 (43.7%) | 632 (57.5%) |
| 65 to 74 Years | 1,392 (99.2%) | 626 (44.6%) |
| 75 Years and over | 651 (100.0%) | 416 (63.9%) |
| Total | 5,418 (53.1%) | 5,584 (54.7%) |
Disability Status by Sex by Age in Galion
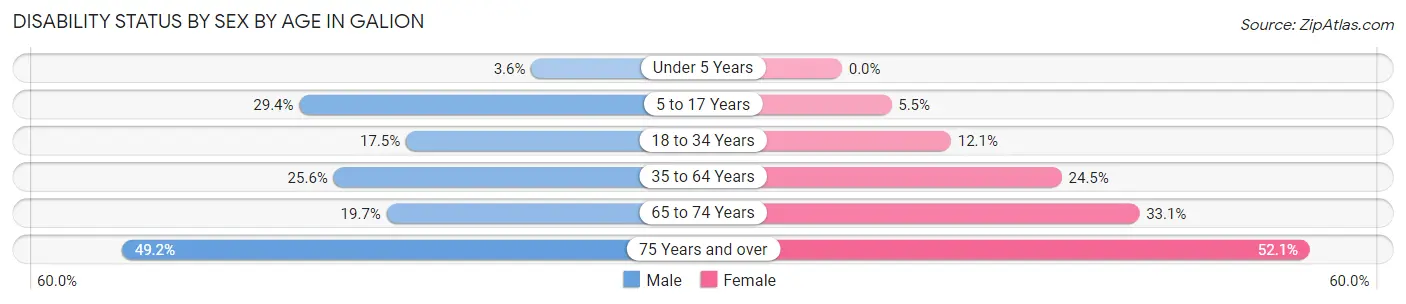
| Age Bracket | Male | Female |
| Under 5 Years | 9 (3.6%) | 0 (0.0%) |
| 5 to 17 Years | 219 (29.4%) | 48 (5.5%) |
| 18 to 34 Years | 198 (17.5%) | 119 (12.1%) |
| 35 to 64 Years | 488 (25.6%) | 474 (24.5%) |
| 65 to 74 Years | 123 (19.7%) | 258 (33.1%) |
| 75 Years and over | 89 (49.2%) | 245 (52.1%) |
Disability Class by Sex by Age in Galion
Disability Class: Hearing Difficulty
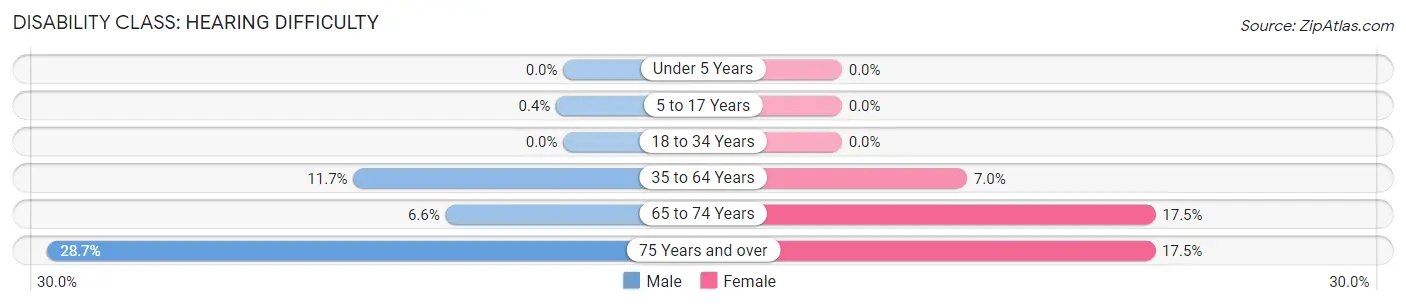
| Age Bracket | Male | Female |
| Under 5 Years | 0 (0.0%) | 0 (0.0%) |
| 5 to 17 Years | 3 (0.4%) | 0 (0.0%) |
| 18 to 34 Years | 0 (0.0%) | 0 (0.0%) |
| 35 to 64 Years | 223 (11.7%) | 135 (7.0%) |
| 65 to 74 Years | 41 (6.6%) | 136 (17.5%) |
| 75 Years and over | 52 (28.7%) | 82 (17.4%) |
Disability Class: Vision Difficulty
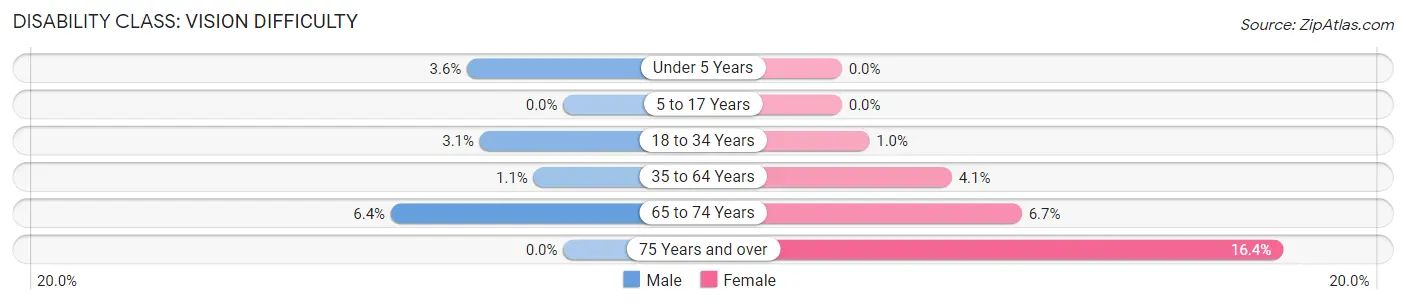
| Age Bracket | Male | Female |
| Under 5 Years | 9 (3.6%) | 0 (0.0%) |
| 5 to 17 Years | 0 (0.0%) | 0 (0.0%) |
| 18 to 34 Years | 35 (3.1%) | 10 (1.0%) |
| 35 to 64 Years | 21 (1.1%) | 79 (4.1%) |
| 65 to 74 Years | 40 (6.4%) | 52 (6.7%) |
| 75 Years and over | 0 (0.0%) | 77 (16.4%) |
Disability Class: Cognitive Difficulty
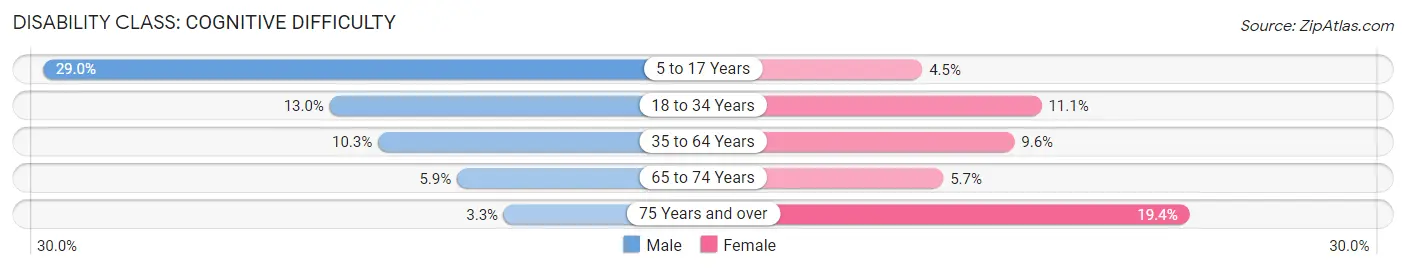
| Age Bracket | Male | Female |
| 5 to 17 Years | 216 (29.0%) | 39 (4.5%) |
| 18 to 34 Years | 147 (13.0%) | 109 (11.1%) |
| 35 to 64 Years | 197 (10.3%) | 186 (9.6%) |
| 65 to 74 Years | 37 (5.9%) | 44 (5.7%) |
| 75 Years and over | 6 (3.3%) | 91 (19.4%) |
Disability Class: Ambulatory Difficulty
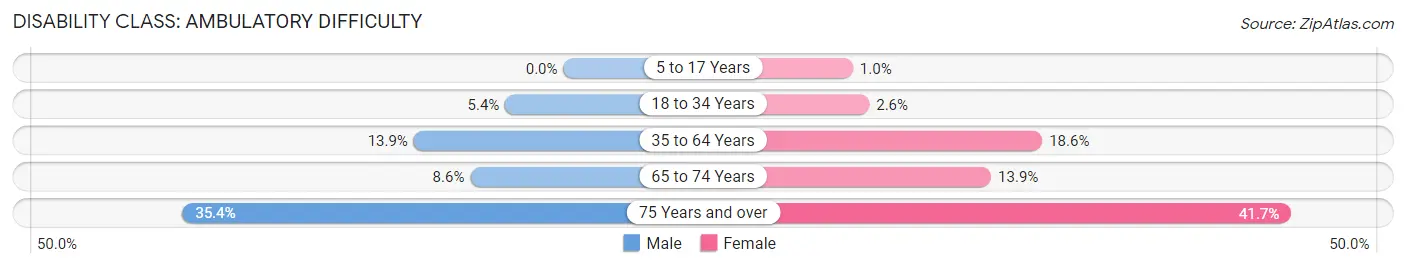
| Age Bracket | Male | Female |
| 5 to 17 Years | 0 (0.0%) | 9 (1.0%) |
| 18 to 34 Years | 61 (5.4%) | 25 (2.5%) |
| 35 to 64 Years | 265 (13.9%) | 360 (18.6%) |
| 65 to 74 Years | 54 (8.6%) | 108 (13.9%) |
| 75 Years and over | 64 (35.4%) | 196 (41.7%) |
Disability Class: Self-Care Difficulty
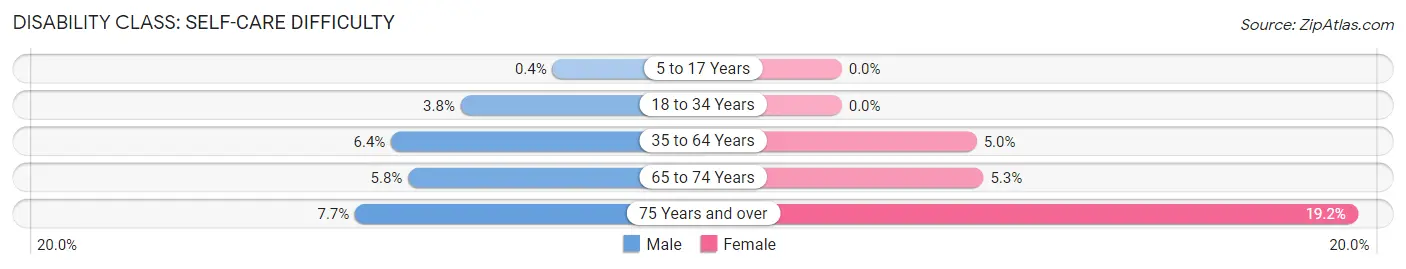
| Age Bracket | Male | Female |
| 5 to 17 Years | 3 (0.4%) | 0 (0.0%) |
| 18 to 34 Years | 43 (3.8%) | 0 (0.0%) |
| 35 to 64 Years | 122 (6.4%) | 97 (5.0%) |
| 65 to 74 Years | 36 (5.8%) | 41 (5.3%) |
| 75 Years and over | 14 (7.7%) | 90 (19.2%) |
Technology Access in Galion
Computing Device Access in Galion
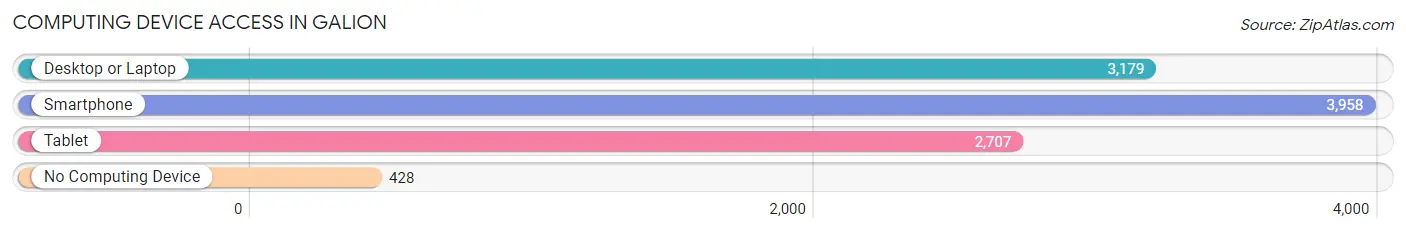
| Device Type | # Households | % Households |
| Desktop or Laptop | 3,179 | 67.9% |
| Smartphone | 3,958 | 84.5% |
| Tablet | 2,707 | 57.8% |
| No Computing Device | 428 | 9.1% |
| Total | 4,684 | 100.0% |
Internet Access in Galion
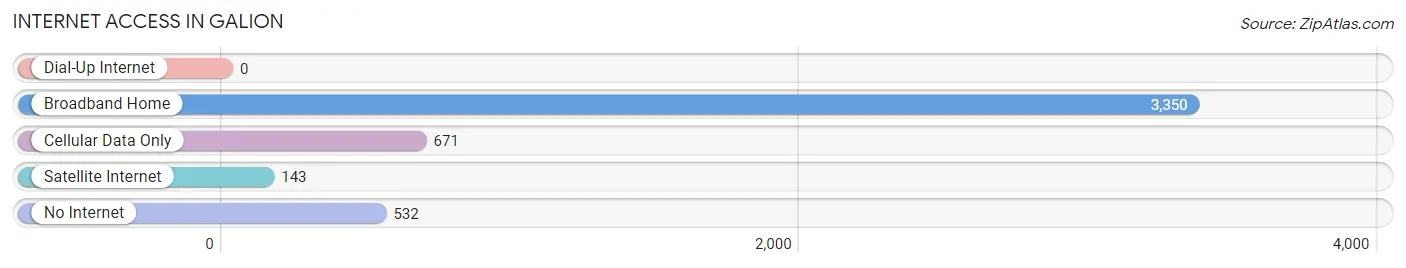
| Internet Type | # Households | % Households |
| Dial-Up Internet | 0 | 0.0% |
| Broadband Home | 3,350 | 71.5% |
| Cellular Data Only | 671 | 14.3% |
| Satellite Internet | 143 | 3.0% |
| No Internet | 532 | 11.4% |
| Total | 4,684 | 100.0% |
Galion Summary
Galion is a city located in Crawford and Richland counties in the state of Ohio. It is situated along the banks of the Olentangy River and is part of the Mansfield Metropolitan Statistical Area. The city has a population of 10,512 as of the 2010 census.
History
Galion was founded in 1831 by John B. Galion, a German immigrant who had come to the area in search of a better life. He purchased a large tract of land and began to develop it into a town. The town was originally called Galionville, but the name was changed to Galion in 1834.
Galion was incorporated as a village in 1841 and as a city in 1868. The city grew rapidly in the late 19th and early 20th centuries, becoming a major industrial center. The city was home to several steel mills, foundries, and other manufacturing plants.
Geography
Galion is located at 40°44'17" North, 82°48'45" West (40.738, -82.812). According to the United States Census Bureau, the city has a total area of 5.2 square miles, all of it land.
Economy
Galion’s economy is largely based on manufacturing and industry. The city is home to several steel mills, foundries, and other manufacturing plants. The city is also home to several retail stores, restaurants, and other businesses.
Demographics
As of the 2010 census, there were 10,512 people, 4,093 households, and 2,619 families residing in the city. The population density was 2,037.2 people per square mile. The racial makeup of the city was 94.2% White, 2.3% African American, 0.3% Native American, 0.5% Asian, 0.1% Pacific Islander, 0.7% from other races, and 1.9% from two or more races. Hispanic or Latino of any race were 2.2% of the population.
The median income for a household in the city was $35,945, and the median income for a family was $45,945. Males had a median income of $35,945 versus $25,945 for females. The per capita income for the city was $17,945. About 11.2% of families and 14.2% of the population were below the poverty line, including 19.2% of those under age 18 and 8.2% of those age 65 or over.
Common Questions
What is the Total Population of Galion?
Total Population of Galion is 10,378.
What is the Total Male Population of Galion?
Total Male Population of Galion is 4,877.
What is the Total Female Population of Galion?
Total Female Population of Galion is 5,501.
What is the Ratio of Males per 100 Females in Galion?
There are 88.66 Males per 100 Females in Galion.
What is the Ratio of Females per 100 Males in Galion?
There are 112.79 Females per 100 Males in Galion.
What is the Median Population Age in Galion?
Median Population Age in Galion is 41.8 Years.
What is the Average Family Size in Galion
Average Family Size in Galion is 2.7 People.
What is the Average Household Size in Galion
Average Household Size in Galion is 2.2 People.
What is Per Capita Income in Galion?
Per Capita income in Galion is $24,849.
What is the Median Family Income in Galion?
Median Family Income in Galion is $57,401.
What is the Median Household income in Galion?
Median Household Income in Galion is $44,458.
What is Income or Wage Gap in Galion?
Income or Wage Gap in Galion is 23.1%.
Women in Galion earn 76.9 cents for every dollar earned by a man.
What is Inequality or Gini Index in Galion?
Inequality or Gini Index in Galion is 0.41.
How Large is the Labor Force in Galion?
There are 4,890 People in the Labor Forcein in Galion.
What is the Percentage of People in the Labor Force in Galion?
57.8% of People are in the Labor Force in Galion.
What is the Unemployment Rate in Galion?
Unemployment Rate in Galion is 7.2%.