Zip Codes with the Highest Percentage of Families with Income Below $10,000 in Cuyahoga Falls, OH
RELATED REPORTS & OPTIONS
Family Income | $0-10k
Cuyahoga Falls
Compare Zip Codes
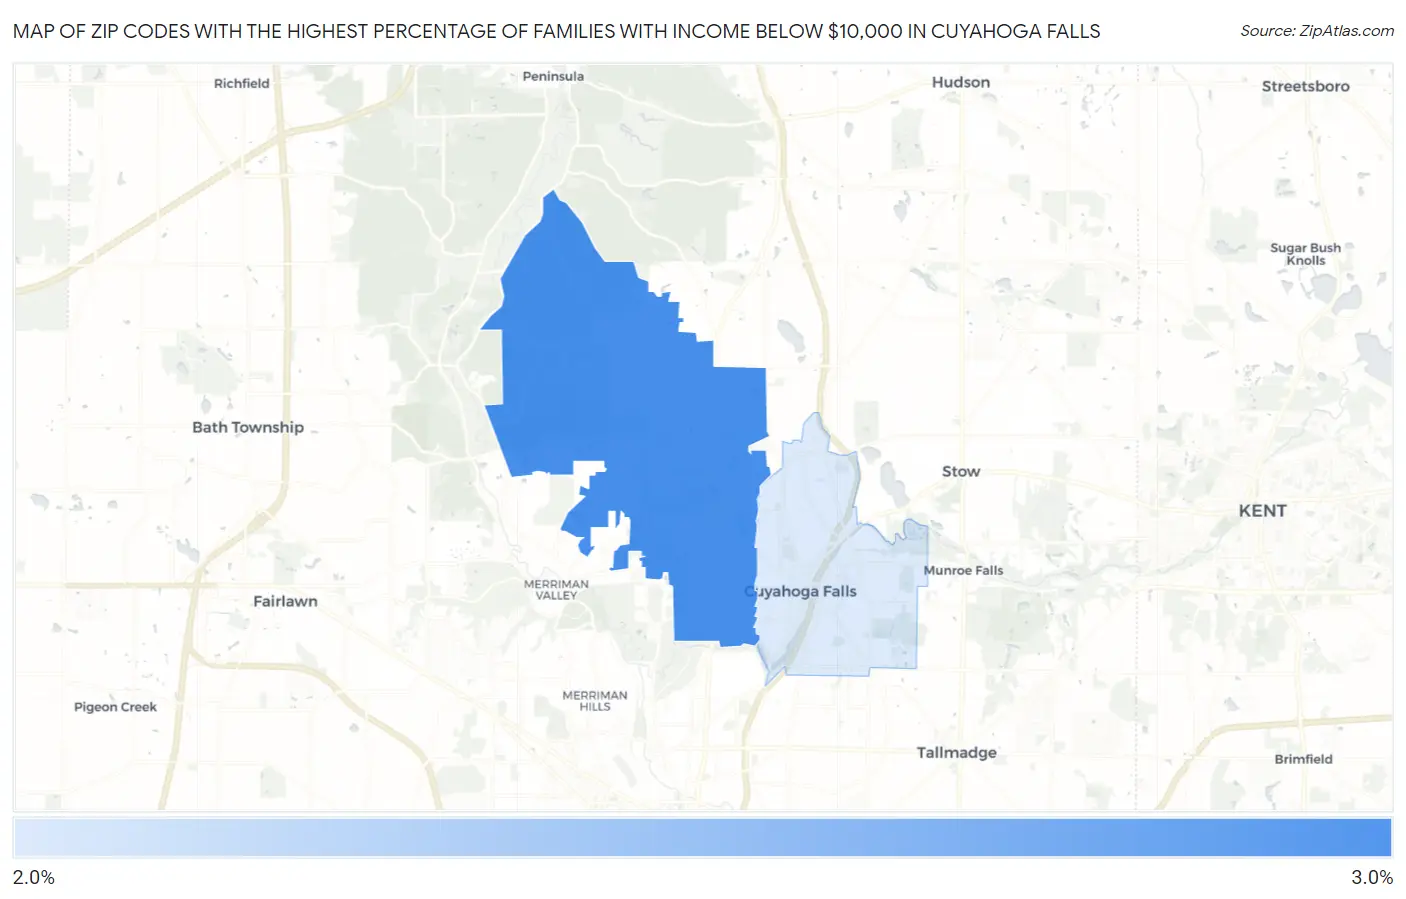
Map of Zip Codes with the Highest Percentage of Families with Income Below $10,000 in Cuyahoga Falls
0.0%
3.0%
Zip Codes with the Highest Percentage of Families with Income Below $10,000 in Cuyahoga Falls, OH
| Zip Code | Families with Income < $10k | vs State | vs National | |
| 1. | 44223 | 2.8% | 3.3%(-0.500)#452 | 3.1%(-0.300)#11,922 |
| 2. | 44221 | 2.2% | 3.3%(-1.10)#541 | 3.1%(-0.900)#14,384 |
1
Common Questions
What are the Top Zip Codes with the Highest Percentage of Families with Income Below $10,000 in Cuyahoga Falls, OH?
Top Zip Codes with the Highest Percentage of Families with Income Below $10,000 in Cuyahoga Falls, OH are:
What zip code has the Highest Percentage of Families with Income Below $10,000 in Cuyahoga Falls, OH?
44223 has the Highest Percentage of Families with Income Below $10,000 in Cuyahoga Falls, OH with 2.8%.
What is the Percentage of Families with Income Below $10,000 in Cuyahoga Falls, OH?
Percentage of Families with Income Below $10,000 in Cuyahoga Falls is 3.0%.
What is the Percentage of Families with Income Below $10,000 in Ohio?
Percentage of Families with Income Below $10,000 in Ohio is 3.3%.
What is the Percentage of Families with Income Below $10,000 in the United States?
Percentage of Families with Income Below $10,000 in the United States is 3.1%.