Zip Codes with the Highest Percentage of Families with Income Below $10,000 in Massachusetts
RELATED REPORTS & OPTIONS
Family Income | $0-10k
Massachusetts
Compare Zip Codes
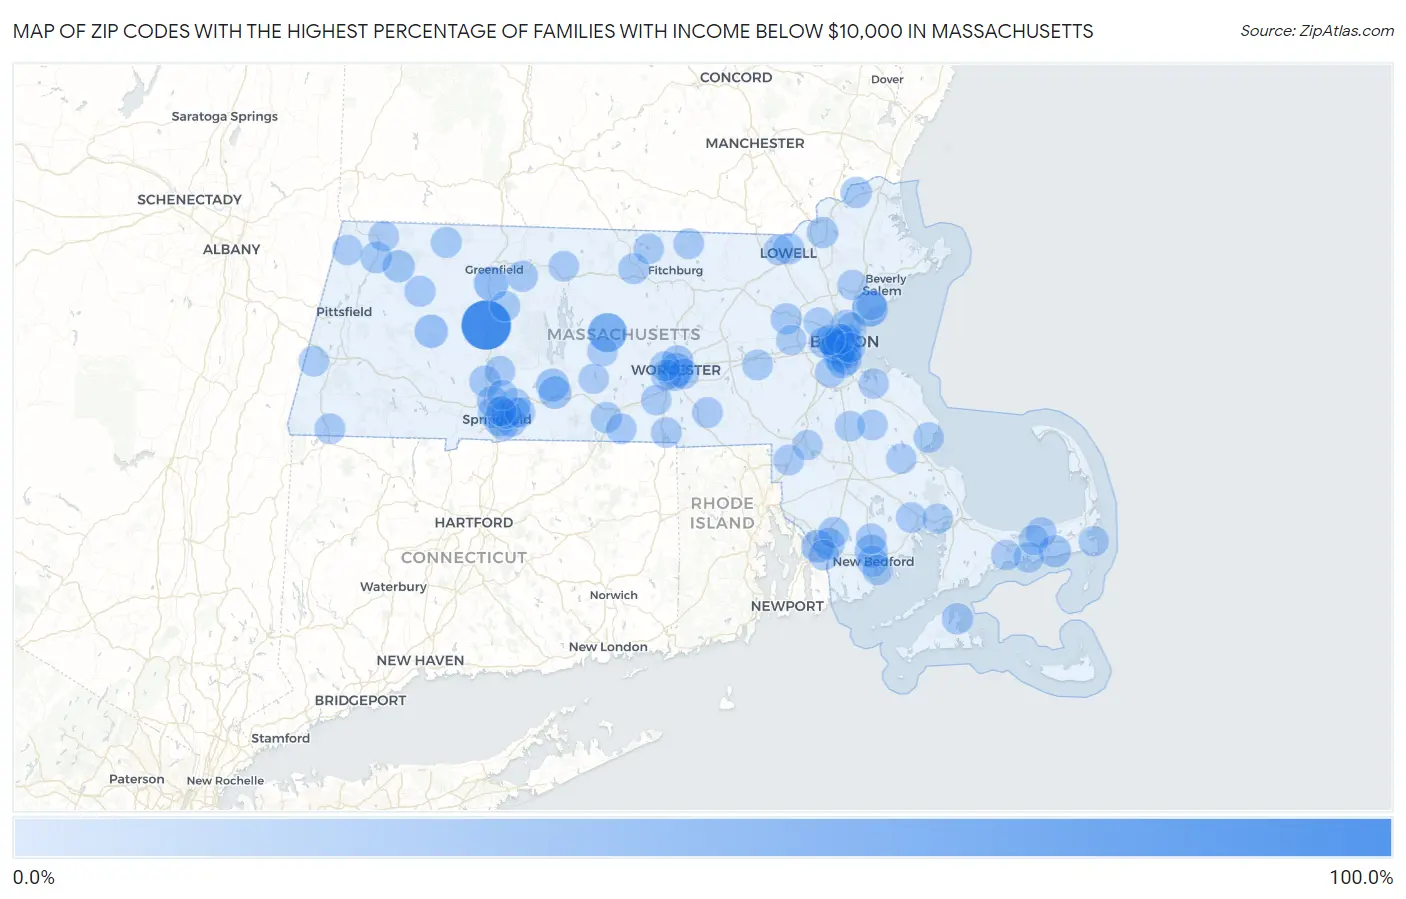
Map of Zip Codes with the Highest Percentage of Families with Income Below $10,000 in Massachusetts
0.0%
100.0%
Zip Codes with the Highest Percentage of Families with Income Below $10,000 in Massachusetts
| Zip Code | Families with Income < $10k | vs State | vs National | |
| 1. | 01066 | 84.2% | 2.4%(+81.8)#1 | 3.1%(+81.1)#15 |
| 2. | 01074 | 38.8% | 2.4%(+36.4)#2 | 3.1%(+35.7)#119 |
| 3. | 01901 | 26.3% | 2.4%(+23.9)#3 | 3.1%(+23.2)#271 |
| 4. | 01342 | 20.5% | 2.4%(+18.1)#4 | 3.1%(+17.4)#454 |
| 5. | 01608 | 18.9% | 2.4%(+16.5)#5 | 3.1%(+15.8)#531 |
| 6. | 01084 | 15.8% | 2.4%(+13.4)#6 | 3.1%(+12.7)#772 |
| 7. | 02199 | 15.1% | 2.4%(+12.7)#7 | 3.1%(+12.0)#856 |
| 8. | 02746 | 14.8% | 2.4%(+12.4)#8 | 3.1%(+11.7)#880 |
| 9. | 01009 | 14.0% | 2.4%(+11.6)#9 | 3.1%(+10.9)#977 |
| 10. | 01079 | 13.7% | 2.4%(+11.3)#10 | 3.1%(+10.6)#1,023 |
| 11. | 02111 | 13.2% | 2.4%(+10.8)#11 | 3.1%(+10.1)#1,092 |
| 12. | 01105 | 12.7% | 2.4%(+10.3)#12 | 3.1%(+9.60)#1,182 |
| 13. | 02724 | 12.5% | 2.4%(+10.1)#13 | 3.1%(+9.40)#1,218 |
| 14. | 01256 | 11.2% | 2.4%(+8.80)#14 | 3.1%(+8.10)#1,547 |
| 15. | 02639 | 10.9% | 2.4%(+8.50)#15 | 3.1%(+7.80)#1,622 |
| 16. | 01610 | 10.7% | 2.4%(+8.30)#16 | 3.1%(+7.60)#1,676 |
| 17. | 02118 | 10.3% | 2.4%(+7.90)#17 | 3.1%(+7.20)#1,797 |
| 18. | 01605 | 9.4% | 2.4%(+7.00)#18 | 3.1%(+6.30)#2,154 |
| 19. | 01107 | 9.3% | 2.4%(+6.90)#19 | 3.1%(+6.20)#2,200 |
| 20. | 02723 | 9.1% | 2.4%(+6.70)#20 | 3.1%(+6.00)#2,298 |
| 21. | 02110 | 8.9% | 2.4%(+6.50)#21 | 3.1%(+5.80)#2,421 |
| 22. | 02120 | 8.8% | 2.4%(+6.40)#22 | 3.1%(+5.70)#2,459 |
| 23. | 01220 | 8.7% | 2.4%(+6.30)#23 | 3.1%(+5.60)#2,519 |
| 24. | 01040 | 8.2% | 2.4%(+5.80)#24 | 3.1%(+5.10)#2,833 |
| 25. | 02119 | 7.8% | 2.4%(+5.40)#25 | 3.1%(+4.70)#3,079 |
| 26. | 02121 | 7.6% | 2.4%(+5.20)#26 | 3.1%(+4.50)#3,202 |
| 27. | 01840 | 7.6% | 2.4%(+5.20)#27 | 3.1%(+4.50)#3,224 |
| 28. | 01860 | 7.4% | 2.4%(+5.00)#28 | 3.1%(+4.30)#3,354 |
| 29. | 02557 | 7.3% | 2.4%(+4.90)#29 | 3.1%(+4.20)#3,441 |
| 30. | 01850 | 7.2% | 2.4%(+4.80)#30 | 3.1%(+4.10)#3,485 |
| 31. | 02125 | 7.0% | 2.4%(+4.60)#31 | 3.1%(+3.90)#3,627 |
| 32. | 02124 | 6.9% | 2.4%(+4.50)#32 | 3.1%(+3.80)#3,689 |
| 33. | 01518 | 6.9% | 2.4%(+4.50)#33 | 3.1%(+3.80)#3,743 |
| 34. | 01773 | 6.8% | 2.4%(+4.40)#34 | 3.1%(+3.70)#3,829 |
| 35. | 01349 | 6.6% | 2.4%(+4.20)#35 | 3.1%(+3.50)#4,070 |
| 36. | 01440 | 6.5% | 2.4%(+4.10)#36 | 3.1%(+3.40)#4,113 |
| 37. | 01070 | 6.5% | 2.4%(+4.10)#37 | 3.1%(+3.40)#4,182 |
| 38. | 02115 | 6.4% | 2.4%(+4.00)#38 | 3.1%(+3.30)#4,206 |
| 39. | 02740 | 6.1% | 2.4%(+3.70)#39 | 3.1%(+3.00)#4,523 |
| 40. | 02720 | 6.1% | 2.4%(+3.70)#40 | 3.1%(+3.00)#4,533 |
| 41. | 01013 | 6.1% | 2.4%(+3.70)#41 | 3.1%(+3.00)#4,545 |
| 42. | 01346 | 6.1% | 2.4%(+3.70)#42 | 3.1%(+3.00)#4,624 |
| 43. | 01151 | 5.9% | 2.4%(+3.50)#43 | 3.1%(+2.80)#4,812 |
| 44. | 01702 | 5.5% | 2.4%(+3.10)#44 | 3.1%(+2.40)#5,305 |
| 45. | 01588 | 5.4% | 2.4%(+3.00)#45 | 3.1%(+2.30)#5,489 |
| 46. | 02745 | 5.3% | 2.4%(+2.90)#46 | 3.1%(+2.20)#5,618 |
| 47. | 01474 | 5.3% | 2.4%(+2.90)#47 | 3.1%(+2.20)#5,690 |
| 48. | 01222 | 5.3% | 2.4%(+2.90)#48 | 3.1%(+2.20)#5,723 |
| 49. | 01118 | 5.2% | 2.4%(+2.80)#49 | 3.1%(+2.10)#5,791 |
| 50. | 01119 | 5.0% | 2.4%(+2.60)#50 | 3.1%(+1.90)#6,127 |
| 51. | 01108 | 4.9% | 2.4%(+2.50)#51 | 3.1%(+1.80)#6,277 |
| 52. | 02122 | 4.9% | 2.4%(+2.50)#52 | 3.1%(+1.80)#6,280 |
| 53. | 01603 | 4.9% | 2.4%(+2.50)#53 | 3.1%(+1.80)#6,289 |
| 54. | 01550 | 4.9% | 2.4%(+2.50)#54 | 3.1%(+1.80)#6,295 |
| 55. | 02149 | 4.8% | 2.4%(+2.40)#55 | 3.1%(+1.70)#6,417 |
| 56. | 01570 | 4.8% | 2.4%(+2.40)#56 | 3.1%(+1.70)#6,474 |
| 57. | 02576 | 4.8% | 2.4%(+2.40)#57 | 3.1%(+1.70)#6,519 |
| 58. | 02638 | 4.8% | 2.4%(+2.40)#58 | 3.1%(+1.70)#6,530 |
| 59. | 01537 | 4.7% | 2.4%(+2.30)#59 | 3.1%(+1.60)#6,743 |
| 60. | 02763 | 4.7% | 2.4%(+2.30)#60 | 3.1%(+1.60)#6,754 |
| 61. | 01364 | 4.6% | 2.4%(+2.20)#61 | 3.1%(+1.50)#6,880 |
| 62. | 01430 | 4.6% | 2.4%(+2.20)#62 | 3.1%(+1.50)#6,887 |
| 63. | 01604 | 4.5% | 2.4%(+2.10)#63 | 3.1%(+1.40)#6,991 |
| 64. | 02721 | 4.5% | 2.4%(+2.10)#64 | 3.1%(+1.40)#7,012 |
| 65. | 01075 | 4.5% | 2.4%(+2.10)#65 | 3.1%(+1.40)#7,033 |
| 66. | 01266 | 4.5% | 2.4%(+2.10)#66 | 3.1%(+1.40)#7,151 |
| 67. | 02135 | 4.4% | 2.4%(+2.00)#67 | 3.1%(+1.30)#7,207 |
| 68. | 02744 | 4.4% | 2.4%(+2.00)#68 | 3.1%(+1.30)#7,264 |
| 69. | 02332 | 4.3% | 2.4%(+1.90)#69 | 3.1%(+1.20)#7,460 |
| 70. | 02673 | 4.3% | 2.4%(+1.90)#70 | 3.1%(+1.20)#7,479 |
| 71. | 01109 | 4.2% | 2.4%(+1.80)#71 | 3.1%(+1.10)#7,661 |
| 72. | 01247 | 4.2% | 2.4%(+1.80)#72 | 3.1%(+1.10)#7,706 |
| 73. | 01375 | 4.2% | 2.4%(+1.80)#73 | 3.1%(+1.10)#7,772 |
| 74. | 02150 | 4.1% | 2.4%(+1.70)#74 | 3.1%(+1.000)#7,882 |
| 75. | 02382 | 4.1% | 2.4%(+1.70)#75 | 3.1%(+1.000)#7,939 |
| 76. | 02632 | 4.1% | 2.4%(+1.70)#76 | 3.1%(+1.000)#7,955 |
| 77. | 01129 | 4.1% | 2.4%(+1.70)#77 | 3.1%(+1.000)#7,998 |
| 78. | 01902 | 4.0% | 2.4%(+1.60)#78 | 3.1%(+0.900)#8,113 |
| 79. | 01940 | 4.0% | 2.4%(+1.60)#79 | 3.1%(+0.900)#8,207 |
| 80. | 01267 | 4.0% | 2.4%(+1.60)#80 | 3.1%(+0.900)#8,235 |
| 81. | 02650 | 4.0% | 2.4%(+1.60)#81 | 3.1%(+0.900)#8,326 |
| 82. | 01531 | 3.9% | 2.4%(+1.50)#82 | 3.1%(+0.800)#8,605 |
| 83. | 02301 | 3.8% | 2.4%(+1.40)#83 | 3.1%(+0.700)#8,629 |
| 84. | 01020 | 3.8% | 2.4%(+1.40)#84 | 3.1%(+0.700)#8,670 |
| 85. | 01854 | 3.8% | 2.4%(+1.40)#85 | 3.1%(+0.700)#8,680 |
| 86. | 02367 | 3.8% | 2.4%(+1.40)#86 | 3.1%(+0.700)#8,825 |
| 87. | 01602 | 3.7% | 2.4%(+1.30)#87 | 3.1%(+0.600)#8,989 |
| 88. | 01104 | 3.7% | 2.4%(+1.30)#88 | 3.1%(+0.600)#8,995 |
| 89. | 02538 | 3.7% | 2.4%(+1.30)#89 | 3.1%(+0.600)#9,089 |
| 90. | 02215 | 3.6% | 2.4%(+1.20)#90 | 3.1%(+0.500)#9,260 |
| 91. | 02048 | 3.6% | 2.4%(+1.20)#91 | 3.1%(+0.500)#9,261 |
| 92. | 02675 | 3.6% | 2.4%(+1.20)#92 | 3.1%(+0.500)#9,333 |
| 93. | 02142 | 3.6% | 2.4%(+1.20)#93 | 3.1%(+0.500)#9,355 |
| 94. | 02136 | 3.5% | 2.4%(+1.10)#94 | 3.1%(+0.400)#9,489 |
| 95. | 02127 | 3.5% | 2.4%(+1.10)#95 | 3.1%(+0.400)#9,503 |
| 96. | 02134 | 3.5% | 2.4%(+1.10)#96 | 3.1%(+0.400)#9,552 |
| 97. | 02476 | 3.5% | 2.4%(+1.10)#97 | 3.1%(+0.400)#9,555 |
| 98. | 02189 | 3.5% | 2.4%(+1.10)#98 | 3.1%(+0.400)#9,565 |
| 99. | 02493 | 3.5% | 2.4%(+1.10)#99 | 3.1%(+0.400)#9,587 |
| 100. | 01585 | 3.5% | 2.4%(+1.10)#100 | 3.1%(+0.400)#9,648 |
Common Questions
What are the Top 10 Zip Codes with the Highest Percentage of Families with Income Below $10,000 in Massachusetts?
Top 10 Zip Codes with the Highest Percentage of Families with Income Below $10,000 in Massachusetts are:
What zip code has the Highest Percentage of Families with Income Below $10,000 in Massachusetts?
01066 has the Highest Percentage of Families with Income Below $10,000 in Massachusetts with 84.2%.
What is the Percentage of Families with Income Below $10,000 in the State of Massachusetts?
Percentage of Families with Income Below $10,000 in Massachusetts is 2.4%.
What is the Percentage of Families with Income Below $10,000 in the United States?
Percentage of Families with Income Below $10,000 in the United States is 3.1%.