Zip Codes with the Highest Percentage of Families with Income Below $10,000 in Cleveland, OH

RELATED REPORTS & OPTIONS

Family Income | $0-10k
Population
Families and Households
Female Fertility
Female Fertility (Unmarried)
Race (Community Size)
Race (Percentage)
Ancestry (Community Size)
AfghanAfricanAlbanianAlsatianAmericanApacheArabArgentineanArmenianAustralianAustrianBahamianBangladeshiBarbadianBelgianBelizeanBhutaneseBlackfeetBrazilianBritishBritish West IndianBulgarianBurmeseCajunCambodianCanadianCape VerdeanCarpatho RusynCelticCentral AmericanCentral American IndianCherokeeChickasawChileanChippewaChoctawColombianComancheCosta RicanCreekCroatianCubanCzechCzechoslovakianDanishDelawareDominicanDutchDutch West IndianEastern EuropeanEcuadorianEgyptianEnglishEstonianEthiopianEuropeanFilipinoFinnishFrenchFrench American IndianFrench CanadianGermanGhanaianGreekGuamanian / ChamorroGuatemalanGuyaneseHaitianHonduranHungarianIcelanderIndian (Asian)IndonesianIranianIraqiIrishIroquoisIsraeliItalianJamaicanJapaneseJordanianKoreanLaotianLatvianLebaneseLiberianLithuanianLumbeeLuxembourgerMacedonianMalaysianMexicanMexican American IndianMongolianMoroccanNative HawaiianNavajoNicaraguanNigerianNorthern EuropeanNorwegianPakistaniPalestinianPanamanianParaguayanPennsylvania GermanPeruvianPolishPortuguesePuebloPuerto RicanRomanianRussianSalvadoranSamoanScandinavianScotch-IrishScottishSeminoleSerbianSierra LeoneanSiouxSlavicSlovakSloveneSomaliSouth AfricanSouth AmericanSouth American IndianSpaniardSpanishSri LankanSubsaharan AfricanSudaneseSwedishSwissSyrianThaiTrinidadian and TobagonianTurkishU.S. Virgin IslanderUgandanUkrainianUruguayanVenezuelanVietnameseWelshWest IndianYaquiYugoslavianZimbabwean
Ancestry (Percentage)
AfghanAfricanAlbanianAlsatianAmericanApacheArabArgentineanArmenianAustralianAustrianBahamianBangladeshiBarbadianBelgianBelizeanBhutaneseBlackfeetBrazilianBritishBritish West IndianBulgarianBurmeseCajunCambodianCanadianCape VerdeanCarpatho RusynCelticCentral AmericanCentral American IndianCherokeeChickasawChileanChippewaChoctawColombianComancheCosta RicanCreekCroatianCubanCzechCzechoslovakianDanishDelawareDominicanDutchDutch West IndianEastern EuropeanEcuadorianEgyptianEnglishEstonianEthiopianEuropeanFilipinoFinnishFrenchFrench American IndianFrench CanadianGermanGhanaianGreekGuamanian / ChamorroGuatemalanGuyaneseHaitianHonduranHungarianIcelanderIndian (Asian)IndonesianIranianIraqiIrishIroquoisIsraeliItalianJamaicanJapaneseJordanianKoreanLaotianLatvianLebaneseLiberianLithuanianLumbeeLuxembourgerMacedonianMalaysianMexicanMexican American IndianMongolianMoroccanNative HawaiianNavajoNicaraguanNigerianNorthern EuropeanNorwegianPakistaniPalestinianPanamanianParaguayanPennsylvania GermanPeruvianPolishPortuguesePuebloPuerto RicanRomanianRussianSalvadoranSamoanScandinavianScotch-IrishScottishSeminoleSerbianSierra LeoneanSiouxSlavicSlovakSloveneSomaliSouth AfricanSouth AmericanSouth American IndianSpaniardSpanishSri LankanSubsaharan AfricanSudaneseSwedishSwissSyrianThaiTrinidadian and TobagonianTurkishU.S. Virgin IslanderUgandanUkrainianUruguayanVenezuelanVietnameseWelshWest IndianYaquiYugoslavianZimbabwean
Immigrant Origin (Total)
AfghanistanAfricaAlbaniaArgentinaAsiaAustraliaAustriaBangladeshBarbadosBelarusBelgiumBelizeBosnia and HerzegovinaBrazilBulgariaBurma / MyanmarCambodiaCanadaCaribbeanCentral AmericaChileChinaColombiaCongoCosta RicaCroatiaCubaCzechoslovakiaDominican RepublicEastern AfricaEastern AsiaEastern EuropeEcuadorEgyptEl SalvadorEnglandEthiopiaEuropeFranceGermanyGhanaGreeceGuatemalaGuyanaHaitiHondurasHong KongHungaryIndiaIndonesiaIranIraqIrelandIsraelItalyJamaicaJapanJordanKazakhstanKenyaKoreaKuwaitLaosLatin AmericaLatviaLebanonLiberiaLithuaniaMalaysiaMexicoMiddle AfricaMoldovaMoroccoNepalNetherlandsNicaraguaNigeriaNorthern AfricaNorthern EuropeOceaniaPakistanPanamaPeruPhilippinesPolandRomaniaRussiaSaudi ArabiaScotlandSerbiaSierra LeoneSingaporeSomaliaSouth AfricaSouth AmericaSouth Central AsiaSouth Eastern AsiaSouthern EuropeSpainSri LankaSudanSwedenSyriaTaiwanThailandTrinidad and TobagoTurkeyUgandaUkraineUruguayUzbekistanVenezuelaVietnamWest IndiesWestern AfricaWestern AsiaWestern EuropeZaireZimbabwe
Immigrant Origin (Percentage)
AfghanistanAfricaAlbaniaArgentinaAsiaAustraliaAustriaBangladeshBarbadosBelarusBelgiumBelizeBosnia and HerzegovinaBrazilBulgariaBurma / MyanmarCambodiaCanadaCaribbeanCentral AmericaChileChinaColombiaCongoCosta RicaCroatiaCubaCzechoslovakiaDominican RepublicEastern AfricaEastern AsiaEastern EuropeEcuadorEgyptEl SalvadorEnglandEthiopiaEuropeFranceGermanyGhanaGreeceGuatemalaGuyanaHaitiHondurasHong KongHungaryIndiaIndonesiaIranIraqIrelandIsraelItalyJamaicaJapanJordanKazakhstanKenyaKoreaKuwaitLaosLatin AmericaLatviaLebanonLiberiaLithuaniaMalaysiaMexicoMiddle AfricaMoldovaMoroccoNepalNetherlandsNicaraguaNigeriaNorthern AfricaNorthern EuropeOceaniaPakistanPanamaPeruPhilippinesPolandRomaniaRussiaSaudi ArabiaScotlandSerbiaSierra LeoneSingaporeSomaliaSouth AfricaSouth AmericaSouth Central AsiaSouth Eastern AsiaSouthern EuropeSpainSri LankaSudanSwedenSyriaTaiwanThailandTrinidad and TobagoTurkeyUgandaUkraineUruguayUzbekistanVenezuelaVietnamWest IndiesWestern AfricaWestern AsiaWestern EuropeZaireZimbabwe
Income
Income (Families)
Income (Households)
Poverty
Poverty (Families)
Unemployment
Employment Occupations
Employment Industries
Employer Class
Commute Time
Commute Means
School Enrollment
Education by Degree Field
Occupancy
Finances
Physical Characteristics
Cleveland
Compare Zip Codes
Comparison Subject

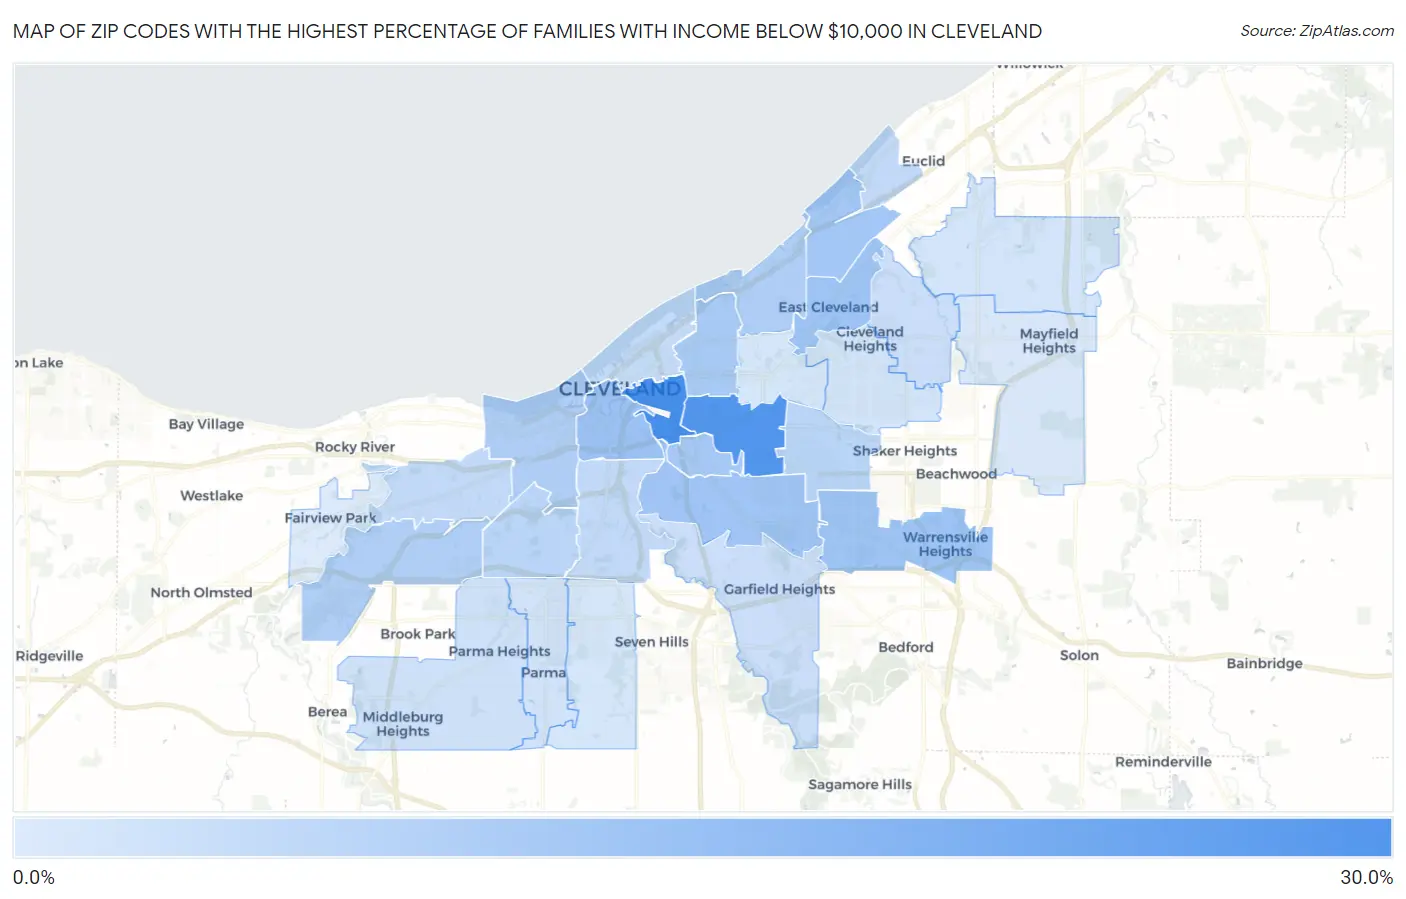
Map of Zip Codes with the Highest Percentage of Families with Income Below $10,000 in Cleveland

0.0%
30.0%
Zip Codes with the Highest Percentage of Families with Income Below $10,000 in Cleveland Map

Zip Codes with the Highest Percentage of Families with Income Below $10,000 in Cleveland, OH

Zip Code Families with Income < $10k vs State vs National
1.4411529.2%3.3%(+25.9)#63.1%(+26.1)#205
2.4410426.8%3.3%(+23.5)#83.1%(+23.7)#257
3.4411312.5%3.3%(+9.20)#373.1%(+9.40)#1,215
4.4412811.6%3.3%(+8.30)#473.1%(+8.50)#1,416
5.4411211.5%3.3%(+8.20)#503.1%(+8.40)#1,445
6.4410511.3%3.3%(+8.00)#533.1%(+8.20)#1,499
7.4411010.7%3.3%(+7.40)#623.1%(+7.60)#1,679
8.4412710.3%3.3%(+7.00)#683.1%(+7.20)#1,803
9.441039.8%3.3%(+6.50)#763.1%(+6.70)#1,990
10.441028.7%3.3%(+5.40)#1013.1%(+5.60)#2,504
11.441088.6%3.3%(+5.30)#1053.1%(+5.50)#2,566
12.441358.4%3.3%(+5.10)#1113.1%(+5.30)#2,711
13.441206.8%3.3%(+3.50)#1613.1%(+3.70)#3,799
14.441446.6%3.3%(+3.30)#1663.1%(+3.50)#4,001
15.441115.4%3.3%(+2.10)#2133.1%(+2.30)#5,436
16.441095.4%3.3%(+2.10)#2143.1%(+2.30)#5,439
17.441195.4%3.3%(+2.10)#2163.1%(+2.30)#5,477
18.441144.9%3.3%(+1.60)#2453.1%(+1.80)#6,325
19.441213.7%3.3%(+0.400)#3393.1%(+0.600)#8,973
20.441253.7%3.3%(+0.400)#3403.1%(+0.600)#8,980
21.441303.1%3.3%(-0.200)#4103.1%(=0.000)#10,752
22.441292.5%3.3%(-0.800)#4913.1%(-0.600)#13,099
23.441432.2%3.3%(-1.10)#5433.1%(-0.900)#14,404
24.441182.1%3.3%(-1.20)#5563.1%(-1.000)#14,803
25.441062.0%3.3%(-1.30)#5793.1%(-1.10)#15,352
26.441341.9%3.3%(-1.40)#5983.1%(-1.20)#15,771
27.441241.4%3.3%(-1.90)#6913.1%(-1.70)#18,190
28.441260.70%3.3%(-2.60)#8133.1%(-2.40)#21,759

Common Questions

What are the Top 10 Zip Codes with the Highest Percentage of Families with Income Below $10,000 in Cleveland, OH?
Top 10 Zip Codes with the Highest Percentage of Families with Income Below $10,000 in Cleveland, OH are:
#1
29.2%
#2
26.8%
#3
12.5%
#4
11.6%
#5
11.5%
#6
11.3%
#7
10.7%
#8
10.3%
#9
9.8%
#10
8.7%
What zip code has the Highest Percentage of Families with Income Below $10,000 in Cleveland, OH?
44115 has the Highest Percentage of Families with Income Below $10,000 in Cleveland, OH with 29.2%.
What is the Percentage of Families with Income Below $10,000 in Cleveland, OH?
Percentage of Families with Income Below $10,000 in Cleveland is 10.0%.
What is the Percentage of Families with Income Below $10,000 in Ohio?
Percentage of Families with Income Below $10,000 in Ohio is 3.3%.
What is the Percentage of Families with Income Below $10,000 in the United States?
Percentage of Families with Income Below $10,000 in the United States is 3.1%.