Zip Codes with the Highest Percentage of Population Employed in Computer & Mathematics in Mansfield, OH
RELATED REPORTS & OPTIONS
Computer & Mathematics
Mansfield
Compare Zip Codes
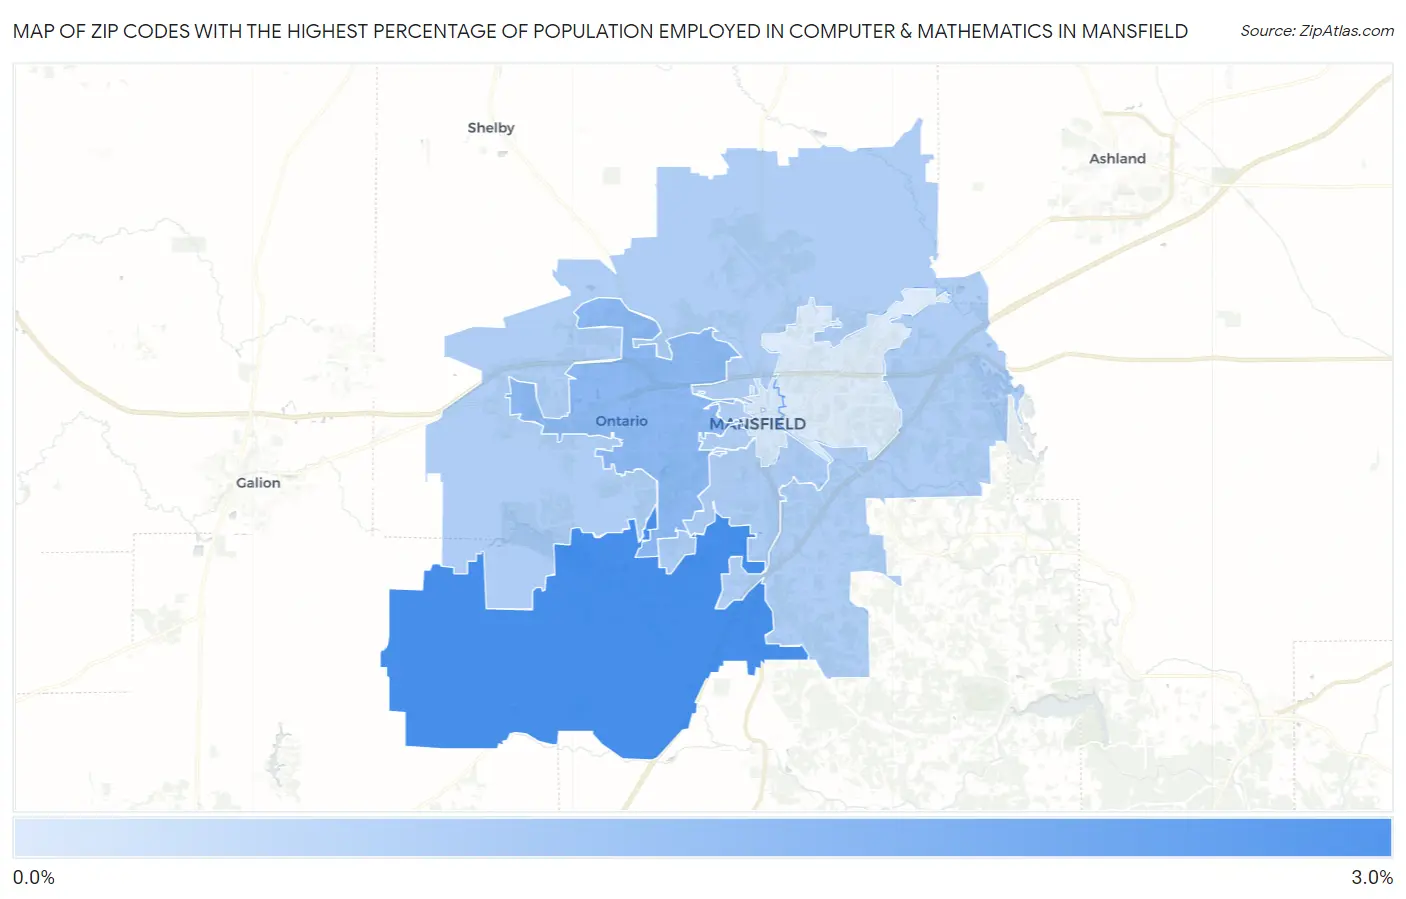
Map of Zip Codes with the Highest Percentage of Population Employed in Computer & Mathematics in Mansfield
0.0%
3.0%
Zip Codes with the Highest Percentage of Population Employed in Computer & Mathematics in Mansfield, OH
| Zip Code | % Employed | vs State | vs National | |
| 1. | 44904 | 2.7% | 3.0%(-0.299)#296 | 3.5%(-0.790)#8,693 |
| 2. | 44906 | 1.6% | 3.0%(-1.39)#501 | 3.5%(-1.88)#13,551 |
| 3. | 44907 | 1.1% | 3.0%(-1.90)#628 | 3.5%(-2.39)#16,523 |
| 4. | 44903 | 1.1% | 3.0%(-1.95)#641 | 3.5%(-2.44)#16,844 |
| 5. | 44902 | 0.48% | 3.0%(-2.56)#790 | 3.5%(-3.05)#20,628 |
| 6. | 44905 | 0.37% | 3.0%(-2.66)#820 | 3.5%(-3.15)#21,223 |
1
Common Questions
What are the Top 5 Zip Codes with the Highest Percentage of Population Employed in Computer & Mathematics in Mansfield, OH?
Top 5 Zip Codes with the Highest Percentage of Population Employed in Computer & Mathematics in Mansfield, OH are:
What zip code has the Highest Percentage of Population Employed in Computer & Mathematics in Mansfield, OH?
44904 has the Highest Percentage of Population Employed in Computer & Mathematics in Mansfield, OH with 2.7%.
What is the Percentage of Population Employed in Computer & Mathematics in Mansfield, OH?
Percentage of Population Employed in Computer & Mathematics in Mansfield is 1.4%.
What is the Percentage of Population Employed in Computer & Mathematics in Ohio?
Percentage of Population Employed in Computer & Mathematics in Ohio is 3.0%.
What is the Percentage of Population Employed in Computer & Mathematics in the United States?
Percentage of Population Employed in Computer & Mathematics in the United States is 3.5%.