Zip Codes with the Highest Percentage of Population Employed in Computer & Mathematics in Springfield, OH
RELATED REPORTS & OPTIONS
Computer & Mathematics
Springfield
Compare Zip Codes
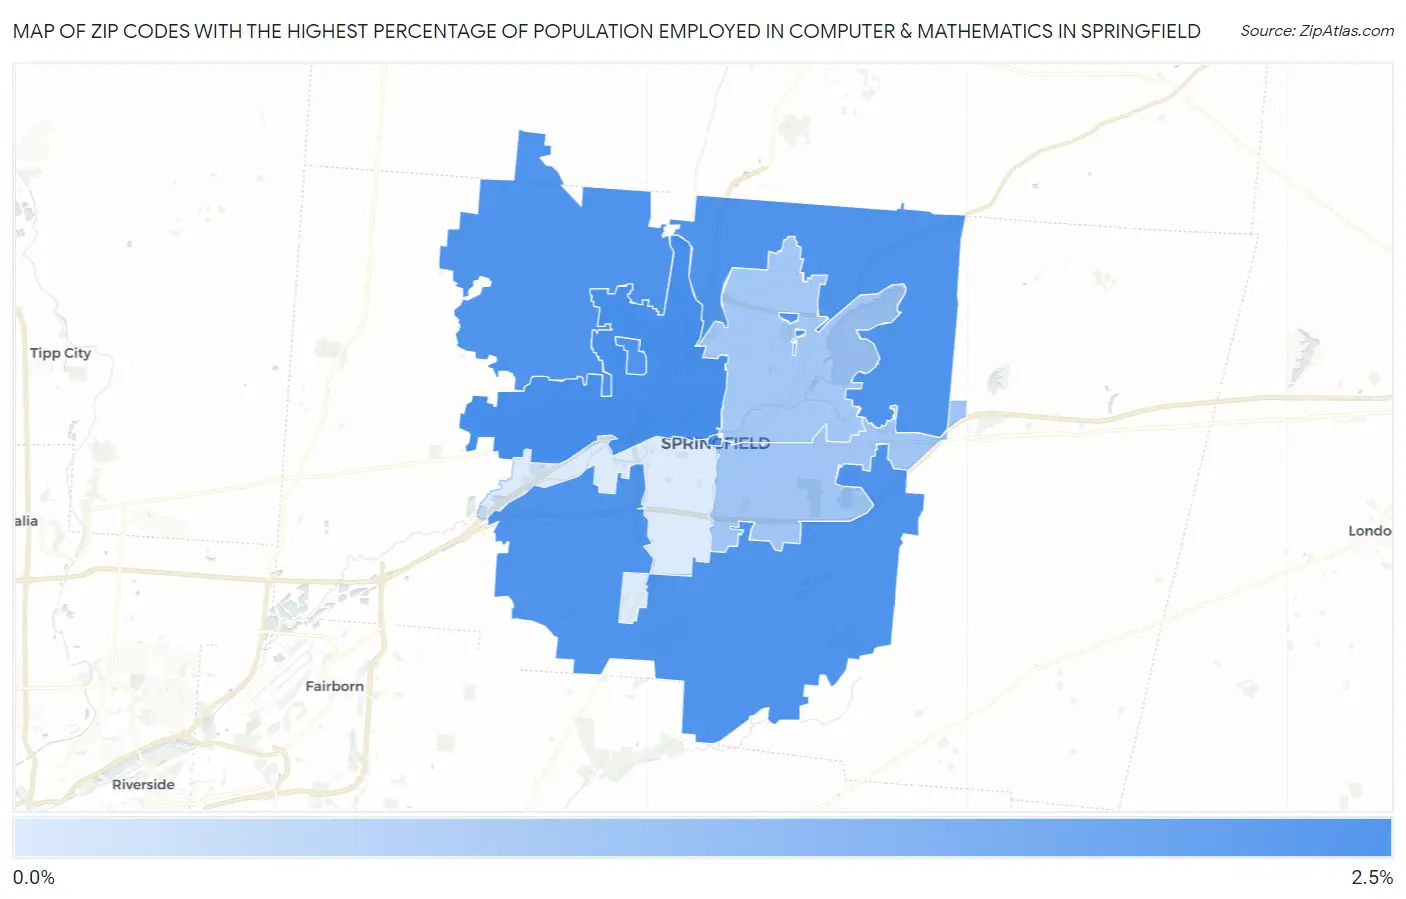
Map of Zip Codes with the Highest Percentage of Population Employed in Computer & Mathematics in Springfield
0.0%
2.5%
Zip Codes with the Highest Percentage of Population Employed in Computer & Mathematics in Springfield, OH
| Zip Code | % Employed | vs State | vs National | |
| 1. | 45504 | 2.0% | 3.0%(-1.00)#428 | 3.5%(-1.49)#11,665 |
| 2. | 45502 | 1.9% | 3.0%(-1.10)#441 | 3.5%(-1.59)#12,115 |
| 3. | 45505 | 1.0% | 3.0%(-2.00)#655 | 3.5%(-2.49)#17,171 |
| 4. | 45503 | 1.0% | 3.0%(-2.02)#661 | 3.5%(-2.51)#17,292 |
| 5. | 45506 | 0.38% | 3.0%(-2.65)#816 | 3.5%(-3.15)#21,173 |
1
Common Questions
What are the Top 3 Zip Codes with the Highest Percentage of Population Employed in Computer & Mathematics in Springfield, OH?
Top 3 Zip Codes with the Highest Percentage of Population Employed in Computer & Mathematics in Springfield, OH are:
What zip code has the Highest Percentage of Population Employed in Computer & Mathematics in Springfield, OH?
45504 has the Highest Percentage of Population Employed in Computer & Mathematics in Springfield, OH with 2.0%.
What is the Percentage of Population Employed in Computer & Mathematics in Springfield, OH?
Percentage of Population Employed in Computer & Mathematics in Springfield is 0.82%.
What is the Percentage of Population Employed in Computer & Mathematics in Ohio?
Percentage of Population Employed in Computer & Mathematics in Ohio is 3.0%.
What is the Percentage of Population Employed in Computer & Mathematics in the United States?
Percentage of Population Employed in Computer & Mathematics in the United States is 3.5%.