Zip Codes with the Highest Percentage of Population Employed in Community & Social Service in Cleveland, OH

RELATED REPORTS & OPTIONS

Community & Social Service
Population
Families and Households
Female Fertility
Female Fertility (Unmarried)
Race (Community Size)
Race (Percentage)
Ancestry (Community Size)
AfghanAfricanAlbanianAlsatianAmericanApacheArabArgentineanArmenianAustralianAustrianBahamianBangladeshiBarbadianBelgianBelizeanBhutaneseBlackfeetBrazilianBritishBritish West IndianBulgarianBurmeseCajunCambodianCanadianCape VerdeanCarpatho RusynCelticCentral AmericanCentral American IndianCherokeeChickasawChileanChippewaChoctawColombianComancheCosta RicanCreekCroatianCubanCzechCzechoslovakianDanishDelawareDominicanDutchDutch West IndianEastern EuropeanEcuadorianEgyptianEnglishEstonianEthiopianEuropeanFilipinoFinnishFrenchFrench American IndianFrench CanadianGermanGhanaianGreekGuamanian / ChamorroGuatemalanGuyaneseHaitianHonduranHungarianIcelanderIndian (Asian)IndonesianIranianIraqiIrishIroquoisIsraeliItalianJamaicanJapaneseJordanianKoreanLaotianLatvianLebaneseLiberianLithuanianLumbeeLuxembourgerMacedonianMalaysianMexicanMexican American IndianMongolianMoroccanNative HawaiianNavajoNicaraguanNigerianNorthern EuropeanNorwegianPakistaniPalestinianPanamanianParaguayanPennsylvania GermanPeruvianPolishPortuguesePuebloPuerto RicanRomanianRussianSalvadoranSamoanScandinavianScotch-IrishScottishSeminoleSerbianSierra LeoneanSiouxSlavicSlovakSloveneSomaliSouth AfricanSouth AmericanSouth American IndianSpaniardSpanishSri LankanSubsaharan AfricanSudaneseSwedishSwissSyrianThaiTrinidadian and TobagonianTurkishU.S. Virgin IslanderUgandanUkrainianUruguayanVenezuelanVietnameseWelshWest IndianYaquiYugoslavianZimbabwean
Ancestry (Percentage)
AfghanAfricanAlbanianAlsatianAmericanApacheArabArgentineanArmenianAustralianAustrianBahamianBangladeshiBarbadianBelgianBelizeanBhutaneseBlackfeetBrazilianBritishBritish West IndianBulgarianBurmeseCajunCambodianCanadianCape VerdeanCarpatho RusynCelticCentral AmericanCentral American IndianCherokeeChickasawChileanChippewaChoctawColombianComancheCosta RicanCreekCroatianCubanCzechCzechoslovakianDanishDelawareDominicanDutchDutch West IndianEastern EuropeanEcuadorianEgyptianEnglishEstonianEthiopianEuropeanFilipinoFinnishFrenchFrench American IndianFrench CanadianGermanGhanaianGreekGuamanian / ChamorroGuatemalanGuyaneseHaitianHonduranHungarianIcelanderIndian (Asian)IndonesianIranianIraqiIrishIroquoisIsraeliItalianJamaicanJapaneseJordanianKoreanLaotianLatvianLebaneseLiberianLithuanianLumbeeLuxembourgerMacedonianMalaysianMexicanMexican American IndianMongolianMoroccanNative HawaiianNavajoNicaraguanNigerianNorthern EuropeanNorwegianPakistaniPalestinianPanamanianParaguayanPennsylvania GermanPeruvianPolishPortuguesePuebloPuerto RicanRomanianRussianSalvadoranSamoanScandinavianScotch-IrishScottishSeminoleSerbianSierra LeoneanSiouxSlavicSlovakSloveneSomaliSouth AfricanSouth AmericanSouth American IndianSpaniardSpanishSri LankanSubsaharan AfricanSudaneseSwedishSwissSyrianThaiTrinidadian and TobagonianTurkishU.S. Virgin IslanderUgandanUkrainianUruguayanVenezuelanVietnameseWelshWest IndianYaquiYugoslavianZimbabwean
Immigrant Origin (Total)
AfghanistanAfricaAlbaniaArgentinaAsiaAustraliaAustriaBangladeshBarbadosBelarusBelgiumBelizeBosnia and HerzegovinaBrazilBulgariaBurma / MyanmarCambodiaCanadaCaribbeanCentral AmericaChileChinaColombiaCongoCosta RicaCroatiaCubaCzechoslovakiaDominican RepublicEastern AfricaEastern AsiaEastern EuropeEcuadorEgyptEl SalvadorEnglandEthiopiaEuropeFranceGermanyGhanaGreeceGuatemalaGuyanaHaitiHondurasHong KongHungaryIndiaIndonesiaIranIraqIrelandIsraelItalyJamaicaJapanJordanKazakhstanKenyaKoreaKuwaitLaosLatin AmericaLatviaLebanonLiberiaLithuaniaMalaysiaMexicoMiddle AfricaMoldovaMoroccoNepalNetherlandsNicaraguaNigeriaNorthern AfricaNorthern EuropeOceaniaPakistanPanamaPeruPhilippinesPolandRomaniaRussiaSaudi ArabiaScotlandSerbiaSierra LeoneSingaporeSomaliaSouth AfricaSouth AmericaSouth Central AsiaSouth Eastern AsiaSouthern EuropeSpainSri LankaSudanSwedenSyriaTaiwanThailandTrinidad and TobagoTurkeyUgandaUkraineUruguayUzbekistanVenezuelaVietnamWest IndiesWestern AfricaWestern AsiaWestern EuropeZaireZimbabwe
Immigrant Origin (Percentage)
AfghanistanAfricaAlbaniaArgentinaAsiaAustraliaAustriaBangladeshBarbadosBelarusBelgiumBelizeBosnia and HerzegovinaBrazilBulgariaBurma / MyanmarCambodiaCanadaCaribbeanCentral AmericaChileChinaColombiaCongoCosta RicaCroatiaCubaCzechoslovakiaDominican RepublicEastern AfricaEastern AsiaEastern EuropeEcuadorEgyptEl SalvadorEnglandEthiopiaEuropeFranceGermanyGhanaGreeceGuatemalaGuyanaHaitiHondurasHong KongHungaryIndiaIndonesiaIranIraqIrelandIsraelItalyJamaicaJapanJordanKazakhstanKenyaKoreaKuwaitLaosLatin AmericaLatviaLebanonLiberiaLithuaniaMalaysiaMexicoMiddle AfricaMoldovaMoroccoNepalNetherlandsNicaraguaNigeriaNorthern AfricaNorthern EuropeOceaniaPakistanPanamaPeruPhilippinesPolandRomaniaRussiaSaudi ArabiaScotlandSerbiaSierra LeoneSingaporeSomaliaSouth AfricaSouth AmericaSouth Central AsiaSouth Eastern AsiaSouthern EuropeSpainSri LankaSudanSwedenSyriaTaiwanThailandTrinidad and TobagoTurkeyUgandaUkraineUruguayUzbekistanVenezuelaVietnamWest IndiesWestern AfricaWestern AsiaWestern EuropeZaireZimbabwe
Income
Income (Families)
Income (Households)
Poverty
Poverty (Families)
Unemployment
Employment Occupations
Employment Industries
Employer Class
Commute Time
Commute Means
School Enrollment
Education by Degree Field
Occupancy
Finances
Physical Characteristics
Cleveland
Compare Zip Codes
Comparison Subject

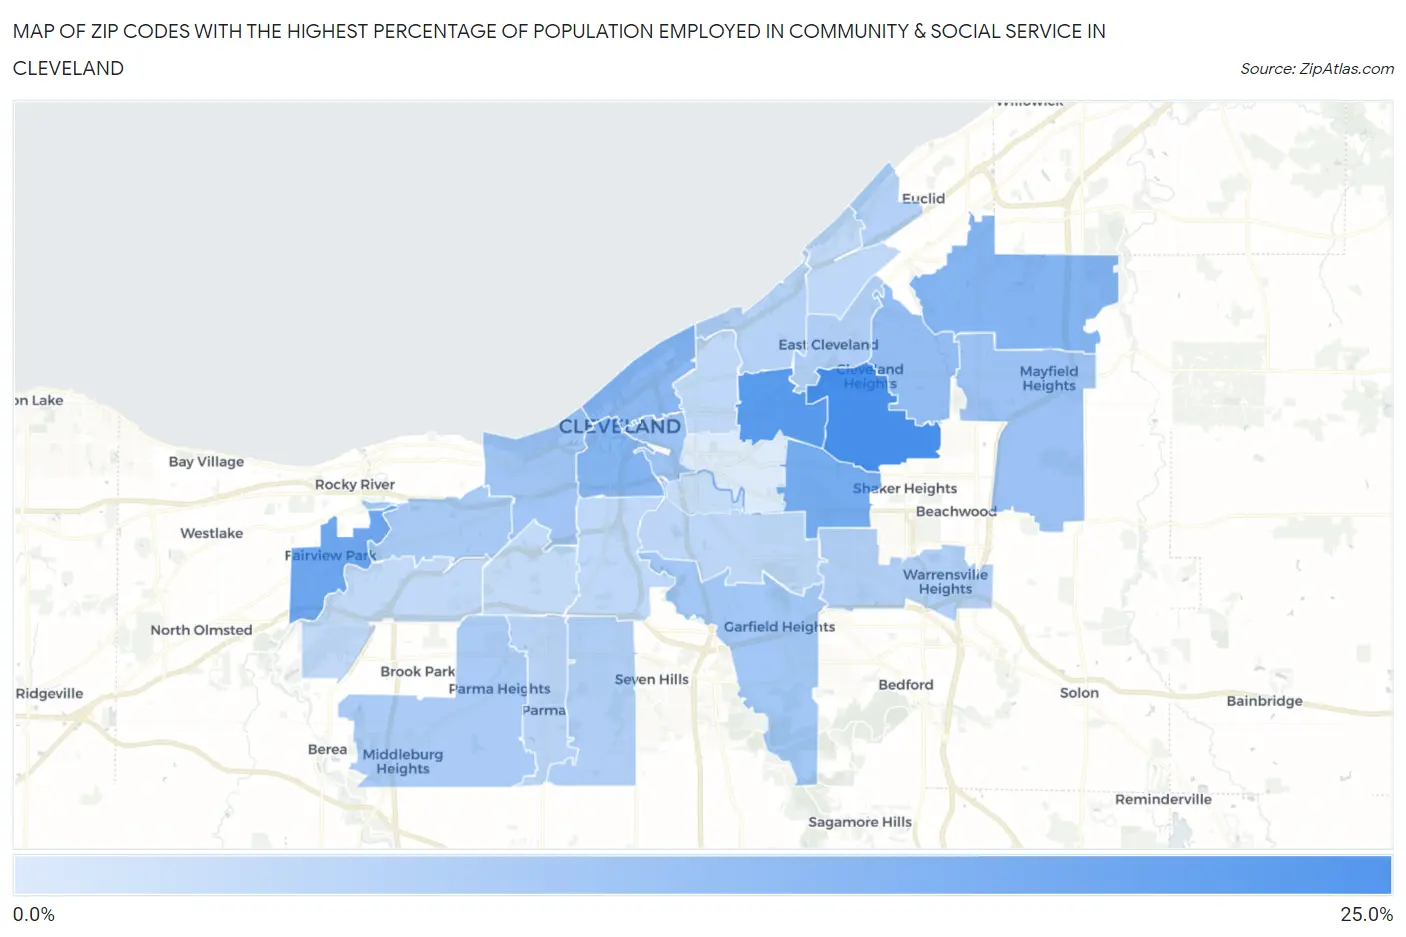
Map of Zip Codes with the Highest Percentage of Population Employed in Community & Social Service in Cleveland

0.0%
25.0%
Zip Codes with the Highest Percentage of Population Employed in Community & Social Service  in Cleveland Map

Zip Codes with the Highest Percentage of Population Employed in Community & Social Service in Cleveland, OH

Zip Code % Employed vs State vs National
1.4411820.7%10.0%(+10.8)#3011.2%(+9.52)#1,800
2.4410618.7%10.0%(+8.73)#4811.2%(+7.47)#2,515
3.4412615.8%10.0%(+5.86)#9011.2%(+4.61)#4,219
4.4412015.0%10.0%(+5.05)#10411.2%(+3.79)#4,951
5.4414313.4%10.0%(+3.40)#15011.2%(+2.14)#6,966
6.4411313.3%10.0%(+3.36)#15511.2%(+2.10)#7,038
7.4411412.6%10.0%(+2.62)#19411.2%(+1.36)#8,298
8.4412111.7%10.0%(+1.72)#24711.2%(+0.466)#10,053
9.4412410.9%10.0%(+0.934)#30511.2%(-0.325)#11,923
10.4411510.4%10.0%(+0.473)#33711.2%(-0.785)#13,046
11.4410210.0%10.0%(+0.050)#36611.2%(-1.21)#14,100
12.441259.7%10.0%(-0.231)#39011.2%(-1.49)#14,811
13.441119.2%10.0%(-0.738)#44211.2%(-2.00)#16,210
14.441309.0%10.0%(-0.969)#46711.2%(-2.23)#16,862
15.441128.5%10.0%(-1.46)#51211.2%(-2.72)#18,181
16.441348.4%10.0%(-1.53)#52111.2%(-2.79)#18,375
17.441288.1%10.0%(-1.88)#56611.2%(-3.14)#19,368
18.441198.0%10.0%(-2.00)#58811.2%(-3.26)#19,701
19.441087.6%10.0%(-2.36)#62611.2%(-3.62)#20,649
20.441297.4%10.0%(-2.55)#64811.2%(-3.81)#21,138
21.441057.0%10.0%(-3.00)#70111.2%(-4.25)#22,241
22.441096.7%10.0%(-3.29)#74011.2%(-4.55)#22,916
23.441036.6%10.0%(-3.36)#75311.2%(-4.62)#23,044
24.441106.6%10.0%(-3.37)#75411.2%(-4.63)#23,067
25.441356.4%10.0%(-3.59)#77511.2%(-4.84)#23,560
26.441446.1%10.0%(-3.89)#81911.2%(-5.15)#24,227
27.441275.8%10.0%(-4.18)#84311.2%(-5.44)#24,824
28.441043.4%10.0%(-6.56)#1,01511.2%(-7.82)#28,203

Common Questions

What are the Top 10 Zip Codes with the Highest Percentage of Population Employed in Community & Social Service in Cleveland, OH?
Top 10 Zip Codes with the Highest Percentage of Population Employed in Community & Social Service in Cleveland, OH are:
#1
20.7%
#2
18.7%
#3
15.8%
#4
15.0%
#5
13.4%
#6
13.3%
#7
12.6%
#8
11.7%
#9
10.9%
#10
10.4%
What zip code has the Highest Percentage of Population Employed in Community & Social Service in Cleveland, OH?
44118 has the Highest Percentage of Population Employed in Community & Social Service in Cleveland, OH with 20.7%.
What is the Percentage of Population Employed in Community & Social Service in Cleveland, OH?
Percentage of Population Employed in Community & Social Service in Cleveland is 8.8%.
What is the Percentage of Population Employed in Community & Social Service in Ohio?
Percentage of Population Employed in Community & Social Service in Ohio is 10.0%.
What is the Percentage of Population Employed in Community & Social Service in the United States?
Percentage of Population Employed in Community & Social Service in the United States is 11.2%.