Zip Codes with the Highest Percentage of Population Employed in Community & Social Service in Massillon, OH
RELATED REPORTS & OPTIONS
Community & Social Service
Massillon
Compare Zip Codes
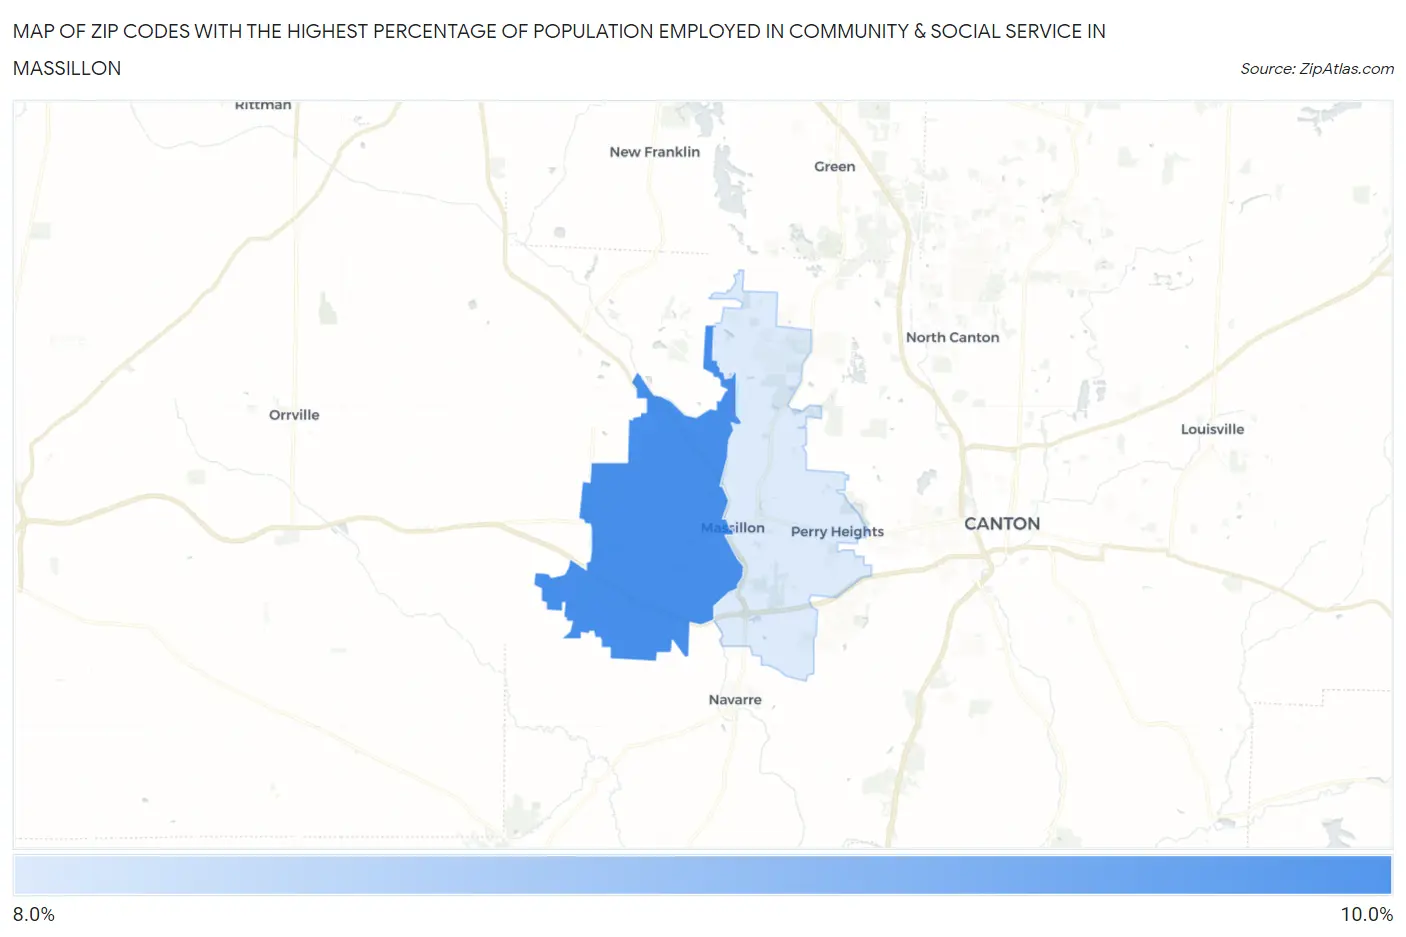
Map of Zip Codes with the Highest Percentage of Population Employed in Community & Social Service in Massillon
0.0%
10.0%
Zip Codes with the Highest Percentage of Population Employed in Community & Social Service in Massillon, OH
| Zip Code | % Employed | vs State | vs National | |
| 1. | 44647 | 9.5% | 10.0%(-0.408)#410 | 11.2%(-1.67)#15,280 |
| 2. | 44646 | 8.1% | 10.0%(-1.87)#565 | 11.2%(-3.13)#19,342 |
1
Common Questions
What are the Top Zip Codes with the Highest Percentage of Population Employed in Community & Social Service in Massillon, OH?
Top Zip Codes with the Highest Percentage of Population Employed in Community & Social Service in Massillon, OH are:
What zip code has the Highest Percentage of Population Employed in Community & Social Service in Massillon, OH?
44647 has the Highest Percentage of Population Employed in Community & Social Service in Massillon, OH with 9.5%.
What is the Percentage of Population Employed in Community & Social Service in Massillon, OH?
Percentage of Population Employed in Community & Social Service in Massillon is 7.5%.
What is the Percentage of Population Employed in Community & Social Service in Ohio?
Percentage of Population Employed in Community & Social Service in Ohio is 10.0%.
What is the Percentage of Population Employed in Community & Social Service in the United States?
Percentage of Population Employed in Community & Social Service in the United States is 11.2%.