Zip Codes with the Highest Percentage of Population Employed in Community & Social Service in Puerto Rico
RELATED REPORTS & OPTIONS
Community & Social Service
Puerto Rico
Compare Zip Codes
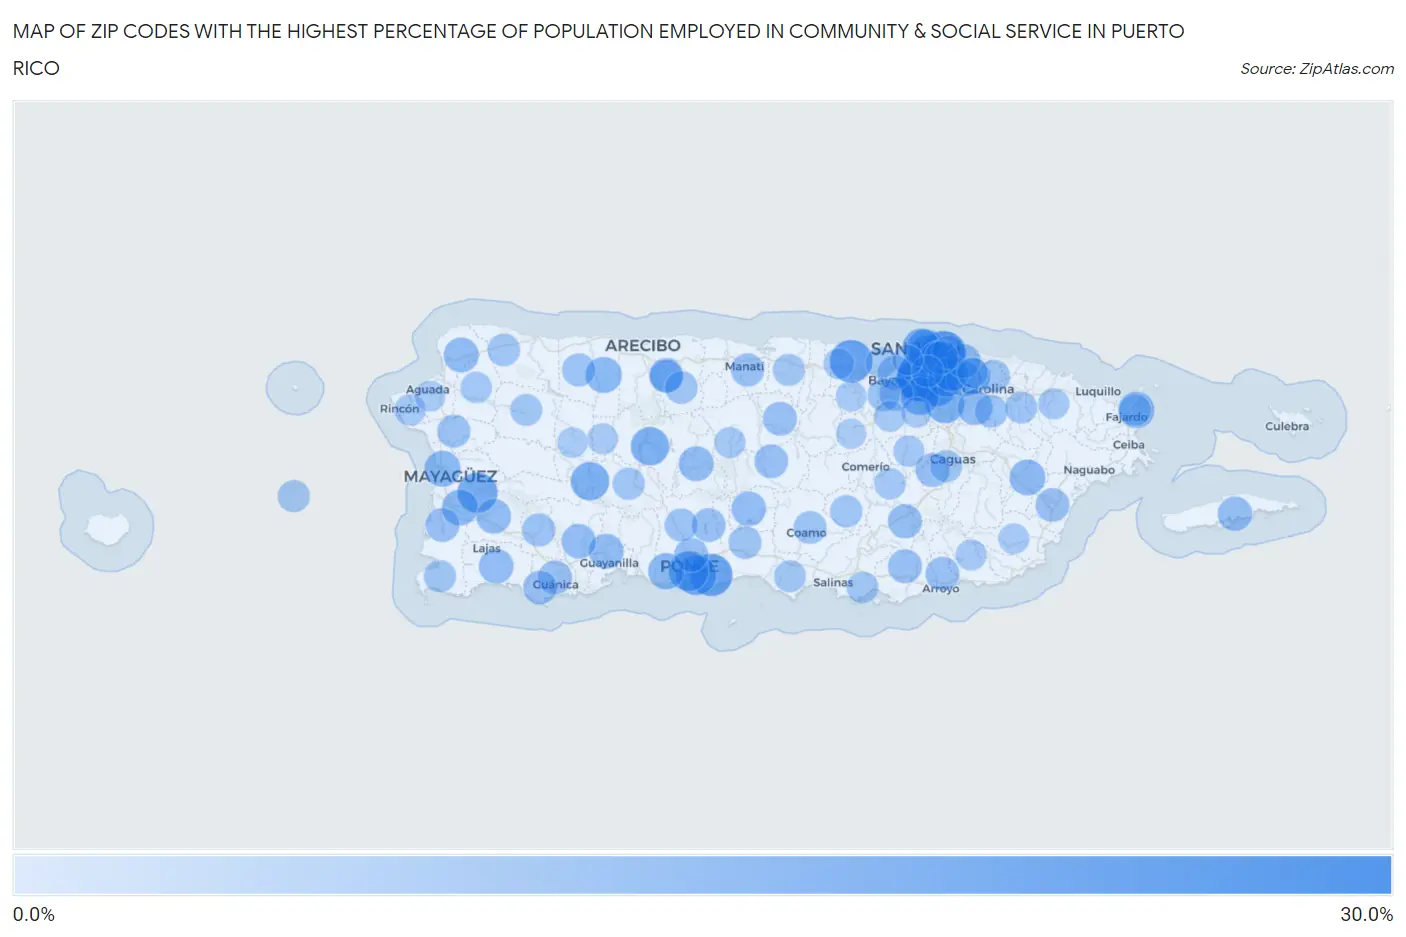
Map of Zip Codes with the Highest Percentage of Population Employed in Community & Social Service in Puerto Rico
0.0%
30.0%
Zip Codes with the Highest Percentage of Population Employed in Community & Social Service in Puerto Rico
| Zip Code | % Employed | vs State | vs National | |
| 1. | 00968 | 25.2% | 10.2%(+14.9)#1 | 11.2%(+14.0)#952 |
| 2. | 00918 | 21.9% | 10.2%(+11.7)#2 | 11.2%(+10.7)#1,498 |
| 3. | 00911 | 21.6% | 10.2%(+11.4)#3 | 11.2%(+10.4)#1,561 |
| 4. | 00966 | 19.1% | 10.2%(+8.83)#4 | 11.2%(+7.84)#2,372 |
| 5. | 00951 | 18.9% | 10.2%(+8.64)#5 | 11.2%(+7.65)#2,445 |
| 6. | 00715 | 18.7% | 10.2%(+8.43)#6 | 11.2%(+7.44)#2,530 |
| 7. | 00927 | 18.2% | 10.2%(+8.00)#7 | 11.2%(+7.01)#2,703 |
| 8. | 00716 | 16.6% | 10.2%(+6.40)#8 | 11.2%(+5.41)#3,628 |
| 9. | 00636 | 16.6% | 10.2%(+6.33)#9 | 11.2%(+5.34)#3,661 |
| 10. | 00717 | 16.3% | 10.2%(+6.05)#10 | 11.2%(+5.06)#3,857 |
| 11. | 00907 | 16.2% | 10.2%(+5.99)#11 | 11.2%(+5.00)#3,897 |
| 12. | 00926 | 15.4% | 10.2%(+5.14)#12 | 11.2%(+4.15)#4,645 |
| 13. | 00906 | 15.3% | 10.2%(+5.08)#13 | 11.2%(+4.09)#4,697 |
| 14. | 00631 | 15.0% | 10.2%(+4.79)#14 | 11.2%(+3.80)#4,946 |
| 15. | 00641 | 15.0% | 10.2%(+4.73)#15 | 11.2%(+3.74)#5,011 |
| 16. | 00969 | 14.7% | 10.2%(+4.44)#16 | 11.2%(+3.45)#5,298 |
| 17. | 00901 | 14.4% | 10.2%(+4.20)#17 | 11.2%(+3.22)#5,555 |
| 18. | 00917 | 13.4% | 10.2%(+3.15)#18 | 11.2%(+2.16)#6,936 |
| 19. | 00925 | 13.2% | 10.2%(+3.02)#19 | 11.2%(+2.03)#7,161 |
| 20. | 00740 | 13.2% | 10.2%(+2.93)#20 | 11.2%(+1.94)#7,305 |
| 21. | 00728 | 13.1% | 10.2%(+2.82)#21 | 11.2%(+1.84)#7,473 |
| 22. | 00659 | 12.9% | 10.2%(+2.69)#22 | 11.2%(+1.70)#7,703 |
| 23. | 00682 | 12.9% | 10.2%(+2.63)#23 | 11.2%(+1.64)#7,798 |
| 24. | 00660 | 12.8% | 10.2%(+2.61)#24 | 11.2%(+1.62)#7,838 |
| 25. | 00771 | 12.6% | 10.2%(+2.38)#25 | 11.2%(+1.40)#8,224 |
| 26. | 00982 | 12.5% | 10.2%(+2.29)#26 | 11.2%(+1.30)#8,384 |
| 27. | 00909 | 12.1% | 10.2%(+1.91)#27 | 11.2%(+0.917)#9,091 |
| 28. | 00924 | 12.1% | 10.2%(+1.86)#28 | 11.2%(+0.876)#9,190 |
| 29. | 00603 | 12.0% | 10.2%(+1.78)#29 | 11.2%(+0.787)#9,362 |
| 30. | 00923 | 12.0% | 10.2%(+1.77)#30 | 11.2%(+0.781)#9,386 |
| 31. | 00664 | 11.9% | 10.2%(+1.71)#31 | 11.2%(+0.725)#9,505 |
| 32. | 00976 | 11.8% | 10.2%(+1.58)#32 | 11.2%(+0.590)#9,758 |
| 33. | 00656 | 11.8% | 10.2%(+1.57)#33 | 11.2%(+0.584)#9,765 |
| 34. | 00667 | 11.7% | 10.2%(+1.45)#34 | 11.2%(+0.464)#10,058 |
| 35. | 00683 | 11.7% | 10.2%(+1.45)#35 | 11.2%(+0.459)#10,065 |
| 36. | 00766 | 11.5% | 10.2%(+1.30)#36 | 11.2%(+0.308)#10,410 |
| 37. | 00698 | 11.5% | 10.2%(+1.24)#37 | 11.2%(+0.253)#10,532 |
| 38. | 00765 | 11.4% | 10.2%(+1.20)#38 | 11.2%(+0.207)#10,626 |
| 39. | 00736 | 11.2% | 10.2%(+0.967)#39 | 11.2%(-0.021)#11,144 |
| 40. | 00979 | 11.2% | 10.2%(+0.966)#40 | 11.2%(-0.022)#11,151 |
| 41. | 00616 | 11.1% | 10.2%(+0.914)#41 | 11.2%(-0.075)#11,276 |
| 42. | 00961 | 11.1% | 10.2%(+0.866)#42 | 11.2%(-0.122)#11,403 |
| 43. | 00784 | 11.1% | 10.2%(+0.837)#43 | 11.2%(-0.151)#11,480 |
| 44. | 00727 | 11.1% | 10.2%(+0.835)#44 | 11.2%(-0.153)#11,487 |
| 45. | 00714 | 11.0% | 10.2%(+0.814)#45 | 11.2%(-0.175)#11,537 |
| 46. | 00730 | 11.0% | 10.2%(+0.789)#46 | 11.2%(-0.200)#11,606 |
| 47. | 00687 | 11.0% | 10.2%(+0.732)#47 | 11.2%(-0.256)#11,744 |
| 48. | 00653 | 10.9% | 10.2%(+0.718)#48 | 11.2%(-0.270)#11,778 |
| 49. | 00959 | 10.9% | 10.2%(+0.630)#49 | 11.2%(-0.358)#12,001 |
| 50. | 00913 | 10.8% | 10.2%(+0.606)#50 | 11.2%(-0.382)#12,053 |
| 51. | 00780 | 10.8% | 10.2%(+0.606)#51 | 11.2%(-0.382)#12,055 |
| 52. | 00791 | 10.8% | 10.2%(+0.598)#52 | 11.2%(-0.390)#12,067 |
| 53. | 00720 | 10.8% | 10.2%(+0.561)#53 | 11.2%(-0.428)#12,154 |
| 54. | 00623 | 10.8% | 10.2%(+0.559)#54 | 11.2%(-0.429)#12,160 |
| 55. | 00647 | 10.8% | 10.2%(+0.534)#55 | 11.2%(-0.454)#12,214 |
| 56. | 00912 | 10.6% | 10.2%(+0.375)#56 | 11.2%(-0.614)#12,627 |
| 57. | 00674 | 10.4% | 10.2%(+0.187)#57 | 11.2%(-0.801)#13,079 |
| 58. | 00637 | 10.3% | 10.2%(+0.084)#58 | 11.2%(-0.905)#13,333 |
| 59. | 00610 | 10.3% | 10.2%(+0.059)#59 | 11.2%(-0.930)#13,402 |
| 60. | 00731 | 10.3% | 10.2%(+0.030)#60 | 11.2%(-0.958)#13,469 |
| 61. | 00612 | 10.2% | 10.2%(-0.001)#61 | 11.2%(-0.989)#13,546 |
| 62. | 00627 | 10.2% | 10.2%(-0.024)#62 | 11.2%(-1.01)#13,605 |
| 63. | 00987 | 10.1% | 10.2%(-0.134)#63 | 11.2%(-1.12)#13,888 |
| 64. | 00769 | 10.0% | 10.2%(-0.198)#64 | 11.2%(-1.19)#14,060 |
| 65. | 00688 | 10.0% | 10.2%(-0.235)#65 | 11.2%(-1.22)#14,148 |
| 66. | 00795 | 10.0% | 10.2%(-0.238)#66 | 11.2%(-1.23)#14,157 |
| 67. | 00957 | 9.9% | 10.2%(-0.330)#67 | 11.2%(-1.32)#14,412 |
| 68. | 00985 | 9.9% | 10.2%(-0.369)#68 | 11.2%(-1.36)#14,512 |
| 69. | 00662 | 9.7% | 10.2%(-0.541)#69 | 11.2%(-1.53)#14,895 |
| 70. | 00680 | 9.6% | 10.2%(-0.648)#70 | 11.2%(-1.64)#15,191 |
| 71. | 00601 | 9.5% | 10.2%(-0.715)#71 | 11.2%(-1.70)#15,391 |
| 72. | 00725 | 9.5% | 10.2%(-0.750)#72 | 11.2%(-1.74)#15,478 |
| 73. | 00705 | 9.5% | 10.2%(-0.768)#73 | 11.2%(-1.76)#15,534 |
| 74. | 00622 | 9.5% | 10.2%(-0.776)#74 | 11.2%(-1.76)#15,559 |
| 75. | 00729 | 9.4% | 10.2%(-0.848)#75 | 11.2%(-1.84)#15,749 |
| 76. | 00920 | 9.4% | 10.2%(-0.868)#76 | 11.2%(-1.86)#15,806 |
| 77. | 00685 | 9.2% | 10.2%(-1.01)#77 | 11.2%(-2.00)#16,222 |
| 78. | 00693 | 9.2% | 10.2%(-1.02)#78 | 11.2%(-2.01)#16,257 |
| 79. | 00757 | 9.2% | 10.2%(-1.02)#79 | 11.2%(-2.01)#16,258 |
| 80. | 00738 | 9.1% | 10.2%(-1.11)#80 | 11.2%(-2.10)#16,503 |
| 81. | 00704 | 9.0% | 10.2%(-1.23)#81 | 11.2%(-2.22)#16,830 |
| 82. | 00739 | 8.8% | 10.2%(-1.39)#82 | 11.2%(-2.38)#17,254 |
| 83. | 00676 | 8.8% | 10.2%(-1.44)#83 | 11.2%(-2.43)#17,390 |
| 84. | 00949 | 8.6% | 10.2%(-1.58)#84 | 11.2%(-2.57)#17,784 |
| 85. | 00677 | 8.6% | 10.2%(-1.60)#85 | 11.2%(-2.59)#17,822 |
| 86. | 00956 | 8.6% | 10.2%(-1.62)#86 | 11.2%(-2.61)#17,872 |
| 87. | 00703 | 8.6% | 10.2%(-1.66)#87 | 11.2%(-2.65)#17,990 |
| 88. | 00745 | 8.5% | 10.2%(-1.70)#88 | 11.2%(-2.69)#18,110 |
| 89. | 00638 | 8.4% | 10.2%(-1.83)#89 | 11.2%(-2.81)#18,467 |
| 90. | 00723 | 8.4% | 10.2%(-1.86)#90 | 11.2%(-2.85)#18,547 |
| 91. | 00611 | 8.3% | 10.2%(-1.93)#91 | 11.2%(-2.92)#18,777 |
| 92. | 00602 | 8.3% | 10.2%(-1.97)#92 | 11.2%(-2.96)#18,879 |
| 93. | 00962 | 8.2% | 10.2%(-2.00)#93 | 11.2%(-2.99)#18,950 |
| 94. | 00767 | 8.1% | 10.2%(-2.08)#94 | 11.2%(-3.06)#19,159 |
| 95. | 00646 | 8.1% | 10.2%(-2.16)#95 | 11.2%(-3.15)#19,395 |
| 96. | 00669 | 8.0% | 10.2%(-2.19)#96 | 11.2%(-3.18)#19,480 |
| 97. | 00953 | 8.0% | 10.2%(-2.21)#97 | 11.2%(-3.20)#19,517 |
| 98. | 00983 | 7.9% | 10.2%(-2.29)#98 | 11.2%(-3.28)#19,772 |
| 99. | 00971 | 7.8% | 10.2%(-2.41)#99 | 11.2%(-3.40)#20,118 |
| 100. | 00719 | 7.8% | 10.2%(-2.45)#100 | 11.2%(-3.44)#20,197 |
1
2Common Questions
What are the Top 10 Zip Codes with the Highest Percentage of Population Employed in Community & Social Service in Puerto Rico?
Top 10 Zip Codes with the Highest Percentage of Population Employed in Community & Social Service in Puerto Rico are:
What zip code has the Highest Percentage of Population Employed in Community & Social Service in Puerto Rico?
00968 has the Highest Percentage of Population Employed in Community & Social Service in Puerto Rico with 25.2%.
What is the Percentage of Population Employed in Community & Social Service in the State of Puerto Rico?
Percentage of Population Employed in Community & Social Service in Puerto Rico is 10.2%.
What is the Percentage of Population Employed in Community & Social Service in the United States?
Percentage of Population Employed in Community & Social Service in the United States is 11.2%.