Wyandot County, OH
Wyandot County Overview
21,818
TOTAL POPULATION
10,775
MALE POPULATION
11,043
FEMALE POPULATION
97.57
MALES / 100 FEMALES
102.49
FEMALES / 100 MALES
42.3
MEDIAN AGE
2.9
AVG FAMILY SIZE
2.4
AVG HOUSEHOLD SIZE
$33,994
PER CAPITA INCOME
$81,466
AVG FAMILY INCOME
$68,552
AVG HOUSEHOLD INCOME
32.6%
WAGE / INCOME GAP [ % ]
67.4¢/ $1
WAGE / INCOME GAP [ $ ]
0.40
INEQUALITY / GINI INDEX
11,286
LABOR FORCE [ PEOPLE ]
63.6%
PERCENT IN LABOR FORCE
2.8%
UNEMPLOYMENT RATE
Race in Wyandot County
The most populous races in Wyandot County are White / Caucasian (20,762 | 95.2%), Two or more Races (718 | 3.3%), and Hispanic or Latino (690 | 3.2%).

| Race | # Population | % Population |
| Asian | 172 | 0.8% |
| Black / African American | 34 | 0.2% |
| Hawaiian / Pacific | 0 | 0.0% |
| Hispanic or Latino | 690 | 3.2% |
| Native / Alaskan | 2 | 0.0% |
| White / Caucasian | 20,762 | 95.2% |
| Two or more Races | 718 | 3.3% |
| Some other Race | 130 | 0.6% |
| Total | 21,818 | 100.0% |
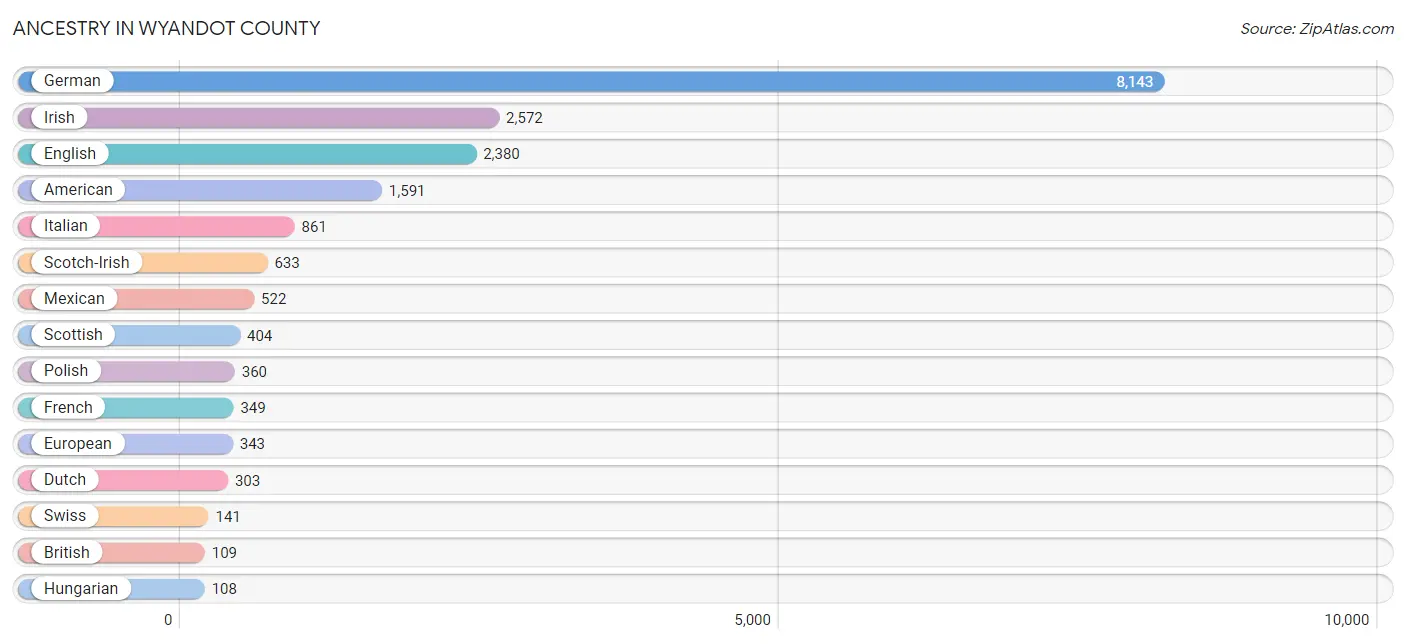
Ancestry in Wyandot County
The most populous ancestries reported in Wyandot County are German (8,143 | 37.3%), Irish (2,572 | 11.8%), English (2,380 | 10.9%), American (1,591 | 7.3%), and Italian (861 | 4.0%), together accounting for 71.3% of all Wyandot County residents.
| Ancestry | # Population | % Population |
| African | 29 | 0.1% |
| American | 1,591 | 7.3% |
| Armenian | 6 | 0.0% |
| Austrian | 34 | 0.2% |
| Belgian | 45 | 0.2% |
| Bhutanese | 16 | 0.1% |
| British | 109 | 0.5% |
| Burmese | 4 | 0.0% |
| Canadian | 21 | 0.1% |
| Central American | 7 | 0.0% |
| Cherokee | 36 | 0.2% |
| Chickasaw | 3 | 0.0% |
| Cuban | 6 | 0.0% |
| Czech | 28 | 0.1% |
| Czechoslovakian | 3 | 0.0% |
| Dutch | 303 | 1.4% |
| Eastern European | 75 | 0.3% |
| English | 2,380 | 10.9% |
| European | 343 | 1.6% |
| French | 349 | 1.6% |
| French Canadian | 23 | 0.1% |
| German | 8,143 | 37.3% |
| Greek | 27 | 0.1% |
| Honduran | 7 | 0.0% |
| Hungarian | 108 | 0.5% |
| Icelander | 4 | 0.0% |
| Indian (Asian) | 35 | 0.2% |
| Irish | 2,572 | 11.8% |
| Iroquois | 9 | 0.0% |
| Italian | 861 | 4.0% |
| Luxembourger | 8 | 0.0% |
| Malaysian | 97 | 0.4% |
| Mexican | 522 | 2.4% |
| Northern European | 10 | 0.1% |
| Norwegian | 20 | 0.1% |
| Pakistani | 25 | 0.1% |
| Pennsylvania German | 15 | 0.1% |
| Polish | 360 | 1.7% |
| Puerto Rican | 45 | 0.2% |
| Russian | 20 | 0.1% |
| Scandinavian | 2 | 0.0% |
| Scotch-Irish | 633 | 2.9% |
| Scottish | 404 | 1.8% |
| Serbian | 8 | 0.0% |
| Sioux | 4 | 0.0% |
| Slovak | 8 | 0.0% |
| Slovene | 5 | 0.0% |
| Spaniard | 12 | 0.1% |
| Spanish | 24 | 0.1% |
| Sri Lankan | 2 | 0.0% |
| Subsaharan African | 29 | 0.1% |
| Swedish | 101 | 0.5% |
| Swiss | 141 | 0.6% |
| Thai | 4 | 0.0% |
| Turkish | 21 | 0.1% |
| Welsh | 97 | 0.4% |
| Yugoslavian | 1 | 0.0% | View All 57 Rows |
Immigrants in Wyandot County
The most numerous immigrant groups reported in Wyandot County came from Central America (112 | 0.5%), Latin America (112 | 0.5%), Mexico (111 | 0.5%), Asia (95 | 0.4%), and Europe (49 | 0.2%), together accounting for 2.2% of all Wyandot County residents.

| Immigration Origin | # Population | % Population |
| Asia | 95 | 0.4% |
| Central America | 112 | 0.5% |
| China | 44 | 0.2% |
| Eastern Asia | 44 | 0.2% |
| Eastern Europe | 10 | 0.1% |
| Europe | 49 | 0.2% |
| Germany | 26 | 0.1% |
| Honduras | 1 | 0.0% |
| Hungary | 5 | 0.0% |
| Italy | 4 | 0.0% |
| Laos | 49 | 0.2% |
| Latin America | 112 | 0.5% |
| Mexico | 111 | 0.5% |
| Northern Europe | 9 | 0.0% |
| Scotland | 9 | 0.0% |
| South Eastern Asia | 49 | 0.2% |
| Southern Europe | 4 | 0.0% |
| Turkey | 2 | 0.0% |
| Western Asia | 2 | 0.0% |
| Western Europe | 26 | 0.1% | View All 20 Rows |
Sex and Age in Wyandot County
Sex and Age in Wyandot County
The most populous age groups in Wyandot County are 55 to 59 Years (878 | 8.2%) for men and 65 to 69 Years (832 | 7.5%) for women.

| Age Bracket | Male | Female |
| Under 5 Years | 550 (5.1%) | 595 (5.4%) |
| 5 to 9 Years | 783 (7.3%) | 788 (7.1%) |
| 10 to 14 Years | 703 (6.5%) | 538 (4.9%) |
| 15 to 19 Years | 711 (6.6%) | 625 (5.7%) |
| 20 to 24 Years | 585 (5.4%) | 599 (5.4%) |
| 25 to 29 Years | 654 (6.1%) | 561 (5.1%) |
| 30 to 34 Years | 564 (5.2%) | 641 (5.8%) |
| 35 to 39 Years | 791 (7.3%) | 677 (6.1%) |
| 40 to 44 Years | 622 (5.8%) | 672 (6.1%) |
| 45 to 49 Years | 667 (6.2%) | 659 (6.0%) |
| 50 to 54 Years | 695 (6.5%) | 708 (6.4%) |
| 55 to 59 Years | 878 (8.2%) | 798 (7.2%) |
| 60 to 64 Years | 660 (6.1%) | 757 (6.9%) |
| 65 to 69 Years | 690 (6.4%) | 832 (7.5%) |
| 70 to 74 Years | 474 (4.4%) | 426 (3.9%) |
| 75 to 79 Years | 328 (3.0%) | 317 (2.9%) |
| 80 to 84 Years | 234 (2.2%) | 457 (4.1%) |
| 85 Years and over | 186 (1.7%) | 393 (3.6%) |
| Total | 10,775 (100.0%) | 11,043 (100.0%) |
Families and Households in Wyandot County
Median Family Size in Wyandot County
The median family size in Wyandot County is 2.93 persons per family, with married-couple families (4,736 | 78.5%) accounting for the largest median family size of 2.98 persons per family. On the other hand, single male/father families (398 | 6.6%) represent the smallest median family size with 2.56 persons per family.

| Family Type | # Families | Family Size |
| Married-Couple | 4,736 (78.5%) | 2.98 |
| Single Male/Father | 398 (6.6%) | 2.56 |
| Single Female/Mother | 901 (14.9%) | 2.80 |
| Total Families | 6,035 (100.0%) | 2.93 |
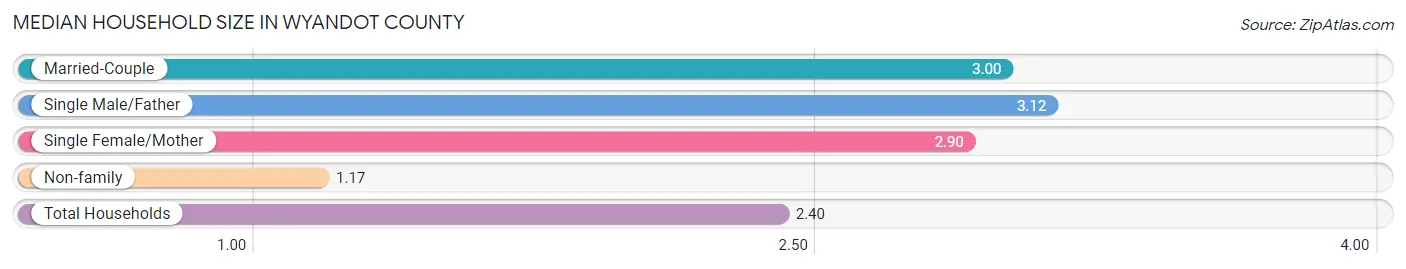
Median Household Size in Wyandot County
The median household size in Wyandot County is 2.40 persons per household, with single male/father households (398 | 4.4%) accounting for the largest median household size of 3.12 persons per household. non-family households (2,947 | 32.8%) represent the smallest median household size with 1.17 persons per household.
| Household Type | # Households | Household Size |
| Married-Couple | 4,736 (52.7%) | 3.00 |
| Single Male/Father | 398 (4.4%) | 3.12 |
| Single Female/Mother | 901 (10.0%) | 2.90 |
| Non-family | 2,947 (32.8%) | 1.17 |
| Total Households | 8,982 (100.0%) | 2.40 |
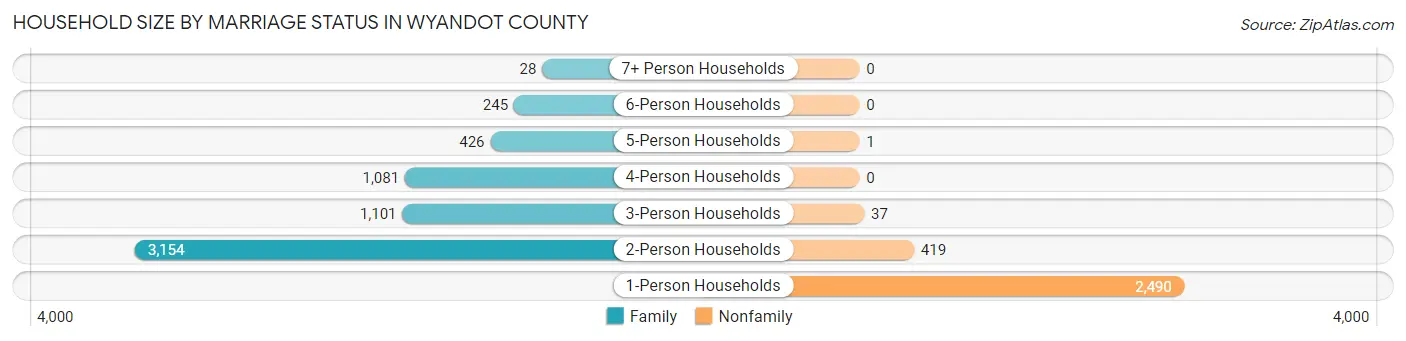
Household Size by Marriage Status in Wyandot County
Out of a total of 8,982 households in Wyandot County, 6,035 (67.2%) are family households, while 2,947 (32.8%) are nonfamily households. The most numerous type of family households are 2-person households, comprising 3,154, and the most common type of nonfamily households are 1-person households, comprising 2,490.
| Household Size | Family Households | Nonfamily Households |
| 1-Person Households | - | 2,490 (27.7%) |
| 2-Person Households | 3,154 (35.1%) | 419 (4.7%) |
| 3-Person Households | 1,101 (12.3%) | 37 (0.4%) |
| 4-Person Households | 1,081 (12.0%) | 0 (0.0%) |
| 5-Person Households | 426 (4.7%) | 1 (0.0%) |
| 6-Person Households | 245 (2.7%) | 0 (0.0%) |
| 7+ Person Households | 28 (0.3%) | 0 (0.0%) |
| Total | 6,035 (67.2%) | 2,947 (32.8%) |
Female Fertility in Wyandot County
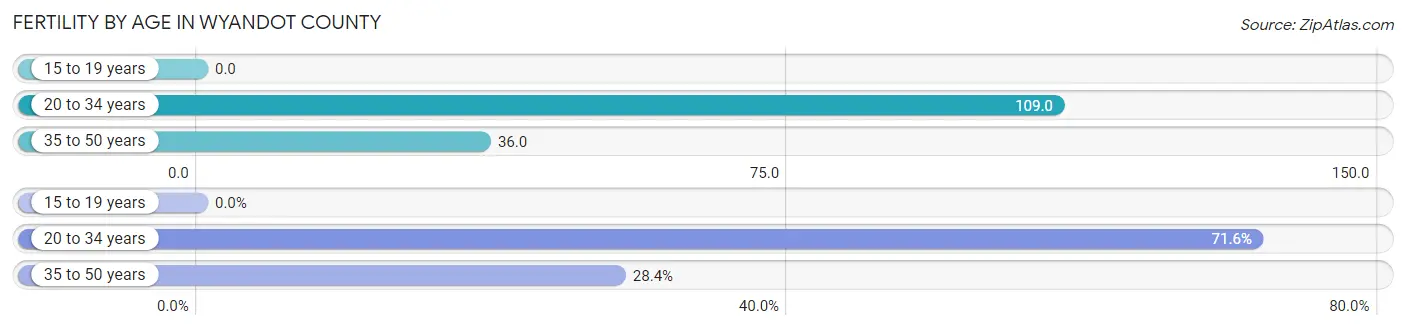
Fertility by Age in Wyandot County
Average fertility rate in Wyandot County is 60.0 births per 1,000 women. Women in the age bracket of 20 to 34 years have the highest fertility rate with 109.0 births per 1,000 women. Women in the age bracket of 20 to 34 years acount for 71.6% of all women with births.
| Age Bracket | Women with Births | Births / 1,000 Women |
| 15 to 19 years | 0 (0.0%) | 0.0 |
| 20 to 34 years | 197 (71.6%) | 109.0 |
| 35 to 50 years | 78 (28.4%) | 36.0 |
| Total | 275 (100.0%) | 60.0 |
Fertility by Age by Marriage Status in Wyandot County
57.8% of women with births (275) in Wyandot County are married. The highest percentage of unmarried women with births falls into 20 to 34 years age bracket with 53.3% of them unmarried at the time of birth, while the lowest percentage of unmarried women with births belong to 35 to 50 years age bracket with 14.1% of them unmarried.
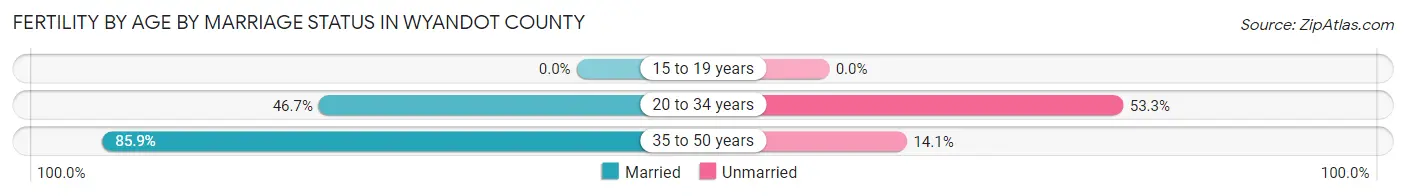
| Age Bracket | Married | Unmarried |
| 15 to 19 years | 0 (0.0%) | 0 (0.0%) |
| 20 to 34 years | 92 (46.7%) | 105 (53.3%) |
| 35 to 50 years | 67 (85.9%) | 11 (14.1%) |
| Total | 159 (57.8%) | 116 (42.2%) |
Fertility by Education in Wyandot County
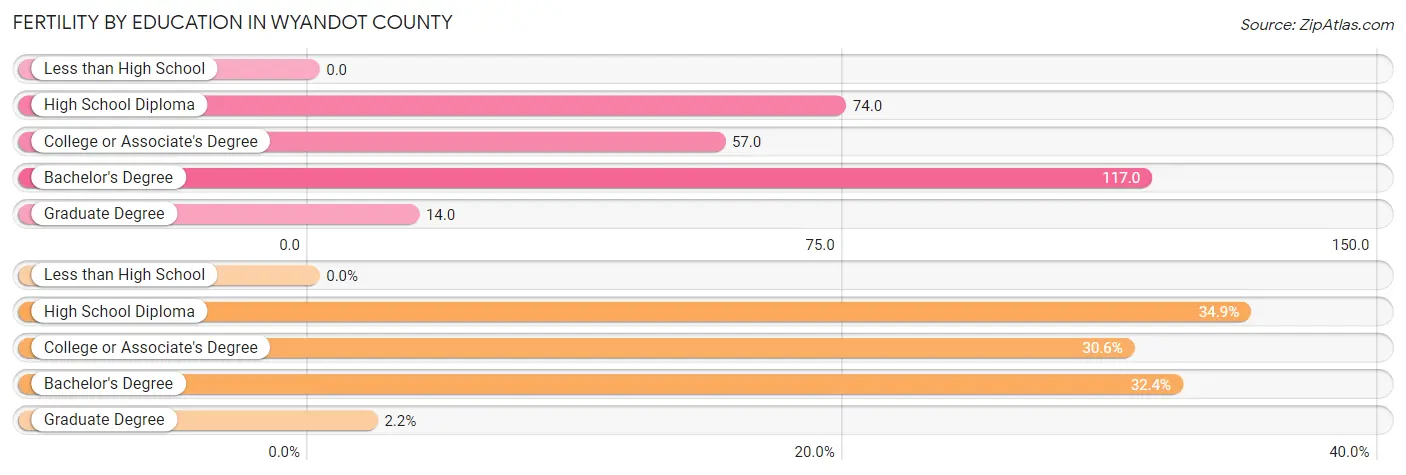
| Educational Attainment | Women with Births | Births / 1,000 Women |
| Less than High School | 0 (0.0%) | 0.0 |
| High School Diploma | 96 (34.9%) | 74.0 |
| College or Associate's Degree | 84 (30.5%) | 57.0 |
| Bachelor's Degree | 89 (32.4%) | 117.0 |
| Graduate Degree | 6 (2.2%) | 14.0 |
| Total | 275 (100.0%) | 60.0 |
Fertility by Education by Marriage Status in Wyandot County
42.2% of women with births in Wyandot County are unmarried. Women with the educational attainment of bachelor's degree are most likely to be married with 100.0% of them married at childbirth, while women with the educational attainment of high school diploma are least likely to be married with 75.0% of them unmarried at childbirth.
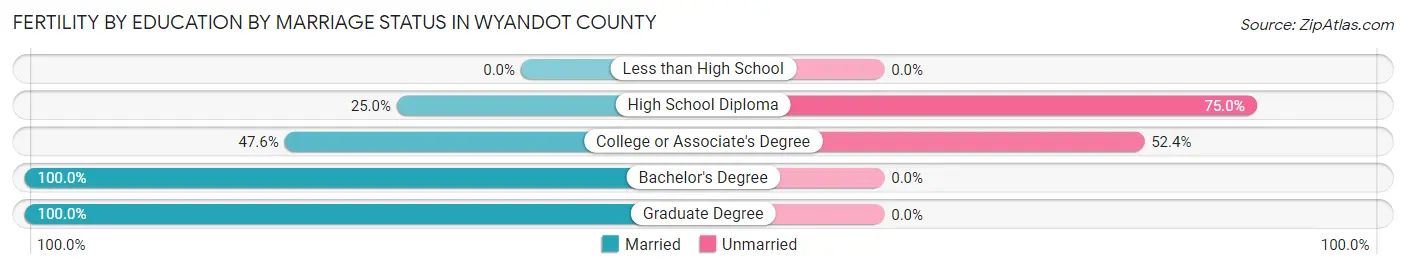
| Educational Attainment | Married | Unmarried |
| Less than High School | 0 (0.0%) | 0 (0.0%) |
| High School Diploma | 24 (25.0%) | 72 (75.0%) |
| College or Associate's Degree | 40 (47.6%) | 44 (52.4%) |
| Bachelor's Degree | 89 (100.0%) | 0 (0.0%) |
| Graduate Degree | 6 (100.0%) | 0 (0.0%) |
| Total | 159 (57.8%) | 116 (42.2%) |
Income in Wyandot County
Income Overview in Wyandot County
Per Capita Income in Wyandot County is $33,994, while median incomes of families and households are $81,466 and $68,552 respectively.
| Characteristic | Number | Measure |
| Per Capita Income | 21,818 | $33,994 |
| Median Family Income | 6,035 | $81,466 |
| Mean Family Income | 6,035 | $95,802 |
| Median Household Income | 8,982 | $68,552 |
| Mean Household Income | 8,982 | $80,824 |
| Income Deficit | 6,035 | $0 |
| Wage / Income Gap (%) | 21,818 | 32.58% |
| Wage / Income Gap ($) | 21,818 | 67.42¢ per $1 |
| Gini / Inequality Index | 21,818 | 0.40 |
Earnings by Sex in Wyandot County
Average Earnings in Wyandot County are $40,983, $47,763 for men and $32,201 for women, a difference of 32.6%.
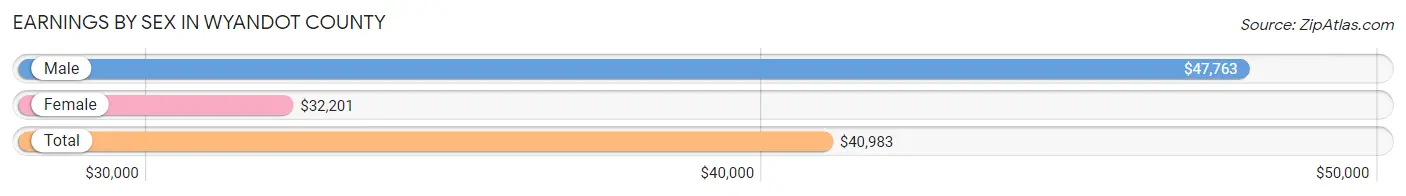
| Sex | Number | Average Earnings |
| Male | 6,274 (52.3%) | $47,763 |
| Female | 5,722 (47.7%) | $32,201 |
| Total | 11,996 (100.0%) | $40,983 |
Earnings by Sex by Income Bracket in Wyandot County
The most common earnings brackets in Wyandot County are $75,000 to $99,999 for men (993 | 15.8%) and $25,000 to $29,999 for women (506 | 8.8%).
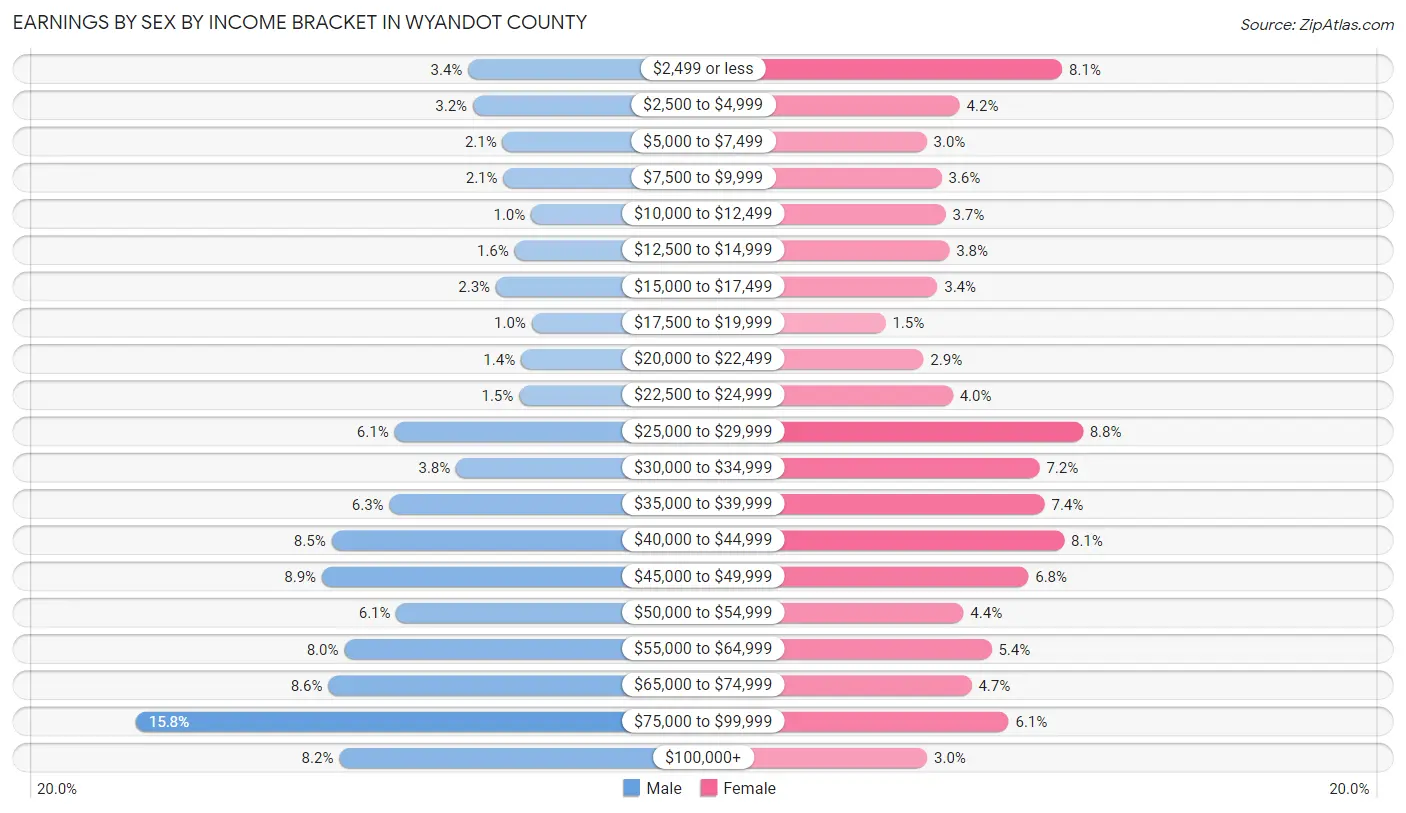
| Income | Male | Female |
| $2,499 or less | 212 (3.4%) | 462 (8.1%) |
| $2,500 to $4,999 | 201 (3.2%) | 242 (4.2%) |
| $5,000 to $7,499 | 131 (2.1%) | 171 (3.0%) |
| $7,500 to $9,999 | 129 (2.1%) | 203 (3.5%) |
| $10,000 to $12,499 | 64 (1.0%) | 212 (3.7%) |
| $12,500 to $14,999 | 103 (1.6%) | 220 (3.8%) |
| $15,000 to $17,499 | 147 (2.3%) | 194 (3.4%) |
| $17,500 to $19,999 | 63 (1.0%) | 83 (1.5%) |
| $20,000 to $22,499 | 88 (1.4%) | 164 (2.9%) |
| $22,500 to $24,999 | 92 (1.5%) | 227 (4.0%) |
| $25,000 to $29,999 | 385 (6.1%) | 506 (8.8%) |
| $30,000 to $34,999 | 240 (3.8%) | 413 (7.2%) |
| $35,000 to $39,999 | 397 (6.3%) | 424 (7.4%) |
| $40,000 to $44,999 | 533 (8.5%) | 466 (8.1%) |
| $45,000 to $49,999 | 556 (8.9%) | 389 (6.8%) |
| $50,000 to $54,999 | 381 (6.1%) | 250 (4.4%) |
| $55,000 to $64,999 | 503 (8.0%) | 310 (5.4%) |
| $65,000 to $74,999 | 541 (8.6%) | 267 (4.7%) |
| $75,000 to $99,999 | 993 (15.8%) | 347 (6.1%) |
| $100,000+ | 515 (8.2%) | 172 (3.0%) |
| Total | 6,274 (100.0%) | 5,722 (100.0%) |
Earnings by Sex by Educational Attainment in Wyandot County
Average earnings in Wyandot County are $51,788 for men and $35,977 for women, a difference of 30.5%. Men with an educational attainment of graduate degree enjoy the highest average annual earnings of $77,868, while those with less than high school education earn the least with $26,750. Women with an educational attainment of graduate degree earn the most with the average annual earnings of $70,028, while those with less than high school education have the smallest earnings of $25,893.
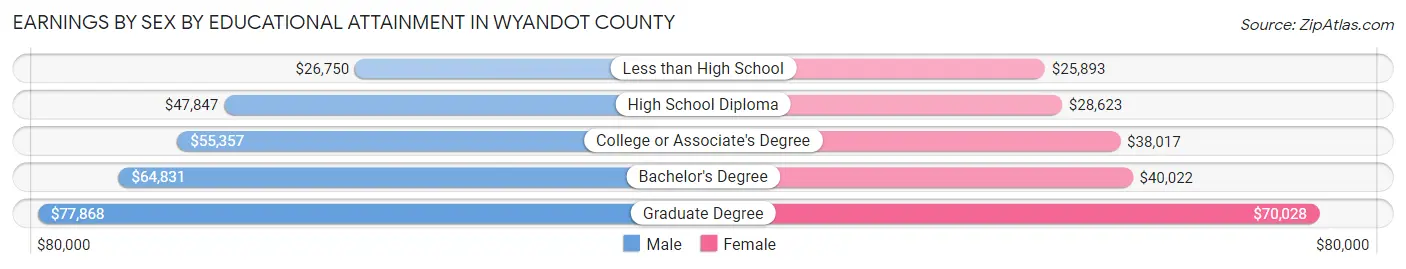
| Educational Attainment | Male Income | Female Income |
| Less than High School | $26,750 | $25,893 |
| High School Diploma | $47,847 | $28,623 |
| College or Associate's Degree | $55,357 | $38,017 |
| Bachelor's Degree | $64,831 | $40,022 |
| Graduate Degree | $77,868 | $70,028 |
| Total | $51,788 | $35,977 |
Family Income in Wyandot County
Family Income Brackets in Wyandot County
According to the Wyandot County family income data, there are 1,460 families falling into the $100,000 to $149,999 income range, which is the most common income bracket and makes up 24.2% of all families. Conversely, the $10,000 to $14,999 income bracket is the least frequent group with only 78 families (1.3%) belonging to this category.
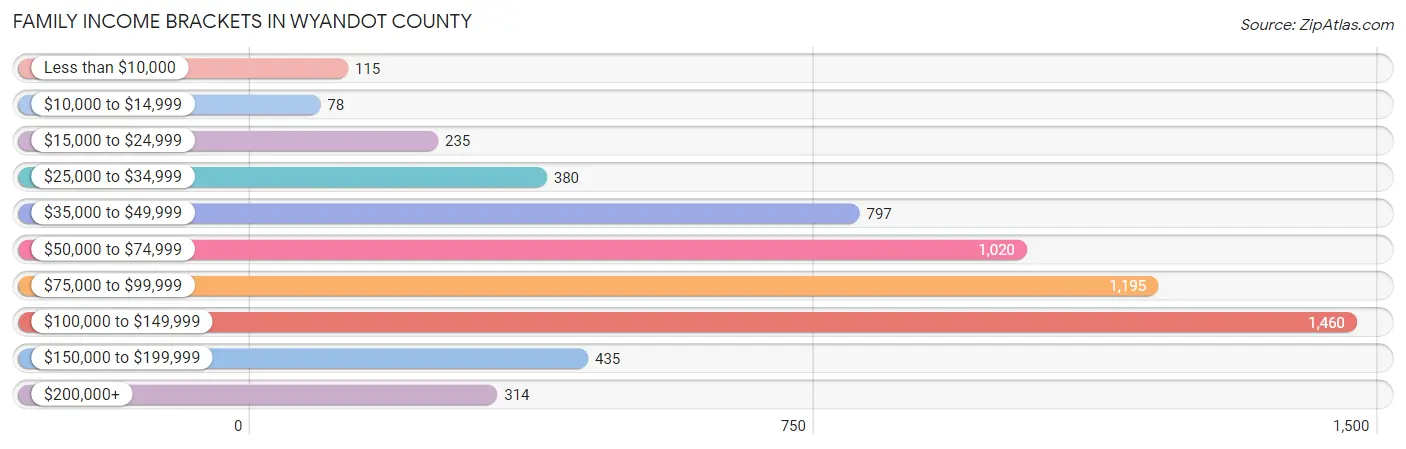
| Income Bracket | # Families | % Families |
| Less than $10,000 | 115 | 1.9% |
| $10,000 to $14,999 | 78 | 1.3% |
| $15,000 to $24,999 | 235 | 3.9% |
| $25,000 to $34,999 | 380 | 6.3% |
| $35,000 to $49,999 | 797 | 13.2% |
| $50,000 to $74,999 | 1,020 | 16.9% |
| $75,000 to $99,999 | 1,195 | 19.8% |
| $100,000 to $149,999 | 1,460 | 24.2% |
| $150,000 to $199,999 | 435 | 7.2% |
| $200,000+ | 314 | 5.2% |
Family Income by Famaliy Size in Wyandot County
6-person families (238 | 3.9%) account for the highest median family income in Wyandot County with $135,676 per family, while 2-person families (3,316 | 54.9%) have the highest median income of $34,272 per family member.

| Income Bracket | # Families | Median Income |
| 2-Person Families | 3,316 (54.9%) | $68,545 |
| 3-Person Families | 1,047 (17.3%) | $74,883 |
| 4-Person Families | 1,072 (17.8%) | $119,628 |
| 5-Person Families | 334 (5.5%) | $120,000 |
| 6-Person Families | 238 (3.9%) | $135,676 |
| 7+ Person Families | 28 (0.5%) | $60,000 |
| Total | 6,035 (100.0%) | $81,466 |
Family Income by Number of Earners in Wyandot County
The median family income in Wyandot County is $81,466, with families comprising 3+ earners (712) having the highest median family income of $137,000, while families with no earners (872) have the lowest median family income of $38,889, accounting for 11.8% and 14.4% of families, respectively.
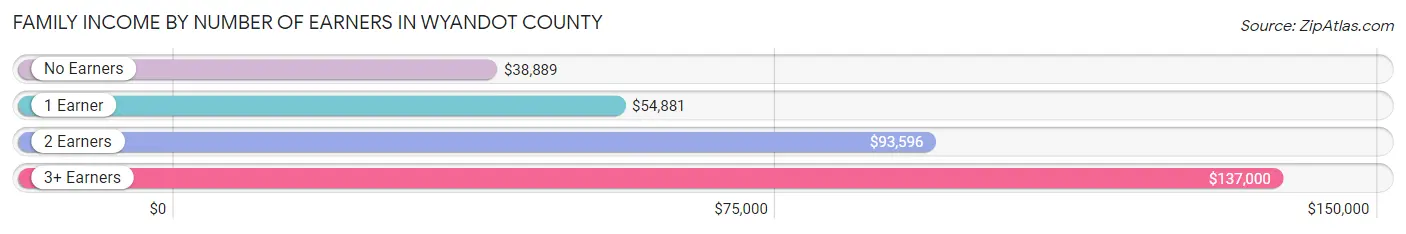
| Number of Earners | # Families | Median Income |
| No Earners | 872 (14.4%) | $38,889 |
| 1 Earner | 1,854 (30.7%) | $54,881 |
| 2 Earners | 2,597 (43.0%) | $93,596 |
| 3+ Earners | 712 (11.8%) | $137,000 |
| Total | 6,035 (100.0%) | $81,466 |
Household Income in Wyandot County
Household Income Brackets in Wyandot County
With 1,751 households falling in the category, the $100,000 to $149,999 income range is the most frequent in Wyandot County, accounting for 19.5% of all households. In contrast, only 305 households (3.4%) fall into the $10,000 to $14,999 income bracket, making it the least populous group.

| Income Bracket | # Households | % Households |
| Less than $10,000 | 323 | 3.6% |
| $10,000 to $14,999 | 305 | 3.4% |
| $15,000 to $24,999 | 710 | 7.9% |
| $25,000 to $34,999 | 853 | 9.5% |
| $35,000 to $49,999 | 1,114 | 12.4% |
| $50,000 to $74,999 | 1,518 | 16.9% |
| $75,000 to $99,999 | 1,644 | 18.3% |
| $100,000 to $149,999 | 1,751 | 19.5% |
| $150,000 to $199,999 | 449 | 5.0% |
| $200,000+ | 341 | 3.8% |
Household Income by Householder Age in Wyandot County
The median household income in Wyandot County is $68,552, with the highest median household income of $80,798 found in the 25 to 44 years age bracket for the primary householder. A total of 2,670 households (29.7%) fall into this category. Meanwhile, the 65+ years age bracket for the primary householder has the lowest median household income of $38,125, with 2,806 households (31.2%) in this group.
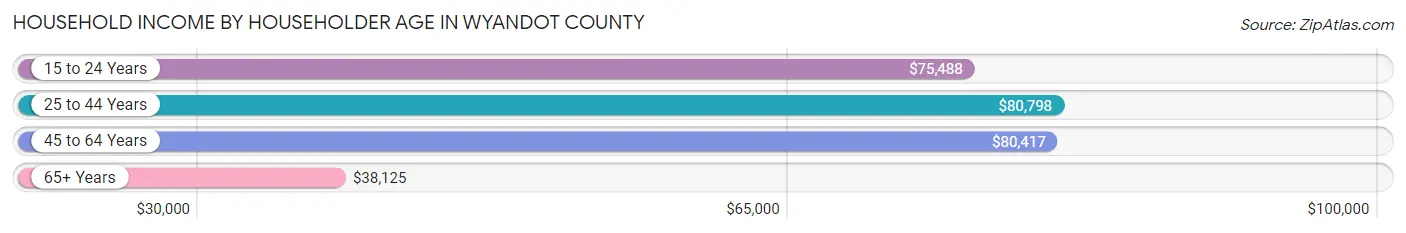
| Income Bracket | # Households | Median Income |
| 15 to 24 Years | 271 (3.0%) | $75,488 |
| 25 to 44 Years | 2,670 (29.7%) | $80,798 |
| 45 to 64 Years | 3,235 (36.0%) | $80,417 |
| 65+ Years | 2,806 (31.2%) | $38,125 |
| Total | 8,982 (100.0%) | $68,552 |
Poverty in Wyandot County
Income Below Poverty by Sex and Age in Wyandot County
With 4.9% poverty level for males and 8.8% for females among the residents of Wyandot County, 16 and 17 year old males and 75 year old and over females are the most vulnerable to poverty, with 94 males (22.7%) and 173 females (16.2%) in their respective age groups living below the poverty level.
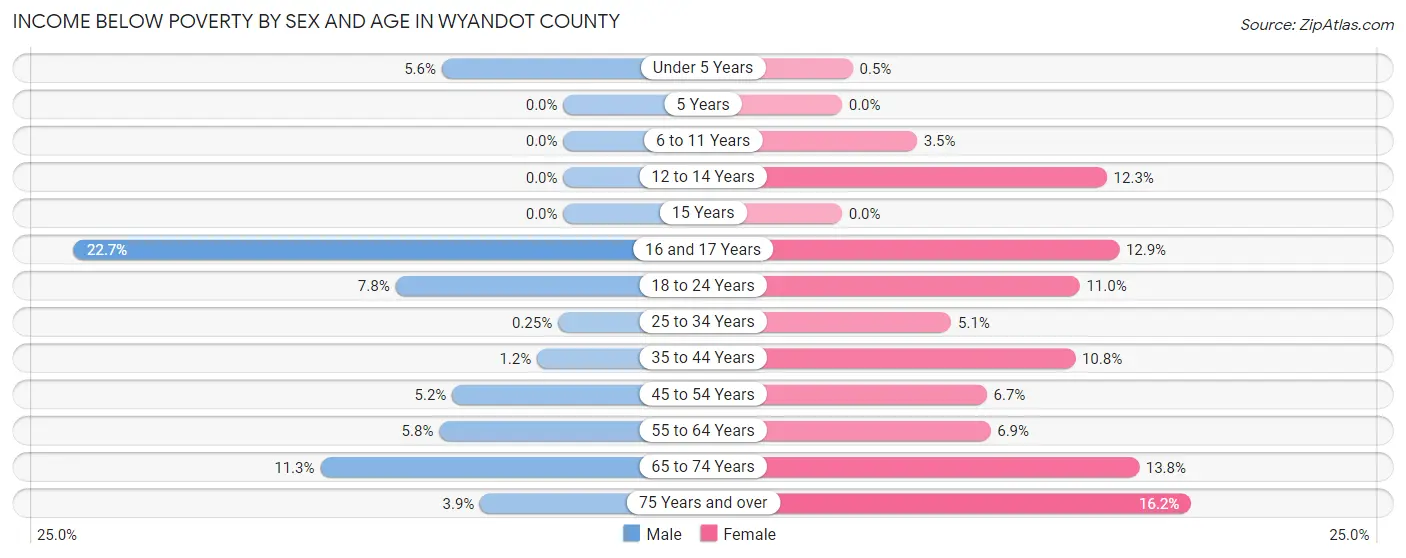
| Age Bracket | Male | Female |
| Under 5 Years | 30 (5.6%) | 3 (0.5%) |
| 5 Years | 0 (0.0%) | 0 (0.0%) |
| 6 to 11 Years | 0 (0.0%) | 26 (3.5%) |
| 12 to 14 Years | 0 (0.0%) | 52 (12.3%) |
| 15 Years | 0 (0.0%) | 0 (0.0%) |
| 16 and 17 Years | 94 (22.7%) | 45 (12.9%) |
| 18 to 24 Years | 65 (7.8%) | 89 (11.0%) |
| 25 to 34 Years | 3 (0.3%) | 61 (5.1%) |
| 35 to 44 Years | 17 (1.2%) | 146 (10.8%) |
| 45 to 54 Years | 70 (5.2%) | 91 (6.7%) |
| 55 to 64 Years | 88 (5.8%) | 107 (6.9%) |
| 65 to 74 Years | 128 (11.3%) | 169 (13.8%) |
| 75 Years and over | 27 (3.9%) | 173 (16.2%) |
| Total | 522 (4.9%) | 962 (8.8%) |
Income Above Poverty by Sex and Age in Wyandot County
According to the poverty statistics in Wyandot County, males aged 5 years and females aged 5 years are the age groups that are most secure financially, with 100.0% of males and 100.0% of females in these age groups living above the poverty line.
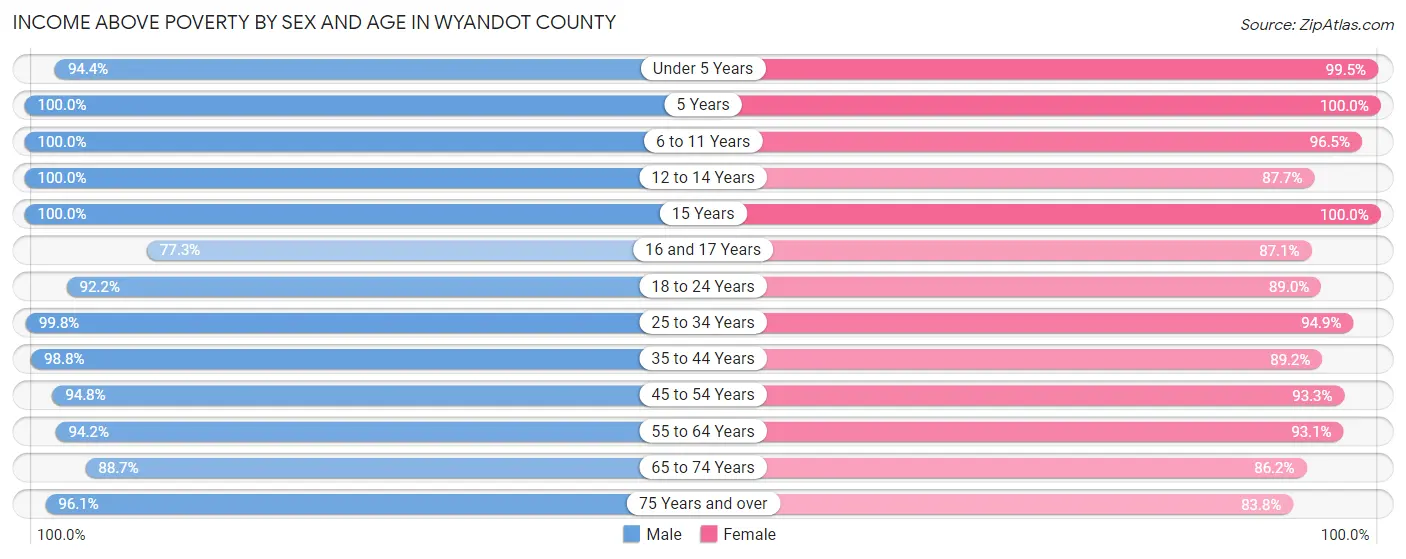
| Age Bracket | Male | Female |
| Under 5 Years | 502 (94.4%) | 592 (99.5%) |
| 5 Years | 94 (100.0%) | 145 (100.0%) |
| 6 to 11 Years | 997 (100.0%) | 722 (96.5%) |
| 12 to 14 Years | 383 (100.0%) | 371 (87.7%) |
| 15 Years | 48 (100.0%) | 67 (100.0%) |
| 16 and 17 Years | 320 (77.3%) | 305 (87.1%) |
| 18 to 24 Years | 769 (92.2%) | 718 (89.0%) |
| 25 to 34 Years | 1,210 (99.8%) | 1,141 (94.9%) |
| 35 to 44 Years | 1,378 (98.8%) | 1,203 (89.2%) |
| 45 to 54 Years | 1,287 (94.8%) | 1,264 (93.3%) |
| 55 to 64 Years | 1,440 (94.2%) | 1,445 (93.1%) |
| 65 to 74 Years | 1,007 (88.7%) | 1,057 (86.2%) |
| 75 Years and over | 672 (96.1%) | 894 (83.8%) |
| Total | 10,107 (95.1%) | 9,924 (91.2%) |
Income Below Poverty Among Married-Couple Families in Wyandot County
The poverty statistics for married-couple families in Wyandot County show that 3.5% or 164 of the total 4,736 families live below the poverty line. Families with no children have the highest poverty rate of 4.3%, comprising of 128 families. On the other hand, families with 3 or 4 children have the lowest poverty rate of 0.0%, which includes 0 families.

| Children | Above Poverty | Below Poverty |
| No Children | 2,885 (95.8%) | 128 (4.3%) |
| 1 or 2 Children | 1,291 (97.3%) | 36 (2.7%) |
| 3 or 4 Children | 369 (100.0%) | 0 (0.0%) |
| 5 or more Children | 27 (100.0%) | 0 (0.0%) |
| Total | 4,572 (96.5%) | 164 (3.5%) |
Income Below Poverty Among Single-Parent Households in Wyandot County
According to the poverty data in Wyandot County, 2.5% or 10 single-father households and 17.2% or 155 single-mother households are living below the poverty line. Among single-father households, those with 1 or 2 children have the highest poverty rate, with 10 households (4.5%) experiencing poverty. Likewise, among single-mother households, those with 1 or 2 children have the highest poverty rate, with 103 households (18.4%) falling below the poverty line.
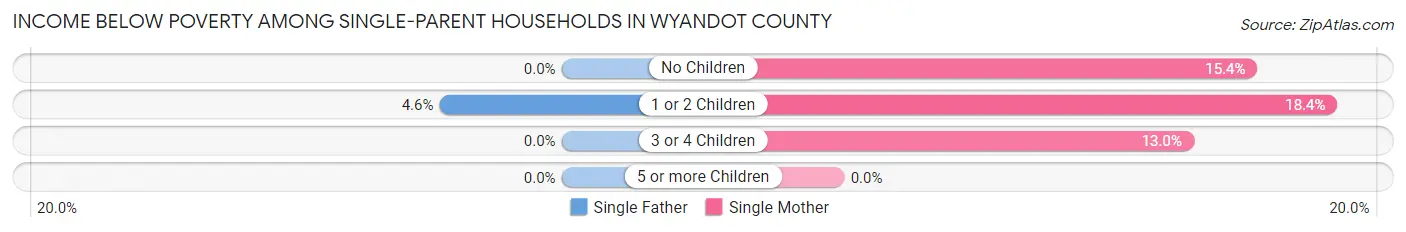
| Children | Single Father | Single Mother |
| No Children | 0 (0.0%) | 49 (15.4%) |
| 1 or 2 Children | 10 (4.5%) | 103 (18.4%) |
| 3 or 4 Children | 0 (0.0%) | 3 (13.0%) |
| 5 or more Children | 0 (0.0%) | 0 (0.0%) |
| Total | 10 (2.5%) | 155 (17.2%) |
Income Below Poverty Among Married-Couple vs Single-Parent Households in Wyandot County
The poverty data for Wyandot County shows that 164 of the married-couple family households (3.5%) and 165 of the single-parent households (12.7%) are living below the poverty level. Within the married-couple family households, those with no children have the highest poverty rate, with 128 households (4.3%) falling below the poverty line. Among the single-parent households, those with 1 or 2 children have the highest poverty rate, with 113 household (14.5%) living below poverty.
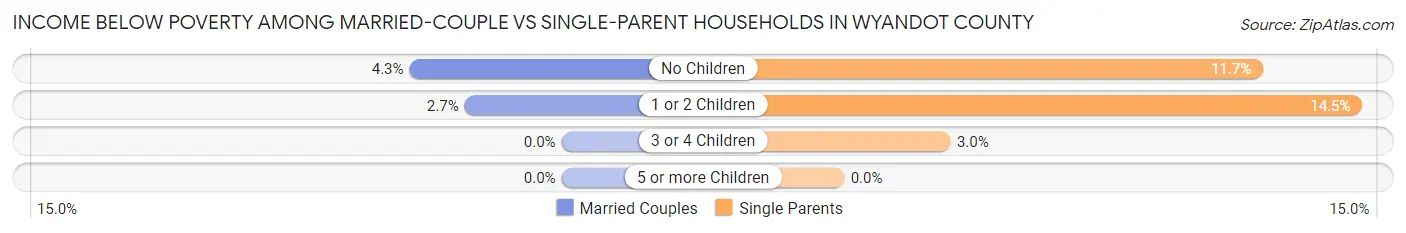
| Children | Married-Couple Families | Single-Parent Households |
| No Children | 128 (4.3%) | 49 (11.7%) |
| 1 or 2 Children | 36 (2.7%) | 113 (14.5%) |
| 3 or 4 Children | 0 (0.0%) | 3 (3.0%) |
| 5 or more Children | 0 (0.0%) | 0 (0.0%) |
| Total | 164 (3.5%) | 165 (12.7%) |
Employment Characteristics in Wyandot County
Employment by Class of Employer in Wyandot County
Among the 10,849 employed individuals in Wyandot County, private company employees (7,977 | 73.5%), local government employees (1,001 | 9.2%), and not-for-profit organizations (823 | 7.6%) make up the most common classes of employment.
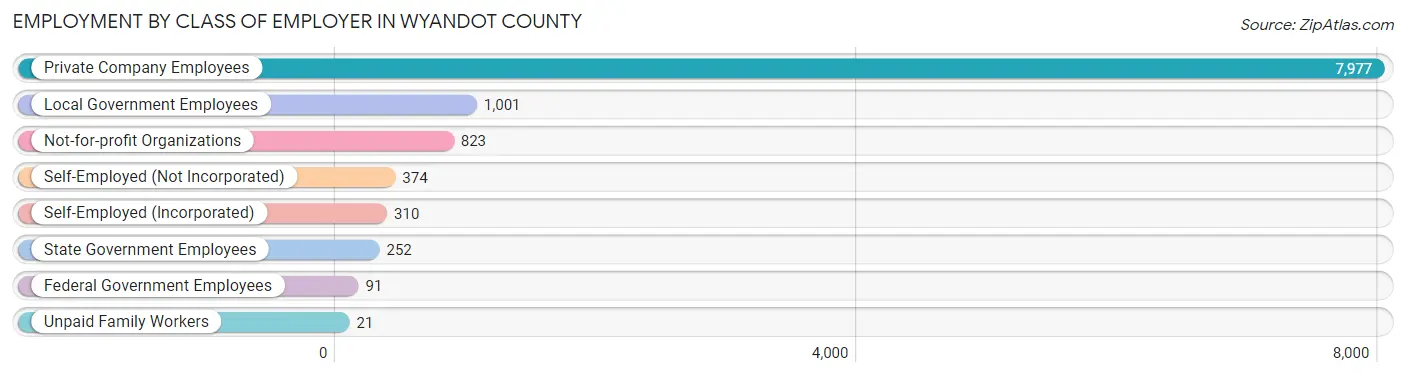
| Employer Class | # Employees | % Employees |
| Private Company Employees | 7,977 | 73.5% |
| Self-Employed (Incorporated) | 310 | 2.9% |
| Self-Employed (Not Incorporated) | 374 | 3.5% |
| Not-for-profit Organizations | 823 | 7.6% |
| Local Government Employees | 1,001 | 9.2% |
| State Government Employees | 252 | 2.3% |
| Federal Government Employees | 91 | 0.8% |
| Unpaid Family Workers | 21 | 0.2% |
| Total | 10,849 | 100.0% |
Employment Status by Age in Wyandot County
According to the labor force statistics for Wyandot County, out of the total population over 16 years of age (17,746), 63.6% or 11,286 individuals are in the labor force, with 2.8% or 316 of them unemployed. The age group with the highest labor force participation rate is 30 to 34 years, with 90.5% or 1,091 individuals in the labor force. Within the labor force, the 75 years and over age range has the highest percentage of unemployed individuals, with 7.5% or 7 of them being unemployed.
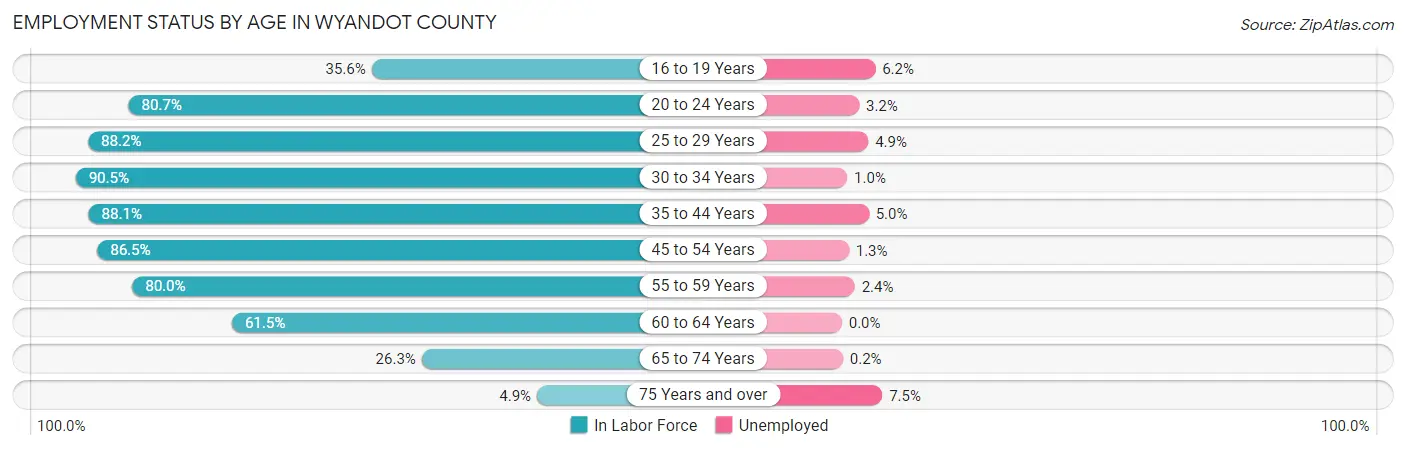
| Age Bracket | In Labor Force | Unemployed |
| 16 to 19 Years | 435 (35.6%) | 27 (6.2%) |
| 20 to 24 Years | 955 (80.7%) | 31 (3.2%) |
| 25 to 29 Years | 1,072 (88.2%) | 53 (4.9%) |
| 30 to 34 Years | 1,091 (90.5%) | 11 (1.0%) |
| 35 to 44 Years | 2,433 (88.1%) | 122 (5.0%) |
| 45 to 54 Years | 2,361 (86.5%) | 31 (1.3%) |
| 55 to 59 Years | 1,341 (80.0%) | 32 (2.4%) |
| 60 to 64 Years | 871 (61.5%) | 0 (0.0%) |
| 65 to 74 Years | 637 (26.3%) | 1 (0.2%) |
| 75 Years and over | 94 (4.9%) | 7 (7.5%) |
| Total | 11,286 (63.6%) | 316 (2.8%) |
Employment Status by Educational Attainment in Wyandot County
According to labor force statistics for Wyandot County, 83.3% of individuals (9,166) out of the total population between 25 and 64 years of age (11,004) are in the labor force, with 2.7% or 247 of them being unemployed. The group with the highest labor force participation rate are those with the educational attainment of bachelor's degree or higher, with 89.0% or 2,434 individuals in the labor force. Within the labor force, individuals with less than high school education have the highest percentage of unemployment, with 8.4% or 19 of them being unemployed.

| Educational Attainment | In Labor Force | Unemployed |
| Less than High School | 226 (48.1%) | 39 (8.4%) |
| High School Diploma | 3,851 (84.0%) | 110 (2.4%) |
| College / Associate Degree | 2,655 (82.6%) | 51 (1.6%) |
| Bachelor's Degree or higher | 2,434 (89.0%) | 107 (3.9%) |
| Total | 9,166 (83.3%) | 297 (2.7%) |
Employment Occupations by Sex in Wyandot County
Management, Business, Science and Arts Occupations
The most common Management, Business, Science and Arts occupations in Wyandot County are Community & Social Service (1,186 | 10.8%), Management (1,023 | 9.3%), Education Instruction & Library (763 | 7.0%), Health Diagnosing & Treating (705 | 6.4%), and Health Technologists (463 | 4.2%).
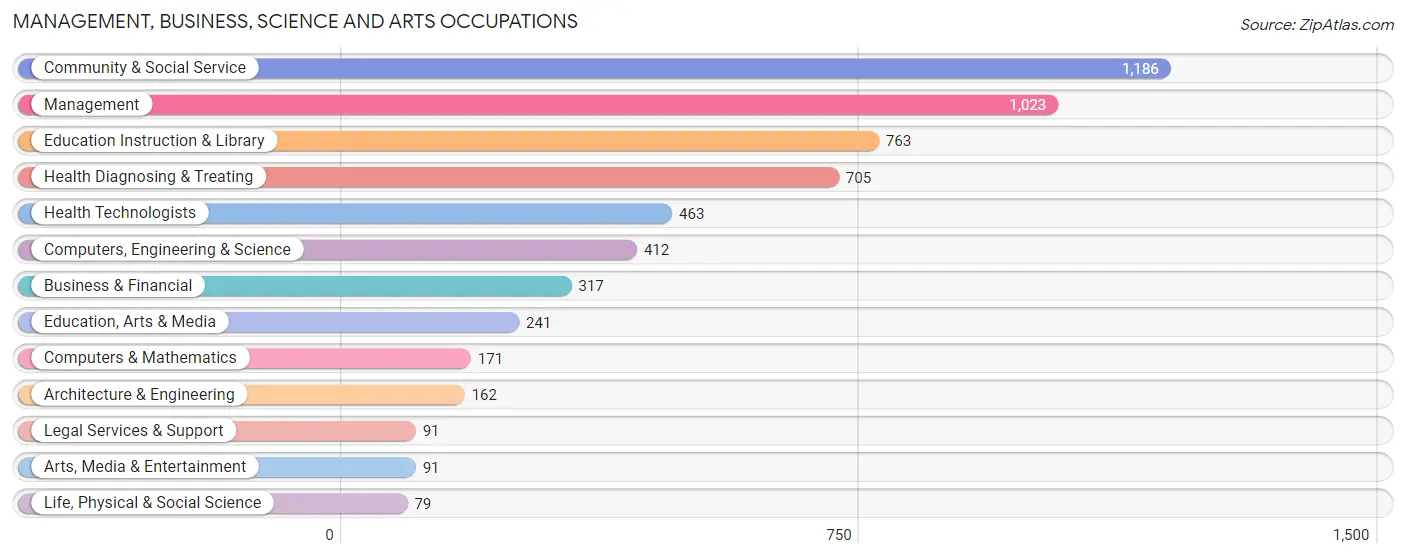
Management, Business, Science and Arts Occupations by Sex
Within the Management, Business, Science and Arts occupations in Wyandot County, the most male-oriented occupations are Computers & Mathematics (97.1%), Computers, Engineering & Science (88.3%), and Life, Physical & Social Science (86.1%), while the most female-oriented occupations are Health Diagnosing & Treating (90.5%), Health Technologists (87.7%), and Legal Services & Support (82.4%).
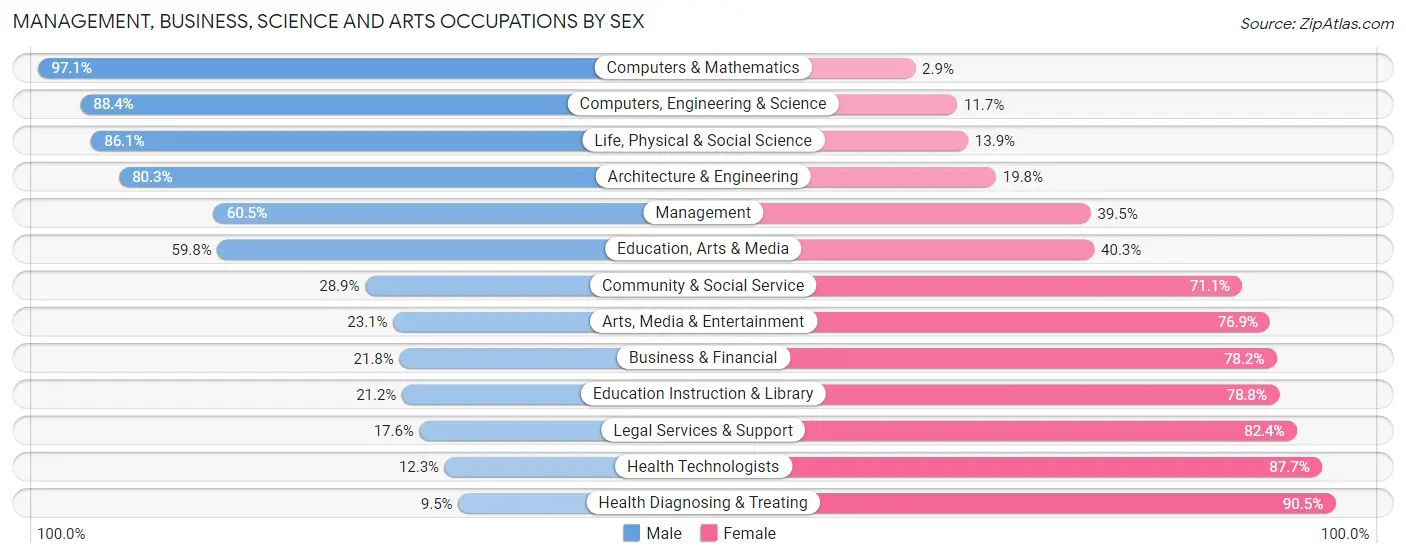
| Occupation | Male | Female |
| Management | 619 (60.5%) | 404 (39.5%) |
| Business & Financial | 69 (21.8%) | 248 (78.2%) |
| Computers, Engineering & Science | 364 (88.3%) | 48 (11.7%) |
| Computers & Mathematics | 166 (97.1%) | 5 (2.9%) |
| Architecture & Engineering | 130 (80.2%) | 32 (19.8%) |
| Life, Physical & Social Science | 68 (86.1%) | 11 (13.9%) |
| Community & Social Service | 343 (28.9%) | 843 (71.1%) |
| Education, Arts & Media | 144 (59.8%) | 97 (40.3%) |
| Legal Services & Support | 16 (17.6%) | 75 (82.4%) |
| Education Instruction & Library | 162 (21.2%) | 601 (78.8%) |
| Arts, Media & Entertainment | 21 (23.1%) | 70 (76.9%) |
| Health Diagnosing & Treating | 67 (9.5%) | 638 (90.5%) |
| Health Technologists | 57 (12.3%) | 406 (87.7%) |
| Total (Category) | 1,462 (40.1%) | 2,181 (59.9%) |
| Total (Overall) | 5,810 (52.9%) | 5,163 (47.0%) |
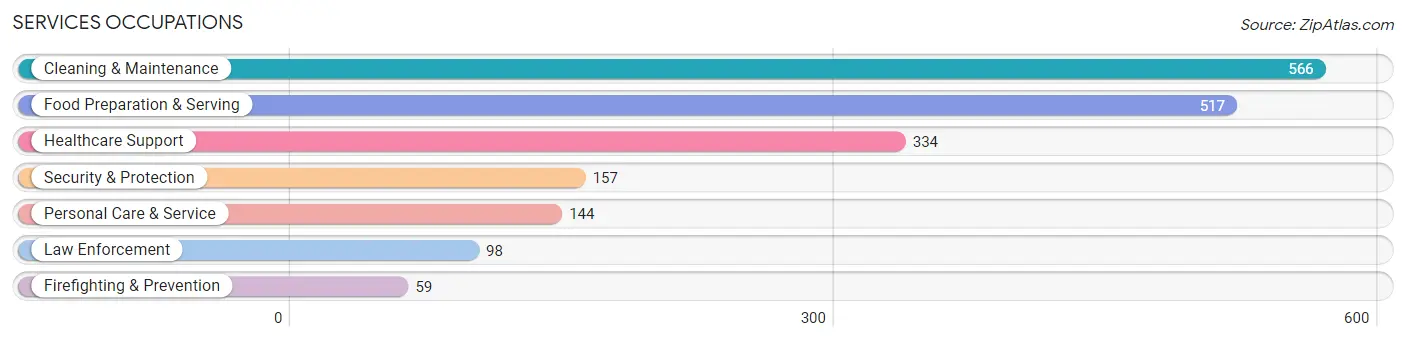
Services Occupations
The most common Services occupations in Wyandot County are Cleaning & Maintenance (566 | 5.2%), Food Preparation & Serving (517 | 4.7%), Healthcare Support (334 | 3.0%), Security & Protection (157 | 1.4%), and Personal Care & Service (144 | 1.3%).
Services Occupations by Sex
Within the Services occupations in Wyandot County, the most male-oriented occupations are Cleaning & Maintenance (74.4%), Firefighting & Prevention (71.2%), and Security & Protection (64.3%), while the most female-oriented occupations are Healthcare Support (96.7%), Personal Care & Service (76.4%), and Food Preparation & Serving (74.3%).

| Occupation | Male | Female |
| Healthcare Support | 11 (3.3%) | 323 (96.7%) |
| Security & Protection | 101 (64.3%) | 56 (35.7%) |
| Firefighting & Prevention | 42 (71.2%) | 17 (28.8%) |
| Law Enforcement | 59 (60.2%) | 39 (39.8%) |
| Food Preparation & Serving | 133 (25.7%) | 384 (74.3%) |
| Cleaning & Maintenance | 421 (74.4%) | 145 (25.6%) |
| Personal Care & Service | 34 (23.6%) | 110 (76.4%) |
| Total (Category) | 700 (40.7%) | 1,018 (59.3%) |
| Total (Overall) | 5,810 (52.9%) | 5,163 (47.0%) |
Sales and Office Occupations
The most common Sales and Office occupations in Wyandot County are Office & Administration (831 | 7.6%), and Sales & Related (755 | 6.9%).

Sales and Office Occupations by Sex

| Occupation | Male | Female |
| Sales & Related | 432 (57.2%) | 323 (42.8%) |
| Office & Administration | 253 (30.4%) | 578 (69.6%) |
| Total (Category) | 685 (43.2%) | 901 (56.8%) |
| Total (Overall) | 5,810 (52.9%) | 5,163 (47.0%) |
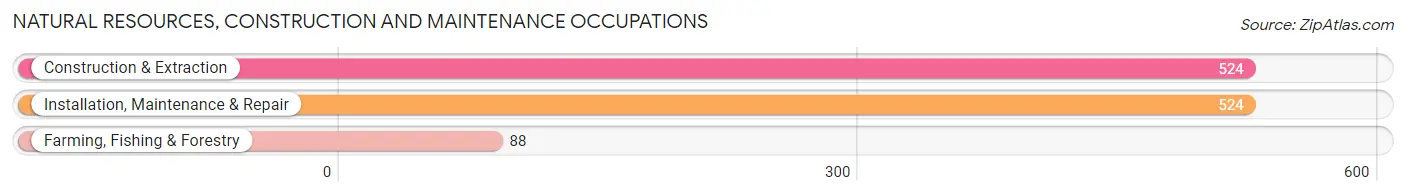
Natural Resources, Construction and Maintenance Occupations
The most common Natural Resources, Construction and Maintenance occupations in Wyandot County are Construction & Extraction (524 | 4.8%), Installation, Maintenance & Repair (524 | 4.8%), and Farming, Fishing & Forestry (88 | 0.8%).
Natural Resources, Construction and Maintenance Occupations by Sex
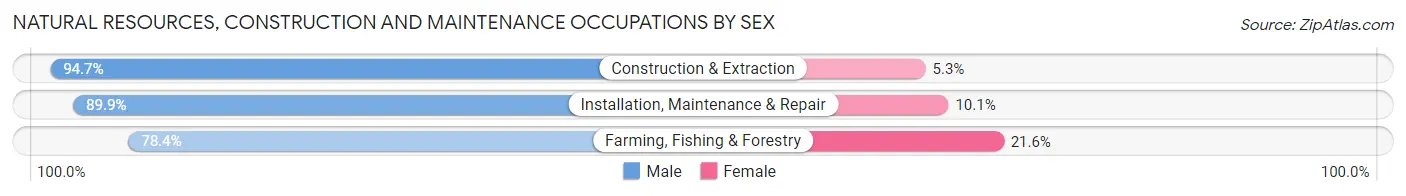
| Occupation | Male | Female |
| Farming, Fishing & Forestry | 69 (78.4%) | 19 (21.6%) |
| Construction & Extraction | 496 (94.7%) | 28 (5.3%) |
| Installation, Maintenance & Repair | 471 (89.9%) | 53 (10.1%) |
| Total (Category) | 1,036 (91.2%) | 100 (8.8%) |
| Total (Overall) | 5,810 (52.9%) | 5,163 (47.0%) |
Production, Transportation and Moving Occupations
The most common Production, Transportation and Moving occupations in Wyandot County are Production (1,636 | 14.9%), Material Moving (921 | 8.4%), and Transportation (333 | 3.0%).

Production, Transportation and Moving Occupations by Sex

| Occupation | Male | Female |
| Production | 978 (59.8%) | 658 (40.2%) |
| Transportation | 301 (90.4%) | 32 (9.6%) |
| Material Moving | 648 (70.4%) | 273 (29.6%) |
| Total (Category) | 1,927 (66.7%) | 963 (33.3%) |
| Total (Overall) | 5,810 (52.9%) | 5,163 (47.0%) |
Employment Industries by Sex in Wyandot County
Employment Industries in Wyandot County
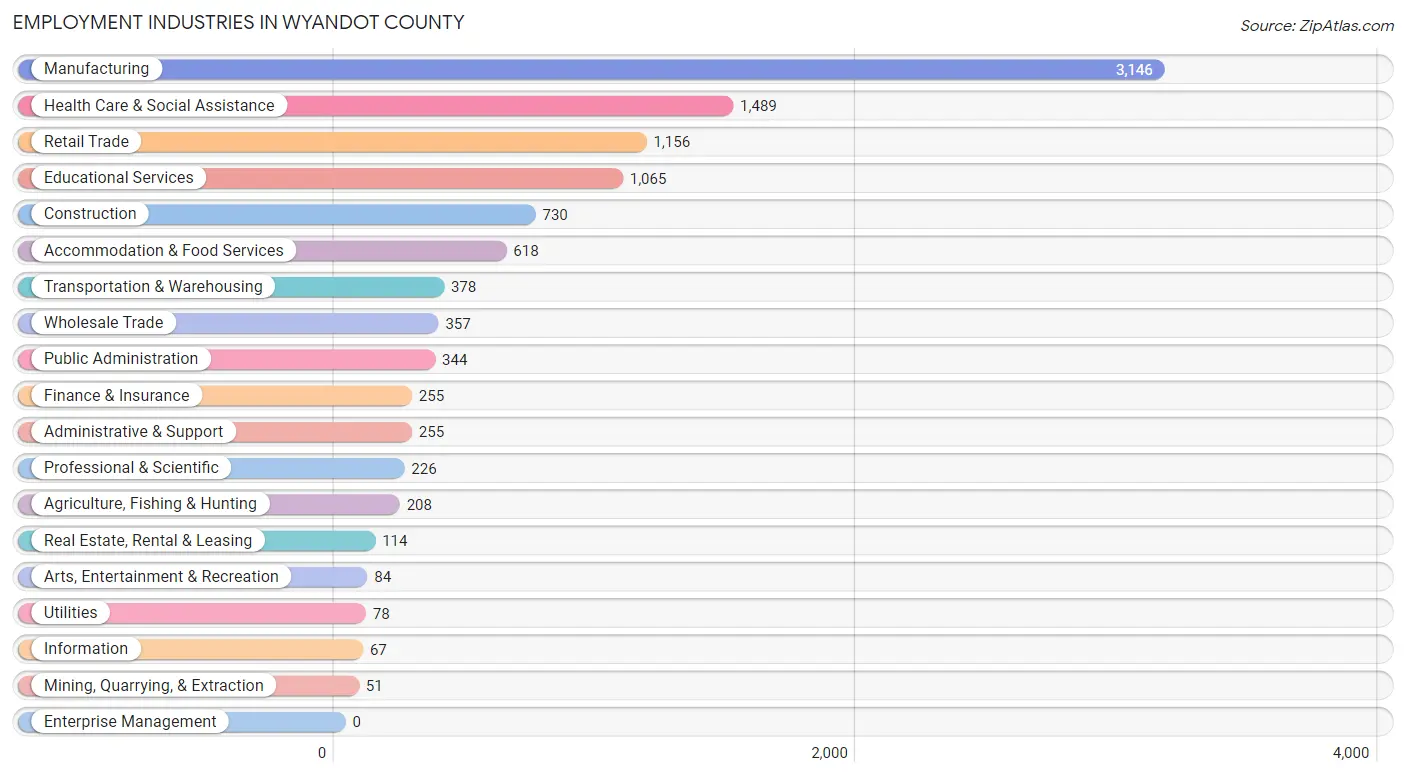
The major employment industries in Wyandot County include Manufacturing (3,146 | 28.7%), Health Care & Social Assistance (1,489 | 13.6%), Retail Trade (1,156 | 10.5%), Educational Services (1,065 | 9.7%), and Construction (730 | 6.7%).
Employment Industries by Sex in Wyandot County
The Wyandot County industries that see more men than women are Mining, Quarrying, & Extraction (100.0%), Utilities (100.0%), and Construction (89.9%), whereas the industries that tend to have a higher number of women are Real Estate, Rental & Leasing (89.5%), Health Care & Social Assistance (82.1%), and Finance & Insurance (78.0%).
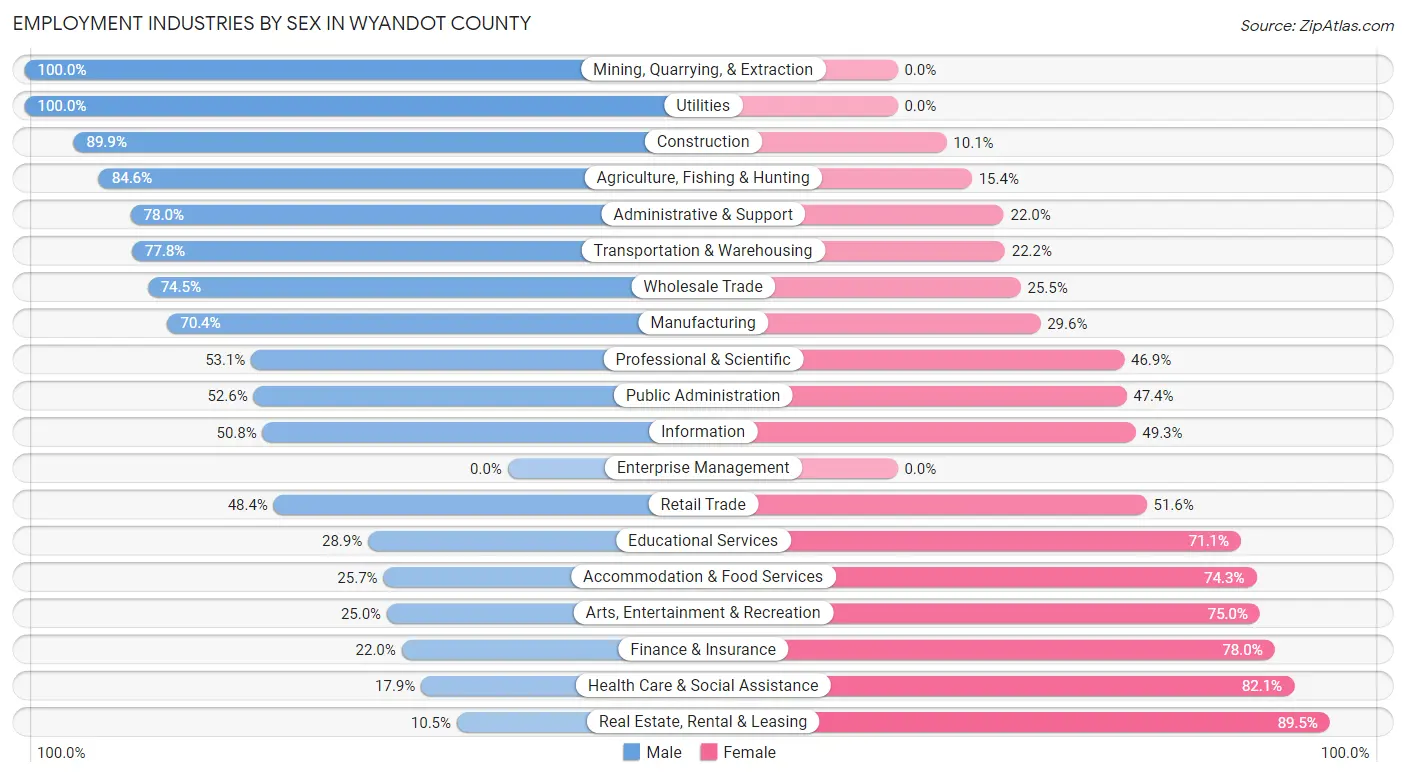
| Industry | Male | Female |
| Agriculture, Fishing & Hunting | 176 (84.6%) | 32 (15.4%) |
| Mining, Quarrying, & Extraction | 51 (100.0%) | 0 (0.0%) |
| Construction | 656 (89.9%) | 74 (10.1%) |
| Manufacturing | 2,216 (70.4%) | 930 (29.6%) |
| Wholesale Trade | 266 (74.5%) | 91 (25.5%) |
| Retail Trade | 560 (48.4%) | 596 (51.6%) |
| Transportation & Warehousing | 294 (77.8%) | 84 (22.2%) |
| Utilities | 78 (100.0%) | 0 (0.0%) |
| Information | 34 (50.7%) | 33 (49.2%) |
| Finance & Insurance | 56 (22.0%) | 199 (78.0%) |
| Real Estate, Rental & Leasing | 12 (10.5%) | 102 (89.5%) |
| Professional & Scientific | 120 (53.1%) | 106 (46.9%) |
| Enterprise Management | 0 (0.0%) | 0 (0.0%) |
| Administrative & Support | 199 (78.0%) | 56 (22.0%) |
| Educational Services | 308 (28.9%) | 757 (71.1%) |
| Health Care & Social Assistance | 267 (17.9%) | 1,222 (82.1%) |
| Arts, Entertainment & Recreation | 21 (25.0%) | 63 (75.0%) |
| Accommodation & Food Services | 159 (25.7%) | 459 (74.3%) |
| Public Administration | 181 (52.6%) | 163 (47.4%) |
| Total | 5,810 (52.9%) | 5,163 (47.0%) |
Education in Wyandot County
School Enrollment in Wyandot County
The most common levels of schooling among the 4,747 students in Wyandot County are elementary school (1,136 | 23.9%), high school (1,076 | 22.7%), and middle school (958 | 20.2%).

| School Level | # Students | % Students |
| Nursery / Preschool | 441 | 9.3% |
| Kindergarten | 328 | 6.9% |
| Elementary School | 1,136 | 23.9% |
| Middle School | 958 | 20.2% |
| High School | 1,076 | 22.7% |
| College / Undergraduate | 666 | 14.0% |
| Graduate / Professional | 142 | 3.0% |
| Total | 4,747 | 100.0% |
School Enrollment by Age by Funding Source in Wyandot County
Out of a total of 4,747 students who are enrolled in schools in Wyandot County, 812 (17.1%) attend a private institution, while the remaining 3,935 (82.9%) are enrolled in public schools. The age group of 35 years and over has the highest likelihood of being enrolled in private schools, with 70 (49.6% in the age bracket) enrolled. Conversely, the age group of 15 to 17 year olds has the lowest likelihood of being enrolled in a private school, with 798 (97.9% in the age bracket) attending a public institution.
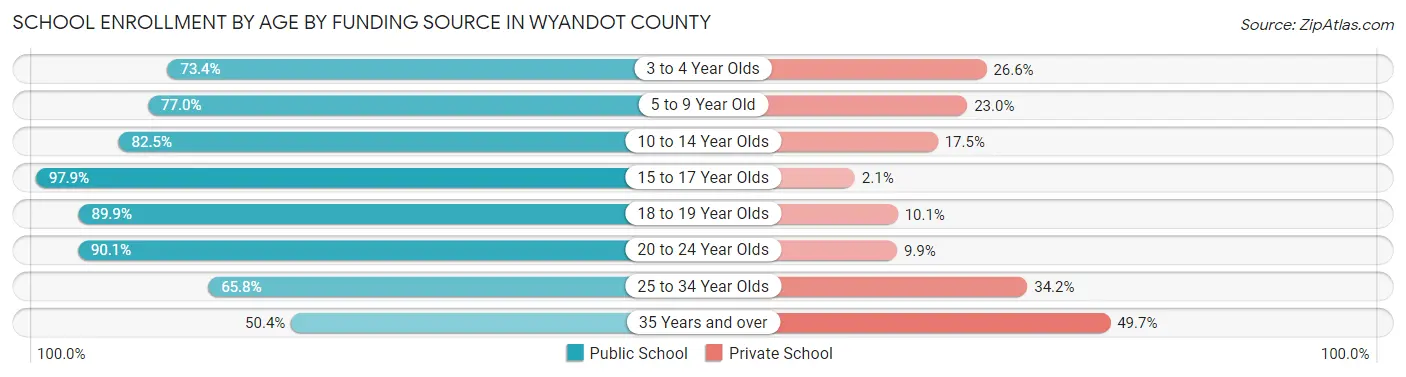
| Age Bracket | Public School | Private School |
| 3 to 4 Year Olds | 196 (73.4%) | 71 (26.6%) |
| 5 to 9 Year Old | 1,147 (77.0%) | 343 (23.0%) |
| 10 to 14 Year Olds | 979 (82.5%) | 208 (17.5%) |
| 15 to 17 Year Olds | 798 (97.9%) | 17 (2.1%) |
| 18 to 19 Year Olds | 304 (89.9%) | 34 (10.1%) |
| 20 to 24 Year Olds | 390 (90.1%) | 43 (9.9%) |
| 25 to 34 Year Olds | 50 (65.8%) | 26 (34.2%) |
| 35 Years and over | 71 (50.3%) | 70 (49.6%) |
| Total | 3,935 (82.9%) | 812 (17.1%) |
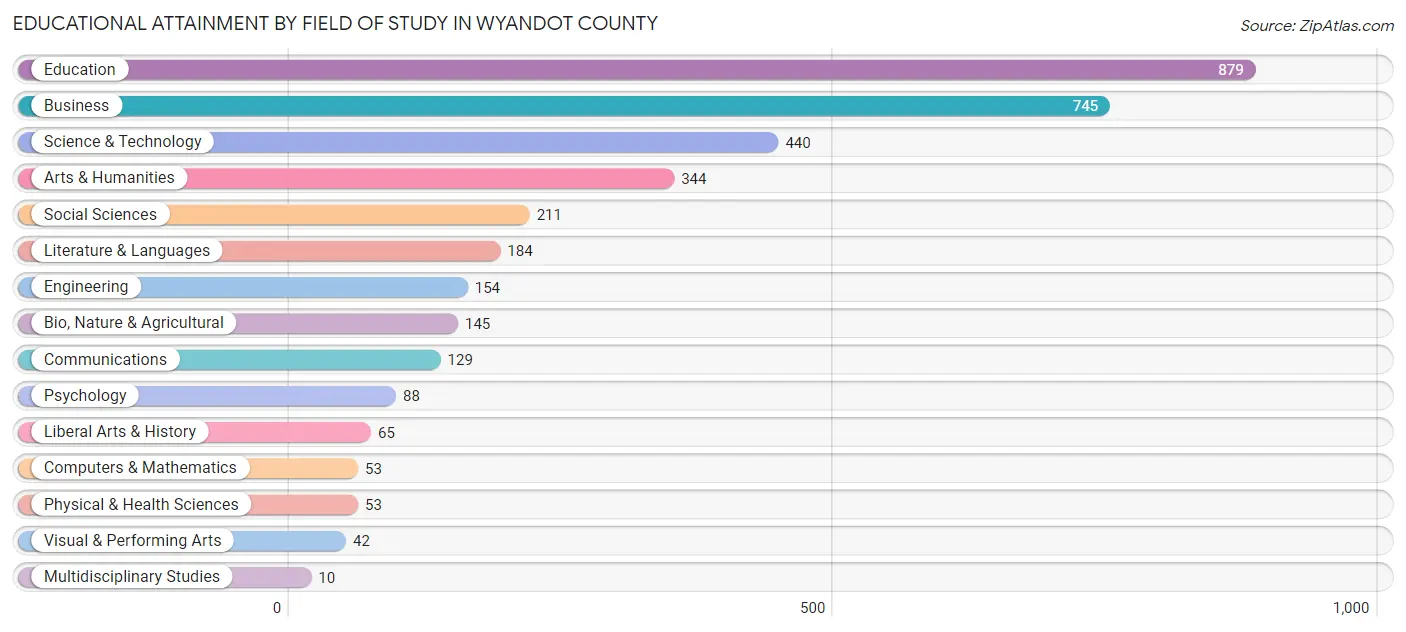
Educational Attainment by Field of Study in Wyandot County
Education (879 | 24.8%), business (745 | 21.0%), science & technology (440 | 12.4%), arts & humanities (344 | 9.7%), and social sciences (211 | 6.0%) are the most common fields of study among 3,542 individuals in Wyandot County who have obtained a bachelor's degree or higher.
| Field of Study | # Graduates | % Graduates |
| Computers & Mathematics | 53 | 1.5% |
| Bio, Nature & Agricultural | 145 | 4.1% |
| Physical & Health Sciences | 53 | 1.5% |
| Psychology | 88 | 2.5% |
| Social Sciences | 211 | 6.0% |
| Engineering | 154 | 4.3% |
| Multidisciplinary Studies | 10 | 0.3% |
| Science & Technology | 440 | 12.4% |
| Business | 745 | 21.0% |
| Education | 879 | 24.8% |
| Literature & Languages | 184 | 5.2% |
| Liberal Arts & History | 65 | 1.8% |
| Visual & Performing Arts | 42 | 1.2% |
| Communications | 129 | 3.6% |
| Arts & Humanities | 344 | 9.7% |
| Total | 3,542 | 100.0% |
Transportation & Commute in Wyandot County
Vehicle Availability by Sex in Wyandot County
The most prevalent vehicle ownership categories in Wyandot County are males with 2 vehicles (2,314, accounting for 39.9%) and females with 2 vehicles (1,834, making up 45.9%).
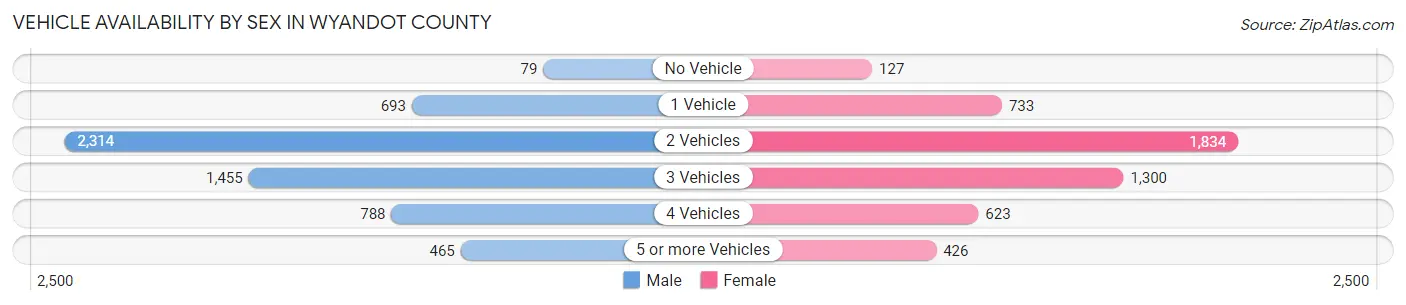
| Vehicles Available | Male | Female |
| No Vehicle | 79 (1.4%) | 127 (2.5%) |
| 1 Vehicle | 693 (12.0%) | 733 (14.5%) |
| 2 Vehicles | 2,314 (39.9%) | 1,834 (36.4%) |
| 3 Vehicles | 1,455 (25.1%) | 1,300 (25.8%) |
| 4 Vehicles | 788 (13.6%) | 623 (12.3%) |
| 5 or more Vehicles | 465 (8.0%) | 426 (8.5%) |
| Total | 5,794 (100.0%) | 5,043 (100.0%) |
Commute Time in Wyandot County
The most frequently occuring commute durations in Wyandot County are 15 to 19 minutes (1,552 commuters, 14.9%), 5 to 9 minutes (1,534 commuters, 14.7%), and 10 to 14 minutes (1,401 commuters, 13.4%).

| Commute Time | # Commuters | % Commuters |
| Less than 5 Minutes | 832 | 8.0% |
| 5 to 9 Minutes | 1,534 | 14.7% |
| 10 to 14 Minutes | 1,401 | 13.4% |
| 15 to 19 Minutes | 1,552 | 14.9% |
| 20 to 24 Minutes | 1,273 | 12.2% |
| 25 to 29 Minutes | 1,058 | 10.1% |
| 30 to 34 Minutes | 1,207 | 11.6% |
| 35 to 39 Minutes | 293 | 2.8% |
| 40 to 44 Minutes | 109 | 1.0% |
| 45 to 59 Minutes | 505 | 4.8% |
| 60 to 89 Minutes | 474 | 4.5% |
| 90 or more Minutes | 203 | 1.9% |
Commute Time by Sex in Wyandot County
The most common commute times in Wyandot County are 15 to 19 minutes (773 commuters, 13.7%) for males and 5 to 9 minutes (841 commuters, 17.5%) for females.

| Commute Time | Male | Female |
| Less than 5 Minutes | 485 (8.6%) | 347 (7.2%) |
| 5 to 9 Minutes | 693 (12.3%) | 841 (17.5%) |
| 10 to 14 Minutes | 700 (12.4%) | 701 (14.6%) |
| 15 to 19 Minutes | 773 (13.7%) | 779 (16.2%) |
| 20 to 24 Minutes | 648 (11.5%) | 625 (13.0%) |
| 25 to 29 Minutes | 617 (11.0%) | 441 (9.2%) |
| 30 to 34 Minutes | 640 (11.4%) | 567 (11.8%) |
| 35 to 39 Minutes | 174 (3.1%) | 119 (2.5%) |
| 40 to 44 Minutes | 82 (1.5%) | 27 (0.6%) |
| 45 to 59 Minutes | 310 (5.5%) | 195 (4.1%) |
| 60 to 89 Minutes | 327 (5.8%) | 147 (3.1%) |
| 90 or more Minutes | 183 (3.3%) | 20 (0.4%) |
Time of Departure to Work by Sex in Wyandot County
The most frequent times of departure to work in Wyandot County are 6:30 AM to 6:59 AM (736, 13.1%) for males and 7:00 AM to 7:29 AM (790, 16.4%) for females.
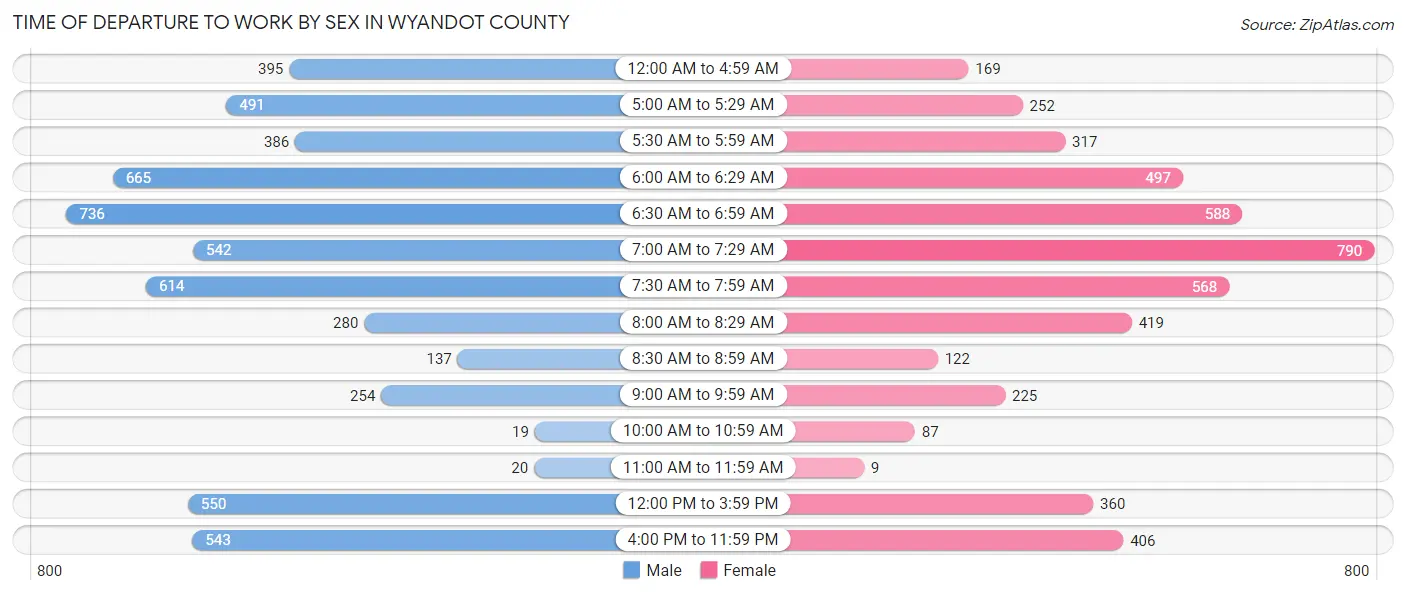
| Time of Departure | Male | Female |
| 12:00 AM to 4:59 AM | 395 (7.0%) | 169 (3.5%) |
| 5:00 AM to 5:29 AM | 491 (8.7%) | 252 (5.2%) |
| 5:30 AM to 5:59 AM | 386 (6.9%) | 317 (6.6%) |
| 6:00 AM to 6:29 AM | 665 (11.8%) | 497 (10.3%) |
| 6:30 AM to 6:59 AM | 736 (13.1%) | 588 (12.2%) |
| 7:00 AM to 7:29 AM | 542 (9.6%) | 790 (16.4%) |
| 7:30 AM to 7:59 AM | 614 (10.9%) | 568 (11.8%) |
| 8:00 AM to 8:29 AM | 280 (5.0%) | 419 (8.7%) |
| 8:30 AM to 8:59 AM | 137 (2.4%) | 122 (2.5%) |
| 9:00 AM to 9:59 AM | 254 (4.5%) | 225 (4.7%) |
| 10:00 AM to 10:59 AM | 19 (0.3%) | 87 (1.8%) |
| 11:00 AM to 11:59 AM | 20 (0.4%) | 9 (0.2%) |
| 12:00 PM to 3:59 PM | 550 (9.8%) | 360 (7.5%) |
| 4:00 PM to 11:59 PM | 543 (9.6%) | 406 (8.4%) |
| Total | 5,632 (100.0%) | 4,809 (100.0%) |
Housing Occupancy in Wyandot County
Occupancy by Ownership in Wyandot County
Of the total 8,982 dwellings in Wyandot County, owner-occupied units account for 6,609 (73.6%), while renter-occupied units make up 2,373 (26.4%).
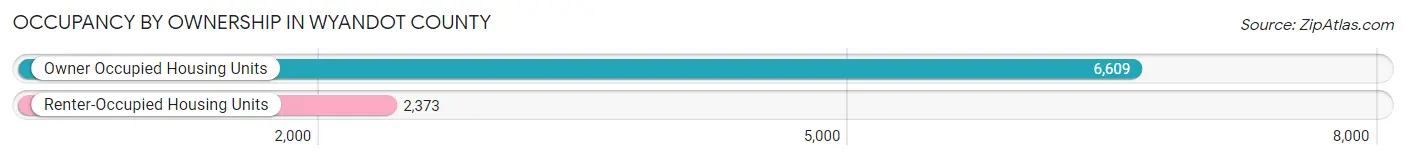
| Occupancy | # Housing Units | % Housing Units |
| Owner Occupied Housing Units | 6,609 | 73.6% |
| Renter-Occupied Housing Units | 2,373 | 26.4% |
| Total Occupied Housing Units | 8,982 | 100.0% |
Occupancy by Household Size in Wyandot County

| Household Size | # Housing Units | % Housing Units |
| 1-Person Household | 2,490 | 27.7% |
| 2-Person Household | 3,573 | 39.8% |
| 3-Person Household | 1,138 | 12.7% |
| 4+ Person Household | 1,781 | 19.8% |
| Total Housing Units | 8,982 | 100.0% |
Occupancy by Ownership by Household Size in Wyandot County
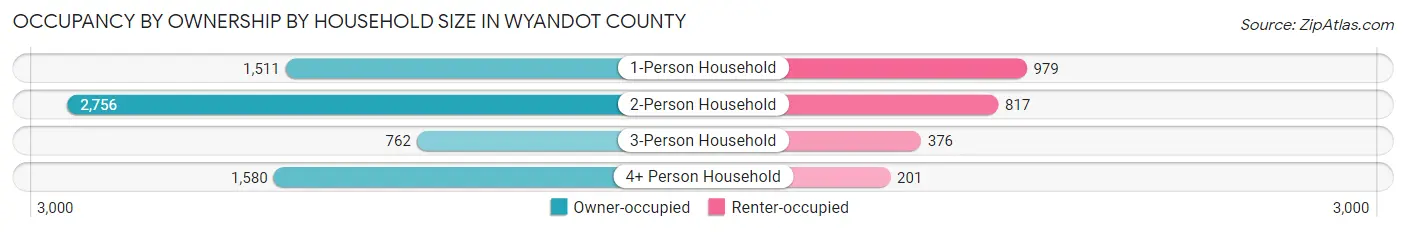
| Household Size | Owner-occupied | Renter-occupied |
| 1-Person Household | 1,511 (60.7%) | 979 (39.3%) |
| 2-Person Household | 2,756 (77.1%) | 817 (22.9%) |
| 3-Person Household | 762 (67.0%) | 376 (33.0%) |
| 4+ Person Household | 1,580 (88.7%) | 201 (11.3%) |
| Total Housing Units | 6,609 (73.6%) | 2,373 (26.4%) |
Occupancy by Educational Attainment in Wyandot County

| Household Size | Owner-occupied | Renter-occupied |
| Less than High School | 204 (57.5%) | 151 (42.5%) |
| High School Diploma | 2,979 (72.7%) | 1,121 (27.3%) |
| College/Associate Degree | 1,983 (75.5%) | 642 (24.5%) |
| Bachelor's Degree or higher | 1,443 (75.9%) | 459 (24.1%) |
Occupancy by Age of Householder in Wyandot County
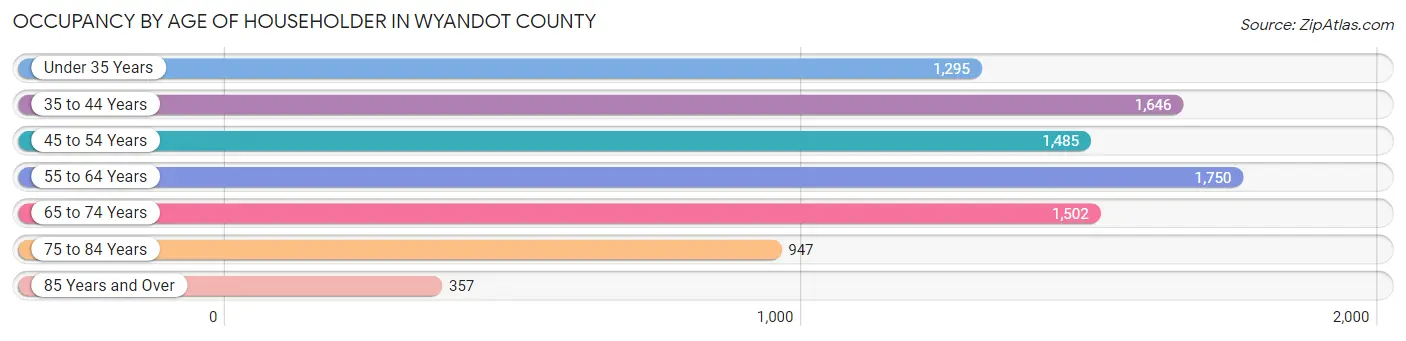
| Age Bracket | # Households | % Households |
| Under 35 Years | 1,295 | 14.4% |
| 35 to 44 Years | 1,646 | 18.3% |
| 45 to 54 Years | 1,485 | 16.5% |
| 55 to 64 Years | 1,750 | 19.5% |
| 65 to 74 Years | 1,502 | 16.7% |
| 75 to 84 Years | 947 | 10.5% |
| 85 Years and Over | 357 | 4.0% |
| Total | 8,982 | 100.0% |
Housing Finances in Wyandot County
Median Income by Occupancy in Wyandot County
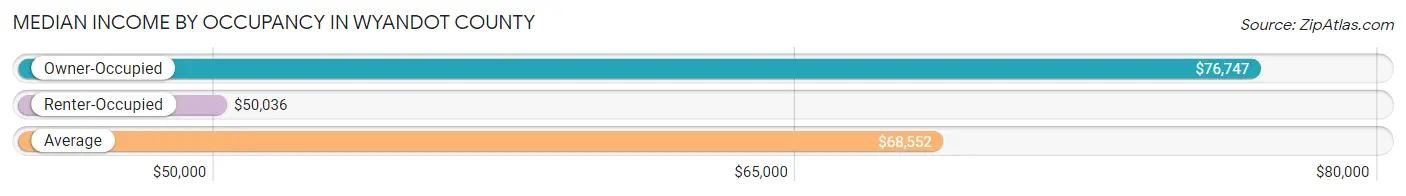
| Occupancy Type | # Households | Median Income |
| Owner-Occupied | 6,609 (73.6%) | $76,747 |
| Renter-Occupied | 2,373 (26.4%) | $50,036 |
| Average | 8,982 (100.0%) | $68,552 |
Occupancy by Householder Income Bracket in Wyandot County
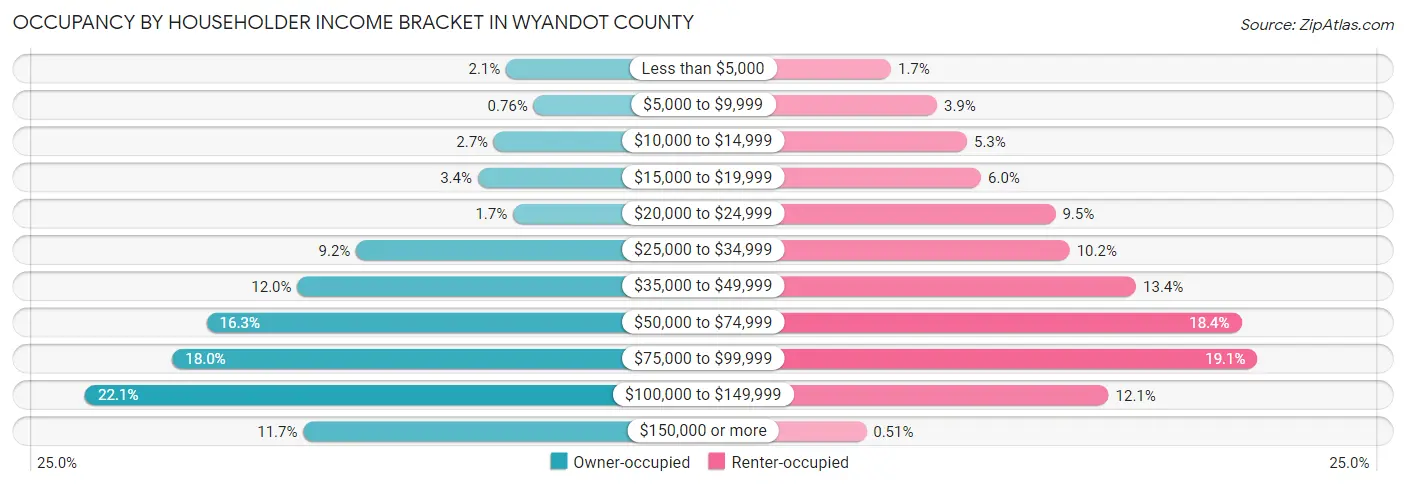
| Income Bracket | Owner-occupied | Renter-occupied |
| Less than $5,000 | 137 (2.1%) | 40 (1.7%) |
| $5,000 to $9,999 | 50 (0.8%) | 92 (3.9%) |
| $10,000 to $14,999 | 175 (2.6%) | 126 (5.3%) |
| $15,000 to $19,999 | 226 (3.4%) | 142 (6.0%) |
| $20,000 to $24,999 | 115 (1.7%) | 226 (9.5%) |
| $25,000 to $34,999 | 609 (9.2%) | 242 (10.2%) |
| $35,000 to $49,999 | 794 (12.0%) | 317 (13.4%) |
| $50,000 to $74,999 | 1,079 (16.3%) | 436 (18.4%) |
| $75,000 to $99,999 | 1,187 (18.0%) | 454 (19.1%) |
| $100,000 to $149,999 | 1,462 (22.1%) | 286 (12.0%) |
| $150,000 or more | 775 (11.7%) | 12 (0.5%) |
| Total | 6,609 (100.0%) | 2,373 (100.0%) |
Monthly Housing Cost Tiers in Wyandot County
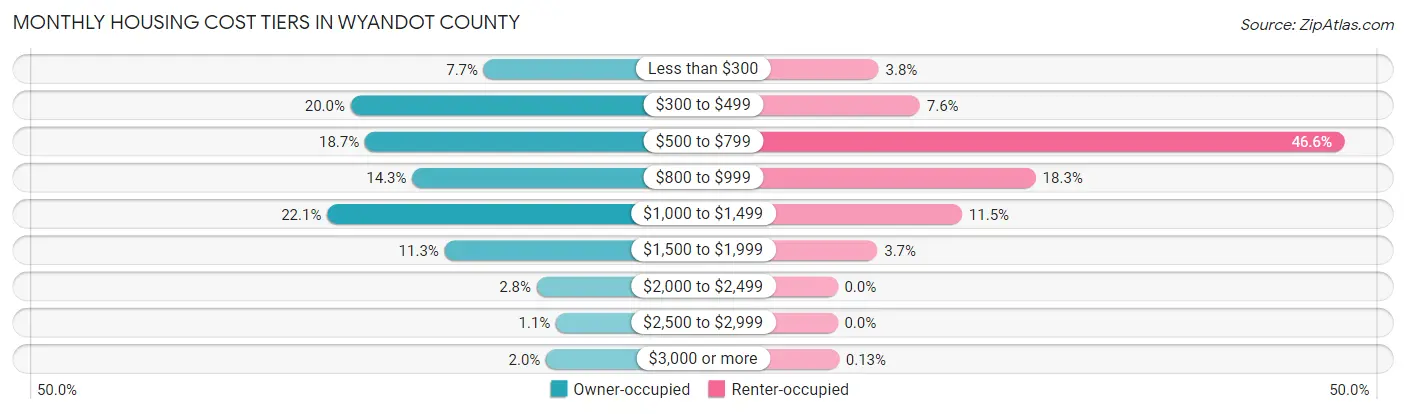
| Monthly Cost | Owner-occupied | Renter-occupied |
| Less than $300 | 510 (7.7%) | 90 (3.8%) |
| $300 to $499 | 1,320 (20.0%) | 180 (7.6%) |
| $500 to $799 | 1,233 (18.7%) | 1,106 (46.6%) |
| $800 to $999 | 945 (14.3%) | 433 (18.2%) |
| $1,000 to $1,499 | 1,463 (22.1%) | 272 (11.5%) |
| $1,500 to $1,999 | 749 (11.3%) | 87 (3.7%) |
| $2,000 to $2,499 | 188 (2.8%) | 0 (0.0%) |
| $2,500 to $2,999 | 70 (1.1%) | 0 (0.0%) |
| $3,000 or more | 131 (2.0%) | 3 (0.1%) |
| Total | 6,609 (100.0%) | 2,373 (100.0%) |
Physical Housing Characteristics in Wyandot County
Housing Structures in Wyandot County
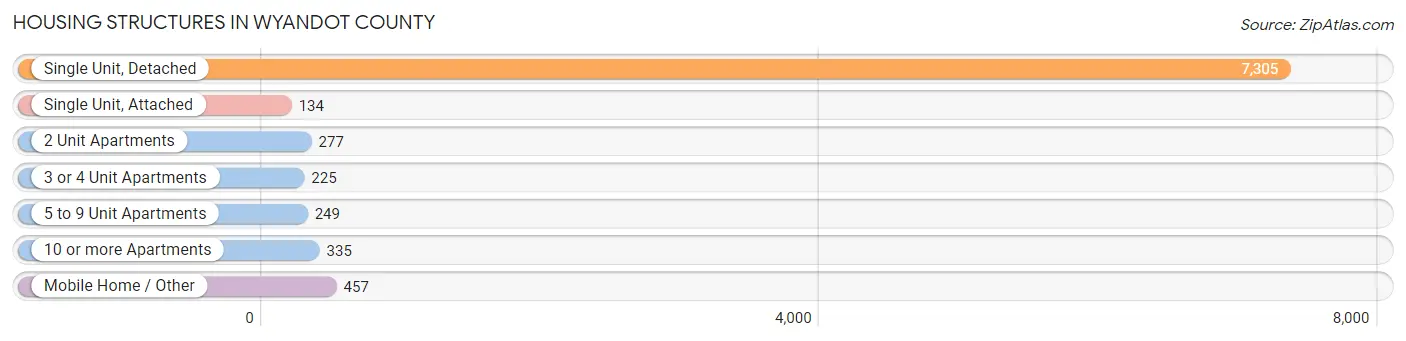
| Structure Type | # Housing Units | % Housing Units |
| Single Unit, Detached | 7,305 | 81.3% |
| Single Unit, Attached | 134 | 1.5% |
| 2 Unit Apartments | 277 | 3.1% |
| 3 or 4 Unit Apartments | 225 | 2.5% |
| 5 to 9 Unit Apartments | 249 | 2.8% |
| 10 or more Apartments | 335 | 3.7% |
| Mobile Home / Other | 457 | 5.1% |
| Total | 8,982 | 100.0% |
Housing Structures by Occupancy in Wyandot County
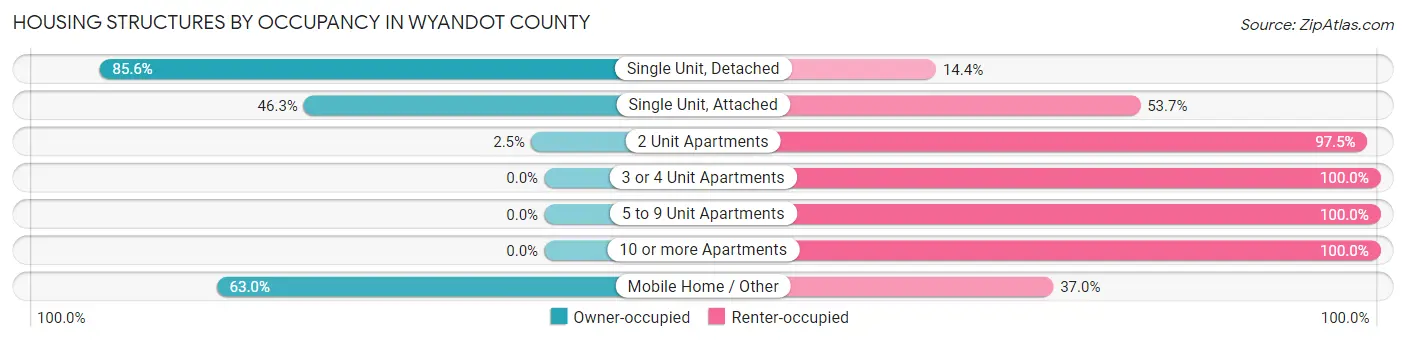
| Structure Type | Owner-occupied | Renter-occupied |
| Single Unit, Detached | 6,252 (85.6%) | 1,053 (14.4%) |
| Single Unit, Attached | 62 (46.3%) | 72 (53.7%) |
| 2 Unit Apartments | 7 (2.5%) | 270 (97.5%) |
| 3 or 4 Unit Apartments | 0 (0.0%) | 225 (100.0%) |
| 5 to 9 Unit Apartments | 0 (0.0%) | 249 (100.0%) |
| 10 or more Apartments | 0 (0.0%) | 335 (100.0%) |
| Mobile Home / Other | 288 (63.0%) | 169 (37.0%) |
| Total | 6,609 (73.6%) | 2,373 (26.4%) |
Housing Structures by Number of Rooms in Wyandot County

| Number of Rooms | Owner-occupied | Renter-occupied |
| 1 Room | 0 (0.0%) | 6 (0.3%) |
| 2 or 3 Rooms | 21 (0.3%) | 329 (13.9%) |
| 4 or 5 Rooms | 1,421 (21.5%) | 1,102 (46.4%) |
| 6 or 7 Rooms | 2,928 (44.3%) | 502 (21.1%) |
| 8 or more Rooms | 2,239 (33.9%) | 434 (18.3%) |
| Total | 6,609 (100.0%) | 2,373 (100.0%) |
Housing Structure by Heating Type in Wyandot County

| Heating Type | Owner-occupied | Renter-occupied |
| Utility Gas | 2,902 (43.9%) | 859 (36.2%) |
| Bottled, Tank, or LP Gas | 1,544 (23.4%) | 127 (5.3%) |
| Electricity | 1,451 (22.0%) | 1,222 (51.5%) |
| Fuel Oil or Kerosene | 155 (2.4%) | 89 (3.7%) |
| Coal or Coke | 0 (0.0%) | 0 (0.0%) |
| All other Fuels | 546 (8.3%) | 64 (2.7%) |
| No Fuel Used | 11 (0.2%) | 12 (0.5%) |
| Total | 6,609 (100.0%) | 2,373 (100.0%) |
Household Vehicle Usage in Wyandot County
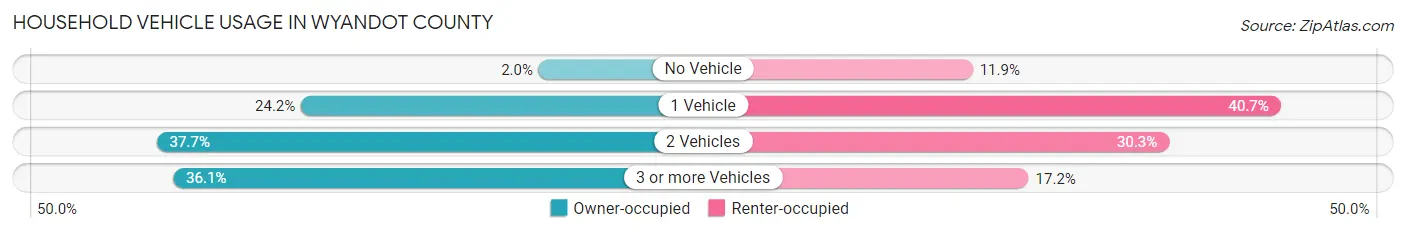
| Vehicles per Household | Owner-occupied | Renter-occupied |
| No Vehicle | 132 (2.0%) | 283 (11.9%) |
| 1 Vehicle | 1,599 (24.2%) | 965 (40.7%) |
| 2 Vehicles | 2,490 (37.7%) | 718 (30.3%) |
| 3 or more Vehicles | 2,388 (36.1%) | 407 (17.2%) |
| Total | 6,609 (100.0%) | 2,373 (100.0%) |
Real Estate & Mortgages in Wyandot County
Real Estate and Mortgage Overview in Wyandot County
| Characteristic | Without Mortgage | With Mortgage |
| Housing Units | 2,888 | 3,721 |
| Median Property Value | $149,400 | $157,400 |
| Median Household Income | $53,935 | $554 |
| Monthly Housing Costs | $436 | $131 |
| Real Estate Taxes | $1,274 | $146 |
Property Value by Mortgage Status in Wyandot County
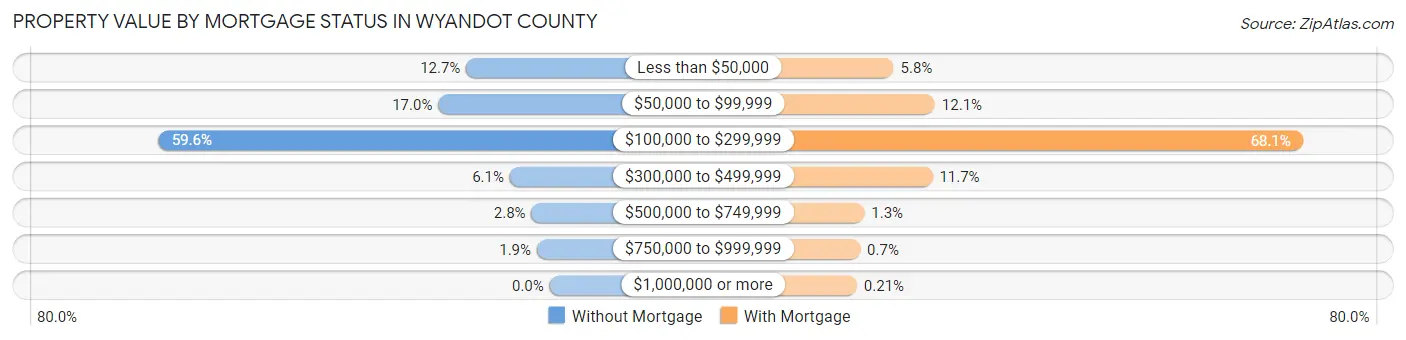
| Property Value | Without Mortgage | With Mortgage |
| Less than $50,000 | 367 (12.7%) | 216 (5.8%) |
| $50,000 to $99,999 | 490 (17.0%) | 450 (12.1%) |
| $100,000 to $299,999 | 1,720 (59.6%) | 2,535 (68.1%) |
| $300,000 to $499,999 | 175 (6.1%) | 436 (11.7%) |
| $500,000 to $749,999 | 80 (2.8%) | 50 (1.3%) |
| $750,000 to $999,999 | 56 (1.9%) | 26 (0.7%) |
| $1,000,000 or more | 0 (0.0%) | 8 (0.2%) |
| Total | 2,888 (100.0%) | 3,721 (100.0%) |
Household Income by Mortgage Status in Wyandot County

| Household Income | Without Mortgage | With Mortgage |
| Less than $10,000 | 115 (4.0%) | 156 (4.2%) |
| $10,000 to $24,999 | 418 (14.5%) | 72 (1.9%) |
| $25,000 to $34,999 | 396 (13.7%) | 98 (2.6%) |
| $35,000 to $49,999 | 423 (14.6%) | 213 (5.7%) |
| $50,000 to $74,999 | 487 (16.9%) | 371 (10.0%) |
| $75,000 to $99,999 | 489 (16.9%) | 592 (15.9%) |
| $100,000 to $149,999 | 339 (11.7%) | 698 (18.8%) |
| $150,000 or more | 221 (7.6%) | 1,123 (30.2%) |
| Total | 2,888 (100.0%) | 3,721 (100.0%) |
Property Value to Household Income Ratio in Wyandot County
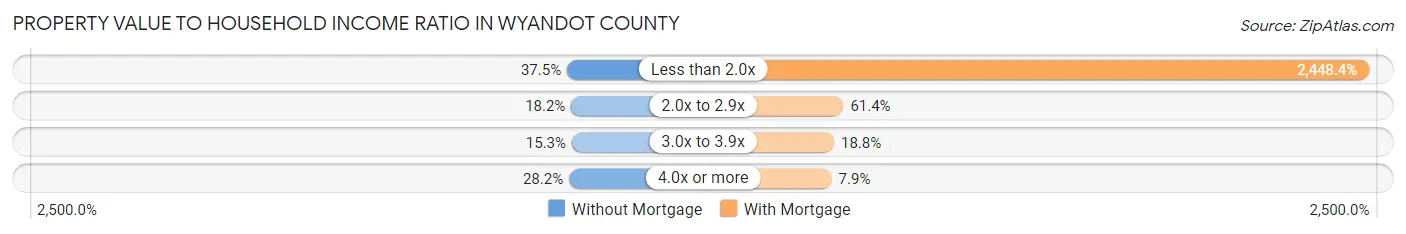
| Value-to-Income Ratio | Without Mortgage | With Mortgage |
| Less than 2.0x | 1,082 (37.5%) | 91,104 (2,448.4%) |
| 2.0x to 2.9x | 525 (18.2%) | 2,284 (61.4%) |
| 3.0x to 3.9x | 441 (15.3%) | 699 (18.8%) |
| 4.0x or more | 815 (28.2%) | 295 (7.9%) |
| Total | 2,888 (100.0%) | 3,721 (100.0%) |
Real Estate Taxes by Mortgage Status in Wyandot County

| Property Taxes | Without Mortgage | With Mortgage |
| Less than $800 | 751 (26.0%) | 13 (0.4%) |
| $800 to $1,499 | 897 (31.1%) | 713 (19.2%) |
| $800 to $1,499 | 1,152 (39.9%) | 1,445 (38.8%) |
| Total | 2,888 (100.0%) | 3,721 (100.0%) |
Health & Disability in Wyandot County
Health Insurance Coverage by Age in Wyandot County
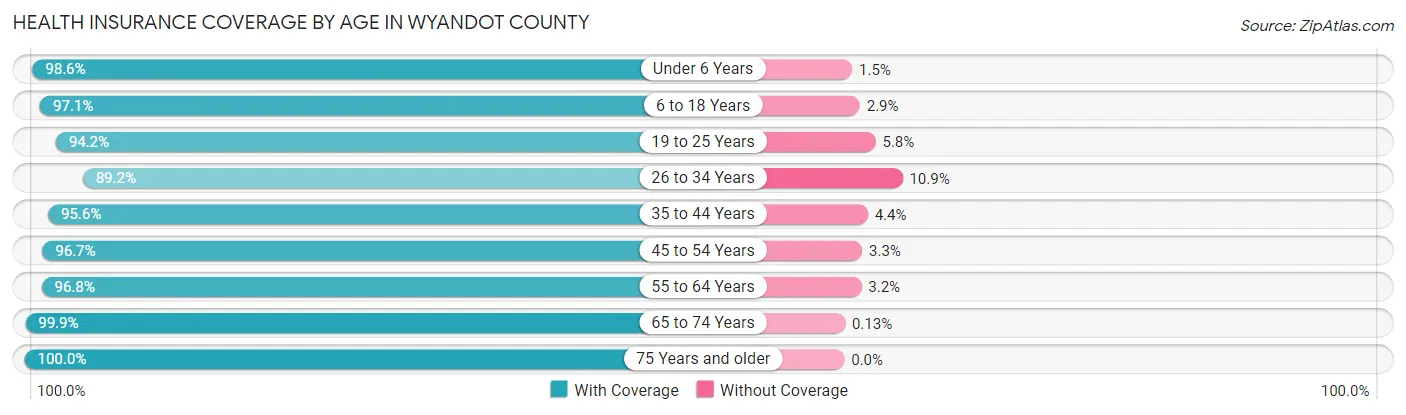
| Age Bracket | With Coverage | Without Coverage |
| Under 6 Years | 1,364 (98.6%) | 20 (1.5%) |
| 6 to 18 Years | 3,633 (97.1%) | 108 (2.9%) |
| 19 to 25 Years | 1,517 (94.2%) | 94 (5.8%) |
| 26 to 34 Years | 1,922 (89.1%) | 234 (10.8%) |
| 35 to 44 Years | 2,624 (95.6%) | 120 (4.4%) |
| 45 to 54 Years | 2,622 (96.7%) | 90 (3.3%) |
| 55 to 64 Years | 2,982 (96.8%) | 98 (3.2%) |
| 65 to 74 Years | 2,358 (99.9%) | 3 (0.1%) |
| 75 Years and older | 1,766 (100.0%) | 0 (0.0%) |
| Total | 20,788 (96.4%) | 767 (3.6%) |
Health Insurance Coverage by Citizenship Status in Wyandot County

| Citizenship Status | With Coverage | Without Coverage |
| Native Born | 1,364 (98.6%) | 20 (1.5%) |
| Foreign Born, Citizen | 3,633 (97.1%) | 108 (2.9%) |
| Foreign Born, not a Citizen | 1,517 (94.2%) | 94 (5.8%) |
Health Insurance Coverage by Household Income in Wyandot County
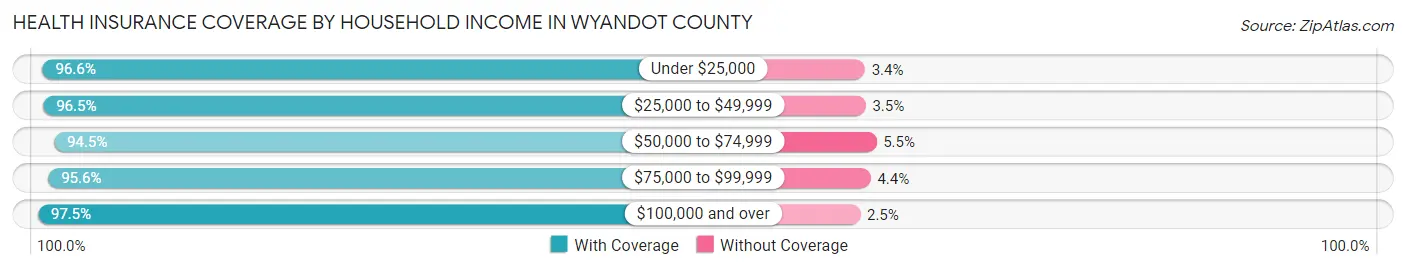
| Household Income | With Coverage | Without Coverage |
| Under $25,000 | 1,839 (96.6%) | 64 (3.4%) |
| $25,000 to $49,999 | 3,557 (96.5%) | 129 (3.5%) |
| $50,000 to $74,999 | 3,088 (94.5%) | 180 (5.5%) |
| $75,000 to $99,999 | 3,902 (95.6%) | 181 (4.4%) |
| $100,000 and over | 8,378 (97.5%) | 213 (2.5%) |
Public vs Private Health Insurance Coverage by Age in Wyandot County

| Age Bracket | Public Insurance | Private Insurance |
| Under 6 | 297 (21.5%) | 1,206 (87.1%) |
| 6 to 18 Years | 1,055 (28.2%) | 2,913 (77.9%) |
| 19 to 25 Years | 226 (14.0%) | 1,332 (82.7%) |
| 25 to 34 Years | 363 (16.8%) | 1,634 (75.8%) |
| 35 to 44 Years | 348 (12.7%) | 2,361 (86.0%) |
| 45 to 54 Years | 351 (12.9%) | 2,374 (87.5%) |
| 55 to 64 Years | 661 (21.5%) | 2,381 (77.3%) |
| 65 to 74 Years | 2,254 (95.5%) | 1,386 (58.7%) |
| 75 Years and over | 1,753 (99.3%) | 1,182 (66.9%) |
| Total | 7,308 (33.9%) | 16,769 (77.8%) |
Disability Status by Sex by Age in Wyandot County

| Age Bracket | Male | Female |
| Under 5 Years | 0 (0.0%) | 0 (0.0%) |
| 5 to 17 Years | 267 (13.7%) | 54 (3.1%) |
| 18 to 34 Years | 169 (8.3%) | 104 (5.2%) |
| 35 to 64 Years | 397 (9.3%) | 425 (10.0%) |
| 65 to 74 Years | 393 (34.6%) | 299 (24.4%) |
| 75 Years and over | 337 (48.2%) | 530 (49.7%) |
Disability Class by Sex by Age in Wyandot County
Disability Class: Hearing Difficulty
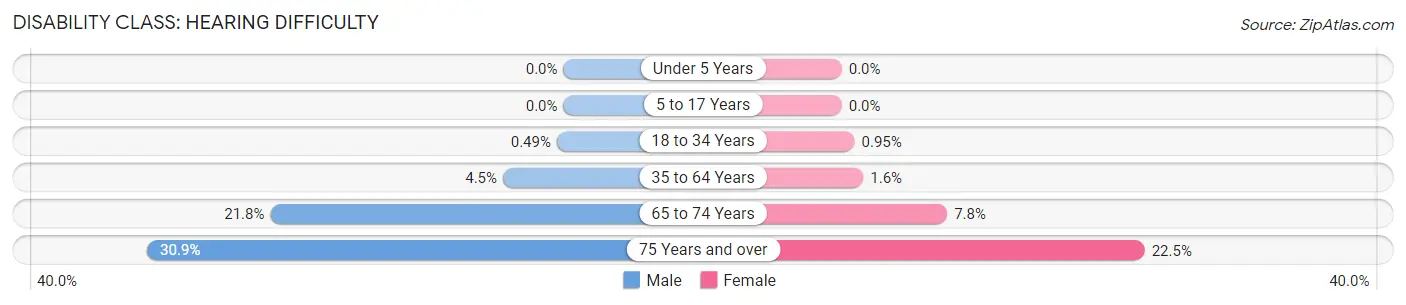
| Age Bracket | Male | Female |
| Under 5 Years | 0 (0.0%) | 0 (0.0%) |
| 5 to 17 Years | 0 (0.0%) | 0 (0.0%) |
| 18 to 34 Years | 10 (0.5%) | 19 (0.9%) |
| 35 to 64 Years | 192 (4.5%) | 68 (1.6%) |
| 65 to 74 Years | 247 (21.8%) | 96 (7.8%) |
| 75 Years and over | 216 (30.9%) | 240 (22.5%) |
Disability Class: Vision Difficulty
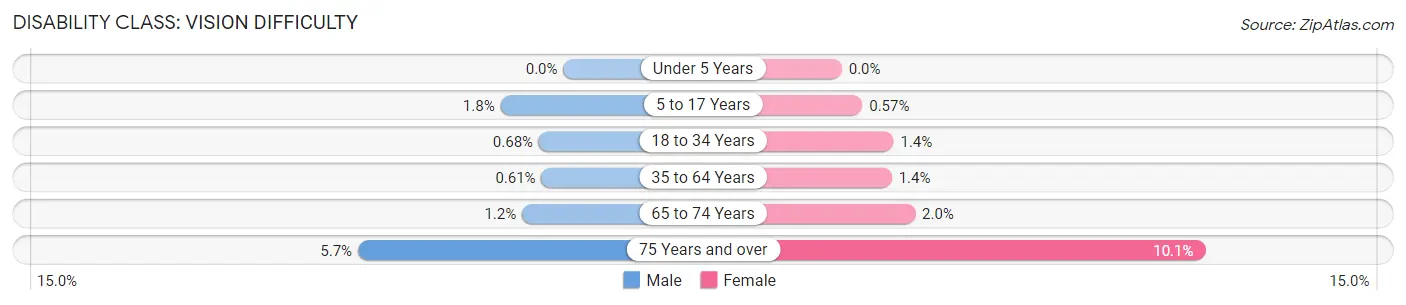
| Age Bracket | Male | Female |
| Under 5 Years | 0 (0.0%) | 0 (0.0%) |
| 5 to 17 Years | 34 (1.8%) | 10 (0.6%) |
| 18 to 34 Years | 14 (0.7%) | 29 (1.4%) |
| 35 to 64 Years | 26 (0.6%) | 59 (1.4%) |
| 65 to 74 Years | 13 (1.1%) | 25 (2.0%) |
| 75 Years and over | 40 (5.7%) | 108 (10.1%) |
Disability Class: Cognitive Difficulty
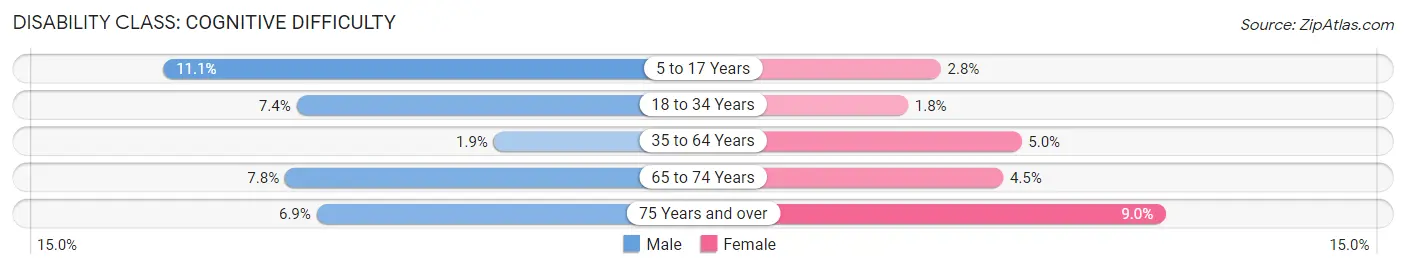
| Age Bracket | Male | Female |
| 5 to 17 Years | 217 (11.1%) | 48 (2.8%) |
| 18 to 34 Years | 152 (7.4%) | 37 (1.8%) |
| 35 to 64 Years | 83 (1.9%) | 213 (5.0%) |
| 65 to 74 Years | 88 (7.7%) | 55 (4.5%) |
| 75 Years and over | 48 (6.9%) | 96 (9.0%) |
Disability Class: Ambulatory Difficulty
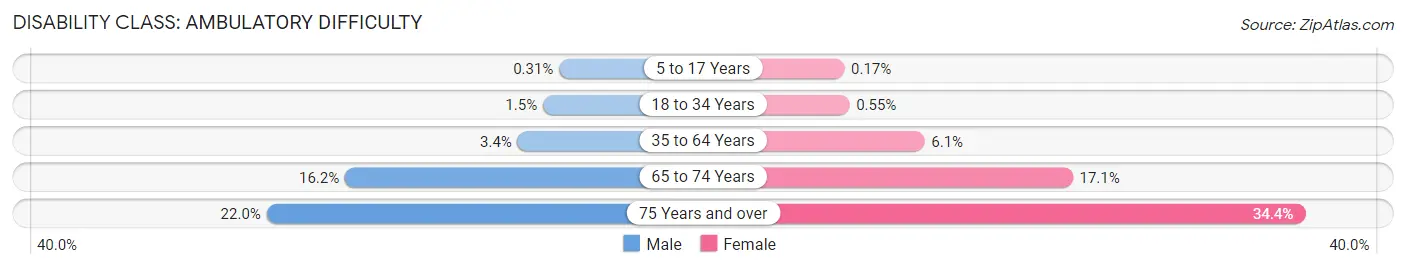
| Age Bracket | Male | Female |
| 5 to 17 Years | 6 (0.3%) | 3 (0.2%) |
| 18 to 34 Years | 31 (1.5%) | 11 (0.5%) |
| 35 to 64 Years | 145 (3.4%) | 261 (6.1%) |
| 65 to 74 Years | 184 (16.2%) | 210 (17.1%) |
| 75 Years and over | 154 (22.0%) | 367 (34.4%) |
Disability Class: Self-Care Difficulty

| Age Bracket | Male | Female |
| 5 to 17 Years | 6 (0.3%) | 3 (0.2%) |
| 18 to 34 Years | 4 (0.2%) | 1 (0.1%) |
| 35 to 64 Years | 47 (1.1%) | 80 (1.9%) |
| 65 to 74 Years | 29 (2.6%) | 54 (4.4%) |
| 75 Years and over | 46 (6.6%) | 108 (10.1%) |
Technology Access in Wyandot County
Computing Device Access in Wyandot County

| Device Type | # Households | % Households |
| Desktop or Laptop | 6,605 | 73.5% |
| Smartphone | 7,550 | 84.1% |
| Tablet | 5,204 | 57.9% |
| No Computing Device | 677 | 7.5% |
| Total | 8,982 | 100.0% |
Internet Access in Wyandot County

| Internet Type | # Households | % Households |
| Dial-Up Internet | 44 | 0.5% |
| Broadband Home | 5,302 | 59.0% |
| Cellular Data Only | 1,378 | 15.3% |
| Satellite Internet | 1,139 | 12.7% |
| No Internet | 1,422 | 15.8% |
| Total | 8,982 | 100.0% |
Wyandot County Summary
Wyandot County is located in the north central region of Ohio, and is part of the Toledo Metropolitan Statistical Area. The county was established in 1845 and is named after the Wyandot Native American tribe. As of the 2010 census, the population was 22,615. The county seat is Upper Sandusky.
Geography
Wyandot County is located in the north central region of Ohio, and is part of the Toledo Metropolitan Statistical Area. The county is bordered by Seneca County to the north, Crawford County to the east, Marion County to the south, and Hardin County to the west. The county has a total area of 437 square miles, of which 434 square miles is land and 3 square miles (0.7%) is water. The county is drained by the Sandusky River, which flows through the county from east to west.
The county is mostly flat, with some rolling hills in the northern and eastern parts of the county. The highest point in the county is located in the northwest corner, at an elevation of 1,093 feet above sea level. The county is mostly covered in farmland, with some wooded areas in the northern and eastern parts of the county.
Demographics
As of the 2010 census, there were 22,615 people, 8,845 households, and 6,093 families residing in the county. The population density was 52 people per square mile. There were 9,845 housing units at an average density of 23 per square mile. The racial makeup of the county was 97.3% White, 0.5% African American, 0.3% Native American, 0.2% Asian, 0.2% from other races, and 1.5% from two or more races. Hispanic or Latino of any race were 0.8% of the population.
There were 8,845 households, out of which 32.2% had children under the age of 18 living with them, 54.2% were married couples living together, 10.2% had a female householder with no husband present, and 30.7% were non-families. 26.2% of all households were made up of individuals, and 11.3% had someone living alone who was 65 years of age or older. The average household size was 2.51 and the average family size was 3.02.
The median age in the county was 39.7 years. 25.2% of residents were under the age of 18; 7.7% were between the ages of 18 and 24; 24.2% were from 25 to 44; 27.2% were from 45 to 64; and 15.7% were 65 years of age or older. The gender makeup of the county was 48.7% male and 51.3% female.
Economy
Wyandot County has a diverse economy, with a mix of manufacturing, agriculture, and service industries. The county is home to several manufacturing companies, including Whirlpool Corporation, which has a plant in Upper Sandusky. Other major employers in the county include the Wyandot County Hospital, the Wyandot County Board of Education, and the Wyandot County Sheriff's Office.
Agriculture is also an important part of the county's economy. The county is home to several large farms, and the county's agricultural products include corn, soybeans, wheat, hay, and livestock.
The county also has a thriving tourism industry, with several attractions, including the Wyandot County Historical Society Museum, the Wyandot County Fairgrounds, and the Wyandot County Park. The county is also home to several wineries, including the Wyandot Winery and the Wyandot Cellars.
Conclusion
Wyandot County is a diverse county located in the north central region of Ohio. The county has a population of 22,615, and is home to several manufacturing, agricultural, and service industries. The county also has a thriving tourism industry, with several attractions, wineries, and other attractions.
Common Questions
What is the Total Population of Wyandot County?
Total Population of Wyandot County is 21,818.
What is the Total Male Population of Wyandot County?
Total Male Population of Wyandot County is 10,775.
What is the Total Female Population of Wyandot County?
Total Female Population of Wyandot County is 11,043.
What is the Ratio of Males per 100 Females in Wyandot County?
There are 97.57 Males per 100 Females in Wyandot County.
What is the Ratio of Females per 100 Males in Wyandot County?
There are 102.49 Females per 100 Males in Wyandot County.
What is the Median Population Age in Wyandot County?
Median Population Age in Wyandot County is 42.3 Years.
What is the Average Family Size in Wyandot County
Average Family Size in Wyandot County is 2.9 People.
What is the Average Household Size in Wyandot County
Average Household Size in Wyandot County is 2.4 People.
What is Per Capita Income in Wyandot County?
Per Capita income in Wyandot County is $33,994.
What is the Median Family Income in Wyandot County?
Median Family Income in Wyandot County is $81,466.
What is the Median Household income in Wyandot County?
Median Household Income in Wyandot County is $68,552.
What is Income or Wage Gap in Wyandot County?
Income or Wage Gap in Wyandot County is 32.6%.
Women in Wyandot County earn 67.4 cents for every dollar earned by a man.
What is Inequality or Gini Index in Wyandot County?
Inequality or Gini Index in Wyandot County is 0.40.
How Large is the Labor Force in Wyandot County?
There are 11,286 People in the Labor Forcein in Wyandot County.
What is the Percentage of People in the Labor Force in Wyandot County?
63.6% of People are in the Labor Force in Wyandot County.
What is the Unemployment Rate in Wyandot County?
Unemployment Rate in Wyandot County is 2.8%.