Williams County, OH
Williams County Map
Williams County Overview
36,973
TOTAL POPULATION
18,476
MALE POPULATION
18,497
FEMALE POPULATION
99.89
MALES / 100 FEMALES
100.11
FEMALES / 100 MALES
41.5
MEDIAN AGE
2.9
AVG FAMILY SIZE
2.3
AVG HOUSEHOLD SIZE
$31,189
PER CAPITA INCOME
$74,199
AVG FAMILY INCOME
$60,632
AVG HOUSEHOLD INCOME
34.5%
WAGE / INCOME GAP [ % ]
65.5¢/ $1
WAGE / INCOME GAP [ $ ]
$12,839
FAMILY INCOME DEFICIT
0.40
INEQUALITY / GINI INDEX
18,352
LABOR FORCE [ PEOPLE ]
61.8%
PERCENT IN LABOR FORCE
3.5%
UNEMPLOYMENT RATE
Race in Williams County
The most populous races in Williams County are White / Caucasian (34,432 | 93.1%), Hispanic or Latino (1,861 | 5.0%), and Two or more Races (1,134 | 3.1%).

| Race | # Population | % Population |
| Asian | 210 | 0.6% |
| Black / African American | 431 | 1.2% |
| Hawaiian / Pacific | 17 | 0.1% |
| Hispanic or Latino | 1,861 | 5.0% |
| Native / Alaskan | 96 | 0.3% |
| White / Caucasian | 34,432 | 93.1% |
| Two or more Races | 1,134 | 3.1% |
| Some other Race | 653 | 1.8% |
| Total | 36,973 | 100.0% |
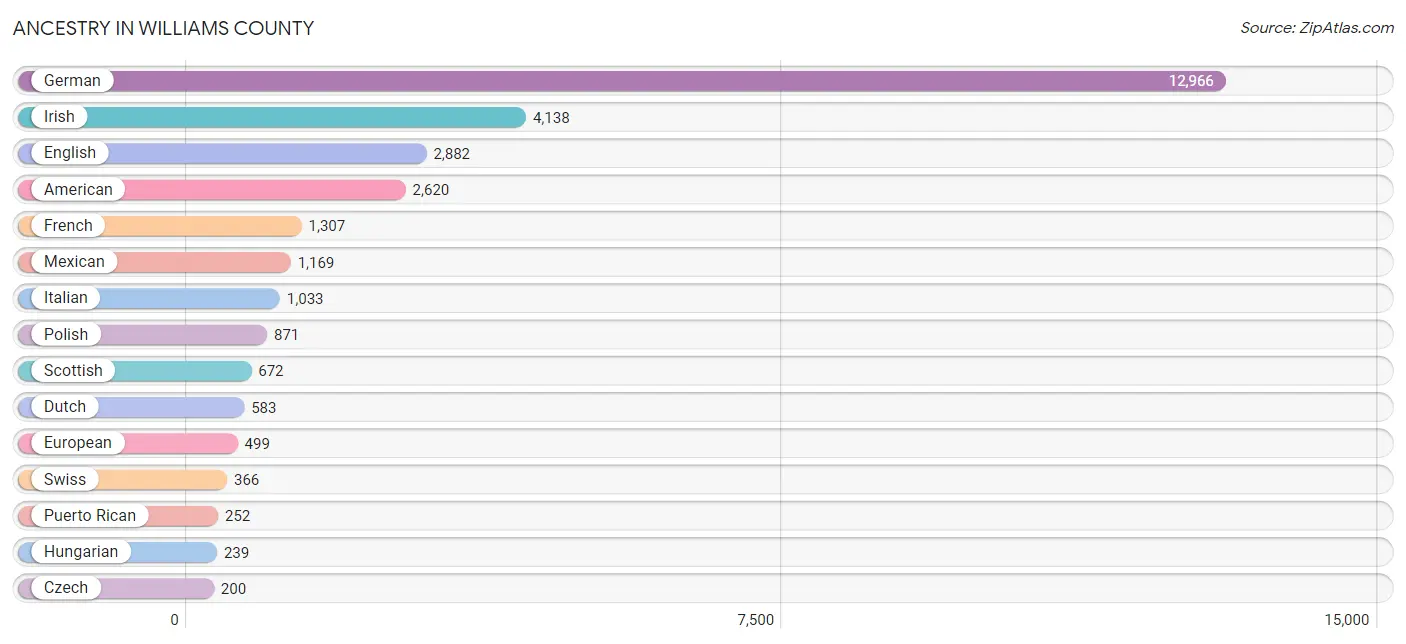
Ancestry in Williams County
The most populous ancestries reported in Williams County are German (12,966 | 35.1%), Irish (4,138 | 11.2%), English (2,882 | 7.8%), American (2,620 | 7.1%), and French (1,307 | 3.5%), together accounting for 64.7% of all Williams County residents.
| Ancestry | # Population | % Population |
| African | 30 | 0.1% |
| American | 2,620 | 7.1% |
| Apache | 31 | 0.1% |
| Arab | 31 | 0.1% |
| Australian | 48 | 0.1% |
| Austrian | 59 | 0.2% |
| Barbadian | 16 | 0.0% |
| Belgian | 93 | 0.3% |
| Bhutanese | 18 | 0.1% |
| Bolivian | 22 | 0.1% |
| British | 79 | 0.2% |
| Burmese | 22 | 0.1% |
| Canadian | 8 | 0.0% |
| Central American | 147 | 0.4% |
| Cherokee | 110 | 0.3% |
| Chippewa | 1 | 0.0% |
| Choctaw | 5 | 0.0% |
| Colombian | 55 | 0.2% |
| Creek | 2 | 0.0% |
| Croatian | 58 | 0.2% |
| Cuban | 17 | 0.1% |
| Czech | 200 | 0.5% |
| Czechoslovakian | 25 | 0.1% |
| Danish | 9 | 0.0% |
| Dutch | 583 | 1.6% |
| English | 2,882 | 7.8% |
| European | 499 | 1.3% |
| Finnish | 2 | 0.0% |
| French | 1,307 | 3.5% |
| French Canadian | 68 | 0.2% |
| German | 12,966 | 35.1% |
| Greek | 116 | 0.3% |
| Guatemalan | 93 | 0.3% |
| Guyanese | 3 | 0.0% |
| Hungarian | 239 | 0.6% |
| Indian (Asian) | 65 | 0.2% |
| Indonesian | 50 | 0.1% |
| Irish | 4,138 | 11.2% |
| Iroquois | 17 | 0.1% |
| Italian | 1,033 | 2.8% |
| Korean | 74 | 0.2% |
| Lebanese | 4 | 0.0% |
| Luxembourger | 9 | 0.0% |
| Menominee | 15 | 0.0% |
| Mexican | 1,169 | 3.2% |
| Mexican American Indian | 19 | 0.1% |
| Mongolian | 7 | 0.0% |
| Moroccan | 9 | 0.0% |
| Native Hawaiian | 12 | 0.0% |
| Nicaraguan | 20 | 0.1% |
| Northern European | 35 | 0.1% |
| Norwegian | 116 | 0.3% |
| Pakistani | 20 | 0.1% |
| Palestinian | 10 | 0.0% |
| Pennsylvania German | 37 | 0.1% |
| Peruvian | 16 | 0.0% |
| Polish | 871 | 2.4% |
| Puerto Rican | 252 | 0.7% |
| Romanian | 88 | 0.2% |
| Russian | 170 | 0.5% |
| Salvadoran | 34 | 0.1% |
| Scandinavian | 46 | 0.1% |
| Scotch-Irish | 196 | 0.5% |
| Scottish | 672 | 1.8% |
| Slovak | 37 | 0.1% |
| Slovene | 101 | 0.3% |
| South African | 9 | 0.0% |
| South American | 93 | 0.3% |
| Spaniard | 22 | 0.1% |
| Spanish | 44 | 0.1% |
| Sri Lankan | 6 | 0.0% |
| Subsaharan African | 39 | 0.1% |
| Swedish | 106 | 0.3% |
| Swiss | 366 | 1.0% |
| Syrian | 8 | 0.0% |
| Ukrainian | 91 | 0.3% |
| Welsh | 199 | 0.5% |
| Yugoslavian | 20 | 0.1% | View All 78 Rows |
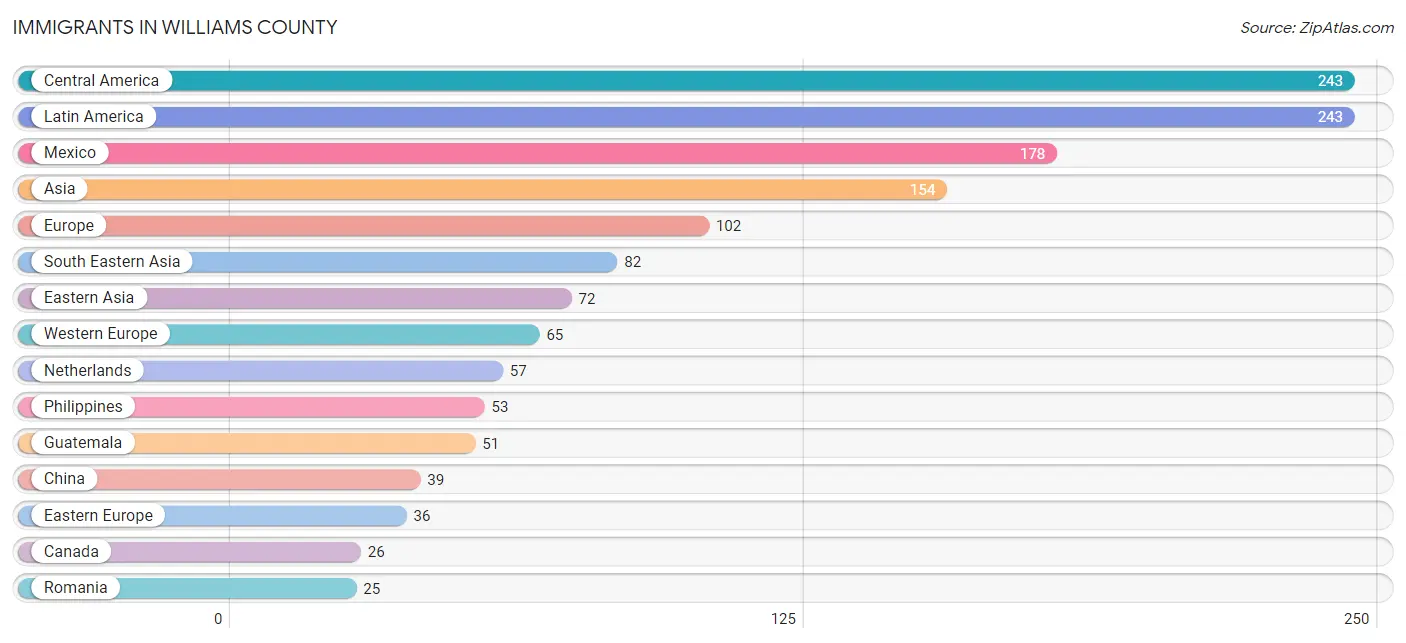
Immigrants in Williams County
The most numerous immigrant groups reported in Williams County came from Central America (243 | 0.7%), Latin America (243 | 0.7%), Mexico (178 | 0.5%), Asia (154 | 0.4%), and Europe (102 | 0.3%), together accounting for 2.5% of all Williams County residents.
| Immigration Origin | # Population | % Population |
| Asia | 154 | 0.4% |
| Canada | 26 | 0.1% |
| Central America | 243 | 0.7% |
| China | 39 | 0.1% |
| Eastern Asia | 72 | 0.2% |
| Eastern Europe | 36 | 0.1% |
| El Salvador | 8 | 0.0% |
| Europe | 102 | 0.3% |
| Germany | 8 | 0.0% |
| Guatemala | 51 | 0.1% |
| Japan | 11 | 0.0% |
| Korea | 22 | 0.1% |
| Latin America | 243 | 0.7% |
| Mexico | 178 | 0.5% |
| Micronesia | 7 | 0.0% |
| Moldova | 11 | 0.0% |
| Netherlands | 57 | 0.2% |
| Nicaragua | 6 | 0.0% |
| Northern Europe | 1 | 0.0% |
| Oceania | 17 | 0.1% |
| Philippines | 53 | 0.1% |
| Romania | 25 | 0.1% |
| Scotland | 1 | 0.0% |
| South Eastern Asia | 82 | 0.2% |
| Thailand | 9 | 0.0% |
| Western Europe | 65 | 0.2% | View All 26 Rows |
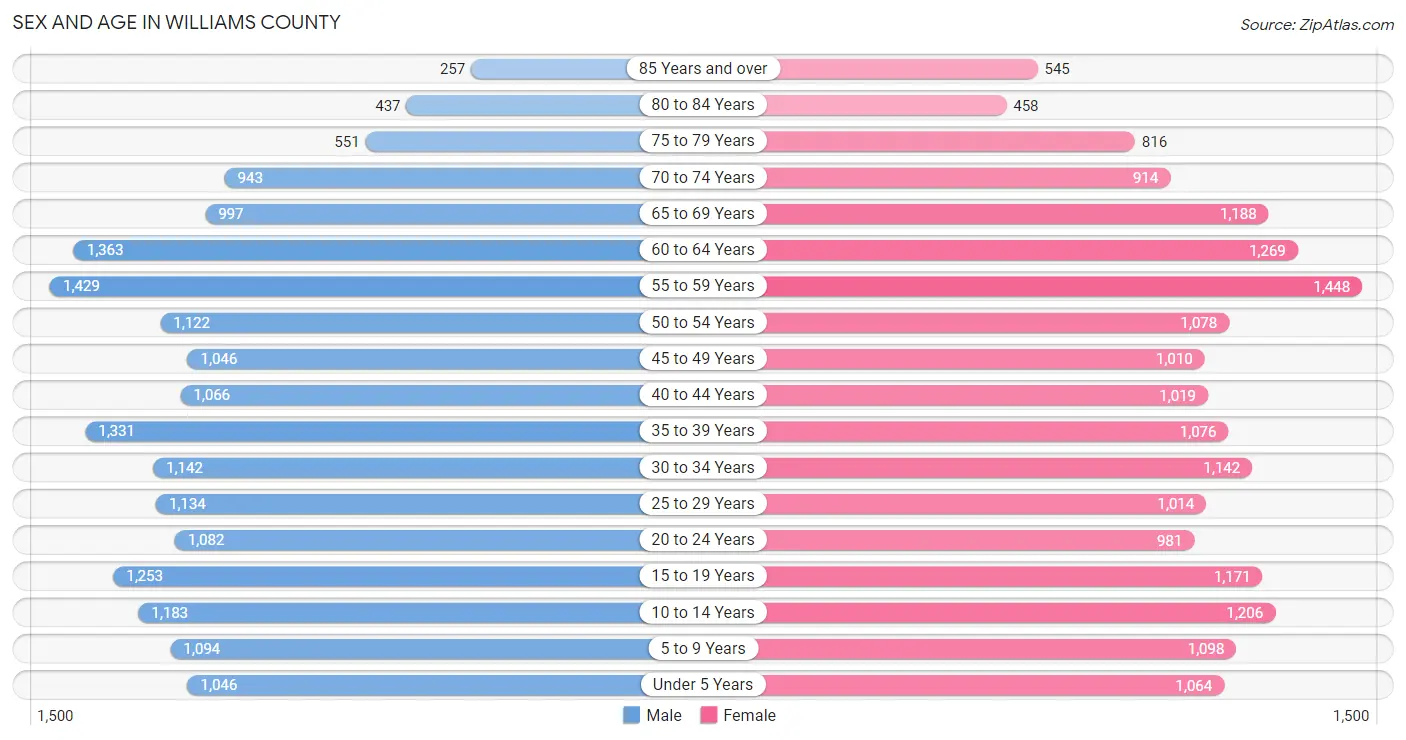
Sex and Age in Williams County
Sex and Age in Williams County
The most populous age groups in Williams County are 55 to 59 Years (1,429 | 7.7%) for men and 55 to 59 Years (1,448 | 7.8%) for women.
| Age Bracket | Male | Female |
| Under 5 Years | 1,046 (5.7%) | 1,064 (5.8%) |
| 5 to 9 Years | 1,094 (5.9%) | 1,098 (5.9%) |
| 10 to 14 Years | 1,183 (6.4%) | 1,206 (6.5%) |
| 15 to 19 Years | 1,253 (6.8%) | 1,171 (6.3%) |
| 20 to 24 Years | 1,082 (5.9%) | 981 (5.3%) |
| 25 to 29 Years | 1,134 (6.1%) | 1,014 (5.5%) |
| 30 to 34 Years | 1,142 (6.2%) | 1,142 (6.2%) |
| 35 to 39 Years | 1,331 (7.2%) | 1,076 (5.8%) |
| 40 to 44 Years | 1,066 (5.8%) | 1,019 (5.5%) |
| 45 to 49 Years | 1,046 (5.7%) | 1,010 (5.5%) |
| 50 to 54 Years | 1,122 (6.1%) | 1,078 (5.8%) |
| 55 to 59 Years | 1,429 (7.7%) | 1,448 (7.8%) |
| 60 to 64 Years | 1,363 (7.4%) | 1,269 (6.9%) |
| 65 to 69 Years | 997 (5.4%) | 1,188 (6.4%) |
| 70 to 74 Years | 943 (5.1%) | 914 (4.9%) |
| 75 to 79 Years | 551 (3.0%) | 816 (4.4%) |
| 80 to 84 Years | 437 (2.4%) | 458 (2.5%) |
| 85 Years and over | 257 (1.4%) | 545 (2.9%) |
| Total | 18,476 (100.0%) | 18,497 (100.0%) |
Families and Households in Williams County
Median Family Size in Williams County
The median family size in Williams County is 2.90 persons per family, with married-couple families (7,206 | 74.7%) accounting for the largest median family size of 3.01 persons per family. On the other hand, single male/father families (870 | 9.0%) represent the smallest median family size with 2.31 persons per family.
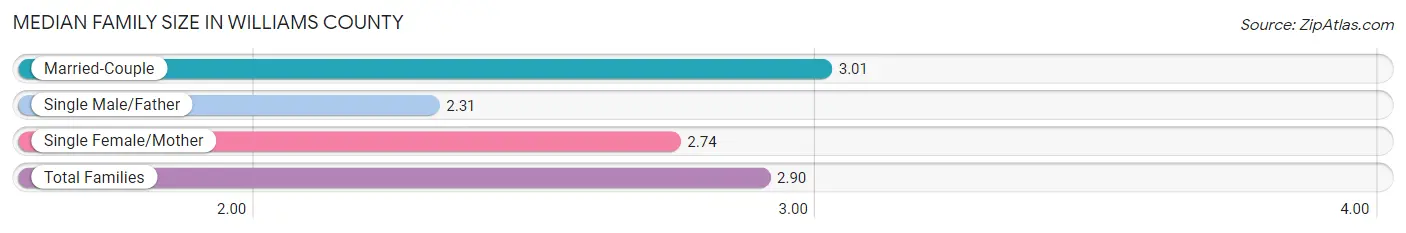
| Family Type | # Families | Family Size |
| Married-Couple | 7,206 (74.7%) | 3.01 |
| Single Male/Father | 870 (9.0%) | 2.31 |
| Single Female/Mother | 1,569 (16.3%) | 2.74 |
| Total Families | 9,645 (100.0%) | 2.90 |
Median Household Size in Williams County
The median household size in Williams County is 2.34 persons per household, with single female/mother households (1,569 | 10.2%) accounting for the largest median household size of 3.06 persons per household. non-family households (5,736 | 37.3%) represent the smallest median household size with 1.22 persons per household.

| Household Type | # Households | Household Size |
| Married-Couple | 7,206 (46.9%) | 3.03 |
| Single Male/Father | 870 (5.7%) | 2.69 |
| Single Female/Mother | 1,569 (10.2%) | 3.06 |
| Non-family | 5,736 (37.3%) | 1.22 |
| Total Households | 15,381 (100.0%) | 2.34 |
Household Size by Marriage Status in Williams County
Out of a total of 15,381 households in Williams County, 9,645 (62.7%) are family households, while 5,736 (37.3%) are nonfamily households. The most numerous type of family households are 2-person households, comprising 4,635, and the most common type of nonfamily households are 1-person households, comprising 4,877.
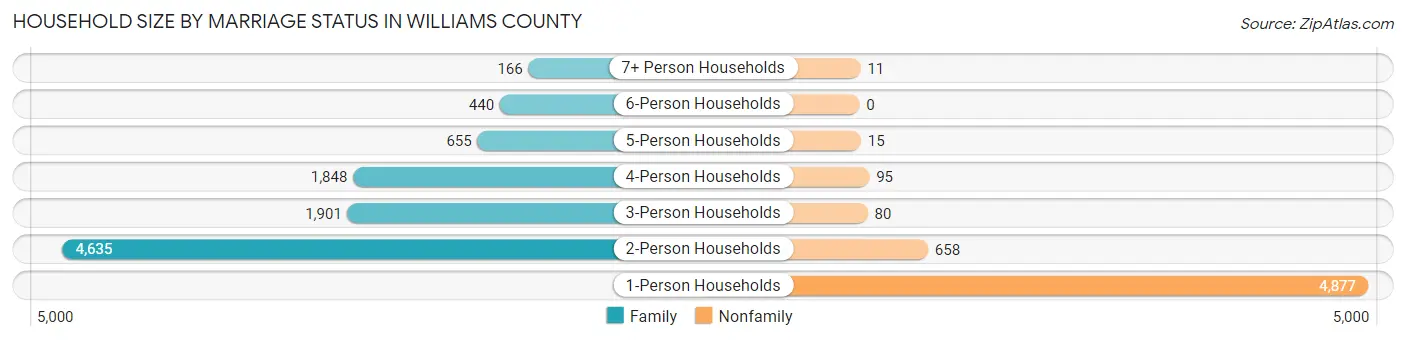
| Household Size | Family Households | Nonfamily Households |
| 1-Person Households | - | 4,877 (31.7%) |
| 2-Person Households | 4,635 (30.1%) | 658 (4.3%) |
| 3-Person Households | 1,901 (12.4%) | 80 (0.5%) |
| 4-Person Households | 1,848 (12.0%) | 95 (0.6%) |
| 5-Person Households | 655 (4.3%) | 15 (0.1%) |
| 6-Person Households | 440 (2.9%) | 0 (0.0%) |
| 7+ Person Households | 166 (1.1%) | 11 (0.1%) |
| Total | 9,645 (62.7%) | 5,736 (37.3%) |
Female Fertility in Williams County
Fertility by Age in Williams County
Average fertility rate in Williams County is 72.0 births per 1,000 women. Women in the age bracket of 20 to 34 years have the highest fertility rate with 141.0 births per 1,000 women. Women in the age bracket of 20 to 34 years acount for 80.7% of all women with births.
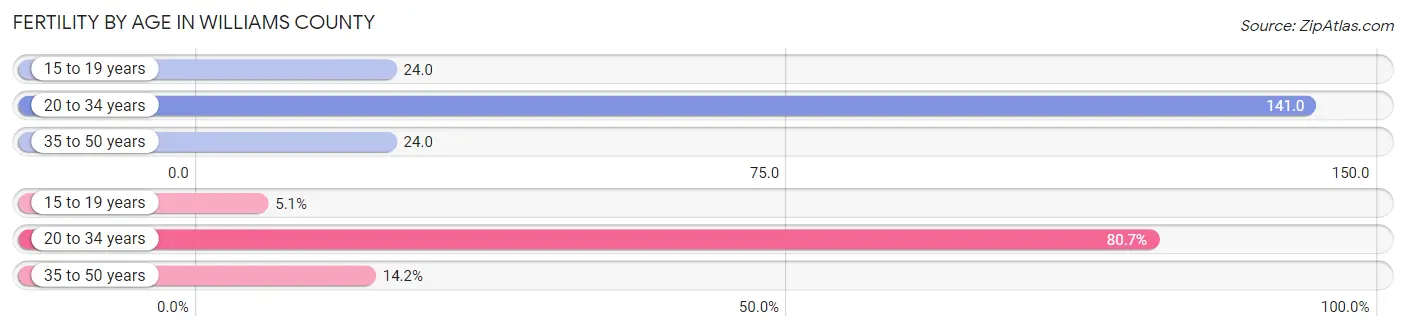
| Age Bracket | Women with Births | Births / 1,000 Women |
| 15 to 19 years | 28 (5.1%) | 24.0 |
| 20 to 34 years | 442 (80.7%) | 141.0 |
| 35 to 50 years | 78 (14.2%) | 24.0 |
| Total | 548 (100.0%) | 72.0 |
Fertility by Age by Marriage Status in Williams County
53.1% of women with births (548) in Williams County are married. The highest percentage of unmarried women with births falls into 15 to 19 years age bracket with 100.0% of them unmarried at the time of birth, while the lowest percentage of unmarried women with births belong to 35 to 50 years age bracket with 10.3% of them unmarried.
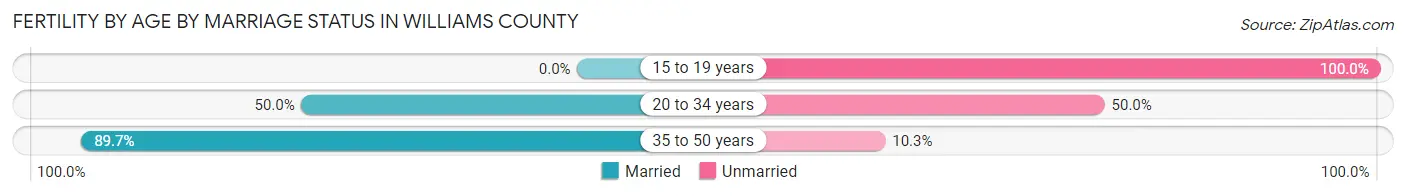
| Age Bracket | Married | Unmarried |
| 15 to 19 years | 0 (0.0%) | 28 (100.0%) |
| 20 to 34 years | 221 (50.0%) | 221 (50.0%) |
| 35 to 50 years | 70 (89.7%) | 8 (10.3%) |
| Total | 291 (53.1%) | 257 (46.9%) |
Fertility by Education in Williams County
Average fertility rate in Williams County is 72.0 births per 1,000 women. Women with the education attainment of bachelor's degree have the highest fertility rate of 118.0 births per 1,000 women, while women with the education attainment of graduate degree have the lowest fertility at 22.0 births per 1,000 women. Women with the education attainment of high school diploma represent 38.3% of all women with births.
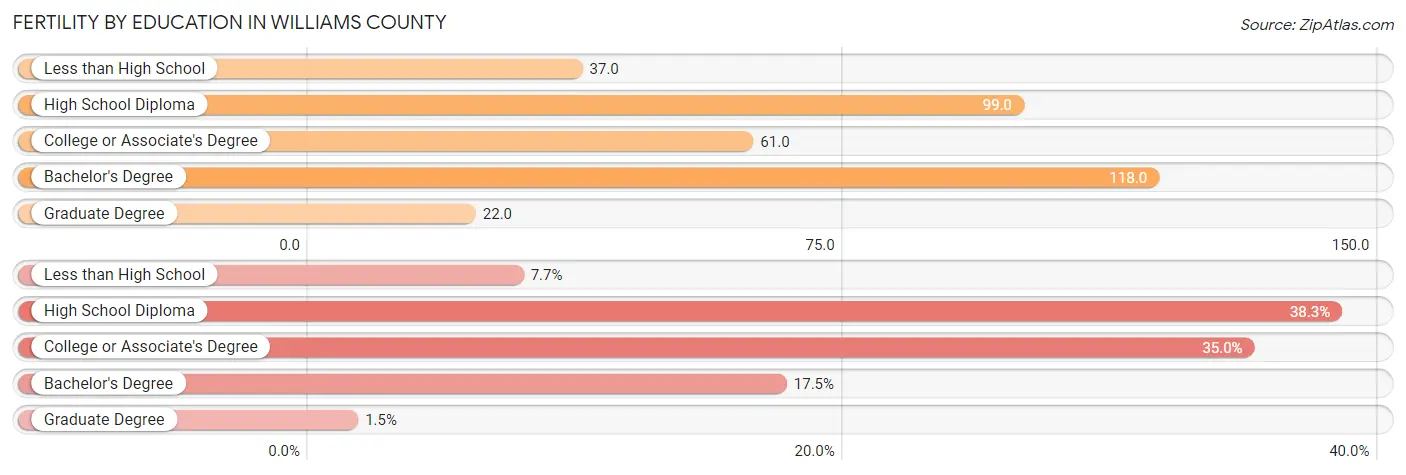
| Educational Attainment | Women with Births | Births / 1,000 Women |
| Less than High School | 42 (7.7%) | 37.0 |
| High School Diploma | 210 (38.3%) | 99.0 |
| College or Associate's Degree | 192 (35.0%) | 61.0 |
| Bachelor's Degree | 96 (17.5%) | 118.0 |
| Graduate Degree | 8 (1.5%) | 22.0 |
| Total | 548 (100.0%) | 72.0 |
Fertility by Education by Marriage Status in Williams County
46.9% of women with births in Williams County are unmarried. Women with the educational attainment of graduate degree are most likely to be married with 100.0% of them married at childbirth, while women with the educational attainment of high school diploma are least likely to be married with 74.3% of them unmarried at childbirth.
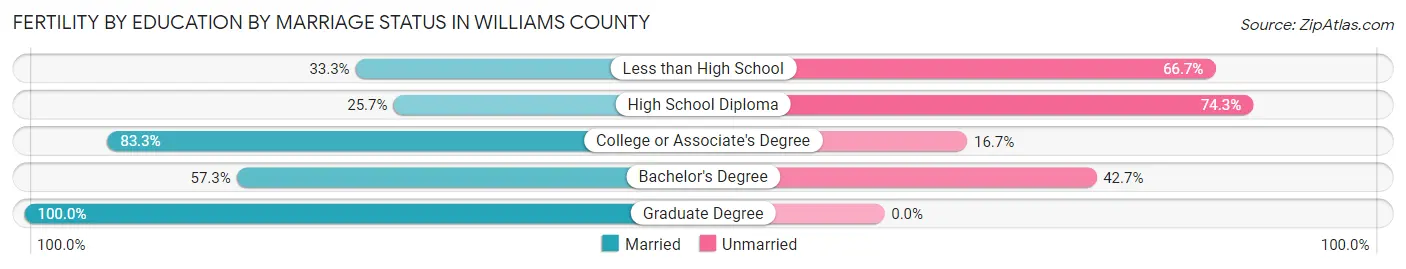
| Educational Attainment | Married | Unmarried |
| Less than High School | 14 (33.3%) | 28 (66.7%) |
| High School Diploma | 54 (25.7%) | 156 (74.3%) |
| College or Associate's Degree | 160 (83.3%) | 32 (16.7%) |
| Bachelor's Degree | 55 (57.3%) | 41 (42.7%) |
| Graduate Degree | 8 (100.0%) | 0 (0.0%) |
| Total | 291 (53.1%) | 257 (46.9%) |
Income in Williams County
Income Overview in Williams County
Per Capita Income in Williams County is $31,189, while median incomes of families and households are $74,199 and $60,632 respectively.
| Characteristic | Number | Measure |
| Per Capita Income | 36,973 | $31,189 |
| Median Family Income | 9,645 | $74,199 |
| Mean Family Income | 9,645 | $83,457 |
| Median Household Income | 15,381 | $60,632 |
| Mean Household Income | 15,381 | $74,139 |
| Income Deficit | 9,645 | $12,839 |
| Wage / Income Gap (%) | 36,973 | 34.52% |
| Wage / Income Gap ($) | 36,973 | 65.48¢ per $1 |
| Gini / Inequality Index | 36,973 | 0.40 |
Earnings by Sex in Williams County
Average Earnings in Williams County are $37,266, $44,053 for men and $28,844 for women, a difference of 34.5%.
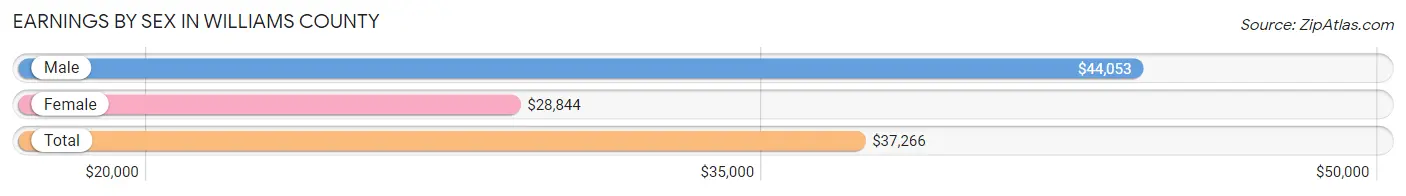
| Sex | Number | Average Earnings |
| Male | 10,306 (52.6%) | $44,053 |
| Female | 9,294 (47.4%) | $28,844 |
| Total | 19,600 (100.0%) | $37,266 |
Earnings by Sex by Income Bracket in Williams County
The most common earnings brackets in Williams County are $75,000 to $99,999 for men (1,123 | 10.9%) and $25,000 to $29,999 for women (1,003 | 10.8%).
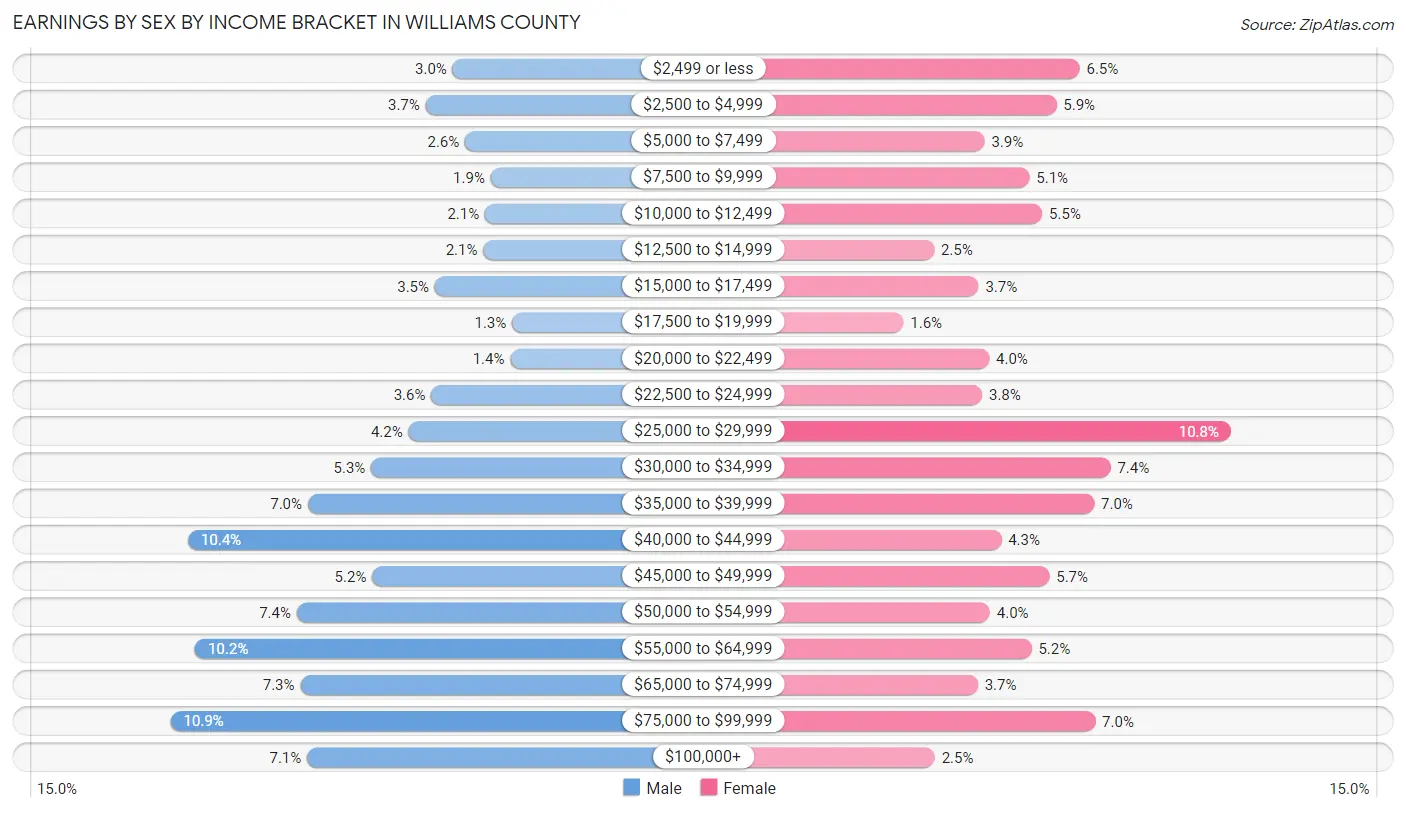
| Income | Male | Female |
| $2,499 or less | 306 (3.0%) | 608 (6.5%) |
| $2,500 to $4,999 | 384 (3.7%) | 547 (5.9%) |
| $5,000 to $7,499 | 270 (2.6%) | 360 (3.9%) |
| $7,500 to $9,999 | 196 (1.9%) | 477 (5.1%) |
| $10,000 to $12,499 | 212 (2.1%) | 510 (5.5%) |
| $12,500 to $14,999 | 217 (2.1%) | 228 (2.5%) |
| $15,000 to $17,499 | 358 (3.5%) | 344 (3.7%) |
| $17,500 to $19,999 | 134 (1.3%) | 148 (1.6%) |
| $20,000 to $22,499 | 139 (1.3%) | 372 (4.0%) |
| $22,500 to $24,999 | 368 (3.6%) | 353 (3.8%) |
| $25,000 to $29,999 | 434 (4.2%) | 1,003 (10.8%) |
| $30,000 to $34,999 | 542 (5.3%) | 689 (7.4%) |
| $35,000 to $39,999 | 726 (7.0%) | 646 (7.0%) |
| $40,000 to $44,999 | 1,073 (10.4%) | 403 (4.3%) |
| $45,000 to $49,999 | 539 (5.2%) | 529 (5.7%) |
| $50,000 to $54,999 | 758 (7.3%) | 374 (4.0%) |
| $55,000 to $64,999 | 1,052 (10.2%) | 482 (5.2%) |
| $65,000 to $74,999 | 747 (7.2%) | 342 (3.7%) |
| $75,000 to $99,999 | 1,123 (10.9%) | 649 (7.0%) |
| $100,000+ | 728 (7.1%) | 230 (2.5%) |
| Total | 10,306 (100.0%) | 9,294 (100.0%) |
Earnings by Sex by Educational Attainment in Williams County
Average earnings in Williams County are $47,404 for men and $32,485 for women, a difference of 31.5%. Men with an educational attainment of graduate degree enjoy the highest average annual earnings of $93,255, while those with less than high school education earn the least with $26,964. Women with an educational attainment of graduate degree earn the most with the average annual earnings of $67,895, while those with less than high school education have the smallest earnings of $23,603.
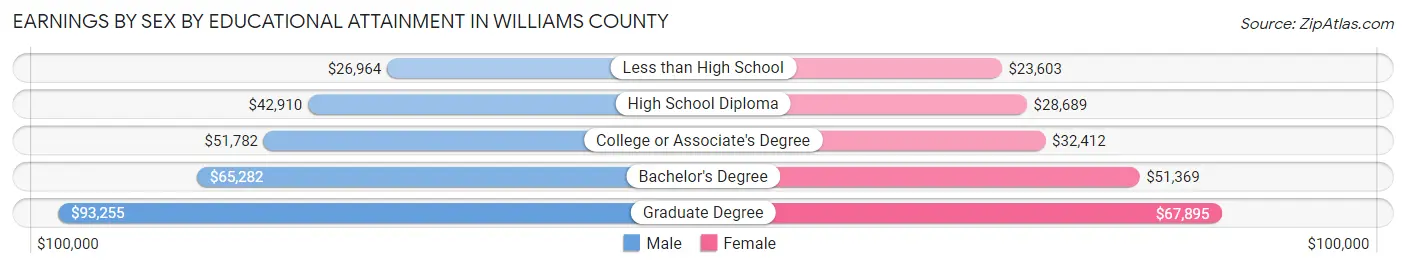
| Educational Attainment | Male Income | Female Income |
| Less than High School | $26,964 | $23,603 |
| High School Diploma | $42,910 | $28,689 |
| College or Associate's Degree | $51,782 | $32,412 |
| Bachelor's Degree | $65,282 | $51,369 |
| Graduate Degree | $93,255 | $67,895 |
| Total | $47,404 | $32,485 |
Family Income in Williams County
Family Income Brackets in Williams County
According to the Williams County family income data, there are 2,160 families falling into the $50,000 to $74,999 income range, which is the most common income bracket and makes up 22.4% of all families. Conversely, the $10,000 to $14,999 income bracket is the least frequent group with only 174 families (1.8%) belonging to this category.
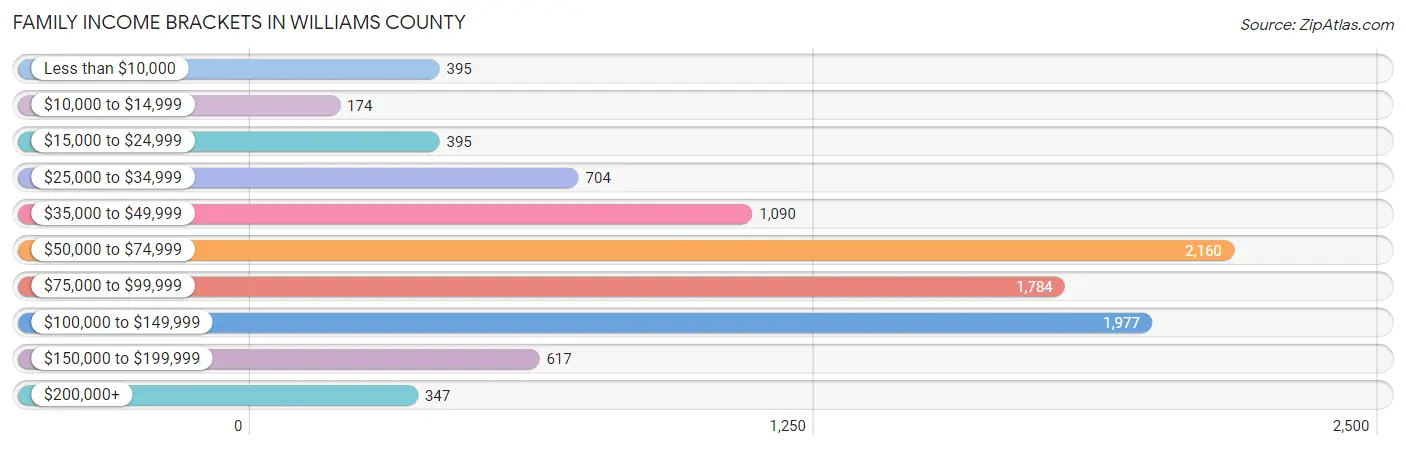
| Income Bracket | # Families | % Families |
| Less than $10,000 | 395 | 4.1% |
| $10,000 to $14,999 | 174 | 1.8% |
| $15,000 to $24,999 | 395 | 4.1% |
| $25,000 to $34,999 | 704 | 7.3% |
| $35,000 to $49,999 | 1,090 | 11.3% |
| $50,000 to $74,999 | 2,160 | 22.4% |
| $75,000 to $99,999 | 1,784 | 18.5% |
| $100,000 to $149,999 | 1,977 | 20.5% |
| $150,000 to $199,999 | 617 | 6.4% |
| $200,000+ | 347 | 3.6% |
Family Income by Famaliy Size in Williams County
5-person families (531 | 5.5%) account for the highest median family income in Williams County with $92,135 per family, while 2-person families (4,920 | 51.0%) have the highest median income of $33,566 per family member.
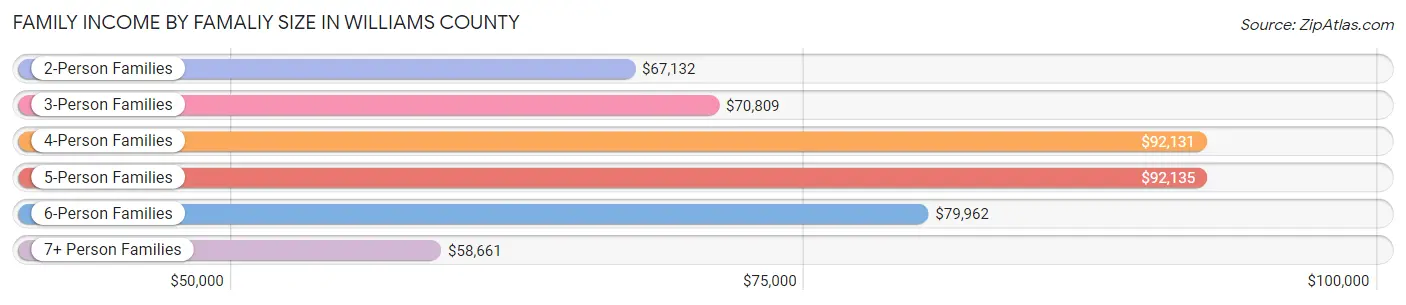
| Income Bracket | # Families | Median Income |
| 2-Person Families | 4,920 (51.0%) | $67,132 |
| 3-Person Families | 1,929 (20.0%) | $70,809 |
| 4-Person Families | 1,733 (18.0%) | $92,131 |
| 5-Person Families | 531 (5.5%) | $92,135 |
| 6-Person Families | 425 (4.4%) | $79,962 |
| 7+ Person Families | 107 (1.1%) | $58,661 |
| Total | 9,645 (100.0%) | $74,199 |
Family Income by Number of Earners in Williams County
The median family income in Williams County is $74,199, with families comprising 3+ earners (1,028) having the highest median family income of $109,906, while families with no earners (1,851) have the lowest median family income of $46,583, accounting for 10.7% and 19.2% of families, respectively.
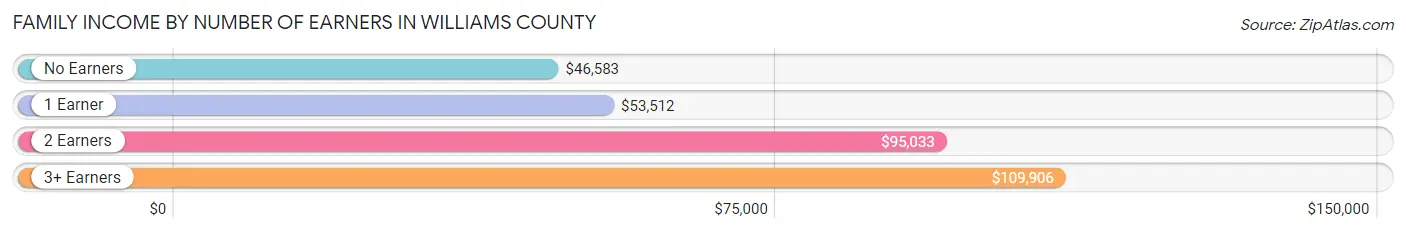
| Number of Earners | # Families | Median Income |
| No Earners | 1,851 (19.2%) | $46,583 |
| 1 Earner | 2,766 (28.7%) | $53,512 |
| 2 Earners | 4,000 (41.5%) | $95,033 |
| 3+ Earners | 1,028 (10.7%) | $109,906 |
| Total | 9,645 (100.0%) | $74,199 |
Household Income in Williams County
Household Income Brackets in Williams County
With 3,353 households falling in the category, the $50,000 to $74,999 income range is the most frequent in Williams County, accounting for 21.8% of all households. In contrast, only 431 households (2.8%) fall into the $200,000+ income bracket, making it the least populous group.
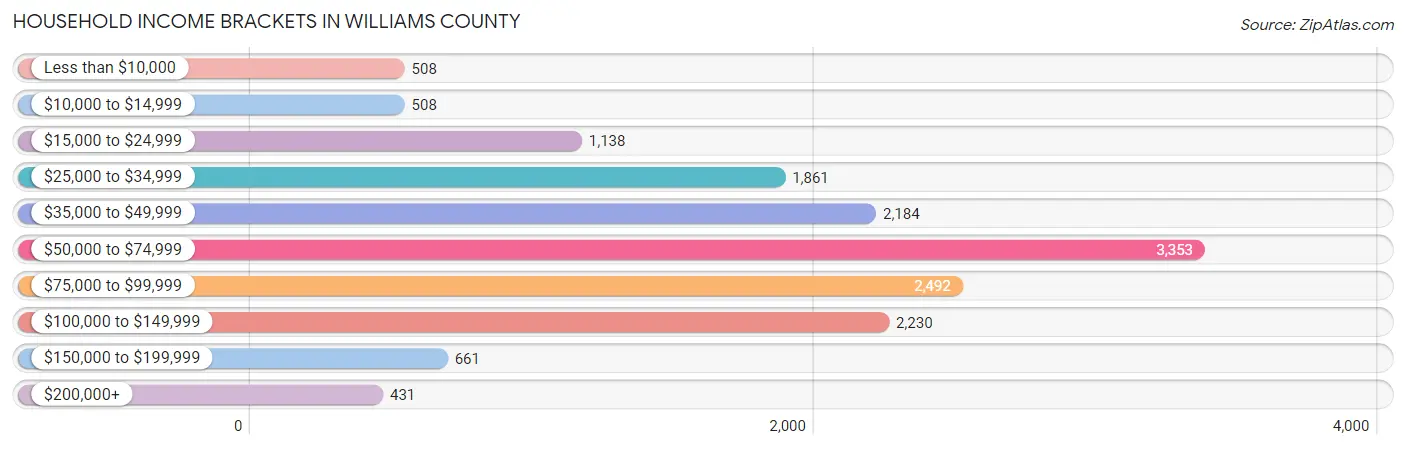
| Income Bracket | # Households | % Households |
| Less than $10,000 | 508 | 3.3% |
| $10,000 to $14,999 | 508 | 3.3% |
| $15,000 to $24,999 | 1,138 | 7.4% |
| $25,000 to $34,999 | 1,861 | 12.1% |
| $35,000 to $49,999 | 2,184 | 14.2% |
| $50,000 to $74,999 | 3,353 | 21.8% |
| $75,000 to $99,999 | 2,492 | 16.2% |
| $100,000 to $149,999 | 2,230 | 14.5% |
| $150,000 to $199,999 | 661 | 4.3% |
| $200,000+ | 431 | 2.8% |
Household Income by Householder Age in Williams County
The median household income in Williams County is $60,632, with the highest median household income of $72,711 found in the 25 to 44 years age bracket for the primary householder. A total of 4,233 households (27.5%) fall into this category. Meanwhile, the 65+ years age bracket for the primary householder has the lowest median household income of $46,581, with 4,579 households (29.8%) in this group.
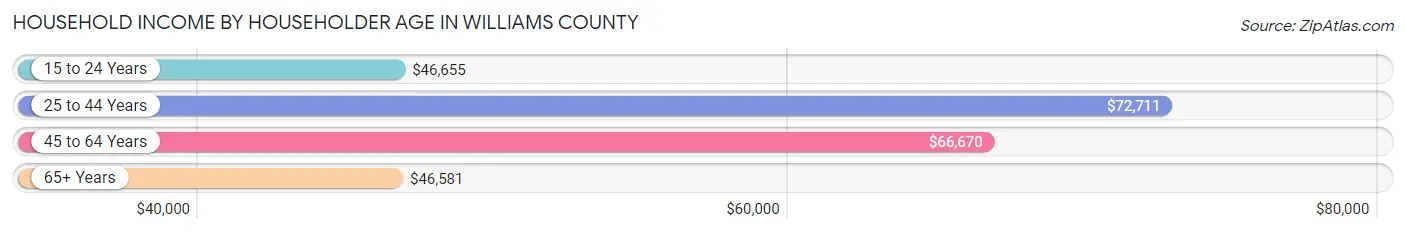
| Income Bracket | # Households | Median Income |
| 15 to 24 Years | 722 (4.7%) | $46,655 |
| 25 to 44 Years | 4,233 (27.5%) | $72,711 |
| 45 to 64 Years | 5,847 (38.0%) | $66,670 |
| 65+ Years | 4,579 (29.8%) | $46,581 |
| Total | 15,381 (100.0%) | $60,632 |
Poverty in Williams County
Income Below Poverty by Sex and Age in Williams County
With 9.4% poverty level for males and 13.0% for females among the residents of Williams County, under 5 year old males and 25 to 34 year old females are the most vulnerable to poverty, with 247 males (24.0%) and 598 females (28.5%) in their respective age groups living below the poverty level.
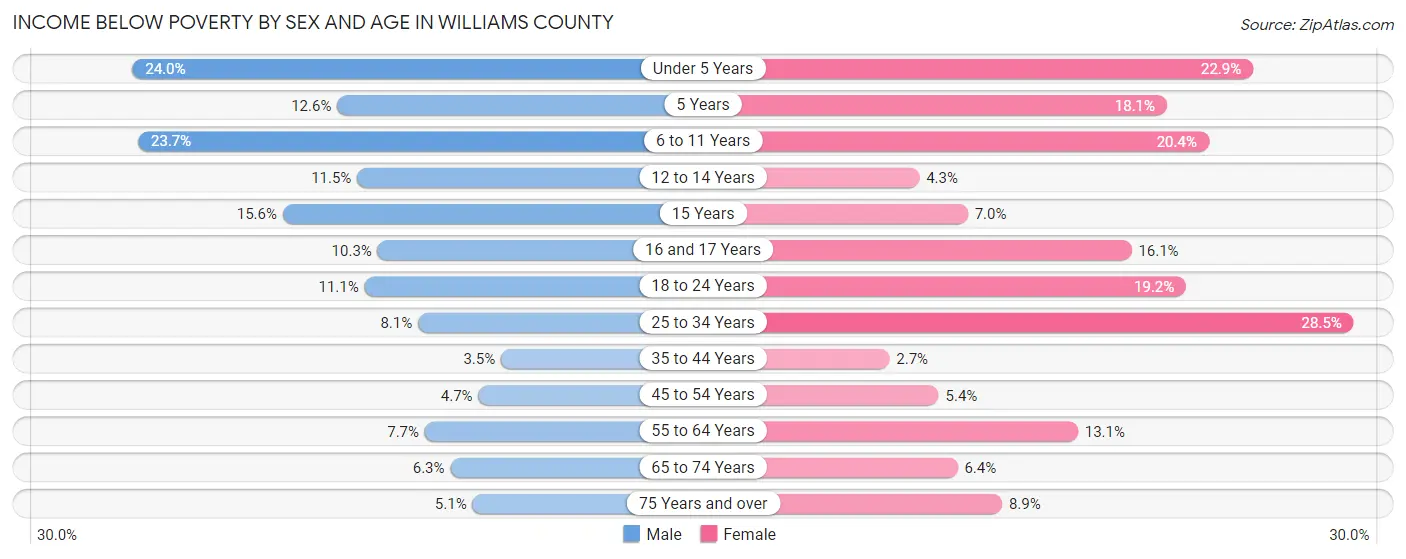
| Age Bracket | Male | Female |
| Under 5 Years | 247 (24.0%) | 240 (22.9%) |
| 5 Years | 17 (12.6%) | 38 (18.1%) |
| 6 to 11 Years | 312 (23.7%) | 266 (20.4%) |
| 12 to 14 Years | 79 (11.5%) | 27 (4.3%) |
| 15 Years | 57 (15.6%) | 15 (7.0%) |
| 16 and 17 Years | 42 (10.3%) | 90 (16.1%) |
| 18 to 24 Years | 168 (11.1%) | 263 (19.2%) |
| 25 to 34 Years | 164 (8.1%) | 598 (28.5%) |
| 35 to 44 Years | 79 (3.5%) | 55 (2.6%) |
| 45 to 54 Years | 99 (4.7%) | 111 (5.4%) |
| 55 to 64 Years | 215 (7.7%) | 351 (13.1%) |
| 65 to 74 Years | 119 (6.3%) | 133 (6.4%) |
| 75 Years and over | 60 (5.1%) | 151 (8.9%) |
| Total | 1,658 (9.4%) | 2,338 (13.0%) |
Income Above Poverty by Sex and Age in Williams County
According to the poverty statistics in Williams County, males aged 35 to 44 years and females aged 35 to 44 years are the age groups that are most secure financially, with 96.5% of males and 97.4% of females in these age groups living above the poverty line.
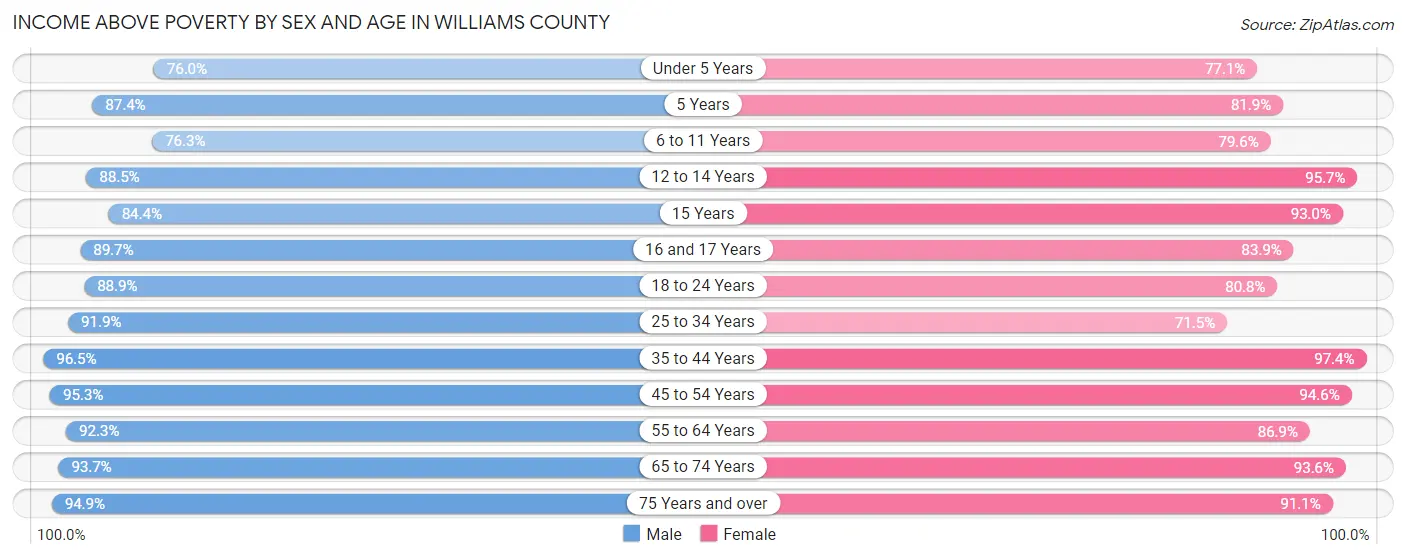
| Age Bracket | Male | Female |
| Under 5 Years | 782 (76.0%) | 808 (77.1%) |
| 5 Years | 118 (87.4%) | 172 (81.9%) |
| 6 to 11 Years | 1,005 (76.3%) | 1,036 (79.6%) |
| 12 to 14 Years | 609 (88.5%) | 599 (95.7%) |
| 15 Years | 308 (84.4%) | 199 (93.0%) |
| 16 and 17 Years | 364 (89.7%) | 468 (83.9%) |
| 18 to 24 Years | 1,350 (88.9%) | 1,109 (80.8%) |
| 25 to 34 Years | 1,862 (91.9%) | 1,500 (71.5%) |
| 35 to 44 Years | 2,200 (96.5%) | 2,022 (97.4%) |
| 45 to 54 Years | 1,992 (95.3%) | 1,950 (94.6%) |
| 55 to 64 Years | 2,573 (92.3%) | 2,320 (86.9%) |
| 65 to 74 Years | 1,774 (93.7%) | 1,933 (93.6%) |
| 75 Years and over | 1,126 (94.9%) | 1,542 (91.1%) |
| Total | 16,063 (90.6%) | 15,658 (87.0%) |
Income Below Poverty Among Married-Couple Families in Williams County
The poverty statistics for married-couple families in Williams County show that 2.5% or 181 of the total 7,206 families live below the poverty line. Families with 5 or more children have the highest poverty rate of 34.0%, comprising of 33 families. On the other hand, families with 1 or 2 children have the lowest poverty rate of 0.2%, which includes 5 families.
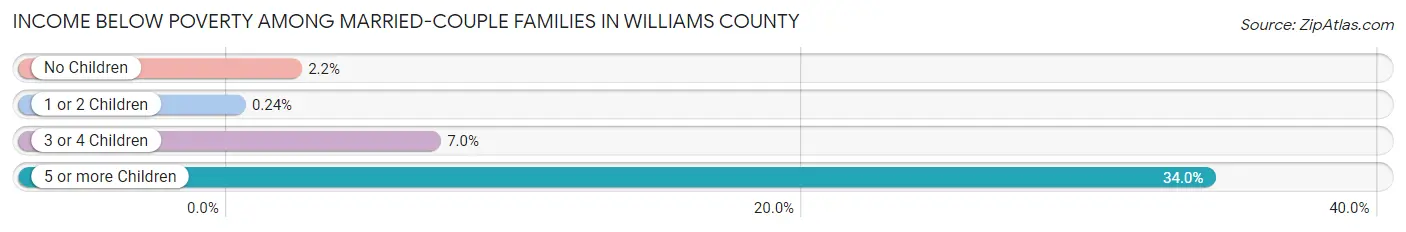
| Children | Above Poverty | Below Poverty |
| No Children | 4,274 (97.8%) | 96 (2.2%) |
| 1 or 2 Children | 2,066 (99.8%) | 5 (0.2%) |
| 3 or 4 Children | 621 (93.0%) | 47 (7.0%) |
| 5 or more Children | 64 (66.0%) | 33 (34.0%) |
| Total | 7,025 (97.5%) | 181 (2.5%) |
Income Below Poverty Among Single-Parent Households in Williams County
According to the poverty data in Williams County, 24.9% or 217 single-father households and 29.0% or 455 single-mother households are living below the poverty line. Among single-father households, those with 5 or more children have the highest poverty rate, with 23 households (100.0%) experiencing poverty. Likewise, among single-mother households, those with 3 or 4 children have the highest poverty rate, with 146 households (57.5%) falling below the poverty line.

| Children | Single Father | Single Mother |
| No Children | 19 (5.7%) | 2 (0.3%) |
| 1 or 2 Children | 173 (34.8%) | 307 (42.6%) |
| 3 or 4 Children | 2 (12.5%) | 146 (57.5%) |
| 5 or more Children | 23 (100.0%) | 0 (0.0%) |
| Total | 217 (24.9%) | 455 (29.0%) |
Income Below Poverty Among Married-Couple vs Single-Parent Households in Williams County
The poverty data for Williams County shows that 181 of the married-couple family households (2.5%) and 672 of the single-parent households (27.6%) are living below the poverty level. Within the married-couple family households, those with 5 or more children have the highest poverty rate, with 33 households (34.0%) falling below the poverty line. Among the single-parent households, those with 5 or more children have the highest poverty rate, with 23 household (100.0%) living below poverty.
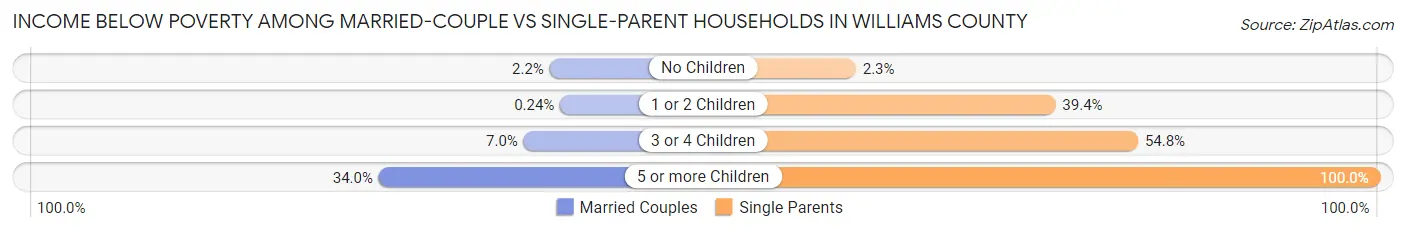
| Children | Married-Couple Families | Single-Parent Households |
| No Children | 96 (2.2%) | 21 (2.3%) |
| 1 or 2 Children | 5 (0.2%) | 480 (39.4%) |
| 3 or 4 Children | 47 (7.0%) | 148 (54.8%) |
| 5 or more Children | 33 (34.0%) | 23 (100.0%) |
| Total | 181 (2.5%) | 672 (27.6%) |
Employment Characteristics in Williams County
Employment by Class of Employer in Williams County
Among the 17,356 employed individuals in Williams County, private company employees (13,286 | 76.5%), local government employees (1,272 | 7.3%), and not-for-profit organizations (1,049 | 6.0%) make up the most common classes of employment.
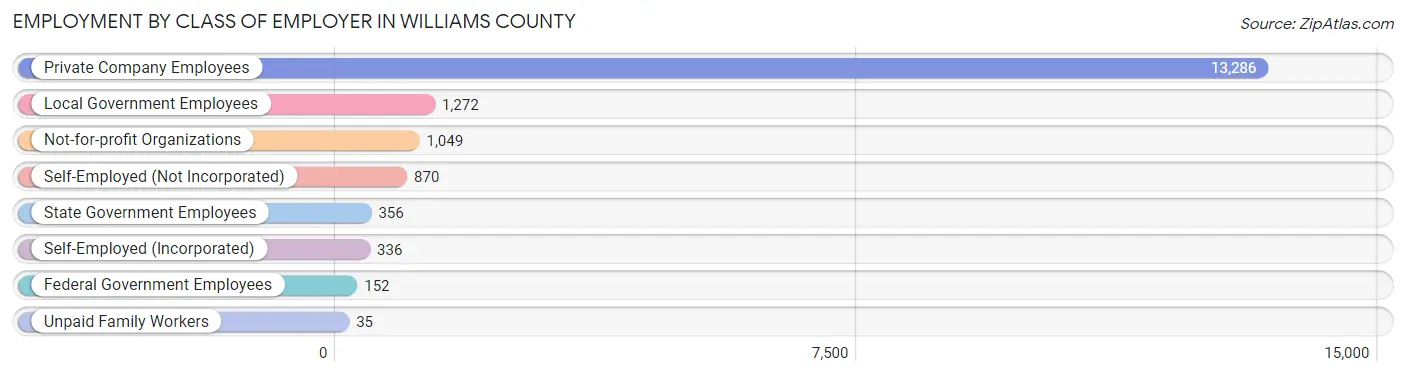
| Employer Class | # Employees | % Employees |
| Private Company Employees | 13,286 | 76.5% |
| Self-Employed (Incorporated) | 336 | 1.9% |
| Self-Employed (Not Incorporated) | 870 | 5.0% |
| Not-for-profit Organizations | 1,049 | 6.0% |
| Local Government Employees | 1,272 | 7.3% |
| State Government Employees | 356 | 2.1% |
| Federal Government Employees | 152 | 0.9% |
| Unpaid Family Workers | 35 | 0.2% |
| Total | 17,356 | 100.0% |
Employment Status by Age in Williams County
According to the labor force statistics for Williams County, out of the total population over 16 years of age (29,695), 61.8% or 18,352 individuals are in the labor force, with 3.5% or 642 of them unemployed. The age group with the highest labor force participation rate is 20 to 24 years, with 88.1% or 1,818 individuals in the labor force. Within the labor force, the 16 to 19 years age range has the highest percentage of unemployed individuals, with 9.6% or 96 of them being unemployed.

| Age Bracket | In Labor Force | Unemployed |
| 16 to 19 Years | 1,005 (54.7%) | 96 (9.6%) |
| 20 to 24 Years | 1,818 (88.1%) | 124 (6.8%) |
| 25 to 29 Years | 1,740 (81.0%) | 108 (6.2%) |
| 30 to 34 Years | 1,731 (75.8%) | 33 (1.9%) |
| 35 to 44 Years | 3,832 (85.3%) | 100 (2.6%) |
| 45 to 54 Years | 3,498 (82.2%) | 49 (1.4%) |
| 55 to 59 Years | 2,071 (72.0%) | 87 (4.2%) |
| 60 to 64 Years | 1,434 (54.5%) | 20 (1.4%) |
| 65 to 74 Years | 1,043 (25.8%) | 18 (1.7%) |
| 75 Years and over | 165 (5.4%) | 9 (5.4%) |
| Total | 18,352 (61.8%) | 642 (3.5%) |
Employment Status by Educational Attainment in Williams County
According to labor force statistics for Williams County, 76.6% of individuals (14,316) out of the total population between 25 and 64 years of age (18,689) are in the labor force, with 2.8% or 401 of them being unemployed. The group with the highest labor force participation rate are those with the educational attainment of bachelor's degree or higher, with 85.7% or 2,446 individuals in the labor force. Within the labor force, individuals with high school diploma education have the highest percentage of unemployment, with 4.4% or 251 of them being unemployed.
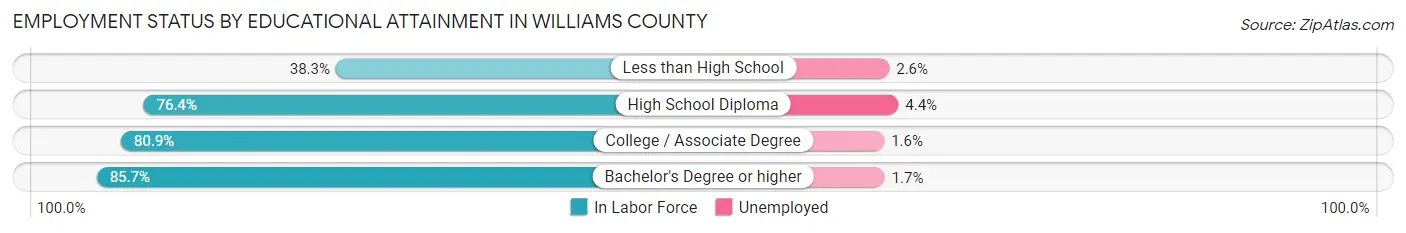
| Educational Attainment | In Labor Force | Unemployed |
| Less than High School | 547 (38.3%) | 37 (2.6%) |
| High School Diploma | 5,712 (76.4%) | 329 (4.4%) |
| College / Associate Degree | 5,608 (80.9%) | 111 (1.6%) |
| Bachelor's Degree or higher | 2,446 (85.7%) | 49 (1.7%) |
| Total | 14,316 (76.6%) | 523 (2.8%) |
Employment Occupations by Sex in Williams County
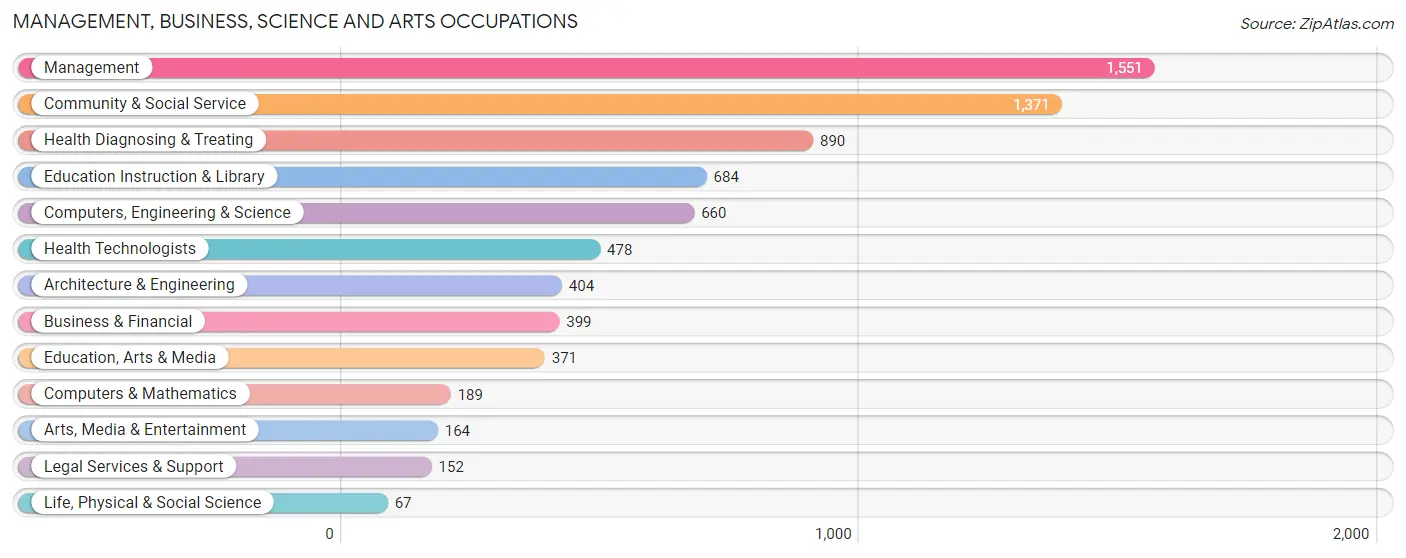
Management, Business, Science and Arts Occupations
The most common Management, Business, Science and Arts occupations in Williams County are Management (1,551 | 8.8%), Community & Social Service (1,371 | 7.7%), Health Diagnosing & Treating (890 | 5.0%), Education Instruction & Library (684 | 3.9%), and Computers, Engineering & Science (660 | 3.7%).
Management, Business, Science and Arts Occupations by Sex
Within the Management, Business, Science and Arts occupations in Williams County, the most male-oriented occupations are Architecture & Engineering (85.6%), Computers & Mathematics (80.4%), and Computers, Engineering & Science (80.1%), while the most female-oriented occupations are Health Technologists (90.2%), Health Diagnosing & Treating (86.1%), and Education Instruction & Library (83.6%).
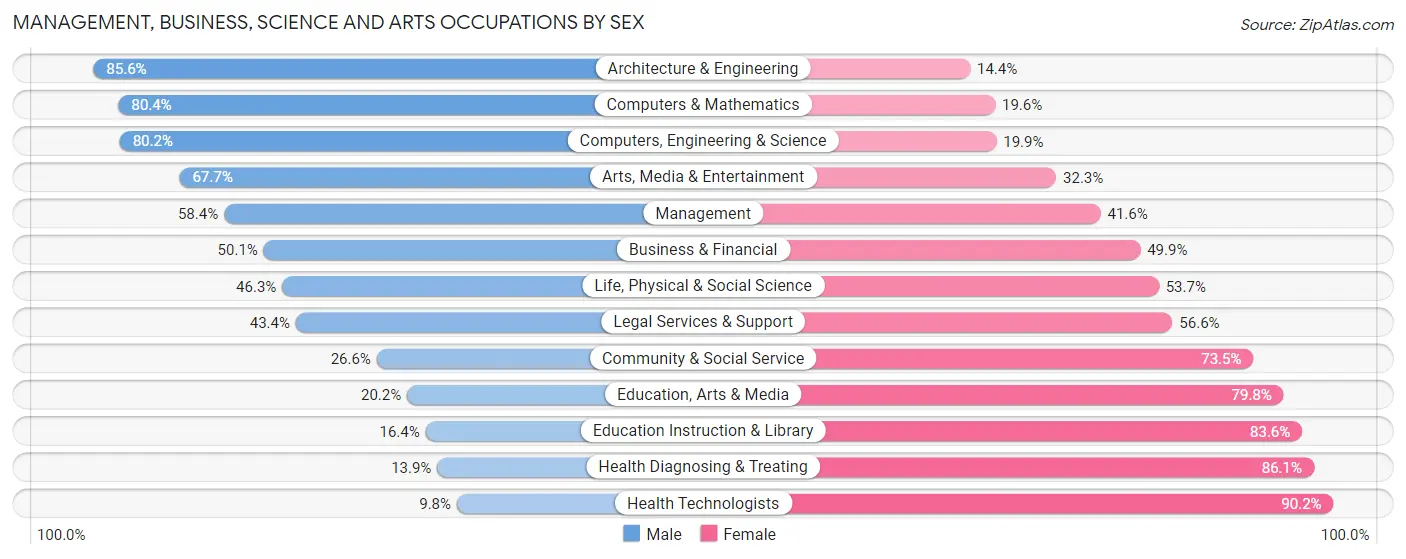
| Occupation | Male | Female |
| Management | 906 (58.4%) | 645 (41.6%) |
| Business & Financial | 200 (50.1%) | 199 (49.9%) |
| Computers, Engineering & Science | 529 (80.1%) | 131 (19.9%) |
| Computers & Mathematics | 152 (80.4%) | 37 (19.6%) |
| Architecture & Engineering | 346 (85.6%) | 58 (14.4%) |
| Life, Physical & Social Science | 31 (46.3%) | 36 (53.7%) |
| Community & Social Service | 364 (26.6%) | 1,007 (73.5%) |
| Education, Arts & Media | 75 (20.2%) | 296 (79.8%) |
| Legal Services & Support | 66 (43.4%) | 86 (56.6%) |
| Education Instruction & Library | 112 (16.4%) | 572 (83.6%) |
| Arts, Media & Entertainment | 111 (67.7%) | 53 (32.3%) |
| Health Diagnosing & Treating | 124 (13.9%) | 766 (86.1%) |
| Health Technologists | 47 (9.8%) | 431 (90.2%) |
| Total (Category) | 2,123 (43.6%) | 2,748 (56.4%) |
| Total (Overall) | 9,340 (52.8%) | 8,349 (47.2%) |
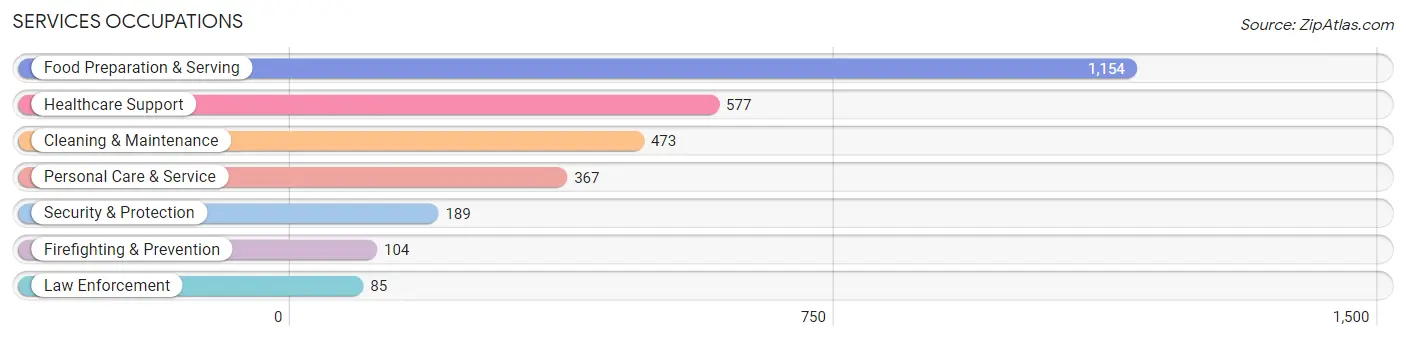
Services Occupations
The most common Services occupations in Williams County are Food Preparation & Serving (1,154 | 6.5%), Healthcare Support (577 | 3.3%), Cleaning & Maintenance (473 | 2.7%), Personal Care & Service (367 | 2.1%), and Security & Protection (189 | 1.1%).
Services Occupations by Sex
Within the Services occupations in Williams County, the most male-oriented occupations are Law Enforcement (94.1%), Security & Protection (72.0%), and Cleaning & Maintenance (57.3%), while the most female-oriented occupations are Personal Care & Service (85.8%), Healthcare Support (84.1%), and Food Preparation & Serving (74.4%).
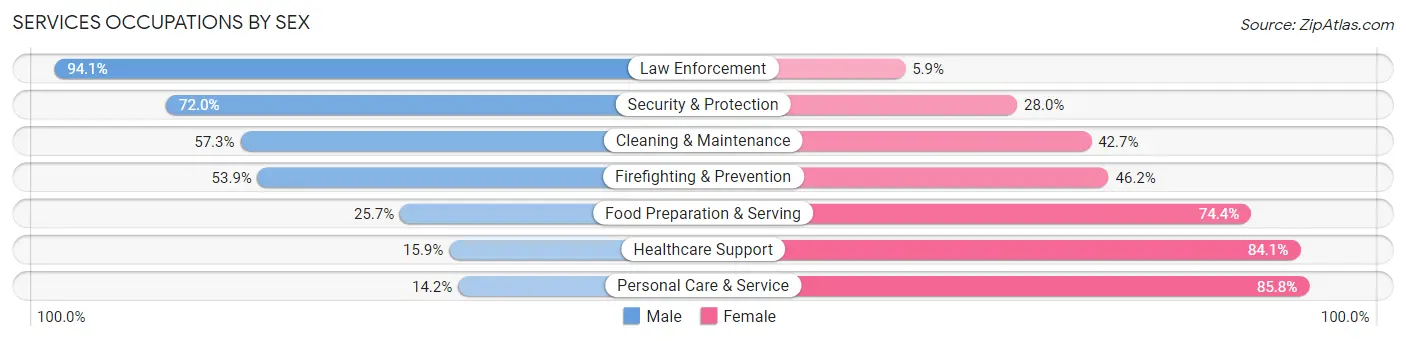
| Occupation | Male | Female |
| Healthcare Support | 92 (15.9%) | 485 (84.1%) |
| Security & Protection | 136 (72.0%) | 53 (28.0%) |
| Firefighting & Prevention | 56 (53.8%) | 48 (46.2%) |
| Law Enforcement | 80 (94.1%) | 5 (5.9%) |
| Food Preparation & Serving | 296 (25.7%) | 858 (74.4%) |
| Cleaning & Maintenance | 271 (57.3%) | 202 (42.7%) |
| Personal Care & Service | 52 (14.2%) | 315 (85.8%) |
| Total (Category) | 847 (30.7%) | 1,913 (69.3%) |
| Total (Overall) | 9,340 (52.8%) | 8,349 (47.2%) |
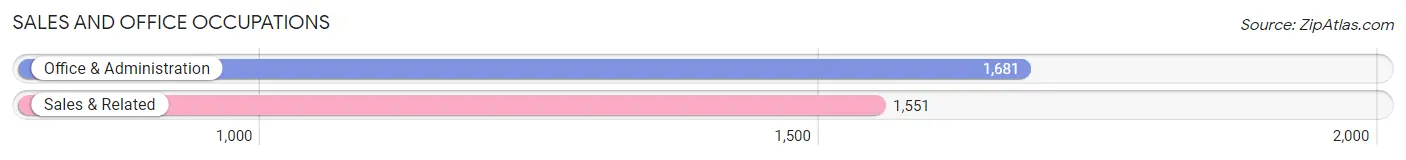
Sales and Office Occupations
The most common Sales and Office occupations in Williams County are Office & Administration (1,681 | 9.5%), and Sales & Related (1,551 | 8.8%).
Sales and Office Occupations by Sex
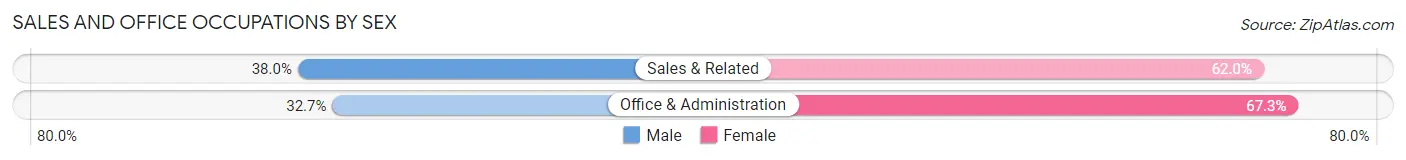
| Occupation | Male | Female |
| Sales & Related | 589 (38.0%) | 962 (62.0%) |
| Office & Administration | 549 (32.7%) | 1,132 (67.3%) |
| Total (Category) | 1,138 (35.2%) | 2,094 (64.8%) |
| Total (Overall) | 9,340 (52.8%) | 8,349 (47.2%) |
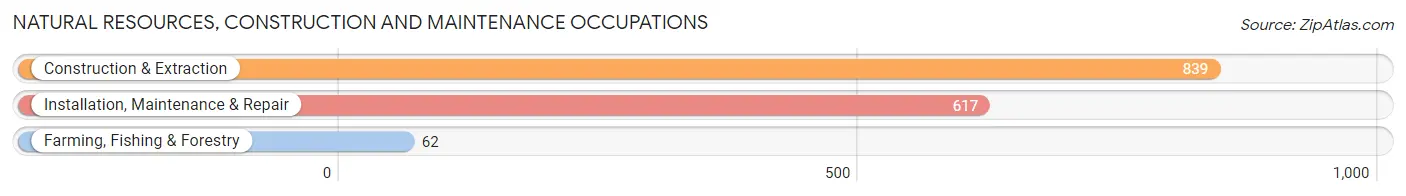
Natural Resources, Construction and Maintenance Occupations
The most common Natural Resources, Construction and Maintenance occupations in Williams County are Construction & Extraction (839 | 4.7%), Installation, Maintenance & Repair (617 | 3.5%), and Farming, Fishing & Forestry (62 | 0.4%).
Natural Resources, Construction and Maintenance Occupations by Sex
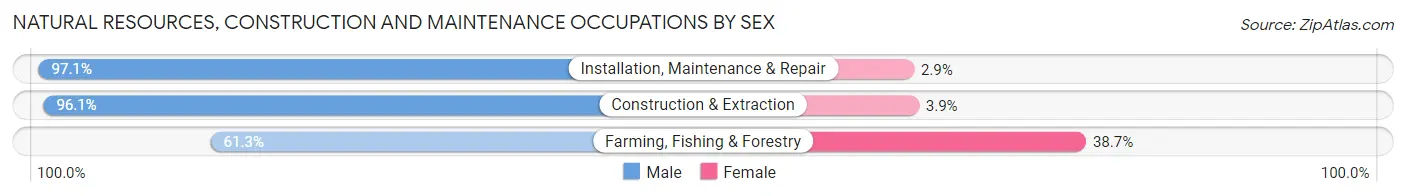
| Occupation | Male | Female |
| Farming, Fishing & Forestry | 38 (61.3%) | 24 (38.7%) |
| Construction & Extraction | 806 (96.1%) | 33 (3.9%) |
| Installation, Maintenance & Repair | 599 (97.1%) | 18 (2.9%) |
| Total (Category) | 1,443 (95.1%) | 75 (4.9%) |
| Total (Overall) | 9,340 (52.8%) | 8,349 (47.2%) |
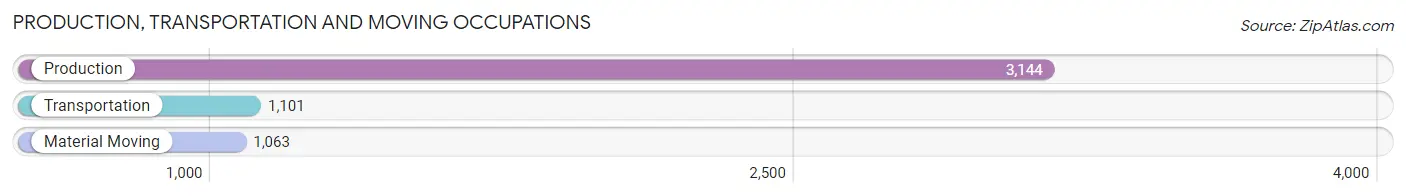
Production, Transportation and Moving Occupations
The most common Production, Transportation and Moving occupations in Williams County are Production (3,144 | 17.8%), Transportation (1,101 | 6.2%), and Material Moving (1,063 | 6.0%).
Production, Transportation and Moving Occupations by Sex
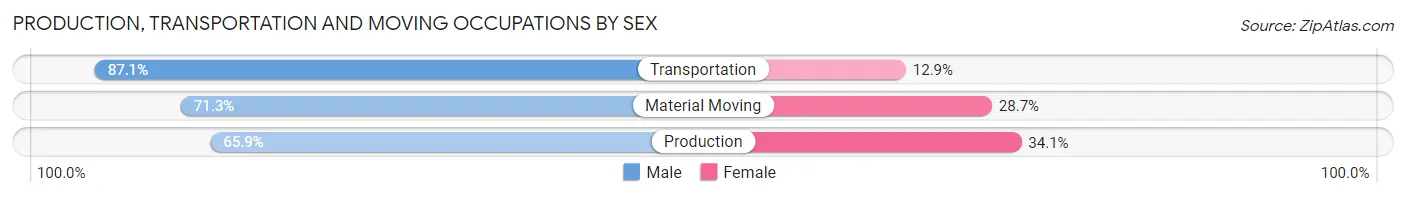
| Occupation | Male | Female |
| Production | 2,072 (65.9%) | 1,072 (34.1%) |
| Transportation | 959 (87.1%) | 142 (12.9%) |
| Material Moving | 758 (71.3%) | 305 (28.7%) |
| Total (Category) | 3,789 (71.4%) | 1,519 (28.6%) |
| Total (Overall) | 9,340 (52.8%) | 8,349 (47.2%) |
Employment Industries by Sex in Williams County
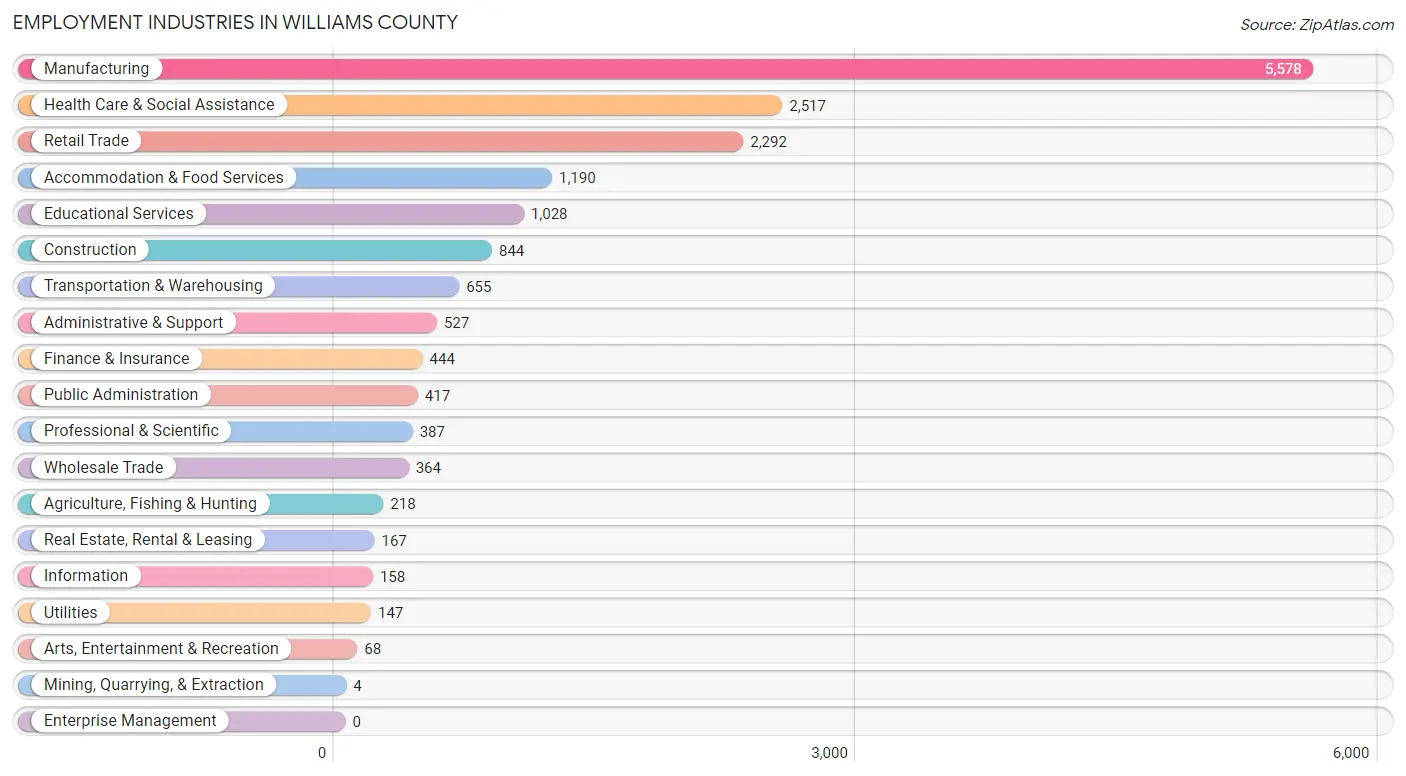
Employment Industries in Williams County
The major employment industries in Williams County include Manufacturing (5,578 | 31.5%), Health Care & Social Assistance (2,517 | 14.2%), Retail Trade (2,292 | 13.0%), Accommodation & Food Services (1,190 | 6.7%), and Educational Services (1,028 | 5.8%).
Employment Industries by Sex in Williams County
The Williams County industries that see more men than women are Mining, Quarrying, & Extraction (100.0%), Construction (95.5%), and Utilities (92.5%), whereas the industries that tend to have a higher number of women are Finance & Insurance (79.9%), Educational Services (78.8%), and Health Care & Social Assistance (77.7%).
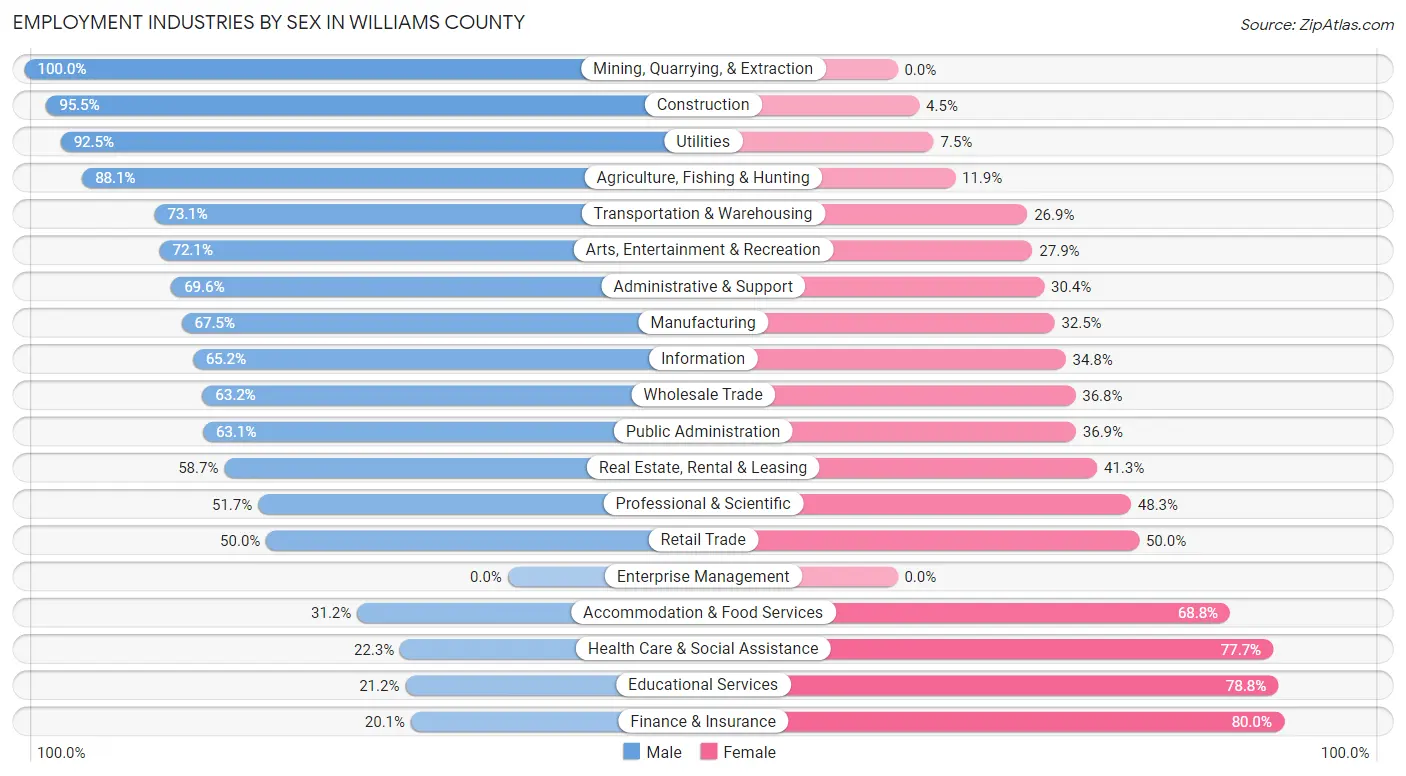
| Industry | Male | Female |
| Agriculture, Fishing & Hunting | 192 (88.1%) | 26 (11.9%) |
| Mining, Quarrying, & Extraction | 4 (100.0%) | 0 (0.0%) |
| Construction | 806 (95.5%) | 38 (4.5%) |
| Manufacturing | 3,765 (67.5%) | 1,813 (32.5%) |
| Wholesale Trade | 230 (63.2%) | 134 (36.8%) |
| Retail Trade | 1,146 (50.0%) | 1,146 (50.0%) |
| Transportation & Warehousing | 479 (73.1%) | 176 (26.9%) |
| Utilities | 136 (92.5%) | 11 (7.5%) |
| Information | 103 (65.2%) | 55 (34.8%) |
| Finance & Insurance | 89 (20.1%) | 355 (79.9%) |
| Real Estate, Rental & Leasing | 98 (58.7%) | 69 (41.3%) |
| Professional & Scientific | 200 (51.7%) | 187 (48.3%) |
| Enterprise Management | 0 (0.0%) | 0 (0.0%) |
| Administrative & Support | 367 (69.6%) | 160 (30.4%) |
| Educational Services | 218 (21.2%) | 810 (78.8%) |
| Health Care & Social Assistance | 561 (22.3%) | 1,956 (77.7%) |
| Arts, Entertainment & Recreation | 49 (72.1%) | 19 (27.9%) |
| Accommodation & Food Services | 371 (31.2%) | 819 (68.8%) |
| Public Administration | 263 (63.1%) | 154 (36.9%) |
| Total | 9,340 (52.8%) | 8,349 (47.2%) |
Education in Williams County
School Enrollment in Williams County
The most common levels of schooling among the 7,924 students in Williams County are high school (2,045 | 25.8%), middle school (1,816 | 22.9%), and elementary school (1,762 | 22.2%).
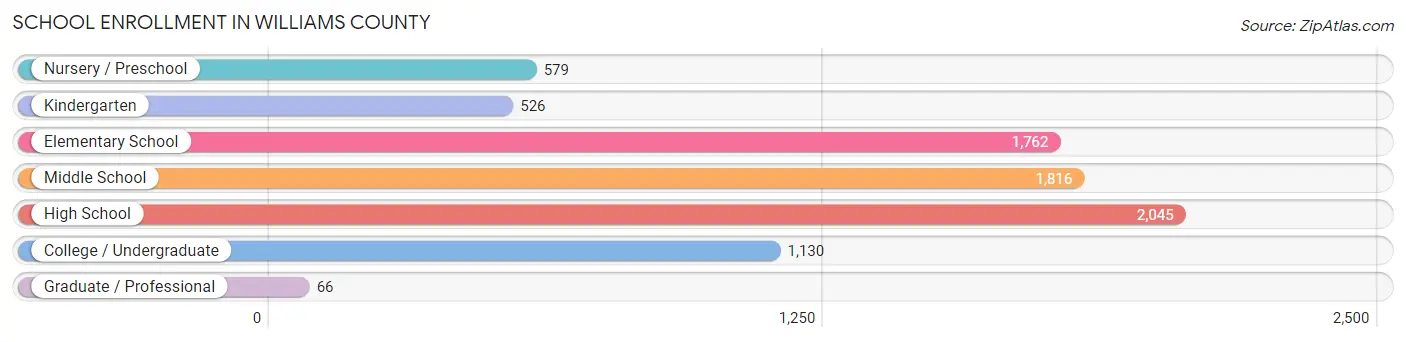
| School Level | # Students | % Students |
| Nursery / Preschool | 579 | 7.3% |
| Kindergarten | 526 | 6.6% |
| Elementary School | 1,762 | 22.2% |
| Middle School | 1,816 | 22.9% |
| High School | 2,045 | 25.8% |
| College / Undergraduate | 1,130 | 14.3% |
| Graduate / Professional | 66 | 0.8% |
| Total | 7,924 | 100.0% |
School Enrollment by Age by Funding Source in Williams County
Out of a total of 7,924 students who are enrolled in schools in Williams County, 1,109 (14.0%) attend a private institution, while the remaining 6,815 (86.0%) are enrolled in public schools. The age group of 20 to 24 year olds has the highest likelihood of being enrolled in private schools, with 78 (24.9% in the age bracket) enrolled. Conversely, the age group of 18 to 19 year olds has the lowest likelihood of being enrolled in a private school, with 458 (94.8% in the age bracket) attending a public institution.
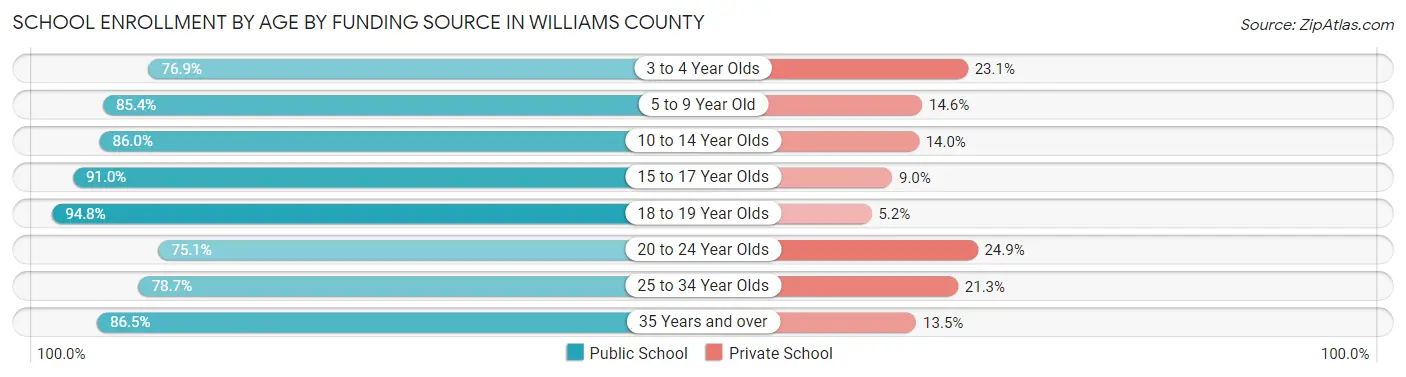
| Age Bracket | Public School | Private School |
| 3 to 4 Year Olds | 326 (76.9%) | 98 (23.1%) |
| 5 to 9 Year Old | 1,773 (85.4%) | 303 (14.6%) |
| 10 to 14 Year Olds | 2,045 (86.0%) | 332 (14.0%) |
| 15 to 17 Year Olds | 1,384 (91.0%) | 137 (9.0%) |
| 18 to 19 Year Olds | 458 (94.8%) | 25 (5.2%) |
| 20 to 24 Year Olds | 235 (75.1%) | 78 (24.9%) |
| 25 to 34 Year Olds | 359 (78.7%) | 97 (21.3%) |
| 35 Years and over | 237 (86.5%) | 37 (13.5%) |
| Total | 6,815 (86.0%) | 1,109 (14.0%) |
Educational Attainment by Field of Study in Williams County
Education (1,059 | 27.2%), business (848 | 21.8%), science & technology (440 | 11.3%), engineering (275 | 7.1%), and arts & humanities (267 | 6.9%) are the most common fields of study among 3,893 individuals in Williams County who have obtained a bachelor's degree or higher.
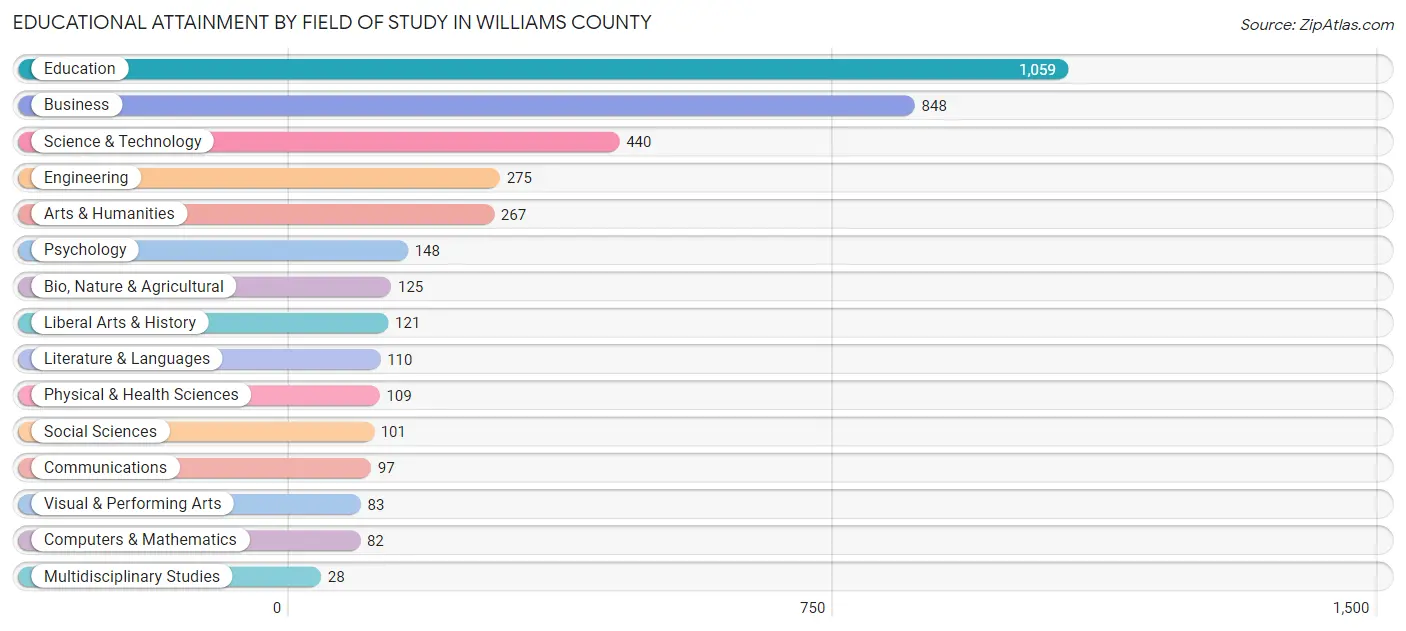
| Field of Study | # Graduates | % Graduates |
| Computers & Mathematics | 82 | 2.1% |
| Bio, Nature & Agricultural | 125 | 3.2% |
| Physical & Health Sciences | 109 | 2.8% |
| Psychology | 148 | 3.8% |
| Social Sciences | 101 | 2.6% |
| Engineering | 275 | 7.1% |
| Multidisciplinary Studies | 28 | 0.7% |
| Science & Technology | 440 | 11.3% |
| Business | 848 | 21.8% |
| Education | 1,059 | 27.2% |
| Literature & Languages | 110 | 2.8% |
| Liberal Arts & History | 121 | 3.1% |
| Visual & Performing Arts | 83 | 2.1% |
| Communications | 97 | 2.5% |
| Arts & Humanities | 267 | 6.9% |
| Total | 3,893 | 100.0% |
Transportation & Commute in Williams County
Vehicle Availability by Sex in Williams County
The most prevalent vehicle ownership categories in Williams County are males with 2 vehicles (3,871, accounting for 42.1%) and females with 2 vehicles (3,396, making up 47.6%).

| Vehicles Available | Male | Female |
| No Vehicle | 265 (2.9%) | 242 (3.0%) |
| 1 Vehicle | 1,345 (14.6%) | 1,660 (20.4%) |
| 2 Vehicles | 3,871 (42.1%) | 3,396 (41.7%) |
| 3 Vehicles | 2,387 (26.0%) | 1,767 (21.7%) |
| 4 Vehicles | 861 (9.4%) | 581 (7.1%) |
| 5 or more Vehicles | 470 (5.1%) | 494 (6.1%) |
| Total | 9,199 (100.0%) | 8,140 (100.0%) |
Commute Time in Williams County
The most frequently occuring commute durations in Williams County are 5 to 9 minutes (3,699 commuters, 21.8%), 10 to 14 minutes (2,745 commuters, 16.2%), and 15 to 19 minutes (2,687 commuters, 15.8%).
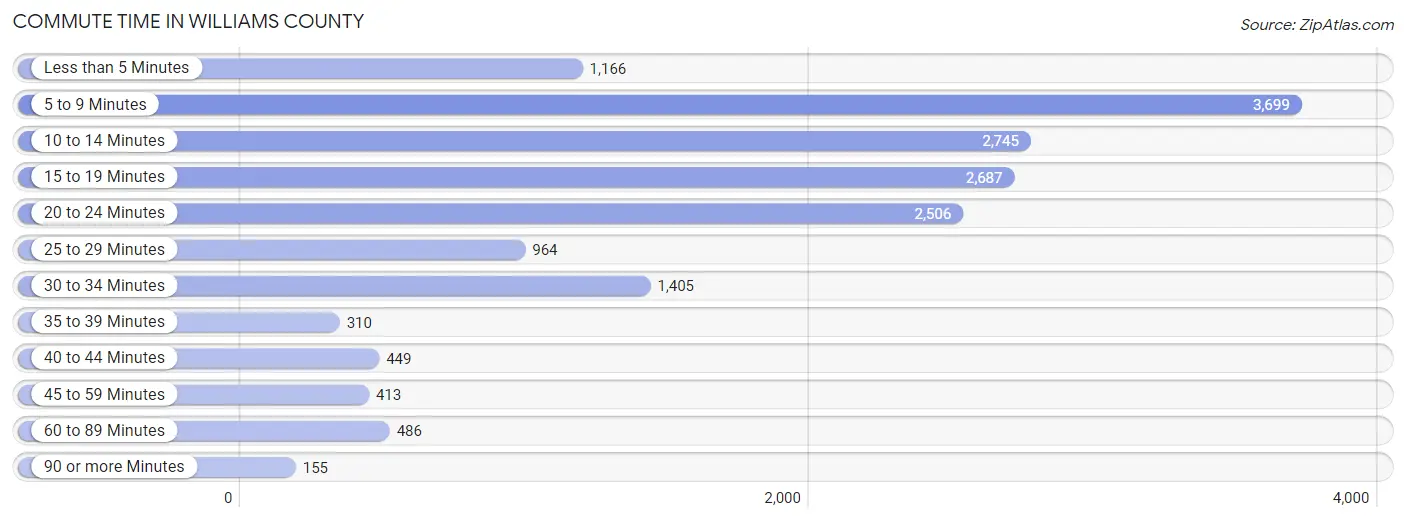
| Commute Time | # Commuters | % Commuters |
| Less than 5 Minutes | 1,166 | 6.9% |
| 5 to 9 Minutes | 3,699 | 21.8% |
| 10 to 14 Minutes | 2,745 | 16.2% |
| 15 to 19 Minutes | 2,687 | 15.8% |
| 20 to 24 Minutes | 2,506 | 14.7% |
| 25 to 29 Minutes | 964 | 5.7% |
| 30 to 34 Minutes | 1,405 | 8.3% |
| 35 to 39 Minutes | 310 | 1.8% |
| 40 to 44 Minutes | 449 | 2.6% |
| 45 to 59 Minutes | 413 | 2.4% |
| 60 to 89 Minutes | 486 | 2.9% |
| 90 or more Minutes | 155 | 0.9% |
Commute Time by Sex in Williams County
The most common commute times in Williams County are 5 to 9 minutes (1,792 commuters, 19.8%) for males and 5 to 9 minutes (1,907 commuters, 24.1%) for females.
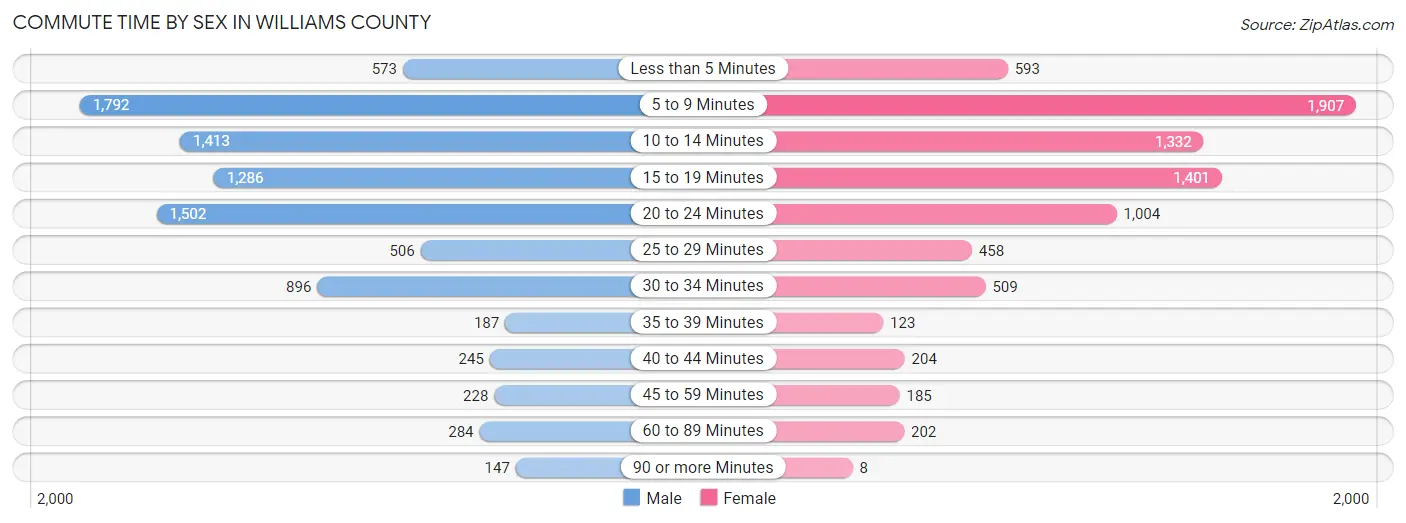
| Commute Time | Male | Female |
| Less than 5 Minutes | 573 (6.3%) | 593 (7.5%) |
| 5 to 9 Minutes | 1,792 (19.8%) | 1,907 (24.1%) |
| 10 to 14 Minutes | 1,413 (15.6%) | 1,332 (16.8%) |
| 15 to 19 Minutes | 1,286 (14.2%) | 1,401 (17.7%) |
| 20 to 24 Minutes | 1,502 (16.6%) | 1,004 (12.7%) |
| 25 to 29 Minutes | 506 (5.6%) | 458 (5.8%) |
| 30 to 34 Minutes | 896 (9.9%) | 509 (6.4%) |
| 35 to 39 Minutes | 187 (2.1%) | 123 (1.5%) |
| 40 to 44 Minutes | 245 (2.7%) | 204 (2.6%) |
| 45 to 59 Minutes | 228 (2.5%) | 185 (2.3%) |
| 60 to 89 Minutes | 284 (3.1%) | 202 (2.5%) |
| 90 or more Minutes | 147 (1.6%) | 8 (0.1%) |
Time of Departure to Work by Sex in Williams County
The most frequent times of departure to work in Williams County are 6:30 AM to 6:59 AM (1,270, 14.0%) for males and 7:30 AM to 7:59 AM (1,187, 15.0%) for females.
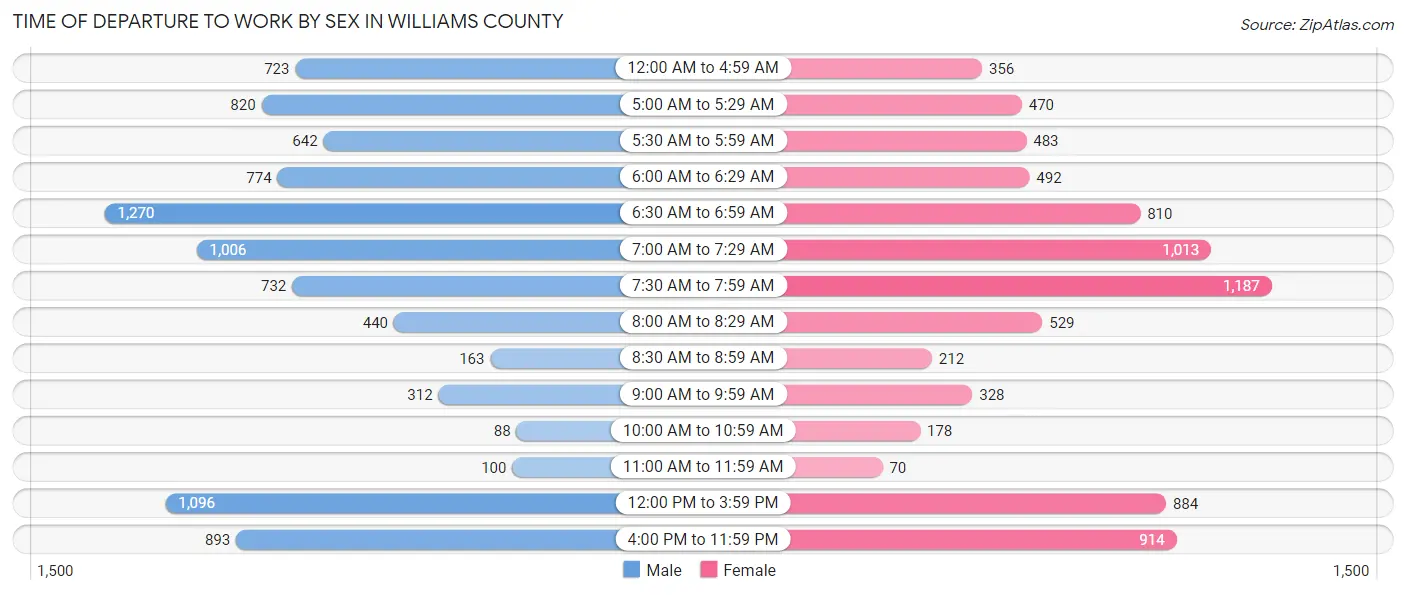
| Time of Departure | Male | Female |
| 12:00 AM to 4:59 AM | 723 (8.0%) | 356 (4.5%) |
| 5:00 AM to 5:29 AM | 820 (9.0%) | 470 (5.9%) |
| 5:30 AM to 5:59 AM | 642 (7.1%) | 483 (6.1%) |
| 6:00 AM to 6:29 AM | 774 (8.5%) | 492 (6.2%) |
| 6:30 AM to 6:59 AM | 1,270 (14.0%) | 810 (10.2%) |
| 7:00 AM to 7:29 AM | 1,006 (11.1%) | 1,013 (12.8%) |
| 7:30 AM to 7:59 AM | 732 (8.1%) | 1,187 (15.0%) |
| 8:00 AM to 8:29 AM | 440 (4.9%) | 529 (6.7%) |
| 8:30 AM to 8:59 AM | 163 (1.8%) | 212 (2.7%) |
| 9:00 AM to 9:59 AM | 312 (3.4%) | 328 (4.1%) |
| 10:00 AM to 10:59 AM | 88 (1.0%) | 178 (2.2%) |
| 11:00 AM to 11:59 AM | 100 (1.1%) | 70 (0.9%) |
| 12:00 PM to 3:59 PM | 1,096 (12.1%) | 884 (11.2%) |
| 4:00 PM to 11:59 PM | 893 (9.9%) | 914 (11.5%) |
| Total | 9,059 (100.0%) | 7,926 (100.0%) |
Housing Occupancy in Williams County
Occupancy by Ownership in Williams County
Of the total 15,381 dwellings in Williams County, owner-occupied units account for 11,553 (75.1%), while renter-occupied units make up 3,828 (24.9%).
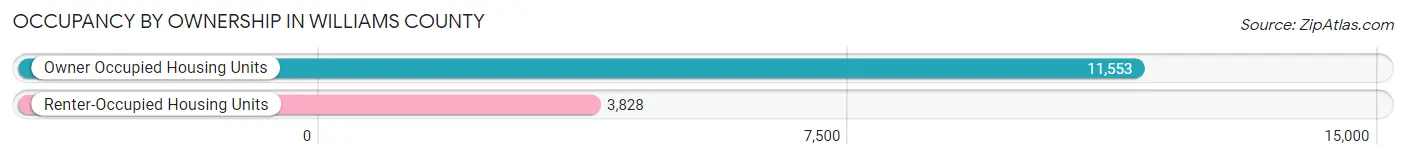
| Occupancy | # Housing Units | % Housing Units |
| Owner Occupied Housing Units | 11,553 | 75.1% |
| Renter-Occupied Housing Units | 3,828 | 24.9% |
| Total Occupied Housing Units | 15,381 | 100.0% |
Occupancy by Household Size in Williams County
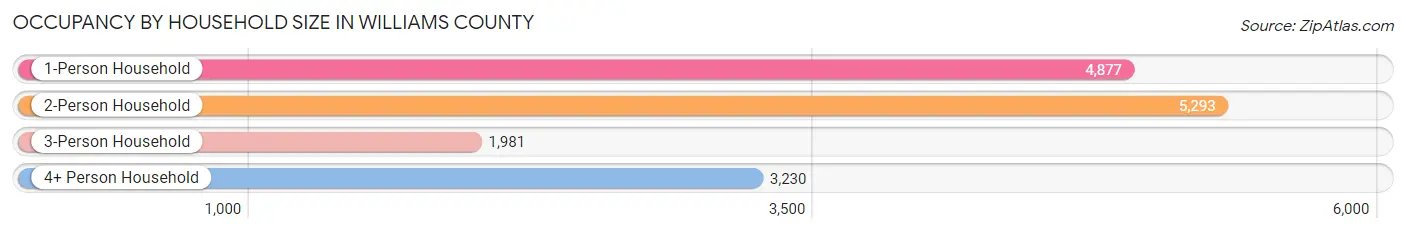
| Household Size | # Housing Units | % Housing Units |
| 1-Person Household | 4,877 | 31.7% |
| 2-Person Household | 5,293 | 34.4% |
| 3-Person Household | 1,981 | 12.9% |
| 4+ Person Household | 3,230 | 21.0% |
| Total Housing Units | 15,381 | 100.0% |
Occupancy by Ownership by Household Size in Williams County

| Household Size | Owner-occupied | Renter-occupied |
| 1-Person Household | 3,417 (70.1%) | 1,460 (29.9%) |
| 2-Person Household | 4,142 (78.2%) | 1,151 (21.7%) |
| 3-Person Household | 1,505 (76.0%) | 476 (24.0%) |
| 4+ Person Household | 2,489 (77.1%) | 741 (22.9%) |
| Total Housing Units | 11,553 (75.1%) | 3,828 (24.9%) |
Occupancy by Educational Attainment in Williams County

| Household Size | Owner-occupied | Renter-occupied |
| Less than High School | 691 (57.4%) | 512 (42.6%) |
| High School Diploma | 4,949 (76.3%) | 1,537 (23.7%) |
| College/Associate Degree | 3,886 (72.2%) | 1,499 (27.8%) |
| Bachelor's Degree or higher | 2,027 (87.9%) | 280 (12.1%) |
Occupancy by Age of Householder in Williams County
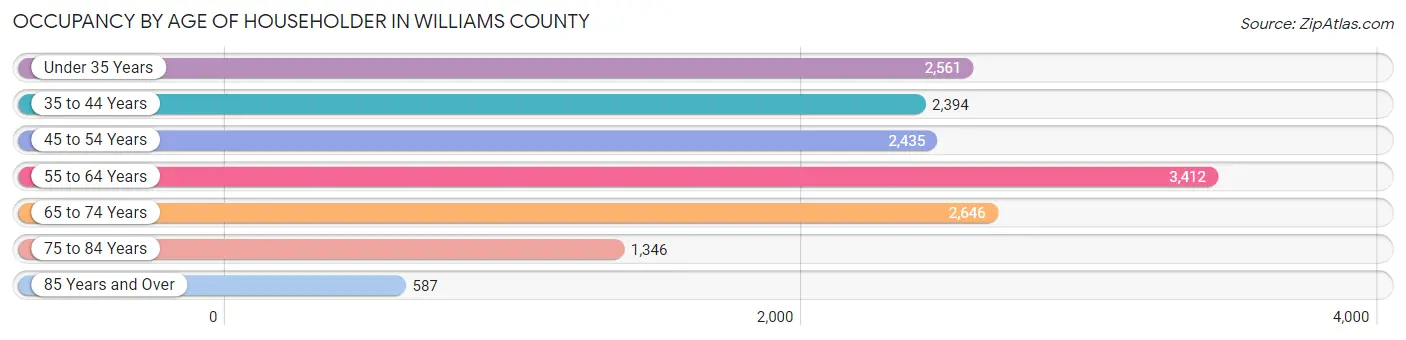
| Age Bracket | # Households | % Households |
| Under 35 Years | 2,561 | 16.7% |
| 35 to 44 Years | 2,394 | 15.6% |
| 45 to 54 Years | 2,435 | 15.8% |
| 55 to 64 Years | 3,412 | 22.2% |
| 65 to 74 Years | 2,646 | 17.2% |
| 75 to 84 Years | 1,346 | 8.7% |
| 85 Years and Over | 587 | 3.8% |
| Total | 15,381 | 100.0% |
Housing Finances in Williams County
Median Income by Occupancy in Williams County
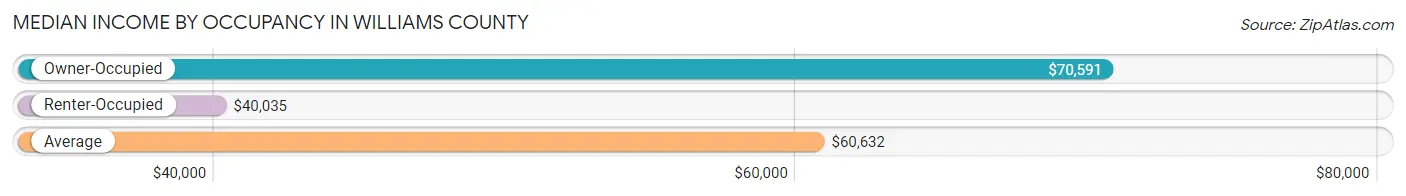
| Occupancy Type | # Households | Median Income |
| Owner-Occupied | 11,553 (75.1%) | $70,591 |
| Renter-Occupied | 3,828 (24.9%) | $40,035 |
| Average | 15,381 (100.0%) | $60,632 |
Occupancy by Householder Income Bracket in Williams County

| Income Bracket | Owner-occupied | Renter-occupied |
| Less than $5,000 | 156 (1.3%) | 162 (4.2%) |
| $5,000 to $9,999 | 103 (0.9%) | 92 (2.4%) |
| $10,000 to $14,999 | 189 (1.6%) | 311 (8.1%) |
| $15,000 to $19,999 | 363 (3.1%) | 192 (5.0%) |
| $20,000 to $24,999 | 354 (3.1%) | 228 (6.0%) |
| $25,000 to $34,999 | 1,206 (10.4%) | 657 (17.2%) |
| $35,000 to $49,999 | 1,389 (12.0%) | 801 (20.9%) |
| $50,000 to $74,999 | 2,507 (21.7%) | 844 (22.1%) |
| $75,000 to $99,999 | 2,148 (18.6%) | 349 (9.1%) |
| $100,000 to $149,999 | 2,083 (18.0%) | 149 (3.9%) |
| $150,000 or more | 1,055 (9.1%) | 43 (1.1%) |
| Total | 11,553 (100.0%) | 3,828 (100.0%) |
Monthly Housing Cost Tiers in Williams County
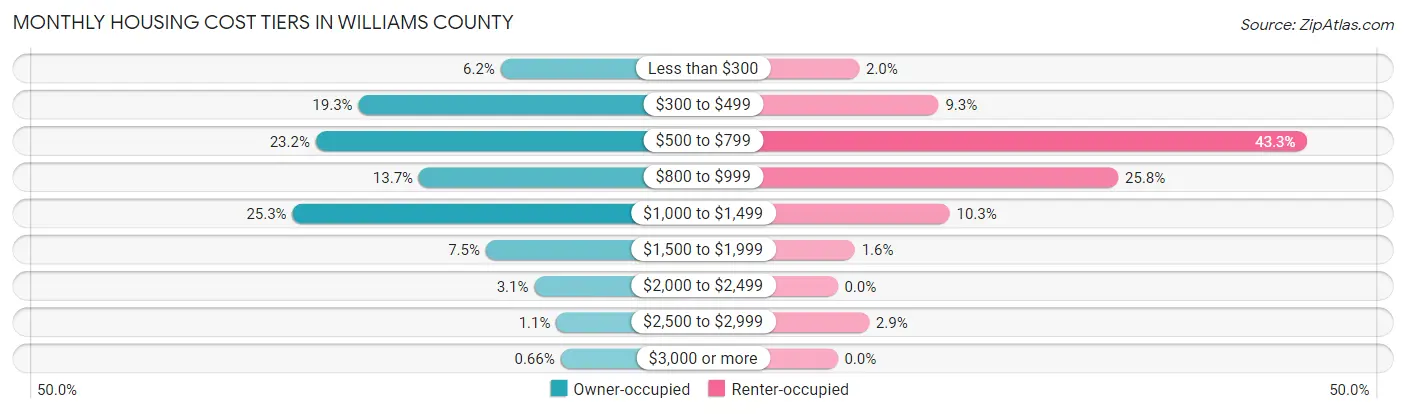
| Monthly Cost | Owner-occupied | Renter-occupied |
| Less than $300 | 713 (6.2%) | 76 (2.0%) |
| $300 to $499 | 2,226 (19.3%) | 356 (9.3%) |
| $500 to $799 | 2,680 (23.2%) | 1,656 (43.3%) |
| $800 to $999 | 1,583 (13.7%) | 989 (25.8%) |
| $1,000 to $1,499 | 2,927 (25.3%) | 395 (10.3%) |
| $1,500 to $1,999 | 871 (7.5%) | 61 (1.6%) |
| $2,000 to $2,499 | 356 (3.1%) | 0 (0.0%) |
| $2,500 to $2,999 | 121 (1.1%) | 111 (2.9%) |
| $3,000 or more | 76 (0.7%) | 0 (0.0%) |
| Total | 11,553 (100.0%) | 3,828 (100.0%) |
Physical Housing Characteristics in Williams County
Housing Structures in Williams County

| Structure Type | # Housing Units | % Housing Units |
| Single Unit, Detached | 12,382 | 80.5% |
| Single Unit, Attached | 409 | 2.7% |
| 2 Unit Apartments | 588 | 3.8% |
| 3 or 4 Unit Apartments | 691 | 4.5% |
| 5 to 9 Unit Apartments | 113 | 0.7% |
| 10 or more Apartments | 362 | 2.4% |
| Mobile Home / Other | 836 | 5.4% |
| Total | 15,381 | 100.0% |
Housing Structures by Occupancy in Williams County
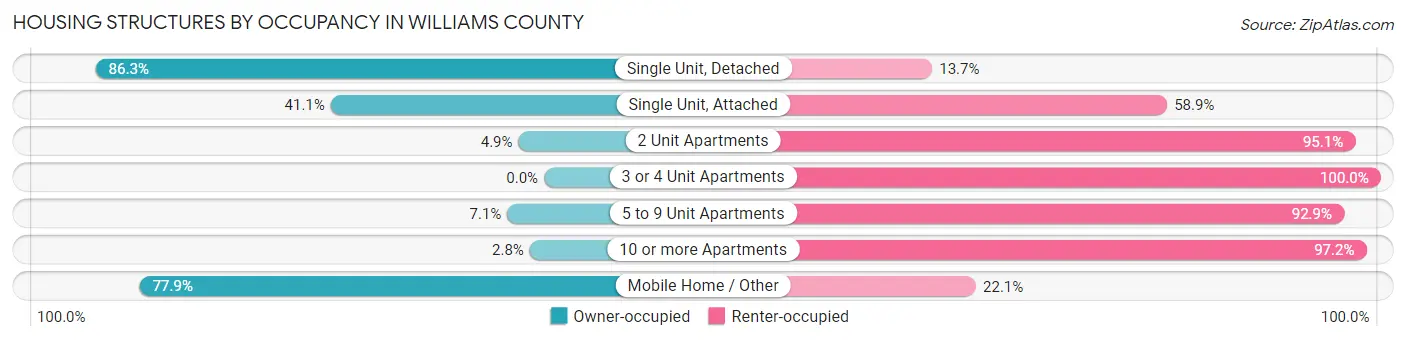
| Structure Type | Owner-occupied | Renter-occupied |
| Single Unit, Detached | 10,687 (86.3%) | 1,695 (13.7%) |
| Single Unit, Attached | 168 (41.1%) | 241 (58.9%) |
| 2 Unit Apartments | 29 (4.9%) | 559 (95.1%) |
| 3 or 4 Unit Apartments | 0 (0.0%) | 691 (100.0%) |
| 5 to 9 Unit Apartments | 8 (7.1%) | 105 (92.9%) |
| 10 or more Apartments | 10 (2.8%) | 352 (97.2%) |
| Mobile Home / Other | 651 (77.9%) | 185 (22.1%) |
| Total | 11,553 (75.1%) | 3,828 (24.9%) |
Housing Structures by Number of Rooms in Williams County
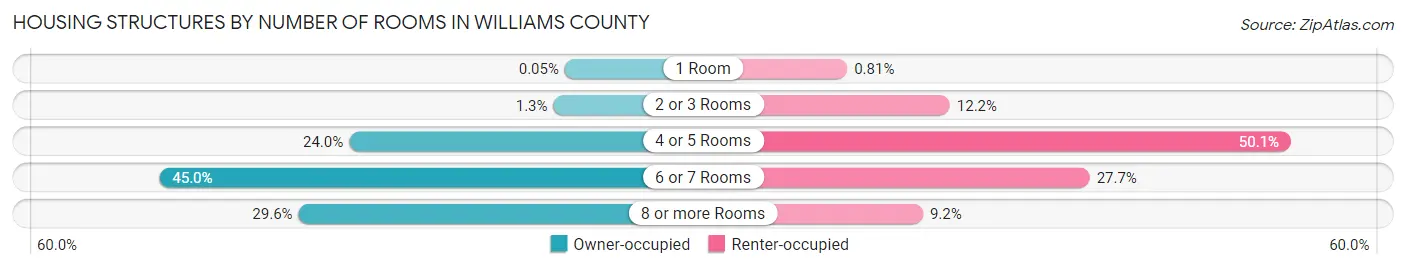
| Number of Rooms | Owner-occupied | Renter-occupied |
| 1 Room | 6 (0.1%) | 31 (0.8%) |
| 2 or 3 Rooms | 152 (1.3%) | 467 (12.2%) |
| 4 or 5 Rooms | 2,771 (24.0%) | 1,916 (50.0%) |
| 6 or 7 Rooms | 5,203 (45.0%) | 1,061 (27.7%) |
| 8 or more Rooms | 3,421 (29.6%) | 353 (9.2%) |
| Total | 11,553 (100.0%) | 3,828 (100.0%) |
Housing Structure by Heating Type in Williams County

| Heating Type | Owner-occupied | Renter-occupied |
| Utility Gas | 6,198 (53.6%) | 2,154 (56.3%) |
| Bottled, Tank, or LP Gas | 2,175 (18.8%) | 282 (7.4%) |
| Electricity | 2,444 (21.1%) | 1,356 (35.4%) |
| Fuel Oil or Kerosene | 240 (2.1%) | 15 (0.4%) |
| Coal or Coke | 21 (0.2%) | 0 (0.0%) |
| All other Fuels | 376 (3.3%) | 3 (0.1%) |
| No Fuel Used | 99 (0.9%) | 18 (0.5%) |
| Total | 11,553 (100.0%) | 3,828 (100.0%) |
Household Vehicle Usage in Williams County
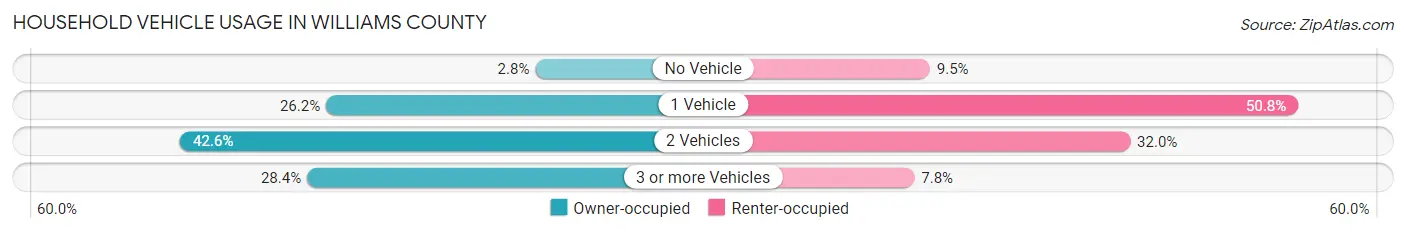
| Vehicles per Household | Owner-occupied | Renter-occupied |
| No Vehicle | 323 (2.8%) | 364 (9.5%) |
| 1 Vehicle | 3,032 (26.2%) | 1,943 (50.8%) |
| 2 Vehicles | 4,920 (42.6%) | 1,223 (32.0%) |
| 3 or more Vehicles | 3,278 (28.4%) | 298 (7.8%) |
| Total | 11,553 (100.0%) | 3,828 (100.0%) |
Real Estate & Mortgages in Williams County
Real Estate and Mortgage Overview in Williams County
| Characteristic | Without Mortgage | With Mortgage |
| Housing Units | 4,777 | 6,776 |
| Median Property Value | $120,600 | $135,200 |
| Median Household Income | $57,561 | $744 |
| Monthly Housing Costs | $454 | $73 |
| Real Estate Taxes | $1,498 | $71 |
Property Value by Mortgage Status in Williams County
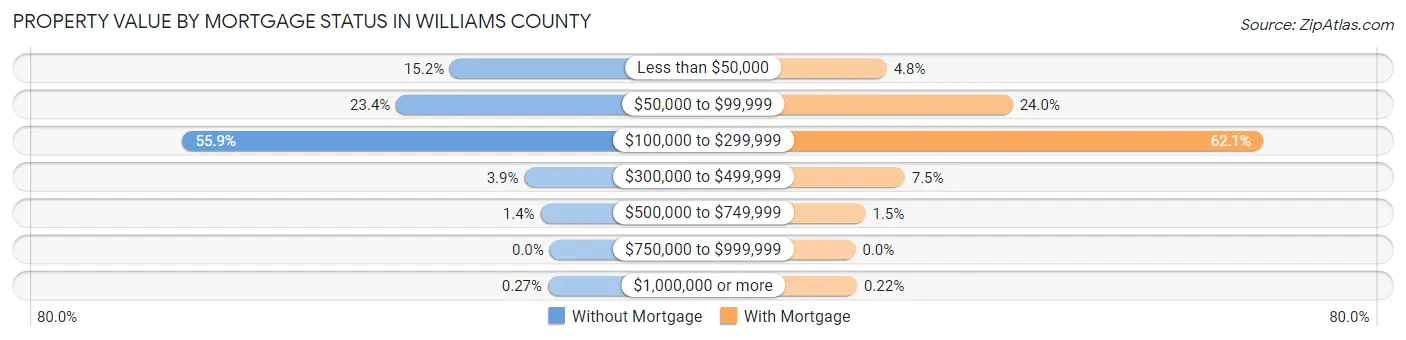
| Property Value | Without Mortgage | With Mortgage |
| Less than $50,000 | 725 (15.2%) | 322 (4.8%) |
| $50,000 to $99,999 | 1,117 (23.4%) | 1,623 (23.9%) |
| $100,000 to $299,999 | 2,671 (55.9%) | 4,205 (62.1%) |
| $300,000 to $499,999 | 184 (3.8%) | 508 (7.5%) |
| $500,000 to $749,999 | 67 (1.4%) | 103 (1.5%) |
| $750,000 to $999,999 | 0 (0.0%) | 0 (0.0%) |
| $1,000,000 or more | 13 (0.3%) | 15 (0.2%) |
| Total | 4,777 (100.0%) | 6,776 (100.0%) |
Household Income by Mortgage Status in Williams County
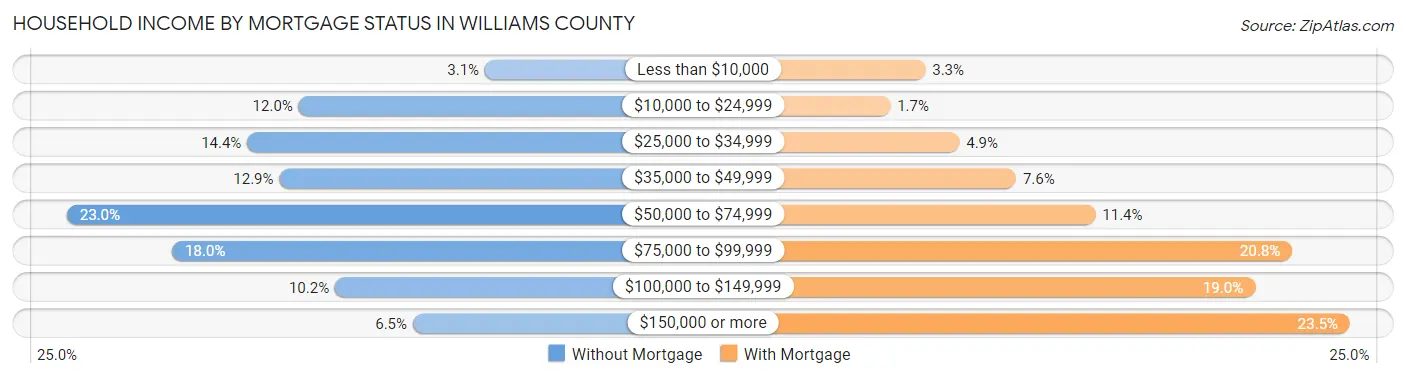
| Household Income | Without Mortgage | With Mortgage |
| Less than $10,000 | 147 (3.1%) | 225 (3.3%) |
| $10,000 to $24,999 | 571 (11.9%) | 112 (1.7%) |
| $25,000 to $34,999 | 688 (14.4%) | 335 (4.9%) |
| $35,000 to $49,999 | 615 (12.9%) | 518 (7.6%) |
| $50,000 to $74,999 | 1,098 (23.0%) | 774 (11.4%) |
| $75,000 to $99,999 | 859 (18.0%) | 1,409 (20.8%) |
| $100,000 to $149,999 | 488 (10.2%) | 1,289 (19.0%) |
| $150,000 or more | 311 (6.5%) | 1,595 (23.5%) |
| Total | 4,777 (100.0%) | 6,776 (100.0%) |
Property Value to Household Income Ratio in Williams County
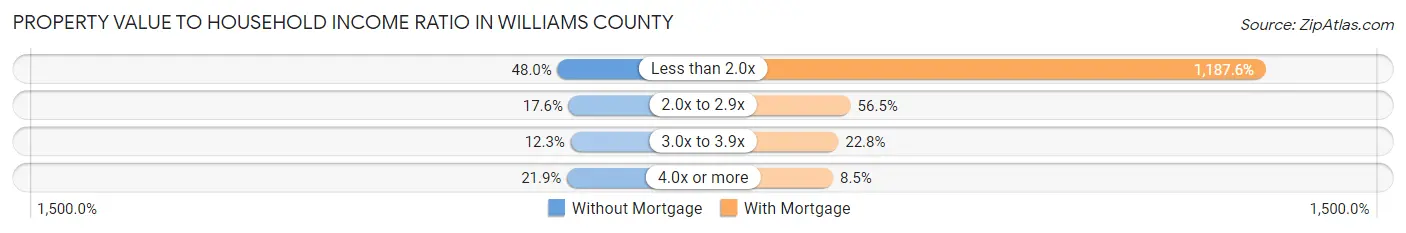
| Value-to-Income Ratio | Without Mortgage | With Mortgage |
| Less than 2.0x | 2,295 (48.0%) | 80,469 (1,187.6%) |
| 2.0x to 2.9x | 840 (17.6%) | 3,828 (56.5%) |
| 3.0x to 3.9x | 589 (12.3%) | 1,546 (22.8%) |
| 4.0x or more | 1,044 (21.8%) | 574 (8.5%) |
| Total | 4,777 (100.0%) | 6,776 (100.0%) |
Real Estate Taxes by Mortgage Status in Williams County
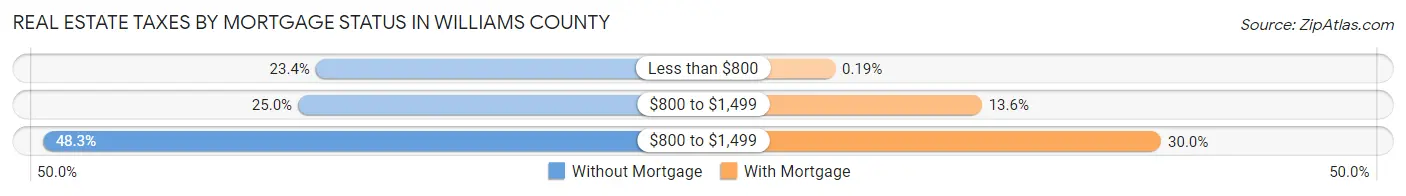
| Property Taxes | Without Mortgage | With Mortgage |
| Less than $800 | 1,119 (23.4%) | 13 (0.2%) |
| $800 to $1,499 | 1,196 (25.0%) | 920 (13.6%) |
| $800 to $1,499 | 2,309 (48.3%) | 2,030 (30.0%) |
| Total | 4,777 (100.0%) | 6,776 (100.0%) |
Health & Disability in Williams County
Health Insurance Coverage by Age in Williams County
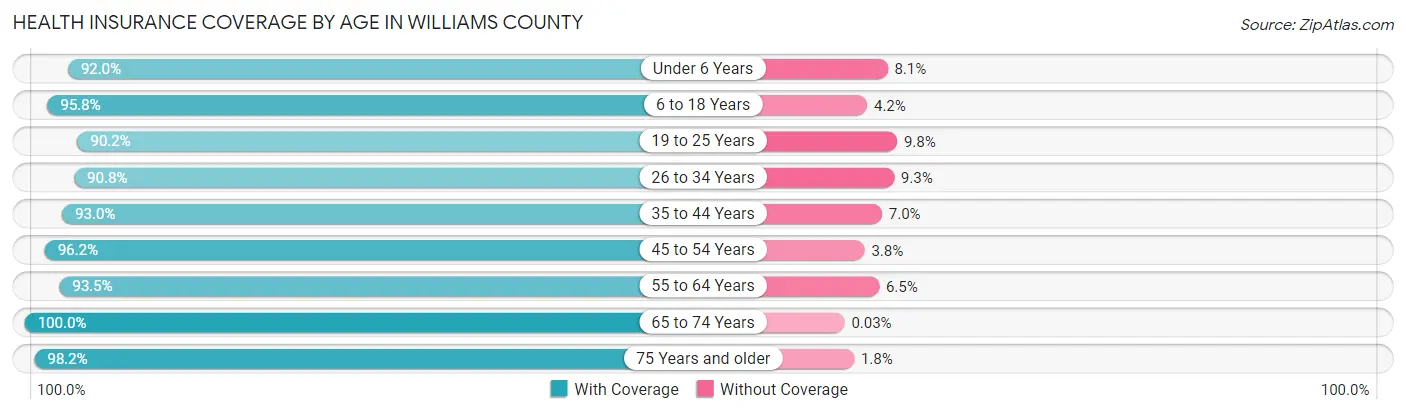
| Age Bracket | With Coverage | Without Coverage |
| Under 6 Years | 2,284 (91.9%) | 200 (8.1%) |
| 6 to 18 Years | 5,912 (95.8%) | 262 (4.2%) |
| 19 to 25 Years | 2,485 (90.2%) | 271 (9.8%) |
| 26 to 34 Years | 3,473 (90.7%) | 354 (9.2%) |
| 35 to 44 Years | 4,051 (93.0%) | 305 (7.0%) |
| 45 to 54 Years | 3,996 (96.2%) | 156 (3.8%) |
| 55 to 64 Years | 5,106 (93.5%) | 353 (6.5%) |
| 65 to 74 Years | 3,958 (100.0%) | 1 (0.0%) |
| 75 Years and older | 2,827 (98.2%) | 52 (1.8%) |
| Total | 34,092 (94.6%) | 1,954 (5.4%) |
Health Insurance Coverage by Citizenship Status in Williams County

| Citizenship Status | With Coverage | Without Coverage |
| Native Born | 2,284 (91.9%) | 200 (8.1%) |
| Foreign Born, Citizen | 5,912 (95.8%) | 262 (4.2%) |
| Foreign Born, not a Citizen | 2,485 (90.2%) | 271 (9.8%) |
Health Insurance Coverage by Household Income in Williams County
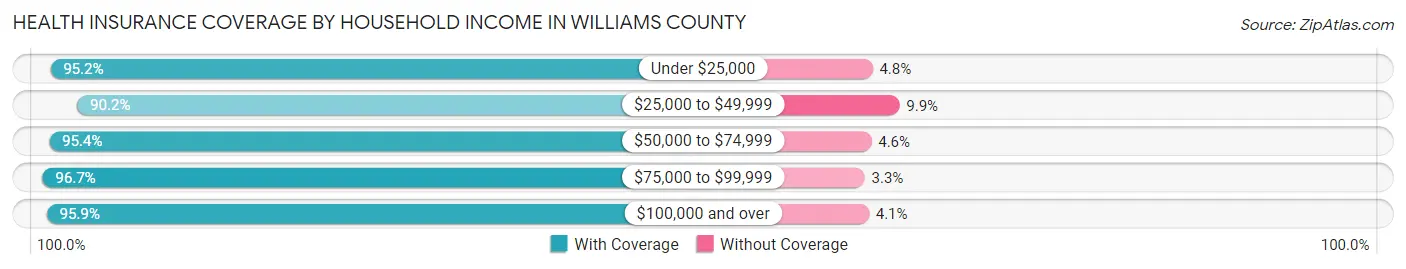
| Household Income | With Coverage | Without Coverage |
| Under $25,000 | 3,187 (95.2%) | 161 (4.8%) |
| $25,000 to $49,999 | 7,219 (90.1%) | 789 (9.9%) |
| $50,000 to $74,999 | 7,726 (95.4%) | 372 (4.6%) |
| $75,000 to $99,999 | 6,621 (96.7%) | 229 (3.3%) |
| $100,000 and over | 9,290 (95.9%) | 399 (4.1%) |
Public vs Private Health Insurance Coverage by Age in Williams County

| Age Bracket | Public Insurance | Private Insurance |
| Under 6 | 1,073 (43.2%) | 1,394 (56.1%) |
| 6 to 18 Years | 2,567 (41.6%) | 3,854 (62.4%) |
| 19 to 25 Years | 573 (20.8%) | 2,025 (73.5%) |
| 25 to 34 Years | 1,079 (28.2%) | 2,500 (65.3%) |
| 35 to 44 Years | 792 (18.2%) | 3,460 (79.4%) |
| 45 to 54 Years | 712 (17.2%) | 3,368 (81.1%) |
| 55 to 64 Years | 1,379 (25.3%) | 4,053 (74.2%) |
| 65 to 74 Years | 3,765 (95.1%) | 2,605 (65.8%) |
| 75 Years and over | 2,808 (97.5%) | 1,729 (60.1%) |
| Total | 14,748 (40.9%) | 24,988 (69.3%) |
Disability Status by Sex by Age in Williams County
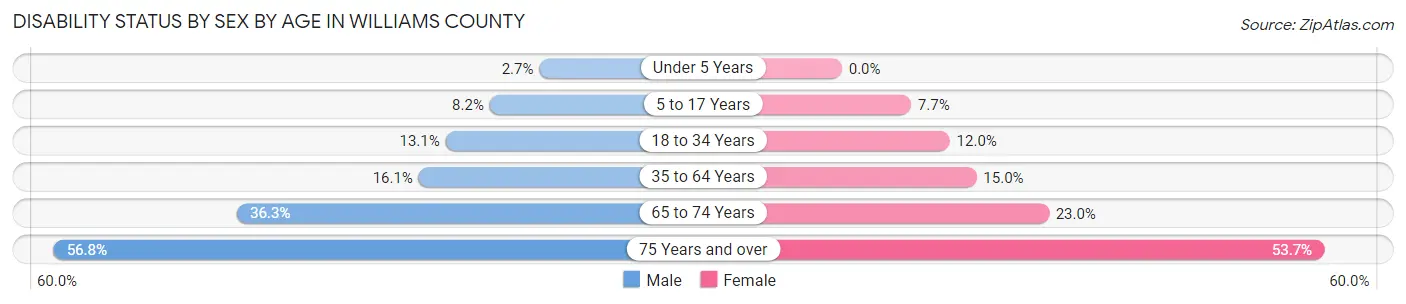
| Age Bracket | Male | Female |
| Under 5 Years | 28 (2.7%) | 0 (0.0%) |
| 5 to 17 Years | 250 (8.2%) | 237 (7.7%) |
| 18 to 34 Years | 465 (13.1%) | 416 (12.0%) |
| 35 to 64 Years | 1,153 (16.1%) | 1,021 (15.0%) |
| 65 to 74 Years | 688 (36.3%) | 476 (23.0%) |
| 75 Years and over | 673 (56.8%) | 909 (53.7%) |
Disability Class by Sex by Age in Williams County
Disability Class: Hearing Difficulty
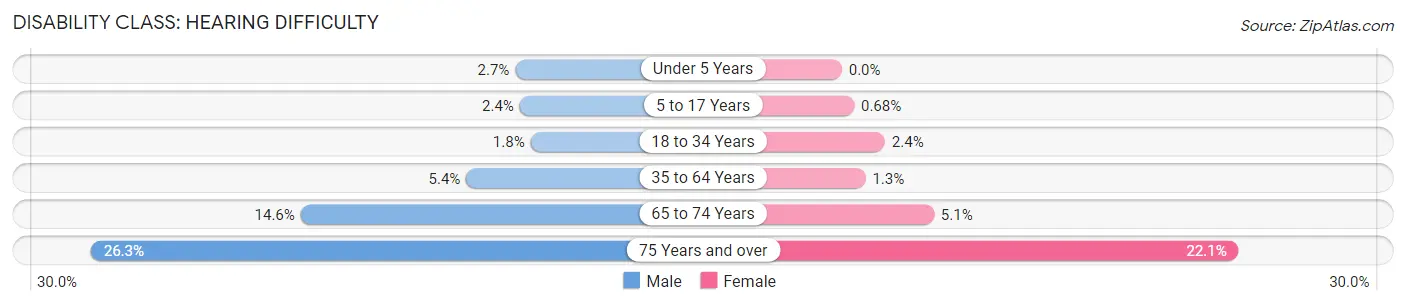
| Age Bracket | Male | Female |
| Under 5 Years | 28 (2.7%) | 0 (0.0%) |
| 5 to 17 Years | 74 (2.4%) | 21 (0.7%) |
| 18 to 34 Years | 65 (1.8%) | 83 (2.4%) |
| 35 to 64 Years | 387 (5.4%) | 90 (1.3%) |
| 65 to 74 Years | 277 (14.6%) | 106 (5.1%) |
| 75 Years and over | 312 (26.3%) | 374 (22.1%) |
Disability Class: Vision Difficulty
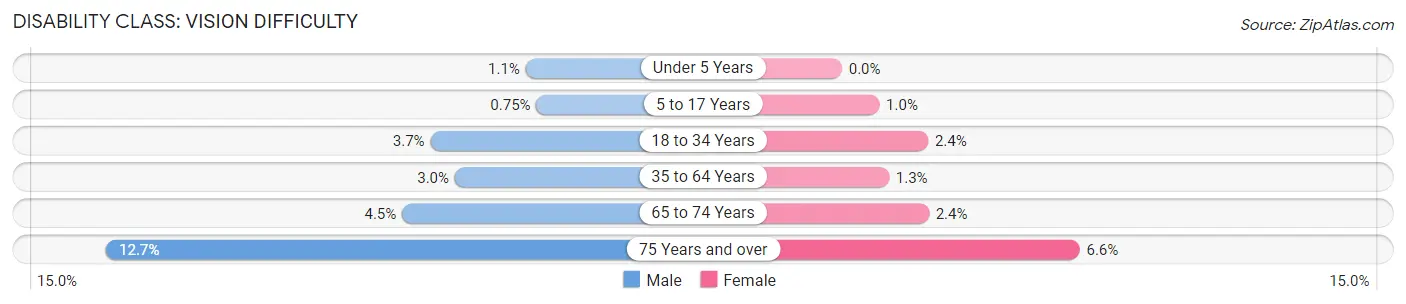
| Age Bracket | Male | Female |
| Under 5 Years | 11 (1.1%) | 0 (0.0%) |
| 5 to 17 Years | 23 (0.7%) | 32 (1.0%) |
| 18 to 34 Years | 131 (3.7%) | 83 (2.4%) |
| 35 to 64 Years | 216 (3.0%) | 89 (1.3%) |
| 65 to 74 Years | 85 (4.5%) | 50 (2.4%) |
| 75 Years and over | 151 (12.7%) | 112 (6.6%) |
Disability Class: Cognitive Difficulty

| Age Bracket | Male | Female |
| 5 to 17 Years | 172 (5.6%) | 202 (6.6%) |
| 18 to 34 Years | 220 (6.2%) | 194 (5.6%) |
| 35 to 64 Years | 439 (6.1%) | 296 (4.3%) |
| 65 to 74 Years | 227 (12.0%) | 105 (5.1%) |
| 75 Years and over | 76 (6.4%) | 130 (7.7%) |
Disability Class: Ambulatory Difficulty
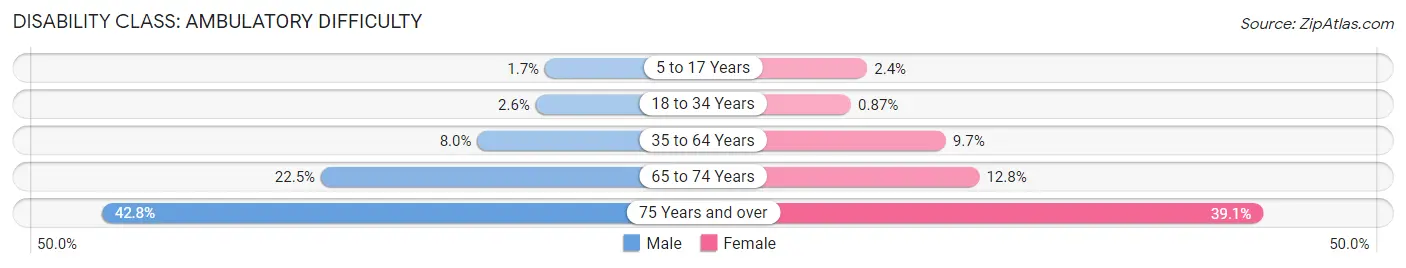
| Age Bracket | Male | Female |
| 5 to 17 Years | 52 (1.7%) | 73 (2.4%) |
| 18 to 34 Years | 91 (2.6%) | 30 (0.9%) |
| 35 to 64 Years | 572 (8.0%) | 658 (9.7%) |
| 65 to 74 Years | 426 (22.5%) | 264 (12.8%) |
| 75 Years and over | 508 (42.8%) | 662 (39.1%) |
Disability Class: Self-Care Difficulty
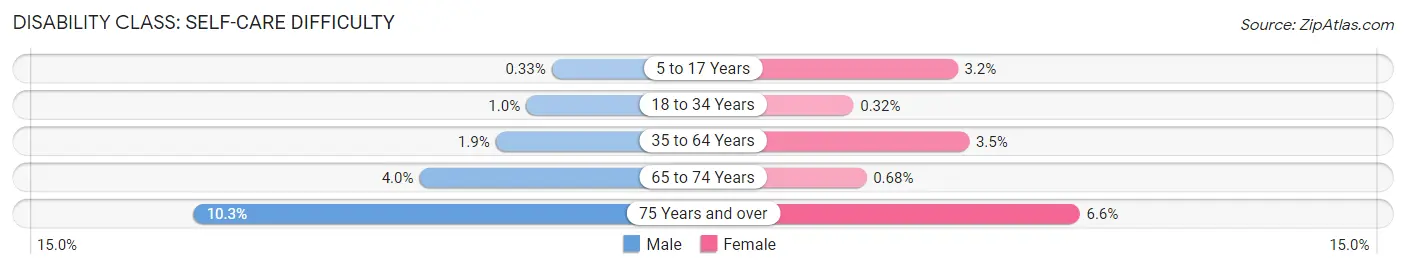
| Age Bracket | Male | Female |
| 5 to 17 Years | 10 (0.3%) | 99 (3.2%) |
| 18 to 34 Years | 37 (1.0%) | 11 (0.3%) |
| 35 to 64 Years | 135 (1.9%) | 241 (3.5%) |
| 65 to 74 Years | 76 (4.0%) | 14 (0.7%) |
| 75 Years and over | 122 (10.3%) | 112 (6.6%) |
Technology Access in Williams County
Computing Device Access in Williams County
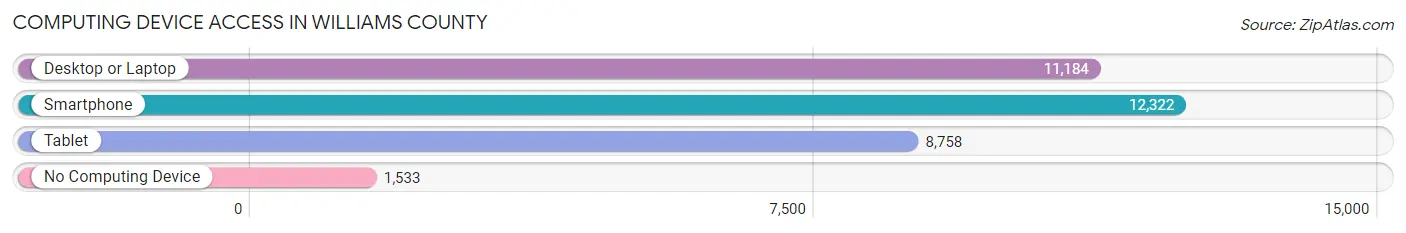
| Device Type | # Households | % Households |
| Desktop or Laptop | 11,184 | 72.7% |
| Smartphone | 12,322 | 80.1% |
| Tablet | 8,758 | 56.9% |
| No Computing Device | 1,533 | 10.0% |
| Total | 15,381 | 100.0% |
Internet Access in Williams County
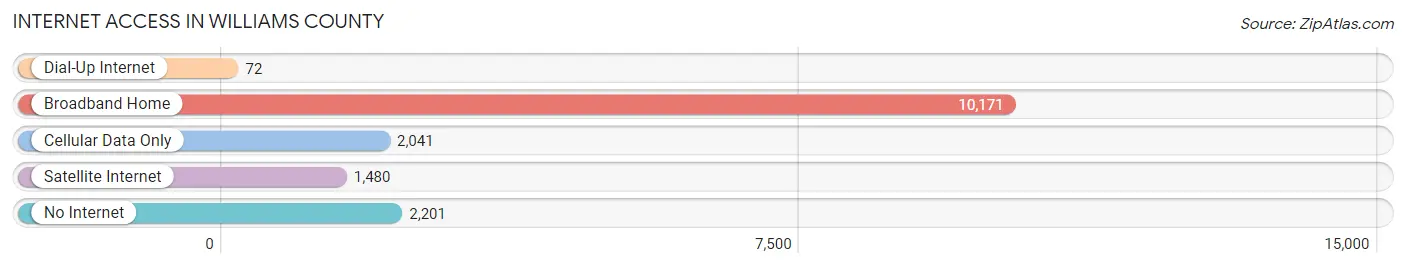
| Internet Type | # Households | % Households |
| Dial-Up Internet | 72 | 0.5% |
| Broadband Home | 10,171 | 66.1% |
| Cellular Data Only | 2,041 | 13.3% |
| Satellite Internet | 1,480 | 9.6% |
| No Internet | 2,201 | 14.3% |
| Total | 15,381 | 100.0% |
Williams County Summary
Williams County is located in the northwest corner of Ohio, and is bordered by Michigan to the north, Indiana to the west, and Fulton and Defiance counties to the south and east, respectively. The county seat is Bryan, and the county is named for David Williams, a soldier in the War of 1812. The county has a total area of 411 square miles, of which 409 square miles is land and 2 square miles is water.
Geography
Williams County is located in the Great Black Swamp region of Ohio, and is characterized by rolling hills, wooded areas, and numerous small lakes and streams. The county is drained by the Maumee River, which flows through the county from east to west. The county is also home to several state parks, including Maumee Bay State Park, which is located on the shore of Lake Erie.
Economy
Williams County has a diverse economy, with a mix of manufacturing, agriculture, and services. The county is home to several large manufacturing companies, including Whirlpool Corporation, which has a large plant in the county. Agriculture is also an important part of the county’s economy, with corn, soybeans, and wheat being the primary crops. The county is also home to several small businesses, including restaurants, retail stores, and professional services.
Demographics
As of the 2010 census, Williams County had a population of 27,822. The population was spread out, with 24.3% under the age of 18, 8.2% from 18 to 24, 25.2% from 25 to 44, 25.7% from 45 to 64, and 16.6% who were 65 years of age or older. The median age was 38.4 years. The median income for a household in the county was $45,945, and the median income for a family was $54,945.
The racial makeup of the county was 95.2% White, 0.7% African American, 0.3% Native American, 0.5% Asian, 0.1% Pacific Islander, 1.7% from other races, and 1.5% from two or more races. Hispanic or Latino of any race were 3.2% of the population.
Conclusion
Williams County is a diverse county located in the northwest corner of Ohio. The county is home to a mix of manufacturing, agriculture, and services, and has a population of 27,822. The county is characterized by rolling hills, wooded areas, and numerous small lakes and streams, and is drained by the Maumee River. The county is also home to several state parks, including Maumee Bay State Park, which is located on the shore of Lake Erie.
Common Questions
What is the Total Population of Williams County?
Total Population of Williams County is 36,973.
What is the Total Male Population of Williams County?
Total Male Population of Williams County is 18,476.
What is the Total Female Population of Williams County?
Total Female Population of Williams County is 18,497.
What is the Ratio of Males per 100 Females in Williams County?
There are 99.89 Males per 100 Females in Williams County.
What is the Ratio of Females per 100 Males in Williams County?
There are 100.11 Females per 100 Males in Williams County.
What is the Median Population Age in Williams County?
Median Population Age in Williams County is 41.5 Years.
What is the Average Family Size in Williams County
Average Family Size in Williams County is 2.9 People.
What is the Average Household Size in Williams County
Average Household Size in Williams County is 2.3 People.
What is Per Capita Income in Williams County?
Per Capita income in Williams County is $31,189.
What is the Median Family Income in Williams County?
Median Family Income in Williams County is $74,199.
What is the Median Household income in Williams County?
Median Household Income in Williams County is $60,632.
What is Income or Wage Gap in Williams County?
Income or Wage Gap in Williams County is 34.5%.
Women in Williams County earn 65.5 cents for every dollar earned by a man.
What is Family Income Deficit in Williams County?
Family Income Deficit in Williams County is $12,839.
Families that are below poverty line in Williams County earn $12,839 less on average than the poverty threshold level.
What is Inequality or Gini Index in Williams County?
Inequality or Gini Index in Williams County is 0.40.
How Large is the Labor Force in Williams County?
There are 18,352 People in the Labor Forcein in Williams County.
What is the Percentage of People in the Labor Force in Williams County?
61.8% of People are in the Labor Force in Williams County.
What is the Unemployment Rate in Williams County?
Unemployment Rate in Williams County is 3.5%.