Wayne County, OH
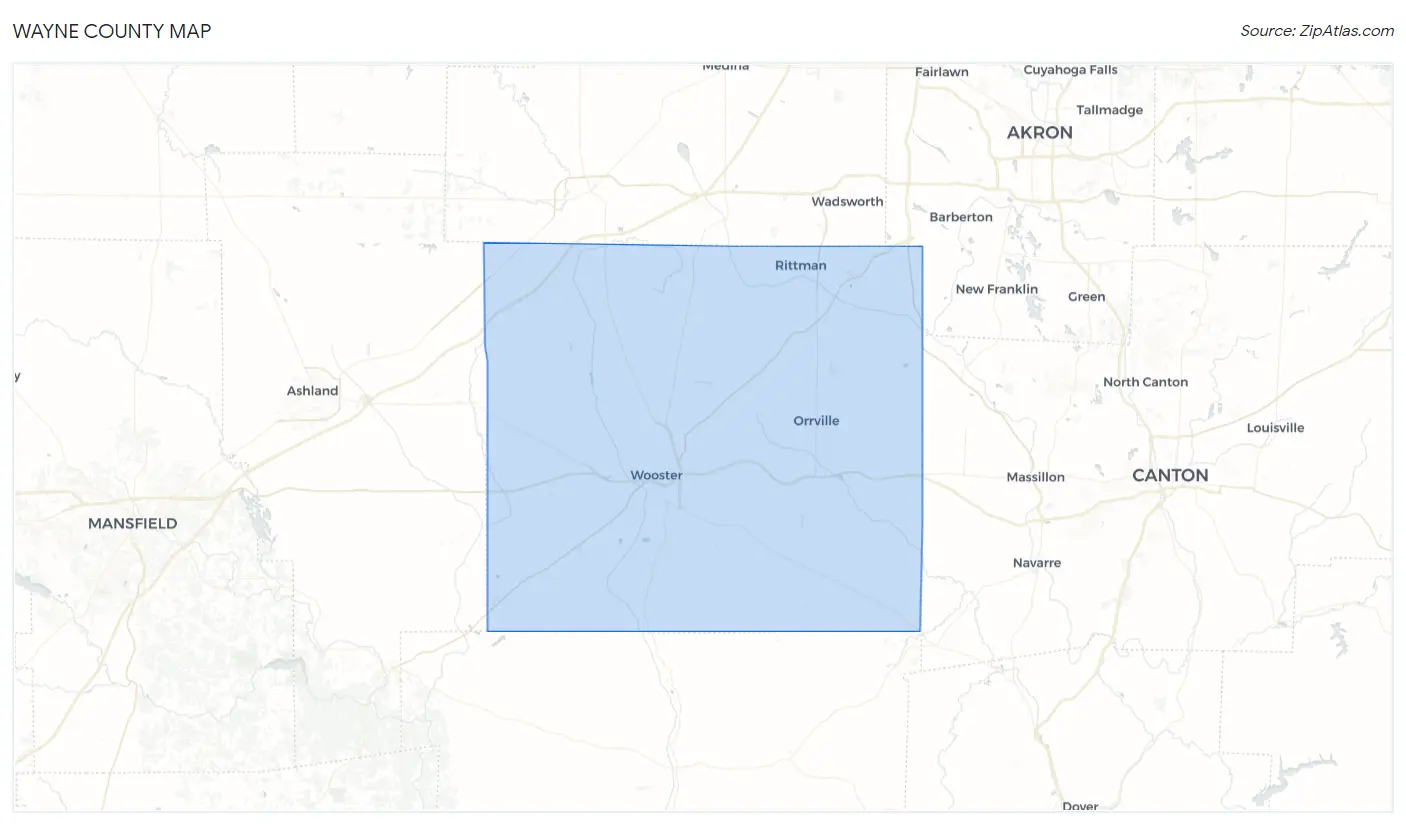
Wayne County Map
Wayne County Overview
116,680
TOTAL POPULATION
58,125
MALE POPULATION
58,555
FEMALE POPULATION
99.27
MALES / 100 FEMALES
100.74
FEMALES / 100 MALES
38.8
MEDIAN AGE
3.1
AVG FAMILY SIZE
2.5
AVG HOUSEHOLD SIZE
$32,908
PER CAPITA INCOME
$83,546
AVG FAMILY INCOME
$70,320
AVG HOUSEHOLD INCOME
42.9%
WAGE / INCOME GAP [ % ]
57.1¢/ $1
WAGE / INCOME GAP [ $ ]
$8,900
FAMILY INCOME DEFICIT
0.41
INEQUALITY / GINI INDEX
57,031
LABOR FORCE [ PEOPLE ]
62.2%
PERCENT IN LABOR FORCE
3.3%
UNEMPLOYMENT RATE
Race in Wayne County
The most populous races in Wayne County are White / Caucasian (109,599 | 93.9%), Two or more Races (2,989 | 2.6%), and Hispanic or Latino (2,507 | 2.1%).
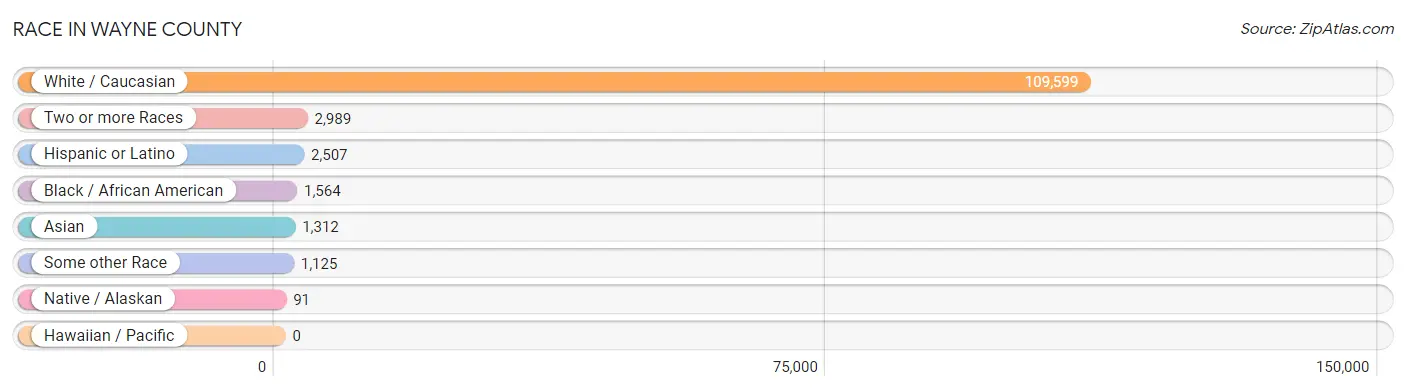
| Race | # Population | % Population |
| Asian | 1,312 | 1.1% |
| Black / African American | 1,564 | 1.3% |
| Hawaiian / Pacific | 0 | 0.0% |
| Hispanic or Latino | 2,507 | 2.1% |
| Native / Alaskan | 91 | 0.1% |
| White / Caucasian | 109,599 | 93.9% |
| Two or more Races | 2,989 | 2.6% |
| Some other Race | 1,125 | 1.0% |
| Total | 116,680 | 100.0% |
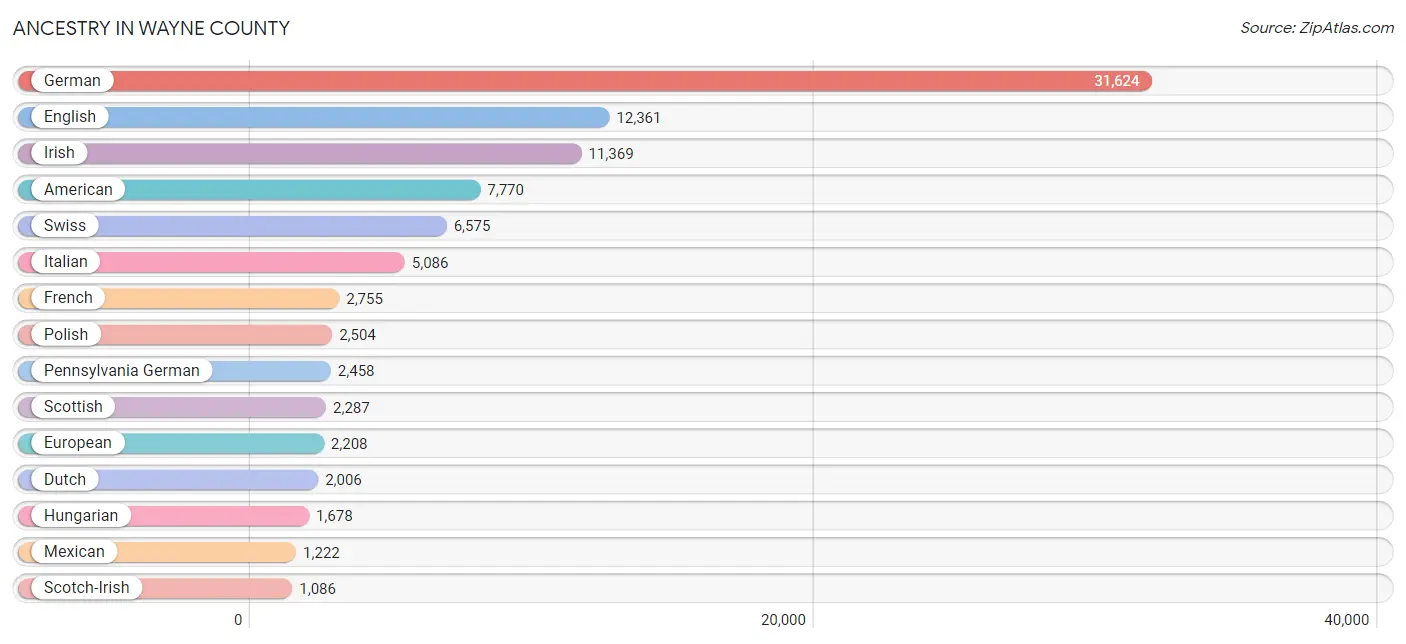
Ancestry in Wayne County
The most populous ancestries reported in Wayne County are German (31,624 | 27.1%), English (12,361 | 10.6%), Irish (11,369 | 9.7%), American (7,770 | 6.7%), and Swiss (6,575 | 5.6%), together accounting for 59.7% of all Wayne County residents.
| Ancestry | # Population | % Population |
| Afghan | 5 | 0.0% |
| African | 48 | 0.0% |
| Alsatian | 15 | 0.0% |
| American | 7,770 | 6.7% |
| Arab | 290 | 0.3% |
| Armenian | 12 | 0.0% |
| Australian | 119 | 0.1% |
| Austrian | 331 | 0.3% |
| Belgian | 73 | 0.1% |
| Belizean | 39 | 0.0% |
| Bhutanese | 126 | 0.1% |
| Blackfeet | 24 | 0.0% |
| Brazilian | 99 | 0.1% |
| British | 660 | 0.6% |
| Burmese | 80 | 0.1% |
| Cambodian | 10 | 0.0% |
| Canadian | 43 | 0.0% |
| Cape Verdean | 5 | 0.0% |
| Carpatho Rusyn | 7 | 0.0% |
| Celtic | 13 | 0.0% |
| Central American | 254 | 0.2% |
| Cherokee | 265 | 0.2% |
| Chickasaw | 4 | 0.0% |
| Chippewa | 5 | 0.0% |
| Choctaw | 8 | 0.0% |
| Colombian | 151 | 0.1% |
| Cree | 7 | 0.0% |
| Croatian | 210 | 0.2% |
| Cuban | 103 | 0.1% |
| Czech | 679 | 0.6% |
| Czechoslovakian | 107 | 0.1% |
| Danish | 162 | 0.1% |
| Dutch | 2,006 | 1.7% |
| Eastern European | 172 | 0.2% |
| Ecuadorian | 42 | 0.0% |
| English | 12,361 | 10.6% |
| Ethiopian | 76 | 0.1% |
| European | 2,208 | 1.9% |
| Finnish | 102 | 0.1% |
| French | 2,755 | 2.4% |
| French American Indian | 9 | 0.0% |
| French Canadian | 645 | 0.5% |
| German | 31,624 | 27.1% |
| Ghanaian | 25 | 0.0% |
| Greek | 235 | 0.2% |
| Guamanian / Chamorro | 10 | 0.0% |
| Guatemalan | 162 | 0.1% |
| Honduran | 38 | 0.0% |
| Hungarian | 1,678 | 1.4% |
| Indian (Asian) | 217 | 0.2% |
| Iranian | 20 | 0.0% |
| Irish | 11,369 | 9.7% |
| Iroquois | 3 | 0.0% |
| Italian | 5,086 | 4.4% |
| Jamaican | 79 | 0.1% |
| Japanese | 139 | 0.1% |
| Kenyan | 13 | 0.0% |
| Korean | 256 | 0.2% |
| Laotian | 24 | 0.0% |
| Lebanese | 95 | 0.1% |
| Lithuanian | 120 | 0.1% |
| Macedonian | 107 | 0.1% |
| Malaysian | 126 | 0.1% |
| Mexican | 1,222 | 1.1% |
| Moroccan | 70 | 0.1% |
| Navajo | 7 | 0.0% |
| New Zealander | 11 | 0.0% |
| Nigerian | 35 | 0.0% |
| Northern European | 77 | 0.1% |
| Norwegian | 225 | 0.2% |
| Osage | 2 | 0.0% |
| Pakistani | 8 | 0.0% |
| Palestinian | 62 | 0.1% |
| Panamanian | 42 | 0.0% |
| Pennsylvania German | 2,458 | 2.1% |
| Peruvian | 8 | 0.0% |
| Polish | 2,504 | 2.1% |
| Portuguese | 15 | 0.0% |
| Puerto Rican | 557 | 0.5% |
| Romanian | 103 | 0.1% |
| Russian | 295 | 0.3% |
| Salvadoran | 12 | 0.0% |
| Samoan | 29 | 0.0% |
| Scandinavian | 372 | 0.3% |
| Scotch-Irish | 1,086 | 0.9% |
| Scottish | 2,287 | 2.0% |
| Serbian | 479 | 0.4% |
| Slovak | 652 | 0.6% |
| Slovene | 171 | 0.2% |
| South American | 237 | 0.2% |
| Spaniard | 5 | 0.0% |
| Spanish American | 22 | 0.0% |
| Sri Lankan | 21 | 0.0% |
| Subsaharan African | 208 | 0.2% |
| Sudanese | 29 | 0.0% |
| Swedish | 534 | 0.5% |
| Swiss | 6,575 | 5.6% |
| Syrian | 37 | 0.0% |
| Thai | 141 | 0.1% |
| Ukrainian | 164 | 0.1% |
| Uruguayan | 36 | 0.0% |
| Welsh | 750 | 0.6% |
| Yugoslavian | 45 | 0.0% | View All 103 Rows |
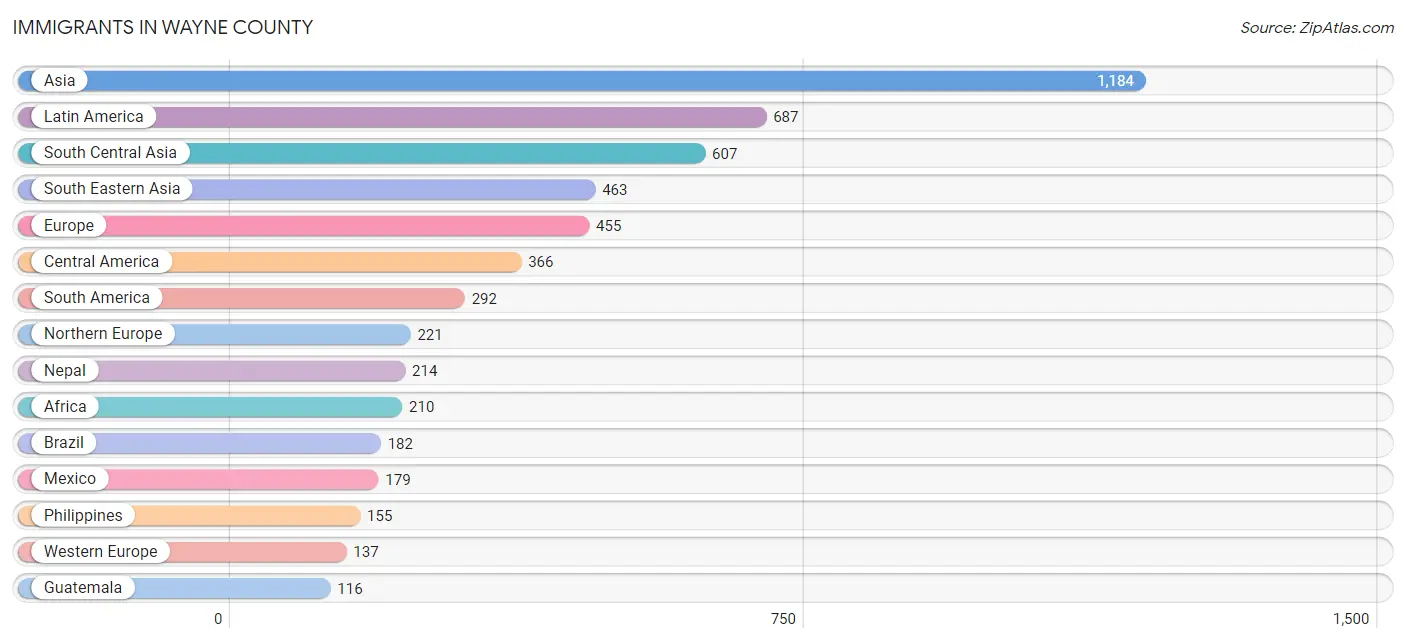
Immigrants in Wayne County
The most numerous immigrant groups reported in Wayne County came from Asia (1,184 | 1.0%), Latin America (687 | 0.6%), South Central Asia (607 | 0.5%), South Eastern Asia (463 | 0.4%), and Europe (455 | 0.4%), together accounting for 2.9% of all Wayne County residents.
| Immigration Origin | # Population | % Population |
| Afghanistan | 3 | 0.0% |
| Africa | 210 | 0.2% |
| Asia | 1,184 | 1.0% |
| Australia | 64 | 0.1% |
| Austria | 15 | 0.0% |
| Brazil | 182 | 0.2% |
| Cambodia | 104 | 0.1% |
| Canada | 100 | 0.1% |
| Caribbean | 29 | 0.0% |
| Central America | 366 | 0.3% |
| China | 39 | 0.0% |
| Colombia | 62 | 0.1% |
| Eastern Africa | 89 | 0.1% |
| Eastern Asia | 99 | 0.1% |
| Eastern Europe | 96 | 0.1% |
| Ecuador | 31 | 0.0% |
| El Salvador | 45 | 0.0% |
| England | 111 | 0.1% |
| Ethiopia | 76 | 0.1% |
| Europe | 455 | 0.4% |
| France | 15 | 0.0% |
| Germany | 99 | 0.1% |
| Guatemala | 116 | 0.1% |
| Honduras | 26 | 0.0% |
| India | 87 | 0.1% |
| Indonesia | 24 | 0.0% |
| Iran | 16 | 0.0% |
| Jamaica | 29 | 0.0% |
| Kenya | 13 | 0.0% |
| Korea | 50 | 0.0% |
| Laos | 89 | 0.1% |
| Latin America | 687 | 0.6% |
| Malaysia | 61 | 0.1% |
| Mexico | 179 | 0.2% |
| Morocco | 9 | 0.0% |
| Nepal | 214 | 0.2% |
| Netherlands | 8 | 0.0% |
| Nigeria | 63 | 0.1% |
| North Macedonia | 18 | 0.0% |
| Northern Africa | 38 | 0.0% |
| Northern Europe | 221 | 0.2% |
| Oceania | 80 | 0.1% |
| Pakistan | 72 | 0.1% |
| Philippines | 155 | 0.1% |
| Poland | 13 | 0.0% |
| Romania | 22 | 0.0% |
| Russia | 10 | 0.0% |
| Saudi Arabia | 2 | 0.0% |
| Scotland | 62 | 0.1% |
| South Africa | 6 | 0.0% |
| South America | 292 | 0.3% |
| South Central Asia | 607 | 0.5% |
| South Eastern Asia | 463 | 0.4% |
| Southern Europe | 1 | 0.0% |
| Spain | 1 | 0.0% |
| Sri Lanka | 37 | 0.0% |
| Sudan | 29 | 0.0% |
| Thailand | 9 | 0.0% |
| Ukraine | 7 | 0.0% |
| Uruguay | 17 | 0.0% |
| Vietnam | 21 | 0.0% |
| Western Africa | 63 | 0.1% |
| Western Asia | 15 | 0.0% |
| Western Europe | 137 | 0.1% | View All 64 Rows |
Sex and Age in Wayne County
Sex and Age in Wayne County
The most populous age groups in Wayne County are 20 to 24 Years (4,410 | 7.6%) for men and 15 to 19 Years (4,417 | 7.5%) for women.
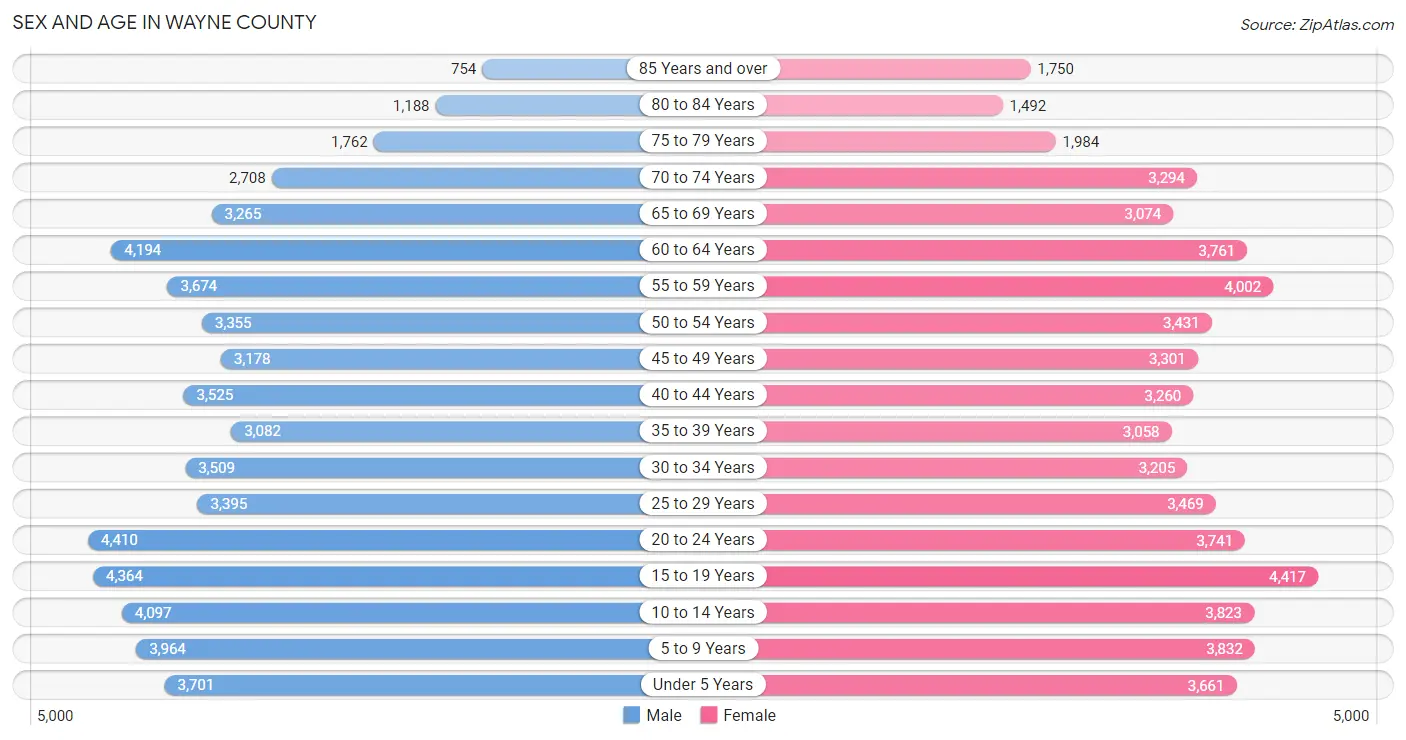
| Age Bracket | Male | Female |
| Under 5 Years | 3,701 (6.4%) | 3,661 (6.2%) |
| 5 to 9 Years | 3,964 (6.8%) | 3,832 (6.5%) |
| 10 to 14 Years | 4,097 (7.0%) | 3,823 (6.5%) |
| 15 to 19 Years | 4,364 (7.5%) | 4,417 (7.5%) |
| 20 to 24 Years | 4,410 (7.6%) | 3,741 (6.4%) |
| 25 to 29 Years | 3,395 (5.8%) | 3,469 (5.9%) |
| 30 to 34 Years | 3,509 (6.0%) | 3,205 (5.5%) |
| 35 to 39 Years | 3,082 (5.3%) | 3,058 (5.2%) |
| 40 to 44 Years | 3,525 (6.1%) | 3,260 (5.6%) |
| 45 to 49 Years | 3,178 (5.5%) | 3,301 (5.6%) |
| 50 to 54 Years | 3,355 (5.8%) | 3,431 (5.9%) |
| 55 to 59 Years | 3,674 (6.3%) | 4,002 (6.8%) |
| 60 to 64 Years | 4,194 (7.2%) | 3,761 (6.4%) |
| 65 to 69 Years | 3,265 (5.6%) | 3,074 (5.2%) |
| 70 to 74 Years | 2,708 (4.7%) | 3,294 (5.6%) |
| 75 to 79 Years | 1,762 (3.0%) | 1,984 (3.4%) |
| 80 to 84 Years | 1,188 (2.0%) | 1,492 (2.5%) |
| 85 Years and over | 754 (1.3%) | 1,750 (3.0%) |
| Total | 58,125 (100.0%) | 58,555 (100.0%) |
Families and Households in Wayne County
Median Family Size in Wayne County
The median family size in Wayne County is 3.11 persons per family, with married-couple families (24,603 | 82.0%) accounting for the largest median family size of 3.2 persons per family. On the other hand, single male/father families (1,841 | 6.1%) represent the smallest median family size with 2.58 persons per family.
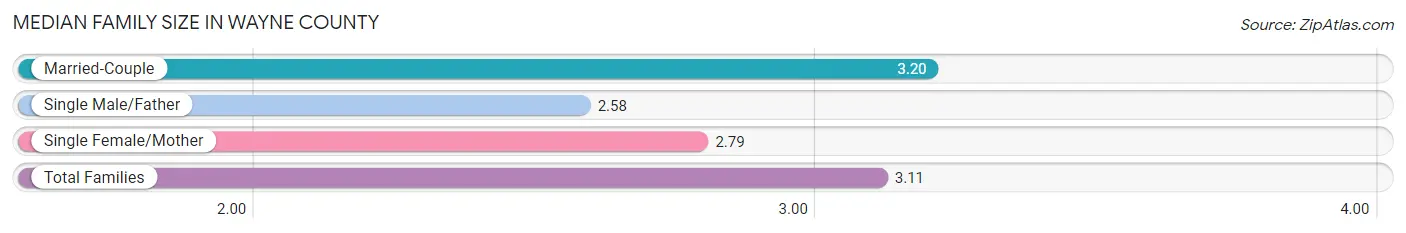
| Family Type | # Families | Family Size |
| Married-Couple | 24,603 (82.0%) | 3.20 |
| Single Male/Father | 1,841 (6.1%) | 2.58 |
| Single Female/Mother | 3,558 (11.9%) | 2.79 |
| Total Families | 30,002 (100.0%) | 3.11 |
Median Household Size in Wayne County
The median household size in Wayne County is 2.54 persons per household, with married-couple households (24,603 | 55.7%) accounting for the largest median household size of 3.22 persons per household. non-family households (14,204 | 32.1%) represent the smallest median household size with 1.17 persons per household.
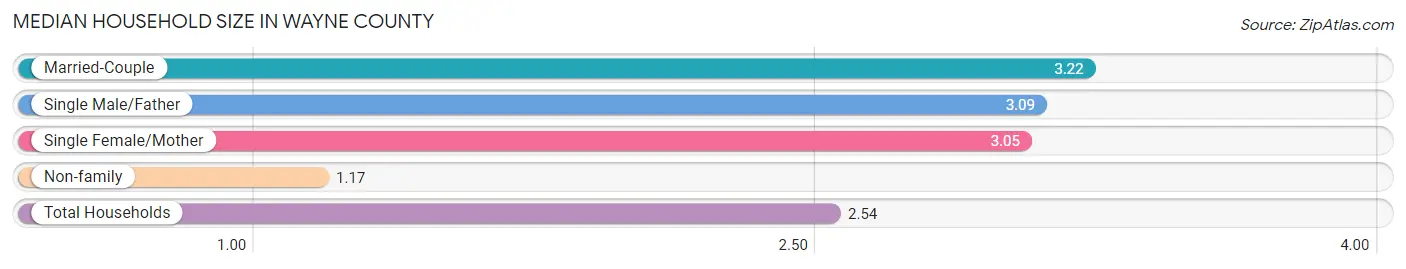
| Household Type | # Households | Household Size |
| Married-Couple | 24,603 (55.7%) | 3.22 |
| Single Male/Father | 1,841 (4.2%) | 3.09 |
| Single Female/Mother | 3,558 (8.1%) | 3.05 |
| Non-family | 14,204 (32.1%) | 1.17 |
| Total Households | 44,206 (100.0%) | 2.54 |
Household Size by Marriage Status in Wayne County
Out of a total of 44,206 households in Wayne County, 30,002 (67.9%) are family households, while 14,204 (32.1%) are nonfamily households. The most numerous type of family households are 2-person households, comprising 14,047, and the most common type of nonfamily households are 1-person households, comprising 12,150.
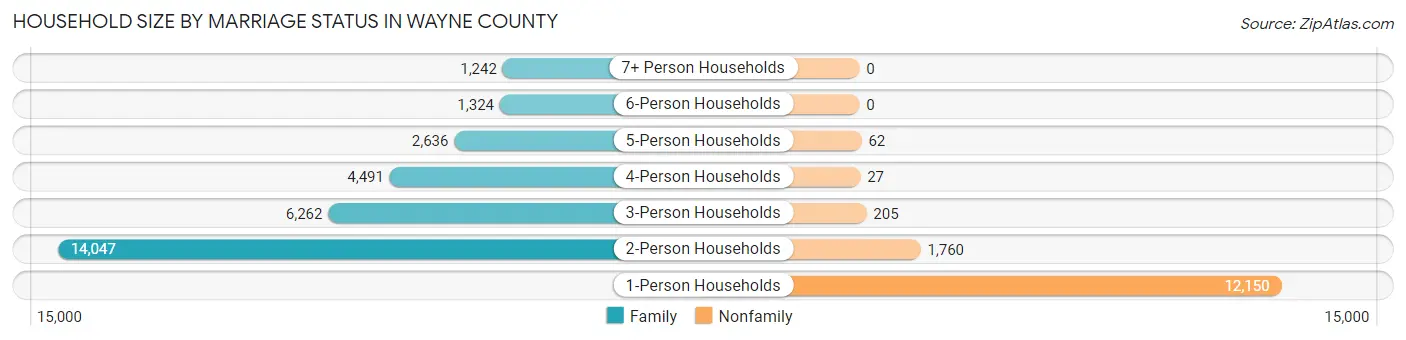
| Household Size | Family Households | Nonfamily Households |
| 1-Person Households | - | 12,150 (27.5%) |
| 2-Person Households | 14,047 (31.8%) | 1,760 (4.0%) |
| 3-Person Households | 6,262 (14.2%) | 205 (0.5%) |
| 4-Person Households | 4,491 (10.2%) | 27 (0.1%) |
| 5-Person Households | 2,636 (6.0%) | 62 (0.1%) |
| 6-Person Households | 1,324 (3.0%) | 0 (0.0%) |
| 7+ Person Households | 1,242 (2.8%) | 0 (0.0%) |
| Total | 30,002 (67.9%) | 14,204 (32.1%) |
Female Fertility in Wayne County
Fertility by Age in Wayne County
Average fertility rate in Wayne County is 71.0 births per 1,000 women. Women in the age bracket of 20 to 34 years have the highest fertility rate with 135.0 births per 1,000 women. Women in the age bracket of 20 to 34 years acount for 79.0% of all women with births.
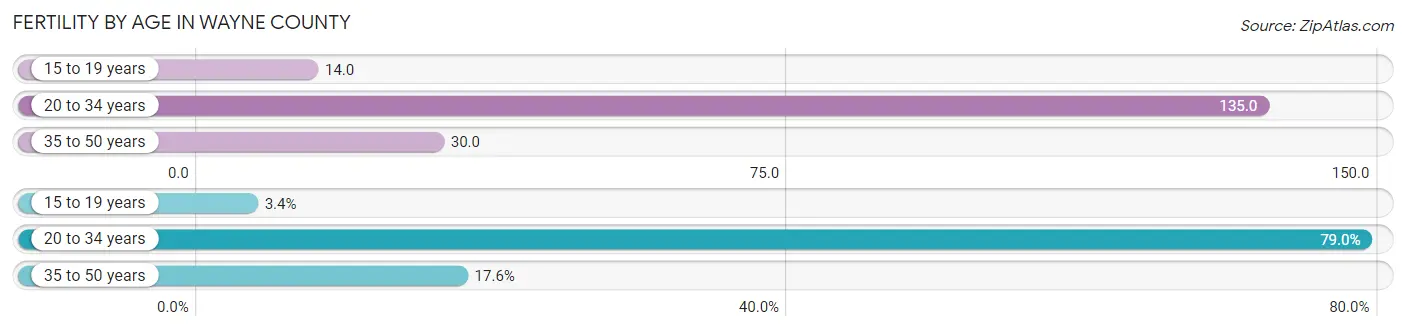
| Age Bracket | Women with Births | Births / 1,000 Women |
| 15 to 19 years | 60 (3.4%) | 14.0 |
| 20 to 34 years | 1,408 (79.0%) | 135.0 |
| 35 to 50 years | 314 (17.6%) | 30.0 |
| Total | 1,782 (100.0%) | 71.0 |
Fertility by Age by Marriage Status in Wayne County
77.2% of women with births (1,782) in Wayne County are married. The highest percentage of unmarried women with births falls into 15 to 19 years age bracket with 100.0% of them unmarried at the time of birth, while the lowest percentage of unmarried women with births belong to 35 to 50 years age bracket with 13.4% of them unmarried.
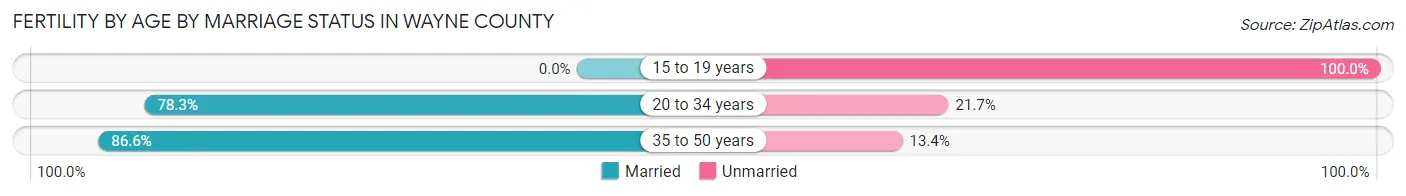
| Age Bracket | Married | Unmarried |
| 15 to 19 years | 0 (0.0%) | 60 (100.0%) |
| 20 to 34 years | 1,102 (78.3%) | 306 (21.7%) |
| 35 to 50 years | 272 (86.6%) | 42 (13.4%) |
| Total | 1,376 (77.2%) | 406 (22.8%) |
Fertility by Education in Wayne County
Average fertility rate in Wayne County is 71.0 births per 1,000 women. Women with the education attainment of graduate degree have the highest fertility rate of 92.0 births per 1,000 women, while women with the education attainment of college or associate's degree have the lowest fertility at 51.0 births per 1,000 women. Women with the education attainment of less than high school represent 30.2% of all women with births.
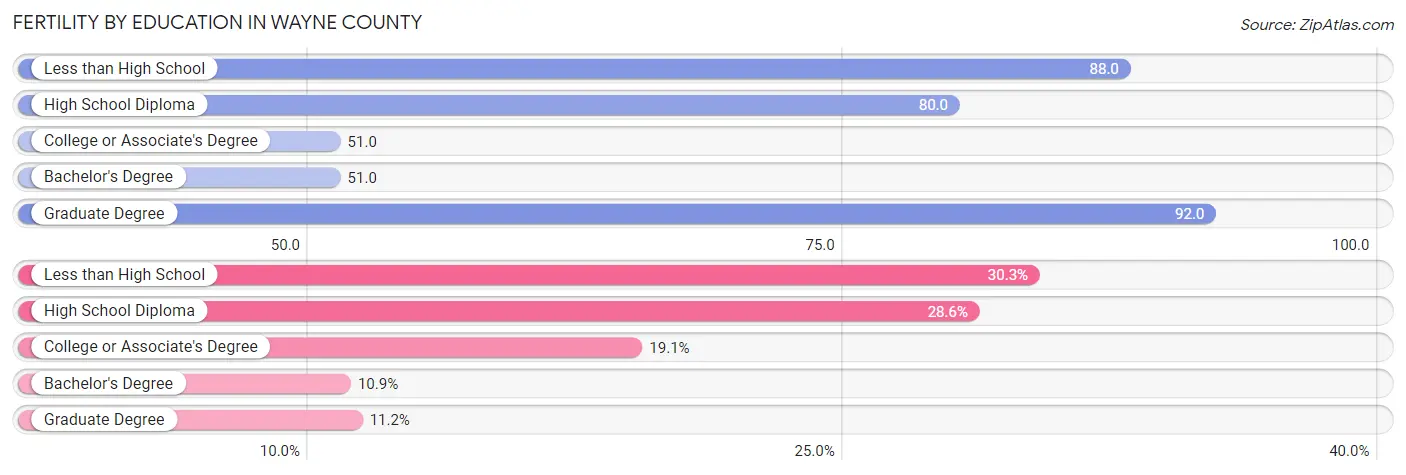
| Educational Attainment | Women with Births | Births / 1,000 Women |
| Less than High School | 539 (30.2%) | 88.0 |
| High School Diploma | 509 (28.6%) | 80.0 |
| College or Associate's Degree | 340 (19.1%) | 51.0 |
| Bachelor's Degree | 194 (10.9%) | 51.0 |
| Graduate Degree | 200 (11.2%) | 92.0 |
| Total | 1,782 (100.0%) | 71.0 |
Fertility by Education by Marriage Status in Wayne County
22.8% of women with births in Wayne County are unmarried. Women with the educational attainment of bachelor's degree are most likely to be married with 100.0% of them married at childbirth, while women with the educational attainment of college or associate's degree are least likely to be married with 43.5% of them unmarried at childbirth.
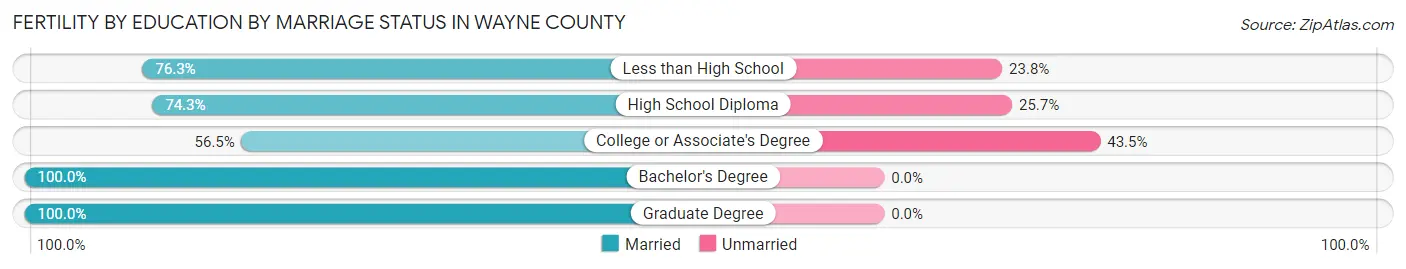
| Educational Attainment | Married | Unmarried |
| Less than High School | 411 (76.2%) | 128 (23.7%) |
| High School Diploma | 378 (74.3%) | 131 (25.7%) |
| College or Associate's Degree | 192 (56.5%) | 148 (43.5%) |
| Bachelor's Degree | 194 (100.0%) | 0 (0.0%) |
| Graduate Degree | 200 (100.0%) | 0 (0.0%) |
| Total | 1,376 (77.2%) | 406 (22.8%) |
Income in Wayne County
Income Overview in Wayne County
Per Capita Income in Wayne County is $32,908, while median incomes of families and households are $83,546 and $70,320 respectively.
| Characteristic | Number | Measure |
| Per Capita Income | 116,680 | $32,908 |
| Median Family Income | 30,002 | $83,546 |
| Mean Family Income | 30,002 | $101,435 |
| Median Household Income | 44,206 | $70,320 |
| Mean Household Income | 44,206 | $86,188 |
| Income Deficit | 30,002 | $8,900 |
| Wage / Income Gap (%) | 116,680 | 42.87% |
| Wage / Income Gap ($) | 116,680 | 57.13¢ per $1 |
| Gini / Inequality Index | 116,680 | 0.41 |
Earnings by Sex in Wayne County
Average Earnings in Wayne County are $37,892, $47,509 for men and $27,141 for women, a difference of 42.9%.
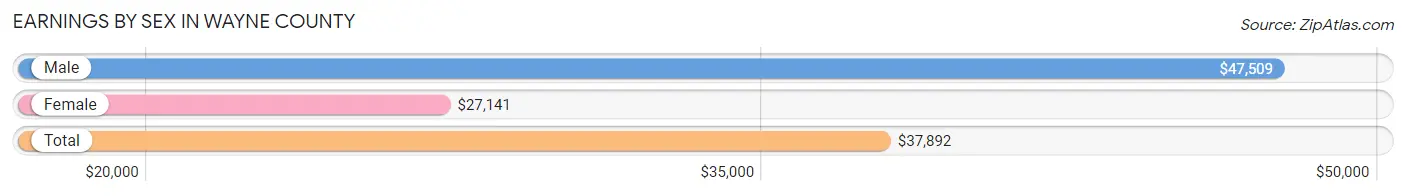
| Sex | Number | Average Earnings |
| Male | 33,456 (55.3%) | $47,509 |
| Female | 27,042 (44.7%) | $27,141 |
| Total | 60,498 (100.0%) | $37,892 |
Earnings by Sex by Income Bracket in Wayne County
The most common earnings brackets in Wayne County are $100,000+ for men (4,242 | 12.7%) and $2,499 or less for women (2,276 | 8.4%).
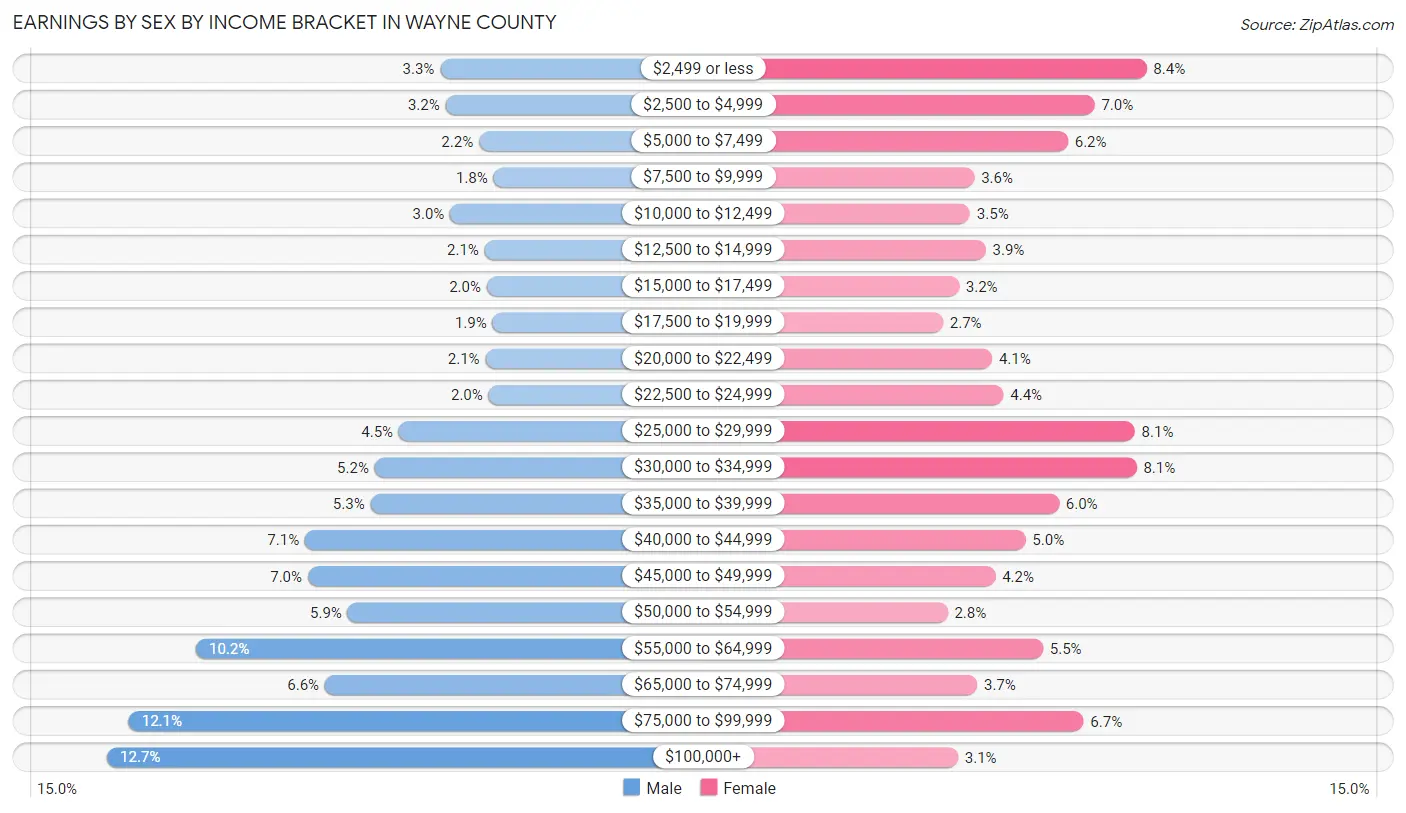
| Income | Male | Female |
| $2,499 or less | 1,112 (3.3%) | 2,276 (8.4%) |
| $2,500 to $4,999 | 1,061 (3.2%) | 1,881 (7.0%) |
| $5,000 to $7,499 | 746 (2.2%) | 1,680 (6.2%) |
| $7,500 to $9,999 | 609 (1.8%) | 967 (3.6%) |
| $10,000 to $12,499 | 1,018 (3.0%) | 935 (3.5%) |
| $12,500 to $14,999 | 693 (2.1%) | 1,055 (3.9%) |
| $15,000 to $17,499 | 671 (2.0%) | 851 (3.2%) |
| $17,500 to $19,999 | 618 (1.8%) | 730 (2.7%) |
| $20,000 to $22,499 | 687 (2.1%) | 1,104 (4.1%) |
| $22,500 to $24,999 | 655 (2.0%) | 1,189 (4.4%) |
| $25,000 to $29,999 | 1,499 (4.5%) | 2,188 (8.1%) |
| $30,000 to $34,999 | 1,725 (5.2%) | 2,200 (8.1%) |
| $35,000 to $39,999 | 1,765 (5.3%) | 1,613 (6.0%) |
| $40,000 to $44,999 | 2,382 (7.1%) | 1,357 (5.0%) |
| $45,000 to $49,999 | 2,354 (7.0%) | 1,129 (4.2%) |
| $50,000 to $54,999 | 1,982 (5.9%) | 764 (2.8%) |
| $55,000 to $64,999 | 3,405 (10.2%) | 1,491 (5.5%) |
| $65,000 to $74,999 | 2,194 (6.6%) | 991 (3.7%) |
| $75,000 to $99,999 | 4,038 (12.1%) | 1,797 (6.7%) |
| $100,000+ | 4,242 (12.7%) | 844 (3.1%) |
| Total | 33,456 (100.0%) | 27,042 (100.0%) |
Earnings by Sex by Educational Attainment in Wayne County
Average earnings in Wayne County are $53,983 for men and $31,456 for women, a difference of 41.7%. Men with an educational attainment of bachelor's degree enjoy the highest average annual earnings of $76,205, while those with high school diploma education earn the least with $48,731. Women with an educational attainment of graduate degree earn the most with the average annual earnings of $62,016, while those with less than high school education have the smallest earnings of $20,458.
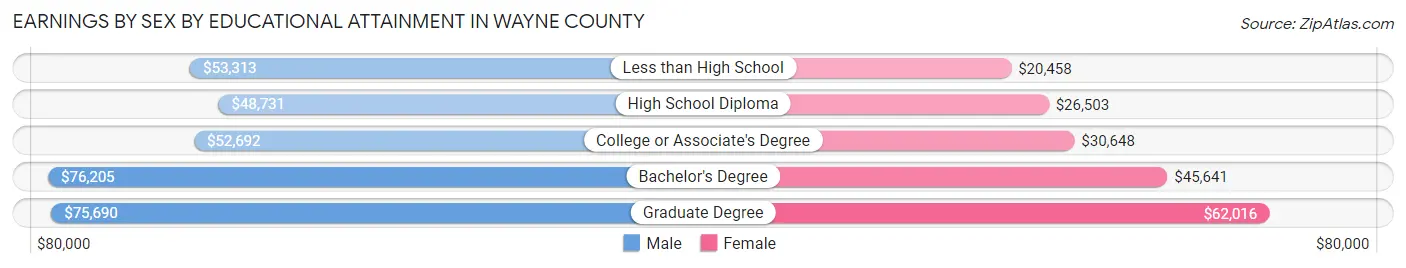
| Educational Attainment | Male Income | Female Income |
| Less than High School | $53,313 | $20,458 |
| High School Diploma | $48,731 | $26,503 |
| College or Associate's Degree | $52,692 | $30,648 |
| Bachelor's Degree | $76,205 | $45,641 |
| Graduate Degree | $75,690 | $62,016 |
| Total | $53,983 | $31,456 |
Family Income in Wayne County
Family Income Brackets in Wayne County
According to the Wayne County family income data, there are 7,320 families falling into the $100,000 to $149,999 income range, which is the most common income bracket and makes up 24.4% of all families. Conversely, the $10,000 to $14,999 income bracket is the least frequent group with only 330 families (1.1%) belonging to this category.
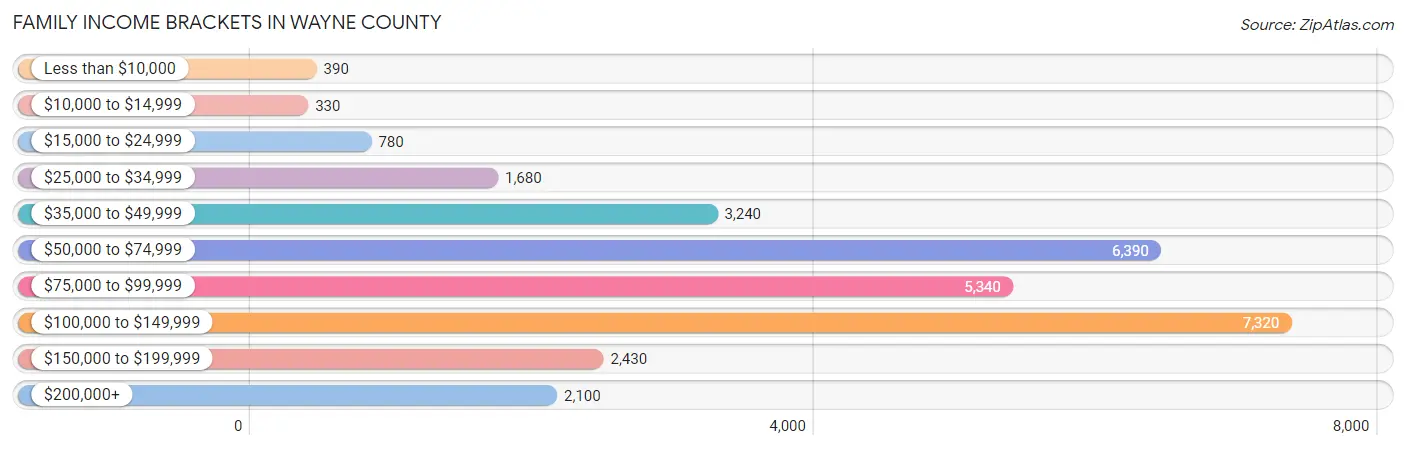
| Income Bracket | # Families | % Families |
| Less than $10,000 | 390 | 1.3% |
| $10,000 to $14,999 | 330 | 1.1% |
| $15,000 to $24,999 | 780 | 2.6% |
| $25,000 to $34,999 | 1,680 | 5.6% |
| $35,000 to $49,999 | 3,240 | 10.8% |
| $50,000 to $74,999 | 6,390 | 21.3% |
| $75,000 to $99,999 | 5,340 | 17.8% |
| $100,000 to $149,999 | 7,320 | 24.4% |
| $150,000 to $199,999 | 2,430 | 8.1% |
| $200,000+ | 2,100 | 7.0% |
Family Income by Famaliy Size in Wayne County
4-person families (4,231 | 14.1%) account for the highest median family income in Wayne County with $101,812 per family, while 2-person families (15,115 | 50.4%) have the highest median income of $37,001 per family member.
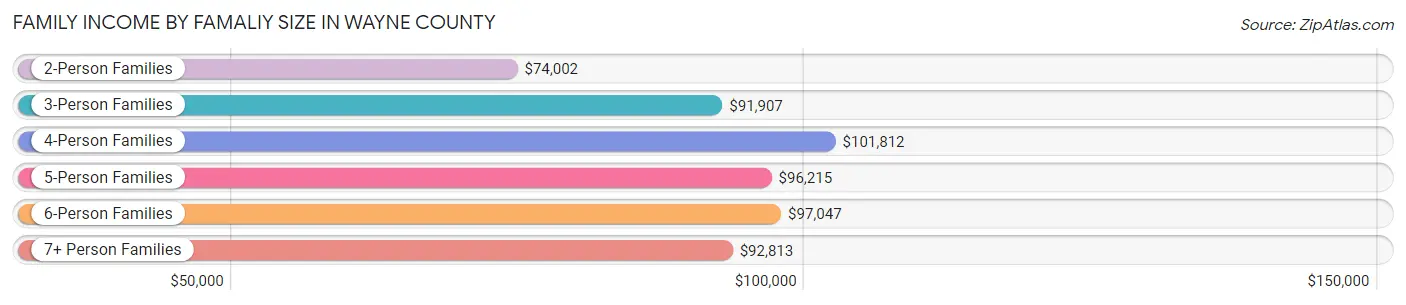
| Income Bracket | # Families | Median Income |
| 2-Person Families | 15,115 (50.4%) | $74,002 |
| 3-Person Families | 5,825 (19.4%) | $91,907 |
| 4-Person Families | 4,231 (14.1%) | $101,812 |
| 5-Person Families | 2,627 (8.8%) | $96,215 |
| 6-Person Families | 1,017 (3.4%) | $97,047 |
| 7+ Person Families | 1,187 (4.0%) | $92,813 |
| Total | 30,002 (100.0%) | $83,546 |
Family Income by Number of Earners in Wayne County
The median family income in Wayne County is $83,546, with families comprising 3+ earners (3,997) having the highest median family income of $140,648, while families with no earners (4,536) have the lowest median family income of $55,072, accounting for 13.3% and 15.1% of families, respectively.
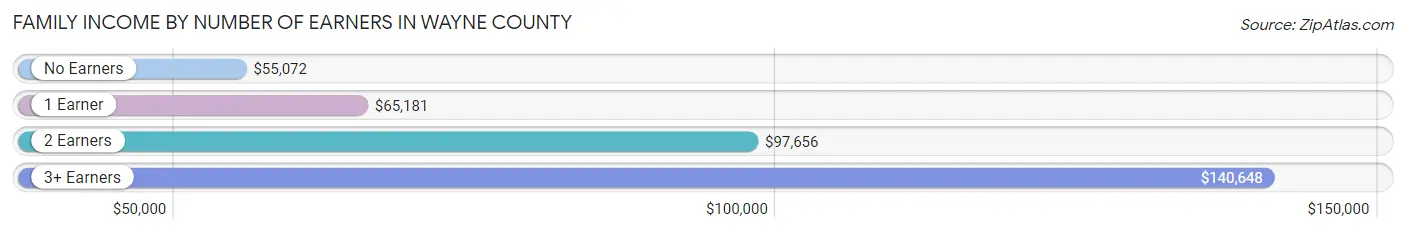
| Number of Earners | # Families | Median Income |
| No Earners | 4,536 (15.1%) | $55,072 |
| 1 Earner | 9,429 (31.4%) | $65,181 |
| 2 Earners | 12,040 (40.1%) | $97,656 |
| 3+ Earners | 3,997 (13.3%) | $140,648 |
| Total | 30,002 (100.0%) | $83,546 |
Household Income in Wayne County
Household Income Brackets in Wayne County
With 8,576 households falling in the category, the $50,000 to $74,999 income range is the most frequent in Wayne County, accounting for 19.4% of all households. In contrast, only 1,282 households (2.9%) fall into the less than $10,000 income bracket, making it the least populous group.
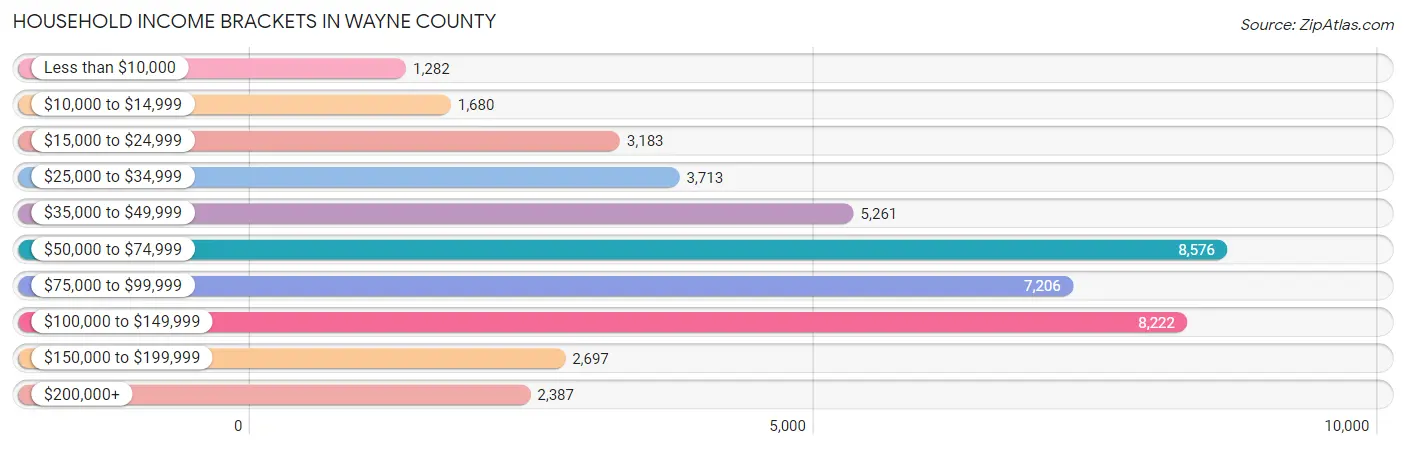
| Income Bracket | # Households | % Households |
| Less than $10,000 | 1,282 | 2.9% |
| $10,000 to $14,999 | 1,680 | 3.8% |
| $15,000 to $24,999 | 3,183 | 7.2% |
| $25,000 to $34,999 | 3,713 | 8.4% |
| $35,000 to $49,999 | 5,261 | 11.9% |
| $50,000 to $74,999 | 8,576 | 19.4% |
| $75,000 to $99,999 | 7,206 | 16.3% |
| $100,000 to $149,999 | 8,222 | 18.6% |
| $150,000 to $199,999 | 2,697 | 6.1% |
| $200,000+ | 2,387 | 5.4% |
Household Income by Householder Age in Wayne County
The median household income in Wayne County is $70,320, with the highest median household income of $83,782 found in the 45 to 64 years age bracket for the primary householder. A total of 16,131 households (36.5%) fall into this category. Meanwhile, the 15 to 24 years age bracket for the primary householder has the lowest median household income of $48,151, with 1,533 households (3.5%) in this group.
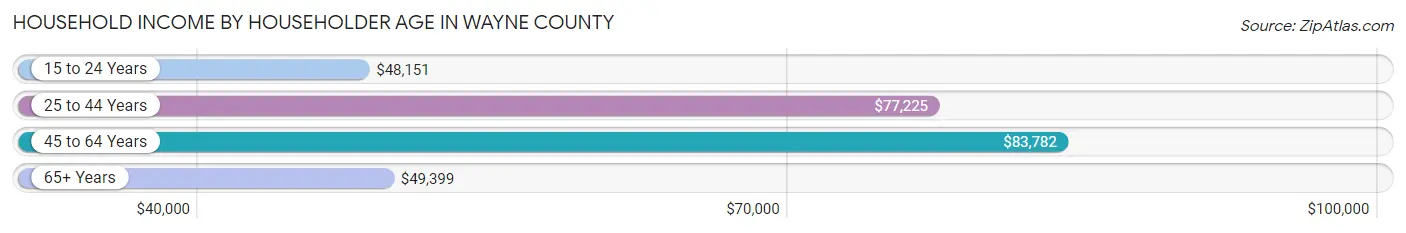
| Income Bracket | # Households | Median Income |
| 15 to 24 Years | 1,533 (3.5%) | $48,151 |
| 25 to 44 Years | 13,204 (29.9%) | $77,225 |
| 45 to 64 Years | 16,131 (36.5%) | $83,782 |
| 65+ Years | 13,338 (30.2%) | $49,399 |
| Total | 44,206 (100.0%) | $70,320 |
Poverty in Wayne County
Income Below Poverty by Sex and Age in Wayne County
With 7.8% poverty level for males and 9.8% for females among the residents of Wayne County, 15 year old males and 5 year old females are the most vulnerable to poverty, with 125 males (15.3%) and 97 females (14.2%) in their respective age groups living below the poverty level.
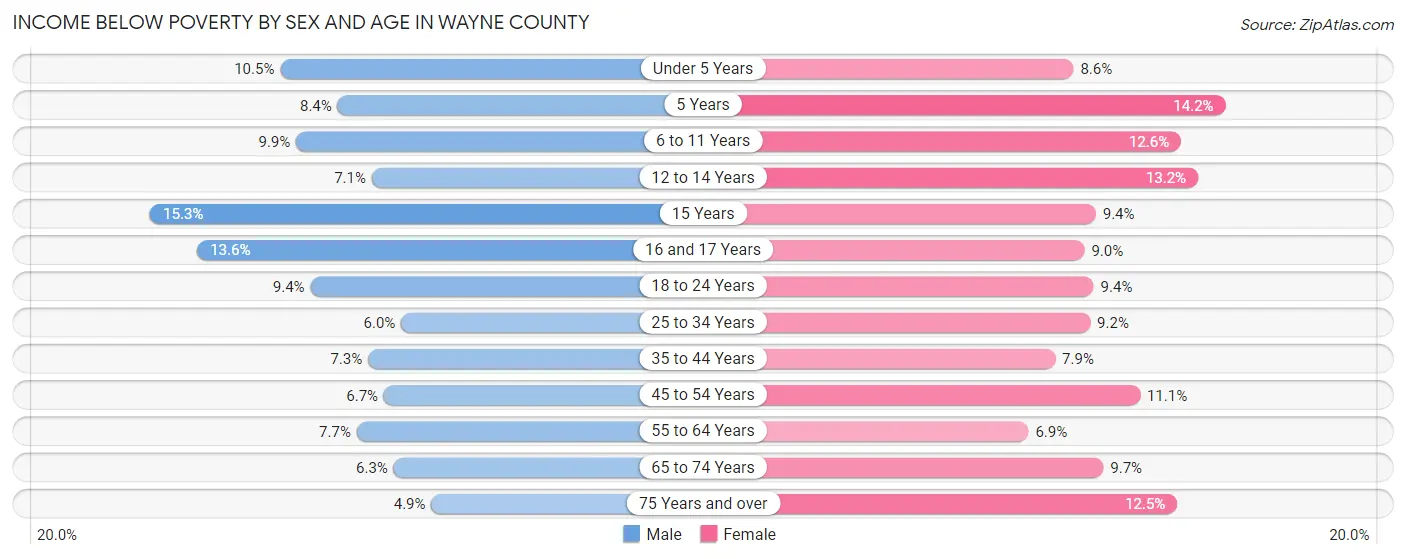
| Age Bracket | Male | Female |
| Under 5 Years | 380 (10.5%) | 310 (8.6%) |
| 5 Years | 60 (8.4%) | 97 (14.2%) |
| 6 to 11 Years | 488 (9.9%) | 565 (12.6%) |
| 12 to 14 Years | 166 (7.1%) | 315 (13.2%) |
| 15 Years | 125 (15.3%) | 100 (9.4%) |
| 16 and 17 Years | 222 (13.6%) | 118 (9.0%) |
| 18 to 24 Years | 491 (9.4%) | 360 (9.3%) |
| 25 to 34 Years | 414 (6.0%) | 614 (9.2%) |
| 35 to 44 Years | 476 (7.2%) | 498 (7.9%) |
| 45 to 54 Years | 433 (6.7%) | 745 (11.1%) |
| 55 to 64 Years | 591 (7.7%) | 534 (6.9%) |
| 65 to 74 Years | 375 (6.3%) | 609 (9.7%) |
| 75 Years and over | 173 (4.9%) | 610 (12.4%) |
| Total | 4,394 (7.8%) | 5,475 (9.8%) |
Income Above Poverty by Sex and Age in Wayne County
According to the poverty statistics in Wayne County, males aged 75 years and over and females aged 55 to 64 years are the age groups that are most secure financially, with 95.1% of males and 93.1% of females in these age groups living above the poverty line.
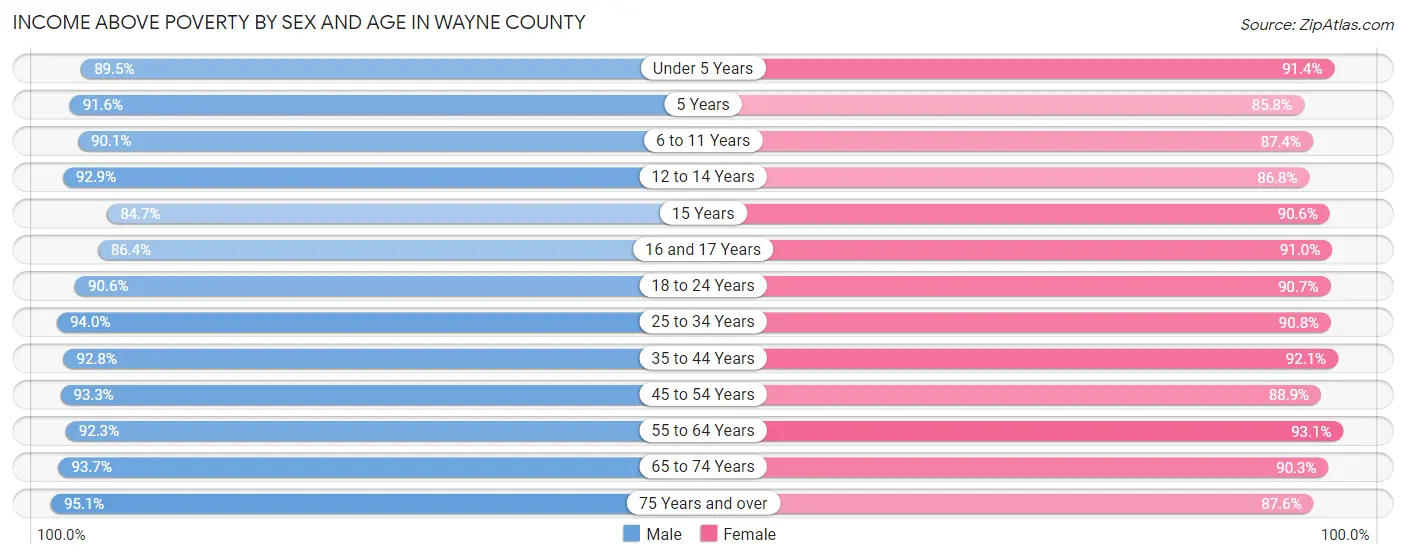
| Age Bracket | Male | Female |
| Under 5 Years | 3,235 (89.5%) | 3,293 (91.4%) |
| 5 Years | 656 (91.6%) | 584 (85.8%) |
| 6 to 11 Years | 4,430 (90.1%) | 3,923 (87.4%) |
| 12 to 14 Years | 2,169 (92.9%) | 2,068 (86.8%) |
| 15 Years | 690 (84.7%) | 960 (90.6%) |
| 16 and 17 Years | 1,412 (86.4%) | 1,191 (91.0%) |
| 18 to 24 Years | 4,736 (90.6%) | 3,490 (90.6%) |
| 25 to 34 Years | 6,459 (94.0%) | 6,049 (90.8%) |
| 35 to 44 Years | 6,091 (92.7%) | 5,791 (92.1%) |
| 45 to 54 Years | 6,064 (93.3%) | 5,985 (88.9%) |
| 55 to 64 Years | 7,117 (92.3%) | 7,173 (93.1%) |
| 65 to 74 Years | 5,581 (93.7%) | 5,662 (90.3%) |
| 75 Years and over | 3,357 (95.1%) | 4,288 (87.5%) |
| Total | 51,997 (92.2%) | 50,457 (90.2%) |
Income Below Poverty Among Married-Couple Families in Wayne County
The poverty statistics for married-couple families in Wayne County show that 2.8% or 694 of the total 24,603 families live below the poverty line. Families with 5 or more children have the highest poverty rate of 22.5%, comprising of 163 families. On the other hand, families with 1 or 2 children have the lowest poverty rate of 1.1%, which includes 71 families.
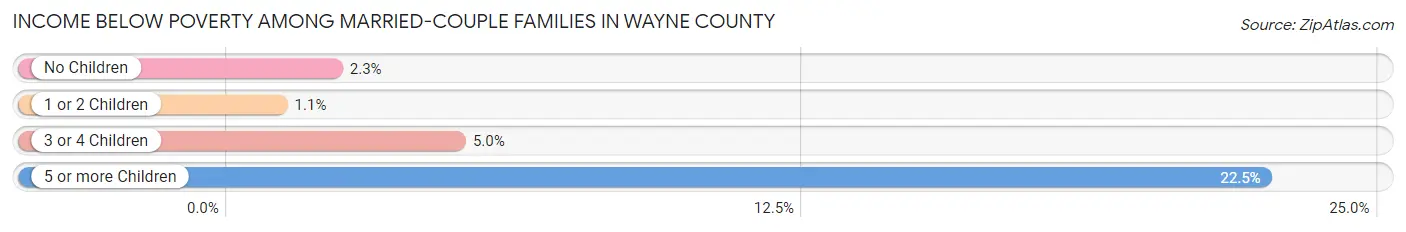
| Children | Above Poverty | Below Poverty |
| No Children | 14,523 (97.7%) | 339 (2.3%) |
| 1 or 2 Children | 6,508 (98.9%) | 71 (1.1%) |
| 3 or 4 Children | 2,317 (95.0%) | 121 (5.0%) |
| 5 or more Children | 561 (77.5%) | 163 (22.5%) |
| Total | 23,909 (97.2%) | 694 (2.8%) |
Income Below Poverty Among Single-Parent Households in Wayne County
According to the poverty data in Wayne County, 9.3% or 171 single-father households and 17.3% or 615 single-mother households are living below the poverty line. Among single-father households, those with 3 or 4 children have the highest poverty rate, with 42 households (15.6%) experiencing poverty. Likewise, among single-mother households, those with 5 or more children have the highest poverty rate, with 23 households (56.1%) falling below the poverty line.
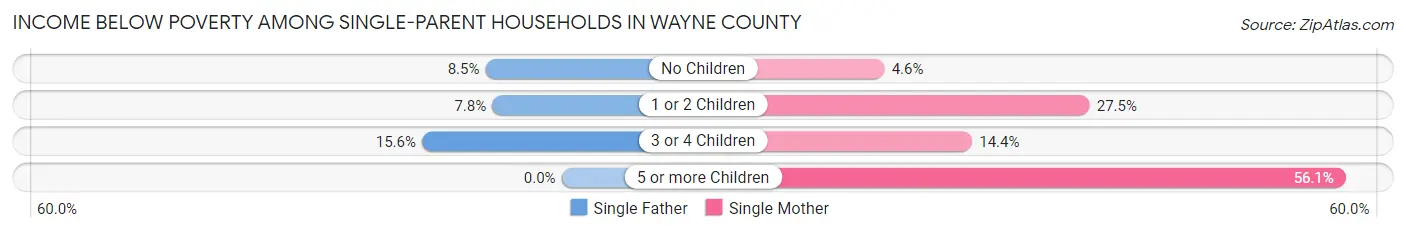
| Children | Single Father | Single Mother |
| No Children | 79 (8.5%) | 71 (4.6%) |
| 1 or 2 Children | 50 (7.8%) | 498 (27.5%) |
| 3 or 4 Children | 42 (15.6%) | 23 (14.4%) |
| 5 or more Children | 0 (0.0%) | 23 (56.1%) |
| Total | 171 (9.3%) | 615 (17.3%) |
Income Below Poverty Among Married-Couple vs Single-Parent Households in Wayne County
The poverty data for Wayne County shows that 694 of the married-couple family households (2.8%) and 786 of the single-parent households (14.6%) are living below the poverty level. Within the married-couple family households, those with 5 or more children have the highest poverty rate, with 163 households (22.5%) falling below the poverty line. Among the single-parent households, those with 5 or more children have the highest poverty rate, with 23 household (56.1%) living below poverty.
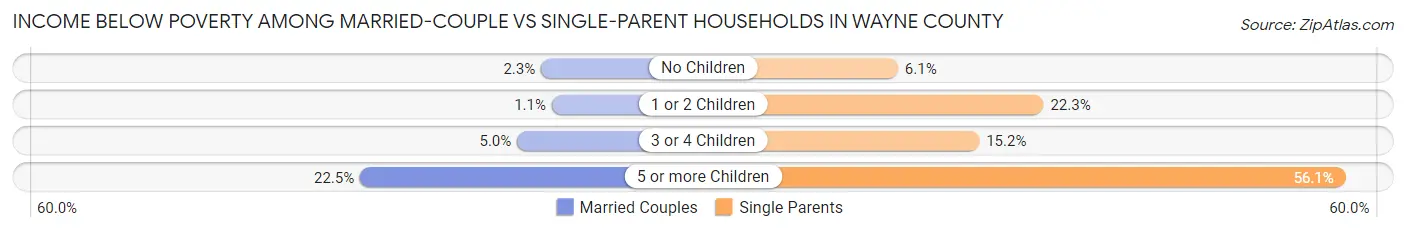
| Children | Married-Couple Families | Single-Parent Households |
| No Children | 339 (2.3%) | 150 (6.1%) |
| 1 or 2 Children | 71 (1.1%) | 548 (22.3%) |
| 3 or 4 Children | 121 (5.0%) | 65 (15.1%) |
| 5 or more Children | 163 (22.5%) | 23 (56.1%) |
| Total | 694 (2.8%) | 786 (14.6%) |
Employment Characteristics in Wayne County
Employment by Class of Employer in Wayne County
Among the 53,961 employed individuals in Wayne County, private company employees (38,064 | 70.5%), not-for-profit organizations (4,550 | 8.4%), and local government employees (4,112 | 7.6%) make up the most common classes of employment.
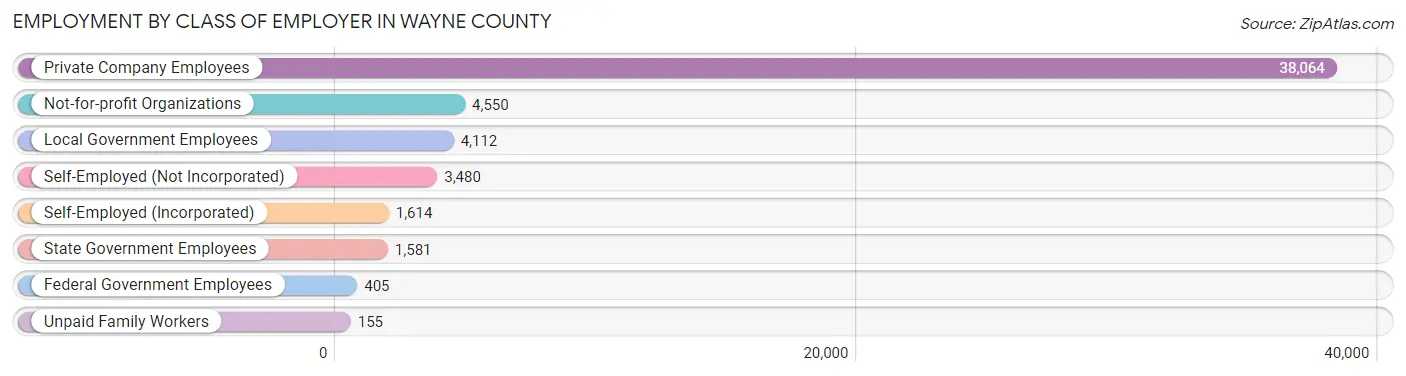
| Employer Class | # Employees | % Employees |
| Private Company Employees | 38,064 | 70.5% |
| Self-Employed (Incorporated) | 1,614 | 3.0% |
| Self-Employed (Not Incorporated) | 3,480 | 6.5% |
| Not-for-profit Organizations | 4,550 | 8.4% |
| Local Government Employees | 4,112 | 7.6% |
| State Government Employees | 1,581 | 2.9% |
| Federal Government Employees | 405 | 0.7% |
| Unpaid Family Workers | 155 | 0.3% |
| Total | 53,961 | 100.0% |
Employment Status by Age in Wayne County
According to the labor force statistics for Wayne County, out of the total population over 16 years of age (91,689), 62.2% or 57,031 individuals are in the labor force, with 3.3% or 1,882 of them unemployed. The age group with the highest labor force participation rate is 30 to 34 years, with 83.5% or 5,606 individuals in the labor force. Within the labor force, the 16 to 19 years age range has the highest percentage of unemployed individuals, with 11.1% or 436 of them being unemployed.
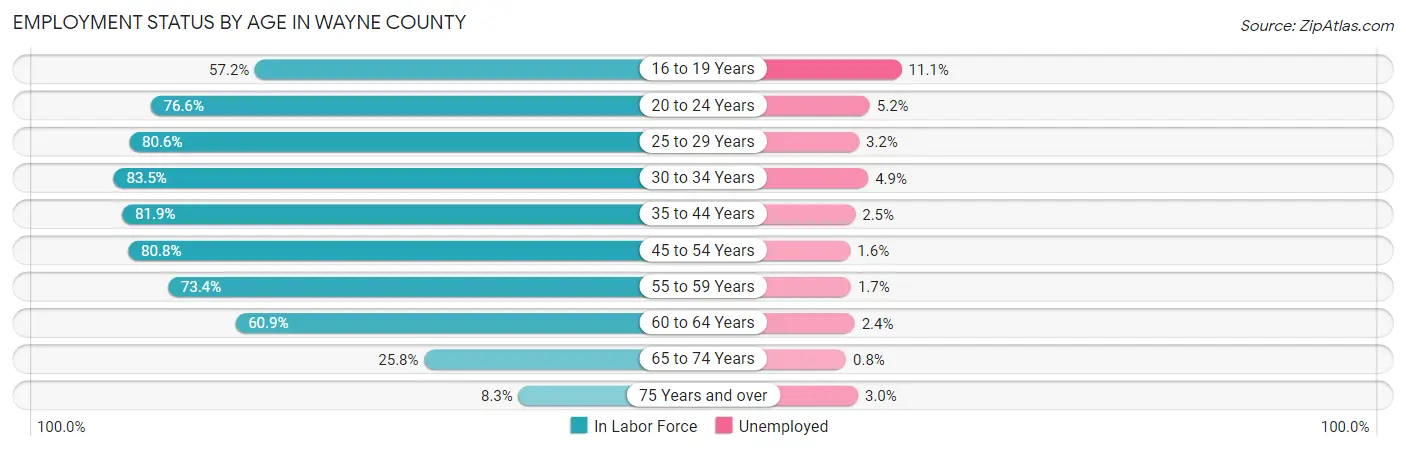
| Age Bracket | In Labor Force | Unemployed |
| 16 to 19 Years | 3,928 (57.2%) | 436 (11.1%) |
| 20 to 24 Years | 6,244 (76.6%) | 325 (5.2%) |
| 25 to 29 Years | 5,532 (80.6%) | 177 (3.2%) |
| 30 to 34 Years | 5,606 (83.5%) | 275 (4.9%) |
| 35 to 44 Years | 10,586 (81.9%) | 265 (2.5%) |
| 45 to 54 Years | 10,718 (80.8%) | 171 (1.6%) |
| 55 to 59 Years | 5,634 (73.4%) | 96 (1.7%) |
| 60 to 64 Years | 4,845 (60.9%) | 116 (2.4%) |
| 65 to 74 Years | 3,184 (25.8%) | 25 (0.8%) |
| 75 Years and over | 741 (8.3%) | 22 (3.0%) |
| Total | 57,031 (62.2%) | 1,882 (3.3%) |
Employment Status by Educational Attainment in Wayne County
According to labor force statistics for Wayne County, 77.5% of individuals (42,934) out of the total population between 25 and 64 years of age (55,399) are in the labor force, with 2.6% or 1,116 of them being unemployed. The group with the highest labor force participation rate are those with the educational attainment of bachelor's degree or higher, with 84.7% or 12,112 individuals in the labor force. Within the labor force, individuals with high school diploma education have the highest percentage of unemployment, with 3.7% or 551 of them being unemployed.
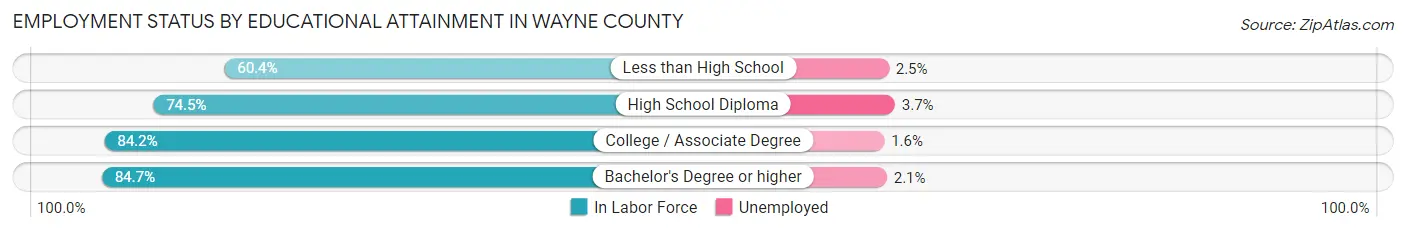
| Educational Attainment | In Labor Force | Unemployed |
| Less than High School | 4,739 (60.4%) | 196 (2.5%) |
| High School Diploma | 14,897 (74.5%) | 740 (3.7%) |
| College / Associate Degree | 11,162 (84.2%) | 212 (1.6%) |
| Bachelor's Degree or higher | 12,112 (84.7%) | 300 (2.1%) |
| Total | 42,934 (77.5%) | 1,440 (2.6%) |
Employment Occupations by Sex in Wayne County
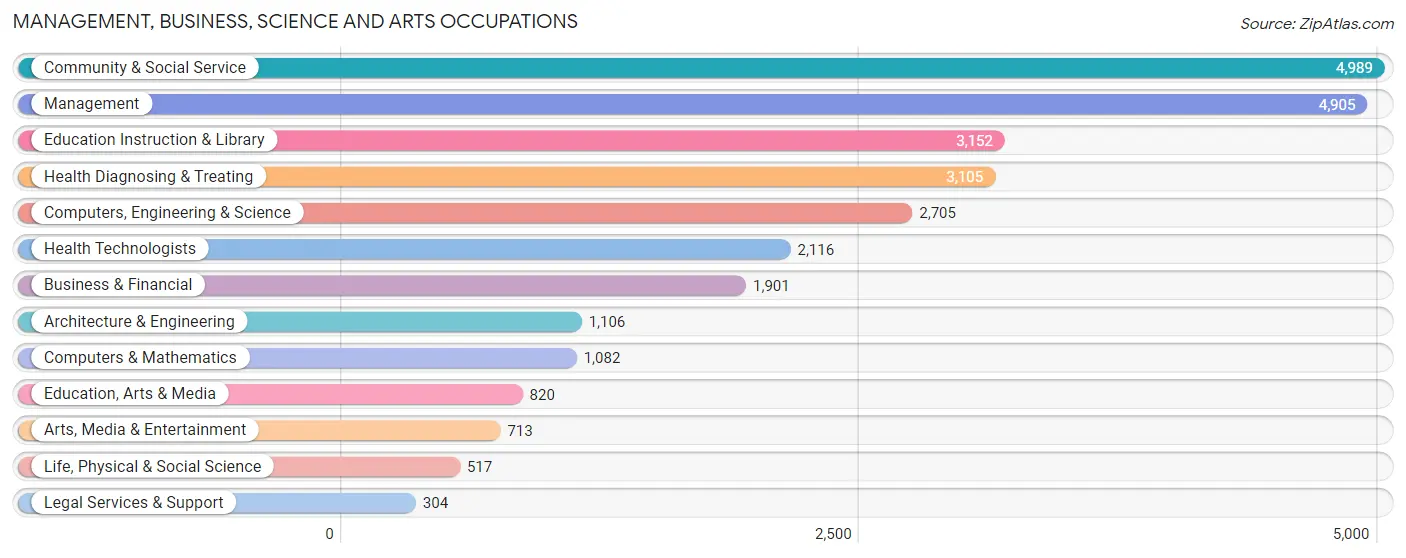
Management, Business, Science and Arts Occupations
The most common Management, Business, Science and Arts occupations in Wayne County are Community & Social Service (4,989 | 9.0%), Management (4,905 | 8.9%), Education Instruction & Library (3,152 | 5.7%), Health Diagnosing & Treating (3,105 | 5.6%), and Computers, Engineering & Science (2,705 | 4.9%).
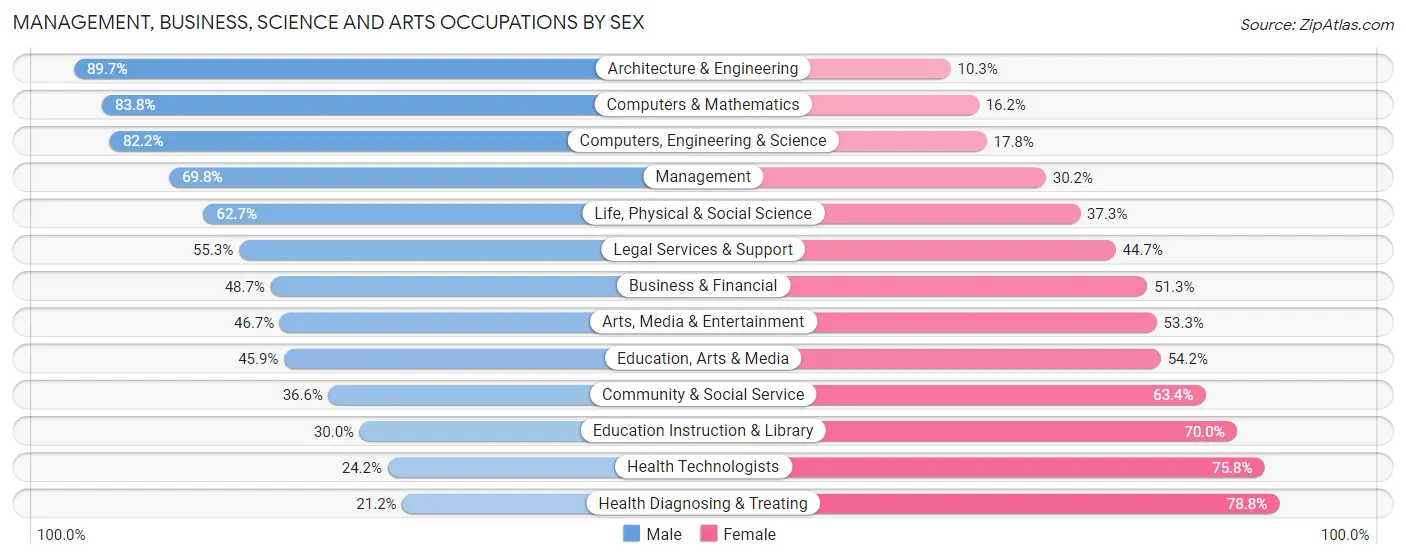
Management, Business, Science and Arts Occupations by Sex
Within the Management, Business, Science and Arts occupations in Wayne County, the most male-oriented occupations are Architecture & Engineering (89.7%), Computers & Mathematics (83.8%), and Computers, Engineering & Science (82.2%), while the most female-oriented occupations are Health Diagnosing & Treating (78.8%), Health Technologists (75.8%), and Education Instruction & Library (70.0%).
| Occupation | Male | Female |
| Management | 3,425 (69.8%) | 1,480 (30.2%) |
| Business & Financial | 925 (48.7%) | 976 (51.3%) |
| Computers, Engineering & Science | 2,223 (82.2%) | 482 (17.8%) |
| Computers & Mathematics | 907 (83.8%) | 175 (16.2%) |
| Architecture & Engineering | 992 (89.7%) | 114 (10.3%) |
| Life, Physical & Social Science | 324 (62.7%) | 193 (37.3%) |
| Community & Social Service | 1,824 (36.6%) | 3,165 (63.4%) |
| Education, Arts & Media | 376 (45.9%) | 444 (54.1%) |
| Legal Services & Support | 168 (55.3%) | 136 (44.7%) |
| Education Instruction & Library | 947 (30.0%) | 2,205 (70.0%) |
| Arts, Media & Entertainment | 333 (46.7%) | 380 (53.3%) |
| Health Diagnosing & Treating | 658 (21.2%) | 2,447 (78.8%) |
| Health Technologists | 513 (24.2%) | 1,603 (75.8%) |
| Total (Category) | 9,055 (51.4%) | 8,550 (48.6%) |
| Total (Overall) | 30,829 (55.9%) | 24,269 (44.1%) |
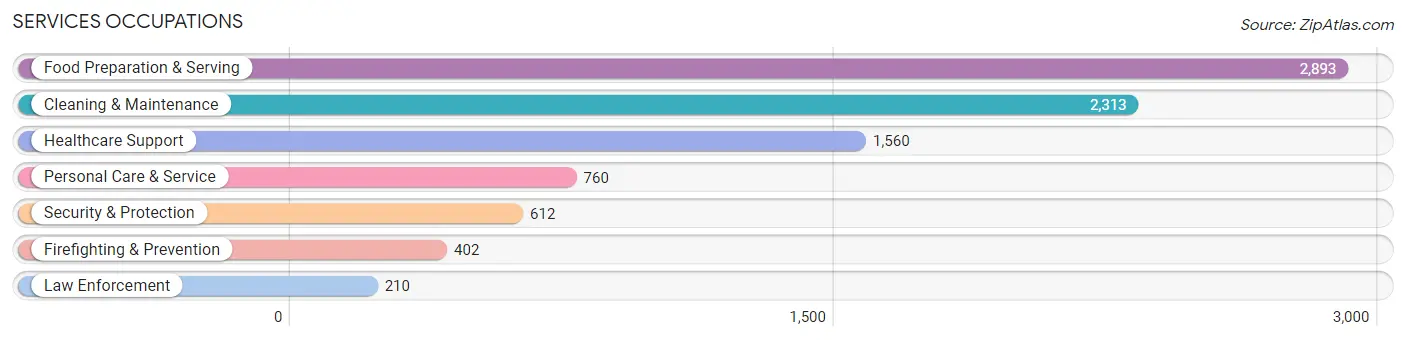
Services Occupations
The most common Services occupations in Wayne County are Food Preparation & Serving (2,893 | 5.2%), Cleaning & Maintenance (2,313 | 4.2%), Healthcare Support (1,560 | 2.8%), Personal Care & Service (760 | 1.4%), and Security & Protection (612 | 1.1%).
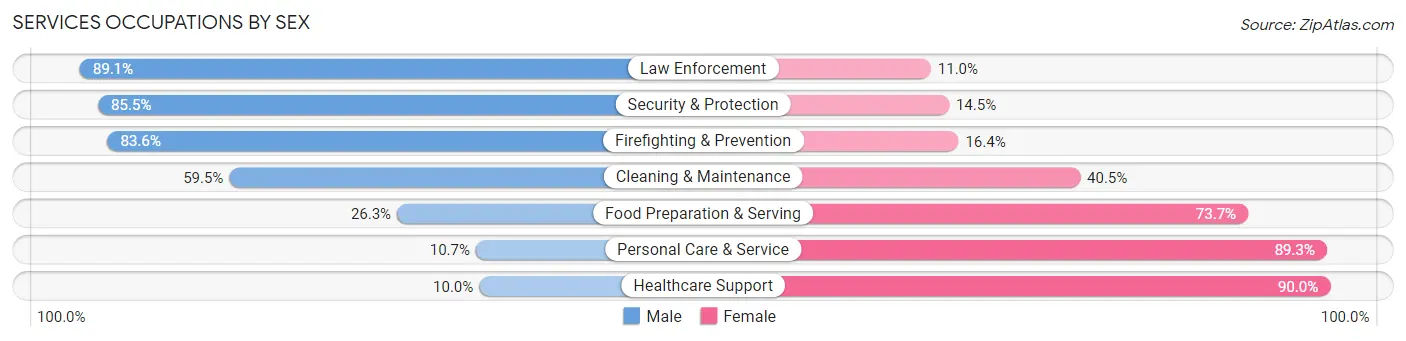
Services Occupations by Sex
Within the Services occupations in Wayne County, the most male-oriented occupations are Law Enforcement (89.0%), Security & Protection (85.5%), and Firefighting & Prevention (83.6%), while the most female-oriented occupations are Healthcare Support (90.0%), Personal Care & Service (89.3%), and Food Preparation & Serving (73.7%).
| Occupation | Male | Female |
| Healthcare Support | 156 (10.0%) | 1,404 (90.0%) |
| Security & Protection | 523 (85.5%) | 89 (14.5%) |
| Firefighting & Prevention | 336 (83.6%) | 66 (16.4%) |
| Law Enforcement | 187 (89.0%) | 23 (11.0%) |
| Food Preparation & Serving | 760 (26.3%) | 2,133 (73.7%) |
| Cleaning & Maintenance | 1,376 (59.5%) | 937 (40.5%) |
| Personal Care & Service | 81 (10.7%) | 679 (89.3%) |
| Total (Category) | 2,896 (35.6%) | 5,242 (64.4%) |
| Total (Overall) | 30,829 (55.9%) | 24,269 (44.1%) |
Sales and Office Occupations
The most common Sales and Office occupations in Wayne County are Office & Administration (6,168 | 11.2%), and Sales & Related (4,453 | 8.1%).

Sales and Office Occupations by Sex
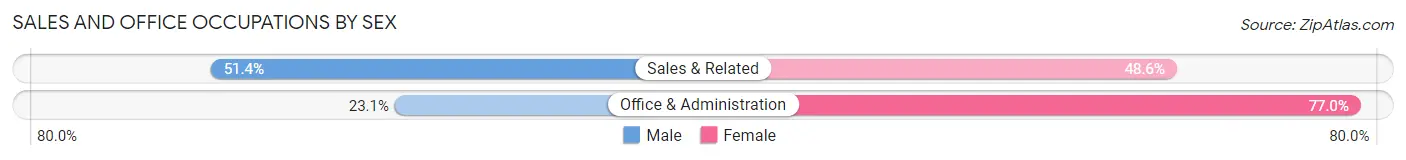
| Occupation | Male | Female |
| Sales & Related | 2,287 (51.4%) | 2,166 (48.6%) |
| Office & Administration | 1,422 (23.1%) | 4,746 (76.9%) |
| Total (Category) | 3,709 (34.9%) | 6,912 (65.1%) |
| Total (Overall) | 30,829 (55.9%) | 24,269 (44.1%) |
Natural Resources, Construction and Maintenance Occupations
The most common Natural Resources, Construction and Maintenance occupations in Wayne County are Construction & Extraction (3,345 | 6.1%), Installation, Maintenance & Repair (2,095 | 3.8%), and Farming, Fishing & Forestry (759 | 1.4%).

Natural Resources, Construction and Maintenance Occupations by Sex
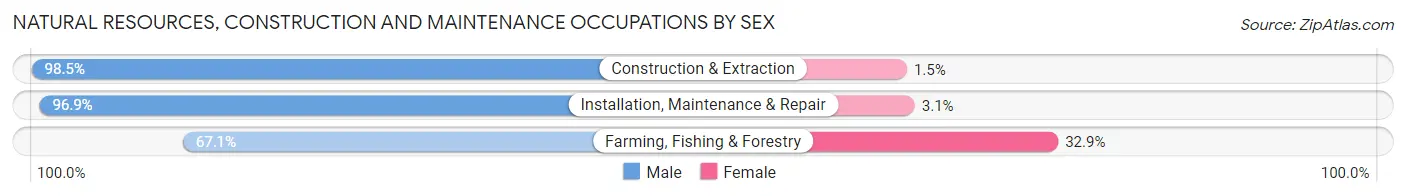
| Occupation | Male | Female |
| Farming, Fishing & Forestry | 509 (67.1%) | 250 (32.9%) |
| Construction & Extraction | 3,296 (98.5%) | 49 (1.5%) |
| Installation, Maintenance & Repair | 2,030 (96.9%) | 65 (3.1%) |
| Total (Category) | 5,835 (94.1%) | 364 (5.9%) |
| Total (Overall) | 30,829 (55.9%) | 24,269 (44.1%) |
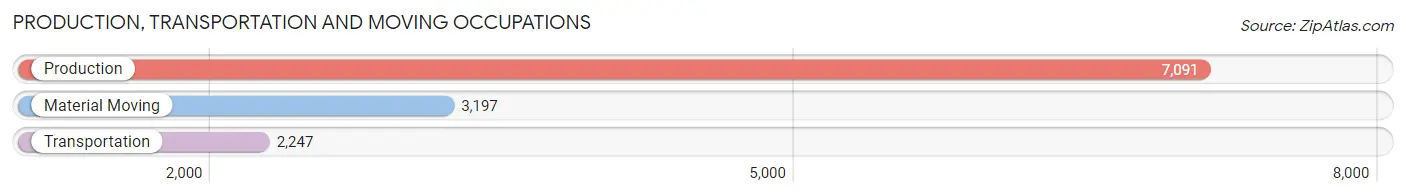
Production, Transportation and Moving Occupations
The most common Production, Transportation and Moving occupations in Wayne County are Production (7,091 | 12.9%), Material Moving (3,197 | 5.8%), and Transportation (2,247 | 4.1%).
Production, Transportation and Moving Occupations by Sex
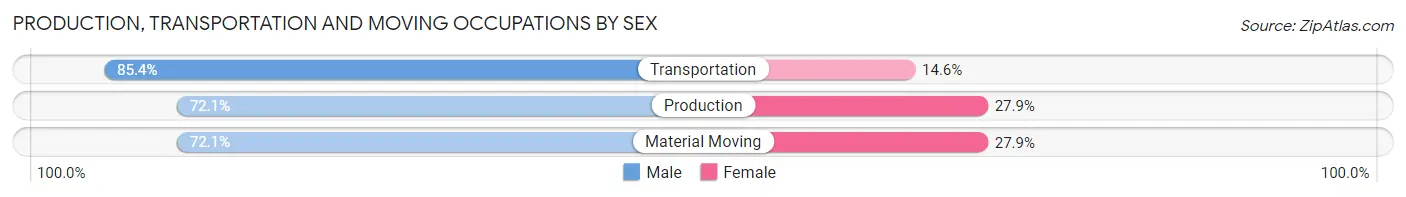
| Occupation | Male | Female |
| Production | 5,111 (72.1%) | 1,980 (27.9%) |
| Transportation | 1,919 (85.4%) | 328 (14.6%) |
| Material Moving | 2,304 (72.1%) | 893 (27.9%) |
| Total (Category) | 9,334 (74.5%) | 3,201 (25.5%) |
| Total (Overall) | 30,829 (55.9%) | 24,269 (44.1%) |
Employment Industries by Sex in Wayne County
Employment Industries in Wayne County
The major employment industries in Wayne County include Manufacturing (13,103 | 23.8%), Health Care & Social Assistance (6,971 | 12.7%), Retail Trade (6,275 | 11.4%), Educational Services (5,322 | 9.7%), and Construction (4,498 | 8.2%).
Employment Industries by Sex in Wayne County
The Wayne County industries that see more men than women are Enterprise Management (95.7%), Construction (91.3%), and Mining, Quarrying, & Extraction (80.2%), whereas the industries that tend to have a higher number of women are Health Care & Social Assistance (80.9%), Accommodation & Food Services (70.2%), and Educational Services (66.1%).
| Industry | Male | Female |
| Agriculture, Fishing & Hunting | 1,356 (78.2%) | 377 (21.7%) |
| Mining, Quarrying, & Extraction | 134 (80.2%) | 33 (19.8%) |
| Construction | 4,107 (91.3%) | 391 (8.7%) |
| Manufacturing | 9,655 (73.7%) | 3,448 (26.3%) |
| Wholesale Trade | 1,076 (79.8%) | 272 (20.2%) |
| Retail Trade | 2,876 (45.8%) | 3,399 (54.2%) |
| Transportation & Warehousing | 1,651 (79.0%) | 439 (21.0%) |
| Utilities | 267 (70.5%) | 112 (29.5%) |
| Information | 274 (62.1%) | 167 (37.9%) |
| Finance & Insurance | 631 (36.6%) | 1,092 (63.4%) |
| Real Estate, Rental & Leasing | 381 (80.2%) | 94 (19.8%) |
| Professional & Scientific | 1,127 (54.7%) | 933 (45.3%) |
| Enterprise Management | 88 (95.7%) | 4 (4.3%) |
| Administrative & Support | 912 (61.5%) | 572 (38.5%) |
| Educational Services | 1,803 (33.9%) | 3,519 (66.1%) |
| Health Care & Social Assistance | 1,331 (19.1%) | 5,640 (80.9%) |
| Arts, Entertainment & Recreation | 208 (56.7%) | 159 (43.3%) |
| Accommodation & Food Services | 889 (29.8%) | 2,097 (70.2%) |
| Public Administration | 734 (58.6%) | 519 (41.4%) |
| Total | 30,829 (55.9%) | 24,269 (44.1%) |
Education in Wayne County
School Enrollment in Wayne County
The most common levels of schooling among the 26,657 students in Wayne County are middle school (6,412 | 24.0%), elementary school (5,959 | 22.4%), and college / undergraduate (5,346 | 20.1%).
| School Level | # Students | % Students |
| Nursery / Preschool | 1,707 | 6.4% |
| Kindergarten | 1,447 | 5.4% |
| Elementary School | 5,959 | 22.4% |
| Middle School | 6,412 | 24.0% |
| High School | 5,079 | 19.1% |
| College / Undergraduate | 5,346 | 20.1% |
| Graduate / Professional | 707 | 2.6% |
| Total | 26,657 | 100.0% |
School Enrollment by Age by Funding Source in Wayne County
Out of a total of 26,657 students who are enrolled in schools in Wayne County, 7,944 (29.8%) attend a private institution, while the remaining 18,713 (70.2%) are enrolled in public schools. The age group of 20 to 24 year olds has the highest likelihood of being enrolled in private schools, with 1,410 (54.5% in the age bracket) enrolled. Conversely, the age group of 15 to 17 year olds has the lowest likelihood of being enrolled in a private school, with 3,792 (93.9% in the age bracket) attending a public institution.
| Age Bracket | Public School | Private School |
| 3 to 4 Year Olds | 708 (70.8%) | 292 (29.2%) |
| 5 to 9 Year Old | 4,743 (64.8%) | 2,573 (35.2%) |
| 10 to 14 Year Olds | 5,887 (78.2%) | 1,644 (21.8%) |
| 15 to 17 Year Olds | 3,792 (93.9%) | 246 (6.1%) |
| 18 to 19 Year Olds | 1,338 (51.3%) | 1,268 (48.7%) |
| 20 to 24 Year Olds | 1,179 (45.5%) | 1,410 (54.5%) |
| 25 to 34 Year Olds | 562 (63.6%) | 322 (36.4%) |
| 35 Years and over | 502 (72.4%) | 191 (27.6%) |
| Total | 18,713 (70.2%) | 7,944 (29.8%) |
Educational Attainment by Field of Study in Wayne County
Education (3,653 | 18.5%), business (3,630 | 18.4%), science & technology (2,148 | 10.9%), bio, nature & agricultural (1,690 | 8.6%), and engineering (1,434 | 7.3%) are the most common fields of study among 19,698 individuals in Wayne County who have obtained a bachelor's degree or higher.
| Field of Study | # Graduates | % Graduates |
| Computers & Mathematics | 639 | 3.2% |
| Bio, Nature & Agricultural | 1,690 | 8.6% |
| Physical & Health Sciences | 597 | 3.0% |
| Psychology | 549 | 2.8% |
| Social Sciences | 990 | 5.0% |
| Engineering | 1,434 | 7.3% |
| Multidisciplinary Studies | 115 | 0.6% |
| Science & Technology | 2,148 | 10.9% |
| Business | 3,630 | 18.4% |
| Education | 3,653 | 18.5% |
| Literature & Languages | 522 | 2.6% |
| Liberal Arts & History | 933 | 4.7% |
| Visual & Performing Arts | 738 | 3.7% |
| Communications | 681 | 3.5% |
| Arts & Humanities | 1,379 | 7.0% |
| Total | 19,698 | 100.0% |
Transportation & Commute in Wayne County
Vehicle Availability by Sex in Wayne County
The most prevalent vehicle ownership categories in Wayne County are males with 2 vehicles (11,736, accounting for 39.2%) and females with 2 vehicles (9,085, making up 51.7%).
| Vehicles Available | Male | Female |
| No Vehicle | 3,026 (10.1%) | 1,588 (7.0%) |
| 1 Vehicle | 3,971 (13.3%) | 3,999 (17.6%) |
| 2 Vehicles | 11,736 (39.2%) | 9,085 (40.0%) |
| 3 Vehicles | 5,927 (19.8%) | 4,300 (19.0%) |
| 4 Vehicles | 3,433 (11.5%) | 2,396 (10.6%) |
| 5 or more Vehicles | 1,861 (6.2%) | 1,328 (5.9%) |
| Total | 29,954 (100.0%) | 22,696 (100.0%) |
Commute Time in Wayne County
The most frequently occuring commute durations in Wayne County are 10 to 14 minutes (9,480 commuters, 18.7%), 5 to 9 minutes (8,312 commuters, 16.4%), and 15 to 19 minutes (7,620 commuters, 15.0%).
| Commute Time | # Commuters | % Commuters |
| Less than 5 Minutes | 4,142 | 8.2% |
| 5 to 9 Minutes | 8,312 | 16.4% |
| 10 to 14 Minutes | 9,480 | 18.7% |
| 15 to 19 Minutes | 7,620 | 15.0% |
| 20 to 24 Minutes | 6,649 | 13.1% |
| 25 to 29 Minutes | 2,764 | 5.5% |
| 30 to 34 Minutes | 4,331 | 8.6% |
| 35 to 39 Minutes | 1,110 | 2.2% |
| 40 to 44 Minutes | 1,373 | 2.7% |
| 45 to 59 Minutes | 2,477 | 4.9% |
| 60 to 89 Minutes | 1,577 | 3.1% |
| 90 or more Minutes | 780 | 1.5% |
Commute Time by Sex in Wayne County
The most common commute times in Wayne County are 10 to 14 minutes (4,998 commuters, 17.5%) for males and 10 to 14 minutes (4,482 commuters, 20.3%) for females.
| Commute Time | Male | Female |
| Less than 5 Minutes | 2,507 (8.8%) | 1,635 (7.4%) |
| 5 to 9 Minutes | 4,118 (14.4%) | 4,194 (19.0%) |
| 10 to 14 Minutes | 4,998 (17.5%) | 4,482 (20.3%) |
| 15 to 19 Minutes | 4,302 (15.1%) | 3,318 (15.0%) |
| 20 to 24 Minutes | 3,566 (12.5%) | 3,083 (14.0%) |
| 25 to 29 Minutes | 1,509 (5.3%) | 1,255 (5.7%) |
| 30 to 34 Minutes | 2,805 (9.8%) | 1,526 (6.9%) |
| 35 to 39 Minutes | 691 (2.4%) | 419 (1.9%) |
| 40 to 44 Minutes | 819 (2.9%) | 554 (2.5%) |
| 45 to 59 Minutes | 1,581 (5.5%) | 896 (4.1%) |
| 60 to 89 Minutes | 1,000 (3.5%) | 577 (2.6%) |
| 90 or more Minutes | 617 (2.2%) | 163 (0.7%) |
Time of Departure to Work by Sex in Wayne County
The most frequent times of departure to work in Wayne County are 7:00 AM to 7:29 AM (4,392, 15.4%) for males and 7:30 AM to 7:59 AM (3,803, 17.2%) for females.
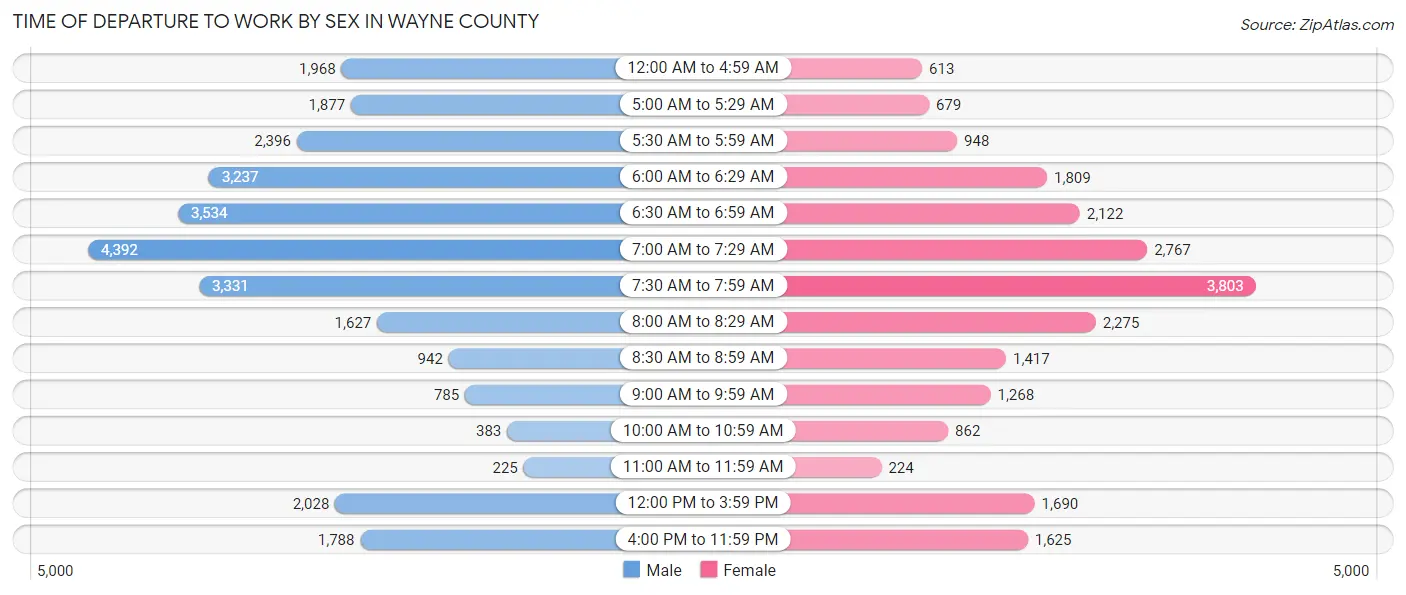
| Time of Departure | Male | Female |
| 12:00 AM to 4:59 AM | 1,968 (6.9%) | 613 (2.8%) |
| 5:00 AM to 5:29 AM | 1,877 (6.6%) | 679 (3.1%) |
| 5:30 AM to 5:59 AM | 2,396 (8.4%) | 948 (4.3%) |
| 6:00 AM to 6:29 AM | 3,237 (11.4%) | 1,809 (8.2%) |
| 6:30 AM to 6:59 AM | 3,534 (12.4%) | 2,122 (9.6%) |
| 7:00 AM to 7:29 AM | 4,392 (15.4%) | 2,767 (12.5%) |
| 7:30 AM to 7:59 AM | 3,331 (11.7%) | 3,803 (17.2%) |
| 8:00 AM to 8:29 AM | 1,627 (5.7%) | 2,275 (10.3%) |
| 8:30 AM to 8:59 AM | 942 (3.3%) | 1,417 (6.4%) |
| 9:00 AM to 9:59 AM | 785 (2.8%) | 1,268 (5.7%) |
| 10:00 AM to 10:59 AM | 383 (1.3%) | 862 (3.9%) |
| 11:00 AM to 11:59 AM | 225 (0.8%) | 224 (1.0%) |
| 12:00 PM to 3:59 PM | 2,028 (7.1%) | 1,690 (7.6%) |
| 4:00 PM to 11:59 PM | 1,788 (6.3%) | 1,625 (7.3%) |
| Total | 28,513 (100.0%) | 22,102 (100.0%) |
Housing Occupancy in Wayne County
Occupancy by Ownership in Wayne County
Of the total 44,206 dwellings in Wayne County, owner-occupied units account for 33,300 (75.3%), while renter-occupied units make up 10,906 (24.7%).
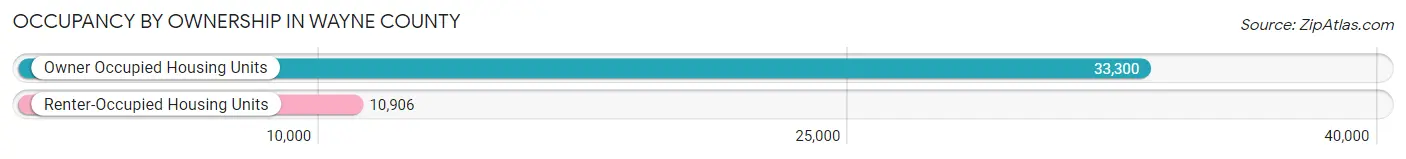
| Occupancy | # Housing Units | % Housing Units |
| Owner Occupied Housing Units | 33,300 | 75.3% |
| Renter-Occupied Housing Units | 10,906 | 24.7% |
| Total Occupied Housing Units | 44,206 | 100.0% |
Occupancy by Household Size in Wayne County
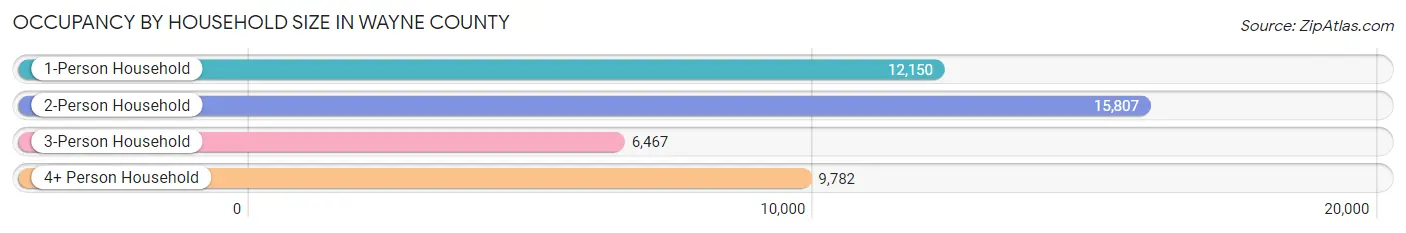
| Household Size | # Housing Units | % Housing Units |
| 1-Person Household | 12,150 | 27.5% |
| 2-Person Household | 15,807 | 35.8% |
| 3-Person Household | 6,467 | 14.6% |
| 4+ Person Household | 9,782 | 22.1% |
| Total Housing Units | 44,206 | 100.0% |
Occupancy by Ownership by Household Size in Wayne County
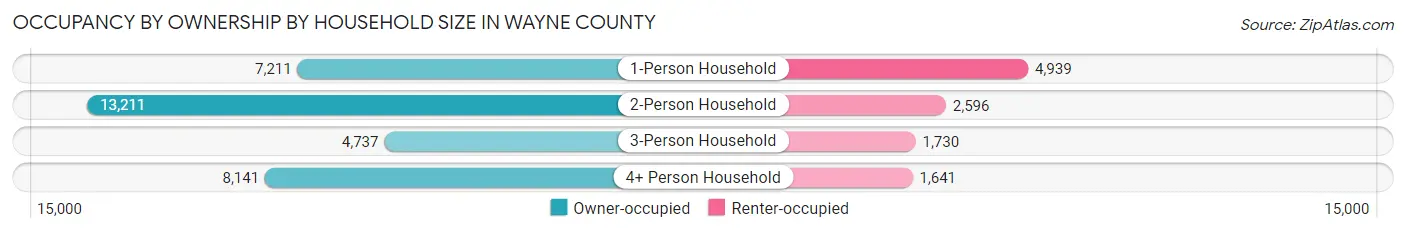
| Household Size | Owner-occupied | Renter-occupied |
| 1-Person Household | 7,211 (59.4%) | 4,939 (40.6%) |
| 2-Person Household | 13,211 (83.6%) | 2,596 (16.4%) |
| 3-Person Household | 4,737 (73.3%) | 1,730 (26.8%) |
| 4+ Person Household | 8,141 (83.2%) | 1,641 (16.8%) |
| Total Housing Units | 33,300 (75.3%) | 10,906 (24.7%) |
Occupancy by Educational Attainment in Wayne County
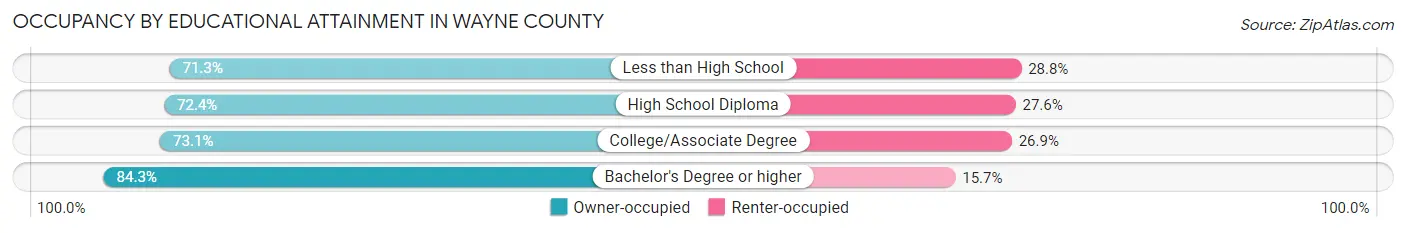
| Household Size | Owner-occupied | Renter-occupied |
| Less than High School | 3,719 (71.3%) | 1,501 (28.7%) |
| High School Diploma | 12,451 (72.4%) | 4,753 (27.6%) |
| College/Associate Degree | 8,077 (73.1%) | 2,969 (26.9%) |
| Bachelor's Degree or higher | 9,053 (84.3%) | 1,683 (15.7%) |
Occupancy by Age of Householder in Wayne County
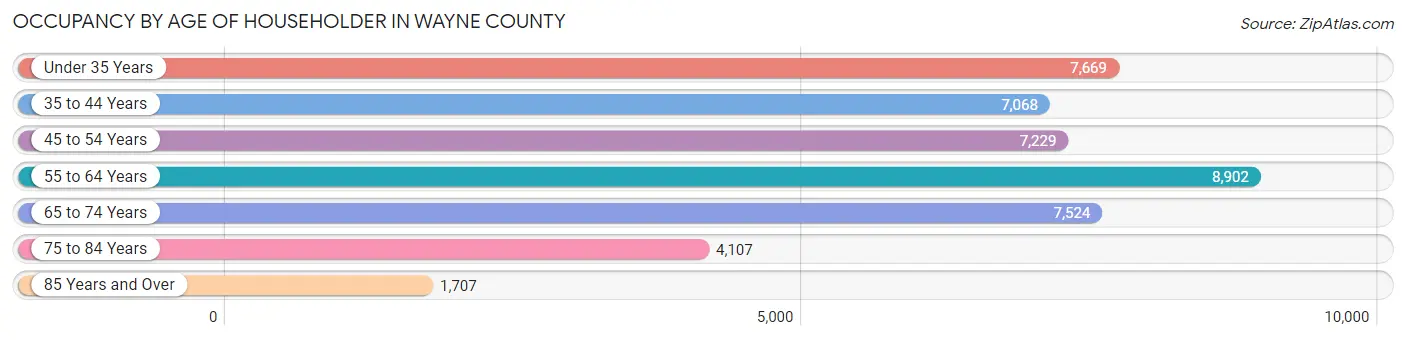
| Age Bracket | # Households | % Households |
| Under 35 Years | 7,669 | 17.3% |
| 35 to 44 Years | 7,068 | 16.0% |
| 45 to 54 Years | 7,229 | 16.4% |
| 55 to 64 Years | 8,902 | 20.1% |
| 65 to 74 Years | 7,524 | 17.0% |
| 75 to 84 Years | 4,107 | 9.3% |
| 85 Years and Over | 1,707 | 3.9% |
| Total | 44,206 | 100.0% |
Housing Finances in Wayne County
Median Income by Occupancy in Wayne County
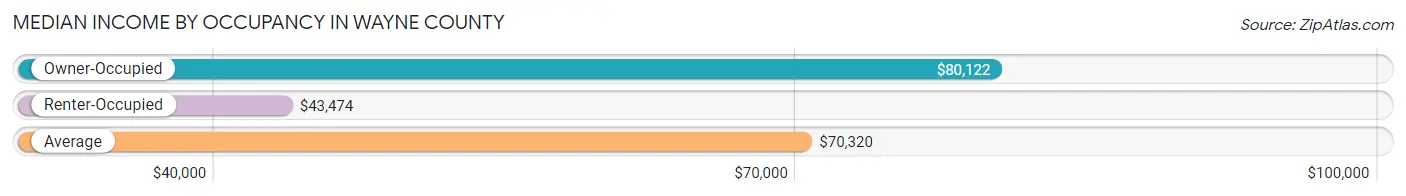
| Occupancy Type | # Households | Median Income |
| Owner-Occupied | 33,300 (75.3%) | $80,122 |
| Renter-Occupied | 10,906 (24.7%) | $43,474 |
| Average | 44,206 (100.0%) | $70,320 |
Occupancy by Householder Income Bracket in Wayne County
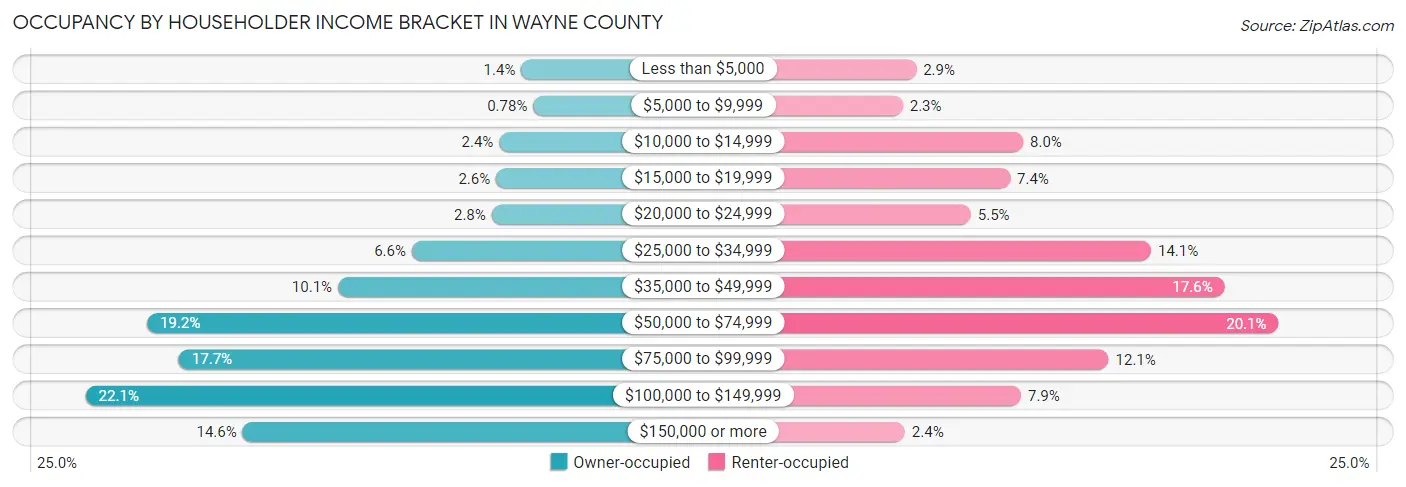
| Income Bracket | Owner-occupied | Renter-occupied |
| Less than $5,000 | 448 (1.3%) | 315 (2.9%) |
| $5,000 to $9,999 | 260 (0.8%) | 245 (2.2%) |
| $10,000 to $14,999 | 800 (2.4%) | 870 (8.0%) |
| $15,000 to $19,999 | 849 (2.5%) | 803 (7.4%) |
| $20,000 to $24,999 | 918 (2.8%) | 599 (5.5%) |
| $25,000 to $34,999 | 2,184 (6.6%) | 1,534 (14.1%) |
| $35,000 to $49,999 | 3,356 (10.1%) | 1,916 (17.6%) |
| $50,000 to $74,999 | 6,382 (19.2%) | 2,195 (20.1%) |
| $75,000 to $99,999 | 5,879 (17.6%) | 1,314 (12.0%) |
| $100,000 to $149,999 | 7,356 (22.1%) | 859 (7.9%) |
| $150,000 or more | 4,868 (14.6%) | 256 (2.4%) |
| Total | 33,300 (100.0%) | 10,906 (100.0%) |
Monthly Housing Cost Tiers in Wayne County
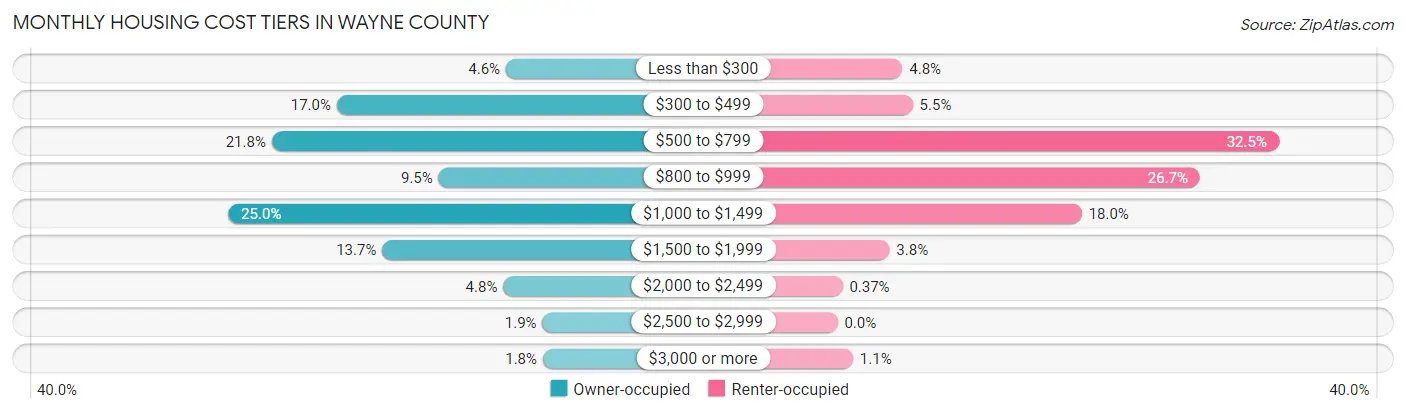
| Monthly Cost | Owner-occupied | Renter-occupied |
| Less than $300 | 1,515 (4.5%) | 521 (4.8%) |
| $300 to $499 | 5,665 (17.0%) | 604 (5.5%) |
| $500 to $799 | 7,260 (21.8%) | 3,544 (32.5%) |
| $800 to $999 | 3,167 (9.5%) | 2,911 (26.7%) |
| $1,000 to $1,499 | 8,332 (25.0%) | 1,962 (18.0%) |
| $1,500 to $1,999 | 4,548 (13.7%) | 418 (3.8%) |
| $2,000 to $2,499 | 1,583 (4.8%) | 40 (0.4%) |
| $2,500 to $2,999 | 621 (1.9%) | 0 (0.0%) |
| $3,000 or more | 609 (1.8%) | 124 (1.1%) |
| Total | 33,300 (100.0%) | 10,906 (100.0%) |
Physical Housing Characteristics in Wayne County
Housing Structures in Wayne County
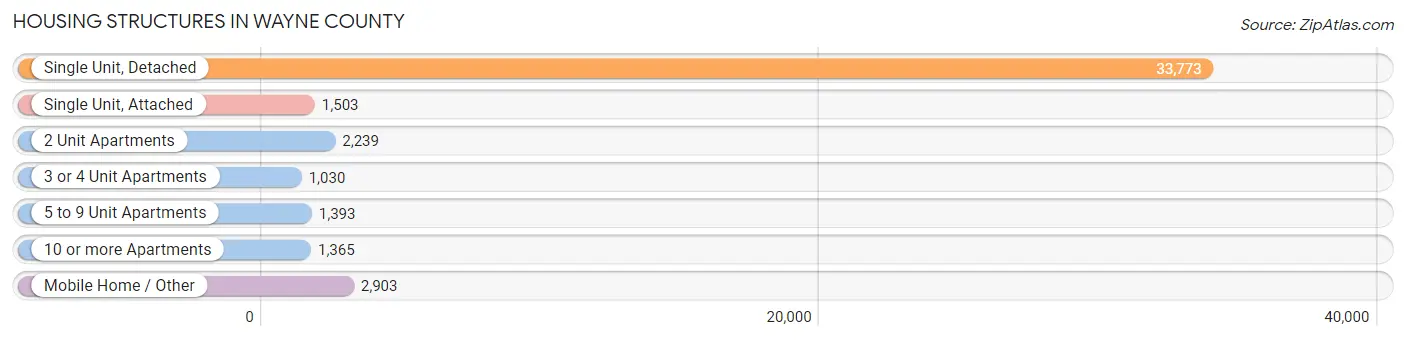
| Structure Type | # Housing Units | % Housing Units |
| Single Unit, Detached | 33,773 | 76.4% |
| Single Unit, Attached | 1,503 | 3.4% |
| 2 Unit Apartments | 2,239 | 5.1% |
| 3 or 4 Unit Apartments | 1,030 | 2.3% |
| 5 to 9 Unit Apartments | 1,393 | 3.2% |
| 10 or more Apartments | 1,365 | 3.1% |
| Mobile Home / Other | 2,903 | 6.6% |
| Total | 44,206 | 100.0% |
Housing Structures by Occupancy in Wayne County
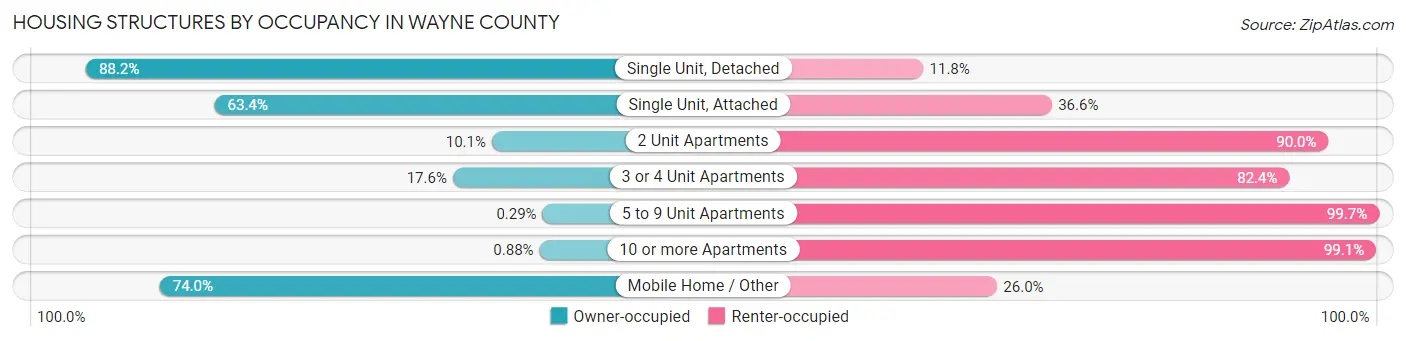
| Structure Type | Owner-occupied | Renter-occupied |
| Single Unit, Detached | 29,778 (88.2%) | 3,995 (11.8%) |
| Single Unit, Attached | 953 (63.4%) | 550 (36.6%) |
| 2 Unit Apartments | 225 (10.1%) | 2,014 (89.9%) |
| 3 or 4 Unit Apartments | 181 (17.6%) | 849 (82.4%) |
| 5 to 9 Unit Apartments | 4 (0.3%) | 1,389 (99.7%) |
| 10 or more Apartments | 12 (0.9%) | 1,353 (99.1%) |
| Mobile Home / Other | 2,147 (74.0%) | 756 (26.0%) |
| Total | 33,300 (75.3%) | 10,906 (24.7%) |
Housing Structures by Number of Rooms in Wayne County
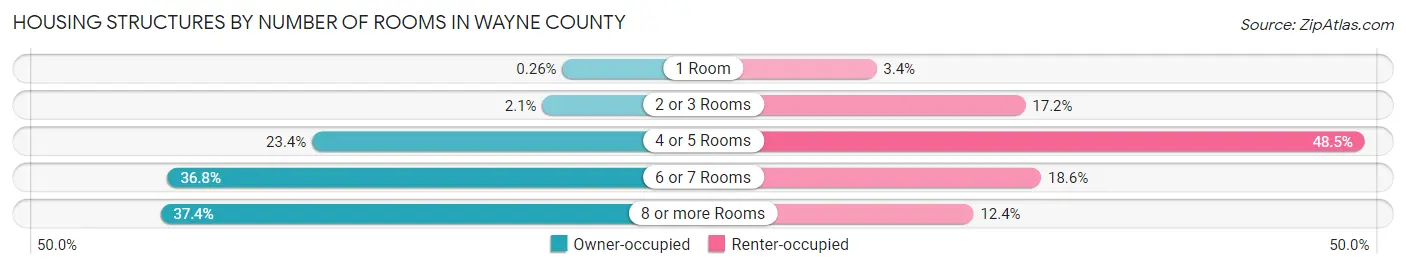
| Number of Rooms | Owner-occupied | Renter-occupied |
| 1 Room | 88 (0.3%) | 367 (3.4%) |
| 2 or 3 Rooms | 701 (2.1%) | 1,870 (17.2%) |
| 4 or 5 Rooms | 7,794 (23.4%) | 5,293 (48.5%) |
| 6 or 7 Rooms | 12,249 (36.8%) | 2,029 (18.6%) |
| 8 or more Rooms | 12,468 (37.4%) | 1,347 (12.3%) |
| Total | 33,300 (100.0%) | 10,906 (100.0%) |
Housing Structure by Heating Type in Wayne County
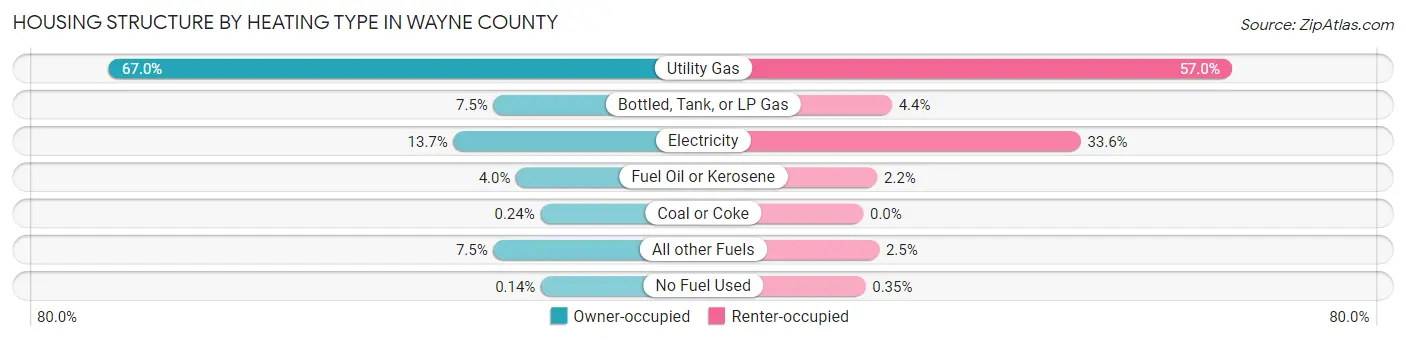
| Heating Type | Owner-occupied | Renter-occupied |
| Utility Gas | 22,298 (67.0%) | 6,215 (57.0%) |
| Bottled, Tank, or LP Gas | 2,491 (7.5%) | 483 (4.4%) |
| Electricity | 4,557 (13.7%) | 3,665 (33.6%) |
| Fuel Oil or Kerosene | 1,330 (4.0%) | 237 (2.2%) |
| Coal or Coke | 80 (0.2%) | 0 (0.0%) |
| All other Fuels | 2,496 (7.5%) | 268 (2.5%) |
| No Fuel Used | 48 (0.1%) | 38 (0.4%) |
| Total | 33,300 (100.0%) | 10,906 (100.0%) |
Household Vehicle Usage in Wayne County
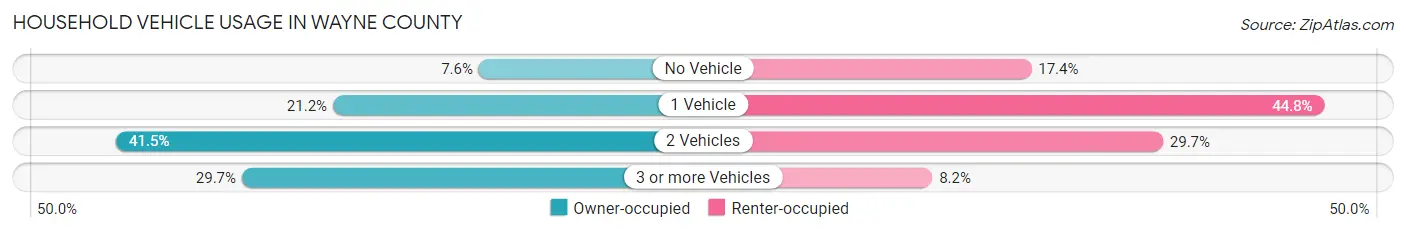
| Vehicles per Household | Owner-occupied | Renter-occupied |
| No Vehicle | 2,532 (7.6%) | 1,898 (17.4%) |
| 1 Vehicle | 7,067 (21.2%) | 4,882 (44.8%) |
| 2 Vehicles | 13,805 (41.5%) | 3,237 (29.7%) |
| 3 or more Vehicles | 9,896 (29.7%) | 889 (8.2%) |
| Total | 33,300 (100.0%) | 10,906 (100.0%) |
Real Estate & Mortgages in Wayne County
Real Estate and Mortgage Overview in Wayne County
| Characteristic | Without Mortgage | With Mortgage |
| Housing Units | 14,198 | 19,102 |
| Median Property Value | $177,600 | $198,300 |
| Median Household Income | $62,625 | $3,433 |
| Monthly Housing Costs | $505 | $601 |
| Real Estate Taxes | $2,265 | $344 |
Property Value by Mortgage Status in Wayne County
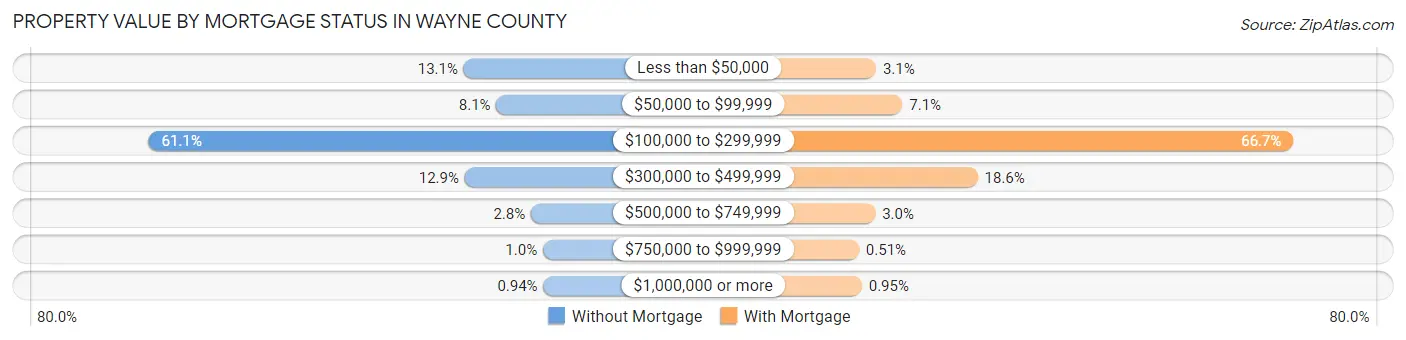
| Property Value | Without Mortgage | With Mortgage |
| Less than $50,000 | 1,856 (13.1%) | 594 (3.1%) |
| $50,000 to $99,999 | 1,150 (8.1%) | 1,362 (7.1%) |
| $100,000 to $299,999 | 8,677 (61.1%) | 12,741 (66.7%) |
| $300,000 to $499,999 | 1,835 (12.9%) | 3,553 (18.6%) |
| $500,000 to $749,999 | 402 (2.8%) | 573 (3.0%) |
| $750,000 to $999,999 | 144 (1.0%) | 98 (0.5%) |
| $1,000,000 or more | 134 (0.9%) | 181 (0.9%) |
| Total | 14,198 (100.0%) | 19,102 (100.0%) |
Household Income by Mortgage Status in Wayne County
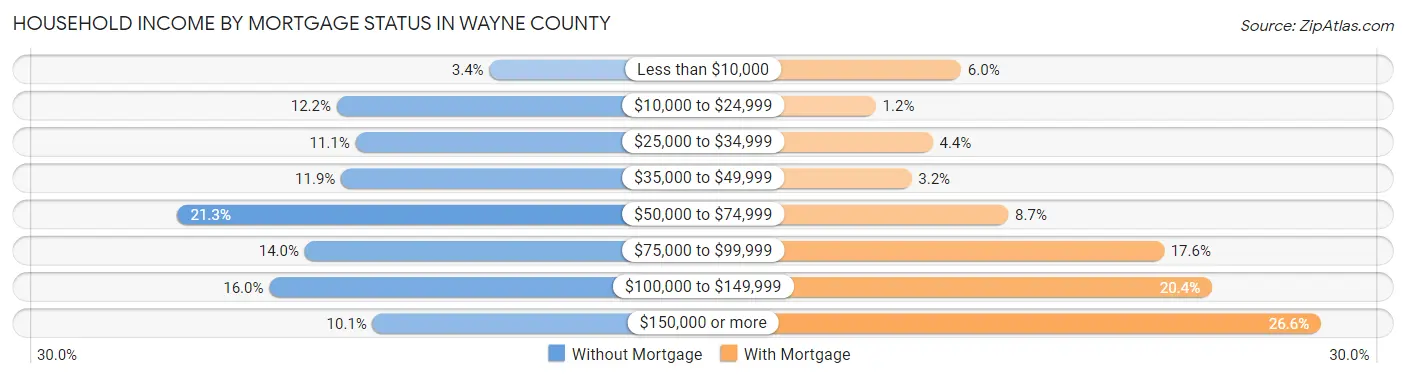
| Household Income | Without Mortgage | With Mortgage |
| Less than $10,000 | 489 (3.4%) | 1,149 (6.0%) |
| $10,000 to $24,999 | 1,727 (12.2%) | 219 (1.1%) |
| $25,000 to $34,999 | 1,575 (11.1%) | 840 (4.4%) |
| $35,000 to $49,999 | 1,691 (11.9%) | 609 (3.2%) |
| $50,000 to $74,999 | 3,019 (21.3%) | 1,665 (8.7%) |
| $75,000 to $99,999 | 1,987 (14.0%) | 3,363 (17.6%) |
| $100,000 to $149,999 | 2,275 (16.0%) | 3,892 (20.4%) |
| $150,000 or more | 1,435 (10.1%) | 5,081 (26.6%) |
| Total | 14,198 (100.0%) | 19,102 (100.0%) |
Property Value to Household Income Ratio in Wayne County
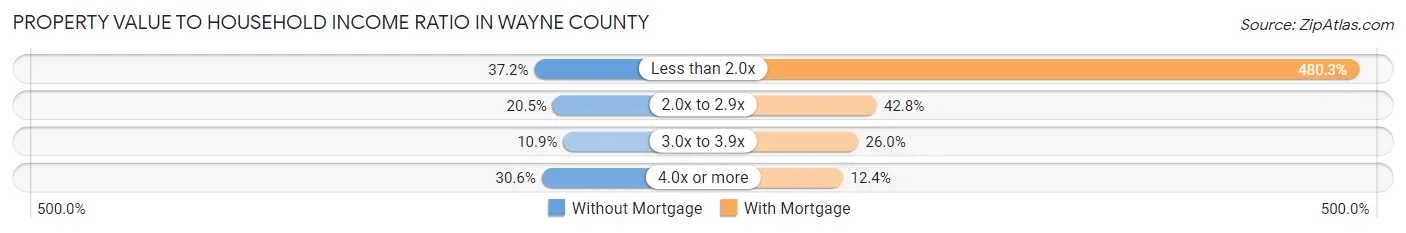
| Value-to-Income Ratio | Without Mortgage | With Mortgage |
| Less than 2.0x | 5,274 (37.1%) | 91,741 (480.3%) |
| 2.0x to 2.9x | 2,911 (20.5%) | 8,173 (42.8%) |
| 3.0x to 3.9x | 1,546 (10.9%) | 4,972 (26.0%) |
| 4.0x or more | 4,341 (30.6%) | 2,366 (12.4%) |
| Total | 14,198 (100.0%) | 19,102 (100.0%) |
Real Estate Taxes by Mortgage Status in Wayne County
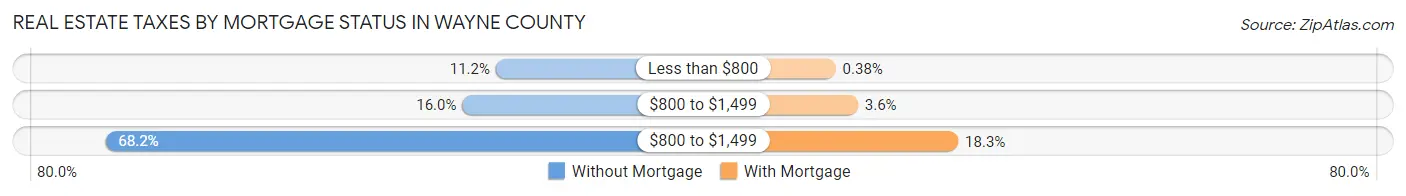
| Property Taxes | Without Mortgage | With Mortgage |
| Less than $800 | 1,583 (11.2%) | 72 (0.4%) |
| $800 to $1,499 | 2,277 (16.0%) | 692 (3.6%) |
| $800 to $1,499 | 9,681 (68.2%) | 3,491 (18.3%) |
| Total | 14,198 (100.0%) | 19,102 (100.0%) |
Health & Disability in Wayne County
Health Insurance Coverage by Age in Wayne County
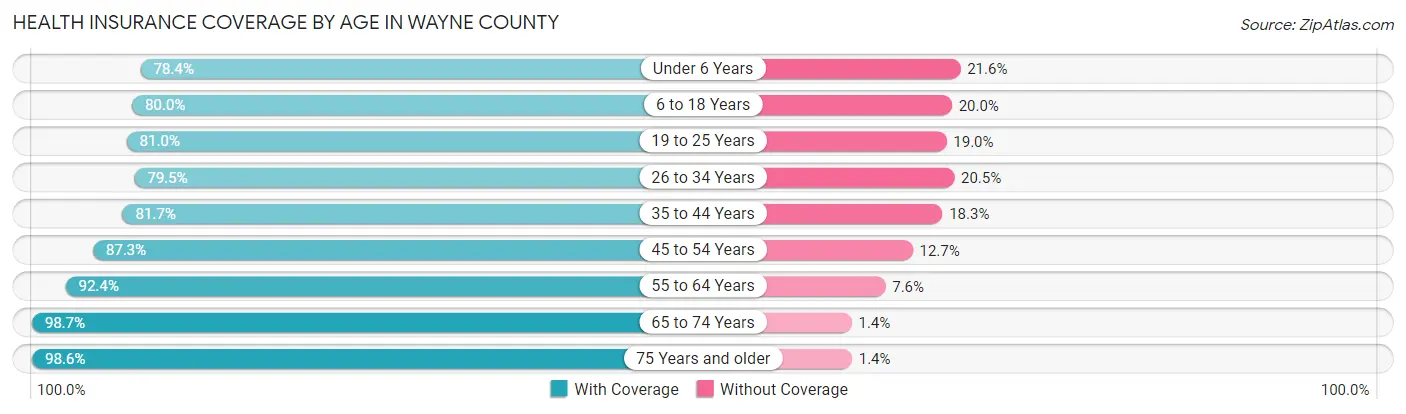
| Age Bracket | With Coverage | Without Coverage |
| Under 6 Years | 6,875 (78.4%) | 1,896 (21.6%) |
| 6 to 18 Years | 16,501 (80.0%) | 4,133 (20.0%) |
| 19 to 25 Years | 9,516 (81.0%) | 2,237 (19.0%) |
| 26 to 34 Years | 9,773 (79.5%) | 2,514 (20.5%) |
| 35 to 44 Years | 10,509 (81.7%) | 2,347 (18.3%) |
| 45 to 54 Years | 11,543 (87.3%) | 1,684 (12.7%) |
| 55 to 64 Years | 14,238 (92.4%) | 1,177 (7.6%) |
| 65 to 74 Years | 12,062 (98.7%) | 165 (1.3%) |
| 75 Years and older | 8,310 (98.6%) | 118 (1.4%) |
| Total | 99,327 (85.9%) | 16,271 (14.1%) |
Health Insurance Coverage by Citizenship Status in Wayne County
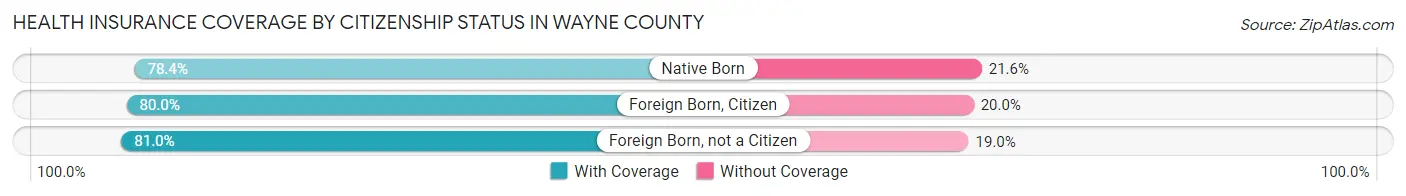
| Citizenship Status | With Coverage | Without Coverage |
| Native Born | 6,875 (78.4%) | 1,896 (21.6%) |
| Foreign Born, Citizen | 16,501 (80.0%) | 4,133 (20.0%) |
| Foreign Born, not a Citizen | 9,516 (81.0%) | 2,237 (19.0%) |
Health Insurance Coverage by Household Income in Wayne County
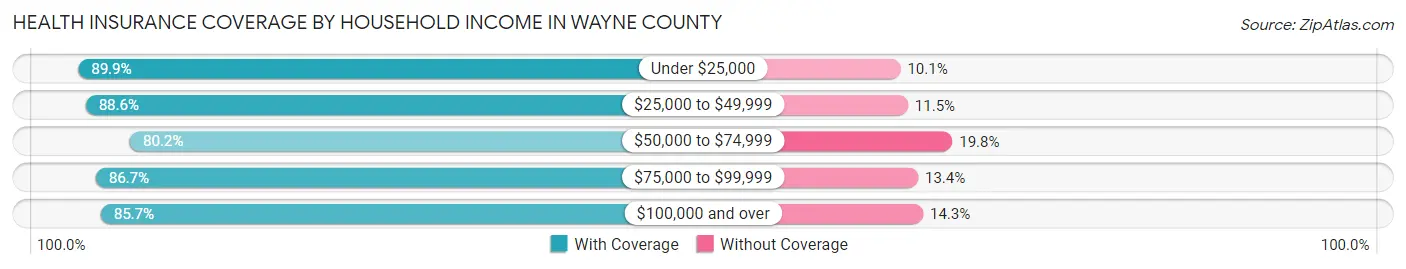
| Household Income | With Coverage | Without Coverage |
| Under $25,000 | 7,634 (89.9%) | 854 (10.1%) |
| $25,000 to $49,999 | 16,073 (88.5%) | 2,079 (11.5%) |
| $50,000 to $74,999 | 17,564 (80.2%) | 4,329 (19.8%) |
| $75,000 to $99,999 | 17,561 (86.7%) | 2,705 (13.4%) |
| $100,000 and over | 37,406 (85.7%) | 6,229 (14.3%) |
Public vs Private Health Insurance Coverage by Age in Wayne County
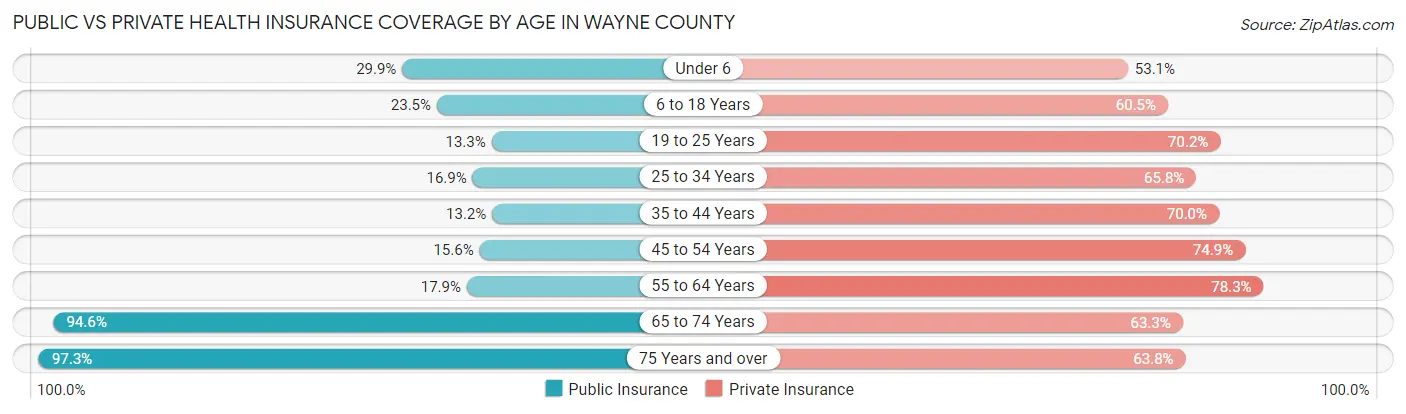
| Age Bracket | Public Insurance | Private Insurance |
| Under 6 | 2,623 (29.9%) | 4,657 (53.1%) |
| 6 to 18 Years | 4,844 (23.5%) | 12,488 (60.5%) |
| 19 to 25 Years | 1,566 (13.3%) | 8,253 (70.2%) |
| 25 to 34 Years | 2,070 (16.9%) | 8,081 (65.8%) |
| 35 to 44 Years | 1,699 (13.2%) | 8,997 (70.0%) |
| 45 to 54 Years | 2,059 (15.6%) | 9,901 (74.9%) |
| 55 to 64 Years | 2,763 (17.9%) | 12,062 (78.2%) |
| 65 to 74 Years | 11,570 (94.6%) | 7,735 (63.3%) |
| 75 Years and over | 8,204 (97.3%) | 5,375 (63.8%) |
| Total | 37,398 (32.4%) | 77,549 (67.1%) |
Disability Status by Sex by Age in Wayne County
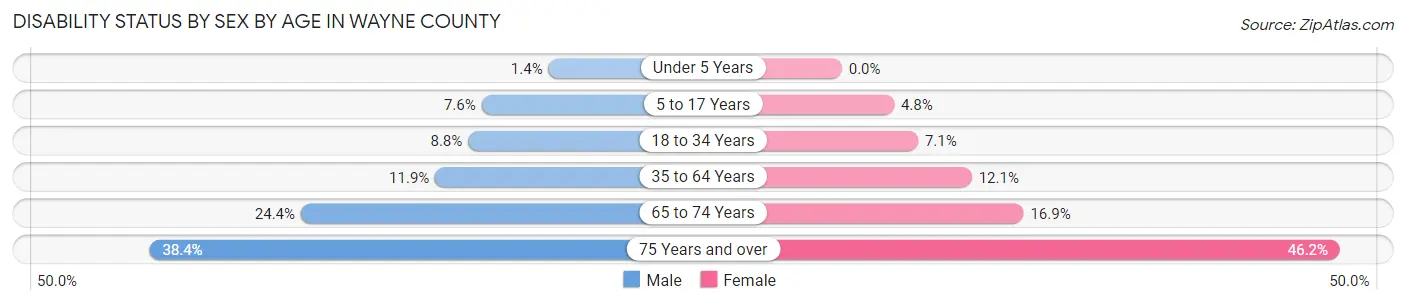
| Age Bracket | Male | Female |
| Under 5 Years | 51 (1.4%) | 0 (0.0%) |
| 5 to 17 Years | 800 (7.6%) | 485 (4.8%) |
| 18 to 34 Years | 1,157 (8.8%) | 879 (7.1%) |
| 35 to 64 Years | 2,472 (11.9%) | 2,499 (12.1%) |
| 65 to 74 Years | 1,451 (24.4%) | 1,057 (16.9%) |
| 75 Years and over | 1,356 (38.4%) | 2,264 (46.2%) |
Disability Class by Sex by Age in Wayne County
Disability Class: Hearing Difficulty
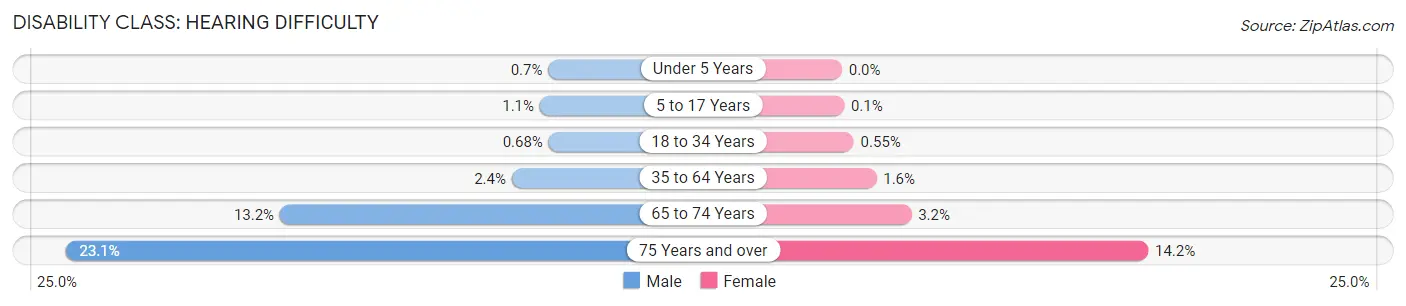
| Age Bracket | Male | Female |
| Under 5 Years | 26 (0.7%) | 0 (0.0%) |
| 5 to 17 Years | 115 (1.1%) | 10 (0.1%) |
| 18 to 34 Years | 89 (0.7%) | 68 (0.5%) |
| 35 to 64 Years | 496 (2.4%) | 331 (1.6%) |
| 65 to 74 Years | 783 (13.2%) | 202 (3.2%) |
| 75 Years and over | 814 (23.1%) | 696 (14.2%) |
Disability Class: Vision Difficulty
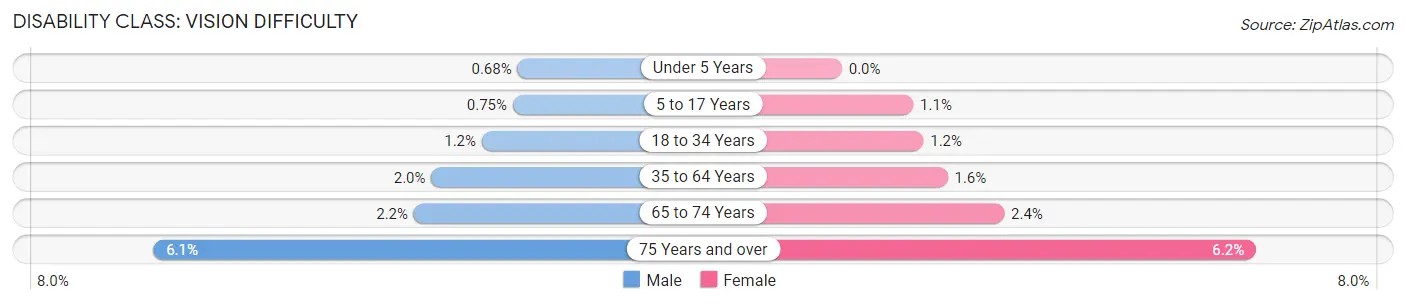
| Age Bracket | Male | Female |
| Under 5 Years | 25 (0.7%) | 0 (0.0%) |
| 5 to 17 Years | 79 (0.7%) | 106 (1.1%) |
| 18 to 34 Years | 158 (1.2%) | 151 (1.2%) |
| 35 to 64 Years | 407 (2.0%) | 326 (1.6%) |
| 65 to 74 Years | 132 (2.2%) | 151 (2.4%) |
| 75 Years and over | 215 (6.1%) | 301 (6.1%) |
Disability Class: Cognitive Difficulty
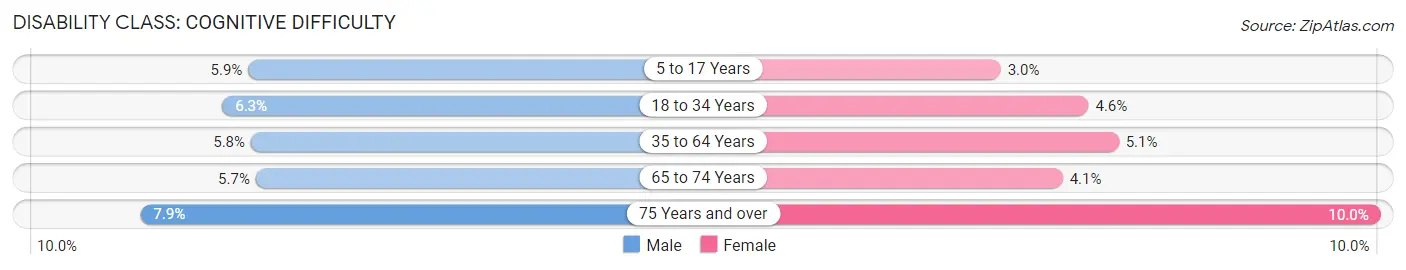
| Age Bracket | Male | Female |
| 5 to 17 Years | 616 (5.9%) | 296 (2.9%) |
| 18 to 34 Years | 829 (6.3%) | 570 (4.6%) |
| 35 to 64 Years | 1,204 (5.8%) | 1,066 (5.1%) |
| 65 to 74 Years | 340 (5.7%) | 257 (4.1%) |
| 75 Years and over | 277 (7.9%) | 490 (10.0%) |
Disability Class: Ambulatory Difficulty
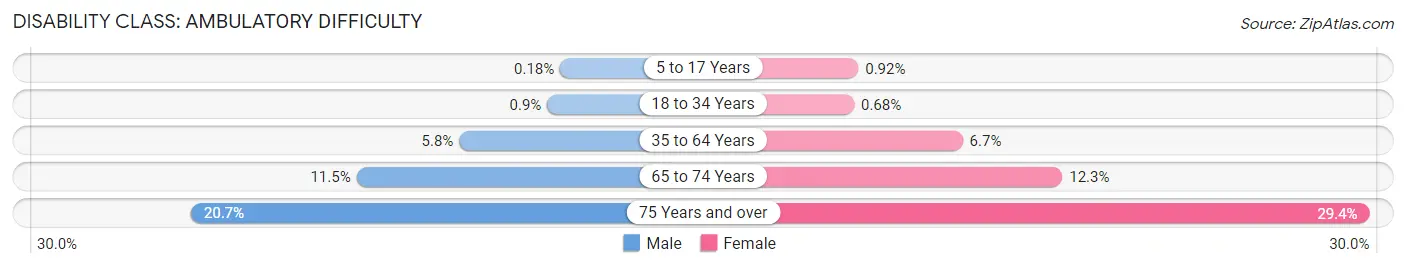
| Age Bracket | Male | Female |
| 5 to 17 Years | 19 (0.2%) | 92 (0.9%) |
| 18 to 34 Years | 118 (0.9%) | 84 (0.7%) |
| 35 to 64 Years | 1,205 (5.8%) | 1,394 (6.7%) |
| 65 to 74 Years | 686 (11.5%) | 770 (12.3%) |
| 75 Years and over | 732 (20.7%) | 1,439 (29.4%) |
Disability Class: Self-Care Difficulty
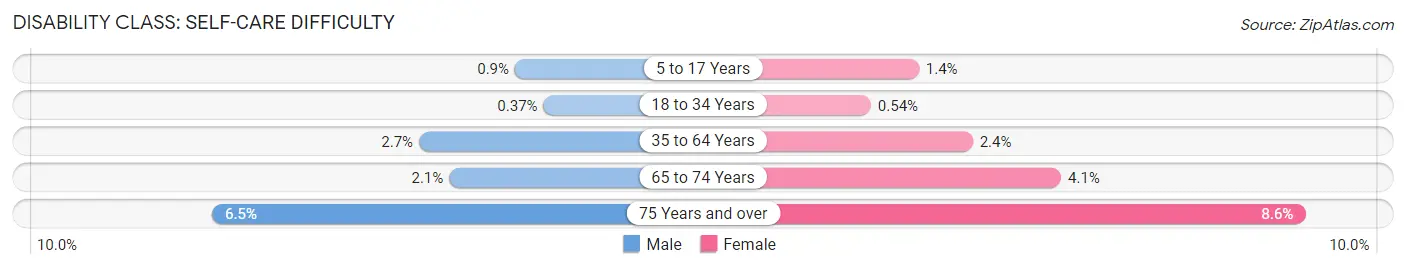
| Age Bracket | Male | Female |
| 5 to 17 Years | 95 (0.9%) | 143 (1.4%) |
| 18 to 34 Years | 49 (0.4%) | 67 (0.5%) |
| 35 to 64 Years | 557 (2.7%) | 504 (2.4%) |
| 65 to 74 Years | 126 (2.1%) | 255 (4.1%) |
| 75 Years and over | 230 (6.5%) | 421 (8.6%) |
Technology Access in Wayne County
Computing Device Access in Wayne County
| Device Type | # Households | % Households |
| Desktop or Laptop | 32,349 | 73.2% |
| Smartphone | 35,307 | 79.9% |
| Tablet | 25,032 | 56.6% |
| No Computing Device | 5,646 | 12.8% |
| Total | 44,206 | 100.0% |
Internet Access in Wayne County
| Internet Type | # Households | % Households |
| Dial-Up Internet | 159 | 0.4% |
| Broadband Home | 30,082 | 68.0% |
| Cellular Data Only | 5,247 | 11.9% |
| Satellite Internet | 1,830 | 4.1% |
| No Internet | 7,502 | 17.0% |
| Total | 44,206 | 100.0% |
Wayne County Summary
Wayne County is located in the northeastern part of Ohio and is part of the Akron Metropolitan Statistical Area. It is bordered by Medina County to the north, Stark County to the east, Summit County to the south, and Ashland County to the west. The county seat is Wooster, and the largest city is Orrville. The county was established in 1808 and named after General Anthony Wayne.
Geography
Wayne County covers an area of 545 square miles and is located in the glaciated Allegheny Plateau region of Ohio. The county is mostly flat with rolling hills and valleys. The highest point in the county is 1,717 feet above sea level, located in the western part of the county. The county is drained by the Killbuck Creek, which flows through the center of the county. Other major waterways include the Apple Creek, the Mohican River, and the Walhonding River.
The county is home to several state parks, including Malabar Farm State Park, Mohican State Park, and Punderson State Park. The county also contains several wildlife areas, including the Killbuck Marsh Wildlife Area, the Mohican-Memorial State Forest, and the Wayne National Forest.
Demographics
As of the 2010 census, Wayne County had a population of 114,520. The racial makeup of the county was 95.2% White, 1.7% African American, 0.3% Native American, 0.7% Asian, 0.1% Pacific Islander, 0.7% from other races, and 1.3% from two or more races. Hispanic or Latino of any race were 2.2% of the population.
The median household income in the county was $48,845 and the median family income was $58,945. The per capita income was $23,845. About 8.2% of families and 11.2% of the population were below the poverty line, including 15.2% of those under age 18 and 6.7% of those age 65 or over.
Economy
Wayne County’s economy is largely based on agriculture and manufacturing. The county is home to several large agricultural operations, including the J.M. Smucker Company, which is the largest employer in the county. Other major employers include the Orrville-based Rubbermaid, the Wooster-based Smith Dairy, and the Orrville-based The J.M. Smucker Company.
The county is also home to several higher education institutions, including the University of Akron Wayne College, the College of Wooster, and the Ohio State University Agricultural Technical Institute.
History
Wayne County was established in 1808 and named after General Anthony Wayne. The county was originally part of the Connecticut Western Reserve, and the first settlers arrived in the area in 1810. The county was largely agricultural, and the population grew slowly until the mid-19th century.
In the late 19th century, the county experienced a period of rapid growth due to the development of the railroad and the discovery of oil and natural gas. The county’s population grew from 10,000 in 1880 to over 50,000 by 1910.
The county continued to grow throughout the 20th century, and by 2000 the population had reached 114,520. Today, Wayne County is a largely rural area with a strong agricultural base. The county is home to several large employers, including the J.M. Smucker Company, Rubbermaid, and Smith Dairy.
Common Questions
What is the Total Population of Wayne County?
Total Population of Wayne County is 116,680.
What is the Total Male Population of Wayne County?
Total Male Population of Wayne County is 58,125.
What is the Total Female Population of Wayne County?
Total Female Population of Wayne County is 58,555.
What is the Ratio of Males per 100 Females in Wayne County?
There are 99.27 Males per 100 Females in Wayne County.
What is the Ratio of Females per 100 Males in Wayne County?
There are 100.74 Females per 100 Males in Wayne County.
What is the Median Population Age in Wayne County?
Median Population Age in Wayne County is 38.8 Years.
What is the Average Family Size in Wayne County
Average Family Size in Wayne County is 3.1 People.
What is the Average Household Size in Wayne County
Average Household Size in Wayne County is 2.5 People.
What is Per Capita Income in Wayne County?
Per Capita income in Wayne County is $32,908.
What is the Median Family Income in Wayne County?
Median Family Income in Wayne County is $83,546.
What is the Median Household income in Wayne County?
Median Household Income in Wayne County is $70,320.
What is Income or Wage Gap in Wayne County?
Income or Wage Gap in Wayne County is 42.9%.
Women in Wayne County earn 57.1 cents for every dollar earned by a man.
What is Family Income Deficit in Wayne County?
Family Income Deficit in Wayne County is $8,900.
Families that are below poverty line in Wayne County earn $8,900 less on average than the poverty threshold level.
What is Inequality or Gini Index in Wayne County?
Inequality or Gini Index in Wayne County is 0.41.
How Large is the Labor Force in Wayne County?
There are 57,031 People in the Labor Forcein in Wayne County.
What is the Percentage of People in the Labor Force in Wayne County?
62.2% of People are in the Labor Force in Wayne County.
What is the Unemployment Rate in Wayne County?
Unemployment Rate in Wayne County is 3.3%.