Tuscarawas County, OH
Tuscarawas County Map
Tuscarawas County Overview
92,840
TOTAL POPULATION
46,428
MALE POPULATION
46,412
FEMALE POPULATION
100.03
MALES / 100 FEMALES
99.97
FEMALES / 100 MALES
41.1
MEDIAN AGE
3.0
AVG FAMILY SIZE
2.4
AVG HOUSEHOLD SIZE
$31,736
PER CAPITA INCOME
$76,057
AVG FAMILY INCOME
$61,953
AVG HOUSEHOLD INCOME
35.6%
WAGE / INCOME GAP [ % ]
64.4¢/ $1
WAGE / INCOME GAP [ $ ]
$10,480
FAMILY INCOME DEFICIT
0.42
INEQUALITY / GINI INDEX
45,764
LABOR FORCE [ PEOPLE ]
61.7%
PERCENT IN LABOR FORCE
5.5%
UNEMPLOYMENT RATE
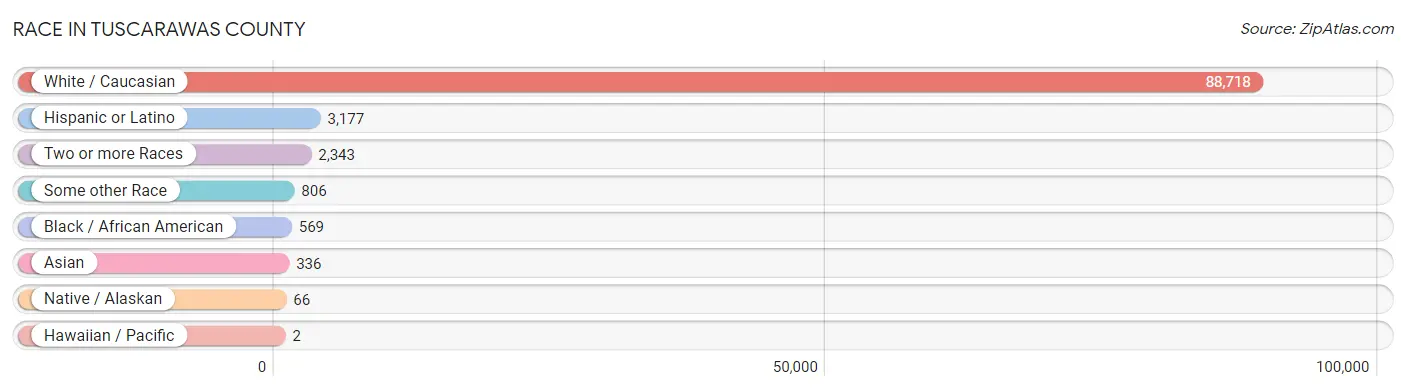
Race in Tuscarawas County
The most populous races in Tuscarawas County are White / Caucasian (88,718 | 95.6%), Hispanic or Latino (3,177 | 3.4%), and Two or more Races (2,343 | 2.5%).
| Race | # Population | % Population |
| Asian | 336 | 0.4% |
| Black / African American | 569 | 0.6% |
| Hawaiian / Pacific | 2 | 0.0% |
| Hispanic or Latino | 3,177 | 3.4% |
| Native / Alaskan | 66 | 0.1% |
| White / Caucasian | 88,718 | 95.6% |
| Two or more Races | 2,343 | 2.5% |
| Some other Race | 806 | 0.9% |
| Total | 92,840 | 100.0% |
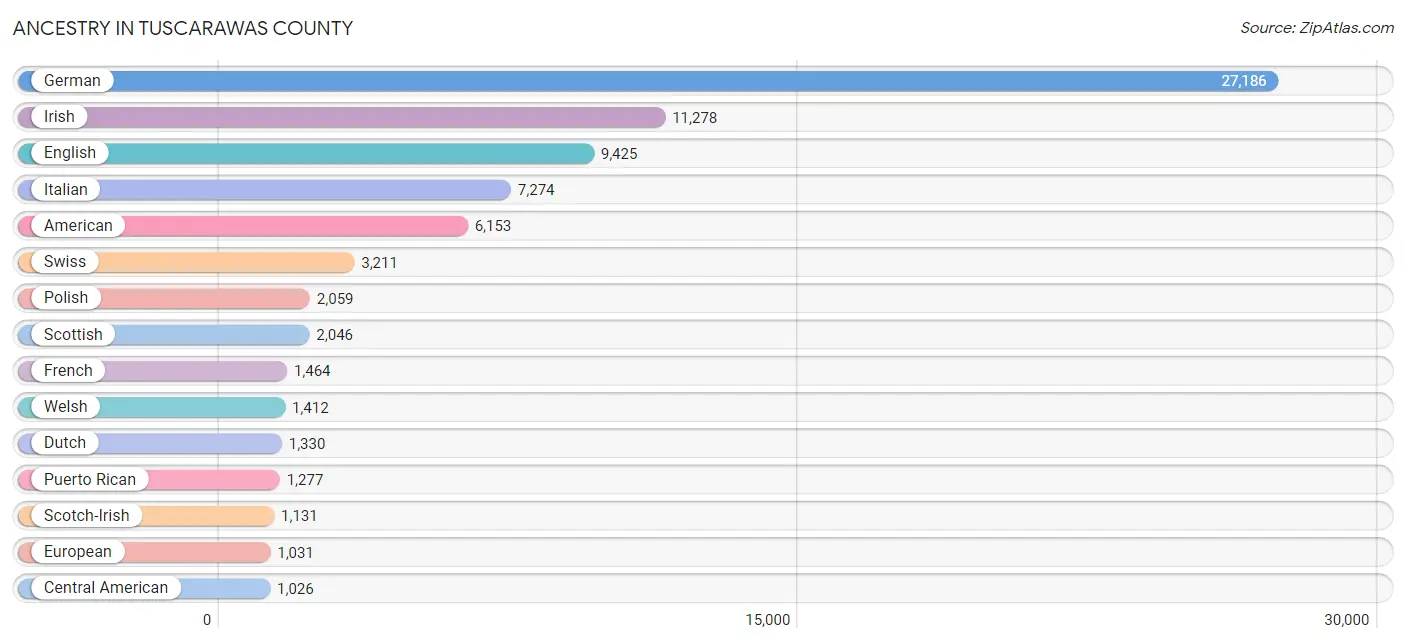
Ancestry in Tuscarawas County
The most populous ancestries reported in Tuscarawas County are German (27,186 | 29.3%), Irish (11,278 | 12.1%), English (9,425 | 10.2%), Italian (7,274 | 7.8%), and American (6,153 | 6.6%), together accounting for 66.0% of all Tuscarawas County residents.
| Ancestry | # Population | % Population |
| African | 14 | 0.0% |
| Albanian | 6 | 0.0% |
| American | 6,153 | 6.6% |
| Arab | 180 | 0.2% |
| Argentinean | 25 | 0.0% |
| Austrian | 286 | 0.3% |
| Belgian | 12 | 0.0% |
| Blackfeet | 31 | 0.0% |
| Brazilian | 46 | 0.1% |
| British | 329 | 0.4% |
| Burmese | 59 | 0.1% |
| Canadian | 18 | 0.0% |
| Central American | 1,026 | 1.1% |
| Central American Indian | 38 | 0.0% |
| Cherokee | 273 | 0.3% |
| Choctaw | 16 | 0.0% |
| Colombian | 2 | 0.0% |
| Costa Rican | 13 | 0.0% |
| Croatian | 39 | 0.0% |
| Crow | 10 | 0.0% |
| Czech | 466 | 0.5% |
| Czechoslovakian | 92 | 0.1% |
| Danish | 152 | 0.2% |
| Dutch | 1,330 | 1.4% |
| Eastern European | 47 | 0.1% |
| Egyptian | 10 | 0.0% |
| English | 9,425 | 10.2% |
| European | 1,031 | 1.1% |
| Filipino | 36 | 0.0% |
| Finnish | 65 | 0.1% |
| French | 1,464 | 1.6% |
| French Canadian | 52 | 0.1% |
| German | 27,186 | 29.3% |
| Greek | 228 | 0.3% |
| Guamanian / Chamorro | 2 | 0.0% |
| Guatemalan | 956 | 1.0% |
| Honduran | 17 | 0.0% |
| Hungarian | 481 | 0.5% |
| Indian (Asian) | 65 | 0.1% |
| Irish | 11,278 | 12.1% |
| Iroquois | 11 | 0.0% |
| Italian | 7,274 | 7.8% |
| Jamaican | 13 | 0.0% |
| Kenyan | 3 | 0.0% |
| Korean | 163 | 0.2% |
| Lebanese | 60 | 0.1% |
| Lithuanian | 45 | 0.1% |
| Macedonian | 22 | 0.0% |
| Mexican | 638 | 0.7% |
| Moroccan | 99 | 0.1% |
| Native Hawaiian | 20 | 0.0% |
| Northern European | 117 | 0.1% |
| Norwegian | 113 | 0.1% |
| Panamanian | 17 | 0.0% |
| Pennsylvania German | 649 | 0.7% |
| Peruvian | 2 | 0.0% |
| Polish | 2,059 | 2.2% |
| Portuguese | 39 | 0.0% |
| Puerto Rican | 1,277 | 1.4% |
| Romanian | 164 | 0.2% |
| Russian | 327 | 0.4% |
| Salvadoran | 23 | 0.0% |
| Samoan | 65 | 0.1% |
| Scandinavian | 133 | 0.1% |
| Scotch-Irish | 1,131 | 1.2% |
| Scottish | 2,046 | 2.2% |
| Serbian | 171 | 0.2% |
| Sierra Leonean | 14 | 0.0% |
| Sioux | 20 | 0.0% |
| Slavic | 43 | 0.1% |
| Slovak | 326 | 0.4% |
| Slovene | 127 | 0.1% |
| South African | 13 | 0.0% |
| South American | 86 | 0.1% |
| Spaniard | 102 | 0.1% |
| Spanish | 4 | 0.0% |
| Sri Lankan | 58 | 0.1% |
| Subsaharan African | 85 | 0.1% |
| Swedish | 340 | 0.4% |
| Swiss | 3,211 | 3.5% |
| Thai | 142 | 0.2% |
| Ugandan | 41 | 0.0% |
| Ukrainian | 205 | 0.2% |
| Venezuelan | 57 | 0.1% |
| Welsh | 1,412 | 1.5% |
| West Indian | 20 | 0.0% |
| Yugoslavian | 47 | 0.1% | View All 87 Rows |
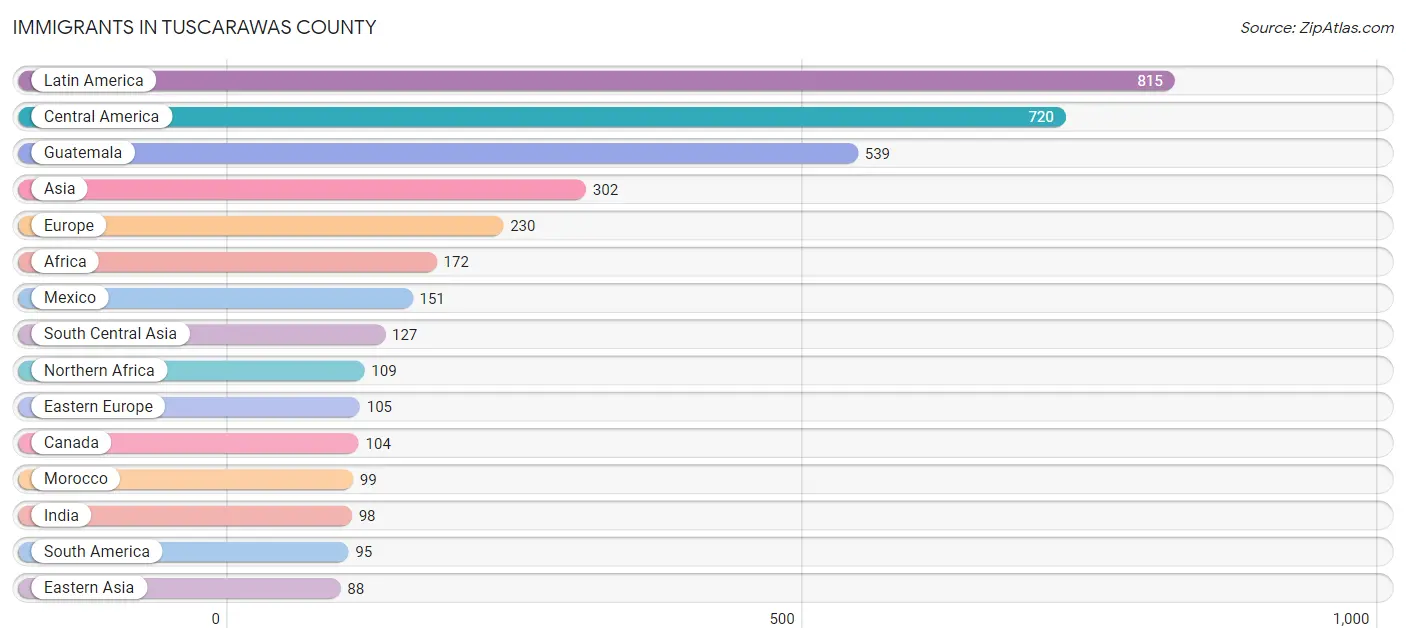
Immigrants in Tuscarawas County
The most numerous immigrant groups reported in Tuscarawas County came from Latin America (815 | 0.9%), Central America (720 | 0.8%), Guatemala (539 | 0.6%), Asia (302 | 0.3%), and Europe (230 | 0.3%), together accounting for 2.8% of all Tuscarawas County residents.
| Immigration Origin | # Population | % Population |
| Africa | 172 | 0.2% |
| Argentina | 25 | 0.0% |
| Asia | 302 | 0.3% |
| Brazil | 46 | 0.1% |
| Canada | 104 | 0.1% |
| Central America | 720 | 0.8% |
| China | 65 | 0.1% |
| Colombia | 2 | 0.0% |
| Costa Rica | 13 | 0.0% |
| Eastern Africa | 41 | 0.0% |
| Eastern Asia | 88 | 0.1% |
| Eastern Europe | 105 | 0.1% |
| Egypt | 10 | 0.0% |
| England | 25 | 0.0% |
| Europe | 230 | 0.3% |
| Germany | 8 | 0.0% |
| Guatemala | 539 | 0.6% |
| Guyana | 4 | 0.0% |
| India | 98 | 0.1% |
| Italy | 40 | 0.0% |
| Korea | 23 | 0.0% |
| Latin America | 815 | 0.9% |
| Mexico | 151 | 0.2% |
| Morocco | 99 | 0.1% |
| Nepal | 29 | 0.0% |
| Netherlands | 5 | 0.0% |
| Northern Africa | 109 | 0.1% |
| Northern Europe | 48 | 0.1% |
| Panama | 17 | 0.0% |
| Philippines | 67 | 0.1% |
| Poland | 16 | 0.0% |
| Russia | 73 | 0.1% |
| Sierra Leone | 14 | 0.0% |
| South America | 95 | 0.1% |
| South Central Asia | 127 | 0.1% |
| South Eastern Asia | 87 | 0.1% |
| Southern Europe | 64 | 0.1% |
| Spain | 24 | 0.0% |
| Uganda | 41 | 0.0% |
| Venezuela | 18 | 0.0% |
| Vietnam | 20 | 0.0% |
| Western Africa | 14 | 0.0% |
| Western Europe | 13 | 0.0% | View All 43 Rows |
Sex and Age in Tuscarawas County
Sex and Age in Tuscarawas County
The most populous age groups in Tuscarawas County are 55 to 59 Years (3,307 | 7.1%) for men and 65 to 69 Years (3,353 | 7.2%) for women.
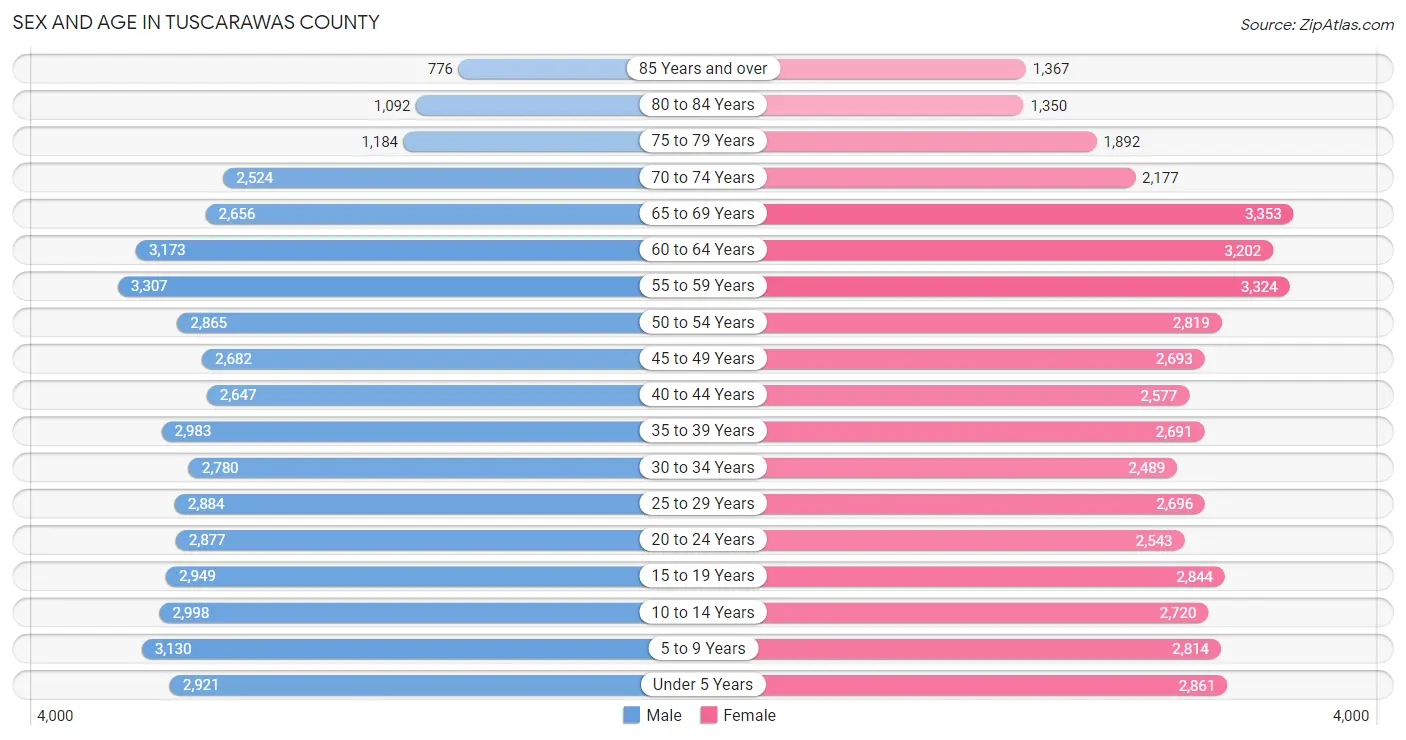
| Age Bracket | Male | Female |
| Under 5 Years | 2,921 (6.3%) | 2,861 (6.2%) |
| 5 to 9 Years | 3,130 (6.7%) | 2,814 (6.1%) |
| 10 to 14 Years | 2,998 (6.5%) | 2,720 (5.9%) |
| 15 to 19 Years | 2,949 (6.4%) | 2,844 (6.1%) |
| 20 to 24 Years | 2,877 (6.2%) | 2,543 (5.5%) |
| 25 to 29 Years | 2,884 (6.2%) | 2,696 (5.8%) |
| 30 to 34 Years | 2,780 (6.0%) | 2,489 (5.4%) |
| 35 to 39 Years | 2,983 (6.4%) | 2,691 (5.8%) |
| 40 to 44 Years | 2,647 (5.7%) | 2,577 (5.6%) |
| 45 to 49 Years | 2,682 (5.8%) | 2,693 (5.8%) |
| 50 to 54 Years | 2,865 (6.2%) | 2,819 (6.1%) |
| 55 to 59 Years | 3,307 (7.1%) | 3,324 (7.2%) |
| 60 to 64 Years | 3,173 (6.8%) | 3,202 (6.9%) |
| 65 to 69 Years | 2,656 (5.7%) | 3,353 (7.2%) |
| 70 to 74 Years | 2,524 (5.4%) | 2,177 (4.7%) |
| 75 to 79 Years | 1,184 (2.5%) | 1,892 (4.1%) |
| 80 to 84 Years | 1,092 (2.4%) | 1,350 (2.9%) |
| 85 Years and over | 776 (1.7%) | 1,367 (2.9%) |
| Total | 46,428 (100.0%) | 46,412 (100.0%) |
Families and Households in Tuscarawas County
Median Family Size in Tuscarawas County
The median family size in Tuscarawas County is 2.96 persons per family, with married-couple families (19,319 | 77.5%) accounting for the largest median family size of 3.02 persons per family. On the other hand, single male/father families (2,411 | 9.7%) represent the smallest median family size with 2.71 persons per family.
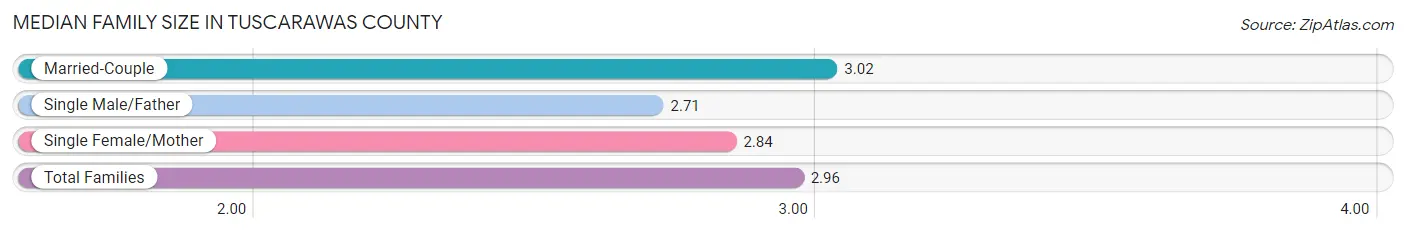
| Family Type | # Families | Family Size |
| Married-Couple | 19,319 (77.5%) | 3.02 |
| Single Male/Father | 2,411 (9.7%) | 2.71 |
| Single Female/Mother | 3,191 (12.8%) | 2.84 |
| Total Families | 24,921 (100.0%) | 2.96 |
Median Household Size in Tuscarawas County
The median household size in Tuscarawas County is 2.43 persons per household, with single male/father households (2,411 | 6.4%) accounting for the largest median household size of 3.16 persons per household. non-family households (12,853 | 34.0%) represent the smallest median household size with 1.21 persons per household.
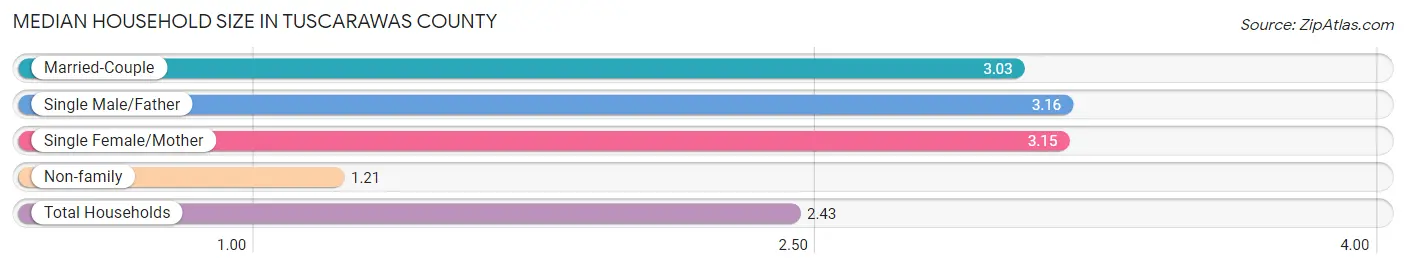
| Household Type | # Households | Household Size |
| Married-Couple | 19,319 (51.1%) | 3.03 |
| Single Male/Father | 2,411 (6.4%) | 3.16 |
| Single Female/Mother | 3,191 (8.5%) | 3.15 |
| Non-family | 12,853 (34.0%) | 1.21 |
| Total Households | 37,774 (100.0%) | 2.43 |
Household Size by Marriage Status in Tuscarawas County
Out of a total of 37,774 households in Tuscarawas County, 24,921 (66.0%) are family households, while 12,853 (34.0%) are nonfamily households. The most numerous type of family households are 2-person households, comprising 12,834, and the most common type of nonfamily households are 1-person households, comprising 10,724.
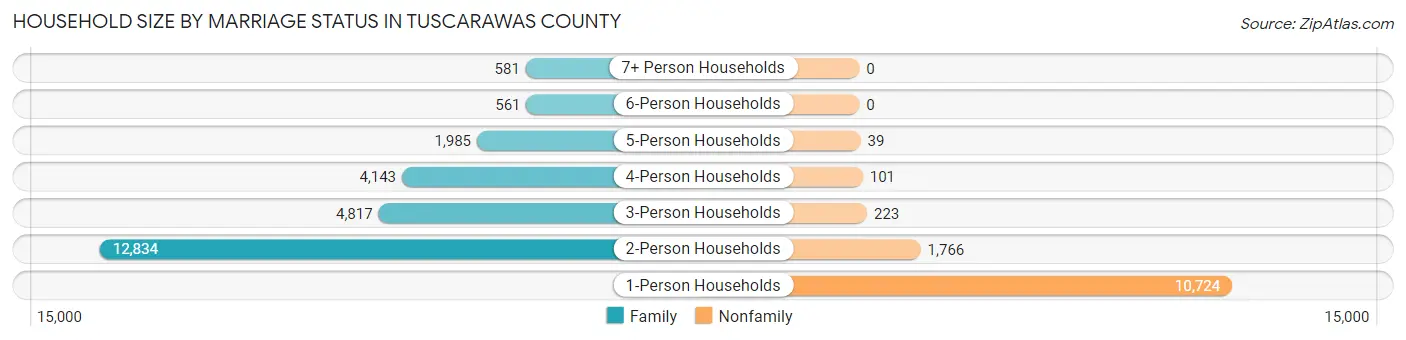
| Household Size | Family Households | Nonfamily Households |
| 1-Person Households | - | 10,724 (28.4%) |
| 2-Person Households | 12,834 (34.0%) | 1,766 (4.7%) |
| 3-Person Households | 4,817 (12.8%) | 223 (0.6%) |
| 4-Person Households | 4,143 (11.0%) | 101 (0.3%) |
| 5-Person Households | 1,985 (5.2%) | 39 (0.1%) |
| 6-Person Households | 561 (1.5%) | 0 (0.0%) |
| 7+ Person Households | 581 (1.5%) | 0 (0.0%) |
| Total | 24,921 (66.0%) | 12,853 (34.0%) |
Female Fertility in Tuscarawas County
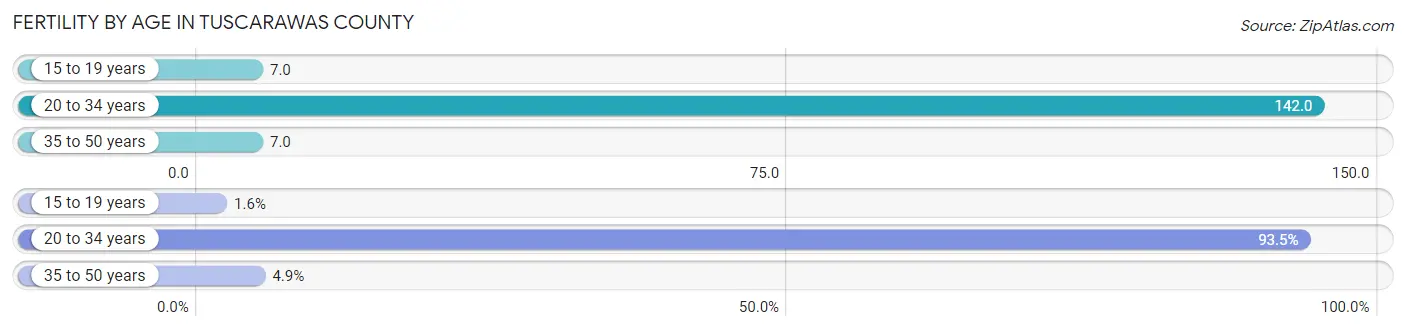
Fertility by Age in Tuscarawas County
Average fertility rate in Tuscarawas County is 61.0 births per 1,000 women. Women in the age bracket of 20 to 34 years have the highest fertility rate with 142.0 births per 1,000 women. Women in the age bracket of 20 to 34 years acount for 93.5% of all women with births.
| Age Bracket | Women with Births | Births / 1,000 Women |
| 15 to 19 years | 19 (1.6%) | 7.0 |
| 20 to 34 years | 1,094 (93.5%) | 142.0 |
| 35 to 50 years | 57 (4.9%) | 7.0 |
| Total | 1,170 (100.0%) | 61.0 |
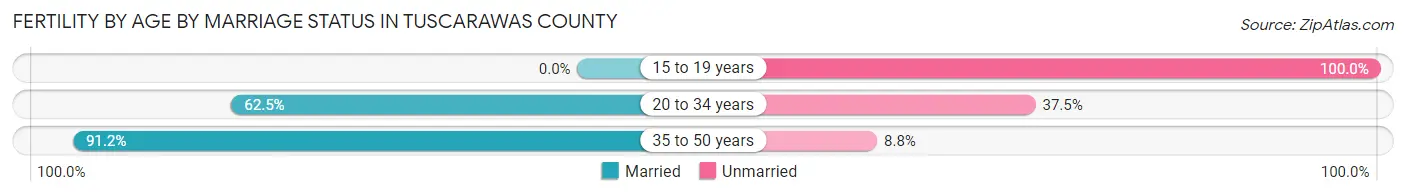
Fertility by Age by Marriage Status in Tuscarawas County
62.9% of women with births (1,170) in Tuscarawas County are married. The highest percentage of unmarried women with births falls into 15 to 19 years age bracket with 100.0% of them unmarried at the time of birth, while the lowest percentage of unmarried women with births belong to 35 to 50 years age bracket with 8.8% of them unmarried.
| Age Bracket | Married | Unmarried |
| 15 to 19 years | 0 (0.0%) | 19 (100.0%) |
| 20 to 34 years | 684 (62.5%) | 410 (37.5%) |
| 35 to 50 years | 52 (91.2%) | 5 (8.8%) |
| Total | 736 (62.9%) | 434 (37.1%) |
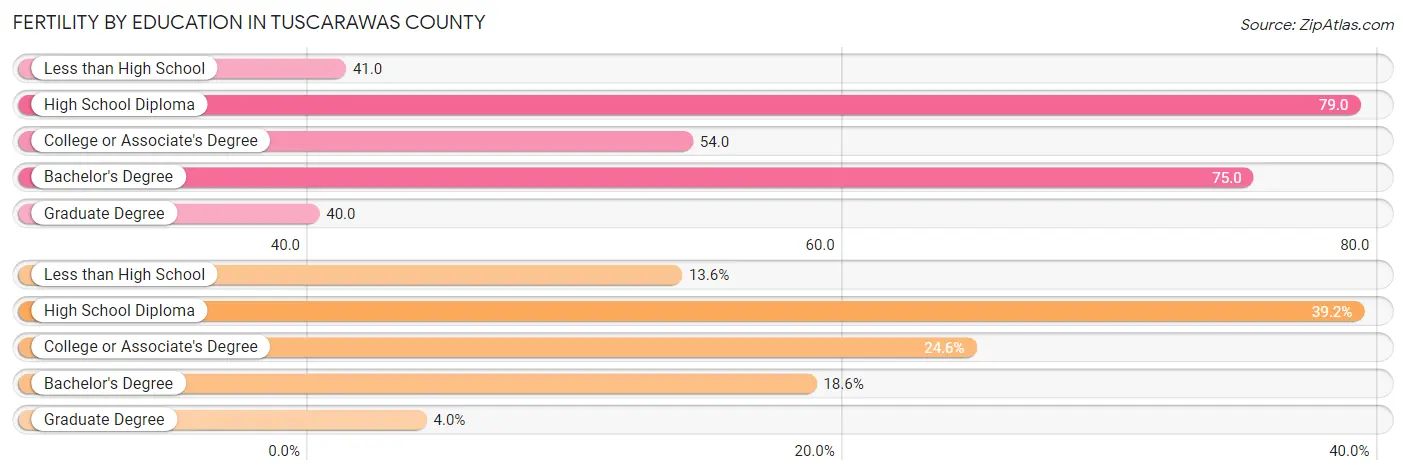
Fertility by Education in Tuscarawas County
Average fertility rate in Tuscarawas County is 61.0 births per 1,000 women. Women with the education attainment of high school diploma have the highest fertility rate of 79.0 births per 1,000 women, while women with the education attainment of graduate degree have the lowest fertility at 40.0 births per 1,000 women. Women with the education attainment of high school diploma represent 39.2% of all women with births.
| Educational Attainment | Women with Births | Births / 1,000 Women |
| Less than High School | 159 (13.6%) | 41.0 |
| High School Diploma | 458 (39.2%) | 79.0 |
| College or Associate's Degree | 288 (24.6%) | 54.0 |
| Bachelor's Degree | 218 (18.6%) | 75.0 |
| Graduate Degree | 47 (4.0%) | 40.0 |
| Total | 1,170 (100.0%) | 61.0 |
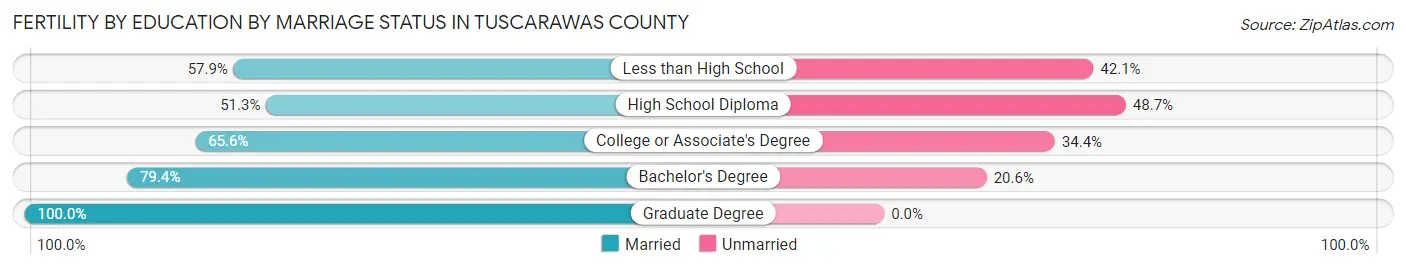
Fertility by Education by Marriage Status in Tuscarawas County
37.1% of women with births in Tuscarawas County are unmarried. Women with the educational attainment of graduate degree are most likely to be married with 100.0% of them married at childbirth, while women with the educational attainment of high school diploma are least likely to be married with 48.7% of them unmarried at childbirth.
| Educational Attainment | Married | Unmarried |
| Less than High School | 92 (57.9%) | 67 (42.1%) |
| High School Diploma | 235 (51.3%) | 223 (48.7%) |
| College or Associate's Degree | 189 (65.6%) | 99 (34.4%) |
| Bachelor's Degree | 173 (79.4%) | 45 (20.6%) |
| Graduate Degree | 47 (100.0%) | 0 (0.0%) |
| Total | 736 (62.9%) | 434 (37.1%) |
Income in Tuscarawas County
Income Overview in Tuscarawas County
Per Capita Income in Tuscarawas County is $31,736, while median incomes of families and households are $76,057 and $61,953 respectively.
| Characteristic | Number | Measure |
| Per Capita Income | 92,840 | $31,736 |
| Median Family Income | 24,921 | $76,057 |
| Mean Family Income | 24,921 | $90,520 |
| Median Household Income | 37,774 | $61,953 |
| Mean Household Income | 37,774 | $76,914 |
| Income Deficit | 24,921 | $10,480 |
| Wage / Income Gap (%) | 92,840 | 35.60% |
| Wage / Income Gap ($) | 92,840 | 64.40¢ per $1 |
| Gini / Inequality Index | 92,840 | 0.42 |
Earnings by Sex in Tuscarawas County
Average Earnings in Tuscarawas County are $37,234, $45,371 for men and $29,217 for women, a difference of 35.6%.
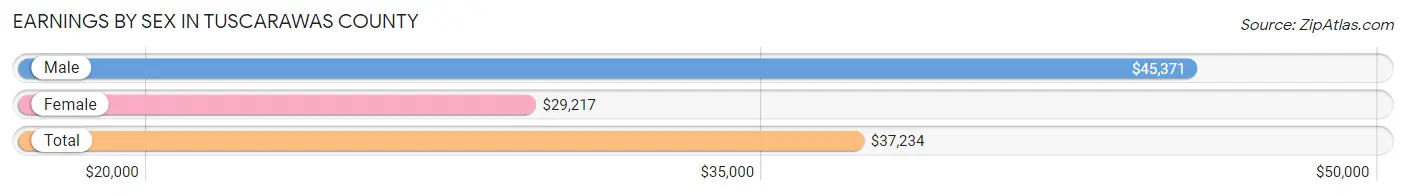
| Sex | Number | Average Earnings |
| Male | 26,331 (55.5%) | $45,371 |
| Female | 21,078 (44.5%) | $29,217 |
| Total | 47,409 (100.0%) | $37,234 |
Earnings by Sex by Income Bracket in Tuscarawas County
The most common earnings brackets in Tuscarawas County are $75,000 to $99,999 for men (2,943 | 11.2%) and $55,000 to $64,999 for women (1,504 | 7.1%).
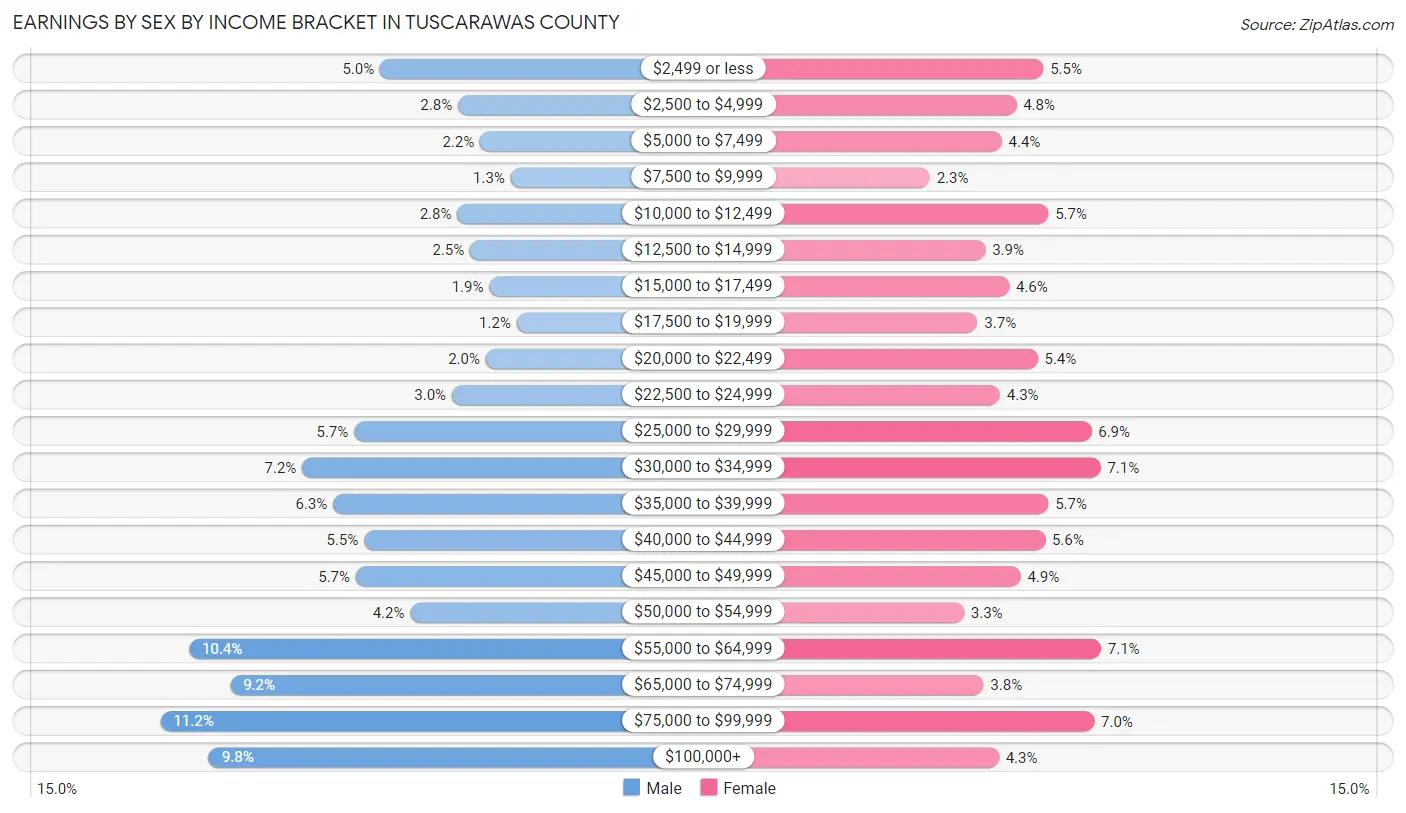
| Income | Male | Female |
| $2,499 or less | 1,319 (5.0%) | 1,164 (5.5%) |
| $2,500 to $4,999 | 742 (2.8%) | 1,003 (4.8%) |
| $5,000 to $7,499 | 580 (2.2%) | 916 (4.3%) |
| $7,500 to $9,999 | 352 (1.3%) | 491 (2.3%) |
| $10,000 to $12,499 | 747 (2.8%) | 1,193 (5.7%) |
| $12,500 to $14,999 | 654 (2.5%) | 820 (3.9%) |
| $15,000 to $17,499 | 512 (1.9%) | 962 (4.6%) |
| $17,500 to $19,999 | 307 (1.2%) | 773 (3.7%) |
| $20,000 to $22,499 | 538 (2.0%) | 1,130 (5.4%) |
| $22,500 to $24,999 | 786 (3.0%) | 907 (4.3%) |
| $25,000 to $29,999 | 1,511 (5.7%) | 1,449 (6.9%) |
| $30,000 to $34,999 | 1,896 (7.2%) | 1,503 (7.1%) |
| $35,000 to $39,999 | 1,667 (6.3%) | 1,193 (5.7%) |
| $40,000 to $44,999 | 1,438 (5.5%) | 1,173 (5.6%) |
| $45,000 to $49,999 | 1,498 (5.7%) | 1,029 (4.9%) |
| $50,000 to $54,999 | 1,095 (4.2%) | 694 (3.3%) |
| $55,000 to $64,999 | 2,732 (10.4%) | 1,504 (7.1%) |
| $65,000 to $74,999 | 2,429 (9.2%) | 810 (3.8%) |
| $75,000 to $99,999 | 2,943 (11.2%) | 1,465 (7.0%) |
| $100,000+ | 2,585 (9.8%) | 899 (4.3%) |
| Total | 26,331 (100.0%) | 21,078 (100.0%) |
Earnings by Sex by Educational Attainment in Tuscarawas County
Average earnings in Tuscarawas County are $51,537 for men and $33,666 for women, a difference of 34.7%. Men with an educational attainment of bachelor's degree enjoy the highest average annual earnings of $76,960, while those with less than high school education earn the least with $43,404. Women with an educational attainment of graduate degree earn the most with the average annual earnings of $69,833, while those with less than high school education have the smallest earnings of $16,442.

| Educational Attainment | Male Income | Female Income |
| Less than High School | $43,404 | $16,442 |
| High School Diploma | $45,333 | $24,332 |
| College or Associate's Degree | $53,546 | $29,967 |
| Bachelor's Degree | $76,960 | $52,118 |
| Graduate Degree | $72,679 | $69,833 |
| Total | $51,537 | $33,666 |
Family Income in Tuscarawas County
Family Income Brackets in Tuscarawas County
According to the Tuscarawas County family income data, there are 5,258 families falling into the $50,000 to $74,999 income range, which is the most common income bracket and makes up 21.1% of all families. Conversely, the $10,000 to $14,999 income bracket is the least frequent group with only 548 families (2.2%) belonging to this category.
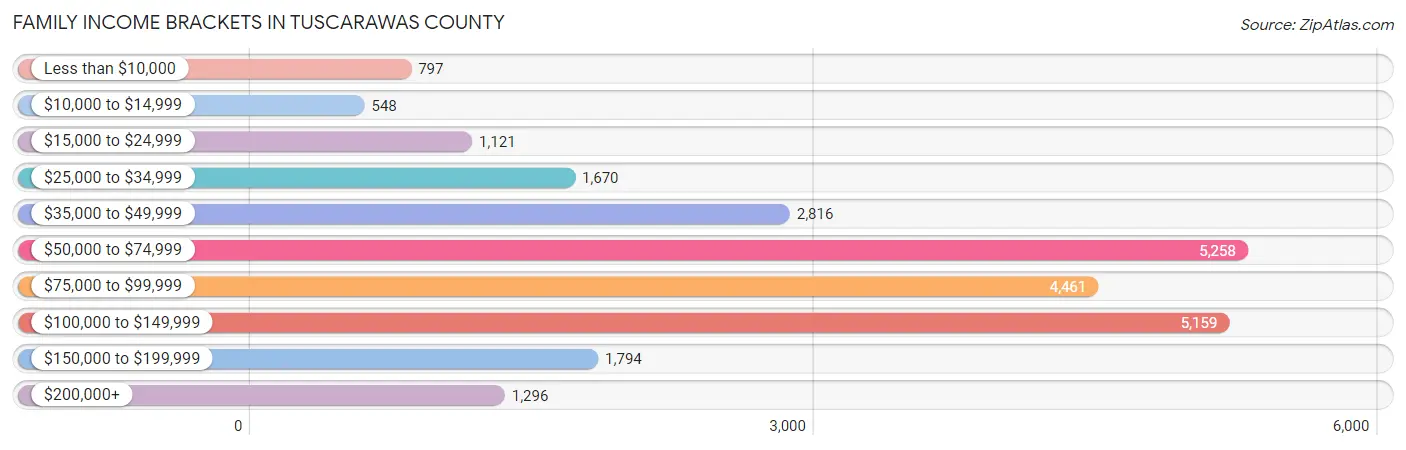
| Income Bracket | # Families | % Families |
| Less than $10,000 | 797 | 3.2% |
| $10,000 to $14,999 | 548 | 2.2% |
| $15,000 to $24,999 | 1,121 | 4.5% |
| $25,000 to $34,999 | 1,670 | 6.7% |
| $35,000 to $49,999 | 2,816 | 11.3% |
| $50,000 to $74,999 | 5,258 | 21.1% |
| $75,000 to $99,999 | 4,461 | 17.9% |
| $100,000 to $149,999 | 5,159 | 20.7% |
| $150,000 to $199,999 | 1,794 | 7.2% |
| $200,000+ | 1,296 | 5.2% |
Family Income by Famaliy Size in Tuscarawas County
5-person families (1,835 | 7.4%) account for the highest median family income in Tuscarawas County with $116,458 per family, while 2-person families (13,735 | 55.1%) have the highest median income of $32,718 per family member.
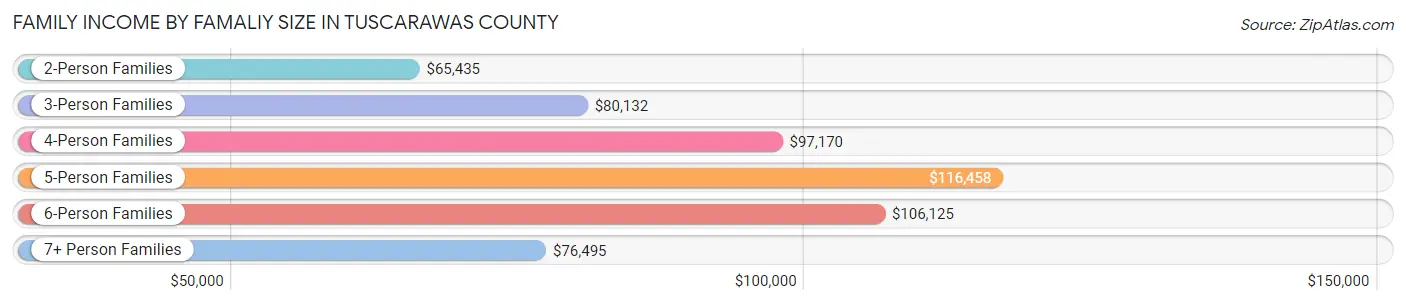
| Income Bracket | # Families | Median Income |
| 2-Person Families | 13,735 (55.1%) | $65,435 |
| 3-Person Families | 4,874 (19.6%) | $80,132 |
| 4-Person Families | 3,449 (13.8%) | $97,170 |
| 5-Person Families | 1,835 (7.4%) | $116,458 |
| 6-Person Families | 539 (2.2%) | $106,125 |
| 7+ Person Families | 489 (2.0%) | $76,495 |
| Total | 24,921 (100.0%) | $76,057 |
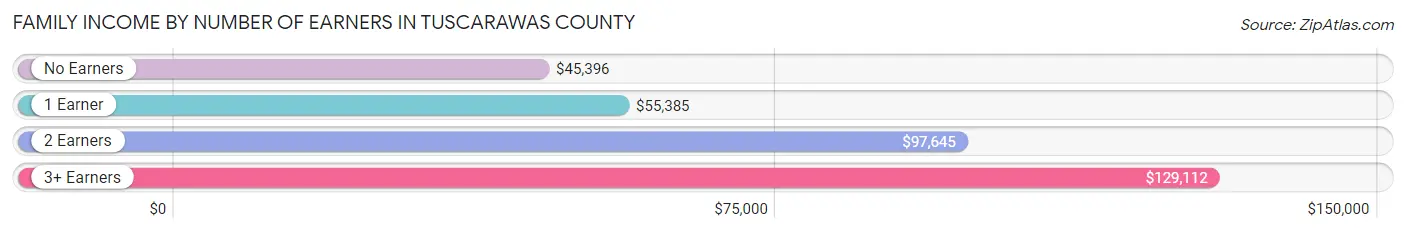
Family Income by Number of Earners in Tuscarawas County
The median family income in Tuscarawas County is $76,057, with families comprising 3+ earners (2,667) having the highest median family income of $129,112, while families with no earners (4,247) have the lowest median family income of $45,396, accounting for 10.7% and 17.0% of families, respectively.
| Number of Earners | # Families | Median Income |
| No Earners | 4,247 (17.0%) | $45,396 |
| 1 Earner | 8,260 (33.1%) | $55,385 |
| 2 Earners | 9,747 (39.1%) | $97,645 |
| 3+ Earners | 2,667 (10.7%) | $129,112 |
| Total | 24,921 (100.0%) | $76,057 |
Household Income in Tuscarawas County
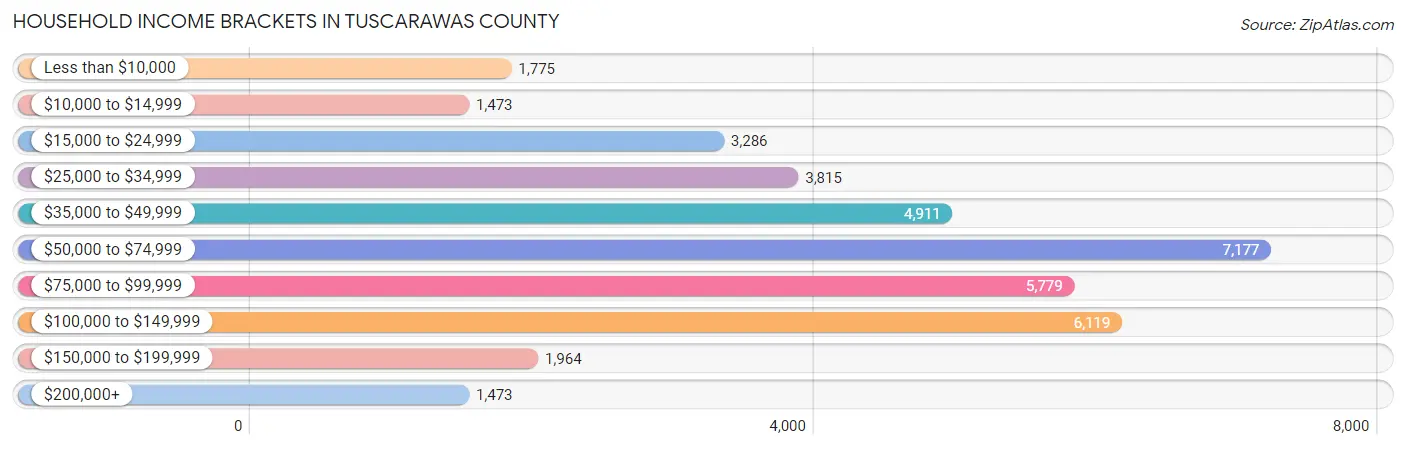
Household Income Brackets in Tuscarawas County
With 7,177 households falling in the category, the $50,000 to $74,999 income range is the most frequent in Tuscarawas County, accounting for 19.0% of all households. In contrast, only 1,473 households (3.9%) fall into the $10,000 to $14,999 income bracket, making it the least populous group.
| Income Bracket | # Households | % Households |
| Less than $10,000 | 1,775 | 4.7% |
| $10,000 to $14,999 | 1,473 | 3.9% |
| $15,000 to $24,999 | 3,286 | 8.7% |
| $25,000 to $34,999 | 3,815 | 10.1% |
| $35,000 to $49,999 | 4,911 | 13.0% |
| $50,000 to $74,999 | 7,177 | 19.0% |
| $75,000 to $99,999 | 5,779 | 15.3% |
| $100,000 to $149,999 | 6,119 | 16.2% |
| $150,000 to $199,999 | 1,964 | 5.2% |
| $200,000+ | 1,473 | 3.9% |
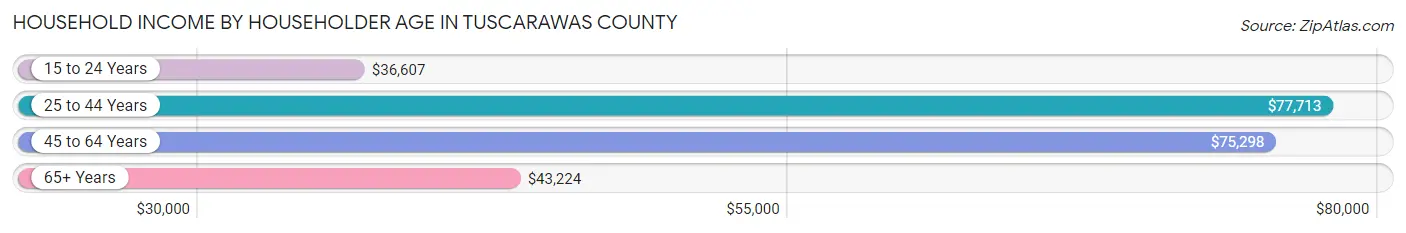
Household Income by Householder Age in Tuscarawas County
The median household income in Tuscarawas County is $61,953, with the highest median household income of $77,713 found in the 25 to 44 years age bracket for the primary householder. A total of 10,600 households (28.1%) fall into this category. Meanwhile, the 15 to 24 years age bracket for the primary householder has the lowest median household income of $36,607, with 1,710 households (4.5%) in this group.
| Income Bracket | # Households | Median Income |
| 15 to 24 Years | 1,710 (4.5%) | $36,607 |
| 25 to 44 Years | 10,600 (28.1%) | $77,713 |
| 45 to 64 Years | 13,723 (36.3%) | $75,298 |
| 65+ Years | 11,741 (31.1%) | $43,224 |
| Total | 37,774 (100.0%) | $61,953 |
Poverty in Tuscarawas County
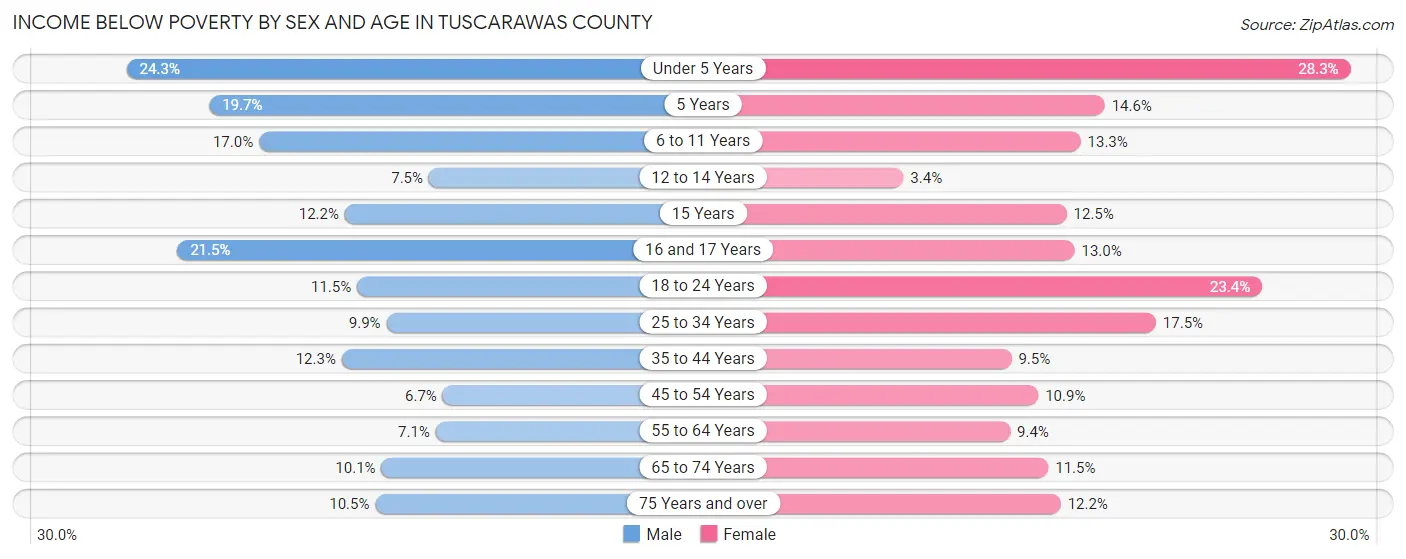
Income Below Poverty by Sex and Age in Tuscarawas County
With 11.5% poverty level for males and 13.5% for females among the residents of Tuscarawas County, under 5 year old males and under 5 year old females are the most vulnerable to poverty, with 699 males (24.3%) and 790 females (28.3%) in their respective age groups living below the poverty level.
| Age Bracket | Male | Female |
| Under 5 Years | 699 (24.3%) | 790 (28.3%) |
| 5 Years | 139 (19.7%) | 71 (14.6%) |
| 6 to 11 Years | 581 (17.0%) | 429 (13.3%) |
| 12 to 14 Years | 139 (7.5%) | 57 (3.4%) |
| 15 Years | 73 (12.2%) | 78 (12.5%) |
| 16 and 17 Years | 275 (21.5%) | 166 (13.0%) |
| 18 to 24 Years | 449 (11.5%) | 815 (23.4%) |
| 25 to 34 Years | 555 (9.9%) | 907 (17.5%) |
| 35 to 44 Years | 692 (12.3%) | 497 (9.5%) |
| 45 to 54 Years | 371 (6.7%) | 601 (10.9%) |
| 55 to 64 Years | 459 (7.1%) | 607 (9.4%) |
| 65 to 74 Years | 513 (10.1%) | 618 (11.5%) |
| 75 Years and over | 308 (10.5%) | 524 (12.2%) |
| Total | 5,253 (11.5%) | 6,160 (13.5%) |
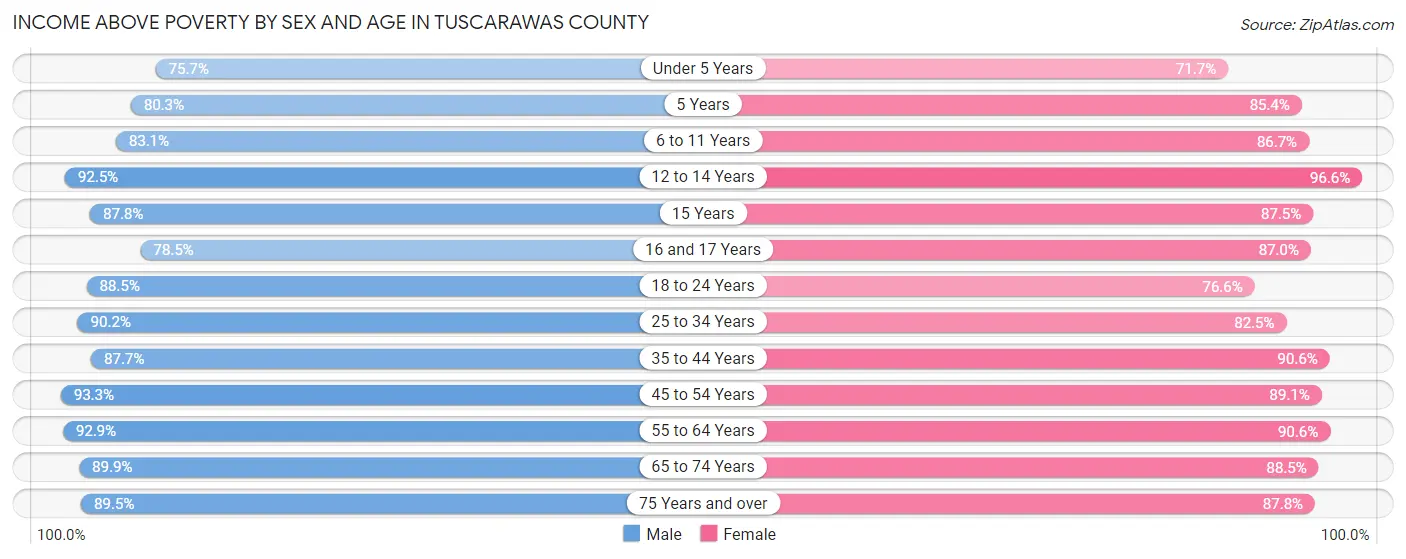
Income Above Poverty by Sex and Age in Tuscarawas County
According to the poverty statistics in Tuscarawas County, males aged 45 to 54 years and females aged 12 to 14 years are the age groups that are most secure financially, with 93.3% of males and 96.6% of females in these age groups living above the poverty line.
| Age Bracket | Male | Female |
| Under 5 Years | 2,175 (75.7%) | 2,000 (71.7%) |
| 5 Years | 566 (80.3%) | 414 (85.4%) |
| 6 to 11 Years | 2,847 (83.1%) | 2,797 (86.7%) |
| 12 to 14 Years | 1,718 (92.5%) | 1,603 (96.6%) |
| 15 Years | 527 (87.8%) | 545 (87.5%) |
| 16 and 17 Years | 1,004 (78.5%) | 1,115 (87.0%) |
| 18 to 24 Years | 3,460 (88.5%) | 2,668 (76.6%) |
| 25 to 34 Years | 5,080 (90.1%) | 4,278 (82.5%) |
| 35 to 44 Years | 4,917 (87.7%) | 4,760 (90.5%) |
| 45 to 54 Years | 5,146 (93.3%) | 4,893 (89.1%) |
| 55 to 64 Years | 5,995 (92.9%) | 5,871 (90.6%) |
| 65 to 74 Years | 4,552 (89.9%) | 4,754 (88.5%) |
| 75 Years and over | 2,633 (89.5%) | 3,774 (87.8%) |
| Total | 40,620 (88.5%) | 39,472 (86.5%) |
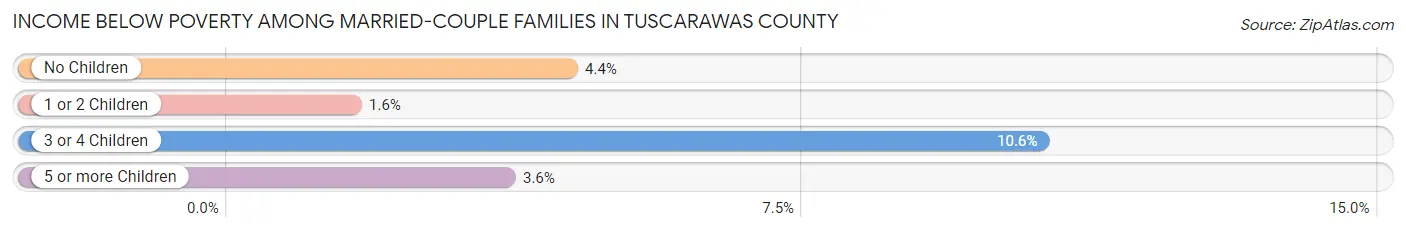
Income Below Poverty Among Married-Couple Families in Tuscarawas County
The poverty statistics for married-couple families in Tuscarawas County show that 4.2% or 802 of the total 19,319 families live below the poverty line. Families with 3 or 4 children have the highest poverty rate of 10.6%, comprising of 148 families. On the other hand, families with 1 or 2 children have the lowest poverty rate of 1.6%, which includes 80 families.
| Children | Above Poverty | Below Poverty |
| No Children | 12,114 (95.6%) | 563 (4.4%) |
| 1 or 2 Children | 4,861 (98.4%) | 80 (1.6%) |
| 3 or 4 Children | 1,250 (89.4%) | 148 (10.6%) |
| 5 or more Children | 292 (96.4%) | 11 (3.6%) |
| Total | 18,517 (95.9%) | 802 (4.2%) |
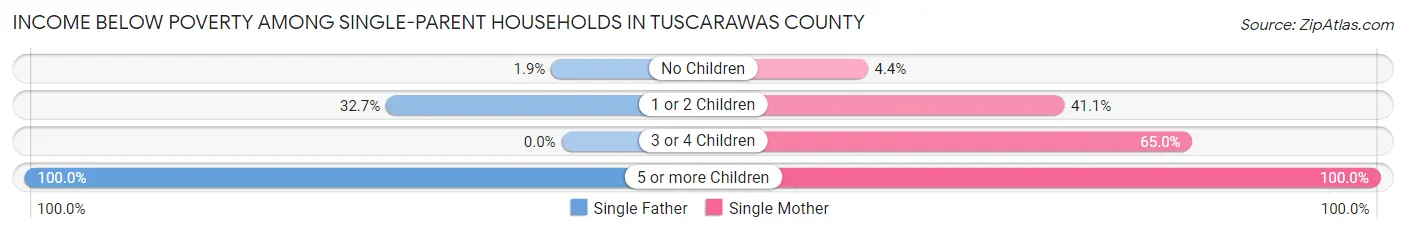
Income Below Poverty Among Single-Parent Households in Tuscarawas County
According to the poverty data in Tuscarawas County, 18.1% or 437 single-father households and 29.0% or 927 single-mother households are living below the poverty line. Among single-father households, those with 5 or more children have the highest poverty rate, with 3 households (100.0%) experiencing poverty. Likewise, among single-mother households, those with 5 or more children have the highest poverty rate, with 5 households (100.0%) falling below the poverty line.
| Children | Single Father | Single Mother |
| No Children | 17 (1.9%) | 53 (4.4%) |
| 1 or 2 Children | 417 (32.7%) | 730 (41.1%) |
| 3 or 4 Children | 0 (0.0%) | 139 (64.9%) |
| 5 or more Children | 3 (100.0%) | 5 (100.0%) |
| Total | 437 (18.1%) | 927 (29.0%) |
Income Below Poverty Among Married-Couple vs Single-Parent Households in Tuscarawas County
The poverty data for Tuscarawas County shows that 802 of the married-couple family households (4.2%) and 1,364 of the single-parent households (24.3%) are living below the poverty level. Within the married-couple family households, those with 3 or 4 children have the highest poverty rate, with 148 households (10.6%) falling below the poverty line. Among the single-parent households, those with 5 or more children have the highest poverty rate, with 8 household (100.0%) living below poverty.

| Children | Married-Couple Families | Single-Parent Households |
| No Children | 563 (4.4%) | 70 (3.4%) |
| 1 or 2 Children | 80 (1.6%) | 1,147 (37.6%) |
| 3 or 4 Children | 148 (10.6%) | 139 (30.5%) |
| 5 or more Children | 11 (3.6%) | 8 (100.0%) |
| Total | 802 (4.2%) | 1,364 (24.3%) |
Employment Characteristics in Tuscarawas County
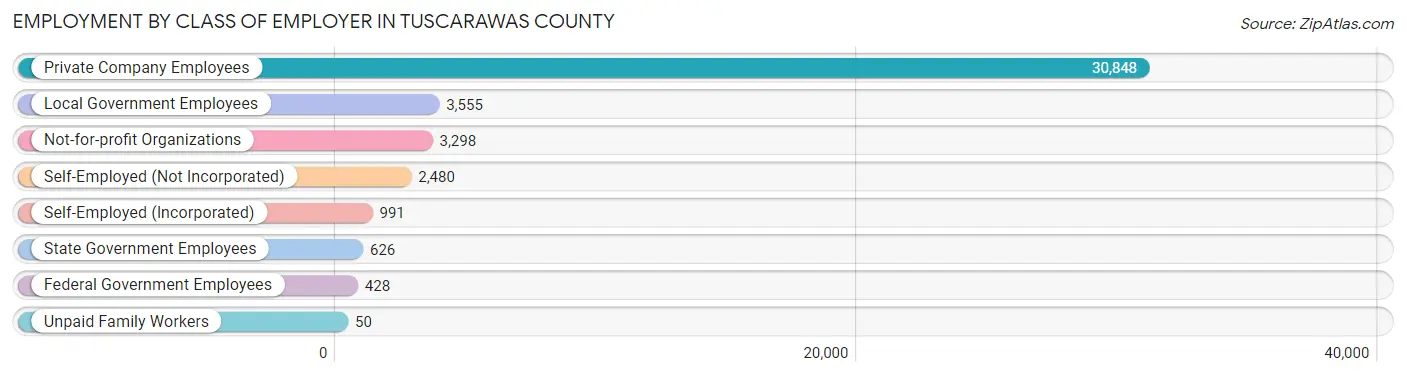
Employment by Class of Employer in Tuscarawas County
Among the 42,276 employed individuals in Tuscarawas County, private company employees (30,848 | 73.0%), local government employees (3,555 | 8.4%), and not-for-profit organizations (3,298 | 7.8%) make up the most common classes of employment.
| Employer Class | # Employees | % Employees |
| Private Company Employees | 30,848 | 73.0% |
| Self-Employed (Incorporated) | 991 | 2.3% |
| Self-Employed (Not Incorporated) | 2,480 | 5.9% |
| Not-for-profit Organizations | 3,298 | 7.8% |
| Local Government Employees | 3,555 | 8.4% |
| State Government Employees | 626 | 1.5% |
| Federal Government Employees | 428 | 1.0% |
| Unpaid Family Workers | 50 | 0.1% |
| Total | 42,276 | 100.0% |
Employment Status by Age in Tuscarawas County
According to the labor force statistics for Tuscarawas County, out of the total population over 16 years of age (74,172), 61.7% or 45,764 individuals are in the labor force, with 5.5% or 2,517 of them unemployed. The age group with the highest labor force participation rate is 20 to 24 years, with 87.7% or 4,753 individuals in the labor force. Within the labor force, the 16 to 19 years age range has the highest percentage of unemployed individuals, with 14.4% or 338 of them being unemployed.

| Age Bracket | In Labor Force | Unemployed |
| 16 to 19 Years | 2,344 (51.3%) | 338 (14.4%) |
| 20 to 24 Years | 4,753 (87.7%) | 499 (10.5%) |
| 25 to 29 Years | 4,620 (82.8%) | 282 (6.1%) |
| 30 to 34 Years | 4,547 (86.3%) | 100 (2.2%) |
| 35 to 44 Years | 9,187 (84.3%) | 514 (5.6%) |
| 45 to 54 Years | 9,013 (81.5%) | 478 (5.3%) |
| 55 to 59 Years | 4,761 (71.8%) | 81 (1.7%) |
| 60 to 64 Years | 3,723 (58.4%) | 201 (5.4%) |
| 65 to 74 Years | 2,517 (23.5%) | 25 (1.0%) |
| 75 Years and over | 291 (3.8%) | 0 (0.0%) |
| Total | 45,764 (61.7%) | 2,517 (5.5%) |
Employment Status by Educational Attainment in Tuscarawas County
According to labor force statistics for Tuscarawas County, 78.3% of individuals (35,871) out of the total population between 25 and 64 years of age (45,812) are in the labor force, with 4.6% or 1,650 of them being unemployed. The group with the highest labor force participation rate are those with the educational attainment of bachelor's degree or higher, with 90.8% or 9,075 individuals in the labor force. Within the labor force, individuals with less than high school education have the highest percentage of unemployment, with 10.9% or 299 of them being unemployed.
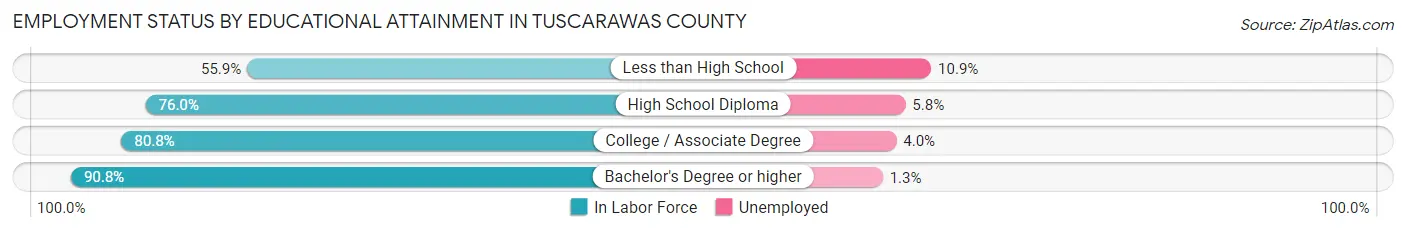
| Educational Attainment | In Labor Force | Unemployed |
| Less than High School | 2,745 (55.9%) | 535 (10.9%) |
| High School Diploma | 14,819 (76.0%) | 1,131 (5.8%) |
| College / Associate Degree | 9,218 (80.8%) | 456 (4.0%) |
| Bachelor's Degree or higher | 9,075 (90.8%) | 130 (1.3%) |
| Total | 35,871 (78.3%) | 2,107 (4.6%) |
Employment Occupations by Sex in Tuscarawas County
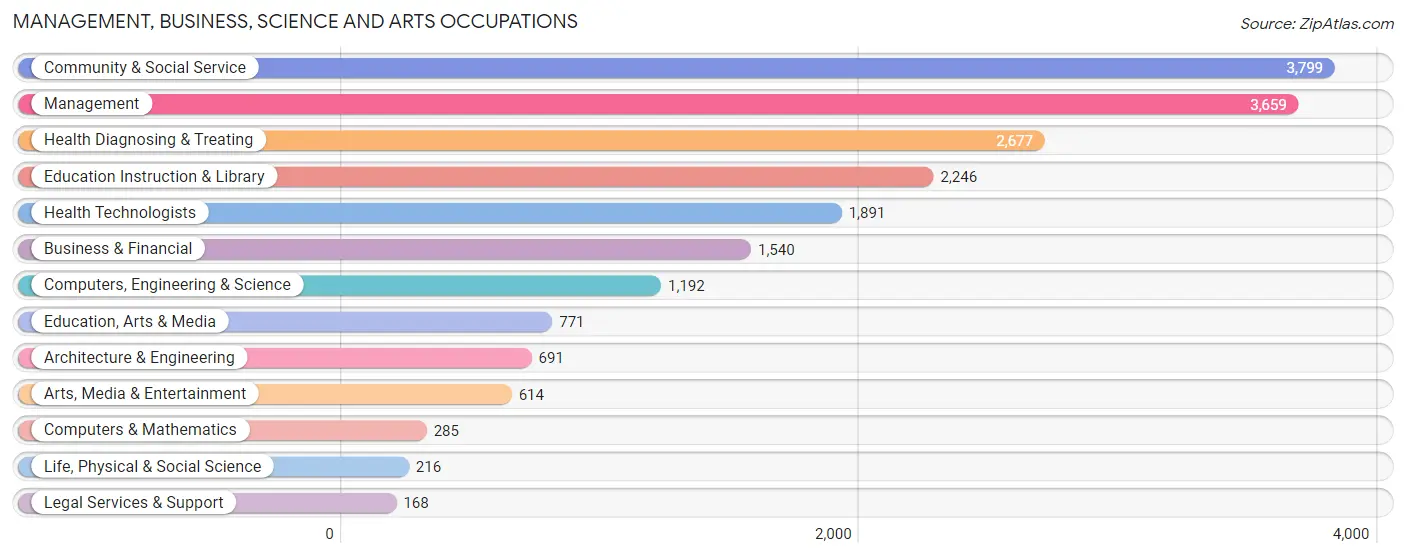
Management, Business, Science and Arts Occupations
The most common Management, Business, Science and Arts occupations in Tuscarawas County are Community & Social Service (3,799 | 8.8%), Management (3,659 | 8.5%), Health Diagnosing & Treating (2,677 | 6.2%), Education Instruction & Library (2,246 | 5.2%), and Health Technologists (1,891 | 4.4%).
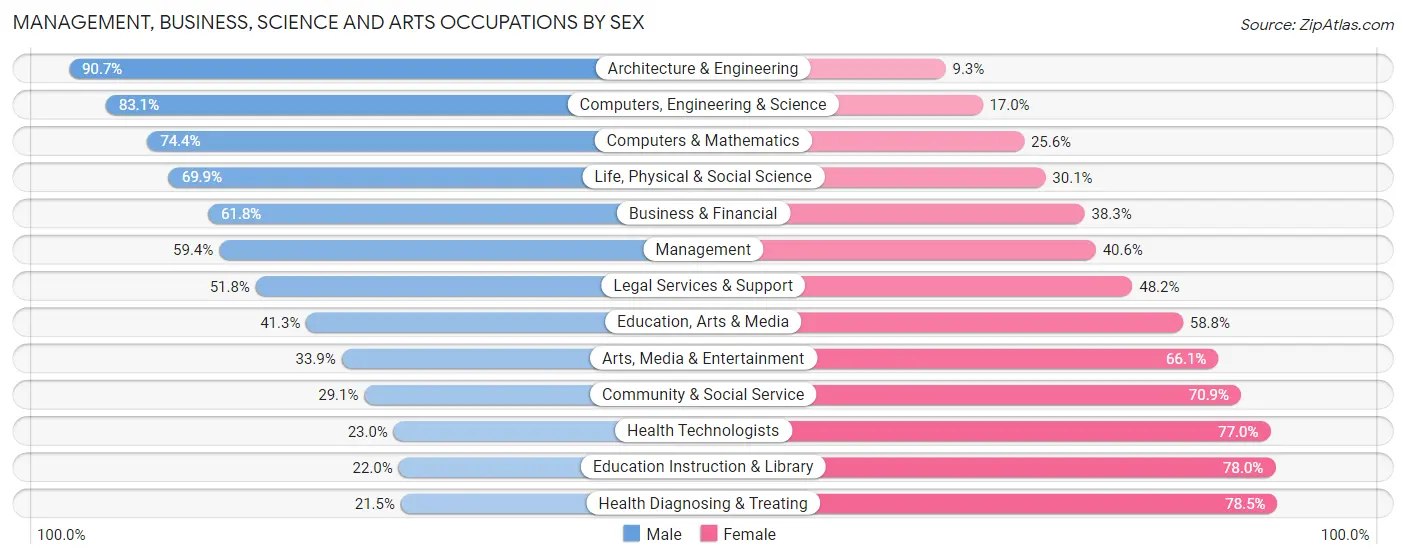
Management, Business, Science and Arts Occupations by Sex
Within the Management, Business, Science and Arts occupations in Tuscarawas County, the most male-oriented occupations are Architecture & Engineering (90.7%), Computers, Engineering & Science (83.1%), and Computers & Mathematics (74.4%), while the most female-oriented occupations are Health Diagnosing & Treating (78.5%), Education Instruction & Library (78.0%), and Health Technologists (77.0%).
| Occupation | Male | Female |
| Management | 2,174 (59.4%) | 1,485 (40.6%) |
| Business & Financial | 951 (61.8%) | 589 (38.3%) |
| Computers, Engineering & Science | 990 (83.1%) | 202 (17.0%) |
| Computers & Mathematics | 212 (74.4%) | 73 (25.6%) |
| Architecture & Engineering | 627 (90.7%) | 64 (9.3%) |
| Life, Physical & Social Science | 151 (69.9%) | 65 (30.1%) |
| Community & Social Service | 1,107 (29.1%) | 2,692 (70.9%) |
| Education, Arts & Media | 318 (41.2%) | 453 (58.8%) |
| Legal Services & Support | 87 (51.8%) | 81 (48.2%) |
| Education Instruction & Library | 494 (22.0%) | 1,752 (78.0%) |
| Arts, Media & Entertainment | 208 (33.9%) | 406 (66.1%) |
| Health Diagnosing & Treating | 576 (21.5%) | 2,101 (78.5%) |
| Health Technologists | 435 (23.0%) | 1,456 (77.0%) |
| Total (Category) | 5,798 (45.1%) | 7,069 (54.9%) |
| Total (Overall) | 24,220 (56.0%) | 19,017 (44.0%) |
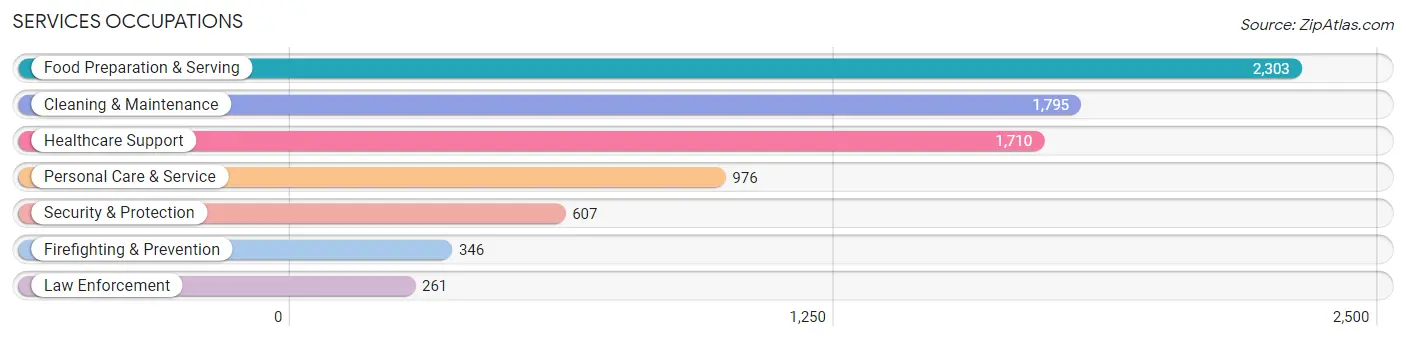
Services Occupations
The most common Services occupations in Tuscarawas County are Food Preparation & Serving (2,303 | 5.3%), Cleaning & Maintenance (1,795 | 4.2%), Healthcare Support (1,710 | 4.0%), Personal Care & Service (976 | 2.3%), and Security & Protection (607 | 1.4%).
Services Occupations by Sex
Within the Services occupations in Tuscarawas County, the most male-oriented occupations are Law Enforcement (85.8%), Security & Protection (83.4%), and Firefighting & Prevention (81.5%), while the most female-oriented occupations are Healthcare Support (90.3%), Food Preparation & Serving (69.0%), and Personal Care & Service (67.7%).
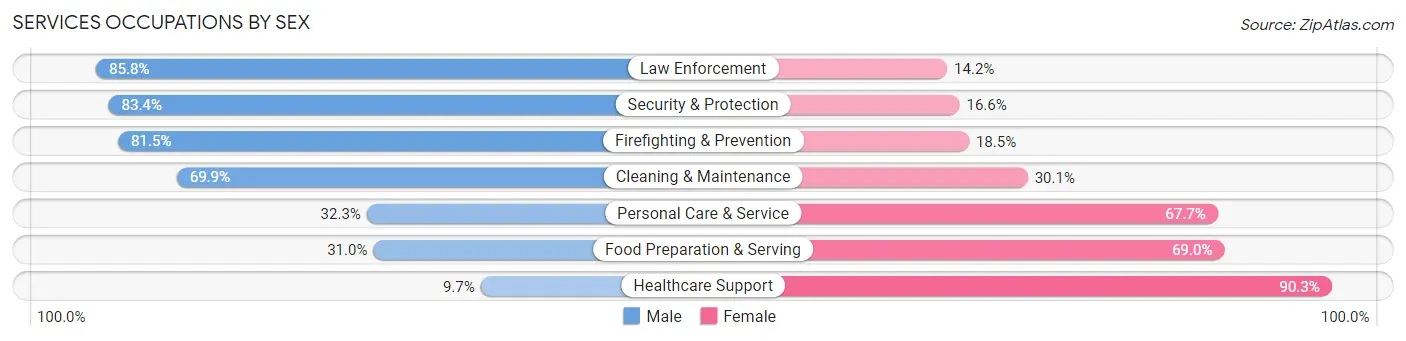
| Occupation | Male | Female |
| Healthcare Support | 166 (9.7%) | 1,544 (90.3%) |
| Security & Protection | 506 (83.4%) | 101 (16.6%) |
| Firefighting & Prevention | 282 (81.5%) | 64 (18.5%) |
| Law Enforcement | 224 (85.8%) | 37 (14.2%) |
| Food Preparation & Serving | 713 (31.0%) | 1,590 (69.0%) |
| Cleaning & Maintenance | 1,254 (69.9%) | 541 (30.1%) |
| Personal Care & Service | 315 (32.3%) | 661 (67.7%) |
| Total (Category) | 2,954 (40.0%) | 4,437 (60.0%) |
| Total (Overall) | 24,220 (56.0%) | 19,017 (44.0%) |
Sales and Office Occupations
The most common Sales and Office occupations in Tuscarawas County are Office & Administration (4,396 | 10.2%), and Sales & Related (3,519 | 8.1%).

Sales and Office Occupations by Sex
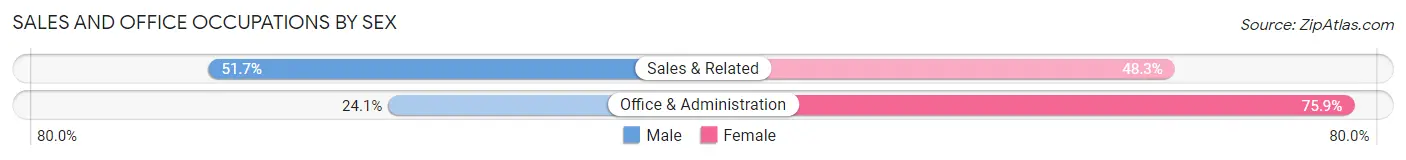
| Occupation | Male | Female |
| Sales & Related | 1,819 (51.7%) | 1,700 (48.3%) |
| Office & Administration | 1,058 (24.1%) | 3,338 (75.9%) |
| Total (Category) | 2,877 (36.3%) | 5,038 (63.6%) |
| Total (Overall) | 24,220 (56.0%) | 19,017 (44.0%) |
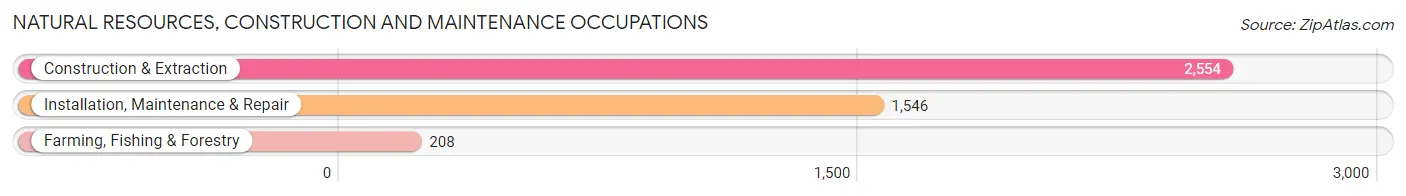
Natural Resources, Construction and Maintenance Occupations
The most common Natural Resources, Construction and Maintenance occupations in Tuscarawas County are Construction & Extraction (2,554 | 5.9%), Installation, Maintenance & Repair (1,546 | 3.6%), and Farming, Fishing & Forestry (208 | 0.5%).
Natural Resources, Construction and Maintenance Occupations by Sex
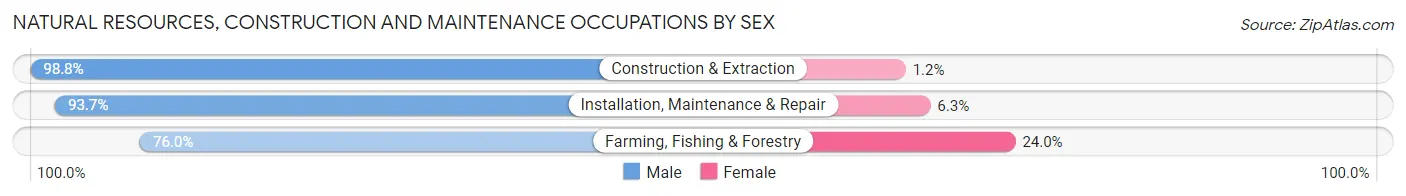
| Occupation | Male | Female |
| Farming, Fishing & Forestry | 158 (76.0%) | 50 (24.0%) |
| Construction & Extraction | 2,523 (98.8%) | 31 (1.2%) |
| Installation, Maintenance & Repair | 1,448 (93.7%) | 98 (6.3%) |
| Total (Category) | 4,129 (95.8%) | 179 (4.2%) |
| Total (Overall) | 24,220 (56.0%) | 19,017 (44.0%) |
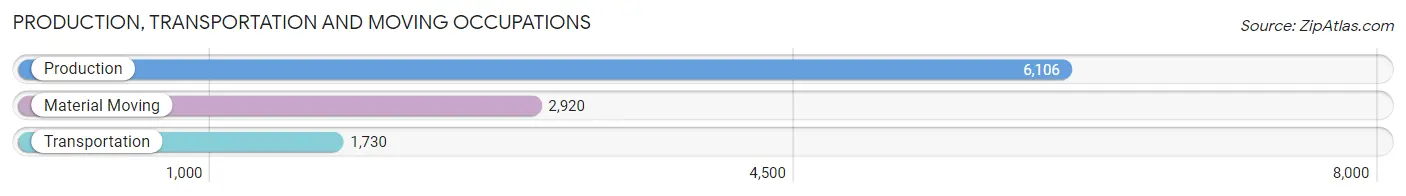
Production, Transportation and Moving Occupations
The most common Production, Transportation and Moving occupations in Tuscarawas County are Production (6,106 | 14.1%), Material Moving (2,920 | 6.8%), and Transportation (1,730 | 4.0%).
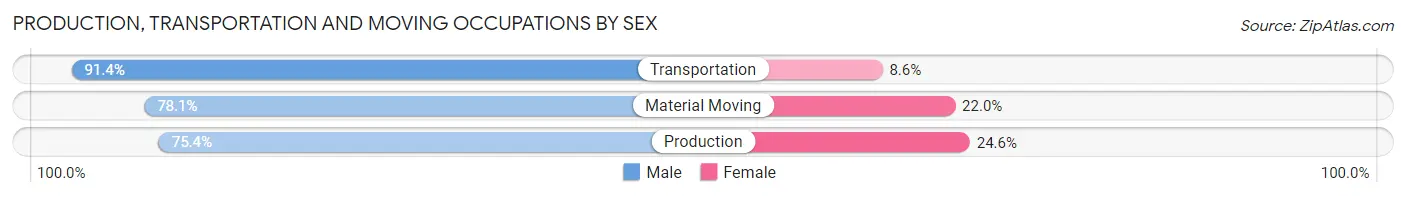
Production, Transportation and Moving Occupations by Sex
| Occupation | Male | Female |
| Production | 4,602 (75.4%) | 1,504 (24.6%) |
| Transportation | 1,581 (91.4%) | 149 (8.6%) |
| Material Moving | 2,279 (78.0%) | 641 (22.0%) |
| Total (Category) | 8,462 (78.7%) | 2,294 (21.3%) |
| Total (Overall) | 24,220 (56.0%) | 19,017 (44.0%) |
Employment Industries by Sex in Tuscarawas County
Employment Industries in Tuscarawas County
The major employment industries in Tuscarawas County include Manufacturing (10,184 | 23.5%), Health Care & Social Assistance (6,015 | 13.9%), Retail Trade (4,577 | 10.6%), Construction (3,425 | 7.9%), and Accommodation & Food Services (3,253 | 7.5%).

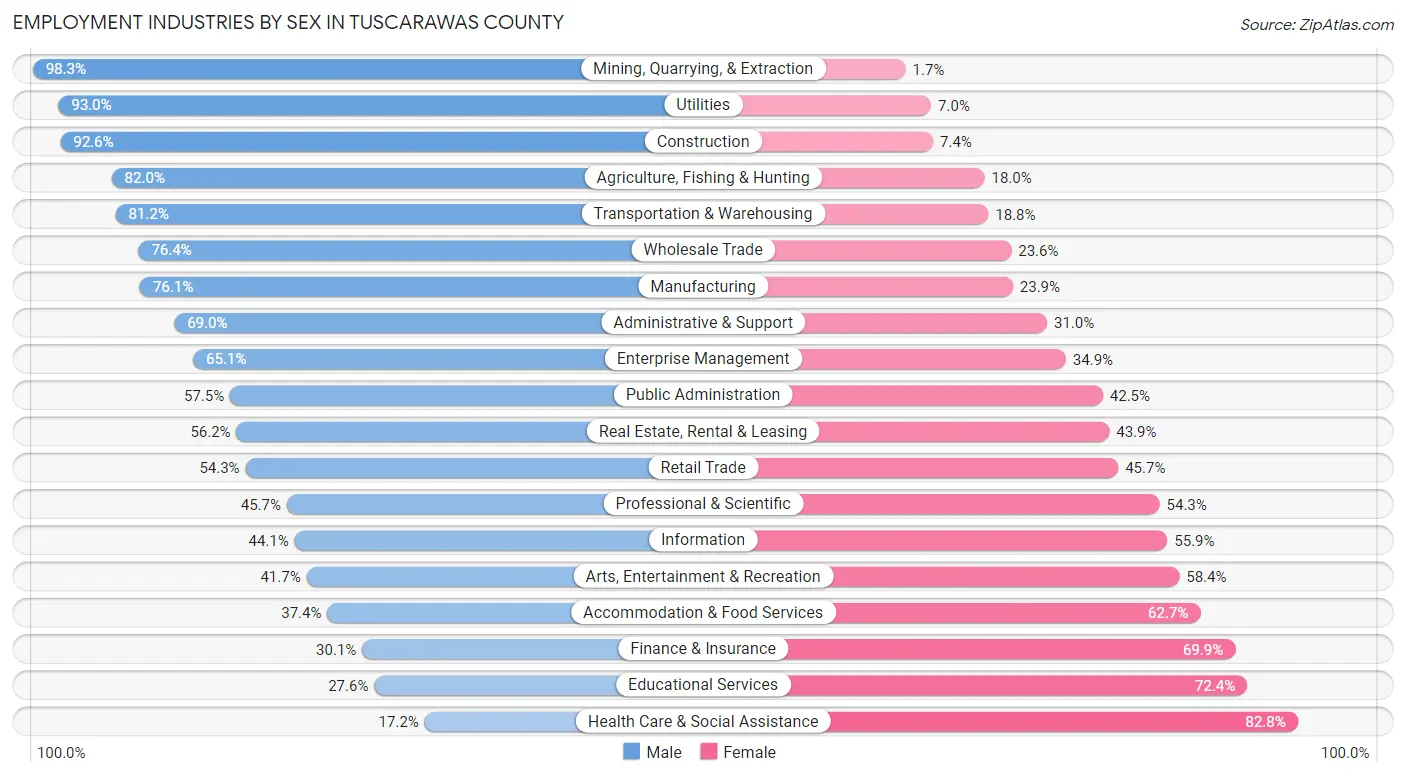
Employment Industries by Sex in Tuscarawas County
The Tuscarawas County industries that see more men than women are Mining, Quarrying, & Extraction (98.3%), Utilities (93.0%), and Construction (92.6%), whereas the industries that tend to have a higher number of women are Health Care & Social Assistance (82.8%), Educational Services (72.4%), and Finance & Insurance (69.9%).
| Industry | Male | Female |
| Agriculture, Fishing & Hunting | 500 (82.0%) | 110 (18.0%) |
| Mining, Quarrying, & Extraction | 465 (98.3%) | 8 (1.7%) |
| Construction | 3,172 (92.6%) | 253 (7.4%) |
| Manufacturing | 7,751 (76.1%) | 2,433 (23.9%) |
| Wholesale Trade | 587 (76.4%) | 181 (23.6%) |
| Retail Trade | 2,485 (54.3%) | 2,092 (45.7%) |
| Transportation & Warehousing | 1,091 (81.2%) | 253 (18.8%) |
| Utilities | 440 (93.0%) | 33 (7.0%) |
| Information | 188 (44.1%) | 238 (55.9%) |
| Finance & Insurance | 420 (30.1%) | 974 (69.9%) |
| Real Estate, Rental & Leasing | 201 (56.1%) | 157 (43.9%) |
| Professional & Scientific | 798 (45.7%) | 947 (54.3%) |
| Enterprise Management | 28 (65.1%) | 15 (34.9%) |
| Administrative & Support | 878 (69.0%) | 394 (31.0%) |
| Educational Services | 877 (27.6%) | 2,297 (72.4%) |
| Health Care & Social Assistance | 1,034 (17.2%) | 4,981 (82.8%) |
| Arts, Entertainment & Recreation | 192 (41.6%) | 269 (58.4%) |
| Accommodation & Food Services | 1,215 (37.3%) | 2,038 (62.6%) |
| Public Administration | 699 (57.5%) | 517 (42.5%) |
| Total | 24,220 (56.0%) | 19,017 (44.0%) |
Education in Tuscarawas County
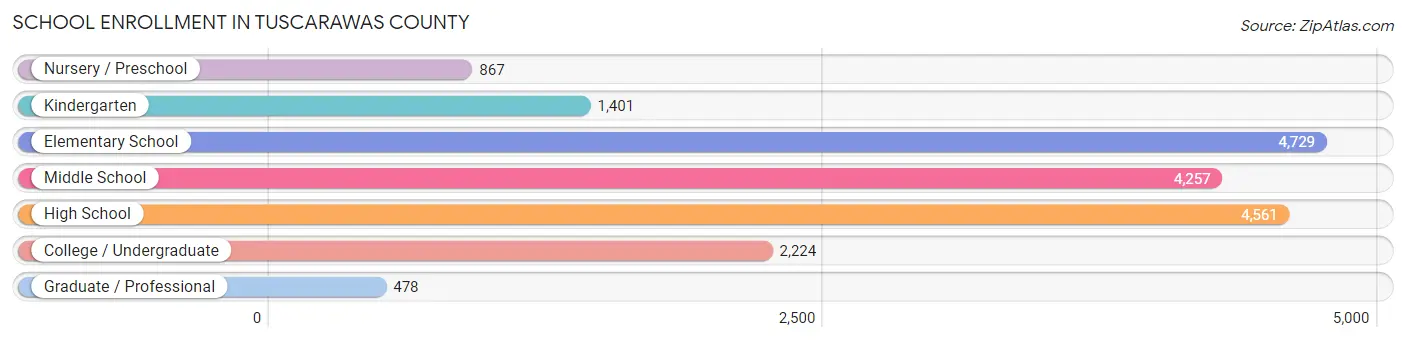
School Enrollment in Tuscarawas County
The most common levels of schooling among the 18,517 students in Tuscarawas County are elementary school (4,729 | 25.5%), high school (4,561 | 24.6%), and middle school (4,257 | 23.0%).
| School Level | # Students | % Students |
| Nursery / Preschool | 867 | 4.7% |
| Kindergarten | 1,401 | 7.6% |
| Elementary School | 4,729 | 25.5% |
| Middle School | 4,257 | 23.0% |
| High School | 4,561 | 24.6% |
| College / Undergraduate | 2,224 | 12.0% |
| Graduate / Professional | 478 | 2.6% |
| Total | 18,517 | 100.0% |
School Enrollment by Age by Funding Source in Tuscarawas County
Out of a total of 18,517 students who are enrolled in schools in Tuscarawas County, 3,037 (16.4%) attend a private institution, while the remaining 15,480 (83.6%) are enrolled in public schools. The age group of 25 to 34 year olds has the highest likelihood of being enrolled in private schools, with 269 (43.6% in the age bracket) enrolled. Conversely, the age group of 15 to 17 year olds has the lowest likelihood of being enrolled in a private school, with 3,241 (94.4% in the age bracket) attending a public institution.
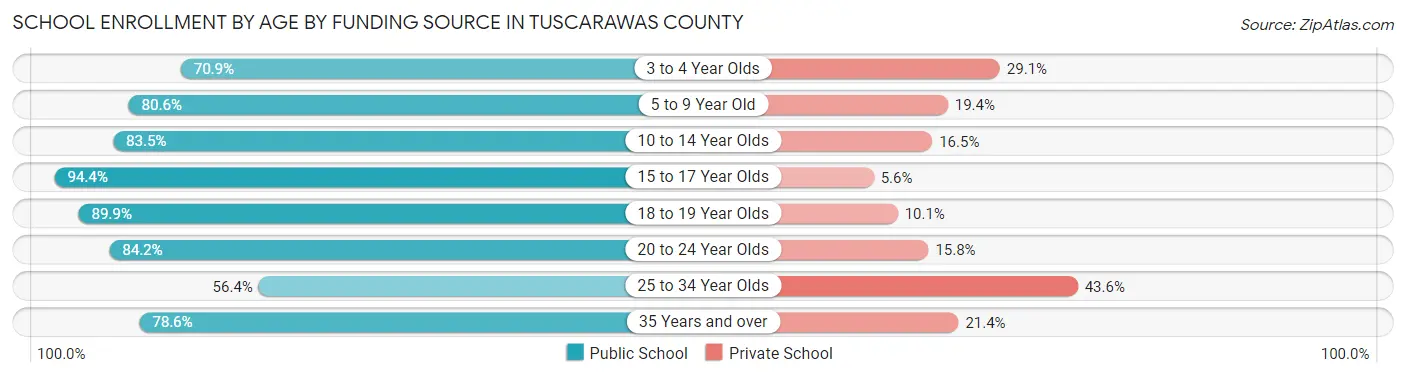
| Age Bracket | Public School | Private School |
| 3 to 4 Year Olds | 402 (70.9%) | 165 (29.1%) |
| 5 to 9 Year Old | 4,437 (80.6%) | 1,067 (19.4%) |
| 10 to 14 Year Olds | 4,647 (83.5%) | 918 (16.5%) |
| 15 to 17 Year Olds | 3,241 (94.4%) | 192 (5.6%) |
| 18 to 19 Year Olds | 966 (89.9%) | 108 (10.1%) |
| 20 to 24 Year Olds | 944 (84.2%) | 177 (15.8%) |
| 25 to 34 Year Olds | 348 (56.4%) | 269 (43.6%) |
| 35 Years and over | 500 (78.6%) | 136 (21.4%) |
| Total | 15,480 (83.6%) | 3,037 (16.4%) |
Educational Attainment by Field of Study in Tuscarawas County
Education (2,829 | 21.2%), business (2,817 | 21.1%), science & technology (2,225 | 16.7%), liberal arts & history (711 | 5.3%), and bio, nature & agricultural (682 | 5.1%) are the most common fields of study among 13,348 individuals in Tuscarawas County who have obtained a bachelor's degree or higher.
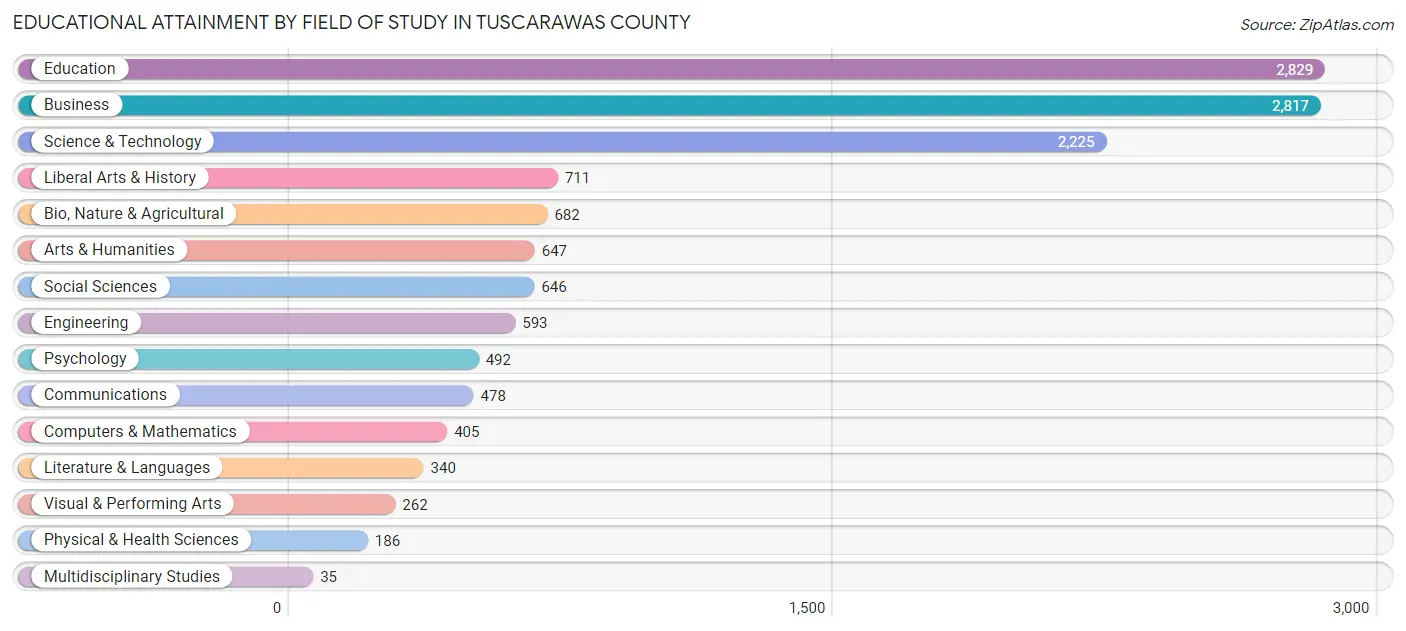
| Field of Study | # Graduates | % Graduates |
| Computers & Mathematics | 405 | 3.0% |
| Bio, Nature & Agricultural | 682 | 5.1% |
| Physical & Health Sciences | 186 | 1.4% |
| Psychology | 492 | 3.7% |
| Social Sciences | 646 | 4.8% |
| Engineering | 593 | 4.4% |
| Multidisciplinary Studies | 35 | 0.3% |
| Science & Technology | 2,225 | 16.7% |
| Business | 2,817 | 21.1% |
| Education | 2,829 | 21.2% |
| Literature & Languages | 340 | 2.5% |
| Liberal Arts & History | 711 | 5.3% |
| Visual & Performing Arts | 262 | 2.0% |
| Communications | 478 | 3.6% |
| Arts & Humanities | 647 | 4.9% |
| Total | 13,348 | 100.0% |
Transportation & Commute in Tuscarawas County
Vehicle Availability by Sex in Tuscarawas County
The most prevalent vehicle ownership categories in Tuscarawas County are males with 2 vehicles (9,303, accounting for 39.4%) and females with 2 vehicles (7,724, making up 50.0%).
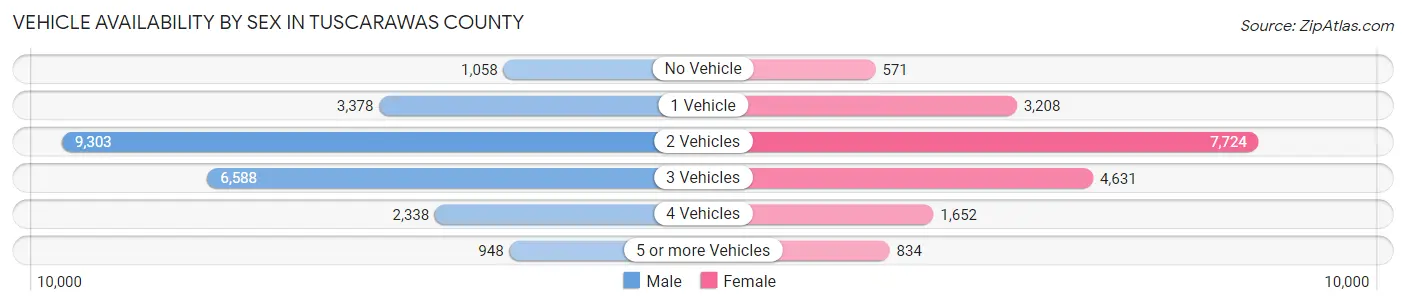
| Vehicles Available | Male | Female |
| No Vehicle | 1,058 (4.5%) | 571 (3.1%) |
| 1 Vehicle | 3,378 (14.3%) | 3,208 (17.2%) |
| 2 Vehicles | 9,303 (39.4%) | 7,724 (41.5%) |
| 3 Vehicles | 6,588 (27.9%) | 4,631 (24.9%) |
| 4 Vehicles | 2,338 (9.9%) | 1,652 (8.9%) |
| 5 or more Vehicles | 948 (4.0%) | 834 (4.5%) |
| Total | 23,613 (100.0%) | 18,620 (100.0%) |
Commute Time in Tuscarawas County
The most frequently occuring commute durations in Tuscarawas County are 15 to 19 minutes (6,312 commuters, 15.9%), 10 to 14 minutes (6,032 commuters, 15.2%), and 5 to 9 minutes (5,698 commuters, 14.3%).
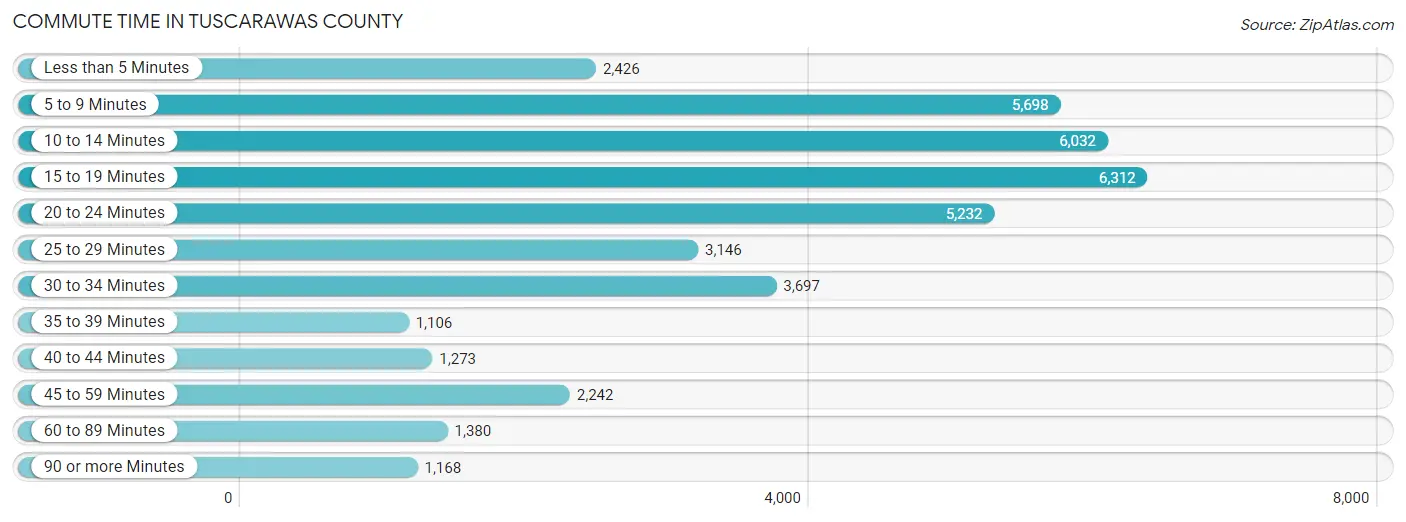
| Commute Time | # Commuters | % Commuters |
| Less than 5 Minutes | 2,426 | 6.1% |
| 5 to 9 Minutes | 5,698 | 14.3% |
| 10 to 14 Minutes | 6,032 | 15.2% |
| 15 to 19 Minutes | 6,312 | 15.9% |
| 20 to 24 Minutes | 5,232 | 13.2% |
| 25 to 29 Minutes | 3,146 | 7.9% |
| 30 to 34 Minutes | 3,697 | 9.3% |
| 35 to 39 Minutes | 1,106 | 2.8% |
| 40 to 44 Minutes | 1,273 | 3.2% |
| 45 to 59 Minutes | 2,242 | 5.7% |
| 60 to 89 Minutes | 1,380 | 3.5% |
| 90 or more Minutes | 1,168 | 2.9% |
Commute Time by Sex in Tuscarawas County
The most common commute times in Tuscarawas County are 10 to 14 minutes (3,417 commuters, 15.2%) for males and 15 to 19 minutes (3,296 commuters, 19.2%) for females.
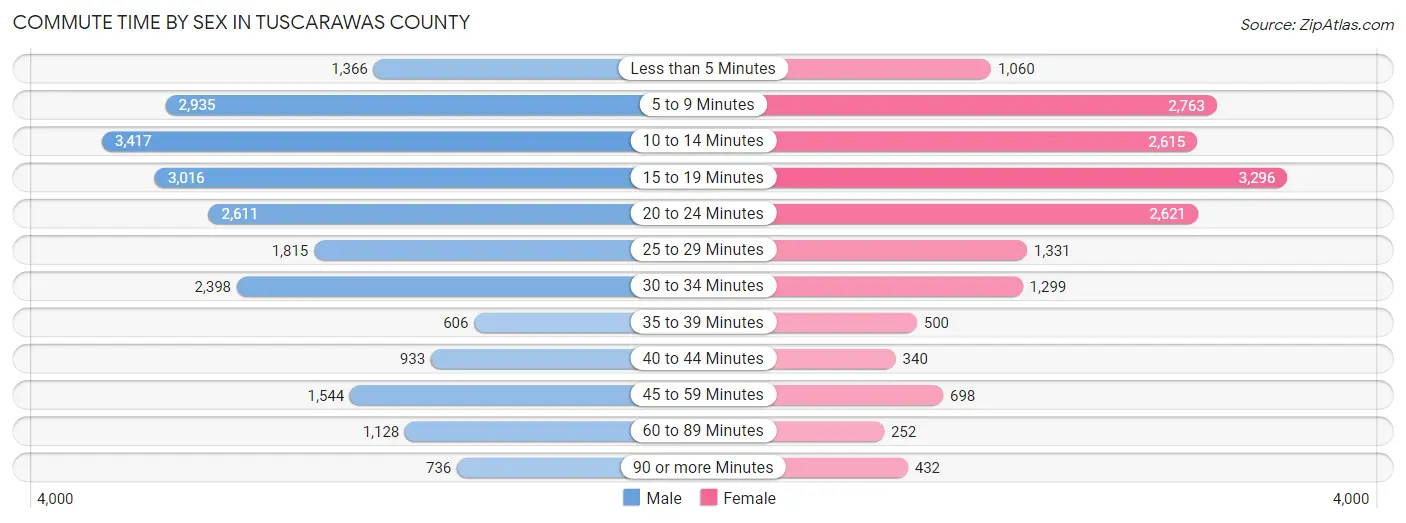
| Commute Time | Male | Female |
| Less than 5 Minutes | 1,366 (6.1%) | 1,060 (6.2%) |
| 5 to 9 Minutes | 2,935 (13.0%) | 2,763 (16.1%) |
| 10 to 14 Minutes | 3,417 (15.2%) | 2,615 (15.2%) |
| 15 to 19 Minutes | 3,016 (13.4%) | 3,296 (19.2%) |
| 20 to 24 Minutes | 2,611 (11.6%) | 2,621 (15.2%) |
| 25 to 29 Minutes | 1,815 (8.1%) | 1,331 (7.7%) |
| 30 to 34 Minutes | 2,398 (10.7%) | 1,299 (7.5%) |
| 35 to 39 Minutes | 606 (2.7%) | 500 (2.9%) |
| 40 to 44 Minutes | 933 (4.2%) | 340 (2.0%) |
| 45 to 59 Minutes | 1,544 (6.9%) | 698 (4.1%) |
| 60 to 89 Minutes | 1,128 (5.0%) | 252 (1.5%) |
| 90 or more Minutes | 736 (3.3%) | 432 (2.5%) |
Time of Departure to Work by Sex in Tuscarawas County
The most frequent times of departure to work in Tuscarawas County are 7:00 AM to 7:29 AM (2,455, 10.9%) for males and 7:30 AM to 7:59 AM (2,200, 12.8%) for females.
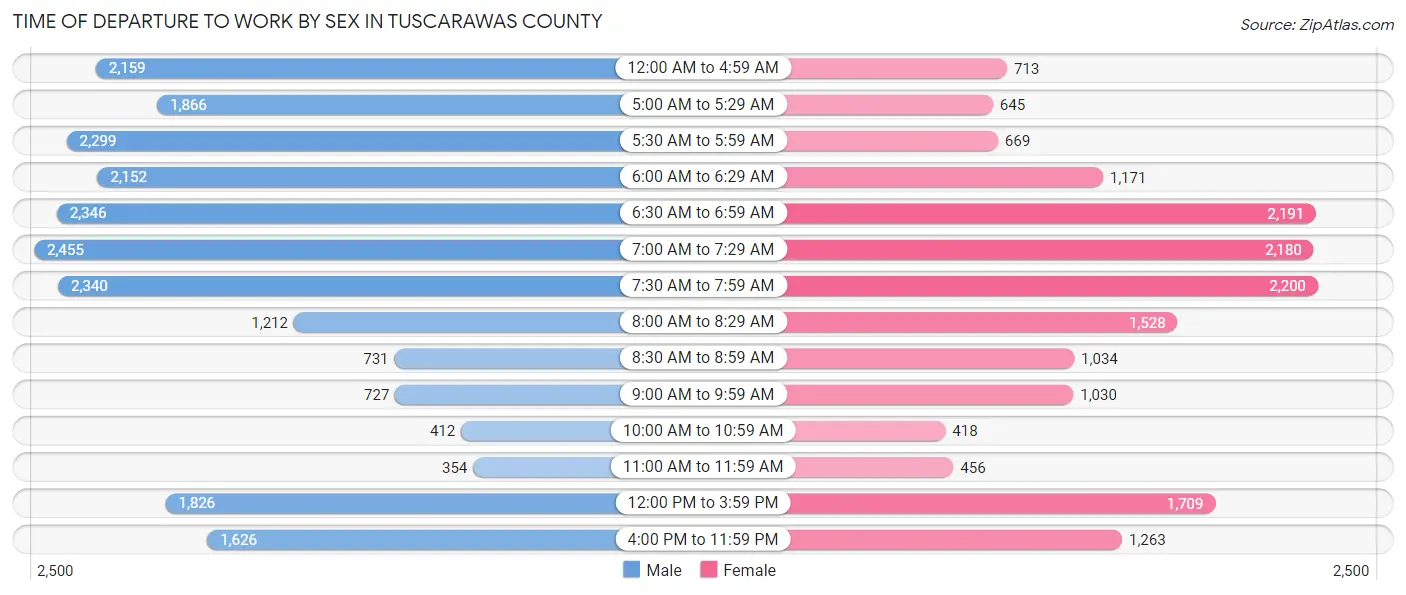
| Time of Departure | Male | Female |
| 12:00 AM to 4:59 AM | 2,159 (9.6%) | 713 (4.1%) |
| 5:00 AM to 5:29 AM | 1,866 (8.3%) | 645 (3.7%) |
| 5:30 AM to 5:59 AM | 2,299 (10.2%) | 669 (3.9%) |
| 6:00 AM to 6:29 AM | 2,152 (9.6%) | 1,171 (6.8%) |
| 6:30 AM to 6:59 AM | 2,346 (10.4%) | 2,191 (12.7%) |
| 7:00 AM to 7:29 AM | 2,455 (10.9%) | 2,180 (12.7%) |
| 7:30 AM to 7:59 AM | 2,340 (10.4%) | 2,200 (12.8%) |
| 8:00 AM to 8:29 AM | 1,212 (5.4%) | 1,528 (8.9%) |
| 8:30 AM to 8:59 AM | 731 (3.3%) | 1,034 (6.0%) |
| 9:00 AM to 9:59 AM | 727 (3.2%) | 1,030 (6.0%) |
| 10:00 AM to 10:59 AM | 412 (1.8%) | 418 (2.4%) |
| 11:00 AM to 11:59 AM | 354 (1.6%) | 456 (2.6%) |
| 12:00 PM to 3:59 PM | 1,826 (8.1%) | 1,709 (9.9%) |
| 4:00 PM to 11:59 PM | 1,626 (7.2%) | 1,263 (7.3%) |
| Total | 22,505 (100.0%) | 17,207 (100.0%) |
Housing Occupancy in Tuscarawas County
Occupancy by Ownership in Tuscarawas County
Of the total 37,774 dwellings in Tuscarawas County, owner-occupied units account for 26,273 (69.6%), while renter-occupied units make up 11,501 (30.4%).
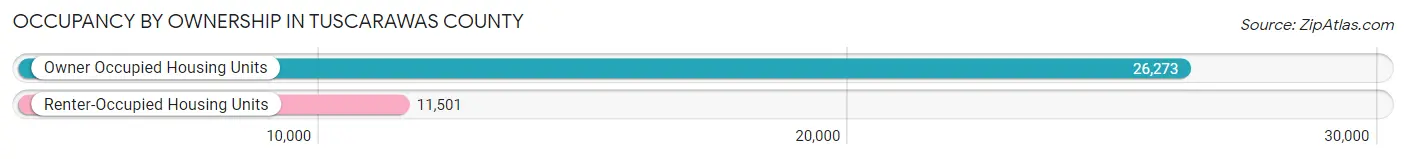
| Occupancy | # Housing Units | % Housing Units |
| Owner Occupied Housing Units | 26,273 | 69.6% |
| Renter-Occupied Housing Units | 11,501 | 30.4% |
| Total Occupied Housing Units | 37,774 | 100.0% |
Occupancy by Household Size in Tuscarawas County
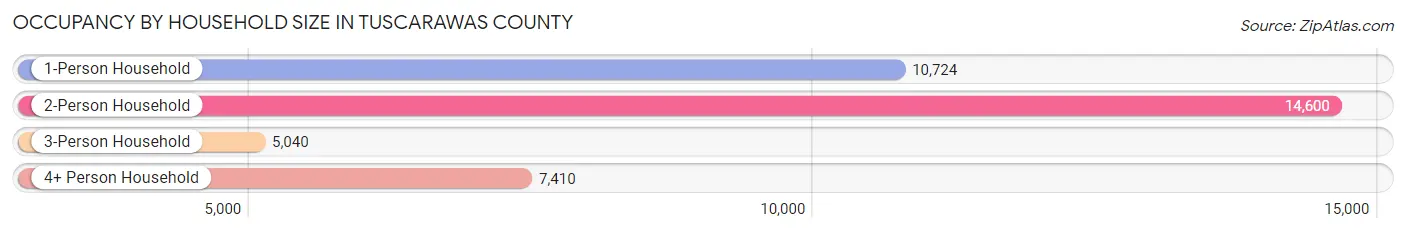
| Household Size | # Housing Units | % Housing Units |
| 1-Person Household | 10,724 | 28.4% |
| 2-Person Household | 14,600 | 38.7% |
| 3-Person Household | 5,040 | 13.3% |
| 4+ Person Household | 7,410 | 19.6% |
| Total Housing Units | 37,774 | 100.0% |
Occupancy by Ownership by Household Size in Tuscarawas County
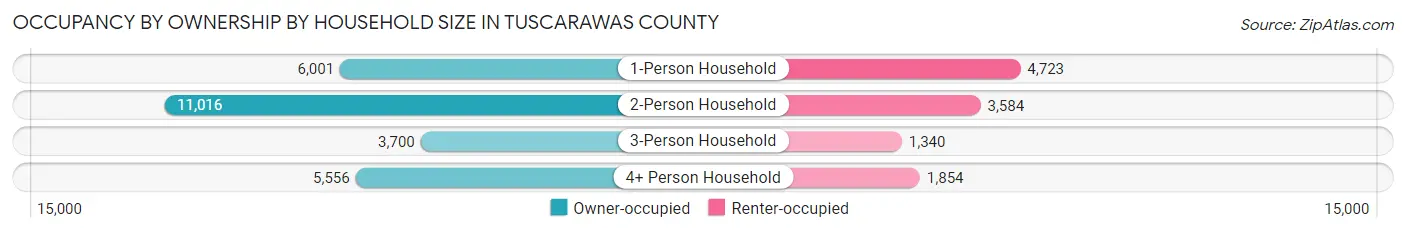
| Household Size | Owner-occupied | Renter-occupied |
| 1-Person Household | 6,001 (56.0%) | 4,723 (44.0%) |
| 2-Person Household | 11,016 (75.4%) | 3,584 (24.5%) |
| 3-Person Household | 3,700 (73.4%) | 1,340 (26.6%) |
| 4+ Person Household | 5,556 (75.0%) | 1,854 (25.0%) |
| Total Housing Units | 26,273 (69.6%) | 11,501 (30.4%) |
Occupancy by Educational Attainment in Tuscarawas County
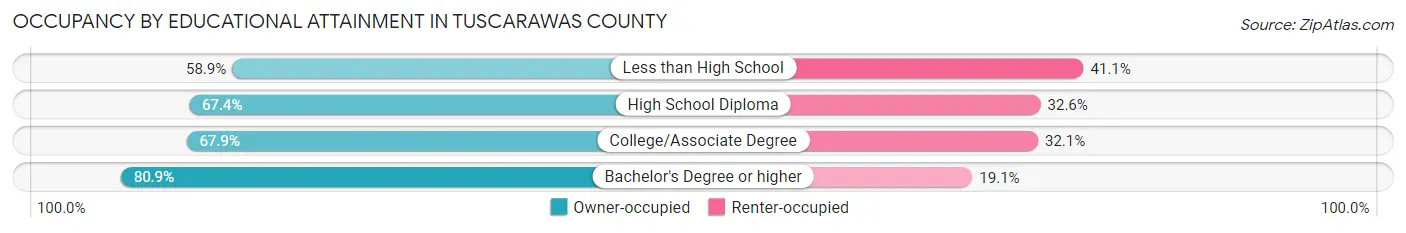
| Household Size | Owner-occupied | Renter-occupied |
| Less than High School | 2,420 (58.9%) | 1,691 (41.1%) |
| High School Diploma | 10,780 (67.4%) | 5,214 (32.6%) |
| College/Associate Degree | 6,388 (67.9%) | 3,020 (32.1%) |
| Bachelor's Degree or higher | 6,685 (80.9%) | 1,576 (19.1%) |
Occupancy by Age of Householder in Tuscarawas County

| Age Bracket | # Households | % Households |
| Under 35 Years | 6,717 | 17.8% |
| 35 to 44 Years | 5,593 | 14.8% |
| 45 to 54 Years | 6,046 | 16.0% |
| 55 to 64 Years | 7,677 | 20.3% |
| 65 to 74 Years | 6,602 | 17.5% |
| 75 to 84 Years | 3,650 | 9.7% |
| 85 Years and Over | 1,489 | 3.9% |
| Total | 37,774 | 100.0% |
Housing Finances in Tuscarawas County
Median Income by Occupancy in Tuscarawas County
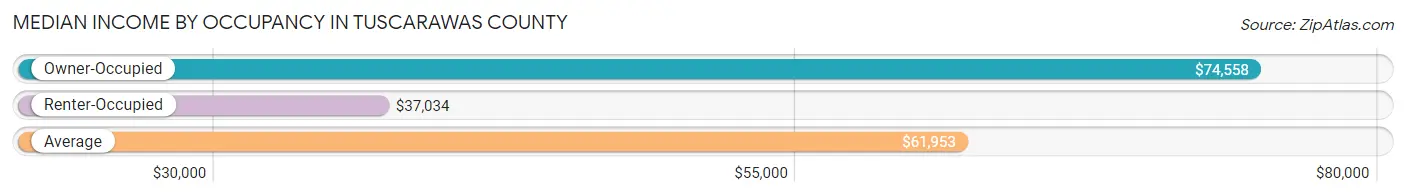
| Occupancy Type | # Households | Median Income |
| Owner-Occupied | 26,273 (69.6%) | $74,558 |
| Renter-Occupied | 11,501 (30.4%) | $37,034 |
| Average | 37,774 (100.0%) | $61,953 |
Occupancy by Householder Income Bracket in Tuscarawas County
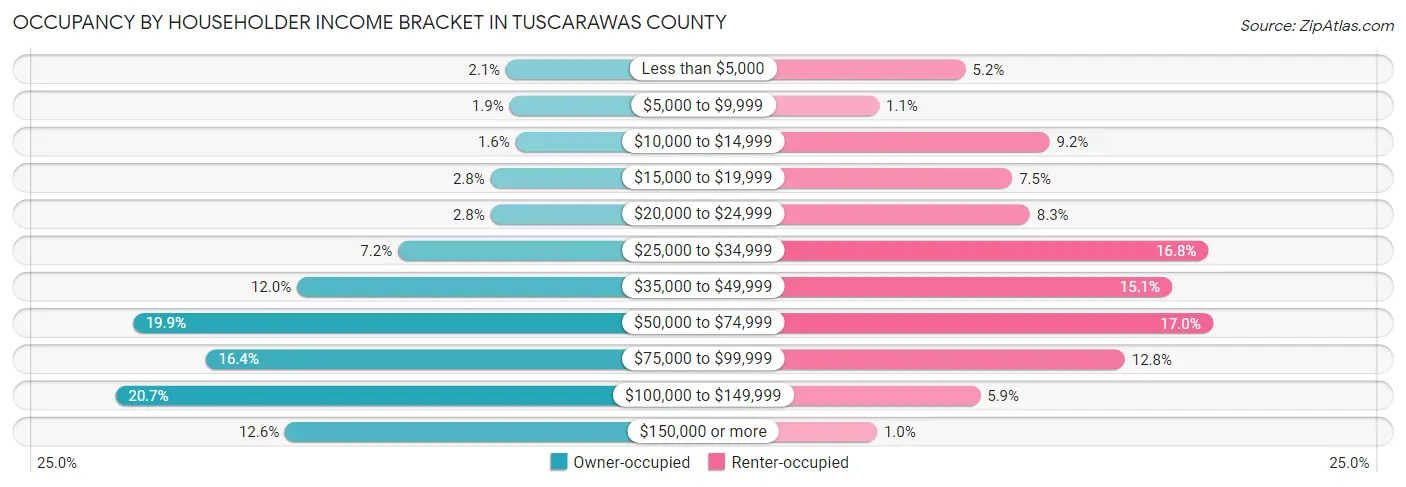
| Income Bracket | Owner-occupied | Renter-occupied |
| Less than $5,000 | 547 (2.1%) | 603 (5.2%) |
| $5,000 to $9,999 | 503 (1.9%) | 129 (1.1%) |
| $10,000 to $14,999 | 425 (1.6%) | 1,063 (9.2%) |
| $15,000 to $19,999 | 739 (2.8%) | 858 (7.5%) |
| $20,000 to $24,999 | 739 (2.8%) | 955 (8.3%) |
| $25,000 to $34,999 | 1,897 (7.2%) | 1,931 (16.8%) |
| $35,000 to $49,999 | 3,161 (12.0%) | 1,732 (15.1%) |
| $50,000 to $74,999 | 5,215 (19.9%) | 1,955 (17.0%) |
| $75,000 to $99,999 | 4,303 (16.4%) | 1,475 (12.8%) |
| $100,000 to $149,999 | 5,434 (20.7%) | 683 (5.9%) |
| $150,000 or more | 3,310 (12.6%) | 117 (1.0%) |
| Total | 26,273 (100.0%) | 11,501 (100.0%) |
Monthly Housing Cost Tiers in Tuscarawas County
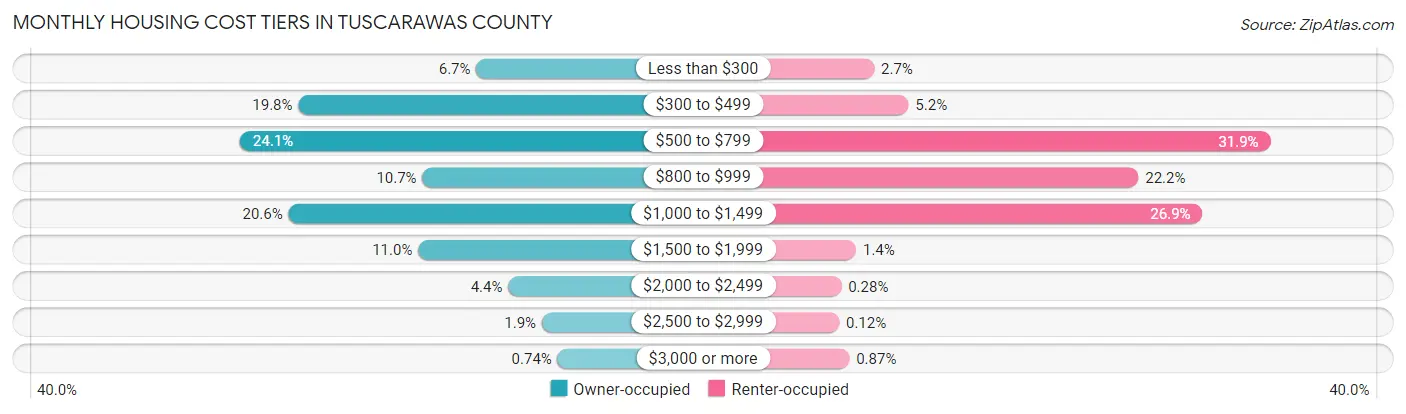
| Monthly Cost | Owner-occupied | Renter-occupied |
| Less than $300 | 1,767 (6.7%) | 310 (2.7%) |
| $300 to $499 | 5,212 (19.8%) | 601 (5.2%) |
| $500 to $799 | 6,343 (24.1%) | 3,668 (31.9%) |
| $800 to $999 | 2,811 (10.7%) | 2,549 (22.2%) |
| $1,000 to $1,499 | 5,403 (20.6%) | 3,091 (26.9%) |
| $1,500 to $1,999 | 2,893 (11.0%) | 157 (1.4%) |
| $2,000 to $2,499 | 1,151 (4.4%) | 32 (0.3%) |
| $2,500 to $2,999 | 498 (1.9%) | 14 (0.1%) |
| $3,000 or more | 195 (0.7%) | 100 (0.9%) |
| Total | 26,273 (100.0%) | 11,501 (100.0%) |
Physical Housing Characteristics in Tuscarawas County
Housing Structures in Tuscarawas County
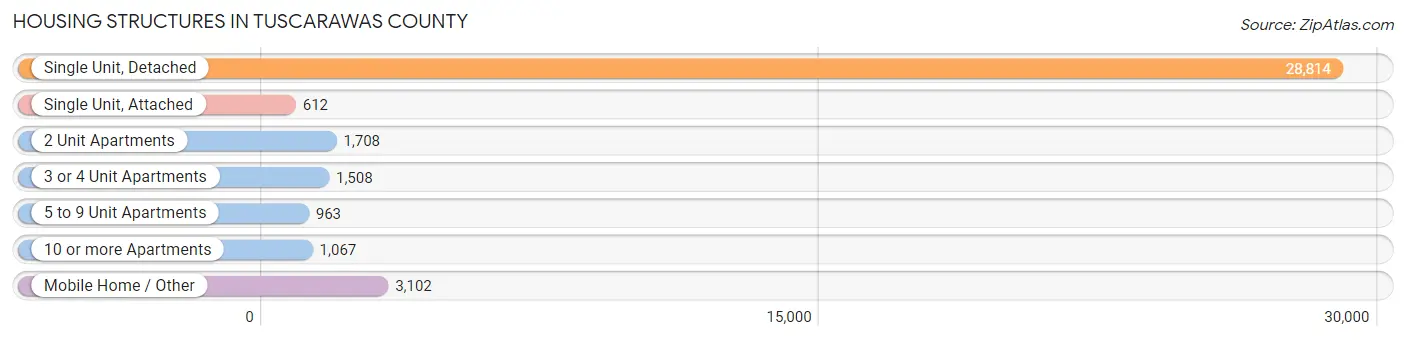
| Structure Type | # Housing Units | % Housing Units |
| Single Unit, Detached | 28,814 | 76.3% |
| Single Unit, Attached | 612 | 1.6% |
| 2 Unit Apartments | 1,708 | 4.5% |
| 3 or 4 Unit Apartments | 1,508 | 4.0% |
| 5 to 9 Unit Apartments | 963 | 2.5% |
| 10 or more Apartments | 1,067 | 2.8% |
| Mobile Home / Other | 3,102 | 8.2% |
| Total | 37,774 | 100.0% |
Housing Structures by Occupancy in Tuscarawas County
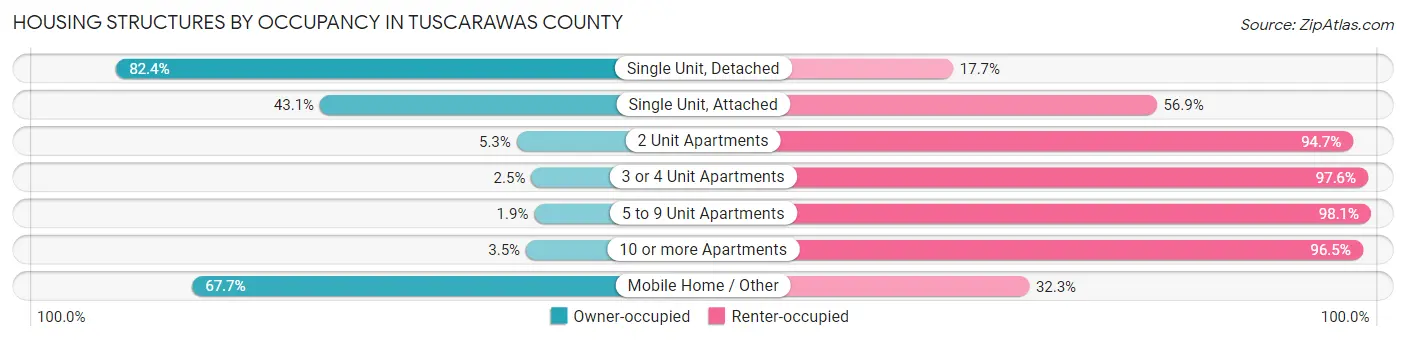
| Structure Type | Owner-occupied | Renter-occupied |
| Single Unit, Detached | 23,727 (82.4%) | 5,087 (17.6%) |
| Single Unit, Attached | 264 (43.1%) | 348 (56.9%) |
| 2 Unit Apartments | 90 (5.3%) | 1,618 (94.7%) |
| 3 or 4 Unit Apartments | 37 (2.5%) | 1,471 (97.6%) |
| 5 to 9 Unit Apartments | 18 (1.9%) | 945 (98.1%) |
| 10 or more Apartments | 37 (3.5%) | 1,030 (96.5%) |
| Mobile Home / Other | 2,100 (67.7%) | 1,002 (32.3%) |
| Total | 26,273 (69.6%) | 11,501 (30.4%) |
Housing Structures by Number of Rooms in Tuscarawas County
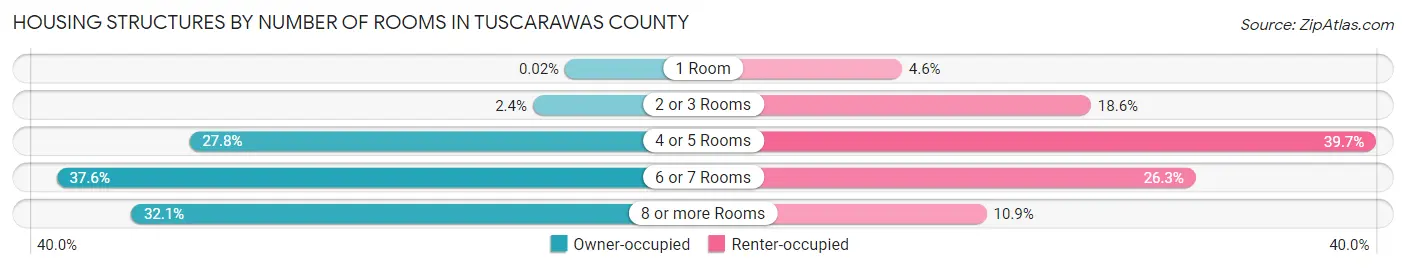
| Number of Rooms | Owner-occupied | Renter-occupied |
| 1 Room | 4 (0.0%) | 527 (4.6%) |
| 2 or 3 Rooms | 630 (2.4%) | 2,136 (18.6%) |
| 4 or 5 Rooms | 7,310 (27.8%) | 4,563 (39.7%) |
| 6 or 7 Rooms | 9,888 (37.6%) | 3,027 (26.3%) |
| 8 or more Rooms | 8,441 (32.1%) | 1,248 (10.8%) |
| Total | 26,273 (100.0%) | 11,501 (100.0%) |
Housing Structure by Heating Type in Tuscarawas County
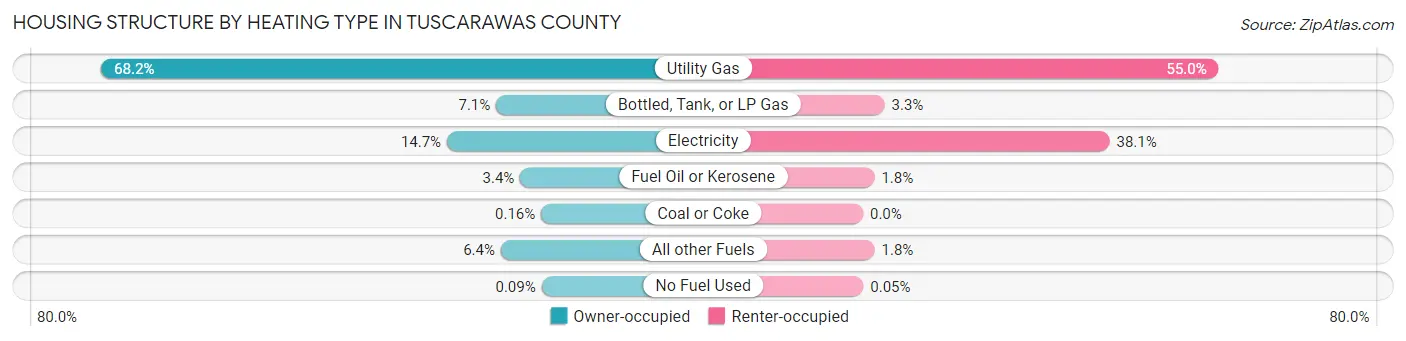
| Heating Type | Owner-occupied | Renter-occupied |
| Utility Gas | 17,908 (68.2%) | 6,320 (54.9%) |
| Bottled, Tank, or LP Gas | 1,868 (7.1%) | 383 (3.3%) |
| Electricity | 3,864 (14.7%) | 4,383 (38.1%) |
| Fuel Oil or Kerosene | 890 (3.4%) | 203 (1.8%) |
| Coal or Coke | 41 (0.2%) | 0 (0.0%) |
| All other Fuels | 1,679 (6.4%) | 206 (1.8%) |
| No Fuel Used | 23 (0.1%) | 6 (0.1%) |
| Total | 26,273 (100.0%) | 11,501 (100.0%) |
Household Vehicle Usage in Tuscarawas County
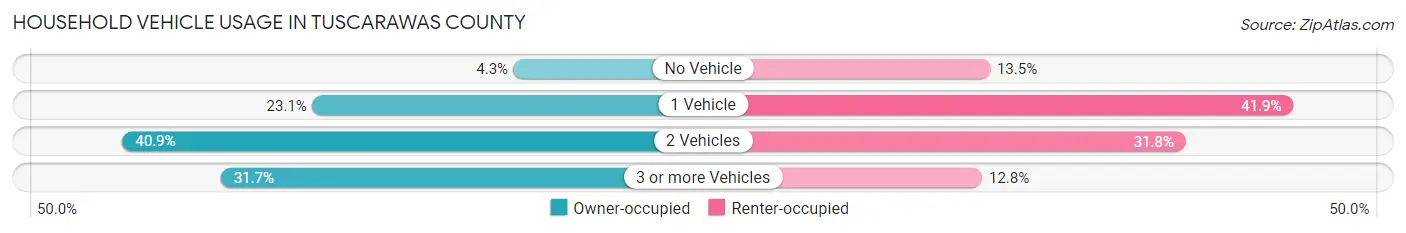
| Vehicles per Household | Owner-occupied | Renter-occupied |
| No Vehicle | 1,136 (4.3%) | 1,557 (13.5%) |
| 1 Vehicle | 6,072 (23.1%) | 4,814 (41.9%) |
| 2 Vehicles | 10,738 (40.9%) | 3,658 (31.8%) |
| 3 or more Vehicles | 8,327 (31.7%) | 1,472 (12.8%) |
| Total | 26,273 (100.0%) | 11,501 (100.0%) |
Real Estate & Mortgages in Tuscarawas County
Real Estate and Mortgage Overview in Tuscarawas County
| Characteristic | Without Mortgage | With Mortgage |
| Housing Units | 12,169 | 14,104 |
| Median Property Value | $151,500 | $172,200 |
| Median Household Income | $56,092 | $2,459 |
| Monthly Housing Costs | $471 | $186 |
| Real Estate Taxes | $1,659 | $238 |
Property Value by Mortgage Status in Tuscarawas County
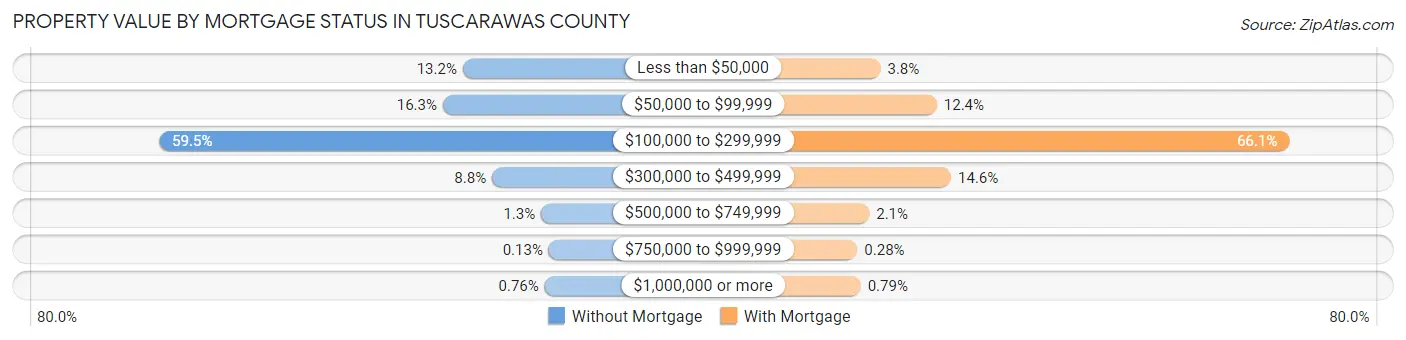
| Property Value | Without Mortgage | With Mortgage |
| Less than $50,000 | 1,611 (13.2%) | 538 (3.8%) |
| $50,000 to $99,999 | 1,980 (16.3%) | 1,747 (12.4%) |
| $100,000 to $299,999 | 7,242 (59.5%) | 9,320 (66.1%) |
| $300,000 to $499,999 | 1,069 (8.8%) | 2,053 (14.6%) |
| $500,000 to $749,999 | 158 (1.3%) | 295 (2.1%) |
| $750,000 to $999,999 | 16 (0.1%) | 40 (0.3%) |
| $1,000,000 or more | 93 (0.8%) | 111 (0.8%) |
| Total | 12,169 (100.0%) | 14,104 (100.0%) |
Household Income by Mortgage Status in Tuscarawas County
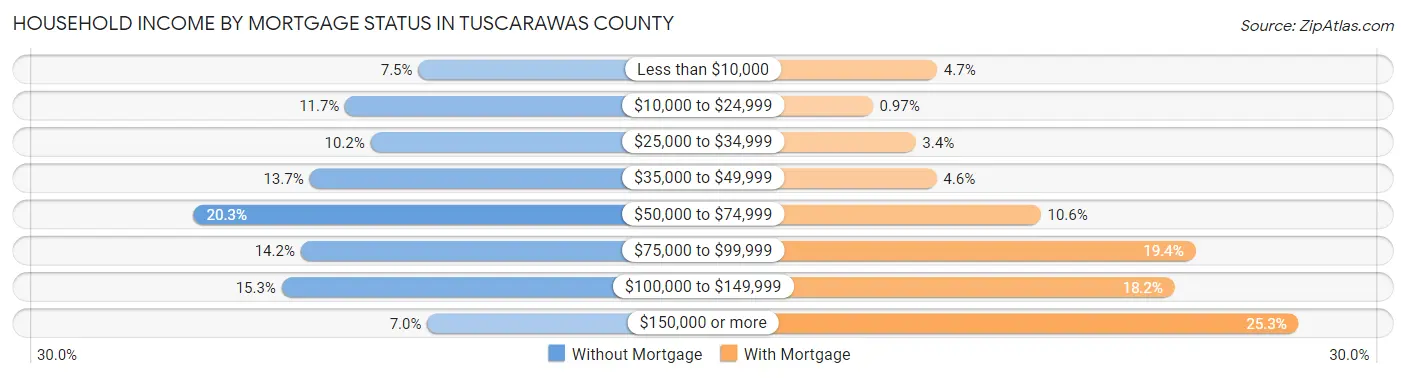
| Household Income | Without Mortgage | With Mortgage |
| Less than $10,000 | 913 (7.5%) | 656 (4.6%) |
| $10,000 to $24,999 | 1,421 (11.7%) | 137 (1.0%) |
| $25,000 to $34,999 | 1,245 (10.2%) | 482 (3.4%) |
| $35,000 to $49,999 | 1,670 (13.7%) | 652 (4.6%) |
| $50,000 to $74,999 | 2,475 (20.3%) | 1,491 (10.6%) |
| $75,000 to $99,999 | 1,731 (14.2%) | 2,740 (19.4%) |
| $100,000 to $149,999 | 1,863 (15.3%) | 2,572 (18.2%) |
| $150,000 or more | 851 (7.0%) | 3,571 (25.3%) |
| Total | 12,169 (100.0%) | 14,104 (100.0%) |
Property Value to Household Income Ratio in Tuscarawas County
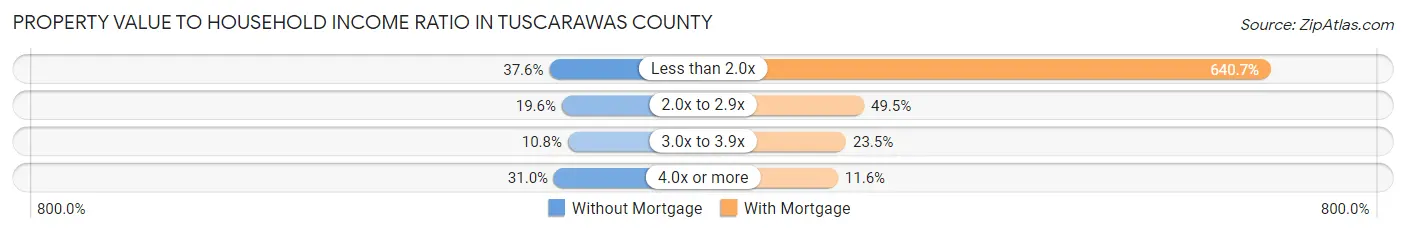
| Value-to-Income Ratio | Without Mortgage | With Mortgage |
| Less than 2.0x | 4,580 (37.6%) | 90,360 (640.7%) |
| 2.0x to 2.9x | 2,383 (19.6%) | 6,987 (49.5%) |
| 3.0x to 3.9x | 1,317 (10.8%) | 3,311 (23.5%) |
| 4.0x or more | 3,766 (30.9%) | 1,638 (11.6%) |
| Total | 12,169 (100.0%) | 14,104 (100.0%) |
Real Estate Taxes by Mortgage Status in Tuscarawas County

| Property Taxes | Without Mortgage | With Mortgage |
| Less than $800 | 2,294 (18.9%) | 29 (0.2%) |
| $800 to $1,499 | 2,995 (24.6%) | 1,186 (8.4%) |
| $800 to $1,499 | 6,585 (54.1%) | 3,639 (25.8%) |
| Total | 12,169 (100.0%) | 14,104 (100.0%) |
Health & Disability in Tuscarawas County
Health Insurance Coverage by Age in Tuscarawas County
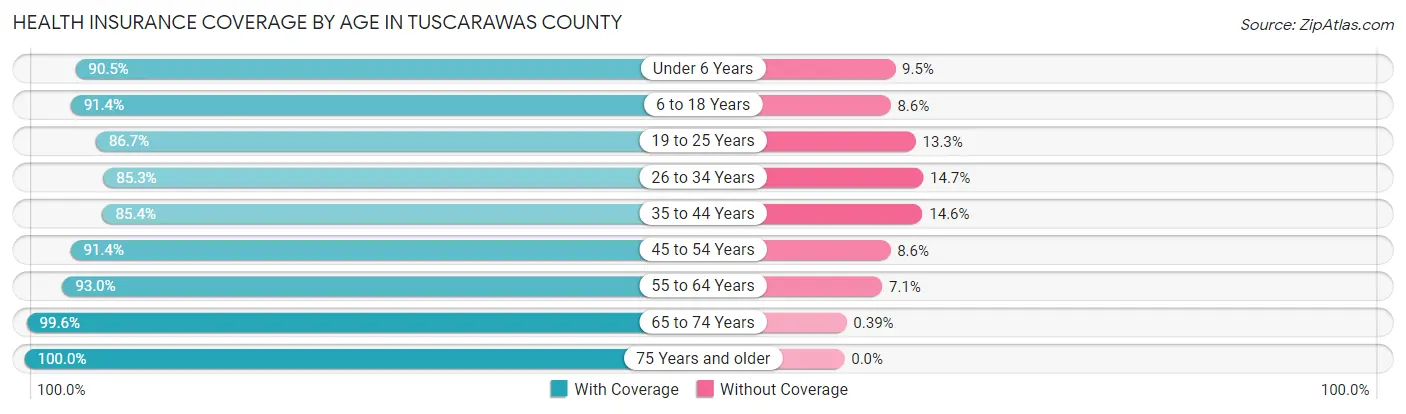
| Age Bracket | With Coverage | Without Coverage |
| Under 6 Years | 6,350 (90.5%) | 665 (9.5%) |
| 6 to 18 Years | 13,973 (91.4%) | 1,316 (8.6%) |
| 19 to 25 Years | 6,615 (86.7%) | 1,015 (13.3%) |
| 26 to 34 Years | 8,107 (85.3%) | 1,397 (14.7%) |
| 35 to 44 Years | 9,284 (85.4%) | 1,582 (14.6%) |
| 45 to 54 Years | 10,068 (91.4%) | 943 (8.6%) |
| 55 to 64 Years | 12,020 (92.9%) | 912 (7.0%) |
| 65 to 74 Years | 10,396 (99.6%) | 41 (0.4%) |
| 75 Years and older | 7,239 (100.0%) | 0 (0.0%) |
| Total | 84,052 (91.4%) | 7,871 (8.6%) |
Health Insurance Coverage by Citizenship Status in Tuscarawas County
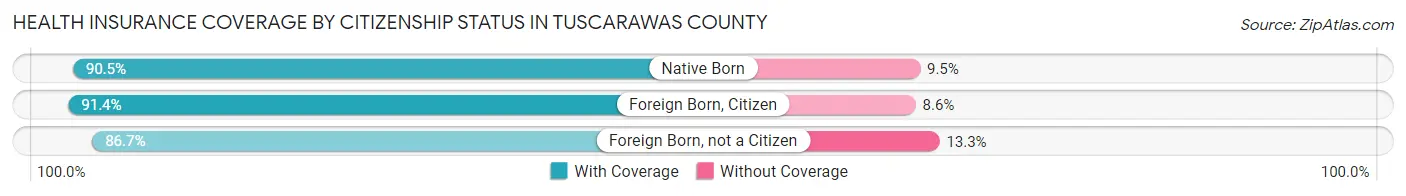
| Citizenship Status | With Coverage | Without Coverage |
| Native Born | 6,350 (90.5%) | 665 (9.5%) |
| Foreign Born, Citizen | 13,973 (91.4%) | 1,316 (8.6%) |
| Foreign Born, not a Citizen | 6,615 (86.7%) | 1,015 (13.3%) |
Health Insurance Coverage by Household Income in Tuscarawas County
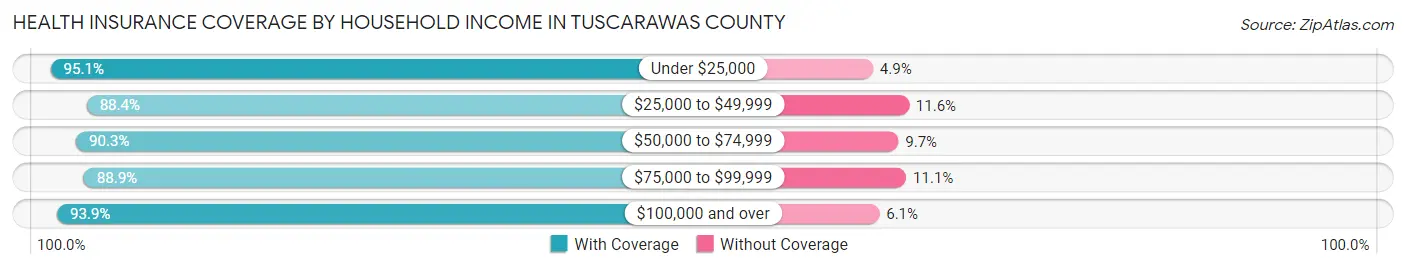
| Household Income | With Coverage | Without Coverage |
| Under $25,000 | 10,006 (95.1%) | 515 (4.9%) |
| $25,000 to $49,999 | 16,007 (88.4%) | 2,108 (11.6%) |
| $50,000 to $74,999 | 15,192 (90.3%) | 1,624 (9.7%) |
| $75,000 to $99,999 | 14,214 (88.9%) | 1,779 (11.1%) |
| $100,000 and over | 28,472 (93.9%) | 1,845 (6.1%) |
Public vs Private Health Insurance Coverage by Age in Tuscarawas County
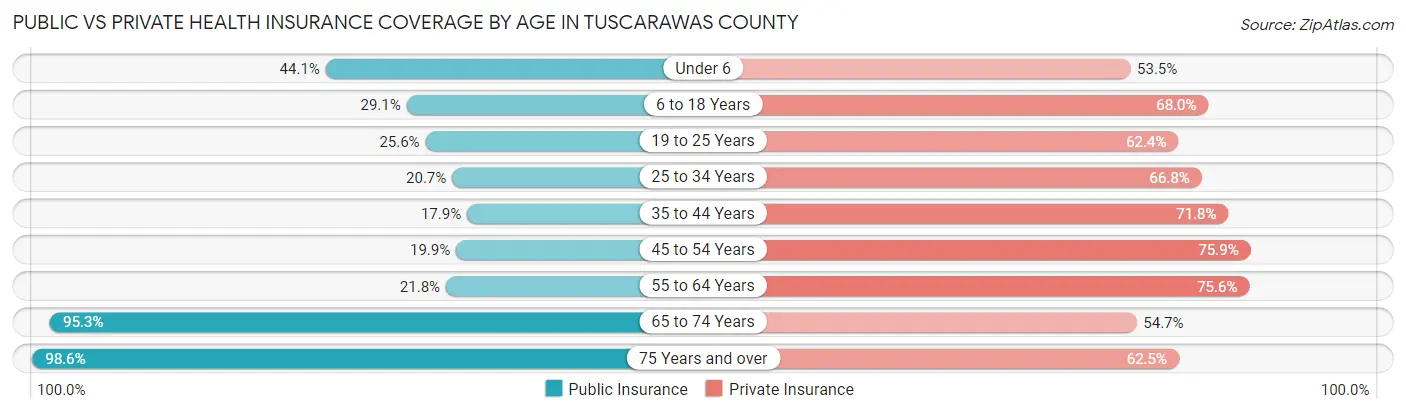
| Age Bracket | Public Insurance | Private Insurance |
| Under 6 | 3,095 (44.1%) | 3,754 (53.5%) |
| 6 to 18 Years | 4,449 (29.1%) | 10,399 (68.0%) |
| 19 to 25 Years | 1,953 (25.6%) | 4,764 (62.4%) |
| 25 to 34 Years | 1,963 (20.6%) | 6,348 (66.8%) |
| 35 to 44 Years | 1,944 (17.9%) | 7,796 (71.8%) |
| 45 to 54 Years | 2,193 (19.9%) | 8,352 (75.8%) |
| 55 to 64 Years | 2,819 (21.8%) | 9,779 (75.6%) |
| 65 to 74 Years | 9,943 (95.3%) | 5,706 (54.7%) |
| 75 Years and over | 7,135 (98.6%) | 4,527 (62.5%) |
| Total | 35,494 (38.6%) | 61,425 (66.8%) |
Disability Status by Sex by Age in Tuscarawas County

| Age Bracket | Male | Female |
| Under 5 Years | 6 (0.2%) | 0 (0.0%) |
| 5 to 17 Years | 546 (6.8%) | 274 (3.7%) |
| 18 to 34 Years | 794 (8.3%) | 834 (9.6%) |
| 35 to 64 Years | 2,730 (15.5%) | 2,960 (17.2%) |
| 65 to 74 Years | 1,255 (24.8%) | 1,161 (21.6%) |
| 75 Years and over | 1,342 (45.6%) | 1,971 (45.9%) |
Disability Class by Sex by Age in Tuscarawas County
Disability Class: Hearing Difficulty
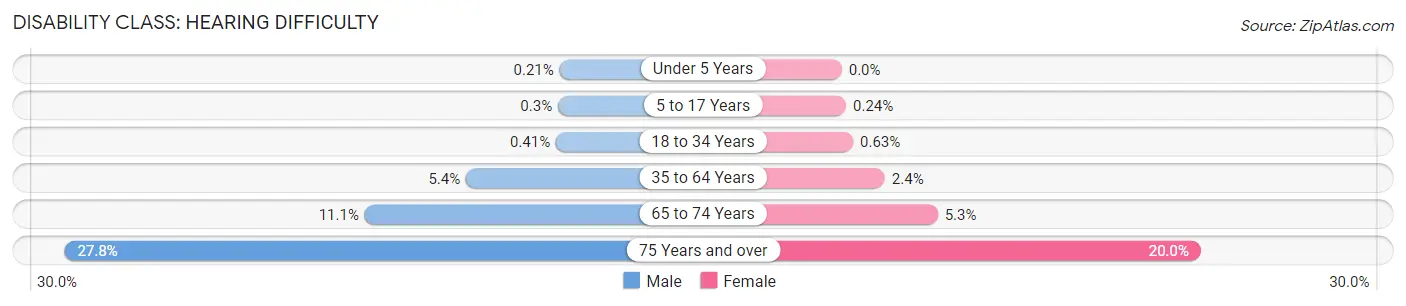
| Age Bracket | Male | Female |
| Under 5 Years | 6 (0.2%) | 0 (0.0%) |
| 5 to 17 Years | 24 (0.3%) | 18 (0.2%) |
| 18 to 34 Years | 39 (0.4%) | 55 (0.6%) |
| 35 to 64 Years | 952 (5.4%) | 413 (2.4%) |
| 65 to 74 Years | 560 (11.1%) | 287 (5.3%) |
| 75 Years and over | 817 (27.8%) | 859 (20.0%) |
Disability Class: Vision Difficulty
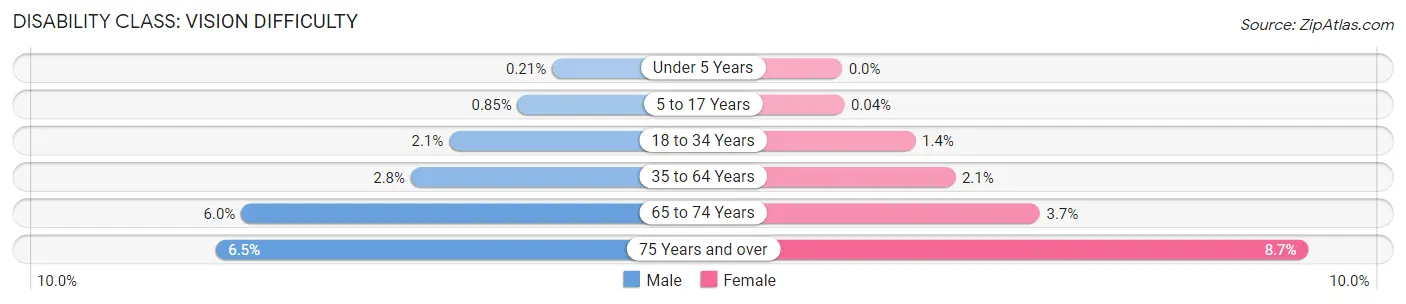
| Age Bracket | Male | Female |
| Under 5 Years | 6 (0.2%) | 0 (0.0%) |
| 5 to 17 Years | 68 (0.9%) | 3 (0.0%) |
| 18 to 34 Years | 202 (2.1%) | 118 (1.4%) |
| 35 to 64 Years | 497 (2.8%) | 362 (2.1%) |
| 65 to 74 Years | 303 (6.0%) | 197 (3.7%) |
| 75 Years and over | 190 (6.5%) | 372 (8.7%) |
Disability Class: Cognitive Difficulty
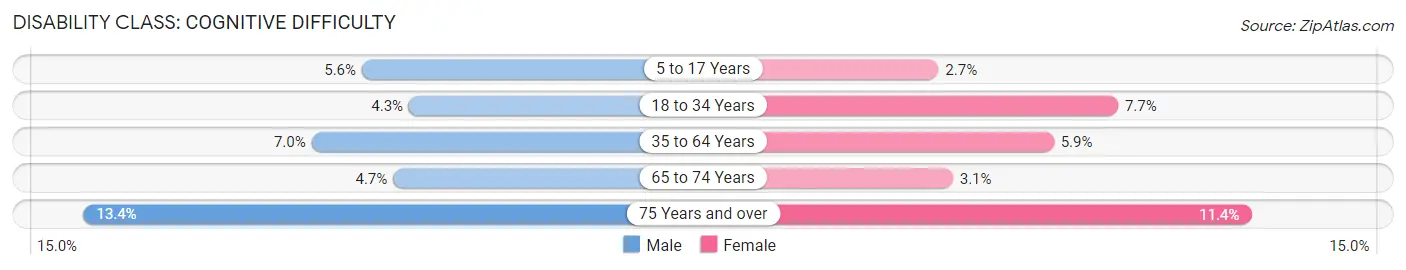
| Age Bracket | Male | Female |
| 5 to 17 Years | 449 (5.6%) | 200 (2.7%) |
| 18 to 34 Years | 410 (4.3%) | 667 (7.7%) |
| 35 to 64 Years | 1,232 (7.0%) | 1,017 (5.9%) |
| 65 to 74 Years | 240 (4.7%) | 166 (3.1%) |
| 75 Years and over | 393 (13.4%) | 490 (11.4%) |
Disability Class: Ambulatory Difficulty
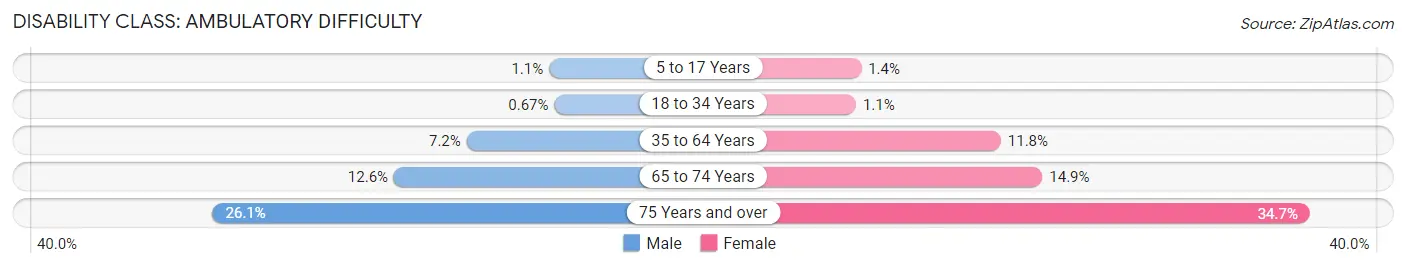
| Age Bracket | Male | Female |
| 5 to 17 Years | 85 (1.1%) | 107 (1.4%) |
| 18 to 34 Years | 64 (0.7%) | 91 (1.1%) |
| 35 to 64 Years | 1,262 (7.2%) | 2,035 (11.8%) |
| 65 to 74 Years | 637 (12.6%) | 800 (14.9%) |
| 75 Years and over | 766 (26.1%) | 1,493 (34.7%) |
Disability Class: Self-Care Difficulty
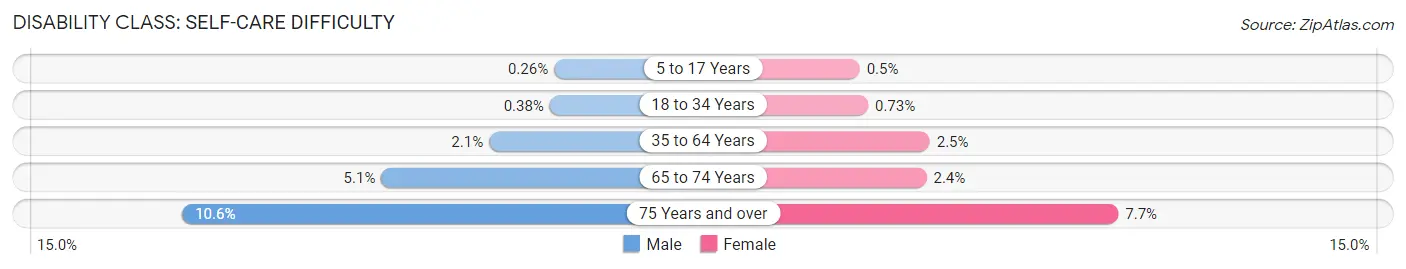
| Age Bracket | Male | Female |
| 5 to 17 Years | 21 (0.3%) | 37 (0.5%) |
| 18 to 34 Years | 36 (0.4%) | 63 (0.7%) |
| 35 to 64 Years | 364 (2.1%) | 422 (2.5%) |
| 65 to 74 Years | 257 (5.1%) | 127 (2.4%) |
| 75 Years and over | 312 (10.6%) | 331 (7.7%) |
Technology Access in Tuscarawas County
Computing Device Access in Tuscarawas County
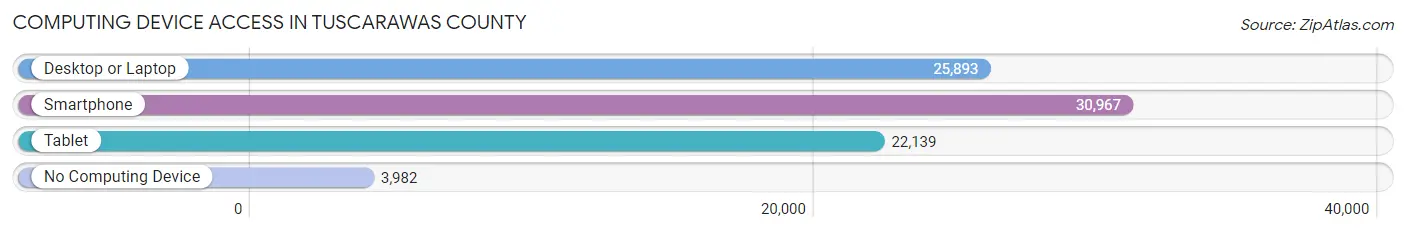
| Device Type | # Households | % Households |
| Desktop or Laptop | 25,893 | 68.5% |
| Smartphone | 30,967 | 82.0% |
| Tablet | 22,139 | 58.6% |
| No Computing Device | 3,982 | 10.5% |
| Total | 37,774 | 100.0% |
Internet Access in Tuscarawas County
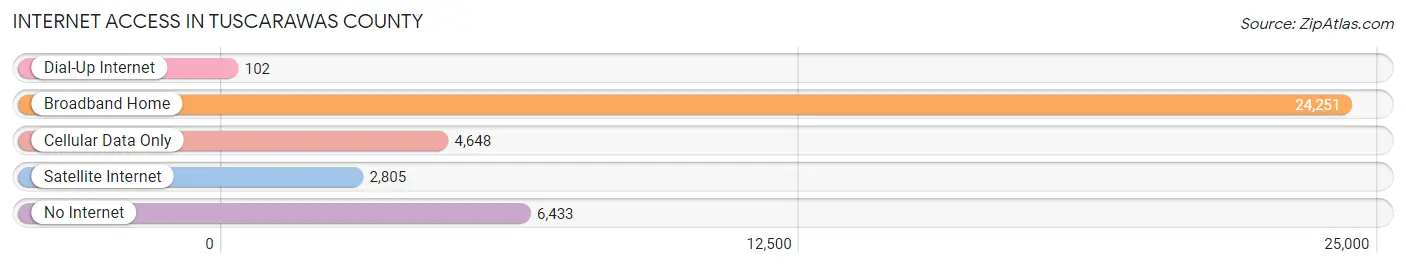
| Internet Type | # Households | % Households |
| Dial-Up Internet | 102 | 0.3% |
| Broadband Home | 24,251 | 64.2% |
| Cellular Data Only | 4,648 | 12.3% |
| Satellite Internet | 2,805 | 7.4% |
| No Internet | 6,433 | 17.0% |
| Total | 37,774 | 100.0% |
Tuscarawas County Summary
Tuscarawas County is located in the eastern part of the state of Ohio, in the Appalachian region of the United States. It is bordered by Holmes County to the north, Coshocton County to the east, Harrison County to the south, and Carroll and Stark Counties to the west. The county seat is New Philadelphia, and the county is named after the Tuscarawas River, which flows through the county.
History
Tuscarawas County was formed in 1808 from portions of Muskingum and Coshocton Counties. The county was named after the Tuscarawas River, which was named by the Delaware Indians, who lived in the area. The first settlers in the county were mostly of German and Swiss descent, and they began arriving in the early 1800s. The county was officially organized in 1808, and the first county seat was located in Gnadenhutten.
The county experienced rapid growth in the mid-1800s, due to the discovery of coal and oil in the area. This led to the development of several coal mines and oil wells, which provided jobs for many of the county’s residents. The county also experienced a population boom during this time, as many people moved to the area to take advantage of the new economic opportunities.
The county was also home to several Native American tribes, including the Delaware, Shawnee, and Wyandot. These tribes were forcibly removed from the area in the early 1800s, as part of the Indian Removal Act.
Geography
Tuscarawas County is located in the Appalachian region of the United States. It is bordered by Holmes County to the north, Coshocton County to the east, Harrison County to the south, and Carroll and Stark Counties to the west. The county has a total area of 545 square miles, of which 543 square miles is land and 2 square miles is water.
The county is mostly flat, with some rolling hills in the northern and western parts of the county. The highest point in the county is located in the western part of the county, at an elevation of 1,092 feet. The county is drained by the Tuscarawas River, which flows through the county from north to south.
Economy
Tuscarawas County’s economy is largely based on manufacturing and agriculture. The county is home to several large manufacturing companies, including the Timken Company, which produces bearings and other industrial products. The county is also home to several agricultural businesses, including dairy farms, poultry farms, and vegetable farms.
The county also has a thriving tourism industry, with several popular attractions, including the Amish Country, the Ohio and Erie Canal, and the historic town of Zoar.
Demographics
As of the 2010 census, the population of Tuscarawas County was 92,582. The population is mostly white (93.3%), with small percentages of African American (2.3%), Asian (0.7%), and Hispanic or Latino (1.7%) residents. The median household income in the county is $45,945, and the median home value is $125,400. The county has a poverty rate of 13.3%.
The largest city in the county is New Philadelphia, with a population of 17,288. Other major cities in the county include Dover (12,867), Uhrichsville (8,945), and Dennison (5,945).
Common Questions
What is the Total Population of Tuscarawas County?
Total Population of Tuscarawas County is 92,840.
What is the Total Male Population of Tuscarawas County?
Total Male Population of Tuscarawas County is 46,428.
What is the Total Female Population of Tuscarawas County?
Total Female Population of Tuscarawas County is 46,412.
What is the Ratio of Males per 100 Females in Tuscarawas County?
There are 100.03 Males per 100 Females in Tuscarawas County.
What is the Ratio of Females per 100 Males in Tuscarawas County?
There are 99.97 Females per 100 Males in Tuscarawas County.
What is the Median Population Age in Tuscarawas County?
Median Population Age in Tuscarawas County is 41.1 Years.
What is the Average Family Size in Tuscarawas County
Average Family Size in Tuscarawas County is 3.0 People.
What is the Average Household Size in Tuscarawas County
Average Household Size in Tuscarawas County is 2.4 People.
What is Per Capita Income in Tuscarawas County?
Per Capita income in Tuscarawas County is $31,736.
What is the Median Family Income in Tuscarawas County?
Median Family Income in Tuscarawas County is $76,057.
What is the Median Household income in Tuscarawas County?
Median Household Income in Tuscarawas County is $61,953.
What is Income or Wage Gap in Tuscarawas County?
Income or Wage Gap in Tuscarawas County is 35.6%.
Women in Tuscarawas County earn 64.4 cents for every dollar earned by a man.
What is Family Income Deficit in Tuscarawas County?
Family Income Deficit in Tuscarawas County is $10,480.
Families that are below poverty line in Tuscarawas County earn $10,480 less on average than the poverty threshold level.
What is Inequality or Gini Index in Tuscarawas County?
Inequality or Gini Index in Tuscarawas County is 0.42.
How Large is the Labor Force in Tuscarawas County?
There are 45,764 People in the Labor Forcein in Tuscarawas County.
What is the Percentage of People in the Labor Force in Tuscarawas County?
61.7% of People are in the Labor Force in Tuscarawas County.
What is the Unemployment Rate in Tuscarawas County?
Unemployment Rate in Tuscarawas County is 5.5%.