Trumbull County, OH
Trumbull County Map
Trumbull County Overview
201,749
TOTAL POPULATION
99,158
MALE POPULATION
102,591
FEMALE POPULATION
96.65
MALES / 100 FEMALES
103.46
FEMALES / 100 MALES
44.0
MEDIAN AGE
3.0
AVG FAMILY SIZE
2.3
AVG HOUSEHOLD SIZE
$30,294
PER CAPITA INCOME
$69,368
AVG FAMILY INCOME
$53,537
AVG HOUSEHOLD INCOME
33.3%
WAGE / INCOME GAP [ % ]
66.7¢/ $1
WAGE / INCOME GAP [ $ ]
$11,481
FAMILY INCOME DEFICIT
0.45
INEQUALITY / GINI INDEX
90,983
LABOR FORCE [ PEOPLE ]
54.9%
PERCENT IN LABOR FORCE
4.8%
UNEMPLOYMENT RATE
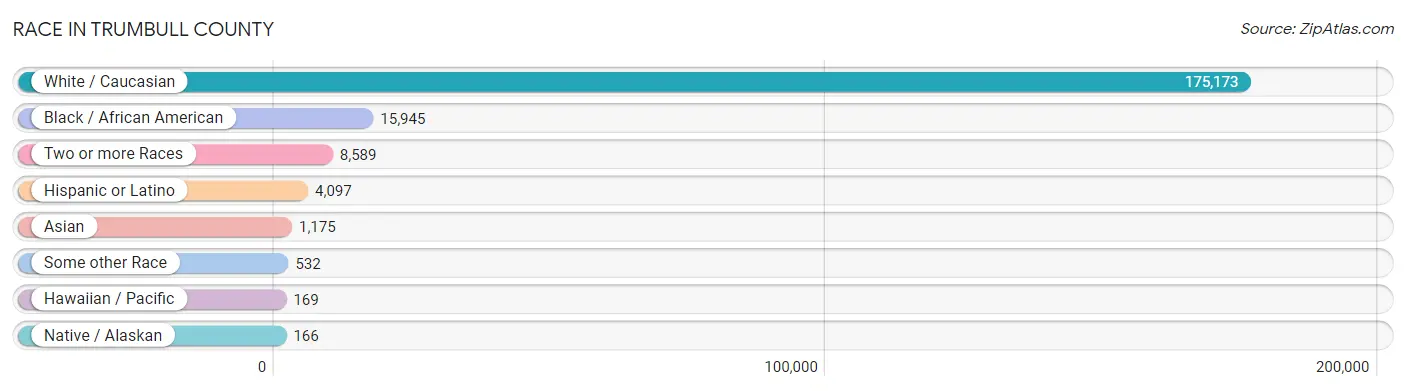
Race in Trumbull County
The most populous races in Trumbull County are White / Caucasian (175,173 | 86.8%), Black / African American (15,945 | 7.9%), and Two or more Races (8,589 | 4.3%).
| Race | # Population | % Population |
| Asian | 1,175 | 0.6% |
| Black / African American | 15,945 | 7.9% |
| Hawaiian / Pacific | 169 | 0.1% |
| Hispanic or Latino | 4,097 | 2.0% |
| Native / Alaskan | 166 | 0.1% |
| White / Caucasian | 175,173 | 86.8% |
| Two or more Races | 8,589 | 4.3% |
| Some other Race | 532 | 0.3% |
| Total | 201,749 | 100.0% |
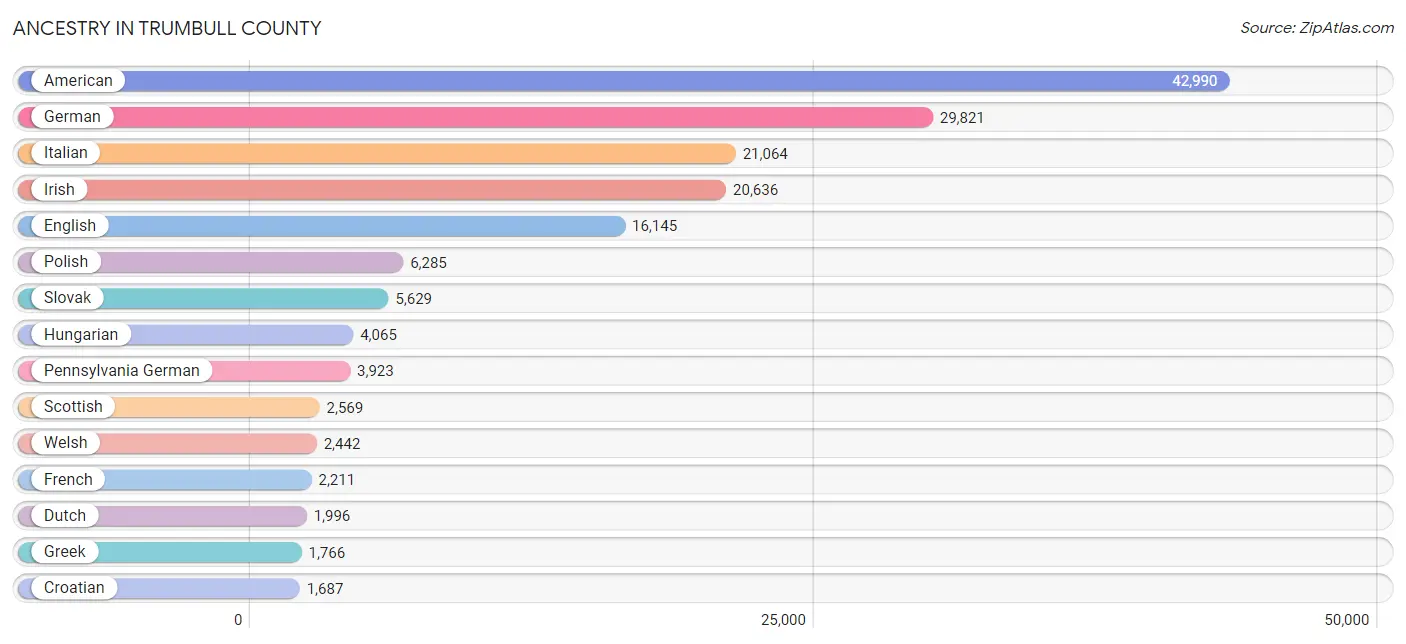
Ancestry in Trumbull County
The most populous ancestries reported in Trumbull County are American (42,990 | 21.3%), German (29,821 | 14.8%), Italian (21,064 | 10.4%), Irish (20,636 | 10.2%), and English (16,145 | 8.0%), together accounting for 64.8% of all Trumbull County residents.
| Ancestry | # Population | % Population |
| African | 159 | 0.1% |
| Alaskan Athabascan | 13 | 0.0% |
| Albanian | 72 | 0.0% |
| American | 42,990 | 21.3% |
| Apache | 22 | 0.0% |
| Arab | 656 | 0.3% |
| Armenian | 51 | 0.0% |
| Australian | 16 | 0.0% |
| Austrian | 281 | 0.1% |
| Bahamian | 15 | 0.0% |
| Barbadian | 59 | 0.0% |
| Belgian | 77 | 0.0% |
| Bhutanese | 226 | 0.1% |
| Blackfeet | 211 | 0.1% |
| Brazilian | 113 | 0.1% |
| British | 492 | 0.2% |
| Bulgarian | 35 | 0.0% |
| Burmese | 321 | 0.2% |
| Cambodian | 15 | 0.0% |
| Canadian | 239 | 0.1% |
| Carpatho Rusyn | 22 | 0.0% |
| Celtic | 63 | 0.0% |
| Central American | 110 | 0.1% |
| Central American Indian | 9 | 0.0% |
| Cherokee | 694 | 0.3% |
| Chippewa | 33 | 0.0% |
| Colombian | 206 | 0.1% |
| Creek | 2 | 0.0% |
| Croatian | 1,687 | 0.8% |
| Crow | 11 | 0.0% |
| Cuban | 271 | 0.1% |
| Czech | 512 | 0.3% |
| Czechoslovakian | 317 | 0.2% |
| Danish | 59 | 0.0% |
| Delaware | 12 | 0.0% |
| Dominican | 16 | 0.0% |
| Dutch | 1,996 | 1.0% |
| Eastern European | 589 | 0.3% |
| Ecuadorian | 10 | 0.0% |
| Egyptian | 22 | 0.0% |
| English | 16,145 | 8.0% |
| Estonian | 13 | 0.0% |
| European | 1,363 | 0.7% |
| Finnish | 801 | 0.4% |
| French | 2,211 | 1.1% |
| French Canadian | 520 | 0.3% |
| German | 29,821 | 14.8% |
| German Russian | 47 | 0.0% |
| Greek | 1,766 | 0.9% |
| Guamanian / Chamorro | 7 | 0.0% |
| Guatemalan | 34 | 0.0% |
| Guyanese | 20 | 0.0% |
| Hungarian | 4,065 | 2.0% |
| Indian (Asian) | 294 | 0.2% |
| Inupiat | 10 | 0.0% |
| Iranian | 53 | 0.0% |
| Irish | 20,636 | 10.2% |
| Iroquois | 36 | 0.0% |
| Italian | 21,064 | 10.4% |
| Jamaican | 262 | 0.1% |
| Jordanian | 7 | 0.0% |
| Korean | 407 | 0.2% |
| Laotian | 15 | 0.0% |
| Lebanese | 328 | 0.2% |
| Lithuanian | 250 | 0.1% |
| Macedonian | 22 | 0.0% |
| Mexican | 1,500 | 0.7% |
| Mexican American Indian | 14 | 0.0% |
| Moroccan | 25 | 0.0% |
| Native Hawaiian | 37 | 0.0% |
| Navajo | 8 | 0.0% |
| Nicaraguan | 6 | 0.0% |
| Nigerian | 44 | 0.0% |
| Northern European | 16 | 0.0% |
| Norwegian | 269 | 0.1% |
| Pakistani | 65 | 0.0% |
| Palestinian | 149 | 0.1% |
| Panamanian | 51 | 0.0% |
| Pennsylvania German | 3,923 | 1.9% |
| Polish | 6,285 | 3.1% |
| Portuguese | 145 | 0.1% |
| Puerto Rican | 1,610 | 0.8% |
| Romanian | 1,085 | 0.5% |
| Russian | 1,161 | 0.6% |
| Salvadoran | 19 | 0.0% |
| Scandinavian | 246 | 0.1% |
| Scotch-Irish | 1,661 | 0.8% |
| Scottish | 2,569 | 1.3% |
| Seminole | 1 | 0.0% |
| Serbian | 378 | 0.2% |
| Sioux | 15 | 0.0% |
| Slavic | 139 | 0.1% |
| Slovak | 5,629 | 2.8% |
| Slovene | 400 | 0.2% |
| South American | 216 | 0.1% |
| Spaniard | 108 | 0.1% |
| Spanish | 41 | 0.0% |
| Sri Lankan | 213 | 0.1% |
| Subsaharan African | 260 | 0.1% |
| Swedish | 1,137 | 0.6% |
| Swiss | 672 | 0.3% |
| Syrian | 32 | 0.0% |
| Thai | 132 | 0.1% |
| Turkish | 24 | 0.0% |
| Ukrainian | 1,246 | 0.6% |
| Welsh | 2,442 | 1.2% |
| Yugoslavian | 202 | 0.1% | View All 107 Rows |
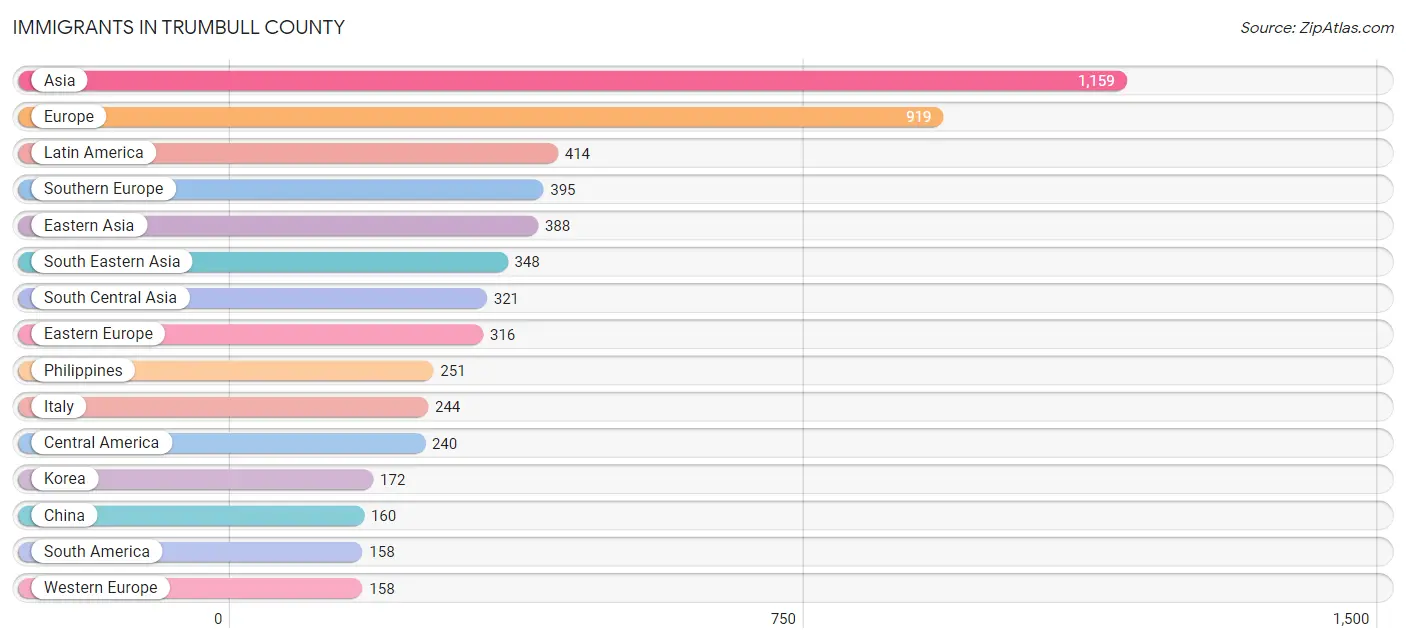
Immigrants in Trumbull County
The most numerous immigrant groups reported in Trumbull County came from Asia (1,159 | 0.6%), Europe (919 | 0.5%), Latin America (414 | 0.2%), Southern Europe (395 | 0.2%), and Eastern Asia (388 | 0.2%), together accounting for 1.6% of all Trumbull County residents.
| Immigration Origin | # Population | % Population |
| Africa | 57 | 0.0% |
| Asia | 1,159 | 0.6% |
| Bangladesh | 17 | 0.0% |
| Belarus | 22 | 0.0% |
| Bosnia and Herzegovina | 6 | 0.0% |
| Cameroon | 32 | 0.0% |
| Canada | 118 | 0.1% |
| Caribbean | 16 | 0.0% |
| Central America | 240 | 0.1% |
| China | 160 | 0.1% |
| Colombia | 88 | 0.0% |
| Croatia | 12 | 0.0% |
| Czechoslovakia | 43 | 0.0% |
| Dominican Republic | 16 | 0.0% |
| Eastern Africa | 3 | 0.0% |
| Eastern Asia | 388 | 0.2% |
| Eastern Europe | 316 | 0.2% |
| Ecuador | 10 | 0.0% |
| Egypt | 22 | 0.0% |
| El Salvador | 19 | 0.0% |
| England | 17 | 0.0% |
| Europe | 919 | 0.5% |
| Germany | 124 | 0.1% |
| Greece | 151 | 0.1% |
| Guatemala | 76 | 0.0% |
| Guyana | 15 | 0.0% |
| Honduras | 8 | 0.0% |
| Hungary | 13 | 0.0% |
| India | 60 | 0.0% |
| Iran | 53 | 0.0% |
| Iraq | 6 | 0.0% |
| Italy | 244 | 0.1% |
| Japan | 56 | 0.0% |
| Jordan | 15 | 0.0% |
| Korea | 172 | 0.1% |
| Latin America | 414 | 0.2% |
| Lebanon | 12 | 0.0% |
| Mexico | 137 | 0.1% |
| Middle Africa | 32 | 0.0% |
| Nepal | 100 | 0.1% |
| Netherlands | 34 | 0.0% |
| Northern Africa | 22 | 0.0% |
| Northern Europe | 50 | 0.0% |
| Pakistan | 46 | 0.0% |
| Peru | 7 | 0.0% |
| Philippines | 251 | 0.1% |
| Poland | 14 | 0.0% |
| Romania | 128 | 0.1% |
| Russia | 13 | 0.0% |
| Scotland | 14 | 0.0% |
| South America | 158 | 0.1% |
| South Central Asia | 321 | 0.2% |
| South Eastern Asia | 348 | 0.2% |
| Southern Europe | 395 | 0.2% |
| Thailand | 60 | 0.0% |
| Ukraine | 26 | 0.0% |
| Venezuela | 38 | 0.0% |
| Vietnam | 37 | 0.0% |
| Western Asia | 33 | 0.0% |
| Western Europe | 158 | 0.1% | View All 60 Rows |
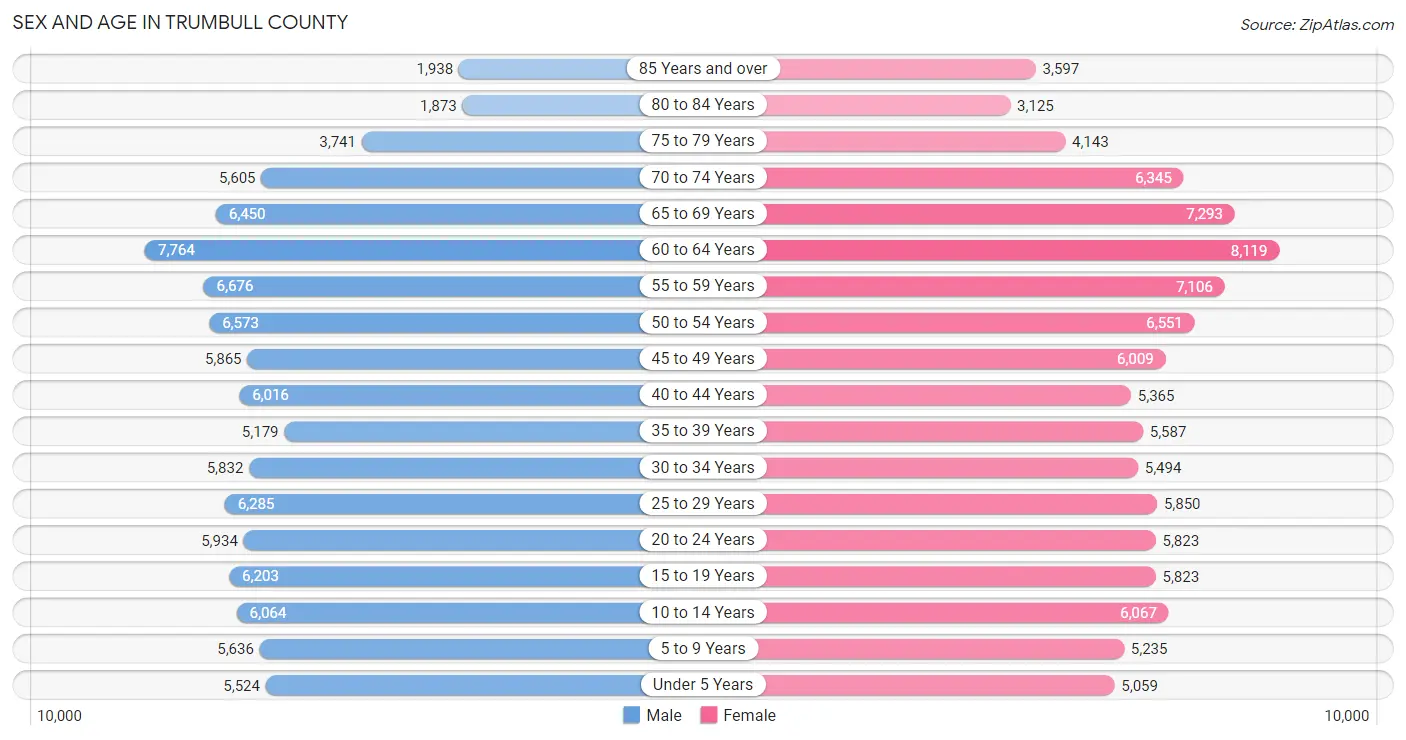
Sex and Age in Trumbull County
Sex and Age in Trumbull County
The most populous age groups in Trumbull County are 60 to 64 Years (7,764 | 7.8%) for men and 60 to 64 Years (8,119 | 7.9%) for women.
| Age Bracket | Male | Female |
| Under 5 Years | 5,524 (5.6%) | 5,059 (4.9%) |
| 5 to 9 Years | 5,636 (5.7%) | 5,235 (5.1%) |
| 10 to 14 Years | 6,064 (6.1%) | 6,067 (5.9%) |
| 15 to 19 Years | 6,203 (6.3%) | 5,823 (5.7%) |
| 20 to 24 Years | 5,934 (6.0%) | 5,823 (5.7%) |
| 25 to 29 Years | 6,285 (6.3%) | 5,850 (5.7%) |
| 30 to 34 Years | 5,832 (5.9%) | 5,494 (5.4%) |
| 35 to 39 Years | 5,179 (5.2%) | 5,587 (5.4%) |
| 40 to 44 Years | 6,016 (6.1%) | 5,365 (5.2%) |
| 45 to 49 Years | 5,865 (5.9%) | 6,009 (5.9%) |
| 50 to 54 Years | 6,573 (6.6%) | 6,551 (6.4%) |
| 55 to 59 Years | 6,676 (6.7%) | 7,106 (6.9%) |
| 60 to 64 Years | 7,764 (7.8%) | 8,119 (7.9%) |
| 65 to 69 Years | 6,450 (6.5%) | 7,293 (7.1%) |
| 70 to 74 Years | 5,605 (5.7%) | 6,345 (6.2%) |
| 75 to 79 Years | 3,741 (3.8%) | 4,143 (4.0%) |
| 80 to 84 Years | 1,873 (1.9%) | 3,125 (3.0%) |
| 85 Years and over | 1,938 (1.9%) | 3,597 (3.5%) |
| Total | 99,158 (100.0%) | 102,591 (100.0%) |
Families and Households in Trumbull County
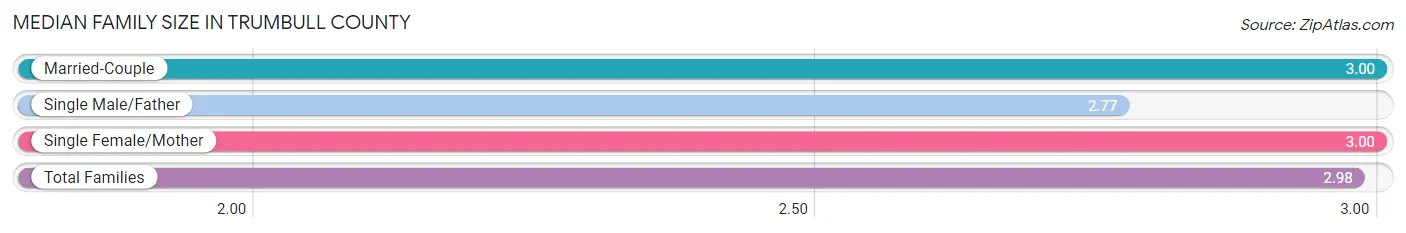
Median Family Size in Trumbull County
The median family size in Trumbull County is 2.98 persons per family, with married-couple families (36,323 | 69.8%) accounting for the largest median family size of 3 persons per family. On the other hand, single male/father families (4,564 | 8.8%) represent the smallest median family size with 2.77 persons per family.
| Family Type | # Families | Family Size |
| Married-Couple | 36,323 (69.8%) | 3.00 |
| Single Male/Father | 4,564 (8.8%) | 2.77 |
| Single Female/Mother | 11,140 (21.4%) | 3.00 |
| Total Families | 52,027 (100.0%) | 2.98 |
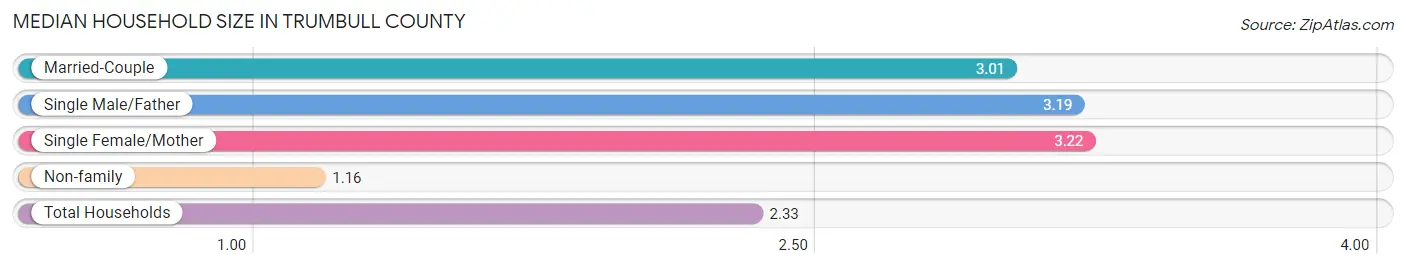
Median Household Size in Trumbull County
The median household size in Trumbull County is 2.33 persons per household, with single female/mother households (11,140 | 13.1%) accounting for the largest median household size of 3.22 persons per household. non-family households (33,015 | 38.8%) represent the smallest median household size with 1.16 persons per household.
| Household Type | # Households | Household Size |
| Married-Couple | 36,323 (42.7%) | 3.01 |
| Single Male/Father | 4,564 (5.4%) | 3.19 |
| Single Female/Mother | 11,140 (13.1%) | 3.22 |
| Non-family | 33,015 (38.8%) | 1.16 |
| Total Households | 85,042 (100.0%) | 2.33 |
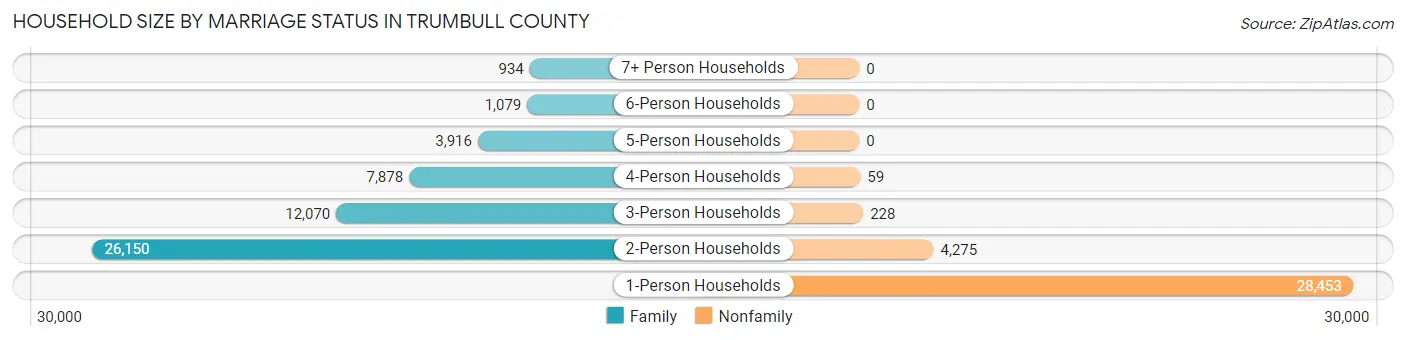
Household Size by Marriage Status in Trumbull County
Out of a total of 85,042 households in Trumbull County, 52,027 (61.2%) are family households, while 33,015 (38.8%) are nonfamily households. The most numerous type of family households are 2-person households, comprising 26,150, and the most common type of nonfamily households are 1-person households, comprising 28,453.
| Household Size | Family Households | Nonfamily Households |
| 1-Person Households | - | 28,453 (33.5%) |
| 2-Person Households | 26,150 (30.7%) | 4,275 (5.0%) |
| 3-Person Households | 12,070 (14.2%) | 228 (0.3%) |
| 4-Person Households | 7,878 (9.3%) | 59 (0.1%) |
| 5-Person Households | 3,916 (4.6%) | 0 (0.0%) |
| 6-Person Households | 1,079 (1.3%) | 0 (0.0%) |
| 7+ Person Households | 934 (1.1%) | 0 (0.0%) |
| Total | 52,027 (61.2%) | 33,015 (38.8%) |
Female Fertility in Trumbull County
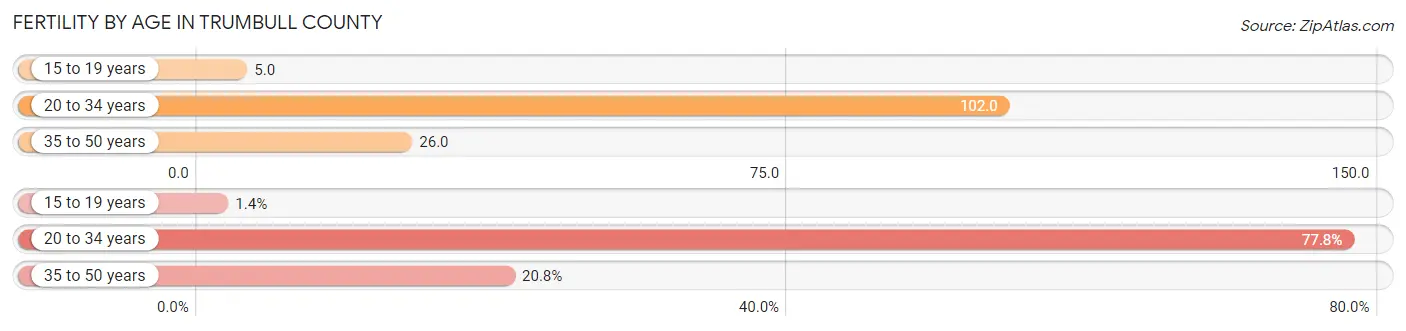
Fertility by Age in Trumbull County
Average fertility rate in Trumbull County is 54.0 births per 1,000 women. Women in the age bracket of 20 to 34 years have the highest fertility rate with 102.0 births per 1,000 women. Women in the age bracket of 20 to 34 years acount for 77.8% of all women with births.
| Age Bracket | Women with Births | Births / 1,000 Women |
| 15 to 19 years | 31 (1.4%) | 5.0 |
| 20 to 34 years | 1,750 (77.8%) | 102.0 |
| 35 to 50 years | 469 (20.8%) | 26.0 |
| Total | 2,250 (100.0%) | 54.0 |
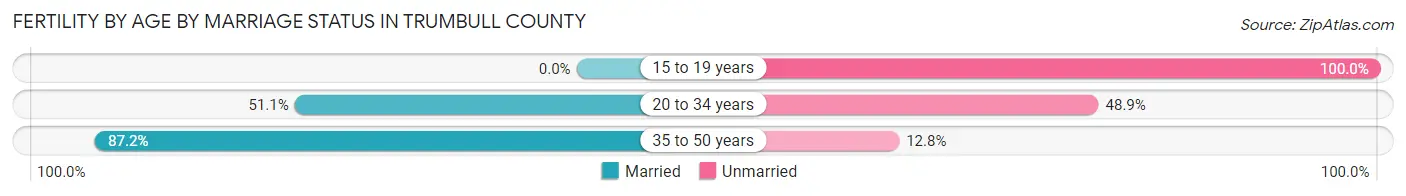
Fertility by Age by Marriage Status in Trumbull County
57.9% of women with births (2,250) in Trumbull County are married. The highest percentage of unmarried women with births falls into 15 to 19 years age bracket with 100.0% of them unmarried at the time of birth, while the lowest percentage of unmarried women with births belong to 35 to 50 years age bracket with 12.8% of them unmarried.
| Age Bracket | Married | Unmarried |
| 15 to 19 years | 0 (0.0%) | 31 (100.0%) |
| 20 to 34 years | 894 (51.1%) | 856 (48.9%) |
| 35 to 50 years | 409 (87.2%) | 60 (12.8%) |
| Total | 1,303 (57.9%) | 947 (42.1%) |
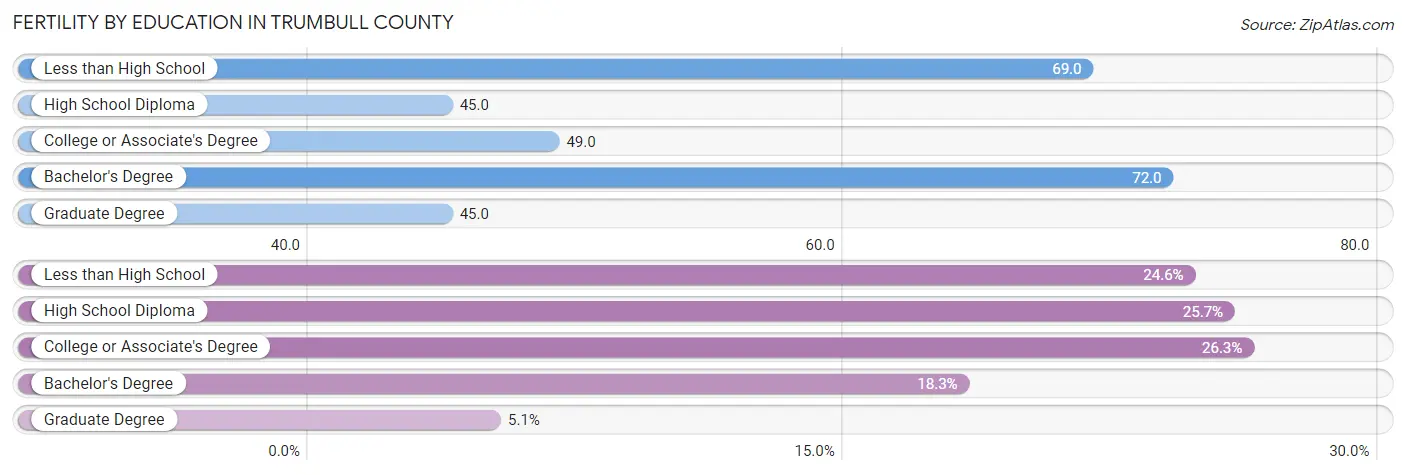
Fertility by Education in Trumbull County
Average fertility rate in Trumbull County is 54.0 births per 1,000 women. Women with the education attainment of bachelor's degree have the highest fertility rate of 72.0 births per 1,000 women, while women with the education attainment of high school diploma have the lowest fertility at 45.0 births per 1,000 women. Women with the education attainment of college or associate's degree represent 26.3% of all women with births.
| Educational Attainment | Women with Births | Births / 1,000 Women |
| Less than High School | 554 (24.6%) | 69.0 |
| High School Diploma | 579 (25.7%) | 45.0 |
| College or Associate's Degree | 591 (26.3%) | 49.0 |
| Bachelor's Degree | 411 (18.3%) | 72.0 |
| Graduate Degree | 115 (5.1%) | 45.0 |
| Total | 2,250 (100.0%) | 54.0 |
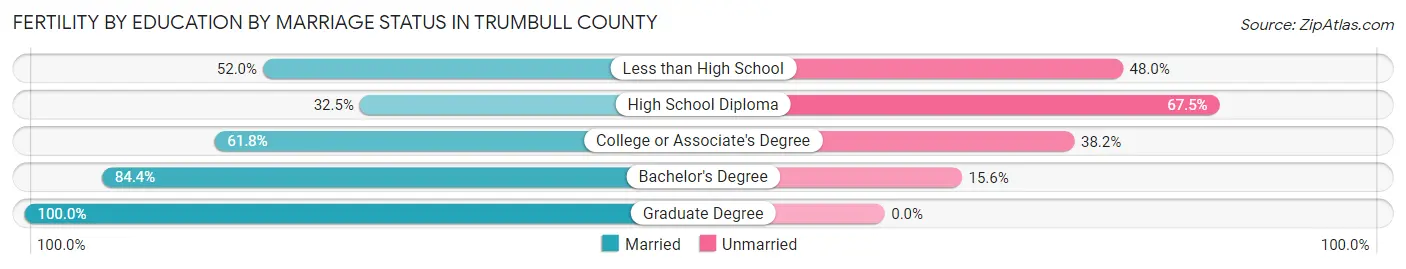
Fertility by Education by Marriage Status in Trumbull County
42.1% of women with births in Trumbull County are unmarried. Women with the educational attainment of graduate degree are most likely to be married with 100.0% of them married at childbirth, while women with the educational attainment of high school diploma are least likely to be married with 67.5% of them unmarried at childbirth.
| Educational Attainment | Married | Unmarried |
| Less than High School | 288 (52.0%) | 266 (48.0%) |
| High School Diploma | 188 (32.5%) | 391 (67.5%) |
| College or Associate's Degree | 365 (61.8%) | 226 (38.2%) |
| Bachelor's Degree | 347 (84.4%) | 64 (15.6%) |
| Graduate Degree | 115 (100.0%) | 0 (0.0%) |
| Total | 1,303 (57.9%) | 947 (42.1%) |
Income in Trumbull County
Income Overview in Trumbull County
Per Capita Income in Trumbull County is $30,294, while median incomes of families and households are $69,368 and $53,537 respectively.
| Characteristic | Number | Measure |
| Per Capita Income | 201,749 | $30,294 |
| Median Family Income | 52,027 | $69,368 |
| Mean Family Income | 52,027 | $84,649 |
| Median Household Income | 85,042 | $53,537 |
| Mean Household Income | 85,042 | $70,262 |
| Income Deficit | 52,027 | $11,481 |
| Wage / Income Gap (%) | 201,749 | 33.26% |
| Wage / Income Gap ($) | 201,749 | 66.74¢ per $1 |
| Gini / Inequality Index | 201,749 | 0.45 |
Earnings by Sex in Trumbull County
Average Earnings in Trumbull County are $35,587, $42,490 for men and $28,359 for women, a difference of 33.3%.
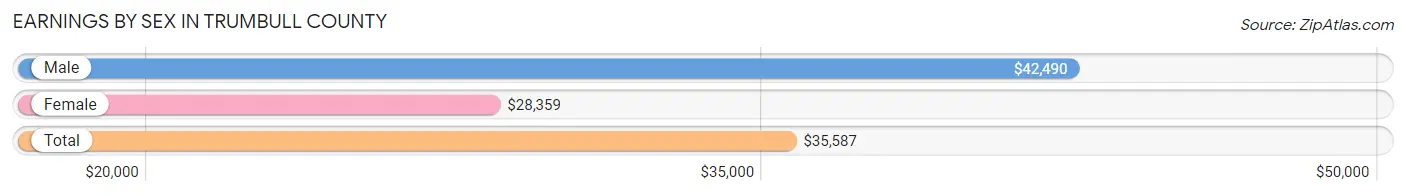
| Sex | Number | Average Earnings |
| Male | 50,256 (53.1%) | $42,490 |
| Female | 44,463 (46.9%) | $28,359 |
| Total | 94,719 (100.0%) | $35,587 |
Earnings by Sex by Income Bracket in Trumbull County
The most common earnings brackets in Trumbull County are $75,000 to $99,999 for men (5,267 | 10.5%) and $25,000 to $29,999 for women (4,120 | 9.3%).
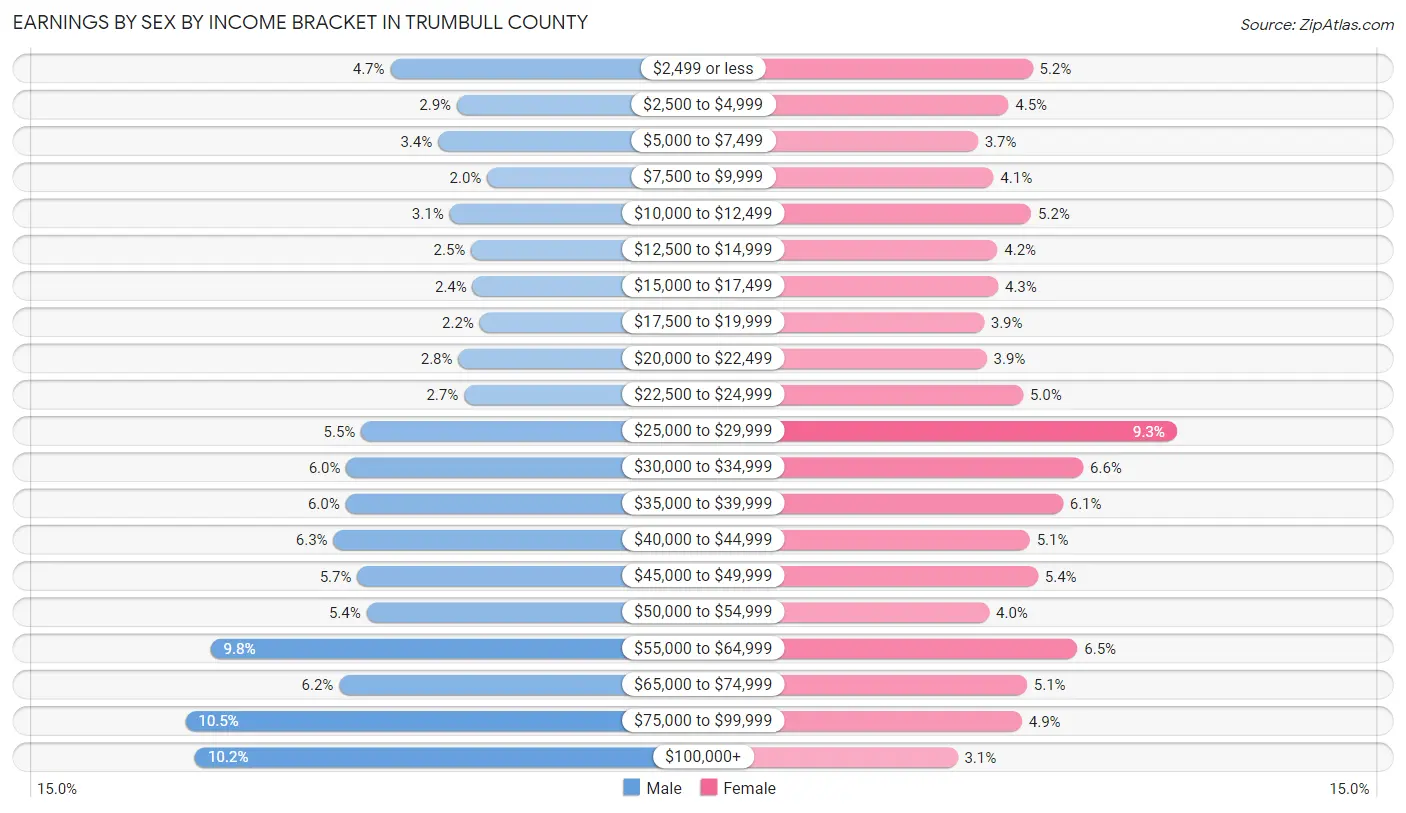
| Income | Male | Female |
| $2,499 or less | 2,372 (4.7%) | 2,320 (5.2%) |
| $2,500 to $4,999 | 1,431 (2.9%) | 2,020 (4.5%) |
| $5,000 to $7,499 | 1,699 (3.4%) | 1,636 (3.7%) |
| $7,500 to $9,999 | 1,007 (2.0%) | 1,832 (4.1%) |
| $10,000 to $12,499 | 1,537 (3.1%) | 2,301 (5.2%) |
| $12,500 to $14,999 | 1,232 (2.5%) | 1,881 (4.2%) |
| $15,000 to $17,499 | 1,209 (2.4%) | 1,889 (4.3%) |
| $17,500 to $19,999 | 1,109 (2.2%) | 1,713 (3.8%) |
| $20,000 to $22,499 | 1,410 (2.8%) | 1,748 (3.9%) |
| $22,500 to $24,999 | 1,333 (2.6%) | 2,200 (5.0%) |
| $25,000 to $29,999 | 2,782 (5.5%) | 4,120 (9.3%) |
| $30,000 to $34,999 | 2,996 (6.0%) | 2,952 (6.6%) |
| $35,000 to $39,999 | 3,004 (6.0%) | 2,697 (6.1%) |
| $40,000 to $44,999 | 3,177 (6.3%) | 2,285 (5.1%) |
| $45,000 to $49,999 | 2,841 (5.7%) | 2,387 (5.4%) |
| $50,000 to $54,999 | 2,711 (5.4%) | 1,777 (4.0%) |
| $55,000 to $64,999 | 4,910 (9.8%) | 2,881 (6.5%) |
| $65,000 to $74,999 | 3,097 (6.2%) | 2,252 (5.1%) |
| $75,000 to $99,999 | 5,267 (10.5%) | 2,188 (4.9%) |
| $100,000+ | 5,132 (10.2%) | 1,384 (3.1%) |
| Total | 50,256 (100.0%) | 44,463 (100.0%) |
Earnings by Sex by Educational Attainment in Trumbull County
Average earnings in Trumbull County are $47,293 for men and $32,279 for women, a difference of 31.8%. Men with an educational attainment of graduate degree enjoy the highest average annual earnings of $78,914, while those with less than high school education earn the least with $33,154. Women with an educational attainment of graduate degree earn the most with the average annual earnings of $61,734, while those with less than high school education have the smallest earnings of $17,824.
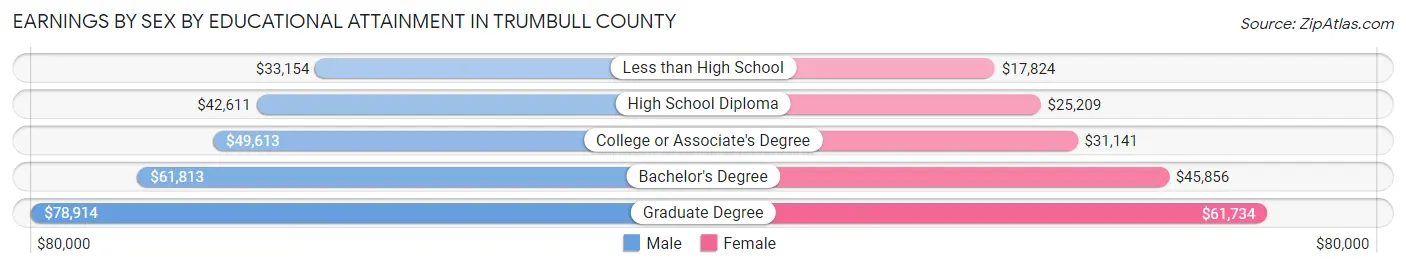
| Educational Attainment | Male Income | Female Income |
| Less than High School | $33,154 | $17,824 |
| High School Diploma | $42,611 | $25,209 |
| College or Associate's Degree | $49,613 | $31,141 |
| Bachelor's Degree | $61,813 | $45,856 |
| Graduate Degree | $78,914 | $61,734 |
| Total | $47,293 | $32,279 |
Family Income in Trumbull County
Family Income Brackets in Trumbull County
According to the Trumbull County family income data, there are 10,561 families falling into the $50,000 to $74,999 income range, which is the most common income bracket and makes up 20.3% of all families. Conversely, the $10,000 to $14,999 income bracket is the least frequent group with only 1,925 families (3.7%) belonging to this category.
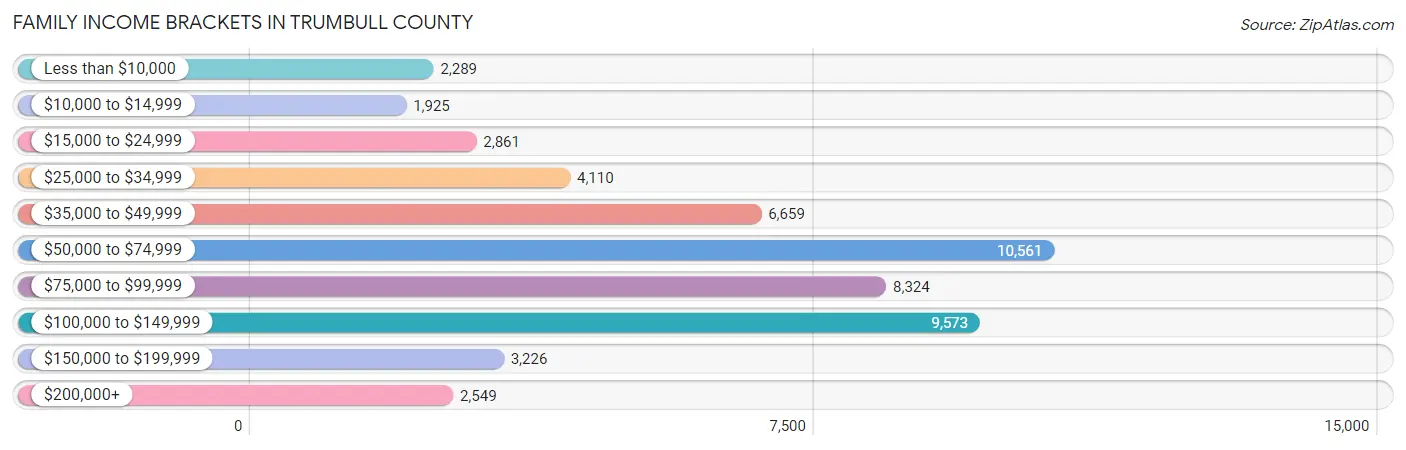
| Income Bracket | # Families | % Families |
| Less than $10,000 | 2,289 | 4.4% |
| $10,000 to $14,999 | 1,925 | 3.7% |
| $15,000 to $24,999 | 2,861 | 5.5% |
| $25,000 to $34,999 | 4,110 | 7.9% |
| $35,000 to $49,999 | 6,659 | 12.8% |
| $50,000 to $74,999 | 10,561 | 20.3% |
| $75,000 to $99,999 | 8,324 | 16.0% |
| $100,000 to $149,999 | 9,573 | 18.4% |
| $150,000 to $199,999 | 3,226 | 6.2% |
| $200,000+ | 2,549 | 4.9% |
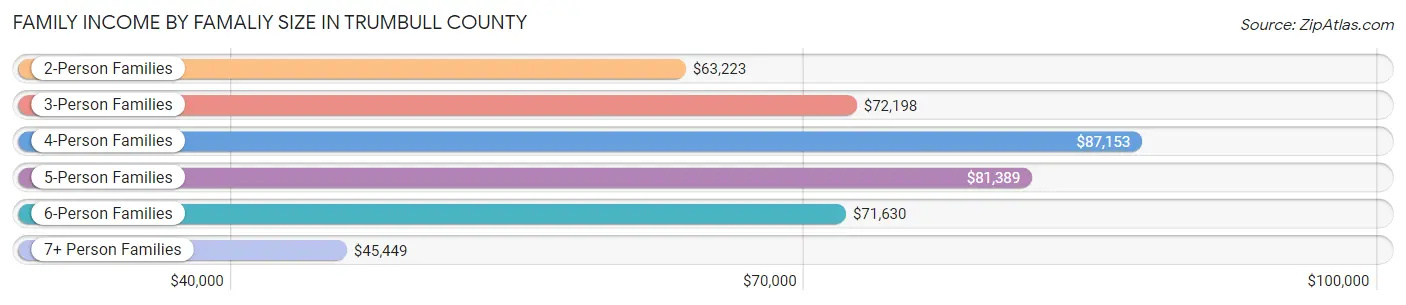
Family Income by Famaliy Size in Trumbull County
4-person families (7,242 | 13.9%) account for the highest median family income in Trumbull County with $87,153 per family, while 2-person families (27,891 | 53.6%) have the highest median income of $31,612 per family member.
| Income Bracket | # Families | Median Income |
| 2-Person Families | 27,891 (53.6%) | $63,223 |
| 3-Person Families | 11,770 (22.6%) | $72,198 |
| 4-Person Families | 7,242 (13.9%) | $87,153 |
| 5-Person Families | 3,336 (6.4%) | $81,389 |
| 6-Person Families | 942 (1.8%) | $71,630 |
| 7+ Person Families | 846 (1.6%) | $45,449 |
| Total | 52,027 (100.0%) | $69,368 |
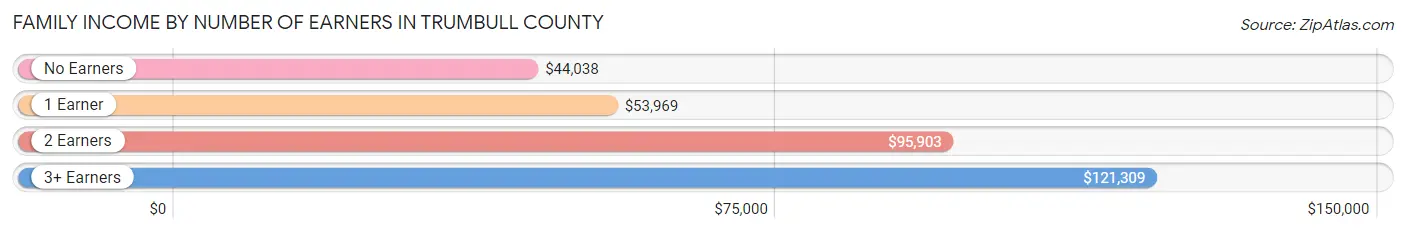
Family Income by Number of Earners in Trumbull County
The median family income in Trumbull County is $69,368, with families comprising 3+ earners (4,544) having the highest median family income of $121,309, while families with no earners (11,770) have the lowest median family income of $44,038, accounting for 8.7% and 22.6% of families, respectively.
| Number of Earners | # Families | Median Income |
| No Earners | 11,770 (22.6%) | $44,038 |
| 1 Earner | 18,307 (35.2%) | $53,969 |
| 2 Earners | 17,406 (33.5%) | $95,903 |
| 3+ Earners | 4,544 (8.7%) | $121,309 |
| Total | 52,027 (100.0%) | $69,368 |
Household Income in Trumbull County
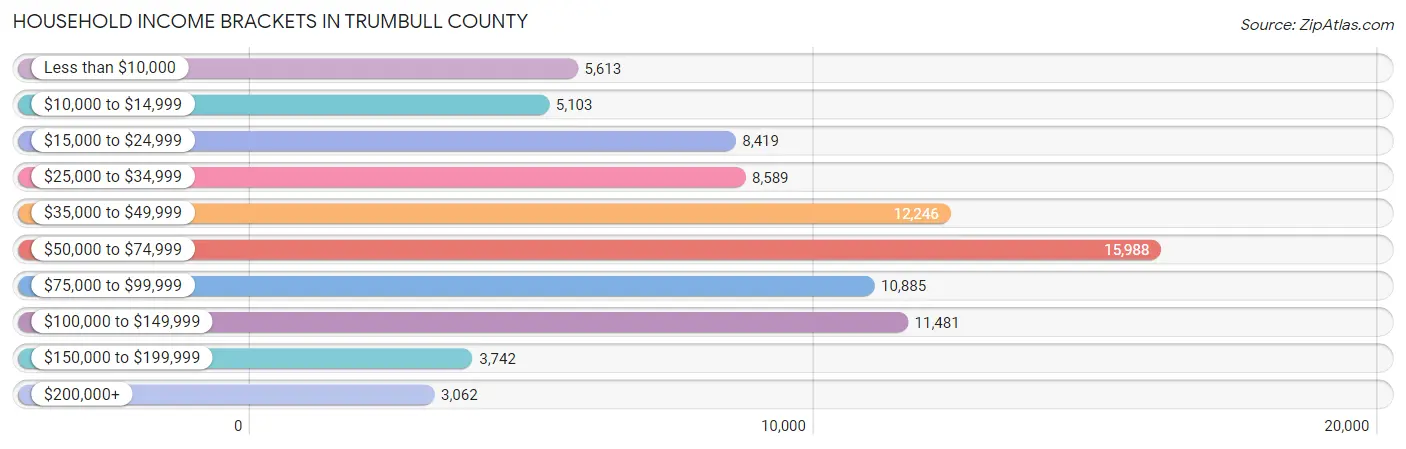
Household Income Brackets in Trumbull County
With 15,988 households falling in the category, the $50,000 to $74,999 income range is the most frequent in Trumbull County, accounting for 18.8% of all households. In contrast, only 3,062 households (3.6%) fall into the $200,000+ income bracket, making it the least populous group.
| Income Bracket | # Households | % Households |
| Less than $10,000 | 5,613 | 6.6% |
| $10,000 to $14,999 | 5,103 | 6.0% |
| $15,000 to $24,999 | 8,419 | 9.9% |
| $25,000 to $34,999 | 8,589 | 10.1% |
| $35,000 to $49,999 | 12,246 | 14.4% |
| $50,000 to $74,999 | 15,988 | 18.8% |
| $75,000 to $99,999 | 10,885 | 12.8% |
| $100,000 to $149,999 | 11,481 | 13.5% |
| $150,000 to $199,999 | 3,742 | 4.4% |
| $200,000+ | 3,062 | 3.6% |
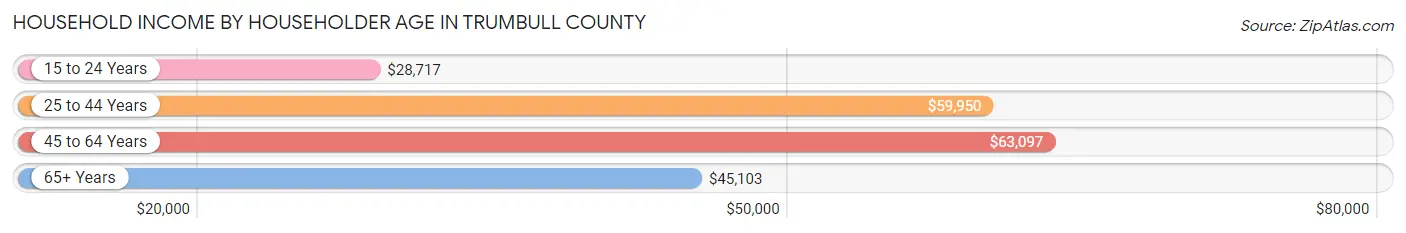
Household Income by Householder Age in Trumbull County
The median household income in Trumbull County is $53,537, with the highest median household income of $63,097 found in the 45 to 64 years age bracket for the primary householder. A total of 31,979 households (37.6%) fall into this category. Meanwhile, the 15 to 24 years age bracket for the primary householder has the lowest median household income of $28,717, with 3,166 households (3.7%) in this group.
| Income Bracket | # Households | Median Income |
| 15 to 24 Years | 3,166 (3.7%) | $28,717 |
| 25 to 44 Years | 21,286 (25.0%) | $59,950 |
| 45 to 64 Years | 31,979 (37.6%) | $63,097 |
| 65+ Years | 28,611 (33.6%) | $45,103 |
| Total | 85,042 (100.0%) | $53,537 |
Poverty in Trumbull County
Income Below Poverty by Sex and Age in Trumbull County
With 14.7% poverty level for males and 19.5% for females among the residents of Trumbull County, under 5 year old males and 5 year old females are the most vulnerable to poverty, with 1,714 males (31.6%) and 446 females (42.9%) in their respective age groups living below the poverty level.
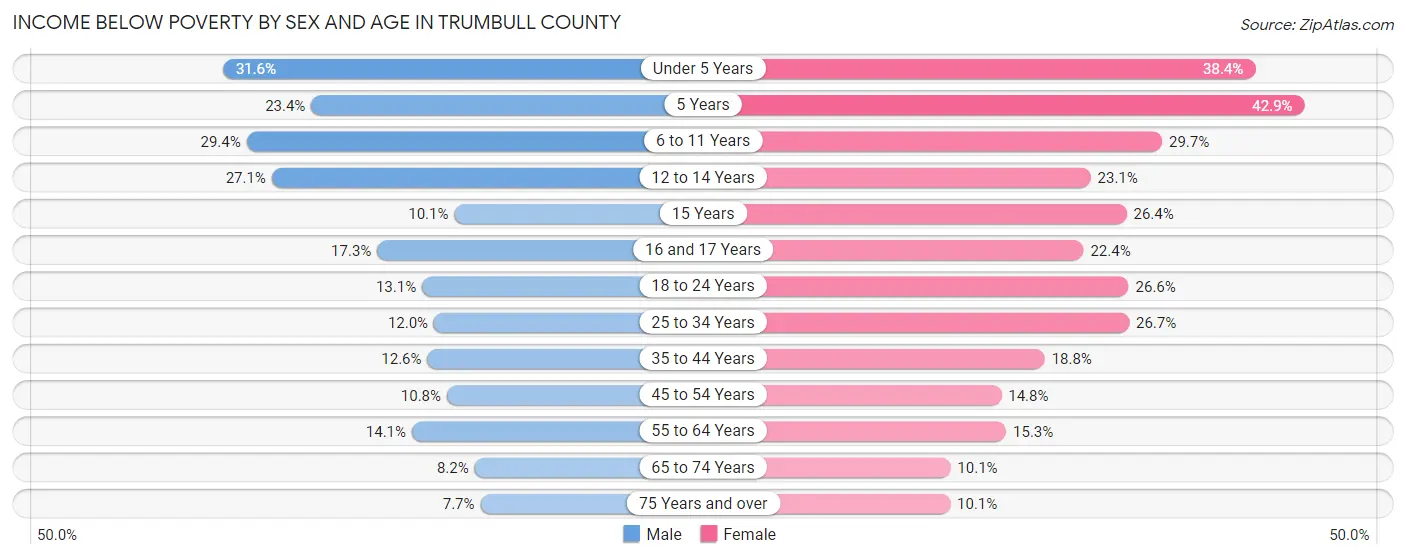
| Age Bracket | Male | Female |
| Under 5 Years | 1,714 (31.6%) | 1,912 (38.4%) |
| 5 Years | 234 (23.4%) | 446 (42.9%) |
| 6 to 11 Years | 2,161 (29.4%) | 1,959 (29.7%) |
| 12 to 14 Years | 873 (27.1%) | 811 (23.1%) |
| 15 Years | 130 (10.1%) | 304 (26.4%) |
| 16 and 17 Years | 444 (17.3%) | 595 (22.4%) |
| 18 to 24 Years | 1,067 (13.1%) | 2,080 (26.6%) |
| 25 to 34 Years | 1,366 (12.0%) | 3,021 (26.7%) |
| 35 to 44 Years | 1,342 (12.6%) | 2,056 (18.8%) |
| 45 to 54 Years | 1,330 (10.8%) | 1,855 (14.8%) |
| 55 to 64 Years | 1,995 (14.1%) | 2,289 (15.2%) |
| 65 to 74 Years | 977 (8.2%) | 1,361 (10.1%) |
| 75 Years and over | 560 (7.7%) | 1,030 (10.1%) |
| Total | 14,193 (14.7%) | 19,719 (19.5%) |
Income Above Poverty by Sex and Age in Trumbull County
According to the poverty statistics in Trumbull County, males aged 75 years and over and females aged 75 years and over are the age groups that are most secure financially, with 92.3% of males and 89.9% of females in these age groups living above the poverty line.
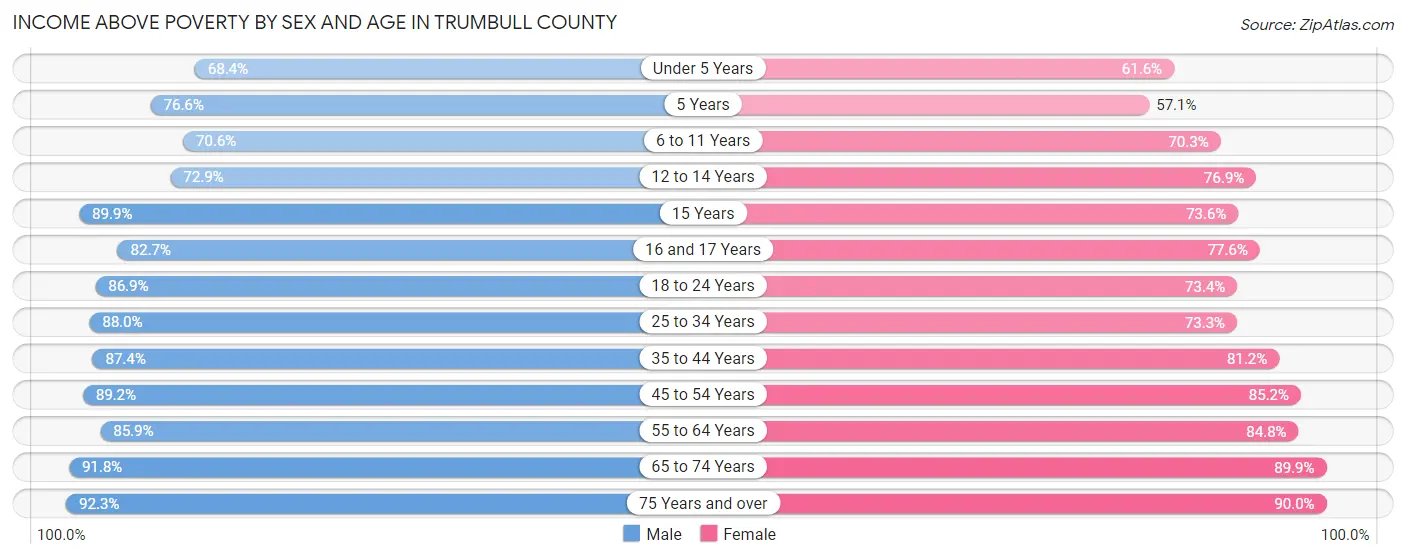
| Age Bracket | Male | Female |
| Under 5 Years | 3,709 (68.4%) | 3,073 (61.6%) |
| 5 Years | 766 (76.6%) | 593 (57.1%) |
| 6 to 11 Years | 5,190 (70.6%) | 4,632 (70.3%) |
| 12 to 14 Years | 2,352 (72.9%) | 2,702 (76.9%) |
| 15 Years | 1,154 (89.9%) | 846 (73.6%) |
| 16 and 17 Years | 2,126 (82.7%) | 2,058 (77.6%) |
| 18 to 24 Years | 7,064 (86.9%) | 5,734 (73.4%) |
| 25 to 34 Years | 10,004 (88.0%) | 8,311 (73.3%) |
| 35 to 44 Years | 9,290 (87.4%) | 8,864 (81.2%) |
| 45 to 54 Years | 10,974 (89.2%) | 10,675 (85.2%) |
| 55 to 64 Years | 12,197 (85.9%) | 12,717 (84.8%) |
| 65 to 74 Years | 10,875 (91.8%) | 12,138 (89.9%) |
| 75 Years and over | 6,711 (92.3%) | 9,223 (89.9%) |
| Total | 82,412 (85.3%) | 81,566 (80.5%) |
Income Below Poverty Among Married-Couple Families in Trumbull County
The poverty statistics for married-couple families in Trumbull County show that 6.1% or 2,213 of the total 36,323 families live below the poverty line. Families with 5 or more children have the highest poverty rate of 70.5%, comprising of 351 families. On the other hand, families with no children have the lowest poverty rate of 4.5%, which includes 1,112 families.
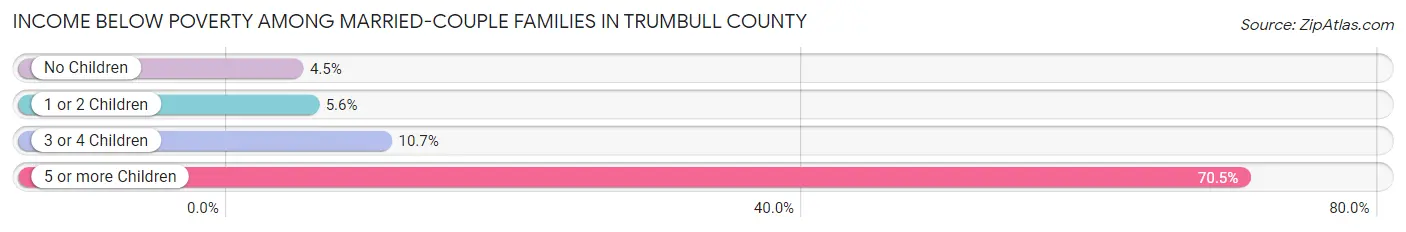
| Children | Above Poverty | Below Poverty |
| No Children | 23,495 (95.5%) | 1,112 (4.5%) |
| 1 or 2 Children | 8,362 (94.4%) | 498 (5.6%) |
| 3 or 4 Children | 2,106 (89.3%) | 252 (10.7%) |
| 5 or more Children | 147 (29.5%) | 351 (70.5%) |
| Total | 34,110 (93.9%) | 2,213 (6.1%) |
Income Below Poverty Among Single-Parent Households in Trumbull County
According to the poverty data in Trumbull County, 14.9% or 678 single-father households and 33.2% or 3,694 single-mother households are living below the poverty line. Among single-father households, those with 3 or 4 children have the highest poverty rate, with 85 households (26.1%) experiencing poverty. Likewise, among single-mother households, those with 5 or more children have the highest poverty rate, with 180 households (100.0%) falling below the poverty line.
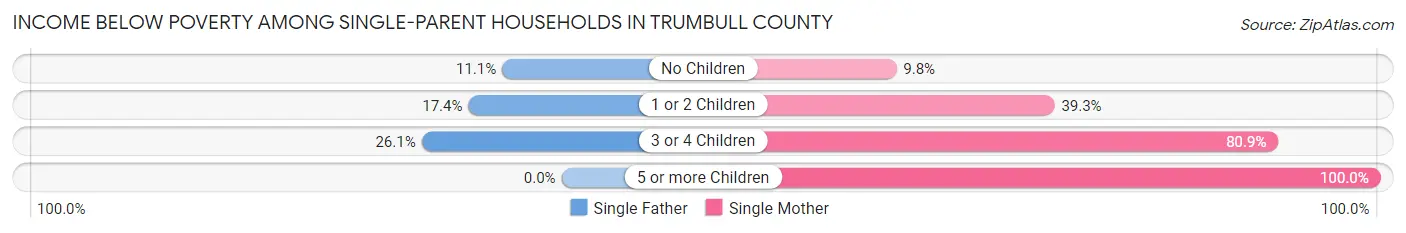
| Children | Single Father | Single Mother |
| No Children | 251 (11.1%) | 437 (9.8%) |
| 1 or 2 Children | 342 (17.4%) | 2,062 (39.3%) |
| 3 or 4 Children | 85 (26.1%) | 1,015 (80.9%) |
| 5 or more Children | 0 (0.0%) | 180 (100.0%) |
| Total | 678 (14.9%) | 3,694 (33.2%) |
Income Below Poverty Among Married-Couple vs Single-Parent Households in Trumbull County
The poverty data for Trumbull County shows that 2,213 of the married-couple family households (6.1%) and 4,372 of the single-parent households (27.8%) are living below the poverty level. Within the married-couple family households, those with 5 or more children have the highest poverty rate, with 351 households (70.5%) falling below the poverty line. Among the single-parent households, those with 5 or more children have the highest poverty rate, with 180 household (100.0%) living below poverty.
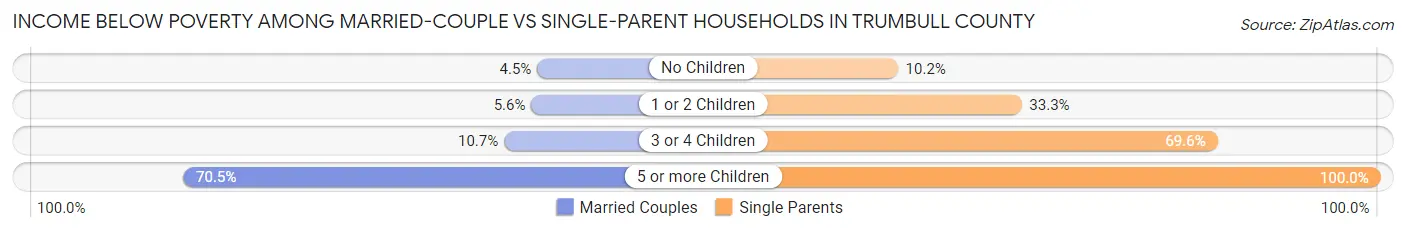
| Children | Married-Couple Families | Single-Parent Households |
| No Children | 1,112 (4.5%) | 688 (10.2%) |
| 1 or 2 Children | 498 (5.6%) | 2,404 (33.3%) |
| 3 or 4 Children | 252 (10.7%) | 1,100 (69.6%) |
| 5 or more Children | 351 (70.5%) | 180 (100.0%) |
| Total | 2,213 (6.1%) | 4,372 (27.8%) |
Employment Characteristics in Trumbull County
Employment by Class of Employer in Trumbull County
Among the 84,556 employed individuals in Trumbull County, private company employees (60,297 | 71.3%), local government employees (6,593 | 7.8%), and not-for-profit organizations (6,530 | 7.7%) make up the most common classes of employment.
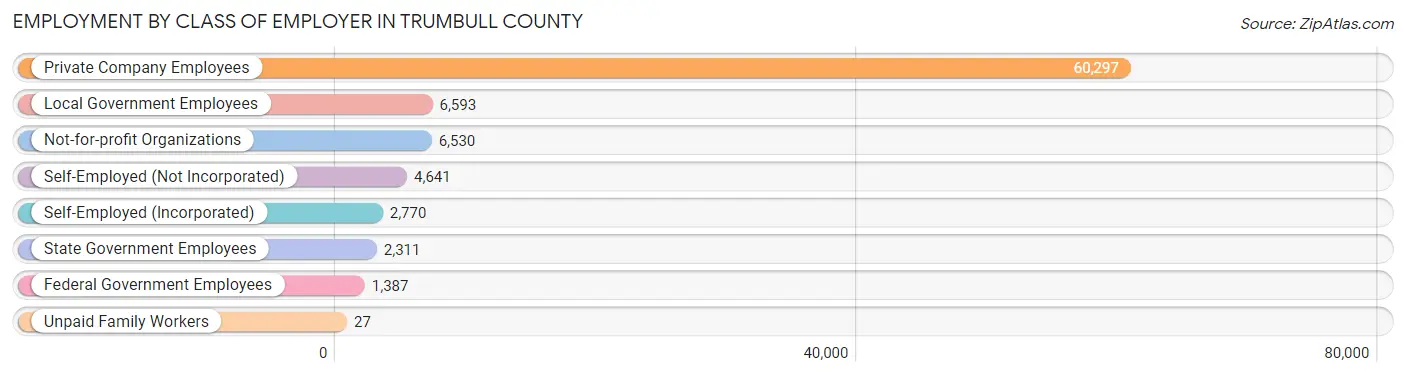
| Employer Class | # Employees | % Employees |
| Private Company Employees | 60,297 | 71.3% |
| Self-Employed (Incorporated) | 2,770 | 3.3% |
| Self-Employed (Not Incorporated) | 4,641 | 5.5% |
| Not-for-profit Organizations | 6,530 | 7.7% |
| Local Government Employees | 6,593 | 7.8% |
| State Government Employees | 2,311 | 2.7% |
| Federal Government Employees | 1,387 | 1.6% |
| Unpaid Family Workers | 27 | 0.0% |
| Total | 84,556 | 100.0% |
Employment Status by Age in Trumbull County
According to the labor force statistics for Trumbull County, out of the total population over 16 years of age (165,725), 54.9% or 90,983 individuals are in the labor force, with 4.8% or 4,367 of them unemployed. The age group with the highest labor force participation rate is 25 to 29 years, with 78.9% or 9,575 individuals in the labor force. Within the labor force, the 16 to 19 years age range has the highest percentage of unemployed individuals, with 13.5% or 520 of them being unemployed.
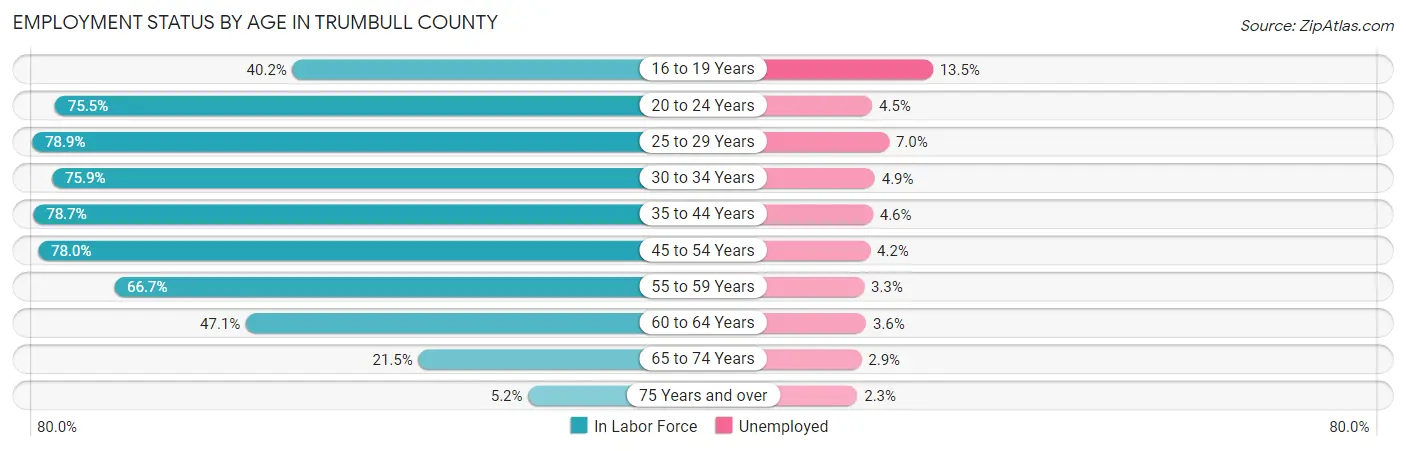
| Age Bracket | In Labor Force | Unemployed |
| 16 to 19 Years | 3,854 (40.2%) | 520 (13.5%) |
| 20 to 24 Years | 8,877 (75.5%) | 399 (4.5%) |
| 25 to 29 Years | 9,575 (78.9%) | 670 (7.0%) |
| 30 to 34 Years | 8,596 (75.9%) | 421 (4.9%) |
| 35 to 44 Years | 17,430 (78.7%) | 802 (4.6%) |
| 45 to 54 Years | 19,498 (78.0%) | 819 (4.2%) |
| 55 to 59 Years | 9,193 (66.7%) | 303 (3.3%) |
| 60 to 64 Years | 7,481 (47.1%) | 269 (3.6%) |
| 65 to 74 Years | 5,524 (21.5%) | 160 (2.9%) |
| 75 Years and over | 958 (5.2%) | 22 (2.3%) |
| Total | 90,983 (54.9%) | 4,367 (4.8%) |
Employment Status by Educational Attainment in Trumbull County
According to labor force statistics for Trumbull County, 71.6% of individuals (71,794) out of the total population between 25 and 64 years of age (100,271) are in the labor force, with 4.6% or 3,303 of them being unemployed. The group with the highest labor force participation rate are those with the educational attainment of bachelor's degree or higher, with 86.5% or 18,370 individuals in the labor force. Within the labor force, individuals with less than high school education have the highest percentage of unemployment, with 10.4% or 501 of them being unemployed.
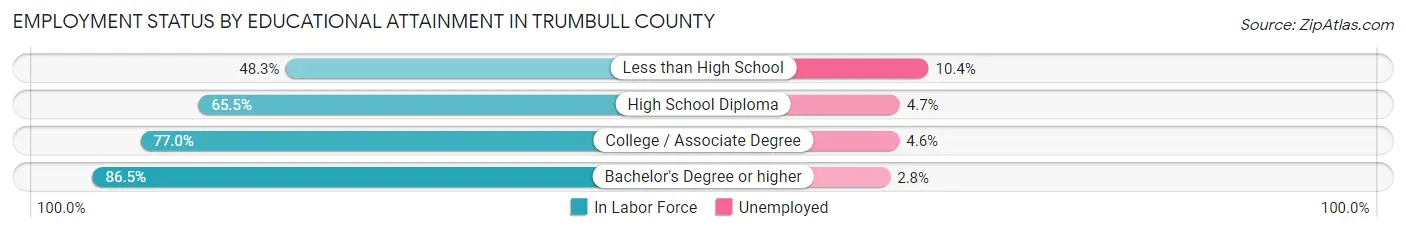
| Educational Attainment | In Labor Force | Unemployed |
| Less than High School | 4,816 (48.3%) | 1,037 (10.4%) |
| High School Diploma | 26,296 (65.5%) | 1,887 (4.7%) |
| College / Associate Degree | 22,265 (77.0%) | 1,330 (4.6%) |
| Bachelor's Degree or higher | 18,370 (86.5%) | 595 (2.8%) |
| Total | 71,794 (71.6%) | 4,612 (4.6%) |
Employment Occupations by Sex in Trumbull County
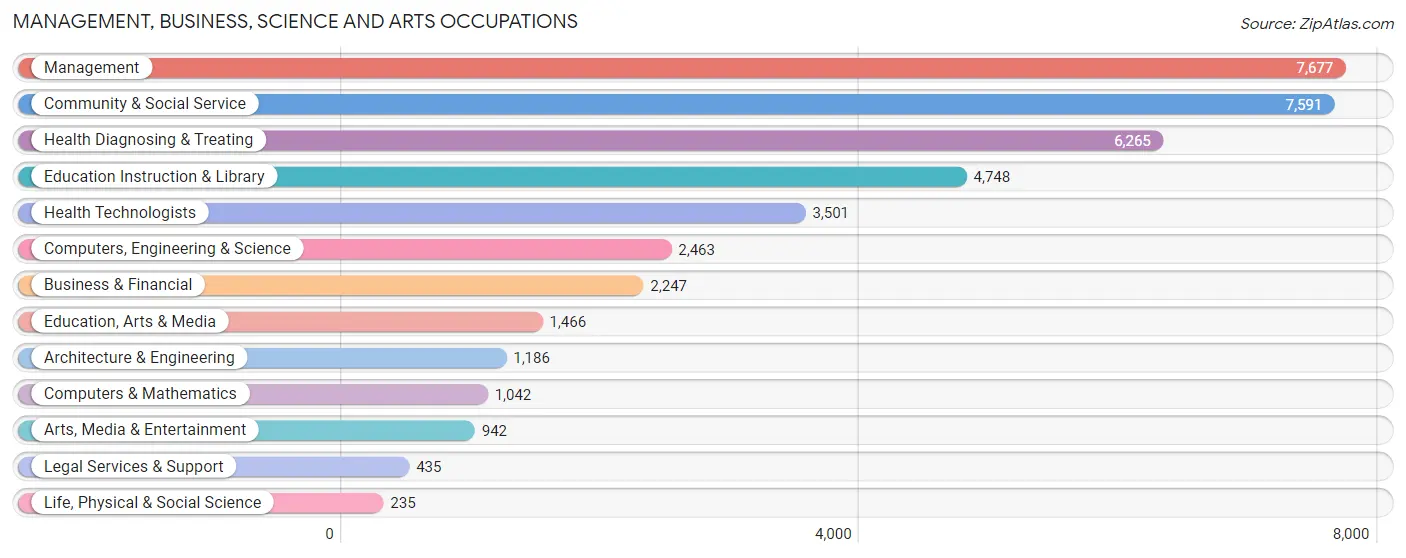
Management, Business, Science and Arts Occupations
The most common Management, Business, Science and Arts occupations in Trumbull County are Management (7,677 | 8.9%), Community & Social Service (7,591 | 8.8%), Health Diagnosing & Treating (6,265 | 7.2%), Education Instruction & Library (4,748 | 5.5%), and Health Technologists (3,501 | 4.1%).
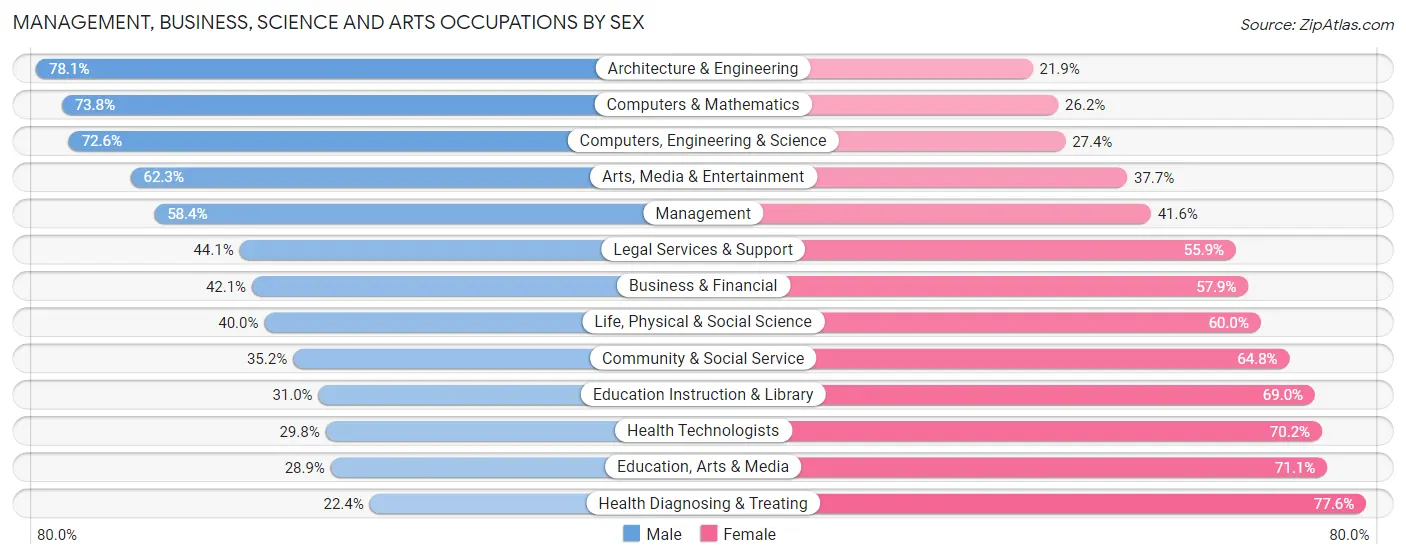
Management, Business, Science and Arts Occupations by Sex
Within the Management, Business, Science and Arts occupations in Trumbull County, the most male-oriented occupations are Architecture & Engineering (78.1%), Computers & Mathematics (73.8%), and Computers, Engineering & Science (72.6%), while the most female-oriented occupations are Health Diagnosing & Treating (77.6%), Education, Arts & Media (71.1%), and Health Technologists (70.2%).
| Occupation | Male | Female |
| Management | 4,480 (58.4%) | 3,197 (41.6%) |
| Business & Financial | 945 (42.1%) | 1,302 (57.9%) |
| Computers, Engineering & Science | 1,789 (72.6%) | 674 (27.4%) |
| Computers & Mathematics | 769 (73.8%) | 273 (26.2%) |
| Architecture & Engineering | 926 (78.1%) | 260 (21.9%) |
| Life, Physical & Social Science | 94 (40.0%) | 141 (60.0%) |
| Community & Social Service | 2,673 (35.2%) | 4,918 (64.8%) |
| Education, Arts & Media | 424 (28.9%) | 1,042 (71.1%) |
| Legal Services & Support | 192 (44.1%) | 243 (55.9%) |
| Education Instruction & Library | 1,470 (31.0%) | 3,278 (69.0%) |
| Arts, Media & Entertainment | 587 (62.3%) | 355 (37.7%) |
| Health Diagnosing & Treating | 1,405 (22.4%) | 4,860 (77.6%) |
| Health Technologists | 1,043 (29.8%) | 2,458 (70.2%) |
| Total (Category) | 11,292 (43.0%) | 14,951 (57.0%) |
| Total (Overall) | 45,350 (52.4%) | 41,118 (47.5%) |
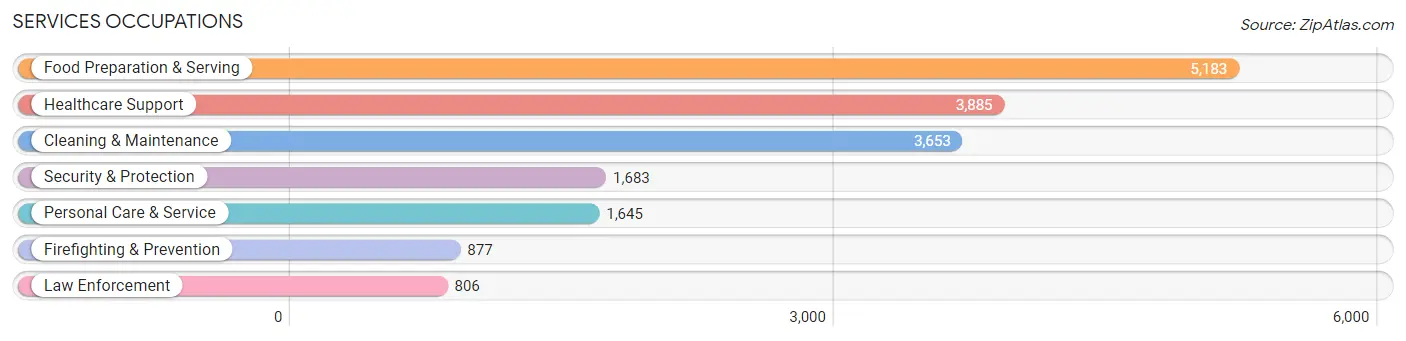
Services Occupations
The most common Services occupations in Trumbull County are Food Preparation & Serving (5,183 | 6.0%), Healthcare Support (3,885 | 4.5%), Cleaning & Maintenance (3,653 | 4.2%), Security & Protection (1,683 | 1.9%), and Personal Care & Service (1,645 | 1.9%).
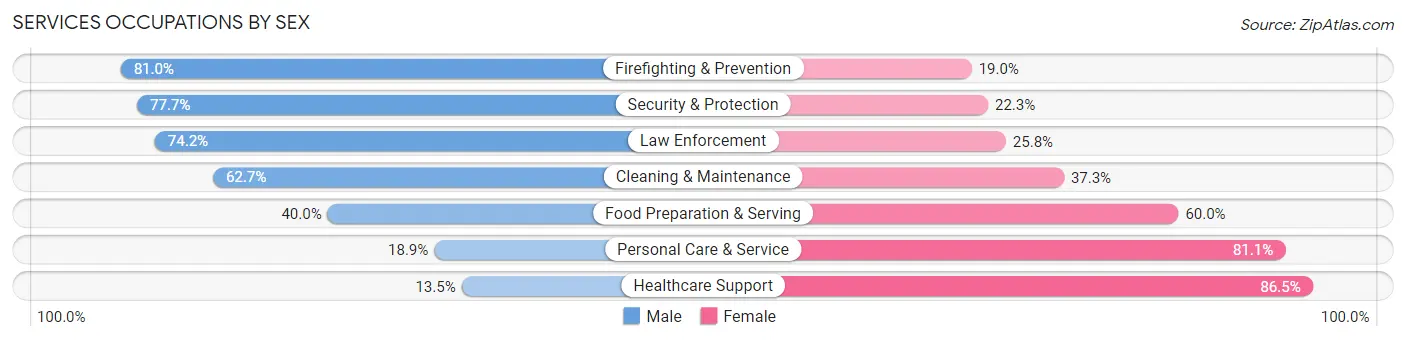
Services Occupations by Sex
Within the Services occupations in Trumbull County, the most male-oriented occupations are Firefighting & Prevention (81.0%), Security & Protection (77.7%), and Law Enforcement (74.2%), while the most female-oriented occupations are Healthcare Support (86.5%), Personal Care & Service (81.1%), and Food Preparation & Serving (60.0%).
| Occupation | Male | Female |
| Healthcare Support | 524 (13.5%) | 3,361 (86.5%) |
| Security & Protection | 1,308 (77.7%) | 375 (22.3%) |
| Firefighting & Prevention | 710 (81.0%) | 167 (19.0%) |
| Law Enforcement | 598 (74.2%) | 208 (25.8%) |
| Food Preparation & Serving | 2,074 (40.0%) | 3,109 (60.0%) |
| Cleaning & Maintenance | 2,290 (62.7%) | 1,363 (37.3%) |
| Personal Care & Service | 311 (18.9%) | 1,334 (81.1%) |
| Total (Category) | 6,507 (40.5%) | 9,542 (59.5%) |
| Total (Overall) | 45,350 (52.4%) | 41,118 (47.5%) |
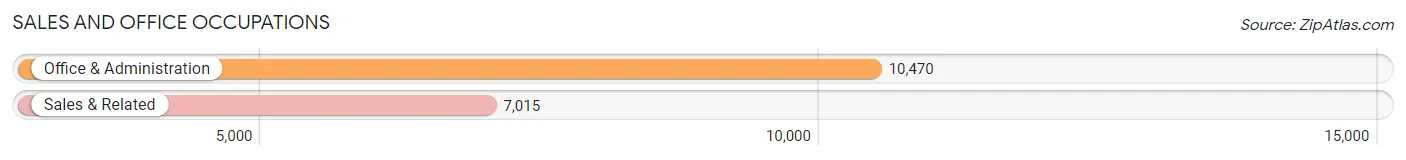
Sales and Office Occupations
The most common Sales and Office occupations in Trumbull County are Office & Administration (10,470 | 12.1%), and Sales & Related (7,015 | 8.1%).
Sales and Office Occupations by Sex
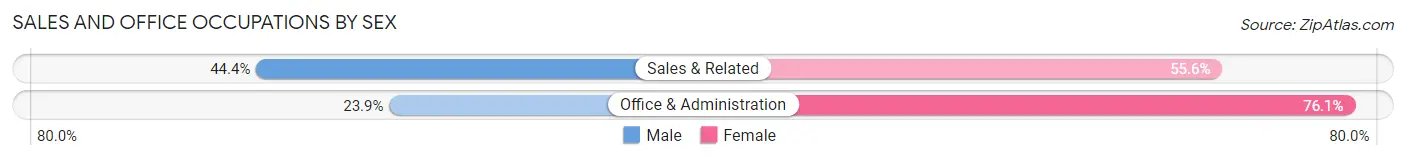
| Occupation | Male | Female |
| Sales & Related | 3,112 (44.4%) | 3,903 (55.6%) |
| Office & Administration | 2,501 (23.9%) | 7,969 (76.1%) |
| Total (Category) | 5,613 (32.1%) | 11,872 (67.9%) |
| Total (Overall) | 45,350 (52.4%) | 41,118 (47.5%) |
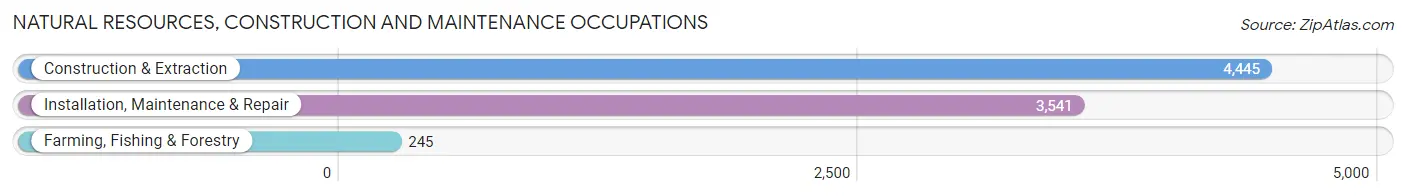
Natural Resources, Construction and Maintenance Occupations
The most common Natural Resources, Construction and Maintenance occupations in Trumbull County are Construction & Extraction (4,445 | 5.1%), Installation, Maintenance & Repair (3,541 | 4.1%), and Farming, Fishing & Forestry (245 | 0.3%).
Natural Resources, Construction and Maintenance Occupations by Sex
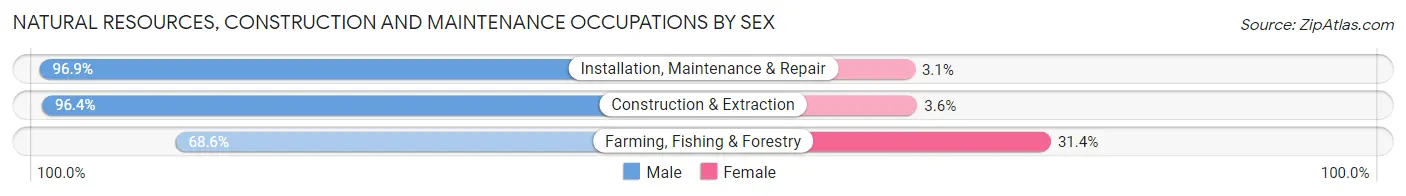
| Occupation | Male | Female |
| Farming, Fishing & Forestry | 168 (68.6%) | 77 (31.4%) |
| Construction & Extraction | 4,283 (96.4%) | 162 (3.6%) |
| Installation, Maintenance & Repair | 3,430 (96.9%) | 111 (3.1%) |
| Total (Category) | 7,881 (95.8%) | 350 (4.3%) |
| Total (Overall) | 45,350 (52.4%) | 41,118 (47.5%) |
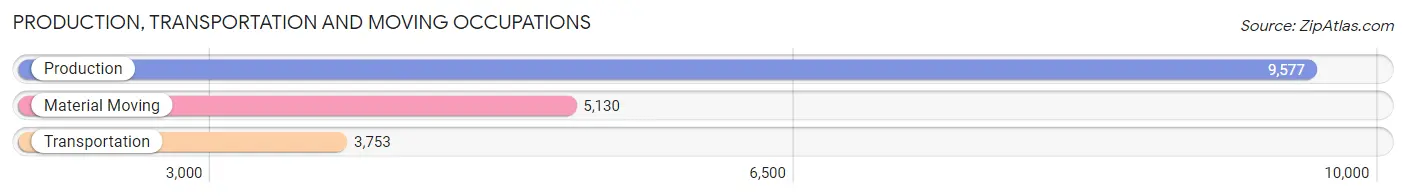
Production, Transportation and Moving Occupations
The most common Production, Transportation and Moving occupations in Trumbull County are Production (9,577 | 11.1%), Material Moving (5,130 | 5.9%), and Transportation (3,753 | 4.3%).
Production, Transportation and Moving Occupations by Sex
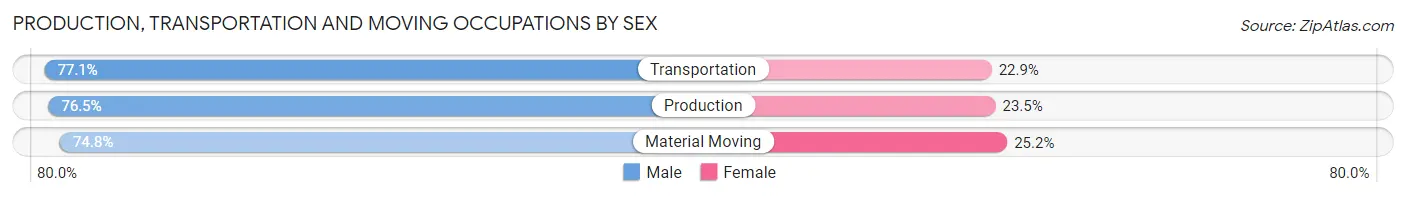
| Occupation | Male | Female |
| Production | 7,327 (76.5%) | 2,250 (23.5%) |
| Transportation | 2,893 (77.1%) | 860 (22.9%) |
| Material Moving | 3,837 (74.8%) | 1,293 (25.2%) |
| Total (Category) | 14,057 (76.1%) | 4,403 (23.8%) |
| Total (Overall) | 45,350 (52.4%) | 41,118 (47.5%) |
Employment Industries by Sex in Trumbull County
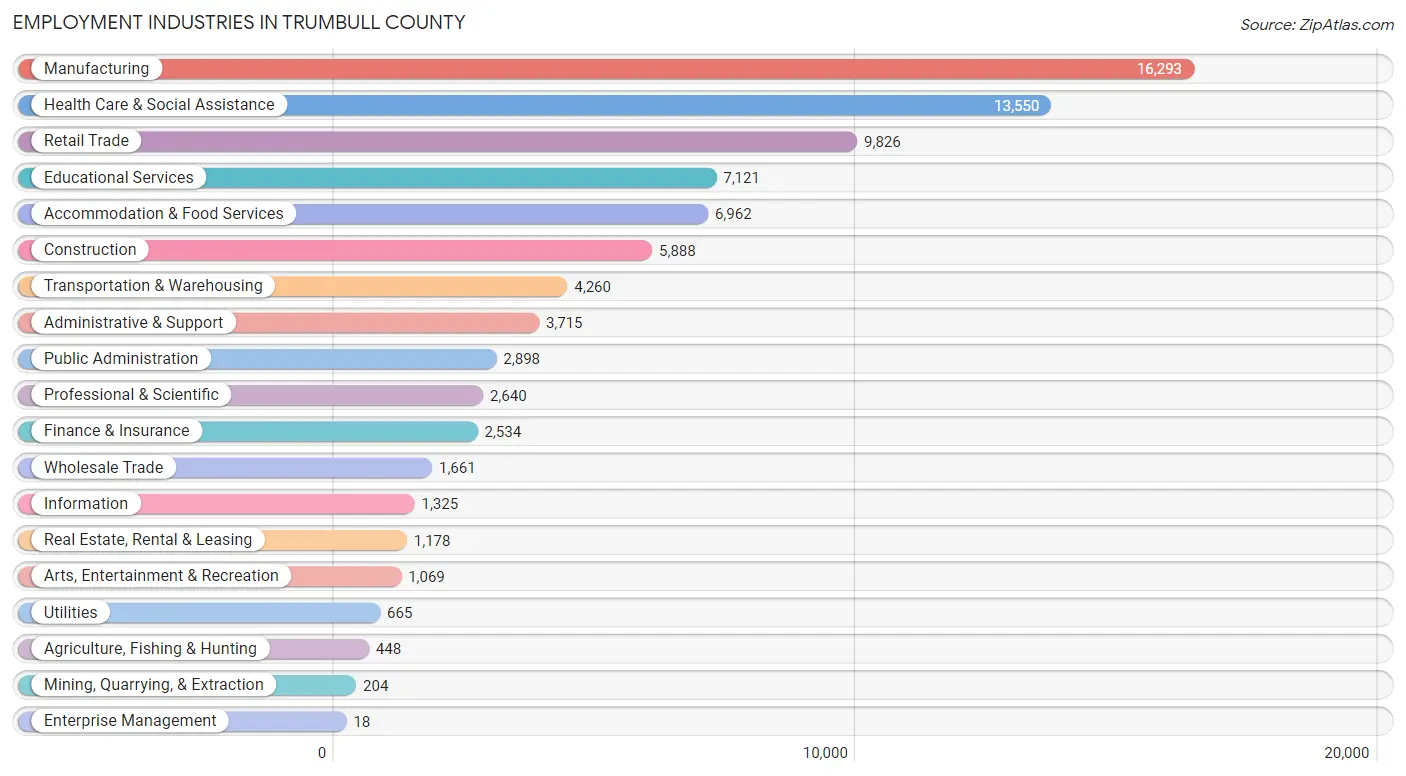
Employment Industries in Trumbull County
The major employment industries in Trumbull County include Manufacturing (16,293 | 18.8%), Health Care & Social Assistance (13,550 | 15.7%), Retail Trade (9,826 | 11.4%), Educational Services (7,121 | 8.2%), and Accommodation & Food Services (6,962 | 8.1%).
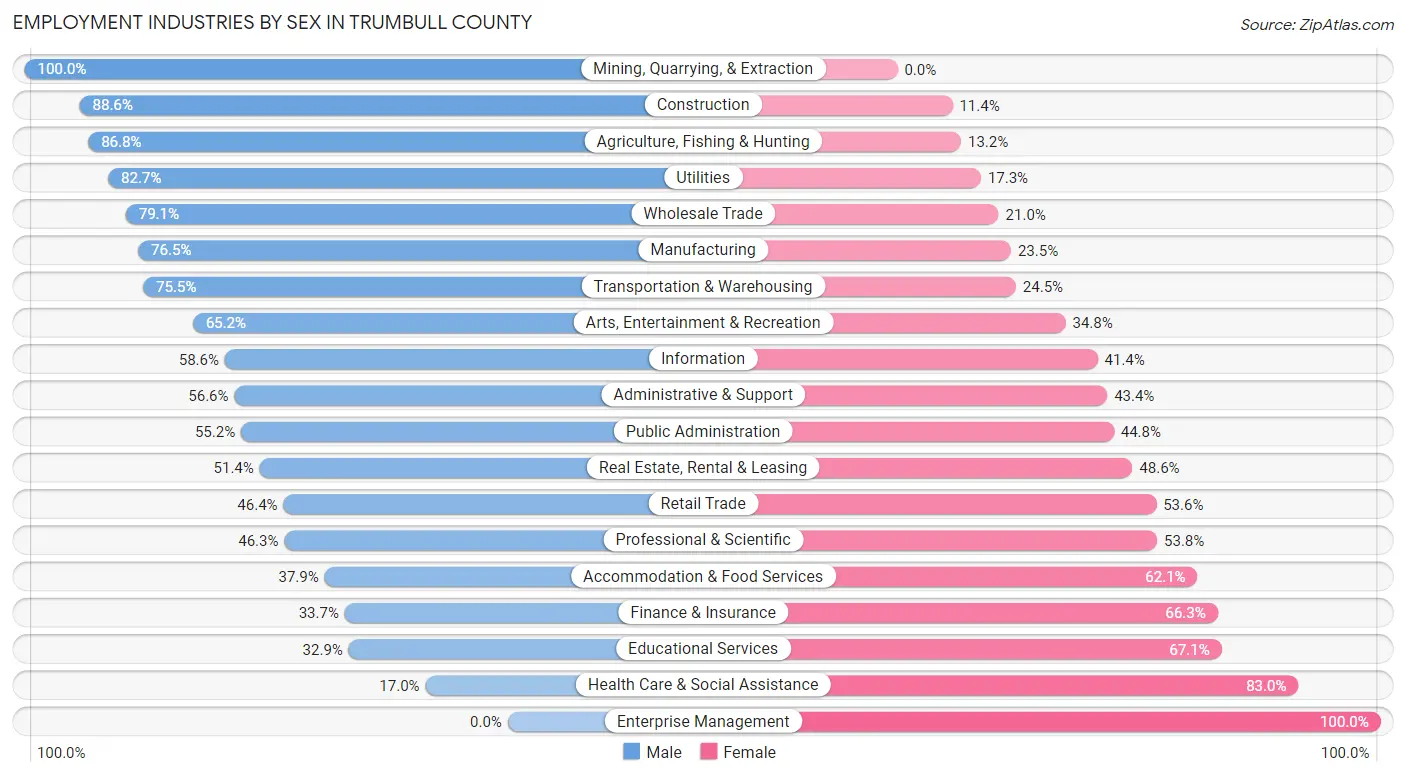
Employment Industries by Sex in Trumbull County
The Trumbull County industries that see more men than women are Mining, Quarrying, & Extraction (100.0%), Construction (88.6%), and Agriculture, Fishing & Hunting (86.8%), whereas the industries that tend to have a higher number of women are Enterprise Management (100.0%), Health Care & Social Assistance (83.0%), and Educational Services (67.1%).
| Industry | Male | Female |
| Agriculture, Fishing & Hunting | 389 (86.8%) | 59 (13.2%) |
| Mining, Quarrying, & Extraction | 204 (100.0%) | 0 (0.0%) |
| Construction | 5,217 (88.6%) | 671 (11.4%) |
| Manufacturing | 12,463 (76.5%) | 3,830 (23.5%) |
| Wholesale Trade | 1,313 (79.0%) | 348 (20.9%) |
| Retail Trade | 4,562 (46.4%) | 5,264 (53.6%) |
| Transportation & Warehousing | 3,215 (75.5%) | 1,045 (24.5%) |
| Utilities | 550 (82.7%) | 115 (17.3%) |
| Information | 776 (58.6%) | 549 (41.4%) |
| Finance & Insurance | 855 (33.7%) | 1,679 (66.3%) |
| Real Estate, Rental & Leasing | 605 (51.4%) | 573 (48.6%) |
| Professional & Scientific | 1,221 (46.3%) | 1,419 (53.7%) |
| Enterprise Management | 0 (0.0%) | 18 (100.0%) |
| Administrative & Support | 2,102 (56.6%) | 1,613 (43.4%) |
| Educational Services | 2,344 (32.9%) | 4,777 (67.1%) |
| Health Care & Social Assistance | 2,309 (17.0%) | 11,241 (83.0%) |
| Arts, Entertainment & Recreation | 697 (65.2%) | 372 (34.8%) |
| Accommodation & Food Services | 2,639 (37.9%) | 4,323 (62.1%) |
| Public Administration | 1,600 (55.2%) | 1,298 (44.8%) |
| Total | 45,350 (52.4%) | 41,118 (47.5%) |
Education in Trumbull County
School Enrollment in Trumbull County
The most common levels of schooling among the 39,778 students in Trumbull County are high school (10,142 | 25.5%), middle school (9,489 | 23.8%), and elementary school (8,738 | 22.0%).
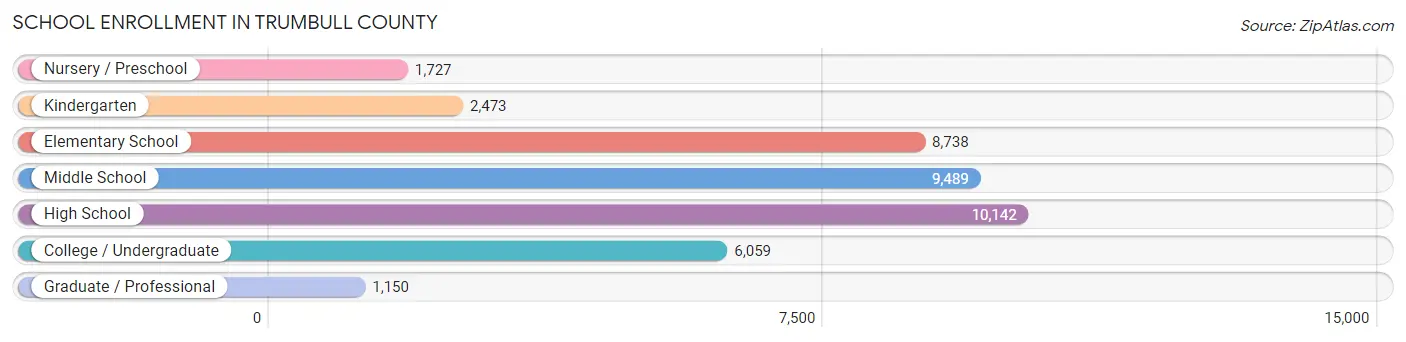
| School Level | # Students | % Students |
| Nursery / Preschool | 1,727 | 4.3% |
| Kindergarten | 2,473 | 6.2% |
| Elementary School | 8,738 | 22.0% |
| Middle School | 9,489 | 23.8% |
| High School | 10,142 | 25.5% |
| College / Undergraduate | 6,059 | 15.2% |
| Graduate / Professional | 1,150 | 2.9% |
| Total | 39,778 | 100.0% |
School Enrollment by Age by Funding Source in Trumbull County
Out of a total of 39,778 students who are enrolled in schools in Trumbull County, 4,137 (10.4%) attend a private institution, while the remaining 35,641 (89.6%) are enrolled in public schools. The age group of 35 years and over has the highest likelihood of being enrolled in private schools, with 394 (24.7% in the age bracket) enrolled. Conversely, the age group of 20 to 24 year olds has the lowest likelihood of being enrolled in a private school, with 2,825 (94.7% in the age bracket) attending a public institution.
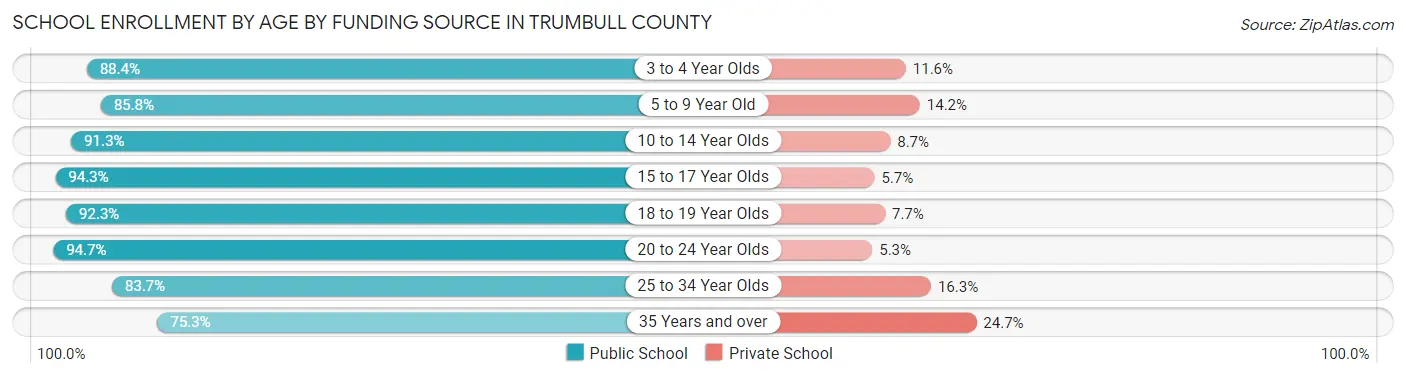
| Age Bracket | Public School | Private School |
| 3 to 4 Year Olds | 1,321 (88.4%) | 173 (11.6%) |
| 5 to 9 Year Old | 8,679 (85.8%) | 1,435 (14.2%) |
| 10 to 14 Year Olds | 10,642 (91.3%) | 1,011 (8.7%) |
| 15 to 17 Year Olds | 6,618 (94.3%) | 403 (5.7%) |
| 18 to 19 Year Olds | 2,553 (92.3%) | 213 (7.7%) |
| 20 to 24 Year Olds | 2,825 (94.7%) | 159 (5.3%) |
| 25 to 34 Year Olds | 1,802 (83.7%) | 350 (16.3%) |
| 35 Years and over | 1,200 (75.3%) | 394 (24.7%) |
| Total | 35,641 (89.6%) | 4,137 (10.4%) |
Educational Attainment by Field of Study in Trumbull County
Business (5,740 | 18.7%), education (5,694 | 18.6%), science & technology (4,552 | 14.8%), arts & humanities (2,326 | 7.6%), and engineering (2,225 | 7.3%) are the most common fields of study among 30,656 individuals in Trumbull County who have obtained a bachelor's degree or higher.
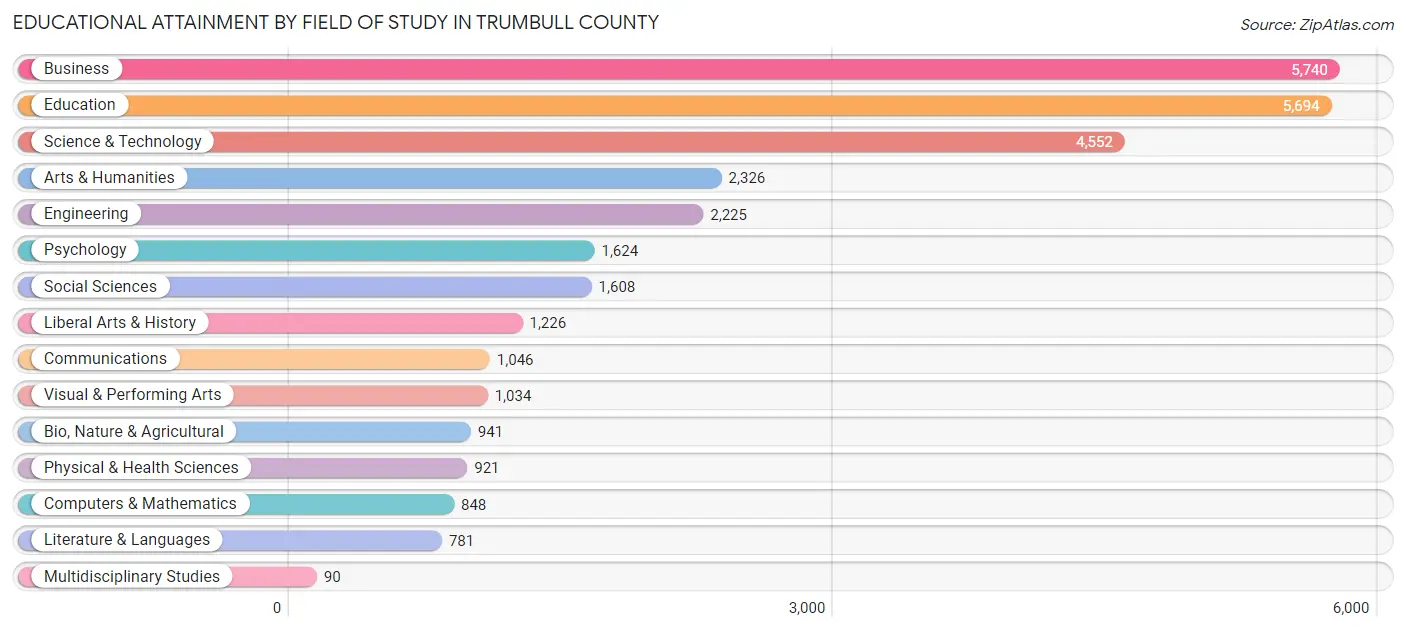
| Field of Study | # Graduates | % Graduates |
| Computers & Mathematics | 848 | 2.8% |
| Bio, Nature & Agricultural | 941 | 3.1% |
| Physical & Health Sciences | 921 | 3.0% |
| Psychology | 1,624 | 5.3% |
| Social Sciences | 1,608 | 5.2% |
| Engineering | 2,225 | 7.3% |
| Multidisciplinary Studies | 90 | 0.3% |
| Science & Technology | 4,552 | 14.8% |
| Business | 5,740 | 18.7% |
| Education | 5,694 | 18.6% |
| Literature & Languages | 781 | 2.5% |
| Liberal Arts & History | 1,226 | 4.0% |
| Visual & Performing Arts | 1,034 | 3.4% |
| Communications | 1,046 | 3.4% |
| Arts & Humanities | 2,326 | 7.6% |
| Total | 30,656 | 100.0% |
Transportation & Commute in Trumbull County
Vehicle Availability by Sex in Trumbull County
The most prevalent vehicle ownership categories in Trumbull County are males with 2 vehicles (19,123, accounting for 43.0%) and females with 2 vehicles (17,337, making up 47.8%).
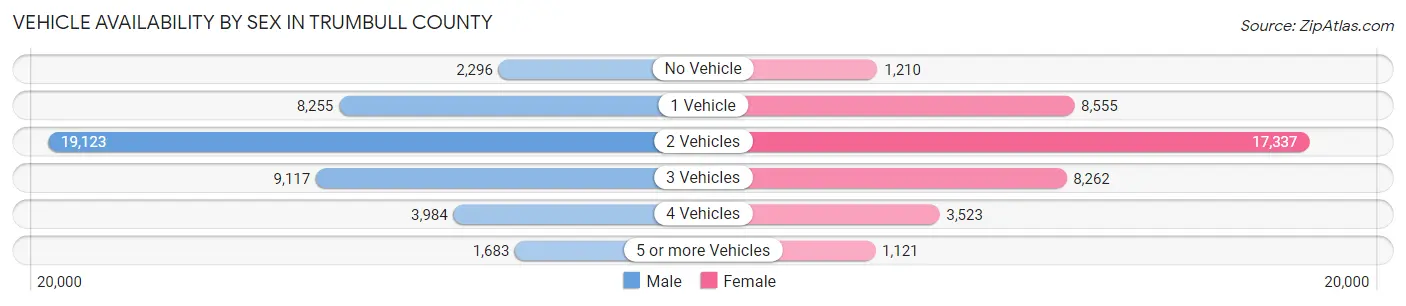
| Vehicles Available | Male | Female |
| No Vehicle | 2,296 (5.2%) | 1,210 (3.0%) |
| 1 Vehicle | 8,255 (18.6%) | 8,555 (21.4%) |
| 2 Vehicles | 19,123 (43.0%) | 17,337 (43.3%) |
| 3 Vehicles | 9,117 (20.5%) | 8,262 (20.6%) |
| 4 Vehicles | 3,984 (9.0%) | 3,523 (8.8%) |
| 5 or more Vehicles | 1,683 (3.8%) | 1,121 (2.8%) |
| Total | 44,458 (100.0%) | 40,008 (100.0%) |
Commute Time in Trumbull County
The most frequently occuring commute durations in Trumbull County are 15 to 19 minutes (13,507 commuters, 16.9%), 20 to 24 minutes (13,233 commuters, 16.6%), and 10 to 14 minutes (11,476 commuters, 14.4%).
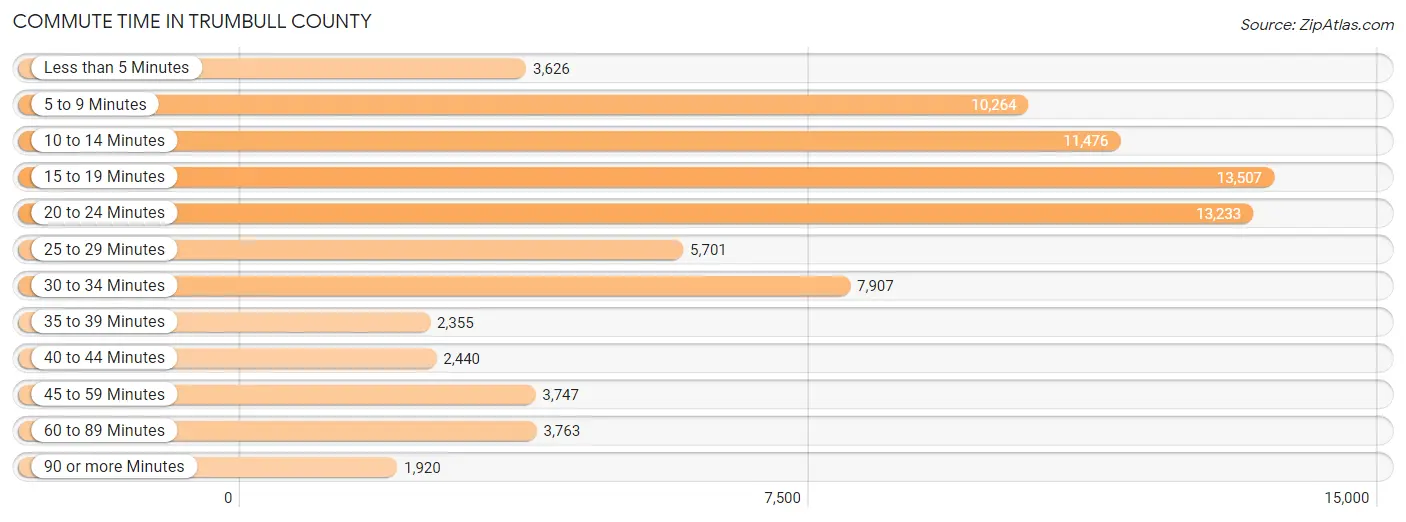
| Commute Time | # Commuters | % Commuters |
| Less than 5 Minutes | 3,626 | 4.5% |
| 5 to 9 Minutes | 10,264 | 12.8% |
| 10 to 14 Minutes | 11,476 | 14.4% |
| 15 to 19 Minutes | 13,507 | 16.9% |
| 20 to 24 Minutes | 13,233 | 16.6% |
| 25 to 29 Minutes | 5,701 | 7.1% |
| 30 to 34 Minutes | 7,907 | 9.9% |
| 35 to 39 Minutes | 2,355 | 2.9% |
| 40 to 44 Minutes | 2,440 | 3.0% |
| 45 to 59 Minutes | 3,747 | 4.7% |
| 60 to 89 Minutes | 3,763 | 4.7% |
| 90 or more Minutes | 1,920 | 2.4% |
Commute Time by Sex in Trumbull County
The most common commute times in Trumbull County are 15 to 19 minutes (7,175 commuters, 17.0%) for males and 10 to 14 minutes (6,403 commuters, 16.9%) for females.
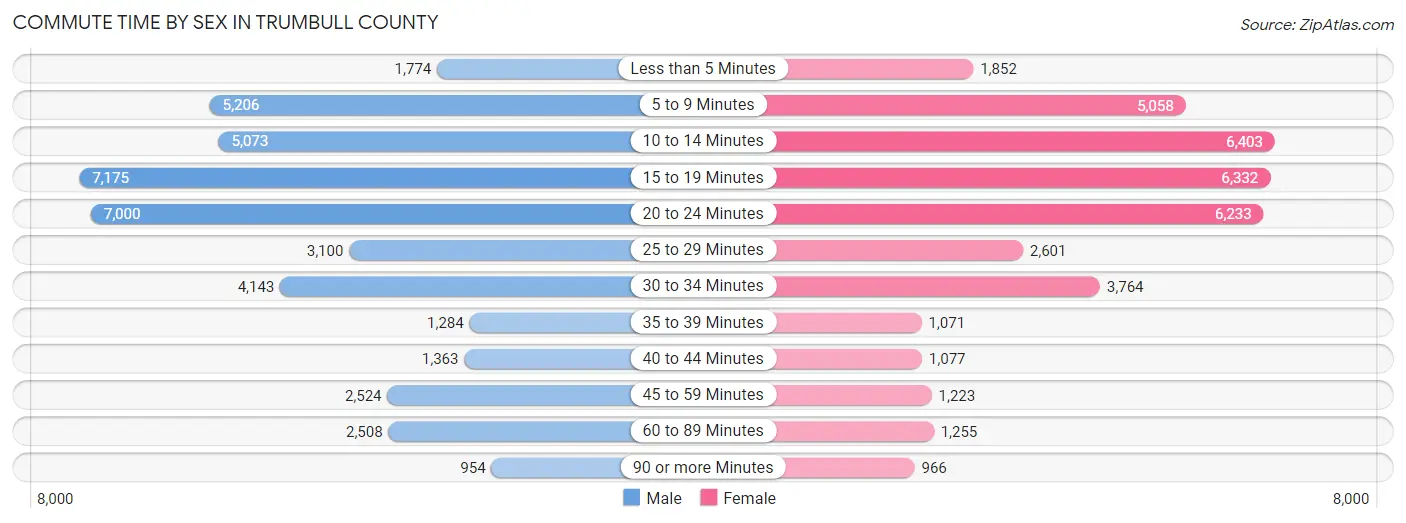
| Commute Time | Male | Female |
| Less than 5 Minutes | 1,774 (4.2%) | 1,852 (4.9%) |
| 5 to 9 Minutes | 5,206 (12.4%) | 5,058 (13.4%) |
| 10 to 14 Minutes | 5,073 (12.0%) | 6,403 (16.9%) |
| 15 to 19 Minutes | 7,175 (17.0%) | 6,332 (16.7%) |
| 20 to 24 Minutes | 7,000 (16.6%) | 6,233 (16.5%) |
| 25 to 29 Minutes | 3,100 (7.4%) | 2,601 (6.9%) |
| 30 to 34 Minutes | 4,143 (9.8%) | 3,764 (10.0%) |
| 35 to 39 Minutes | 1,284 (3.0%) | 1,071 (2.8%) |
| 40 to 44 Minutes | 1,363 (3.2%) | 1,077 (2.9%) |
| 45 to 59 Minutes | 2,524 (6.0%) | 1,223 (3.2%) |
| 60 to 89 Minutes | 2,508 (6.0%) | 1,255 (3.3%) |
| 90 or more Minutes | 954 (2.3%) | 966 (2.5%) |
Time of Departure to Work by Sex in Trumbull County
The most frequent times of departure to work in Trumbull County are 7:00 AM to 7:29 AM (5,095, 12.1%) for males and 7:00 AM to 7:29 AM (5,415, 14.3%) for females.
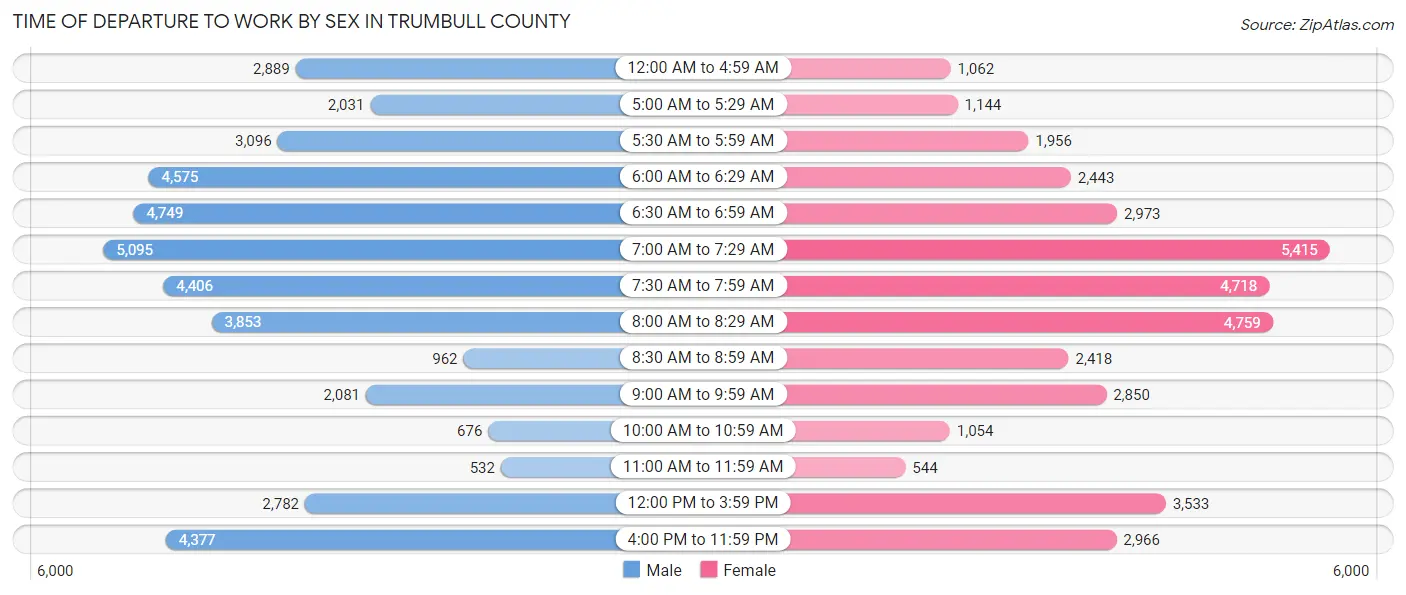
| Time of Departure | Male | Female |
| 12:00 AM to 4:59 AM | 2,889 (6.9%) | 1,062 (2.8%) |
| 5:00 AM to 5:29 AM | 2,031 (4.8%) | 1,144 (3.0%) |
| 5:30 AM to 5:59 AM | 3,096 (7.3%) | 1,956 (5.2%) |
| 6:00 AM to 6:29 AM | 4,575 (10.9%) | 2,443 (6.5%) |
| 6:30 AM to 6:59 AM | 4,749 (11.3%) | 2,973 (7.9%) |
| 7:00 AM to 7:29 AM | 5,095 (12.1%) | 5,415 (14.3%) |
| 7:30 AM to 7:59 AM | 4,406 (10.5%) | 4,718 (12.5%) |
| 8:00 AM to 8:29 AM | 3,853 (9.1%) | 4,759 (12.6%) |
| 8:30 AM to 8:59 AM | 962 (2.3%) | 2,418 (6.4%) |
| 9:00 AM to 9:59 AM | 2,081 (4.9%) | 2,850 (7.5%) |
| 10:00 AM to 10:59 AM | 676 (1.6%) | 1,054 (2.8%) |
| 11:00 AM to 11:59 AM | 532 (1.3%) | 544 (1.4%) |
| 12:00 PM to 3:59 PM | 2,782 (6.6%) | 3,533 (9.3%) |
| 4:00 PM to 11:59 PM | 4,377 (10.4%) | 2,966 (7.8%) |
| Total | 42,104 (100.0%) | 37,835 (100.0%) |
Housing Occupancy in Trumbull County
Occupancy by Ownership in Trumbull County
Of the total 85,042 dwellings in Trumbull County, owner-occupied units account for 61,012 (71.7%), while renter-occupied units make up 24,030 (28.3%).
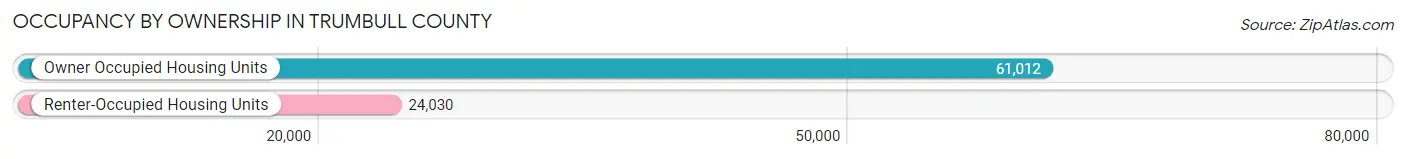
| Occupancy | # Housing Units | % Housing Units |
| Owner Occupied Housing Units | 61,012 | 71.7% |
| Renter-Occupied Housing Units | 24,030 | 28.3% |
| Total Occupied Housing Units | 85,042 | 100.0% |
Occupancy by Household Size in Trumbull County
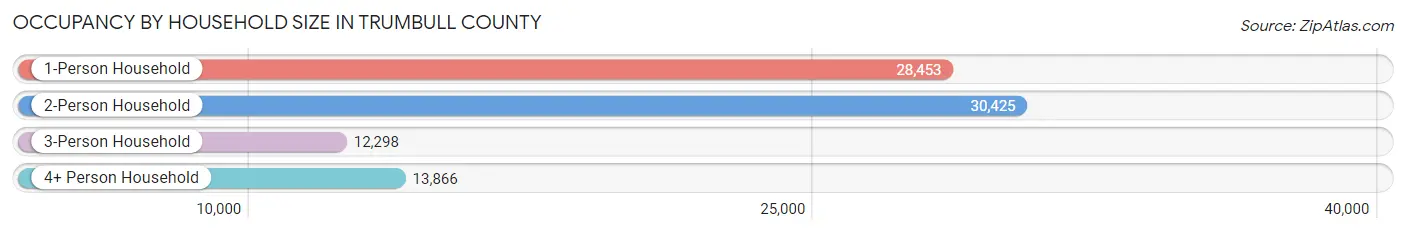
| Household Size | # Housing Units | % Housing Units |
| 1-Person Household | 28,453 | 33.5% |
| 2-Person Household | 30,425 | 35.8% |
| 3-Person Household | 12,298 | 14.5% |
| 4+ Person Household | 13,866 | 16.3% |
| Total Housing Units | 85,042 | 100.0% |
Occupancy by Ownership by Household Size in Trumbull County
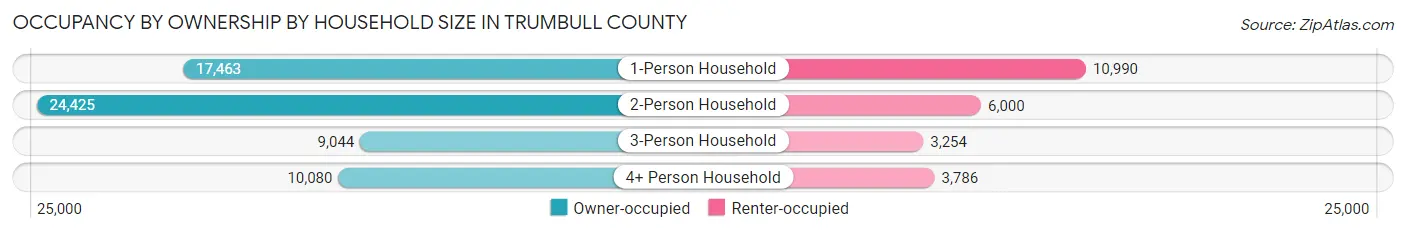
| Household Size | Owner-occupied | Renter-occupied |
| 1-Person Household | 17,463 (61.4%) | 10,990 (38.6%) |
| 2-Person Household | 24,425 (80.3%) | 6,000 (19.7%) |
| 3-Person Household | 9,044 (73.5%) | 3,254 (26.5%) |
| 4+ Person Household | 10,080 (72.7%) | 3,786 (27.3%) |
| Total Housing Units | 61,012 (71.7%) | 24,030 (28.3%) |
Occupancy by Educational Attainment in Trumbull County
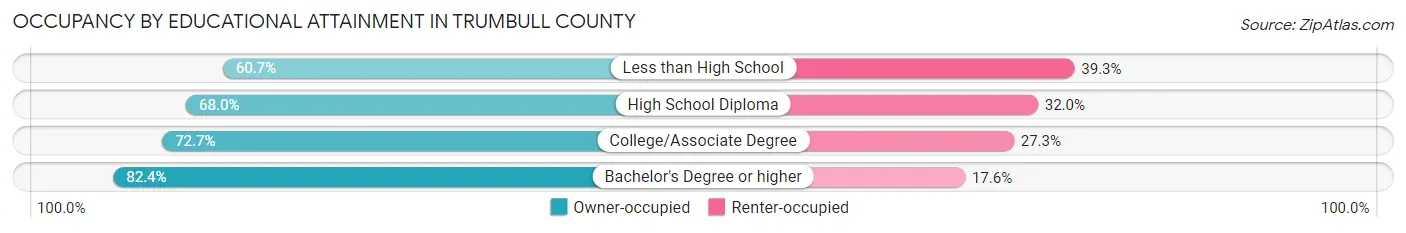
| Household Size | Owner-occupied | Renter-occupied |
| Less than High School | 4,568 (60.7%) | 2,957 (39.3%) |
| High School Diploma | 23,695 (68.0%) | 11,171 (32.0%) |
| College/Associate Degree | 17,969 (72.7%) | 6,743 (27.3%) |
| Bachelor's Degree or higher | 14,780 (82.4%) | 3,159 (17.6%) |
Occupancy by Age of Householder in Trumbull County
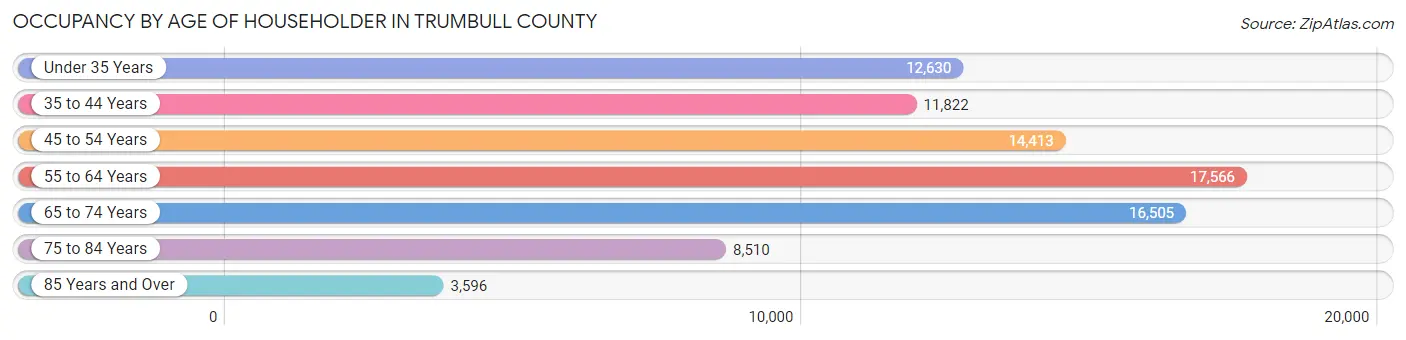
| Age Bracket | # Households | % Households |
| Under 35 Years | 12,630 | 14.8% |
| 35 to 44 Years | 11,822 | 13.9% |
| 45 to 54 Years | 14,413 | 17.0% |
| 55 to 64 Years | 17,566 | 20.7% |
| 65 to 74 Years | 16,505 | 19.4% |
| 75 to 84 Years | 8,510 | 10.0% |
| 85 Years and Over | 3,596 | 4.2% |
| Total | 85,042 | 100.0% |
Housing Finances in Trumbull County
Median Income by Occupancy in Trumbull County
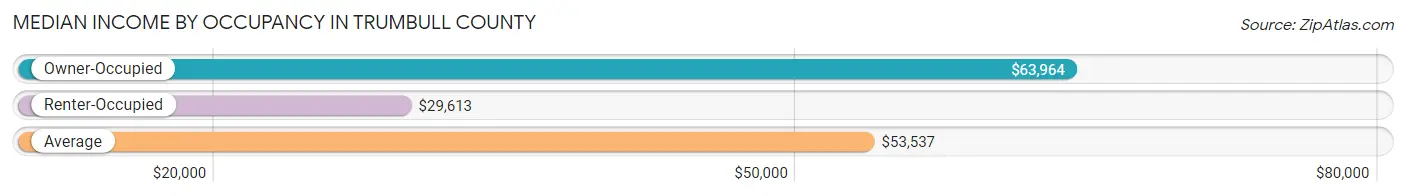
| Occupancy Type | # Households | Median Income |
| Owner-Occupied | 61,012 (71.7%) | $63,964 |
| Renter-Occupied | 24,030 (28.3%) | $29,613 |
| Average | 85,042 (100.0%) | $53,537 |
Occupancy by Householder Income Bracket in Trumbull County
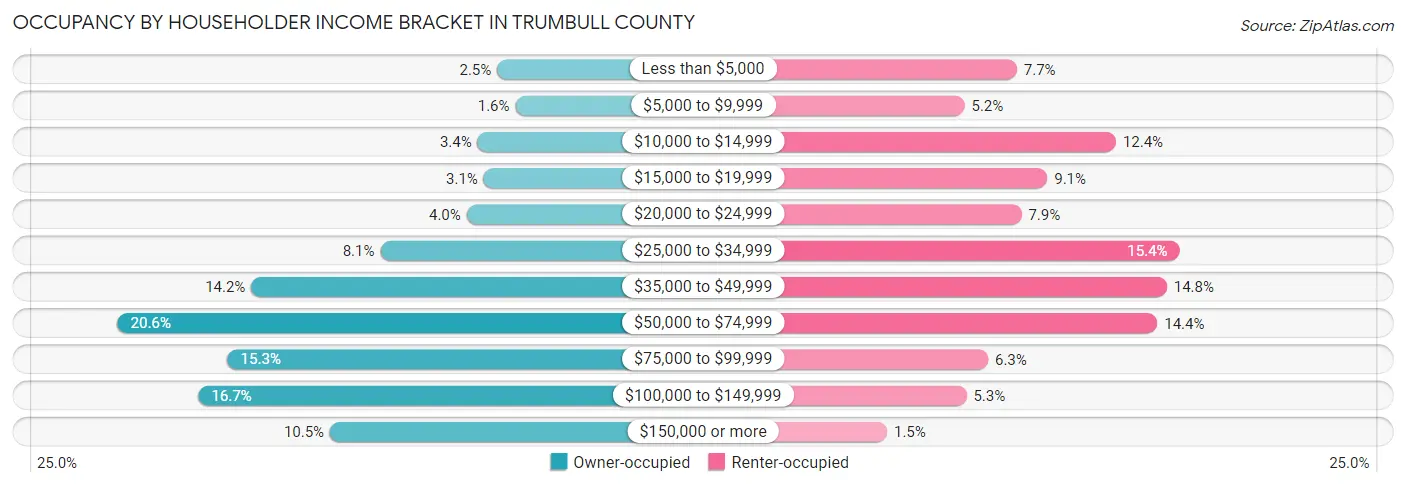
| Income Bracket | Owner-occupied | Renter-occupied |
| Less than $5,000 | 1,523 (2.5%) | 1,845 (7.7%) |
| $5,000 to $9,999 | 993 (1.6%) | 1,246 (5.2%) |
| $10,000 to $14,999 | 2,093 (3.4%) | 2,980 (12.4%) |
| $15,000 to $19,999 | 1,913 (3.1%) | 2,195 (9.1%) |
| $20,000 to $24,999 | 2,413 (4.0%) | 1,899 (7.9%) |
| $25,000 to $34,999 | 4,919 (8.1%) | 3,705 (15.4%) |
| $35,000 to $49,999 | 8,668 (14.2%) | 3,561 (14.8%) |
| $50,000 to $74,999 | 12,552 (20.6%) | 3,454 (14.4%) |
| $75,000 to $99,999 | 9,355 (15.3%) | 1,517 (6.3%) |
| $100,000 to $149,999 | 10,200 (16.7%) | 1,268 (5.3%) |
| $150,000 or more | 6,383 (10.5%) | 360 (1.5%) |
| Total | 61,012 (100.0%) | 24,030 (100.0%) |
Monthly Housing Cost Tiers in Trumbull County
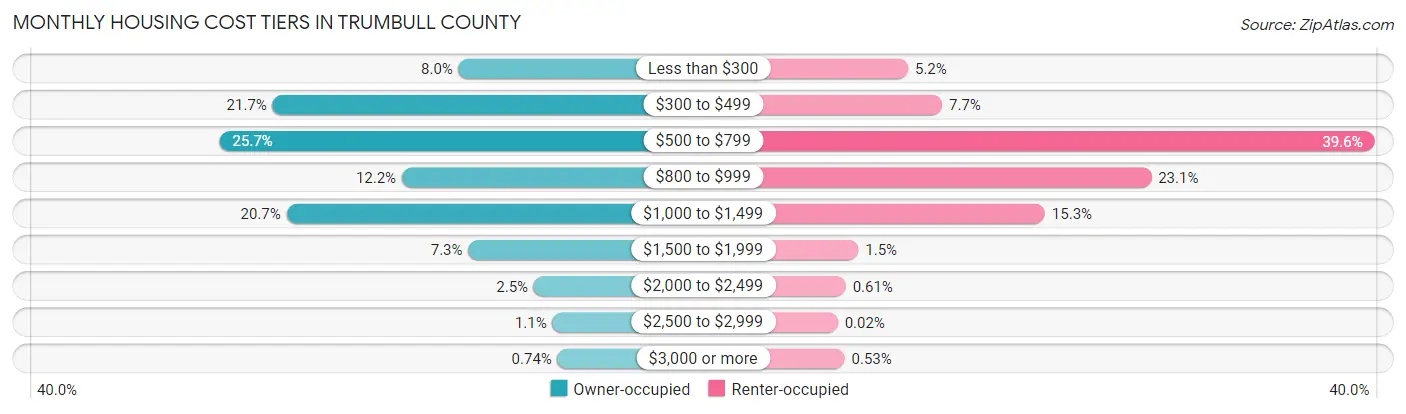
| Monthly Cost | Owner-occupied | Renter-occupied |
| Less than $300 | 4,902 (8.0%) | 1,249 (5.2%) |
| $300 to $499 | 13,259 (21.7%) | 1,853 (7.7%) |
| $500 to $799 | 15,648 (25.7%) | 9,503 (39.6%) |
| $800 to $999 | 7,447 (12.2%) | 5,553 (23.1%) |
| $1,000 to $1,499 | 12,634 (20.7%) | 3,672 (15.3%) |
| $1,500 to $1,999 | 4,467 (7.3%) | 371 (1.5%) |
| $2,000 to $2,499 | 1,519 (2.5%) | 147 (0.6%) |
| $2,500 to $2,999 | 684 (1.1%) | 6 (0.0%) |
| $3,000 or more | 452 (0.7%) | 127 (0.5%) |
| Total | 61,012 (100.0%) | 24,030 (100.0%) |
Physical Housing Characteristics in Trumbull County
Housing Structures in Trumbull County
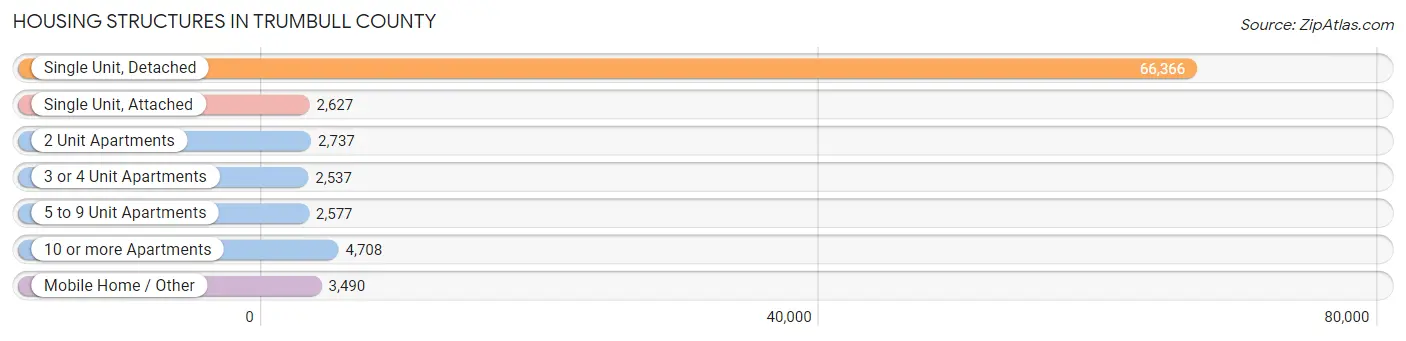
| Structure Type | # Housing Units | % Housing Units |
| Single Unit, Detached | 66,366 | 78.0% |
| Single Unit, Attached | 2,627 | 3.1% |
| 2 Unit Apartments | 2,737 | 3.2% |
| 3 or 4 Unit Apartments | 2,537 | 3.0% |
| 5 to 9 Unit Apartments | 2,577 | 3.0% |
| 10 or more Apartments | 4,708 | 5.5% |
| Mobile Home / Other | 3,490 | 4.1% |
| Total | 85,042 | 100.0% |
Housing Structures by Occupancy in Trumbull County
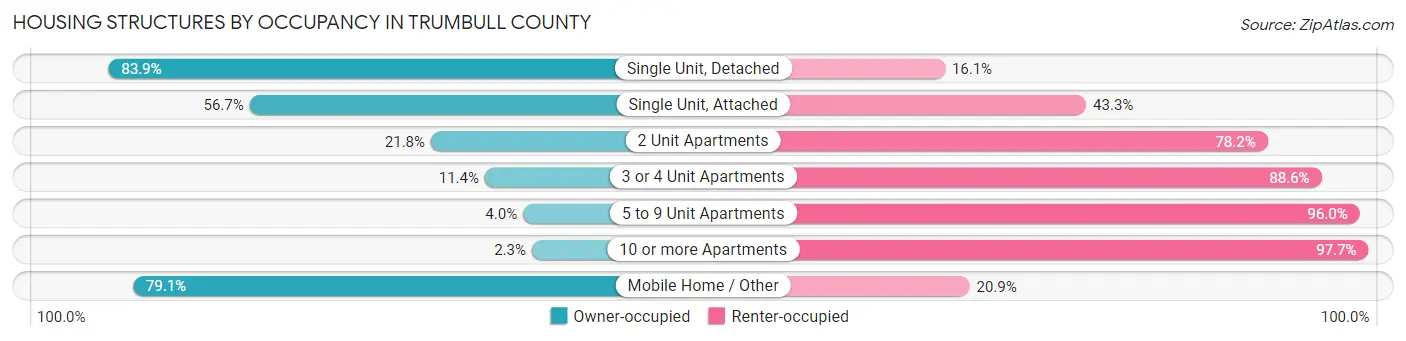
| Structure Type | Owner-occupied | Renter-occupied |
| Single Unit, Detached | 55,662 (83.9%) | 10,704 (16.1%) |
| Single Unit, Attached | 1,489 (56.7%) | 1,138 (43.3%) |
| 2 Unit Apartments | 596 (21.8%) | 2,141 (78.2%) |
| 3 or 4 Unit Apartments | 289 (11.4%) | 2,248 (88.6%) |
| 5 to 9 Unit Apartments | 104 (4.0%) | 2,473 (96.0%) |
| 10 or more Apartments | 110 (2.3%) | 4,598 (97.7%) |
| Mobile Home / Other | 2,762 (79.1%) | 728 (20.9%) |
| Total | 61,012 (71.7%) | 24,030 (28.3%) |
Housing Structures by Number of Rooms in Trumbull County
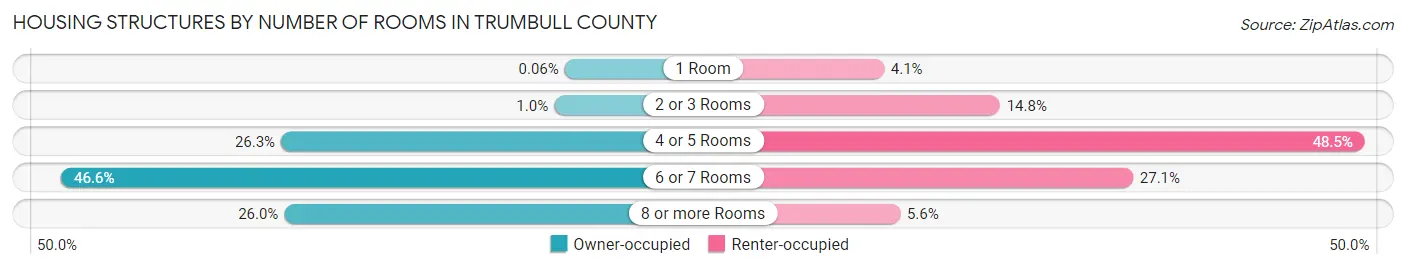
| Number of Rooms | Owner-occupied | Renter-occupied |
| 1 Room | 38 (0.1%) | 975 (4.1%) |
| 2 or 3 Rooms | 633 (1.0%) | 3,551 (14.8%) |
| 4 or 5 Rooms | 16,040 (26.3%) | 11,662 (48.5%) |
| 6 or 7 Rooms | 28,442 (46.6%) | 6,509 (27.1%) |
| 8 or more Rooms | 15,859 (26.0%) | 1,333 (5.6%) |
| Total | 61,012 (100.0%) | 24,030 (100.0%) |
Housing Structure by Heating Type in Trumbull County
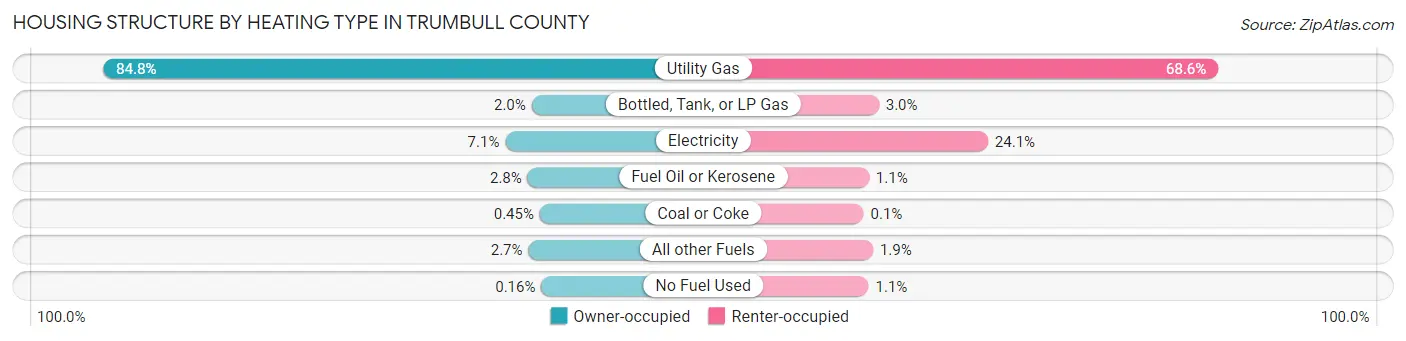
| Heating Type | Owner-occupied | Renter-occupied |
| Utility Gas | 51,742 (84.8%) | 16,487 (68.6%) |
| Bottled, Tank, or LP Gas | 1,230 (2.0%) | 731 (3.0%) |
| Electricity | 4,342 (7.1%) | 5,798 (24.1%) |
| Fuel Oil or Kerosene | 1,707 (2.8%) | 271 (1.1%) |
| Coal or Coke | 277 (0.4%) | 23 (0.1%) |
| All other Fuels | 1,614 (2.6%) | 462 (1.9%) |
| No Fuel Used | 100 (0.2%) | 258 (1.1%) |
| Total | 61,012 (100.0%) | 24,030 (100.0%) |
Household Vehicle Usage in Trumbull County
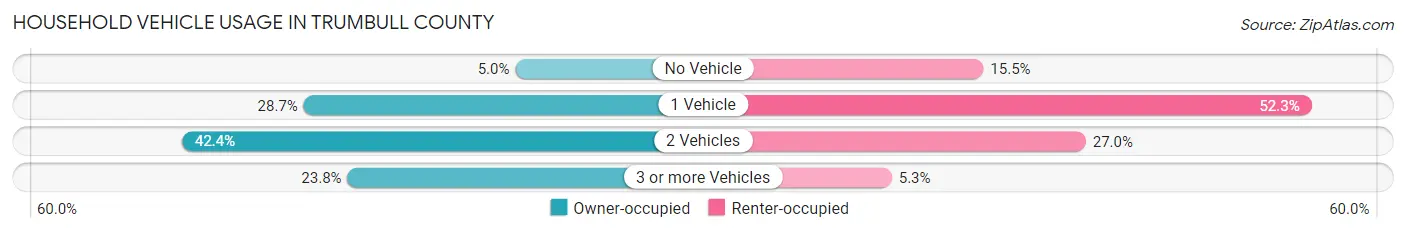
| Vehicles per Household | Owner-occupied | Renter-occupied |
| No Vehicle | 3,069 (5.0%) | 3,726 (15.5%) |
| 1 Vehicle | 17,536 (28.7%) | 12,559 (52.3%) |
| 2 Vehicles | 25,863 (42.4%) | 6,483 (27.0%) |
| 3 or more Vehicles | 14,544 (23.8%) | 1,262 (5.2%) |
| Total | 61,012 (100.0%) | 24,030 (100.0%) |
Real Estate & Mortgages in Trumbull County
Real Estate and Mortgage Overview in Trumbull County
| Characteristic | Without Mortgage | With Mortgage |
| Housing Units | 29,135 | 31,877 |
| Median Property Value | $111,200 | $131,500 |
| Median Household Income | $51,689 | $4,144 |
| Monthly Housing Costs | $460 | $378 |
| Real Estate Taxes | $1,601 | $505 |
Property Value by Mortgage Status in Trumbull County
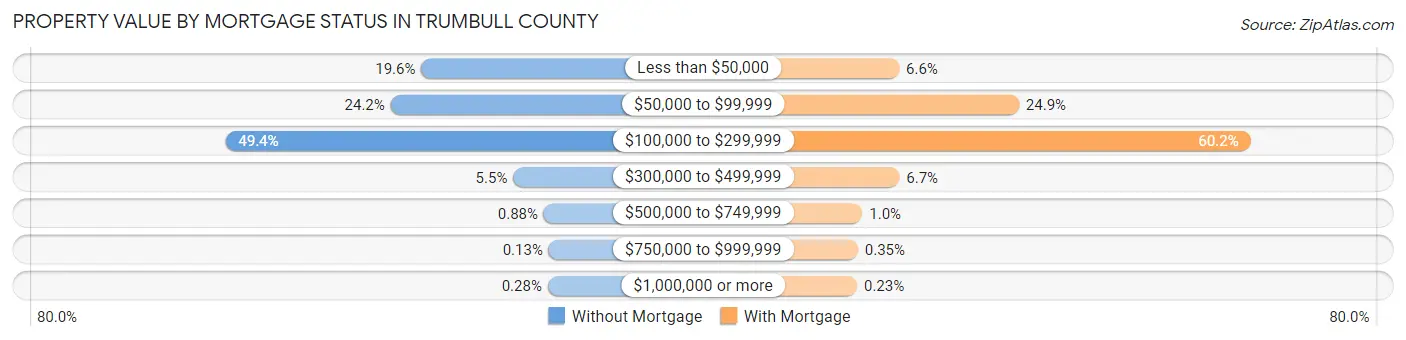
| Property Value | Without Mortgage | With Mortgage |
| Less than $50,000 | 5,695 (19.6%) | 2,118 (6.6%) |
| $50,000 to $99,999 | 7,058 (24.2%) | 7,935 (24.9%) |
| $100,000 to $299,999 | 14,394 (49.4%) | 19,185 (60.2%) |
| $300,000 to $499,999 | 1,613 (5.5%) | 2,125 (6.7%) |
| $500,000 to $749,999 | 255 (0.9%) | 330 (1.0%) |
| $750,000 to $999,999 | 39 (0.1%) | 111 (0.4%) |
| $1,000,000 or more | 81 (0.3%) | 73 (0.2%) |
| Total | 29,135 (100.0%) | 31,877 (100.0%) |
Household Income by Mortgage Status in Trumbull County
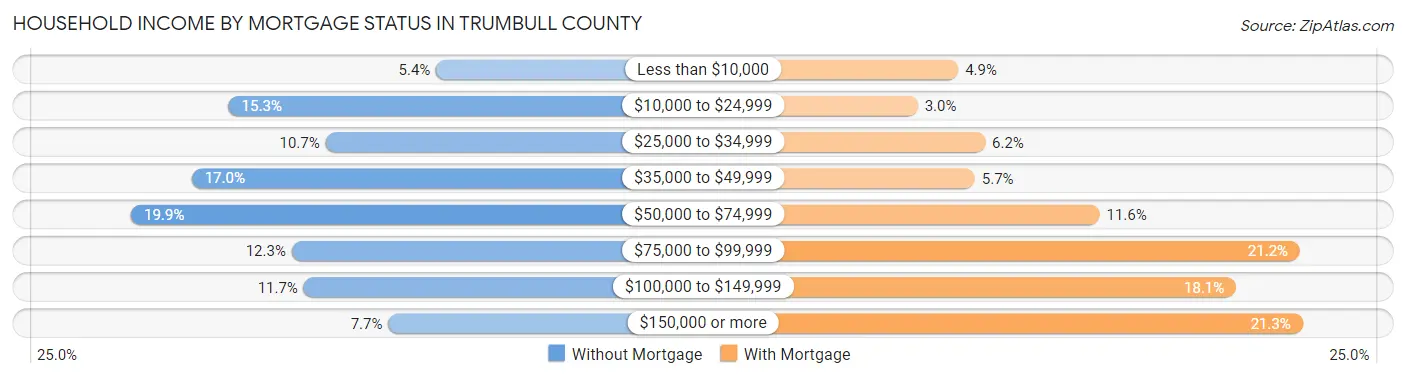
| Household Income | Without Mortgage | With Mortgage |
| Less than $10,000 | 1,574 (5.4%) | 1,559 (4.9%) |
| $10,000 to $24,999 | 4,451 (15.3%) | 942 (3.0%) |
| $25,000 to $34,999 | 3,108 (10.7%) | 1,968 (6.2%) |
| $35,000 to $49,999 | 4,965 (17.0%) | 1,811 (5.7%) |
| $50,000 to $74,999 | 5,806 (19.9%) | 3,703 (11.6%) |
| $75,000 to $99,999 | 3,579 (12.3%) | 6,746 (21.2%) |
| $100,000 to $149,999 | 3,413 (11.7%) | 5,776 (18.1%) |
| $150,000 or more | 2,239 (7.7%) | 6,787 (21.3%) |
| Total | 29,135 (100.0%) | 31,877 (100.0%) |
Property Value to Household Income Ratio in Trumbull County
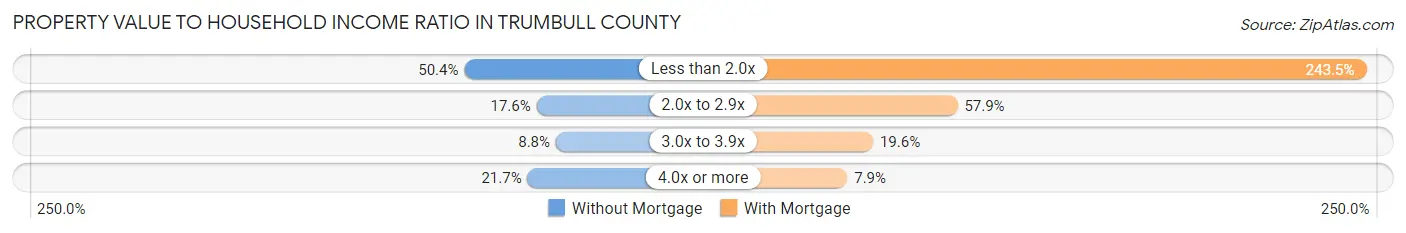
| Value-to-Income Ratio | Without Mortgage | With Mortgage |
| Less than 2.0x | 14,674 (50.4%) | 77,629 (243.5%) |
| 2.0x to 2.9x | 5,116 (17.6%) | 18,453 (57.9%) |
| 3.0x to 3.9x | 2,561 (8.8%) | 6,231 (19.6%) |
| 4.0x or more | 6,314 (21.7%) | 2,512 (7.9%) |
| Total | 29,135 (100.0%) | 31,877 (100.0%) |
Real Estate Taxes by Mortgage Status in Trumbull County
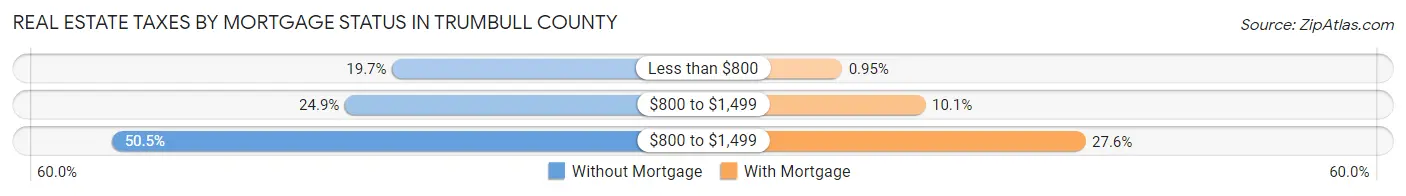
| Property Taxes | Without Mortgage | With Mortgage |
| Less than $800 | 5,740 (19.7%) | 304 (0.9%) |
| $800 to $1,499 | 7,247 (24.9%) | 3,213 (10.1%) |
| $800 to $1,499 | 14,698 (50.4%) | 8,803 (27.6%) |
| Total | 29,135 (100.0%) | 31,877 (100.0%) |
Health & Disability in Trumbull County
Health Insurance Coverage by Age in Trumbull County
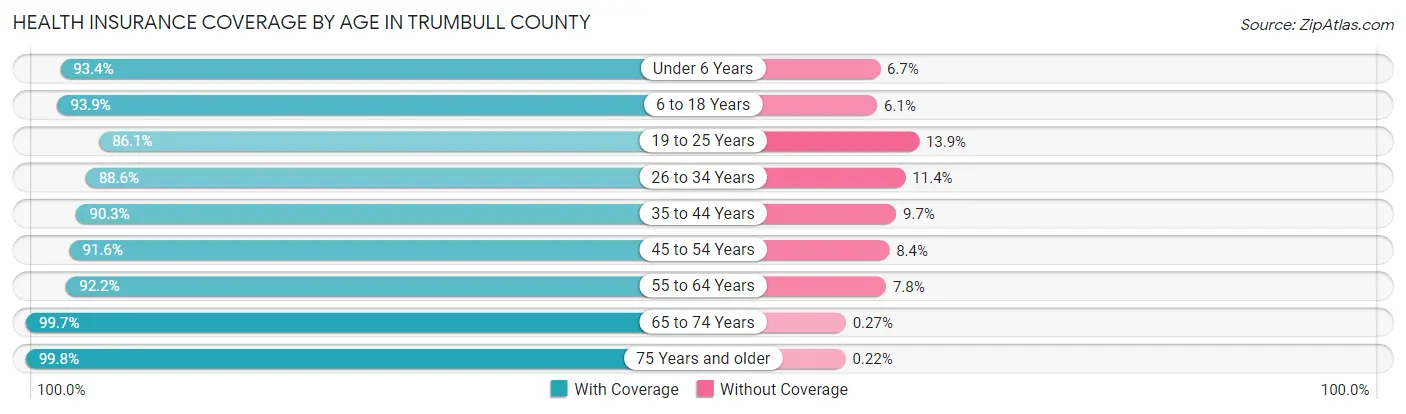
| Age Bracket | With Coverage | Without Coverage |
| Under 6 Years | 11,829 (93.3%) | 843 (6.7%) |
| 6 to 18 Years | 29,089 (93.9%) | 1,898 (6.1%) |
| 19 to 25 Years | 13,393 (86.1%) | 2,166 (13.9%) |
| 26 to 34 Years | 18,224 (88.6%) | 2,346 (11.4%) |
| 35 to 44 Years | 19,463 (90.3%) | 2,080 (9.7%) |
| 45 to 54 Years | 22,739 (91.6%) | 2,081 (8.4%) |
| 55 to 64 Years | 26,927 (92.2%) | 2,271 (7.8%) |
| 65 to 74 Years | 25,283 (99.7%) | 68 (0.3%) |
| 75 Years and older | 17,485 (99.8%) | 39 (0.2%) |
| Total | 184,432 (93.0%) | 13,792 (7.0%) |
Health Insurance Coverage by Citizenship Status in Trumbull County
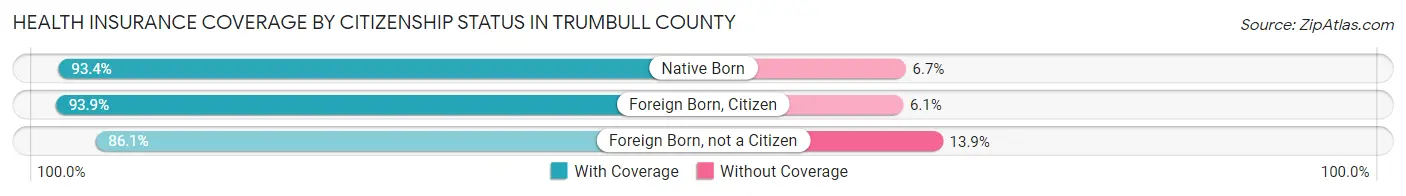
| Citizenship Status | With Coverage | Without Coverage |
| Native Born | 11,829 (93.3%) | 843 (6.7%) |
| Foreign Born, Citizen | 29,089 (93.9%) | 1,898 (6.1%) |
| Foreign Born, not a Citizen | 13,393 (86.1%) | 2,166 (13.9%) |
Health Insurance Coverage by Household Income in Trumbull County
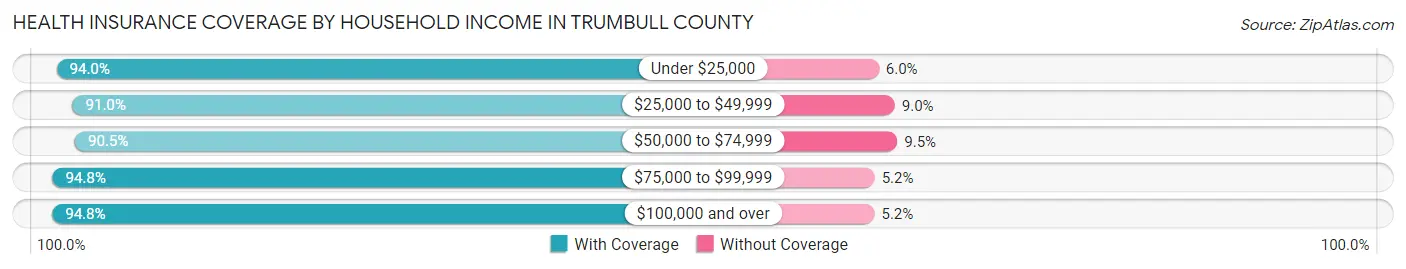
| Household Income | With Coverage | Without Coverage |
| Under $25,000 | 30,809 (94.0%) | 1,968 (6.0%) |
| $25,000 to $49,999 | 38,866 (91.0%) | 3,844 (9.0%) |
| $50,000 to $74,999 | 33,498 (90.5%) | 3,506 (9.5%) |
| $75,000 to $99,999 | 28,004 (94.8%) | 1,550 (5.2%) |
| $100,000 and over | 52,880 (94.8%) | 2,901 (5.2%) |
Public vs Private Health Insurance Coverage by Age in Trumbull County
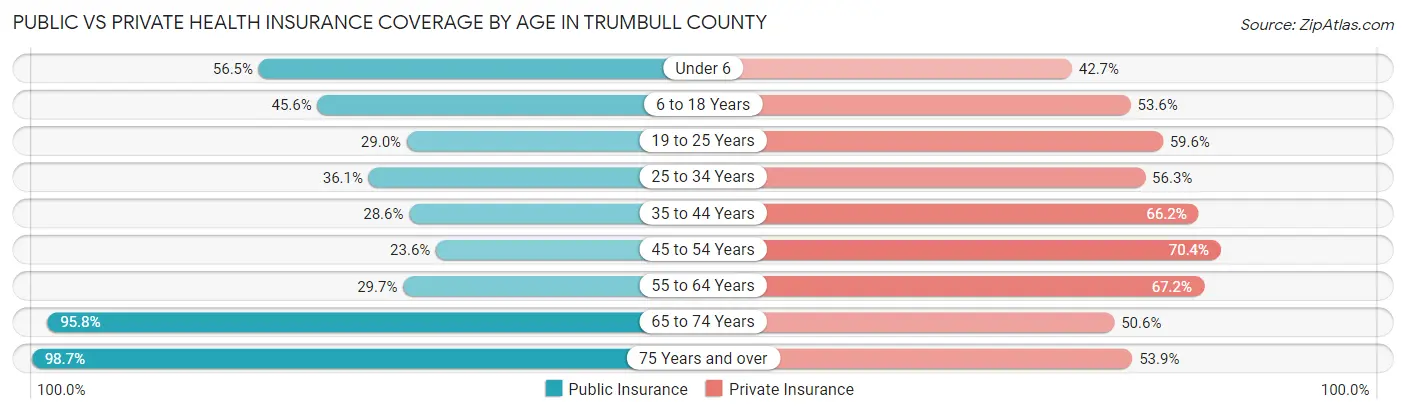
| Age Bracket | Public Insurance | Private Insurance |
| Under 6 | 7,162 (56.5%) | 5,411 (42.7%) |
| 6 to 18 Years | 14,138 (45.6%) | 16,611 (53.6%) |
| 19 to 25 Years | 4,518 (29.0%) | 9,267 (59.6%) |
| 25 to 34 Years | 7,427 (36.1%) | 11,582 (56.3%) |
| 35 to 44 Years | 6,162 (28.6%) | 14,266 (66.2%) |
| 45 to 54 Years | 5,859 (23.6%) | 17,461 (70.4%) |
| 55 to 64 Years | 8,678 (29.7%) | 19,618 (67.2%) |
| 65 to 74 Years | 24,284 (95.8%) | 12,821 (50.6%) |
| 75 Years and over | 17,291 (98.7%) | 9,448 (53.9%) |
| Total | 95,519 (48.2%) | 116,485 (58.8%) |
Disability Status by Sex by Age in Trumbull County
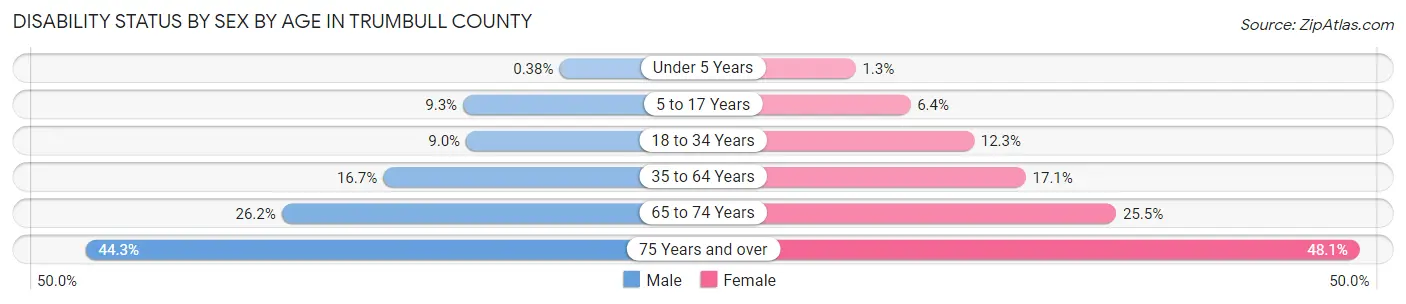
| Age Bracket | Male | Female |
| Under 5 Years | 21 (0.4%) | 64 (1.3%) |
| 5 to 17 Years | 1,450 (9.3%) | 959 (6.4%) |
| 18 to 34 Years | 1,752 (9.0%) | 2,347 (12.2%) |
| 35 to 64 Years | 6,213 (16.7%) | 6,561 (17.1%) |
| 65 to 74 Years | 3,099 (26.2%) | 3,435 (25.5%) |
| 75 Years and over | 3,223 (44.3%) | 4,928 (48.1%) |
Disability Class by Sex by Age in Trumbull County
Disability Class: Hearing Difficulty
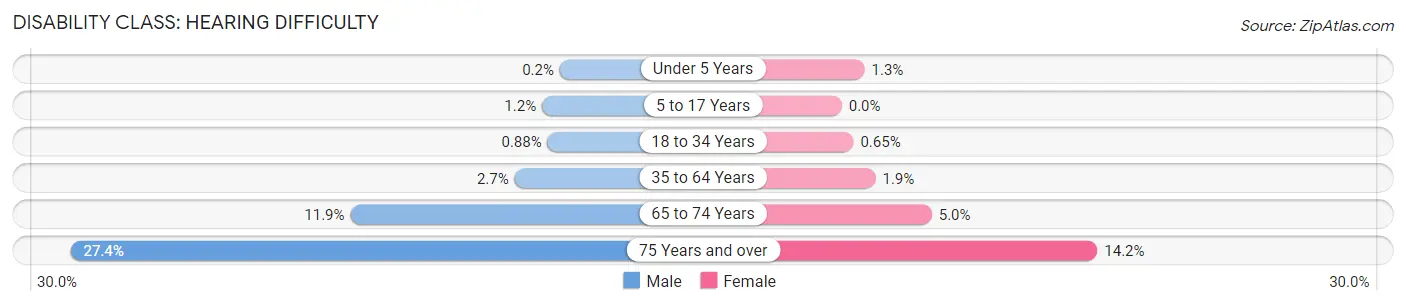
| Age Bracket | Male | Female |
| Under 5 Years | 11 (0.2%) | 64 (1.3%) |
| 5 to 17 Years | 185 (1.2%) | 0 (0.0%) |
| 18 to 34 Years | 171 (0.9%) | 124 (0.6%) |
| 35 to 64 Years | 1,008 (2.7%) | 723 (1.9%) |
| 65 to 74 Years | 1,406 (11.9%) | 676 (5.0%) |
| 75 Years and over | 1,995 (27.4%) | 1,459 (14.2%) |
Disability Class: Vision Difficulty
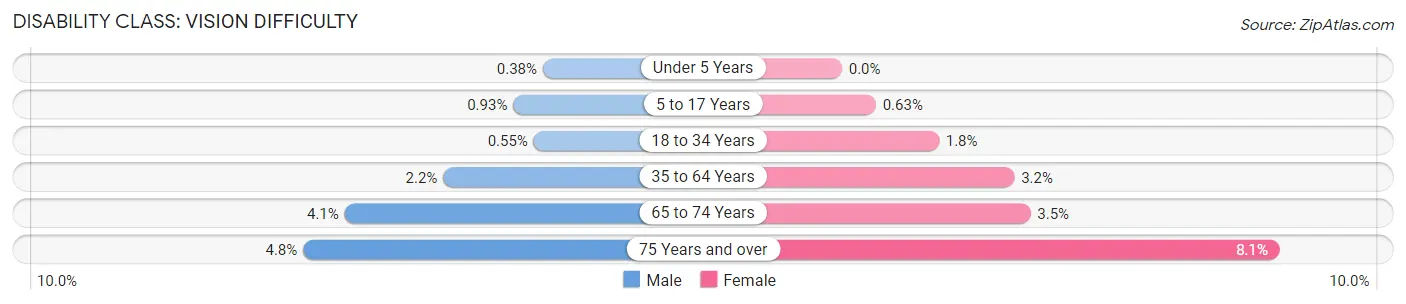
| Age Bracket | Male | Female |
| Under 5 Years | 21 (0.4%) | 0 (0.0%) |
| 5 to 17 Years | 145 (0.9%) | 95 (0.6%) |
| 18 to 34 Years | 106 (0.5%) | 345 (1.8%) |
| 35 to 64 Years | 829 (2.2%) | 1,231 (3.2%) |
| 65 to 74 Years | 481 (4.1%) | 472 (3.5%) |
| 75 Years and over | 351 (4.8%) | 834 (8.1%) |
Disability Class: Cognitive Difficulty
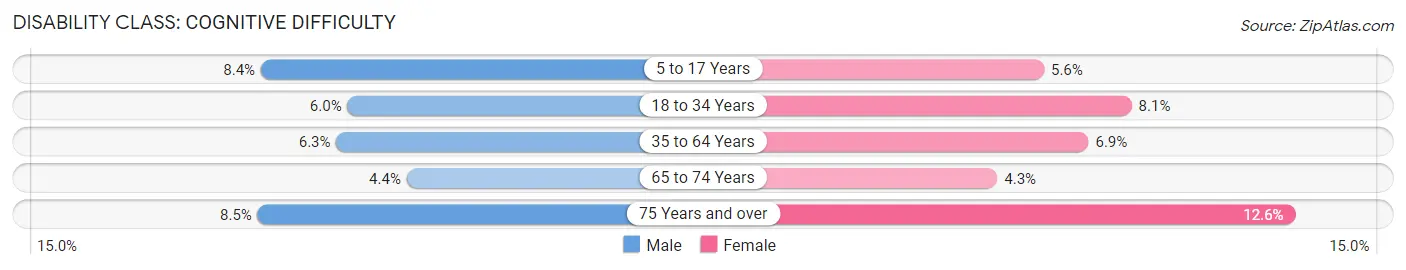
| Age Bracket | Male | Female |
| 5 to 17 Years | 1,309 (8.4%) | 851 (5.6%) |
| 18 to 34 Years | 1,166 (6.0%) | 1,546 (8.1%) |
| 35 to 64 Years | 2,345 (6.3%) | 2,643 (6.9%) |
| 65 to 74 Years | 517 (4.4%) | 585 (4.3%) |
| 75 Years and over | 619 (8.5%) | 1,295 (12.6%) |
Disability Class: Ambulatory Difficulty
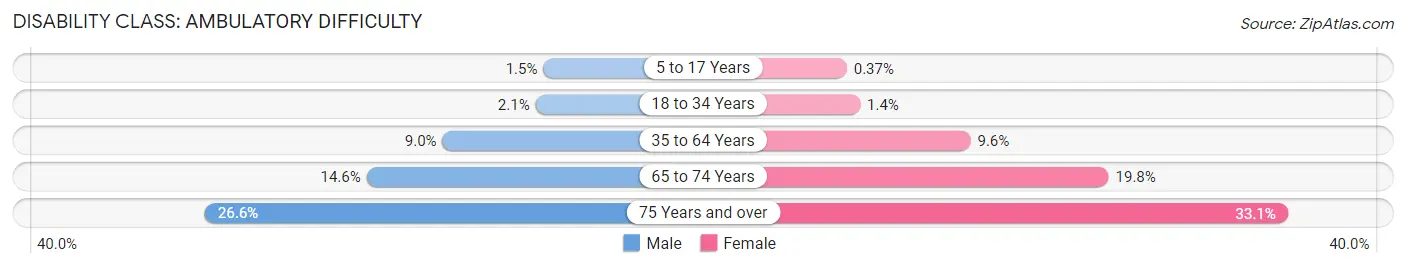
| Age Bracket | Male | Female |
| 5 to 17 Years | 231 (1.5%) | 56 (0.4%) |
| 18 to 34 Years | 401 (2.1%) | 260 (1.4%) |
| 35 to 64 Years | 3,333 (9.0%) | 3,676 (9.6%) |
| 65 to 74 Years | 1,732 (14.6%) | 2,674 (19.8%) |
| 75 Years and over | 1,935 (26.6%) | 3,394 (33.1%) |
Disability Class: Self-Care Difficulty
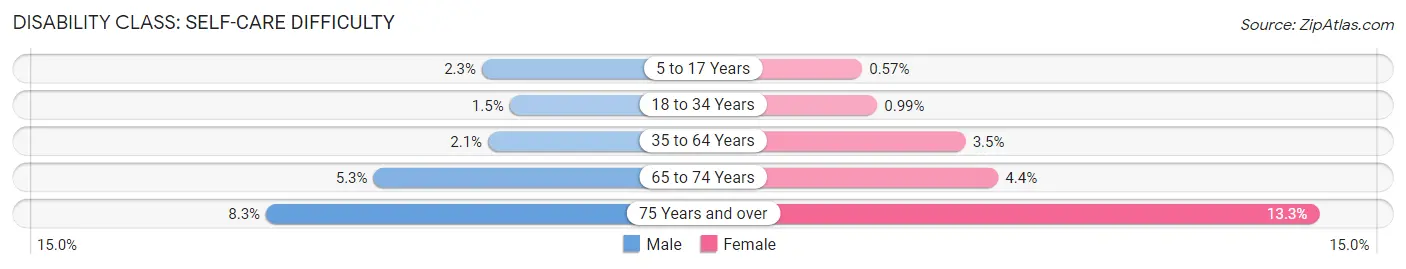
| Age Bracket | Male | Female |
| 5 to 17 Years | 353 (2.3%) | 86 (0.6%) |
| 18 to 34 Years | 290 (1.5%) | 190 (1.0%) |
| 35 to 64 Years | 779 (2.1%) | 1,326 (3.5%) |
| 65 to 74 Years | 627 (5.3%) | 588 (4.4%) |
| 75 Years and over | 602 (8.3%) | 1,363 (13.3%) |
Technology Access in Trumbull County
Computing Device Access in Trumbull County
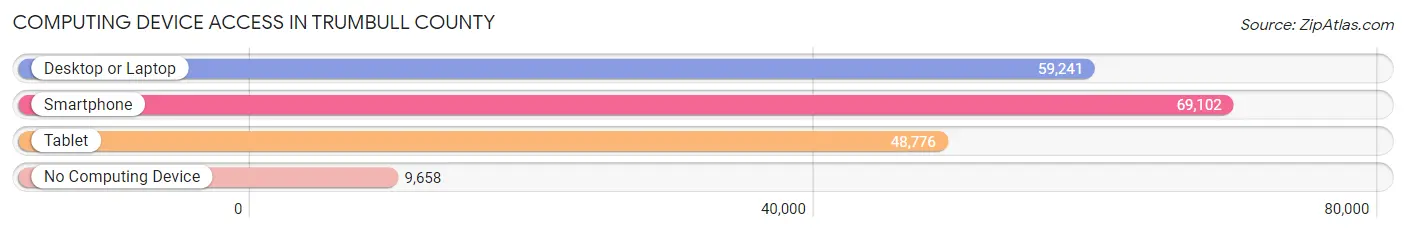
| Device Type | # Households | % Households |
| Desktop or Laptop | 59,241 | 69.7% |
| Smartphone | 69,102 | 81.3% |
| Tablet | 48,776 | 57.4% |
| No Computing Device | 9,658 | 11.4% |
| Total | 85,042 | 100.0% |
Internet Access in Trumbull County
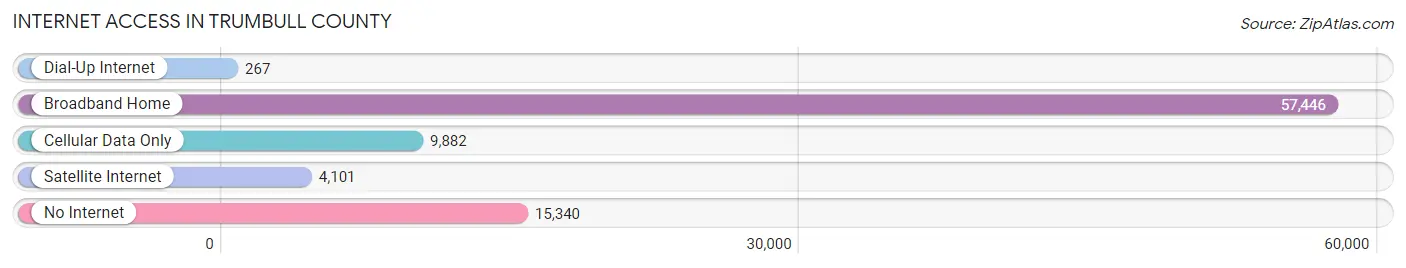
| Internet Type | # Households | % Households |
| Dial-Up Internet | 267 | 0.3% |
| Broadband Home | 57,446 | 67.5% |
| Cellular Data Only | 9,882 | 11.6% |
| Satellite Internet | 4,101 | 4.8% |
| No Internet | 15,340 | 18.0% |
| Total | 85,042 | 100.0% |
Trumbull County Summary
Trumbull County, Ohio is located in the northeastern part of the state and is part of the Mahoning Valley region. It is bordered by Ashtabula County to the north, Portage County to the east, Mahoning County to the south, and Mercer County, Pennsylvania to the west. The county seat is Warren, and the largest city is Niles. The county was established in 1801 and named after Jonathan Trumbull, the Governor of Connecticut during the American Revolution.
Trumbull County has a total area of 616 square miles, of which 612 square miles is land and 4.2 square miles is water. The county is located in the glaciated Allegheny Plateau region of Ohio, and is characterized by rolling hills and valleys. The Mahoning River flows through the county, and the Mosquito Creek and Grand River also flow through the county.
Trumbull County has a population of 210,312, according to the 2010 census. The population is spread out with a median age of 41.7 years. The racial makeup of the county is 90.2% White, 6.3% African American, 0.5% Native American, 0.7% Asian, 0.2% Pacific Islander, 0.7% from other races, and 1.4% from two or more races. Hispanic or Latino of any race were 2.2% of the population.
Trumbull County has a strong manufacturing base, with many of the county’s largest employers being in the manufacturing sector. The largest employers in the county are General Motors, Delphi Automotive, and Packard Electric. Other major employers include the Trumbull County Board of Education, Trumbull Memorial Hospital, and the Trumbull County Sheriff’s Office.
Trumbull County is home to several higher education institutions, including Kent State University at Trumbull, Youngstown State University, and the University of Akron. The county is also home to several museums, including the National Packard Museum, the Warren-Trumbull County Public Library, and the Trumbull County Historical Society.
Trumbull County is served by several major highways, including Interstate 80, Interstate 76, and U.S. Route 422. The county is also served by several airports, including the Youngstown-Warren Regional Airport, the Akron-Canton Regional Airport, and the Cleveland-Hopkins International Airport.
Trumbull County has a rich history, dating back to the early 1800s. The county was home to many Native American tribes, including the Iroquois, Shawnee, and Delaware. The county was also home to many early settlers, including the Moravians, who established the town of Warren in 1798. The county was also home to many abolitionists, including John Brown, who was born in Torbitt Township in 1805.
Trumbull County has a strong economy, with a median household income of $45,845. The county’s unemployment rate is 5.2%, which is lower than the national average. The county’s largest industries are manufacturing, health care, and retail trade. The county is also home to several large companies, including General Motors, Delphi Automotive, and Packard Electric.
Trumbull County is a great place to live, work, and play. The county has a rich history, a strong economy, and a diverse population. The county is home to several higher education institutions, museums, and other attractions. The county is also served by several major highways and airports, making it easy to get around. Trumbull County is a great place to call home.
Common Questions
What is the Total Population of Trumbull County?
Total Population of Trumbull County is 201,749.
What is the Total Male Population of Trumbull County?
Total Male Population of Trumbull County is 99,158.
What is the Total Female Population of Trumbull County?
Total Female Population of Trumbull County is 102,591.
What is the Ratio of Males per 100 Females in Trumbull County?
There are 96.65 Males per 100 Females in Trumbull County.
What is the Ratio of Females per 100 Males in Trumbull County?
There are 103.46 Females per 100 Males in Trumbull County.
What is the Median Population Age in Trumbull County?
Median Population Age in Trumbull County is 44.0 Years.
What is the Average Family Size in Trumbull County
Average Family Size in Trumbull County is 3.0 People.
What is the Average Household Size in Trumbull County
Average Household Size in Trumbull County is 2.3 People.
What is Per Capita Income in Trumbull County?
Per Capita income in Trumbull County is $30,294.
What is the Median Family Income in Trumbull County?
Median Family Income in Trumbull County is $69,368.
What is the Median Household income in Trumbull County?
Median Household Income in Trumbull County is $53,537.
What is Income or Wage Gap in Trumbull County?
Income or Wage Gap in Trumbull County is 33.3%.
Women in Trumbull County earn 66.7 cents for every dollar earned by a man.
What is Family Income Deficit in Trumbull County?
Family Income Deficit in Trumbull County is $11,481.
Families that are below poverty line in Trumbull County earn $11,481 less on average than the poverty threshold level.
What is Inequality or Gini Index in Trumbull County?
Inequality or Gini Index in Trumbull County is 0.45.
How Large is the Labor Force in Trumbull County?
There are 90,983 People in the Labor Forcein in Trumbull County.
What is the Percentage of People in the Labor Force in Trumbull County?
54.9% of People are in the Labor Force in Trumbull County.
What is the Unemployment Rate in Trumbull County?
Unemployment Rate in Trumbull County is 4.8%.