Summit County, OH
Summit County Overview
539,361
TOTAL POPULATION
263,300
MALE POPULATION
276,061
FEMALE POPULATION
95.38
MALES / 100 FEMALES
104.85
FEMALES / 100 MALES
41.1
MEDIAN AGE
3.0
AVG FAMILY SIZE
2.3
AVG HOUSEHOLD SIZE
$40,786
PER CAPITA INCOME
$89,685
AVG FAMILY INCOME
$68,360
AVG HOUSEHOLD INCOME
28.0%
WAGE / INCOME GAP [ % ]
72.0¢/ $1
WAGE / INCOME GAP [ $ ]
$10,636
FAMILY INCOME DEFICIT
0.48
INEQUALITY / GINI INDEX
285,747
LABOR FORCE [ PEOPLE ]
64.8%
PERCENT IN LABOR FORCE
5.3%
UNEMPLOYMENT RATE
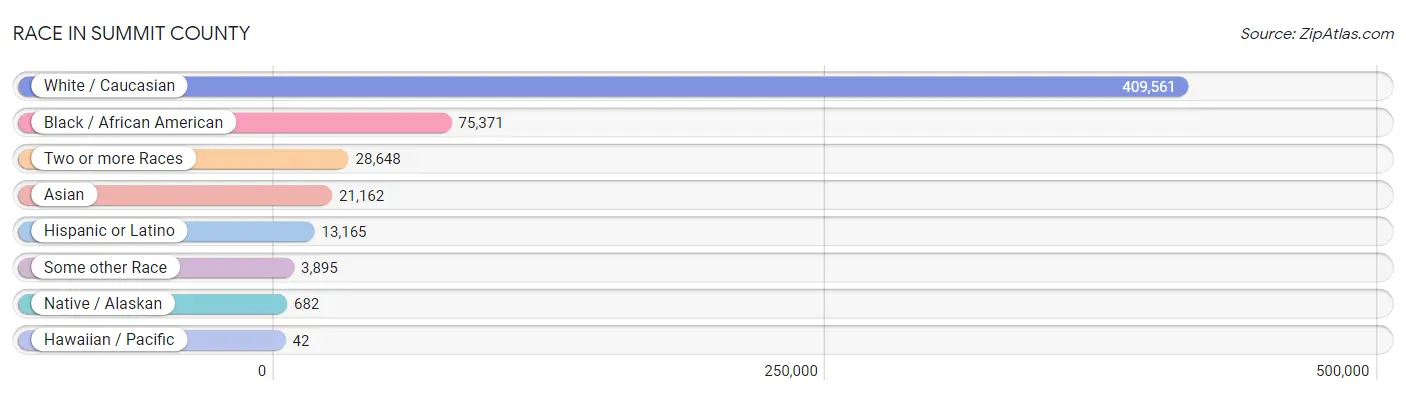
Race in Summit County
The most populous races in Summit County are White / Caucasian (409,561 | 75.9%), Black / African American (75,371 | 14.0%), and Two or more Races (28,648 | 5.3%).
| Race | # Population | % Population |
| Asian | 21,162 | 3.9% |
| Black / African American | 75,371 | 14.0% |
| Hawaiian / Pacific | 42 | 0.0% |
| Hispanic or Latino | 13,165 | 2.4% |
| Native / Alaskan | 682 | 0.1% |
| White / Caucasian | 409,561 | 75.9% |
| Two or more Races | 28,648 | 5.3% |
| Some other Race | 3,895 | 0.7% |
| Total | 539,361 | 100.0% |
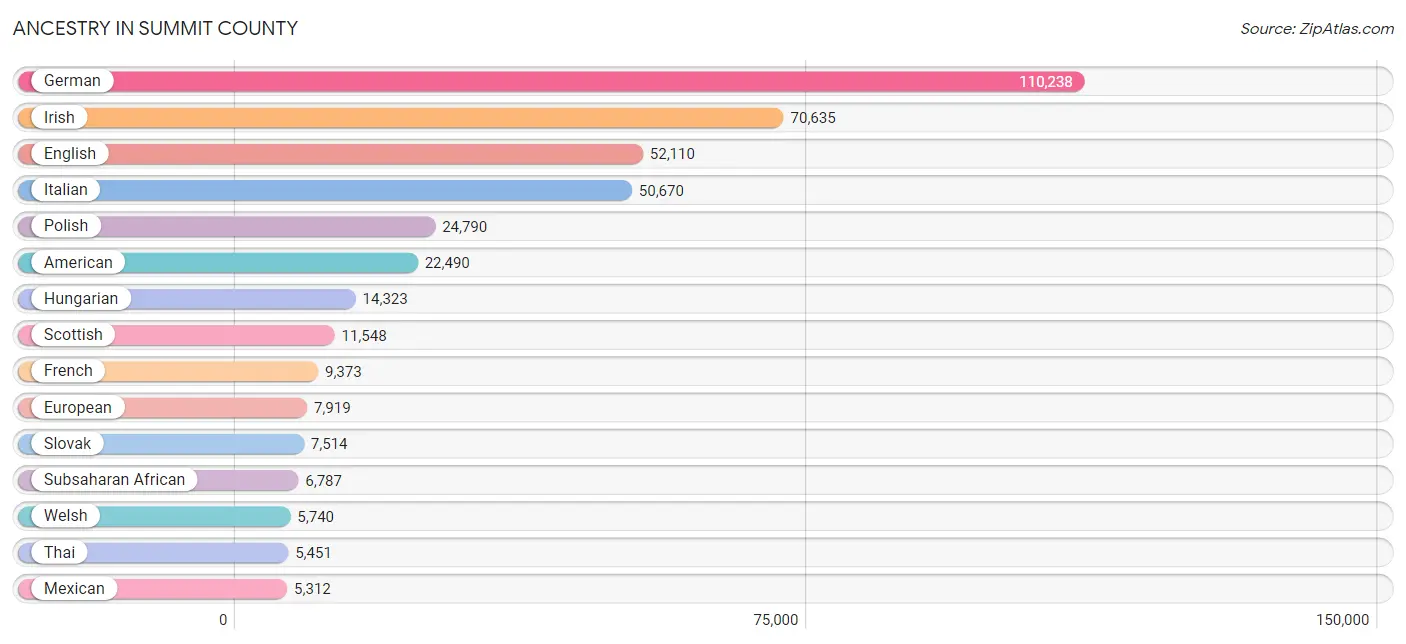
Ancestry in Summit County
The most populous ancestries reported in Summit County are German (110,238 | 20.4%), Irish (70,635 | 13.1%), English (52,110 | 9.7%), Italian (50,670 | 9.4%), and Polish (24,790 | 4.6%), together accounting for 57.2% of all Summit County residents.
| Ancestry | # Population | % Population |
| Afghan | 38 | 0.0% |
| African | 4,298 | 0.8% |
| Albanian | 203 | 0.0% |
| Alsatian | 13 | 0.0% |
| American | 22,490 | 4.2% |
| Apache | 216 | 0.0% |
| Arab | 4,497 | 0.8% |
| Argentinean | 119 | 0.0% |
| Armenian | 261 | 0.1% |
| Australian | 58 | 0.0% |
| Austrian | 2,036 | 0.4% |
| Bahamian | 22 | 0.0% |
| Bangladeshi | 111 | 0.0% |
| Basque | 11 | 0.0% |
| Belgian | 304 | 0.1% |
| Belizean | 32 | 0.0% |
| Bhutanese | 611 | 0.1% |
| Blackfeet | 673 | 0.1% |
| Brazilian | 166 | 0.0% |
| British | 3,684 | 0.7% |
| British West Indian | 10 | 0.0% |
| Bulgarian | 143 | 0.0% |
| Burmese | 1,203 | 0.2% |
| Cajun | 12 | 0.0% |
| Cambodian | 29 | 0.0% |
| Canadian | 715 | 0.1% |
| Carpatho Rusyn | 72 | 0.0% |
| Celtic | 65 | 0.0% |
| Central American | 1,457 | 0.3% |
| Central American Indian | 132 | 0.0% |
| Cherokee | 1,613 | 0.3% |
| Chickasaw | 9 | 0.0% |
| Chilean | 249 | 0.1% |
| Chippewa | 84 | 0.0% |
| Choctaw | 107 | 0.0% |
| Colombian | 261 | 0.1% |
| Colville | 4 | 0.0% |
| Comanche | 7 | 0.0% |
| Costa Rican | 192 | 0.0% |
| Creek | 25 | 0.0% |
| Croatian | 2,392 | 0.4% |
| Crow | 3 | 0.0% |
| Cuban | 259 | 0.1% |
| Cypriot | 14 | 0.0% |
| Czech | 3,815 | 0.7% |
| Czechoslovakian | 1,132 | 0.2% |
| Danish | 836 | 0.2% |
| Delaware | 69 | 0.0% |
| Dominican | 161 | 0.0% |
| Dutch | 4,826 | 0.9% |
| Eastern European | 2,345 | 0.4% |
| Ecuadorian | 149 | 0.0% |
| Egyptian | 233 | 0.0% |
| English | 52,110 | 9.7% |
| Estonian | 30 | 0.0% |
| Ethiopian | 59 | 0.0% |
| European | 7,919 | 1.5% |
| Filipino | 98 | 0.0% |
| Finnish | 832 | 0.2% |
| French | 9,373 | 1.7% |
| French American Indian | 13 | 0.0% |
| French Canadian | 1,319 | 0.2% |
| German | 110,238 | 20.4% |
| German Russian | 11 | 0.0% |
| Ghanaian | 391 | 0.1% |
| Greek | 3,962 | 0.7% |
| Guamanian / Chamorro | 75 | 0.0% |
| Guatemalan | 376 | 0.1% |
| Guyanese | 13 | 0.0% |
| Haitian | 24 | 0.0% |
| Honduran | 394 | 0.1% |
| Hopi | 1 | 0.0% |
| Hungarian | 14,323 | 2.7% |
| Indian (Asian) | 3,932 | 0.7% |
| Indonesian | 1,682 | 0.3% |
| Iranian | 530 | 0.1% |
| Iraqi | 113 | 0.0% |
| Irish | 70,635 | 13.1% |
| Iroquois | 153 | 0.0% |
| Israeli | 269 | 0.1% |
| Italian | 50,670 | 9.4% |
| Jamaican | 736 | 0.1% |
| Japanese | 87 | 0.0% |
| Jordanian | 78 | 0.0% |
| Kenyan | 79 | 0.0% |
| Korean | 1,914 | 0.4% |
| Laotian | 1 | 0.0% |
| Latvian | 34 | 0.0% |
| Lebanese | 2,374 | 0.4% |
| Liberian | 93 | 0.0% |
| Lithuanian | 1,041 | 0.2% |
| Luxembourger | 40 | 0.0% |
| Macedonian | 518 | 0.1% |
| Malaysian | 338 | 0.1% |
| Maltese | 37 | 0.0% |
| Mexican | 5,312 | 1.0% |
| Mexican American Indian | 181 | 0.0% |
| Mongolian | 8 | 0.0% |
| Moroccan | 48 | 0.0% |
| Native Hawaiian | 122 | 0.0% |
| Navajo | 98 | 0.0% |
| Nicaraguan | 34 | 0.0% |
| Nigerian | 600 | 0.1% |
| Northern European | 391 | 0.1% |
| Norwegian | 1,865 | 0.4% |
| Okinawan | 188 | 0.0% |
| Osage | 22 | 0.0% |
| Paiute | 12 | 0.0% |
| Pakistani | 278 | 0.1% |
| Palestinian | 109 | 0.0% |
| Panamanian | 123 | 0.0% |
| Pennsylvania German | 978 | 0.2% |
| Peruvian | 69 | 0.0% |
| Polish | 24,790 | 4.6% |
| Portuguese | 908 | 0.2% |
| Puerto Rican | 3,611 | 0.7% |
| Romanian | 2,127 | 0.4% |
| Russian | 4,805 | 0.9% |
| Salvadoran | 338 | 0.1% |
| Samoan | 22 | 0.0% |
| Scandinavian | 871 | 0.2% |
| Scotch-Irish | 5,001 | 0.9% |
| Scottish | 11,548 | 2.1% |
| Seminole | 13 | 0.0% |
| Serbian | 2,913 | 0.5% |
| Sioux | 91 | 0.0% |
| Slavic | 639 | 0.1% |
| Slovak | 7,514 | 1.4% |
| Slovene | 3,512 | 0.6% |
| South African | 10 | 0.0% |
| South American | 913 | 0.2% |
| Soviet Union | 13 | 0.0% |
| Spaniard | 583 | 0.1% |
| Spanish | 415 | 0.1% |
| Sri Lankan | 1,061 | 0.2% |
| Subsaharan African | 6,787 | 1.3% |
| Sudanese | 63 | 0.0% |
| Swedish | 4,225 | 0.8% |
| Swiss | 3,006 | 0.6% |
| Syrian | 283 | 0.1% |
| Thai | 5,451 | 1.0% |
| Tlingit-Haida | 8 | 0.0% |
| Trinidadian and Tobagonian | 2 | 0.0% |
| Turkish | 109 | 0.0% |
| Ugandan | 9 | 0.0% |
| Ukrainian | 2,488 | 0.5% |
| Uruguayan | 27 | 0.0% |
| Venezuelan | 39 | 0.0% |
| Vietnamese | 75 | 0.0% |
| Welsh | 5,740 | 1.1% |
| West Indian | 239 | 0.0% |
| Yugoslavian | 964 | 0.2% | View All 152 Rows |
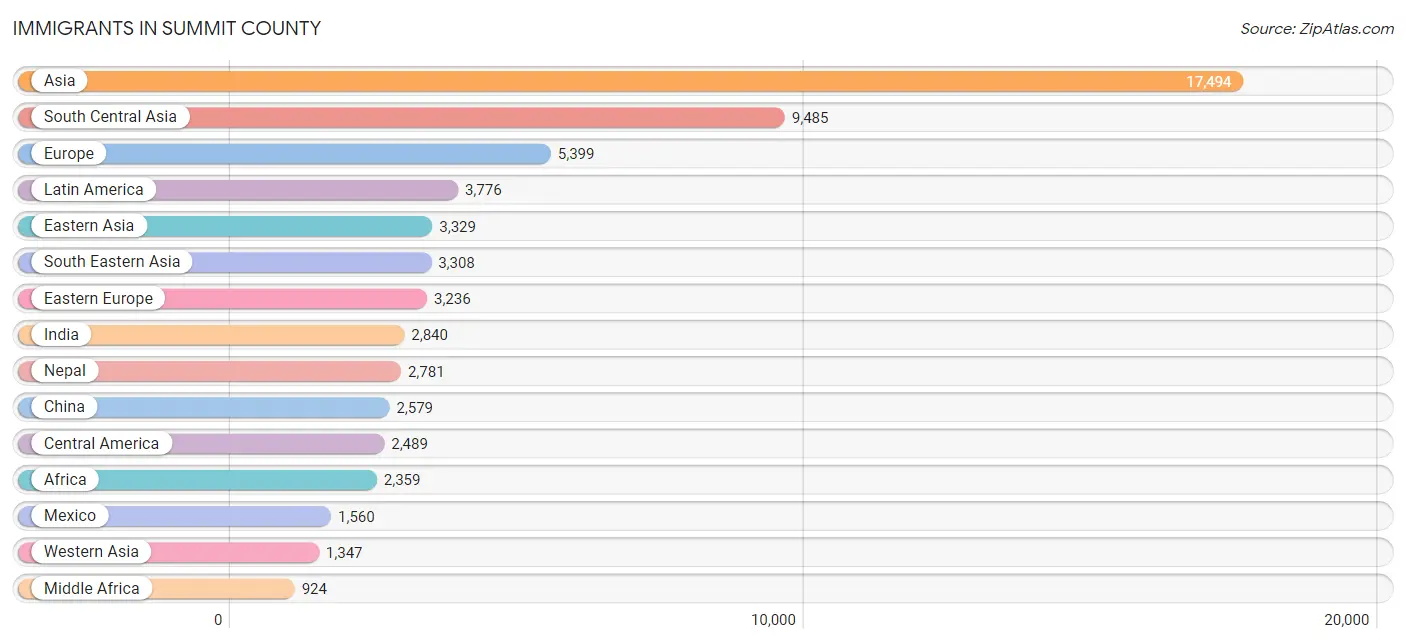
Immigrants in Summit County
The most numerous immigrant groups reported in Summit County came from Asia (17,494 | 3.2%), South Central Asia (9,485 | 1.8%), Europe (5,399 | 1.0%), Latin America (3,776 | 0.7%), and Eastern Asia (3,329 | 0.6%), together accounting for 7.3% of all Summit County residents.
| Immigration Origin | # Population | % Population |
| Afghanistan | 38 | 0.0% |
| Africa | 2,359 | 0.4% |
| Albania | 125 | 0.0% |
| Argentina | 107 | 0.0% |
| Asia | 17,494 | 3.2% |
| Australia | 42 | 0.0% |
| Austria | 101 | 0.0% |
| Bahamas | 123 | 0.0% |
| Bangladesh | 166 | 0.0% |
| Belarus | 23 | 0.0% |
| Belgium | 12 | 0.0% |
| Belize | 32 | 0.0% |
| Bosnia and Herzegovina | 449 | 0.1% |
| Brazil | 161 | 0.0% |
| Bulgaria | 12 | 0.0% |
| Cabo Verde | 13 | 0.0% |
| Cambodia | 20 | 0.0% |
| Cameroon | 71 | 0.0% |
| Canada | 688 | 0.1% |
| Caribbean | 618 | 0.1% |
| Central America | 2,489 | 0.5% |
| Chile | 165 | 0.0% |
| China | 2,579 | 0.5% |
| Colombia | 140 | 0.0% |
| Congo | 520 | 0.1% |
| Costa Rica | 128 | 0.0% |
| Croatia | 186 | 0.0% |
| Cuba | 53 | 0.0% |
| Czechoslovakia | 34 | 0.0% |
| Denmark | 28 | 0.0% |
| Dominican Republic | 41 | 0.0% |
| Eastern Africa | 352 | 0.1% |
| Eastern Asia | 3,329 | 0.6% |
| Eastern Europe | 3,236 | 0.6% |
| Ecuador | 15 | 0.0% |
| Egypt | 111 | 0.0% |
| El Salvador | 325 | 0.1% |
| England | 361 | 0.1% |
| Ethiopia | 52 | 0.0% |
| Europe | 5,399 | 1.0% |
| France | 112 | 0.0% |
| Germany | 451 | 0.1% |
| Ghana | 344 | 0.1% |
| Greece | 121 | 0.0% |
| Guatemala | 182 | 0.0% |
| Guyana | 20 | 0.0% |
| Honduras | 156 | 0.0% |
| Hong Kong | 120 | 0.0% |
| Hungary | 156 | 0.0% |
| India | 2,840 | 0.5% |
| Indonesia | 72 | 0.0% |
| Iran | 337 | 0.1% |
| Iraq | 114 | 0.0% |
| Ireland | 55 | 0.0% |
| Israel | 113 | 0.0% |
| Italy | 287 | 0.1% |
| Jamaica | 192 | 0.0% |
| Japan | 138 | 0.0% |
| Jordan | 58 | 0.0% |
| Kenya | 54 | 0.0% |
| Korea | 612 | 0.1% |
| Kuwait | 10 | 0.0% |
| Laos | 277 | 0.1% |
| Latin America | 3,776 | 0.7% |
| Latvia | 6 | 0.0% |
| Lebanon | 190 | 0.0% |
| Liberia | 78 | 0.0% |
| Malaysia | 21 | 0.0% |
| Mexico | 1,560 | 0.3% |
| Middle Africa | 924 | 0.2% |
| Moldova | 33 | 0.0% |
| Morocco | 3 | 0.0% |
| Nepal | 2,781 | 0.5% |
| Netherlands | 140 | 0.0% |
| Nicaragua | 47 | 0.0% |
| Nigeria | 311 | 0.1% |
| North Macedonia | 41 | 0.0% |
| Northern Africa | 247 | 0.1% |
| Northern Europe | 840 | 0.2% |
| Oceania | 106 | 0.0% |
| Pakistan | 89 | 0.0% |
| Panama | 59 | 0.0% |
| Peru | 17 | 0.0% |
| Philippines | 822 | 0.2% |
| Poland | 241 | 0.0% |
| Portugal | 26 | 0.0% |
| Romania | 447 | 0.1% |
| Russia | 458 | 0.1% |
| Saudi Arabia | 487 | 0.1% |
| Scotland | 57 | 0.0% |
| Serbia | 411 | 0.1% |
| Singapore | 56 | 0.0% |
| South Africa | 47 | 0.0% |
| South America | 669 | 0.1% |
| South Central Asia | 9,485 | 1.8% |
| South Eastern Asia | 3,308 | 0.6% |
| Southern Europe | 493 | 0.1% |
| Spain | 55 | 0.0% |
| Sri Lanka | 61 | 0.0% |
| St. Vincent and the Grenadines | 23 | 0.0% |
| Sudan | 7 | 0.0% |
| Sweden | 36 | 0.0% |
| Switzerland | 14 | 0.0% |
| Syria | 136 | 0.0% |
| Taiwan | 141 | 0.0% |
| Thailand | 522 | 0.1% |
| Trinidad and Tobago | 69 | 0.0% |
| Turkey | 34 | 0.0% |
| Uganda | 9 | 0.0% |
| Ukraine | 323 | 0.1% |
| Uruguay | 16 | 0.0% |
| Uzbekistan | 489 | 0.1% |
| Venezuela | 28 | 0.0% |
| Vietnam | 620 | 0.1% |
| Western Africa | 746 | 0.1% |
| Western Asia | 1,347 | 0.3% |
| Western Europe | 830 | 0.2% |
| Yemen | 93 | 0.0% |
| Zaire | 333 | 0.1% | View All 119 Rows |
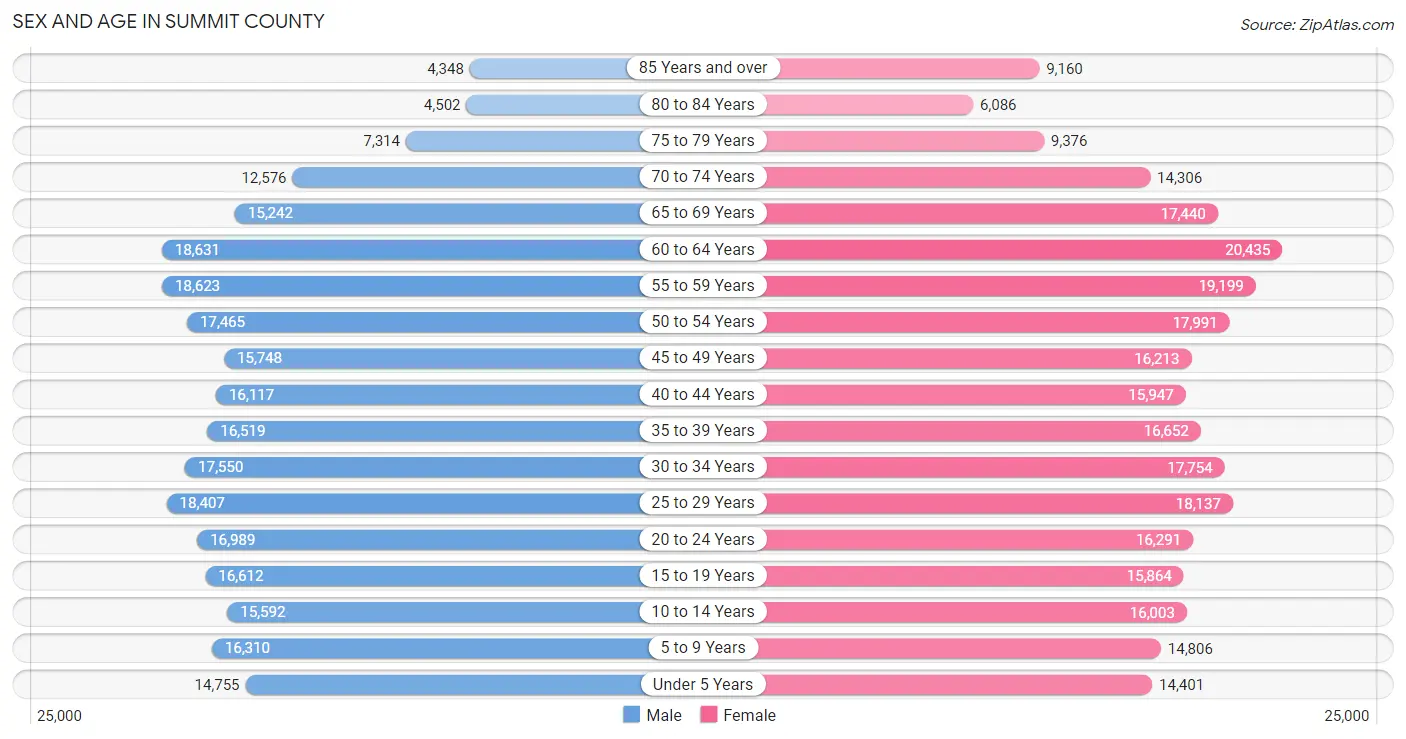
Sex and Age in Summit County
Sex and Age in Summit County
The most populous age groups in Summit County are 60 to 64 Years (18,631 | 7.1%) for men and 60 to 64 Years (20,435 | 7.4%) for women.
| Age Bracket | Male | Female |
| Under 5 Years | 14,755 (5.6%) | 14,401 (5.2%) |
| 5 to 9 Years | 16,310 (6.2%) | 14,806 (5.4%) |
| 10 to 14 Years | 15,592 (5.9%) | 16,003 (5.8%) |
| 15 to 19 Years | 16,612 (6.3%) | 15,864 (5.8%) |
| 20 to 24 Years | 16,989 (6.5%) | 16,291 (5.9%) |
| 25 to 29 Years | 18,407 (7.0%) | 18,137 (6.6%) |
| 30 to 34 Years | 17,550 (6.7%) | 17,754 (6.4%) |
| 35 to 39 Years | 16,519 (6.3%) | 16,652 (6.0%) |
| 40 to 44 Years | 16,117 (6.1%) | 15,947 (5.8%) |
| 45 to 49 Years | 15,748 (6.0%) | 16,213 (5.9%) |
| 50 to 54 Years | 17,465 (6.6%) | 17,991 (6.5%) |
| 55 to 59 Years | 18,623 (7.1%) | 19,199 (7.0%) |
| 60 to 64 Years | 18,631 (7.1%) | 20,435 (7.4%) |
| 65 to 69 Years | 15,242 (5.8%) | 17,440 (6.3%) |
| 70 to 74 Years | 12,576 (4.8%) | 14,306 (5.2%) |
| 75 to 79 Years | 7,314 (2.8%) | 9,376 (3.4%) |
| 80 to 84 Years | 4,502 (1.7%) | 6,086 (2.2%) |
| 85 Years and over | 4,348 (1.7%) | 9,160 (3.3%) |
| Total | 263,300 (100.0%) | 276,061 (100.0%) |
Families and Households in Summit County
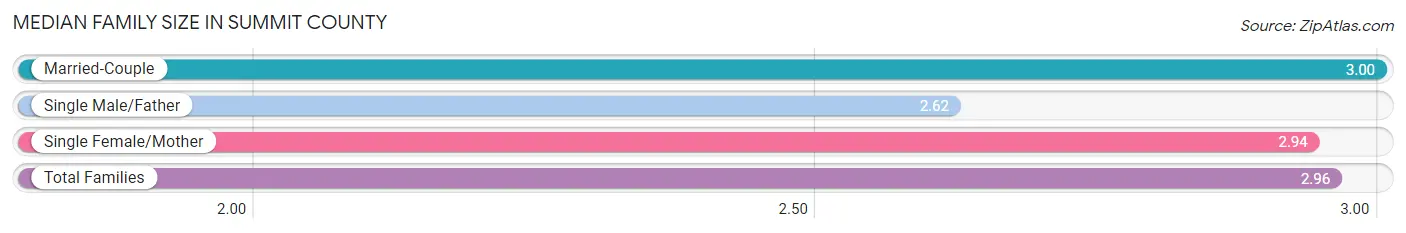
Median Family Size in Summit County
The median family size in Summit County is 2.96 persons per family, with married-couple families (98,562 | 71.5%) accounting for the largest median family size of 3 persons per family. On the other hand, single male/father families (10,542 | 7.6%) represent the smallest median family size with 2.62 persons per family.
| Family Type | # Families | Family Size |
| Married-Couple | 98,562 (71.5%) | 3.00 |
| Single Male/Father | 10,542 (7.6%) | 2.62 |
| Single Female/Mother | 28,832 (20.9%) | 2.94 |
| Total Families | 137,936 (100.0%) | 2.96 |
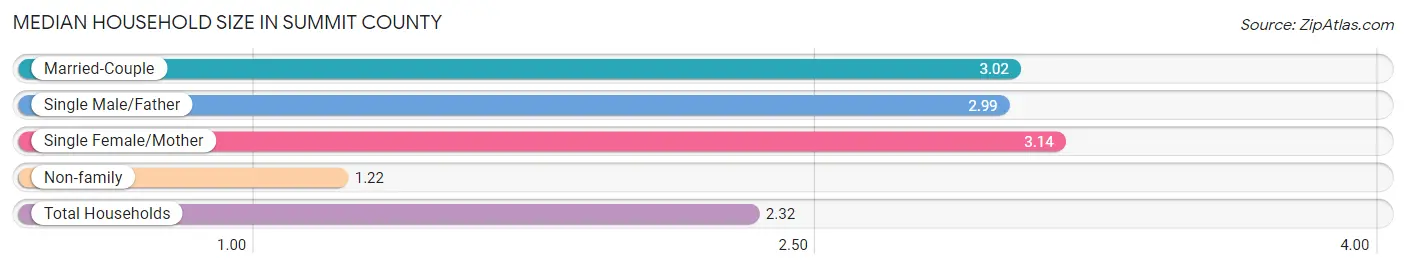
Median Household Size in Summit County
The median household size in Summit County is 2.32 persons per household, with single female/mother households (28,832 | 12.6%) accounting for the largest median household size of 3.14 persons per household. non-family households (90,699 | 39.7%) represent the smallest median household size with 1.22 persons per household.
| Household Type | # Households | Household Size |
| Married-Couple | 98,562 (43.1%) | 3.02 |
| Single Male/Father | 10,542 (4.6%) | 2.99 |
| Single Female/Mother | 28,832 (12.6%) | 3.14 |
| Non-family | 90,699 (39.7%) | 1.22 |
| Total Households | 228,635 (100.0%) | 2.32 |
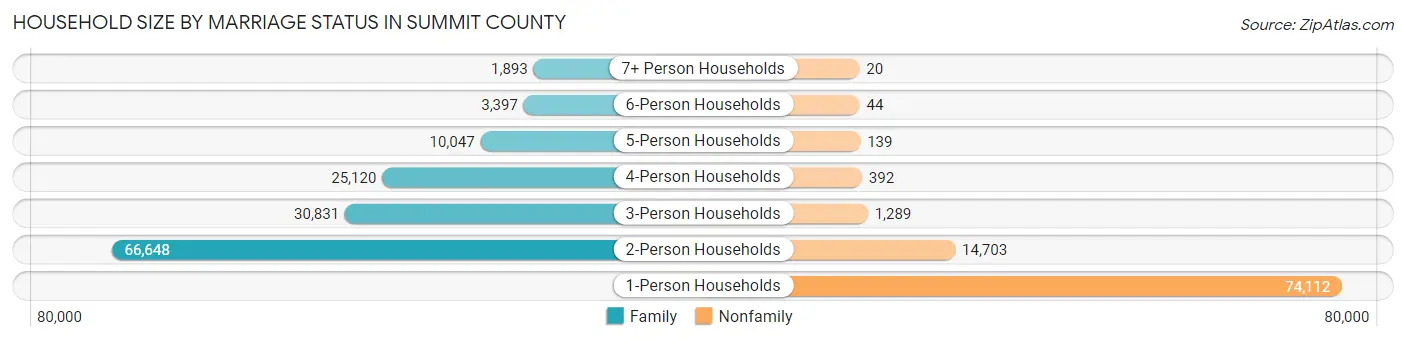
Household Size by Marriage Status in Summit County
Out of a total of 228,635 households in Summit County, 137,936 (60.3%) are family households, while 90,699 (39.7%) are nonfamily households. The most numerous type of family households are 2-person households, comprising 66,648, and the most common type of nonfamily households are 1-person households, comprising 74,112.
| Household Size | Family Households | Nonfamily Households |
| 1-Person Households | - | 74,112 (32.4%) |
| 2-Person Households | 66,648 (29.1%) | 14,703 (6.4%) |
| 3-Person Households | 30,831 (13.5%) | 1,289 (0.6%) |
| 4-Person Households | 25,120 (11.0%) | 392 (0.2%) |
| 5-Person Households | 10,047 (4.4%) | 139 (0.1%) |
| 6-Person Households | 3,397 (1.5%) | 44 (0.0%) |
| 7+ Person Households | 1,893 (0.8%) | 20 (0.0%) |
| Total | 137,936 (60.3%) | 90,699 (39.7%) |
Female Fertility in Summit County
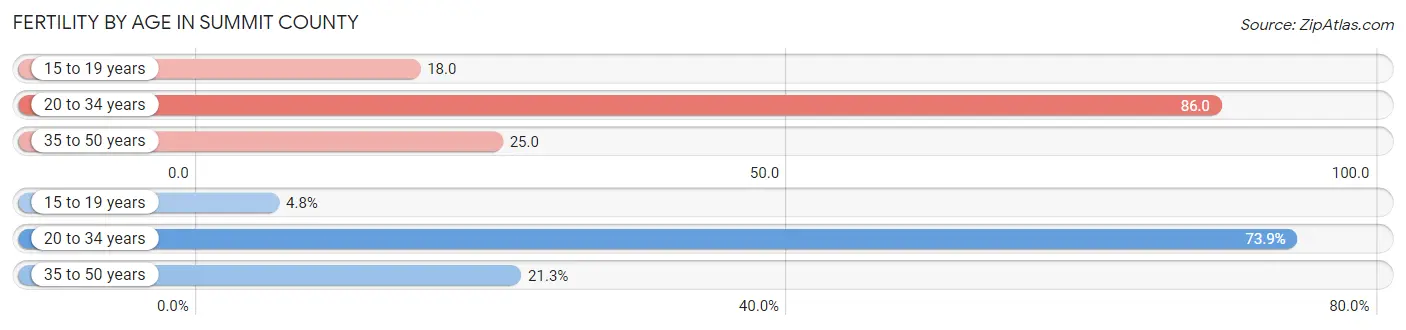
Fertility by Age in Summit County
Average fertility rate in Summit County is 50.0 births per 1,000 women. Women in the age bracket of 20 to 34 years have the highest fertility rate with 86.0 births per 1,000 women. Women in the age bracket of 20 to 34 years acount for 73.9% of all women with births.
| Age Bracket | Women with Births | Births / 1,000 Women |
| 15 to 19 years | 291 (4.8%) | 18.0 |
| 20 to 34 years | 4,467 (73.9%) | 86.0 |
| 35 to 50 years | 1,284 (21.2%) | 25.0 |
| Total | 6,042 (100.0%) | 50.0 |
Fertility by Age by Marriage Status in Summit County
58.9% of women with births (6,042) in Summit County are married. The highest percentage of unmarried women with births falls into 15 to 19 years age bracket with 95.5% of them unmarried at the time of birth, while the lowest percentage of unmarried women with births belong to 35 to 50 years age bracket with 20.6% of them unmarried.
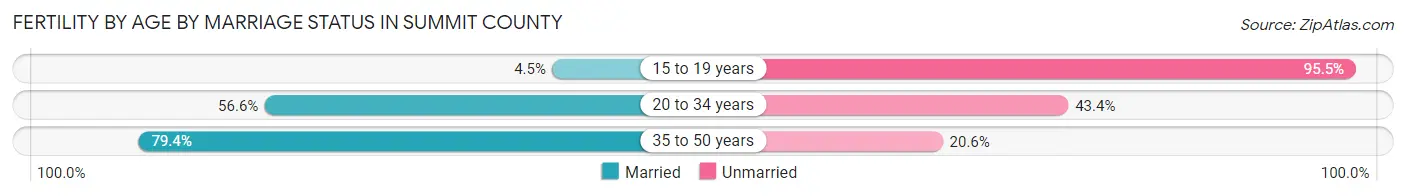
| Age Bracket | Married | Unmarried |
| 15 to 19 years | 13 (4.5%) | 278 (95.5%) |
| 20 to 34 years | 2,528 (56.6%) | 1,939 (43.4%) |
| 35 to 50 years | 1,019 (79.4%) | 265 (20.6%) |
| Total | 3,559 (58.9%) | 2,483 (41.1%) |
Fertility by Education in Summit County
Average fertility rate in Summit County is 50.0 births per 1,000 women. Women with the education attainment of graduate degree have the highest fertility rate of 69.0 births per 1,000 women, while women with the education attainment of less than high school have the lowest fertility at 34.0 births per 1,000 women. Women with the education attainment of college or associate's degree represent 31.3% of all women with births.
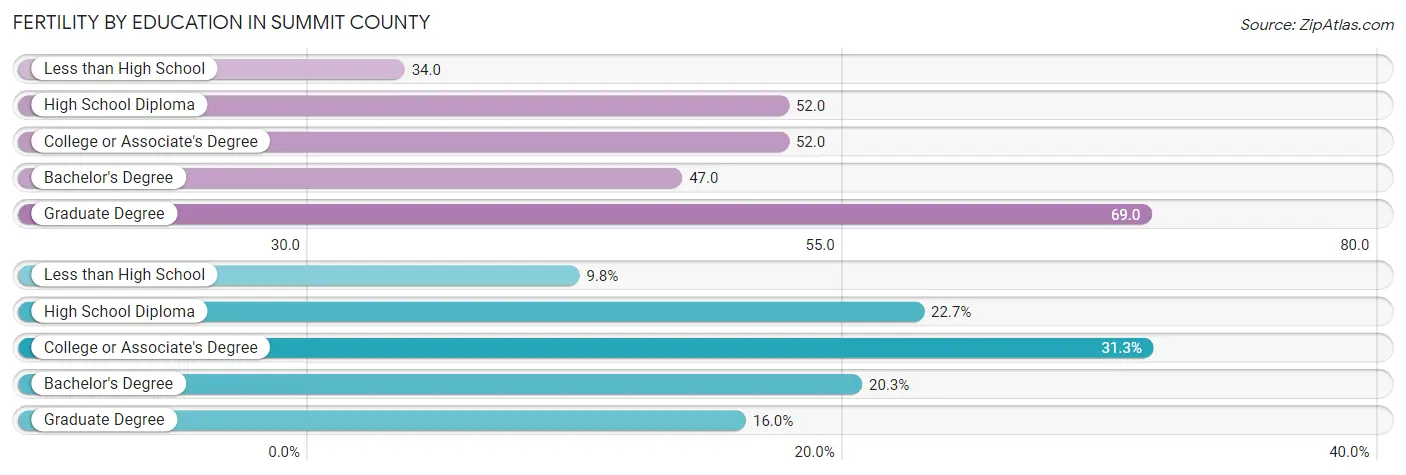
| Educational Attainment | Women with Births | Births / 1,000 Women |
| Less than High School | 589 (9.8%) | 34.0 |
| High School Diploma | 1,369 (22.7%) | 52.0 |
| College or Associate's Degree | 1,889 (31.3%) | 52.0 |
| Bachelor's Degree | 1,229 (20.3%) | 47.0 |
| Graduate Degree | 966 (16.0%) | 69.0 |
| Total | 6,042 (100.0%) | 50.0 |
Fertility by Education by Marriage Status in Summit County
41.1% of women with births in Summit County are unmarried. Women with the educational attainment of graduate degree are most likely to be married with 97.2% of them married at childbirth, while women with the educational attainment of less than high school are least likely to be married with 76.6% of them unmarried at childbirth.
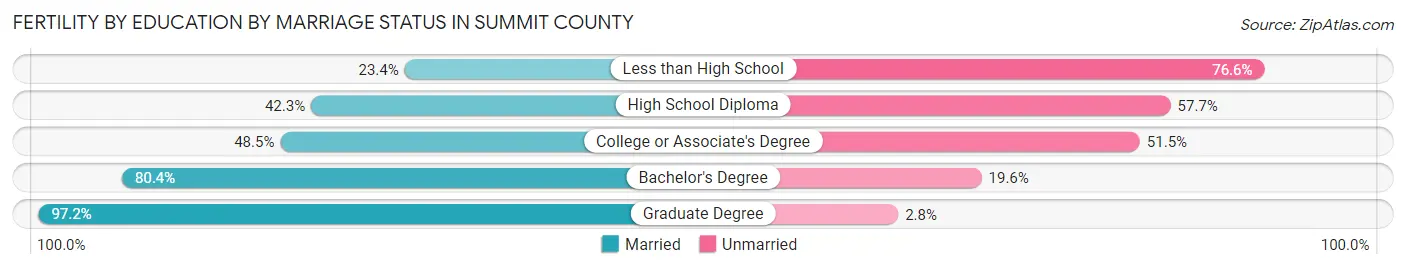
| Educational Attainment | Married | Unmarried |
| Less than High School | 138 (23.4%) | 451 (76.6%) |
| High School Diploma | 579 (42.3%) | 790 (57.7%) |
| College or Associate's Degree | 916 (48.5%) | 973 (51.5%) |
| Bachelor's Degree | 988 (80.4%) | 241 (19.6%) |
| Graduate Degree | 939 (97.2%) | 27 (2.8%) |
| Total | 3,559 (58.9%) | 2,483 (41.1%) |
Income in Summit County
Income Overview in Summit County
Per Capita Income in Summit County is $40,786, while median incomes of families and households are $89,685 and $68,360 respectively.
| Characteristic | Number | Measure |
| Per Capita Income | 539,361 | $40,786 |
| Median Family Income | 137,936 | $89,685 |
| Mean Family Income | 137,936 | $118,314 |
| Median Household Income | 228,635 | $68,360 |
| Mean Household Income | 228,635 | $94,626 |
| Income Deficit | 137,936 | $10,636 |
| Wage / Income Gap (%) | 539,361 | 27.96% |
| Wage / Income Gap ($) | 539,361 | 72.04¢ per $1 |
| Gini / Inequality Index | 539,361 | 0.48 |
Earnings by Sex in Summit County
Average Earnings in Summit County are $40,927, $47,942 for men and $34,539 for women, a difference of 28.0%.
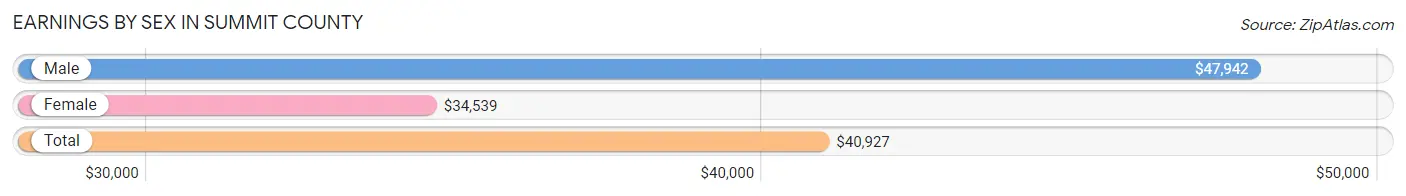
| Sex | Number | Average Earnings |
| Male | 153,670 (51.8%) | $47,942 |
| Female | 142,886 (48.2%) | $34,539 |
| Total | 296,556 (100.0%) | $40,927 |
Earnings by Sex by Income Bracket in Summit County
The most common earnings brackets in Summit County are $100,000+ for men (27,705 | 18.0%) and $75,000 to $99,999 for women (11,243 | 7.9%).
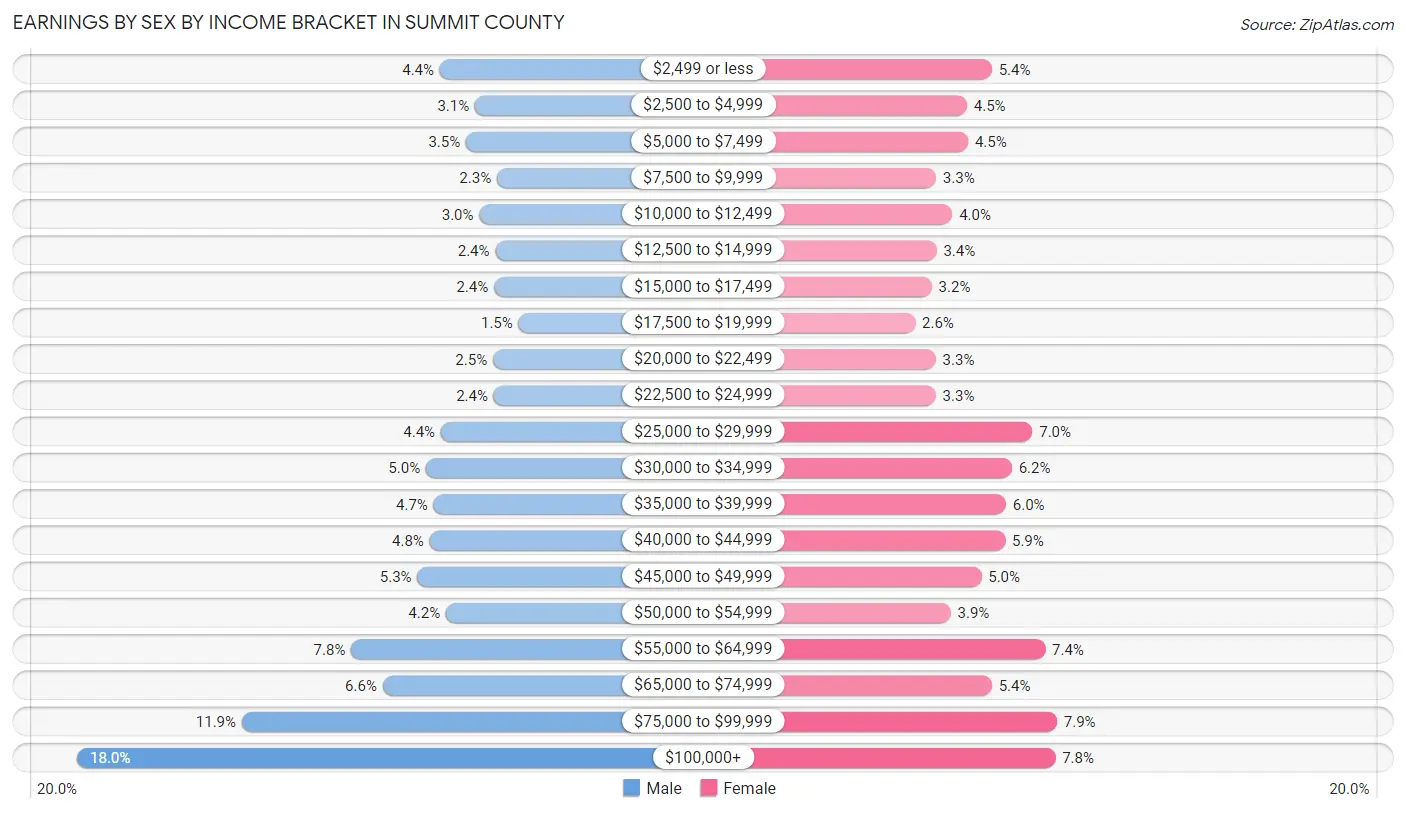
| Income | Male | Female |
| $2,499 or less | 6,828 (4.4%) | 7,757 (5.4%) |
| $2,500 to $4,999 | 4,796 (3.1%) | 6,434 (4.5%) |
| $5,000 to $7,499 | 5,322 (3.5%) | 6,484 (4.5%) |
| $7,500 to $9,999 | 3,527 (2.3%) | 4,771 (3.3%) |
| $10,000 to $12,499 | 4,555 (3.0%) | 5,641 (4.0%) |
| $12,500 to $14,999 | 3,627 (2.4%) | 4,803 (3.4%) |
| $15,000 to $17,499 | 3,703 (2.4%) | 4,549 (3.2%) |
| $17,500 to $19,999 | 2,288 (1.5%) | 3,664 (2.6%) |
| $20,000 to $22,499 | 3,768 (2.5%) | 4,751 (3.3%) |
| $22,500 to $24,999 | 3,725 (2.4%) | 4,763 (3.3%) |
| $25,000 to $29,999 | 6,764 (4.4%) | 9,937 (7.0%) |
| $30,000 to $34,999 | 7,618 (5.0%) | 8,830 (6.2%) |
| $35,000 to $39,999 | 7,184 (4.7%) | 8,510 (6.0%) |
| $40,000 to $44,999 | 7,409 (4.8%) | 8,479 (5.9%) |
| $45,000 to $49,999 | 8,117 (5.3%) | 7,195 (5.0%) |
| $50,000 to $54,999 | 6,475 (4.2%) | 5,553 (3.9%) |
| $55,000 to $64,999 | 11,924 (7.8%) | 10,616 (7.4%) |
| $65,000 to $74,999 | 10,104 (6.6%) | 7,752 (5.4%) |
| $75,000 to $99,999 | 18,231 (11.9%) | 11,243 (7.9%) |
| $100,000+ | 27,705 (18.0%) | 11,154 (7.8%) |
| Total | 153,670 (100.0%) | 142,886 (100.0%) |
Earnings by Sex by Educational Attainment in Summit County
Average earnings in Summit County are $55,678 for men and $39,819 for women, a difference of 28.5%. Men with an educational attainment of graduate degree enjoy the highest average annual earnings of $94,011, while those with less than high school education earn the least with $33,933. Women with an educational attainment of graduate degree earn the most with the average annual earnings of $71,288, while those with less than high school education have the smallest earnings of $21,585.
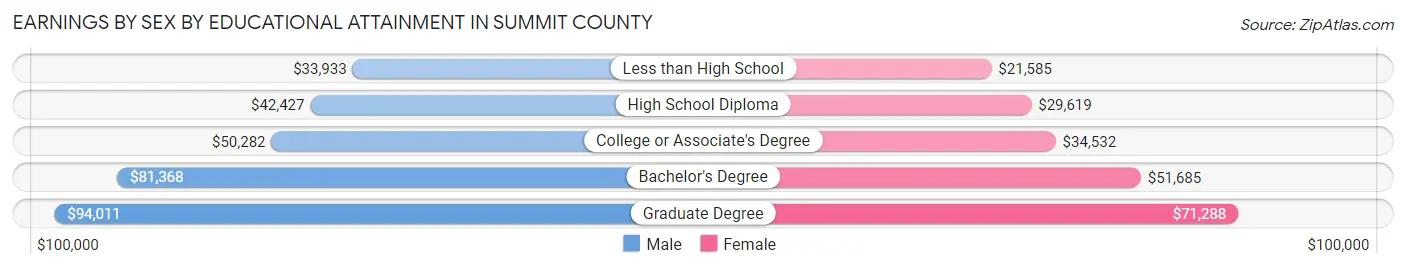
| Educational Attainment | Male Income | Female Income |
| Less than High School | $33,933 | $21,585 |
| High School Diploma | $42,427 | $29,619 |
| College or Associate's Degree | $50,282 | $34,532 |
| Bachelor's Degree | $81,368 | $51,685 |
| Graduate Degree | $94,011 | $71,288 |
| Total | $55,678 | $39,819 |
Family Income in Summit County
Family Income Brackets in Summit County
According to the Summit County family income data, there are 27,449 families falling into the $100,000 to $149,999 income range, which is the most common income bracket and makes up 19.9% of all families. Conversely, the $10,000 to $14,999 income bracket is the least frequent group with only 2,897 families (2.1%) belonging to this category.
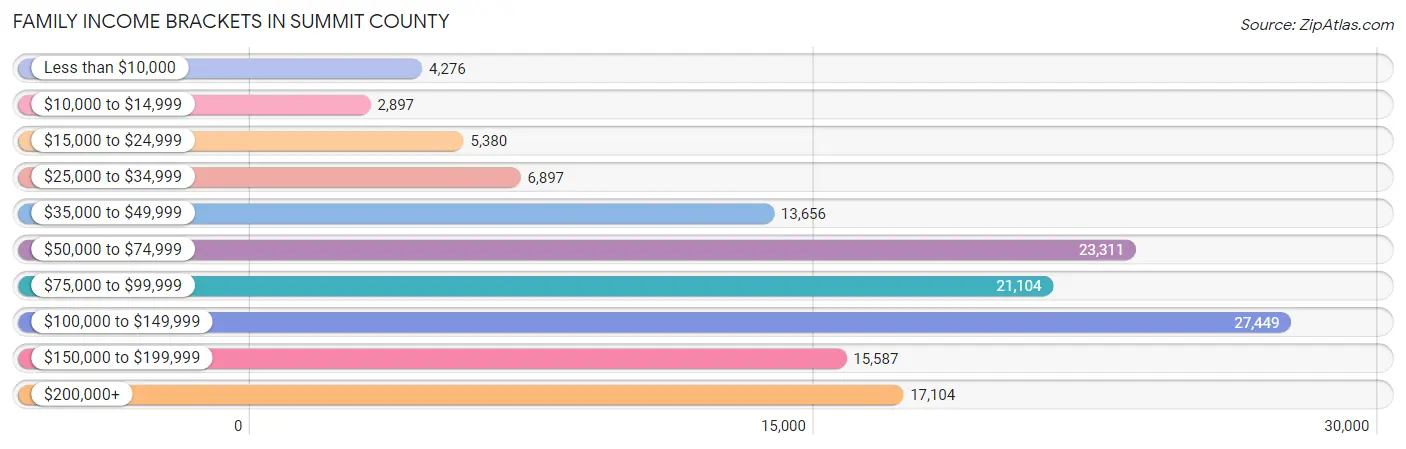
| Income Bracket | # Families | % Families |
| Less than $10,000 | 4,276 | 3.1% |
| $10,000 to $14,999 | 2,897 | 2.1% |
| $15,000 to $24,999 | 5,380 | 3.9% |
| $25,000 to $34,999 | 6,897 | 5.0% |
| $35,000 to $49,999 | 13,656 | 9.9% |
| $50,000 to $74,999 | 23,311 | 16.9% |
| $75,000 to $99,999 | 21,104 | 15.3% |
| $100,000 to $149,999 | 27,449 | 19.9% |
| $150,000 to $199,999 | 15,587 | 11.3% |
| $200,000+ | 17,104 | 12.4% |
Family Income by Famaliy Size in Summit County
4-person families (23,440 | 17.0%) account for the highest median family income in Summit County with $115,571 per family, while 2-person families (70,914 | 51.4%) have the highest median income of $39,681 per family member.

| Income Bracket | # Families | Median Income |
| 2-Person Families | 70,914 (51.4%) | $79,362 |
| 3-Person Families | 29,734 (21.6%) | $92,404 |
| 4-Person Families | 23,440 (17.0%) | $115,571 |
| 5-Person Families | 9,259 (6.7%) | $106,587 |
| 6-Person Families | 2,894 (2.1%) | $110,500 |
| 7+ Person Families | 1,695 (1.2%) | $96,964 |
| Total | 137,936 (100.0%) | $89,685 |
Family Income by Number of Earners in Summit County
The median family income in Summit County is $89,685, with families comprising 3+ earners (15,659) having the highest median family income of $143,892, while families with no earners (21,117) have the lowest median family income of $53,534, accounting for 11.4% and 15.3% of families, respectively.
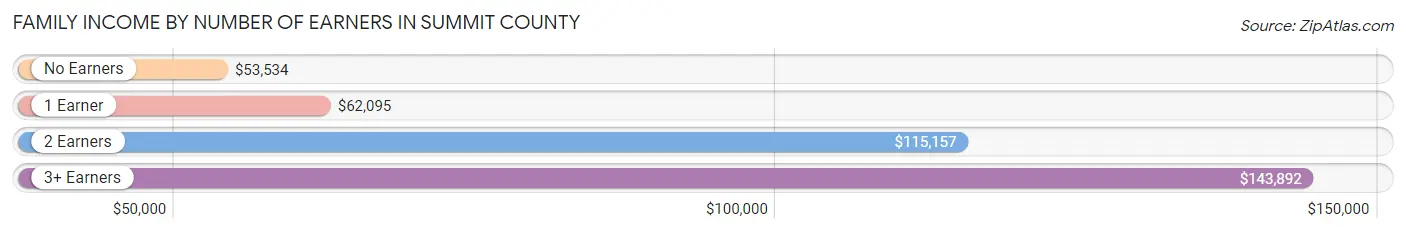
| Number of Earners | # Families | Median Income |
| No Earners | 21,117 (15.3%) | $53,534 |
| 1 Earner | 44,001 (31.9%) | $62,095 |
| 2 Earners | 57,159 (41.4%) | $115,157 |
| 3+ Earners | 15,659 (11.4%) | $143,892 |
| Total | 137,936 (100.0%) | $89,685 |
Household Income in Summit County
Household Income Brackets in Summit County
With 39,097 households falling in the category, the $50,000 to $74,999 income range is the most frequent in Summit County, accounting for 17.1% of all households. In contrast, only 10,289 households (4.5%) fall into the $10,000 to $14,999 income bracket, making it the least populous group.
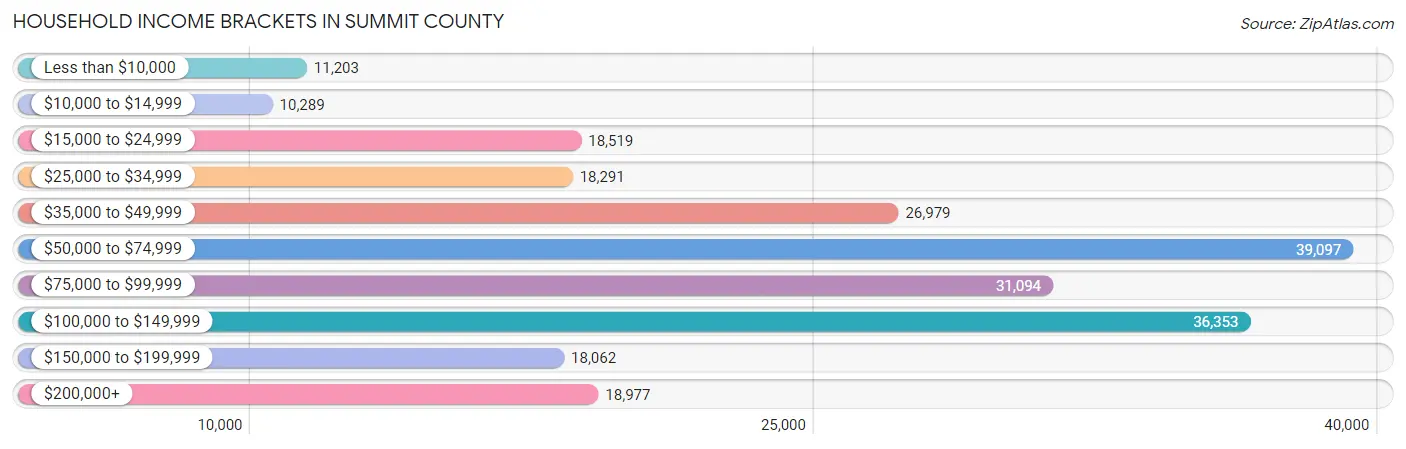
| Income Bracket | # Households | % Households |
| Less than $10,000 | 11,203 | 4.9% |
| $10,000 to $14,999 | 10,289 | 4.5% |
| $15,000 to $24,999 | 18,519 | 8.1% |
| $25,000 to $34,999 | 18,291 | 8.0% |
| $35,000 to $49,999 | 26,979 | 11.8% |
| $50,000 to $74,999 | 39,097 | 17.1% |
| $75,000 to $99,999 | 31,094 | 13.6% |
| $100,000 to $149,999 | 36,353 | 15.9% |
| $150,000 to $199,999 | 18,062 | 7.9% |
| $200,000+ | 18,977 | 8.3% |
Household Income by Householder Age in Summit County
The median household income in Summit County is $68,360, with the highest median household income of $85,083 found in the 45 to 64 years age bracket for the primary householder. A total of 84,793 households (37.1%) fall into this category. Meanwhile, the 15 to 24 years age bracket for the primary householder has the lowest median household income of $38,712, with 8,685 households (3.8%) in this group.
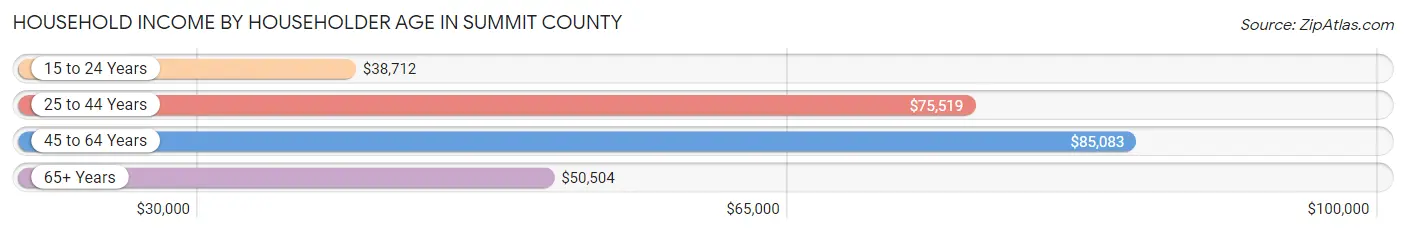
| Income Bracket | # Households | Median Income |
| 15 to 24 Years | 8,685 (3.8%) | $38,712 |
| 25 to 44 Years | 70,463 (30.8%) | $75,519 |
| 45 to 64 Years | 84,793 (37.1%) | $85,083 |
| 65+ Years | 64,694 (28.3%) | $50,504 |
| Total | 228,635 (100.0%) | $68,360 |
Poverty in Summit County
Income Below Poverty by Sex and Age in Summit County
With 11.2% poverty level for males and 13.6% for females among the residents of Summit County, 5 year old males and 18 to 24 year old females are the most vulnerable to poverty, with 765 males (22.2%) and 4,524 females (21.1%) in their respective age groups living below the poverty level.
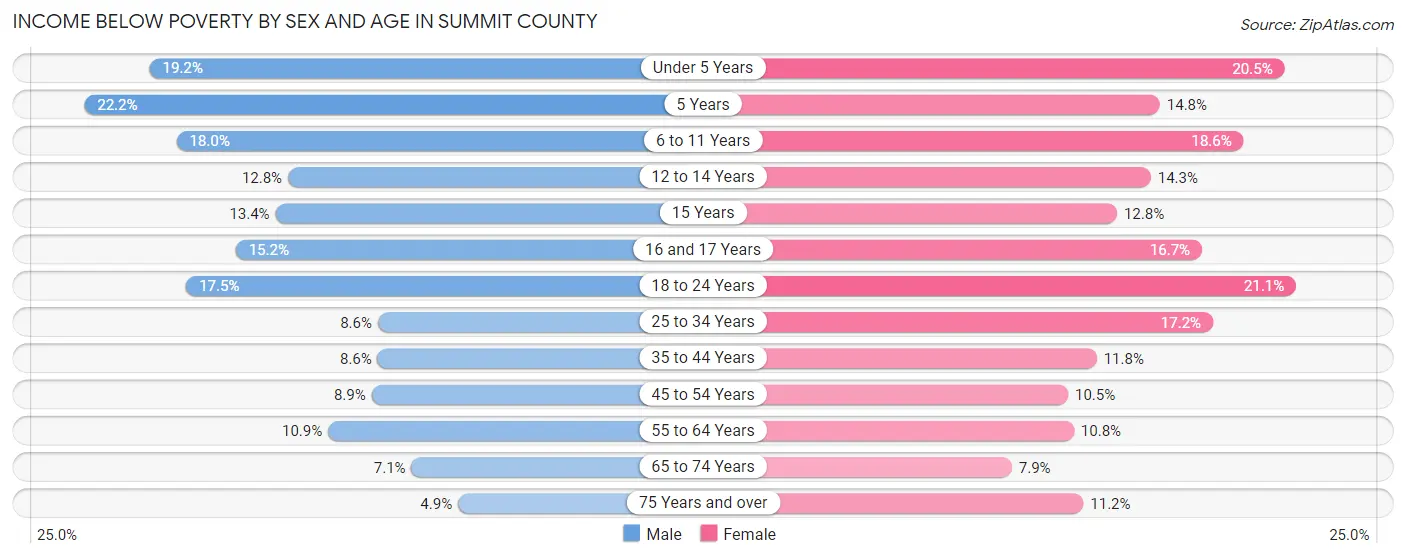
| Age Bracket | Male | Female |
| Under 5 Years | 2,741 (19.2%) | 2,909 (20.5%) |
| 5 Years | 765 (22.2%) | 464 (14.8%) |
| 6 to 11 Years | 3,359 (17.9%) | 3,352 (18.6%) |
| 12 to 14 Years | 1,195 (12.8%) | 1,322 (14.3%) |
| 15 Years | 455 (13.4%) | 398 (12.8%) |
| 16 and 17 Years | 1,029 (15.2%) | 1,118 (16.7%) |
| 18 to 24 Years | 3,843 (17.5%) | 4,524 (21.1%) |
| 25 to 34 Years | 3,052 (8.6%) | 6,164 (17.2%) |
| 35 to 44 Years | 2,791 (8.6%) | 3,843 (11.8%) |
| 45 to 54 Years | 2,932 (8.9%) | 3,580 (10.5%) |
| 55 to 64 Years | 4,011 (10.9%) | 4,236 (10.8%) |
| 65 to 74 Years | 1,934 (7.0%) | 2,476 (7.9%) |
| 75 Years and over | 770 (4.9%) | 2,576 (11.2%) |
| Total | 28,877 (11.2%) | 36,962 (13.6%) |
Income Above Poverty by Sex and Age in Summit County
According to the poverty statistics in Summit County, males aged 75 years and over and females aged 65 to 74 years are the age groups that are most secure financially, with 95.1% of males and 92.1% of females in these age groups living above the poverty line.
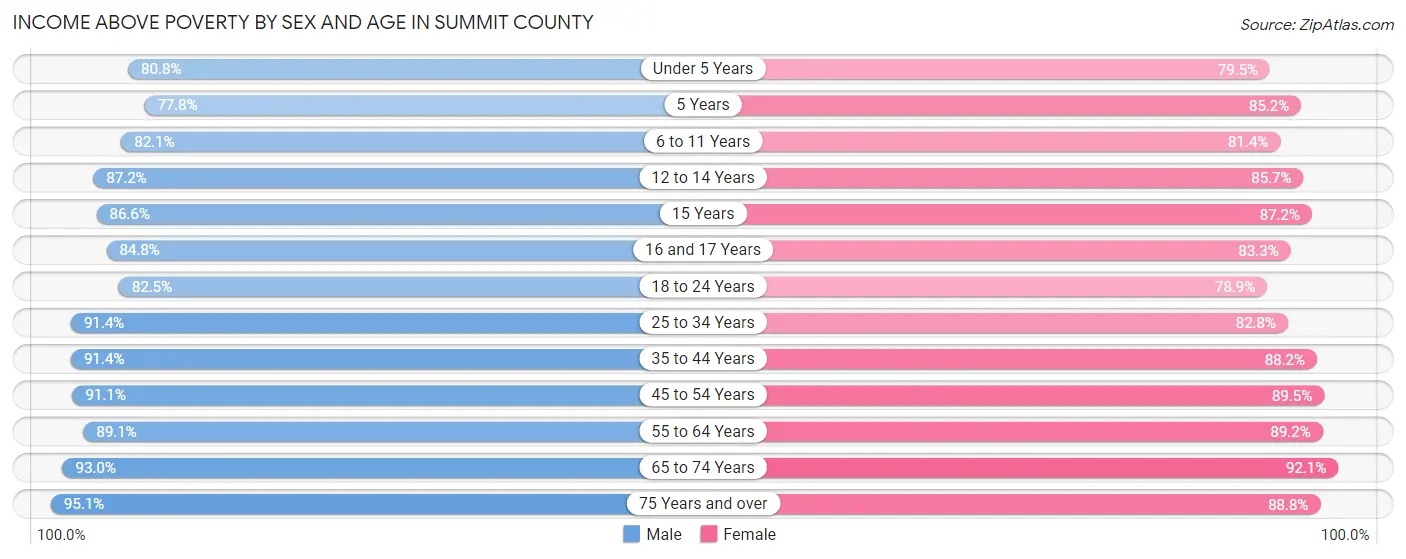
| Age Bracket | Male | Female |
| Under 5 Years | 11,534 (80.8%) | 11,253 (79.5%) |
| 5 Years | 2,677 (77.8%) | 2,680 (85.2%) |
| 6 to 11 Years | 15,352 (82.1%) | 14,628 (81.4%) |
| 12 to 14 Years | 8,156 (87.2%) | 7,896 (85.7%) |
| 15 Years | 2,951 (86.6%) | 2,719 (87.2%) |
| 16 and 17 Years | 5,742 (84.8%) | 5,571 (83.3%) |
| 18 to 24 Years | 18,121 (82.5%) | 16,940 (78.9%) |
| 25 to 34 Years | 32,380 (91.4%) | 29,638 (82.8%) |
| 35 to 44 Years | 29,578 (91.4%) | 28,647 (88.2%) |
| 45 to 54 Years | 30,020 (91.1%) | 30,513 (89.5%) |
| 55 to 64 Years | 32,705 (89.1%) | 35,090 (89.2%) |
| 65 to 74 Years | 25,498 (92.9%) | 28,903 (92.1%) |
| 75 Years and over | 14,990 (95.1%) | 20,394 (88.8%) |
| Total | 229,704 (88.8%) | 234,872 (86.4%) |
Income Below Poverty Among Married-Couple Families in Summit County
The poverty statistics for married-couple families in Summit County show that 3.2% or 3,105 of the total 98,562 families live below the poverty line. Families with 5 or more children have the highest poverty rate of 21.1%, comprising of 135 families. On the other hand, families with no children have the lowest poverty rate of 2.2%, which includes 1,356 families.
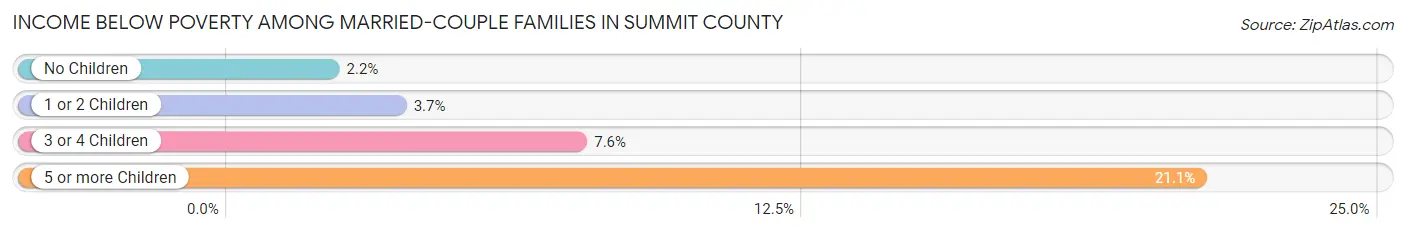
| Children | Above Poverty | Below Poverty |
| No Children | 59,934 (97.8%) | 1,356 (2.2%) |
| 1 or 2 Children | 28,662 (96.3%) | 1,091 (3.7%) |
| 3 or 4 Children | 6,356 (92.4%) | 523 (7.6%) |
| 5 or more Children | 505 (78.9%) | 135 (21.1%) |
| Total | 95,457 (96.9%) | 3,105 (3.2%) |
Income Below Poverty Among Single-Parent Households in Summit County
According to the poverty data in Summit County, 14.0% or 1,480 single-father households and 25.7% or 7,422 single-mother households are living below the poverty line. Among single-father households, those with 5 or more children have the highest poverty rate, with 17 households (21.2%) experiencing poverty. Likewise, among single-mother households, those with 5 or more children have the highest poverty rate, with 156 households (63.7%) falling below the poverty line.
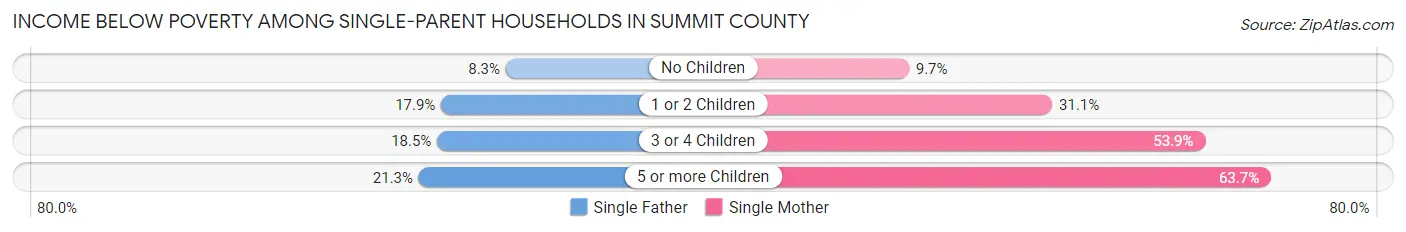
| Children | Single Father | Single Mother |
| No Children | 358 (8.3%) | 1,069 (9.7%) |
| 1 or 2 Children | 990 (17.9%) | 4,450 (31.1%) |
| 3 or 4 Children | 115 (18.5%) | 1,747 (53.9%) |
| 5 or more Children | 17 (21.2%) | 156 (63.7%) |
| Total | 1,480 (14.0%) | 7,422 (25.7%) |
Income Below Poverty Among Married-Couple vs Single-Parent Households in Summit County
The poverty data for Summit County shows that 3,105 of the married-couple family households (3.2%) and 8,902 of the single-parent households (22.6%) are living below the poverty level. Within the married-couple family households, those with 5 or more children have the highest poverty rate, with 135 households (21.1%) falling below the poverty line. Among the single-parent households, those with 5 or more children have the highest poverty rate, with 173 household (53.2%) living below poverty.
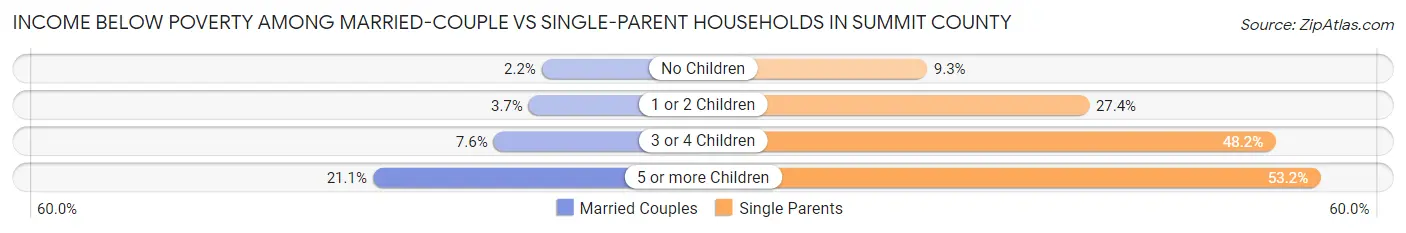
| Children | Married-Couple Families | Single-Parent Households |
| No Children | 1,356 (2.2%) | 1,427 (9.3%) |
| 1 or 2 Children | 1,091 (3.7%) | 5,440 (27.4%) |
| 3 or 4 Children | 523 (7.6%) | 1,862 (48.2%) |
| 5 or more Children | 135 (21.1%) | 173 (53.2%) |
| Total | 3,105 (3.2%) | 8,902 (22.6%) |
Employment Characteristics in Summit County
Employment by Class of Employer in Summit County
Among the 264,826 employed individuals in Summit County, private company employees (186,185 | 70.3%), not-for-profit organizations (27,206 | 10.3%), and local government employees (19,267 | 7.3%) make up the most common classes of employment.
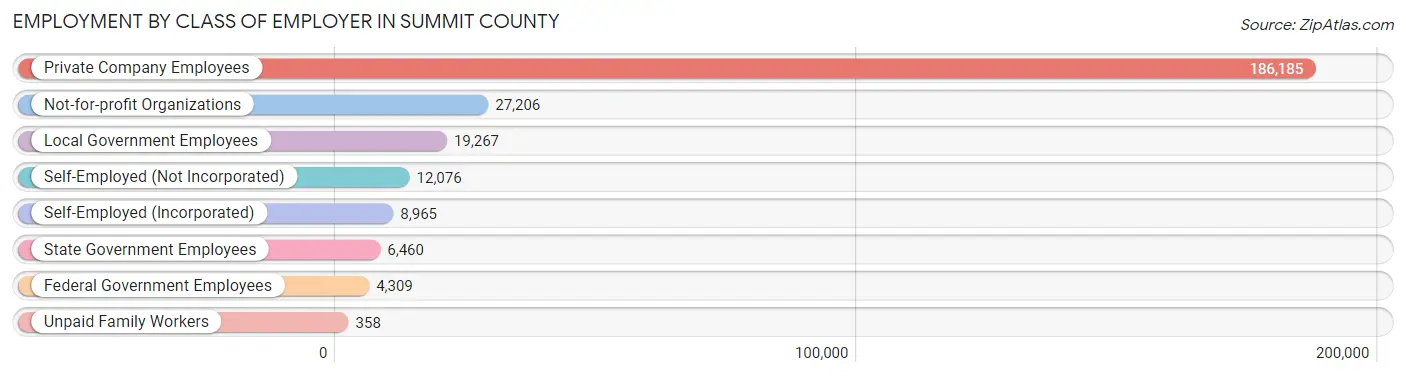
| Employer Class | # Employees | % Employees |
| Private Company Employees | 186,185 | 70.3% |
| Self-Employed (Incorporated) | 8,965 | 3.4% |
| Self-Employed (Not Incorporated) | 12,076 | 4.6% |
| Not-for-profit Organizations | 27,206 | 10.3% |
| Local Government Employees | 19,267 | 7.3% |
| State Government Employees | 6,460 | 2.4% |
| Federal Government Employees | 4,309 | 1.6% |
| Unpaid Family Workers | 358 | 0.1% |
| Total | 264,826 | 100.0% |
Employment Status by Age in Summit County
According to the labor force statistics for Summit County, out of the total population over 16 years of age (440,967), 64.8% or 285,747 individuals are in the labor force, with 5.3% or 15,145 of them unemployed. The age group with the highest labor force participation rate is 25 to 29 years, with 87.4% or 31,939 individuals in the labor force. Within the labor force, the 16 to 19 years age range has the highest percentage of unemployed individuals, with 12.7% or 1,668 of them being unemployed.
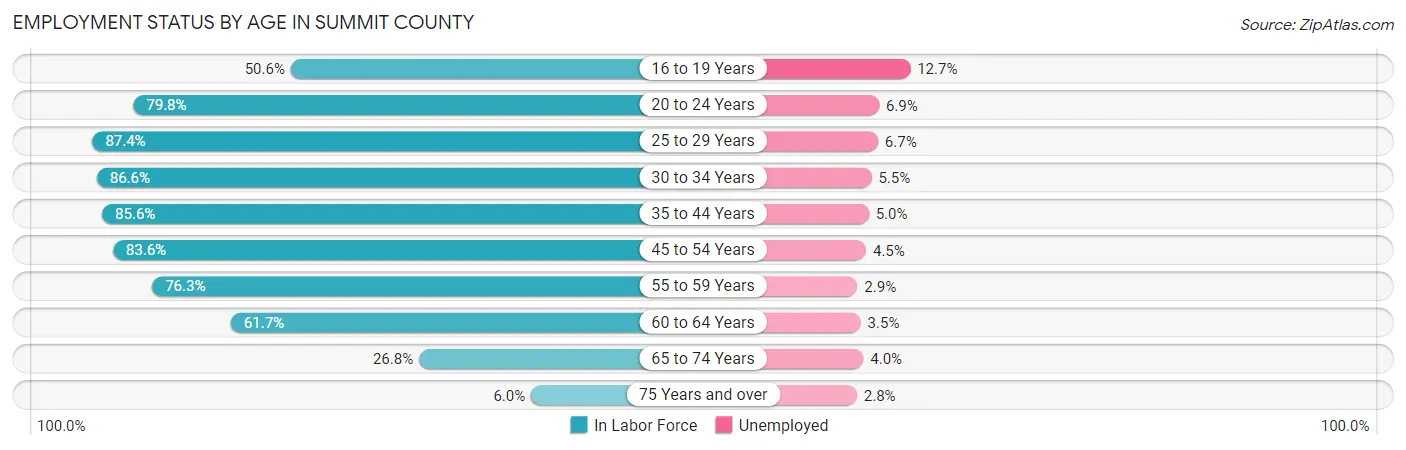
| Age Bracket | In Labor Force | Unemployed |
| 16 to 19 Years | 13,130 (50.6%) | 1,668 (12.7%) |
| 20 to 24 Years | 26,557 (79.8%) | 1,832 (6.9%) |
| 25 to 29 Years | 31,939 (87.4%) | 2,140 (6.7%) |
| 30 to 34 Years | 30,573 (86.6%) | 1,682 (5.5%) |
| 35 to 44 Years | 55,841 (85.6%) | 2,792 (5.0%) |
| 45 to 54 Years | 56,361 (83.6%) | 2,536 (4.5%) |
| 55 to 59 Years | 28,858 (76.3%) | 837 (2.9%) |
| 60 to 64 Years | 24,104 (61.7%) | 844 (3.5%) |
| 65 to 74 Years | 15,963 (26.8%) | 639 (4.0%) |
| 75 Years and over | 2,447 (6.0%) | 69 (2.8%) |
| Total | 285,747 (64.8%) | 15,145 (5.3%) |
Employment Status by Educational Attainment in Summit County
According to labor force statistics for Summit County, 80.9% of individuals (227,643) out of the total population between 25 and 64 years of age (281,388) are in the labor force, with 4.8% or 10,927 of them being unemployed. The group with the highest labor force participation rate are those with the educational attainment of bachelor's degree or higher, with 88.5% or 91,566 individuals in the labor force. Within the labor force, individuals with less than high school education have the highest percentage of unemployment, with 12.9% or 1,441 of them being unemployed.
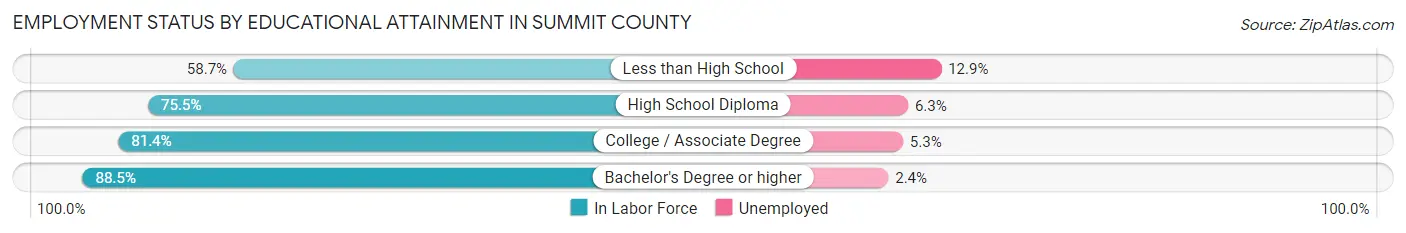
| Educational Attainment | In Labor Force | Unemployed |
| Less than High School | 11,167 (58.7%) | 2,454 (12.9%) |
| High School Diploma | 56,792 (75.5%) | 4,739 (6.3%) |
| College / Associate Degree | 68,116 (81.4%) | 4,435 (5.3%) |
| Bachelor's Degree or higher | 91,566 (88.5%) | 2,483 (2.4%) |
| Total | 227,643 (80.9%) | 13,507 (4.8%) |
Employment Occupations by Sex in Summit County
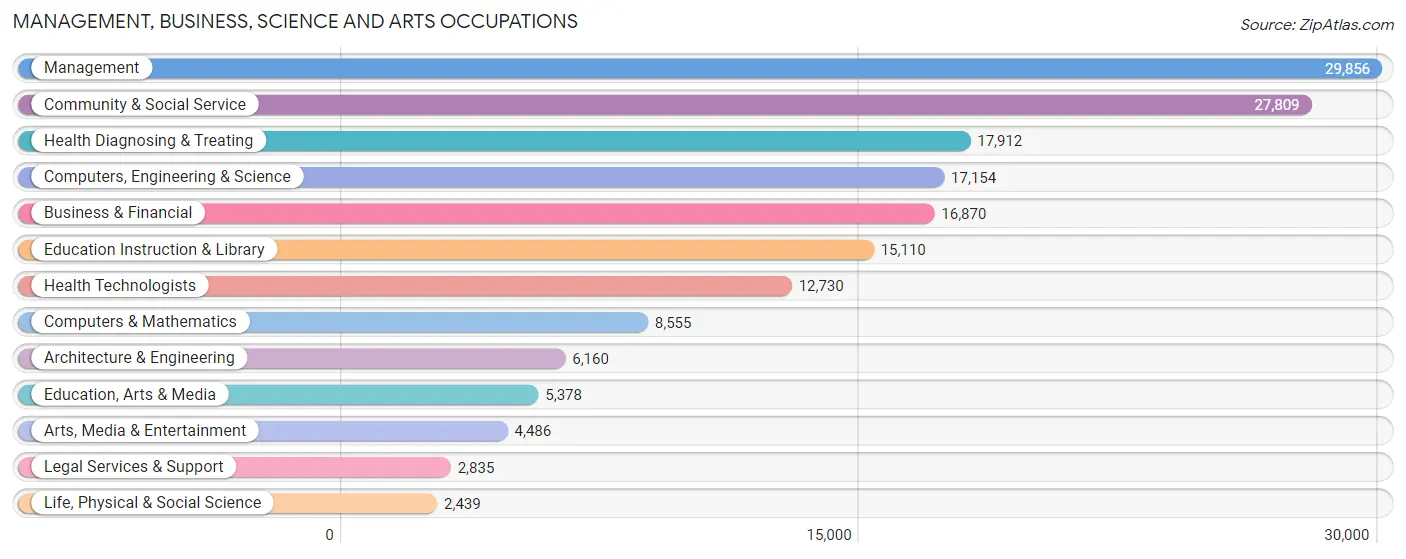
Management, Business, Science and Arts Occupations
The most common Management, Business, Science and Arts occupations in Summit County are Management (29,856 | 11.1%), Community & Social Service (27,809 | 10.3%), Health Diagnosing & Treating (17,912 | 6.6%), Computers, Engineering & Science (17,154 | 6.4%), and Business & Financial (16,870 | 6.2%).
Management, Business, Science and Arts Occupations by Sex
Within the Management, Business, Science and Arts occupations in Summit County, the most male-oriented occupations are Architecture & Engineering (83.4%), Computers, Engineering & Science (75.9%), and Computers & Mathematics (74.7%), while the most female-oriented occupations are Health Diagnosing & Treating (76.5%), Health Technologists (74.3%), and Education Instruction & Library (73.2%).
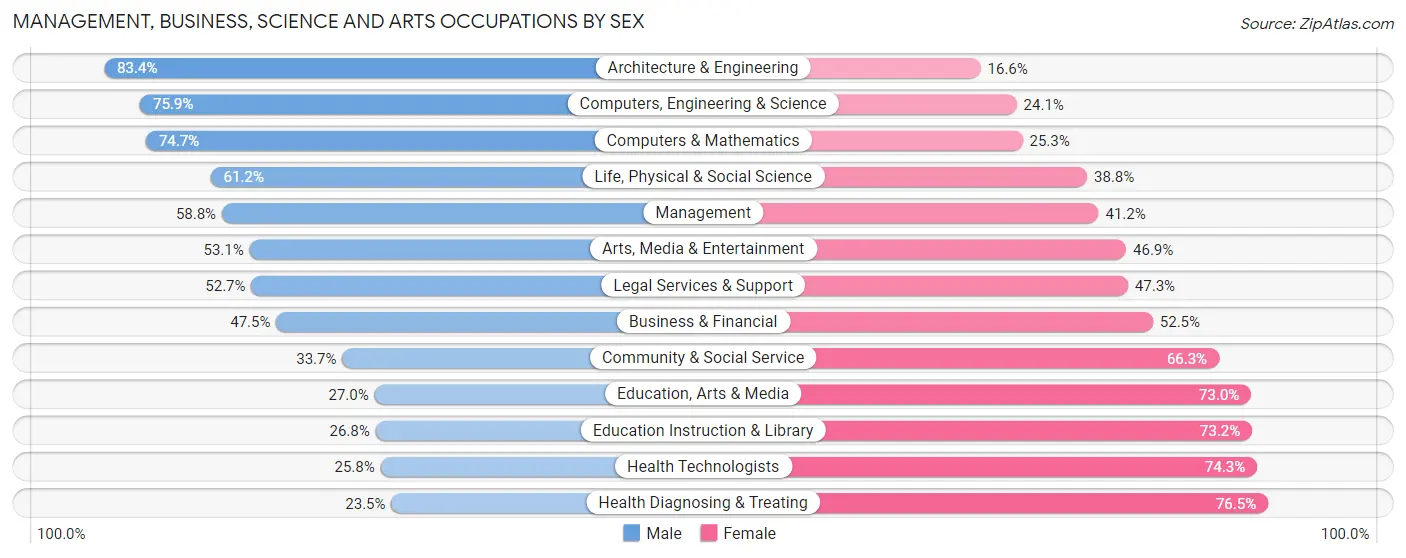
| Occupation | Male | Female |
| Management | 17,565 (58.8%) | 12,291 (41.2%) |
| Business & Financial | 8,013 (47.5%) | 8,857 (52.5%) |
| Computers, Engineering & Science | 13,021 (75.9%) | 4,133 (24.1%) |
| Computers & Mathematics | 6,389 (74.7%) | 2,166 (25.3%) |
| Architecture & Engineering | 5,139 (83.4%) | 1,021 (16.6%) |
| Life, Physical & Social Science | 1,493 (61.2%) | 946 (38.8%) |
| Community & Social Service | 9,377 (33.7%) | 18,432 (66.3%) |
| Education, Arts & Media | 1,452 (27.0%) | 3,926 (73.0%) |
| Legal Services & Support | 1,494 (52.7%) | 1,341 (47.3%) |
| Education Instruction & Library | 4,050 (26.8%) | 11,060 (73.2%) |
| Arts, Media & Entertainment | 2,381 (53.1%) | 2,105 (46.9%) |
| Health Diagnosing & Treating | 4,208 (23.5%) | 13,704 (76.5%) |
| Health Technologists | 3,278 (25.8%) | 9,452 (74.3%) |
| Total (Category) | 52,184 (47.6%) | 57,417 (52.4%) |
| Total (Overall) | 140,253 (51.9%) | 130,018 (48.1%) |
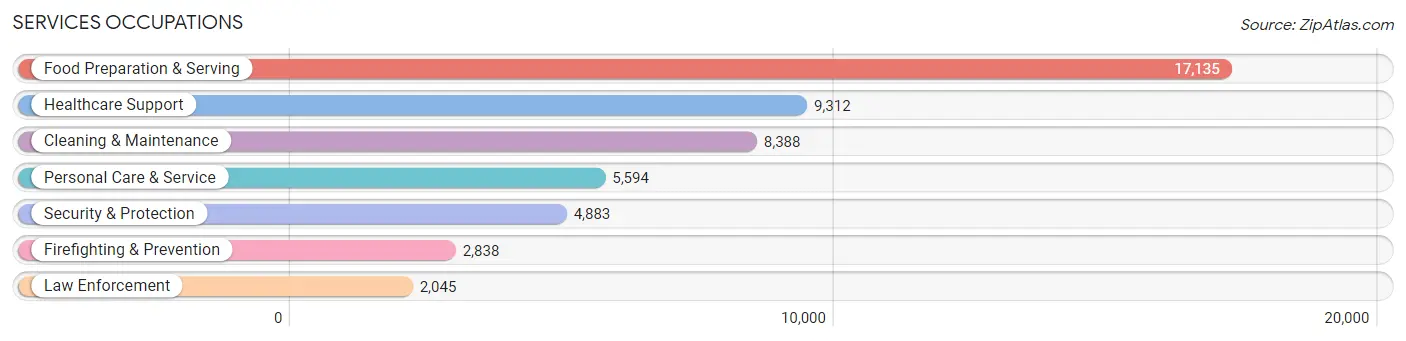
Services Occupations
The most common Services occupations in Summit County are Food Preparation & Serving (17,135 | 6.3%), Healthcare Support (9,312 | 3.5%), Cleaning & Maintenance (8,388 | 3.1%), Personal Care & Service (5,594 | 2.1%), and Security & Protection (4,883 | 1.8%).
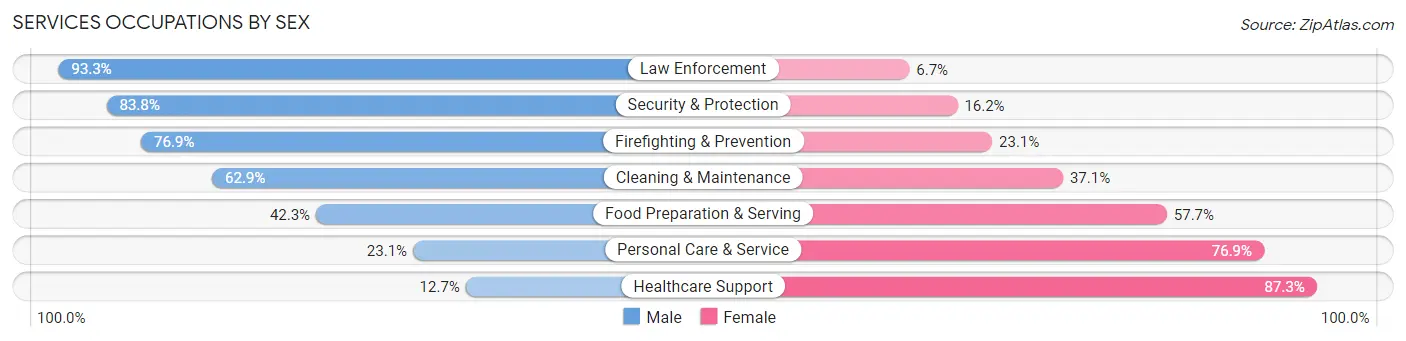
Services Occupations by Sex
Within the Services occupations in Summit County, the most male-oriented occupations are Law Enforcement (93.3%), Security & Protection (83.8%), and Firefighting & Prevention (76.9%), while the most female-oriented occupations are Healthcare Support (87.3%), Personal Care & Service (76.9%), and Food Preparation & Serving (57.7%).
| Occupation | Male | Female |
| Healthcare Support | 1,179 (12.7%) | 8,133 (87.3%) |
| Security & Protection | 4,091 (83.8%) | 792 (16.2%) |
| Firefighting & Prevention | 2,183 (76.9%) | 655 (23.1%) |
| Law Enforcement | 1,908 (93.3%) | 137 (6.7%) |
| Food Preparation & Serving | 7,250 (42.3%) | 9,885 (57.7%) |
| Cleaning & Maintenance | 5,274 (62.9%) | 3,114 (37.1%) |
| Personal Care & Service | 1,293 (23.1%) | 4,301 (76.9%) |
| Total (Category) | 19,087 (42.1%) | 26,225 (57.9%) |
| Total (Overall) | 140,253 (51.9%) | 130,018 (48.1%) |
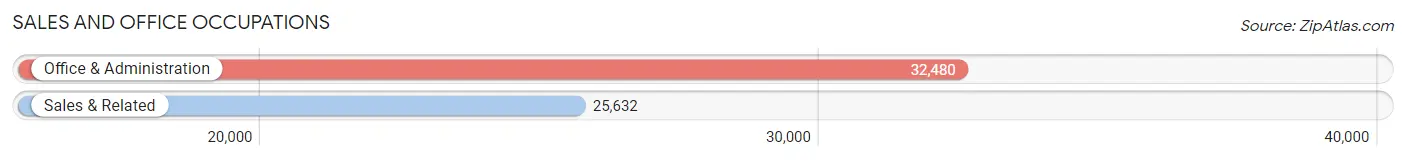
Sales and Office Occupations
The most common Sales and Office occupations in Summit County are Office & Administration (32,480 | 12.0%), and Sales & Related (25,632 | 9.5%).
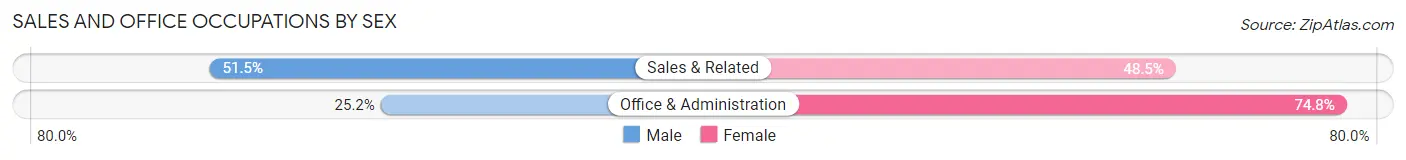
Sales and Office Occupations by Sex
| Occupation | Male | Female |
| Sales & Related | 13,207 (51.5%) | 12,425 (48.5%) |
| Office & Administration | 8,195 (25.2%) | 24,285 (74.8%) |
| Total (Category) | 21,402 (36.8%) | 36,710 (63.2%) |
| Total (Overall) | 140,253 (51.9%) | 130,018 (48.1%) |
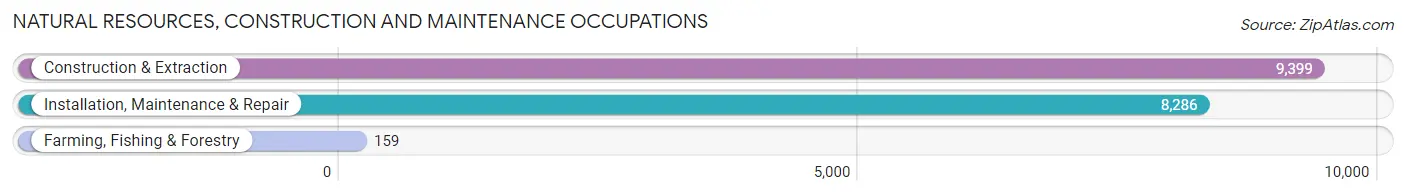
Natural Resources, Construction and Maintenance Occupations
The most common Natural Resources, Construction and Maintenance occupations in Summit County are Construction & Extraction (9,399 | 3.5%), Installation, Maintenance & Repair (8,286 | 3.1%), and Farming, Fishing & Forestry (159 | 0.1%).
Natural Resources, Construction and Maintenance Occupations by Sex
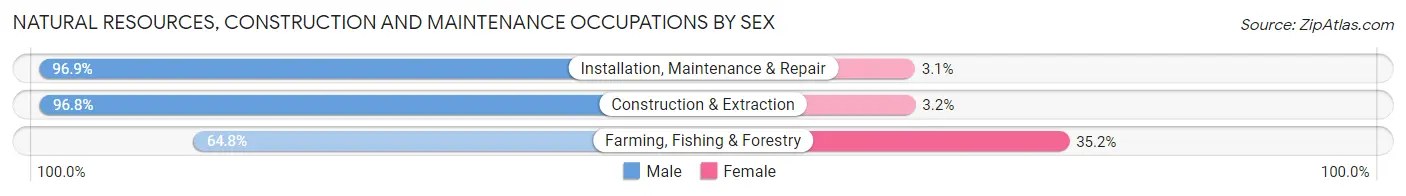
| Occupation | Male | Female |
| Farming, Fishing & Forestry | 103 (64.8%) | 56 (35.2%) |
| Construction & Extraction | 9,096 (96.8%) | 303 (3.2%) |
| Installation, Maintenance & Repair | 8,030 (96.9%) | 256 (3.1%) |
| Total (Category) | 17,229 (96.6%) | 615 (3.5%) |
| Total (Overall) | 140,253 (51.9%) | 130,018 (48.1%) |
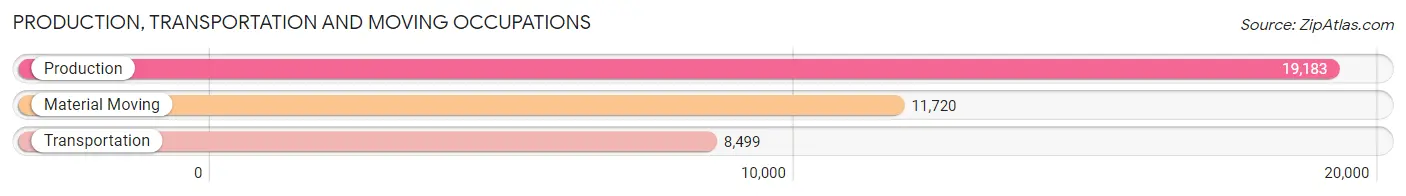
Production, Transportation and Moving Occupations
The most common Production, Transportation and Moving occupations in Summit County are Production (19,183 | 7.1%), Material Moving (11,720 | 4.3%), and Transportation (8,499 | 3.1%).
Production, Transportation and Moving Occupations by Sex
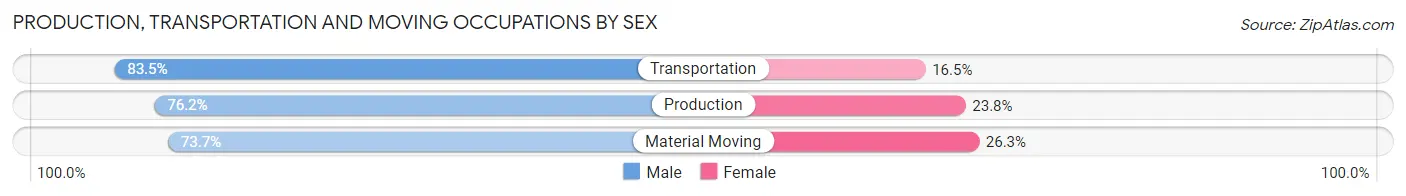
| Occupation | Male | Female |
| Production | 14,613 (76.2%) | 4,570 (23.8%) |
| Transportation | 7,100 (83.5%) | 1,399 (16.5%) |
| Material Moving | 8,638 (73.7%) | 3,082 (26.3%) |
| Total (Category) | 30,351 (77.0%) | 9,051 (23.0%) |
| Total (Overall) | 140,253 (51.9%) | 130,018 (48.1%) |
Employment Industries by Sex in Summit County
Employment Industries in Summit County
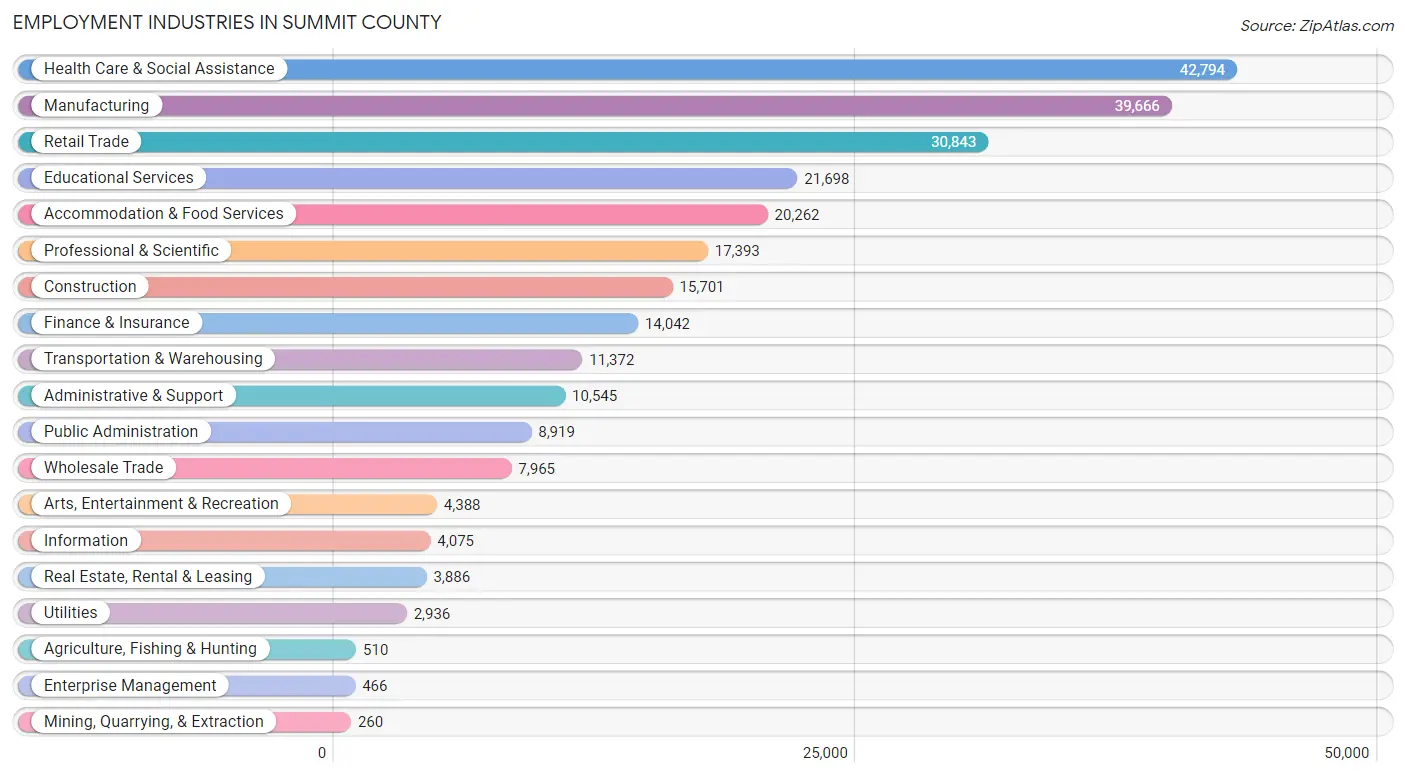
The major employment industries in Summit County include Health Care & Social Assistance (42,794 | 15.8%), Manufacturing (39,666 | 14.7%), Retail Trade (30,843 | 11.4%), Educational Services (21,698 | 8.0%), and Accommodation & Food Services (20,262 | 7.5%).
Employment Industries by Sex in Summit County
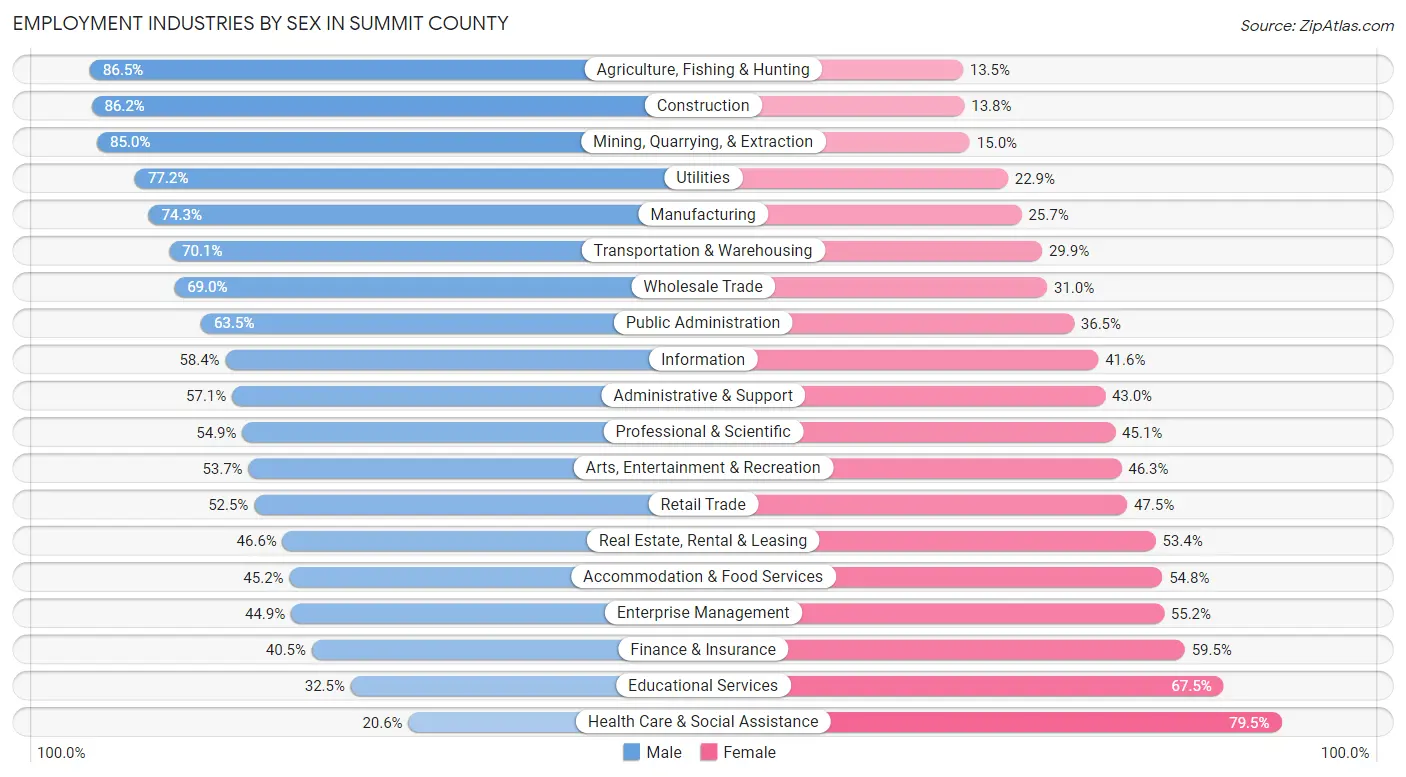
The Summit County industries that see more men than women are Agriculture, Fishing & Hunting (86.5%), Construction (86.2%), and Mining, Quarrying, & Extraction (85.0%), whereas the industries that tend to have a higher number of women are Health Care & Social Assistance (79.4%), Educational Services (67.5%), and Finance & Insurance (59.5%).
| Industry | Male | Female |
| Agriculture, Fishing & Hunting | 441 (86.5%) | 69 (13.5%) |
| Mining, Quarrying, & Extraction | 221 (85.0%) | 39 (15.0%) |
| Construction | 13,528 (86.2%) | 2,173 (13.8%) |
| Manufacturing | 29,479 (74.3%) | 10,187 (25.7%) |
| Wholesale Trade | 5,498 (69.0%) | 2,467 (31.0%) |
| Retail Trade | 16,185 (52.5%) | 14,658 (47.5%) |
| Transportation & Warehousing | 7,969 (70.1%) | 3,403 (29.9%) |
| Utilities | 2,265 (77.1%) | 671 (22.9%) |
| Information | 2,381 (58.4%) | 1,694 (41.6%) |
| Finance & Insurance | 5,692 (40.5%) | 8,350 (59.5%) |
| Real Estate, Rental & Leasing | 1,810 (46.6%) | 2,076 (53.4%) |
| Professional & Scientific | 9,554 (54.9%) | 7,839 (45.1%) |
| Enterprise Management | 209 (44.9%) | 257 (55.1%) |
| Administrative & Support | 6,016 (57.1%) | 4,529 (42.9%) |
| Educational Services | 7,048 (32.5%) | 14,650 (67.5%) |
| Health Care & Social Assistance | 8,793 (20.5%) | 34,001 (79.4%) |
| Arts, Entertainment & Recreation | 2,355 (53.7%) | 2,033 (46.3%) |
| Accommodation & Food Services | 9,156 (45.2%) | 11,106 (54.8%) |
| Public Administration | 5,662 (63.5%) | 3,257 (36.5%) |
| Total | 140,253 (51.9%) | 130,018 (48.1%) |
Education in Summit County
School Enrollment in Summit County
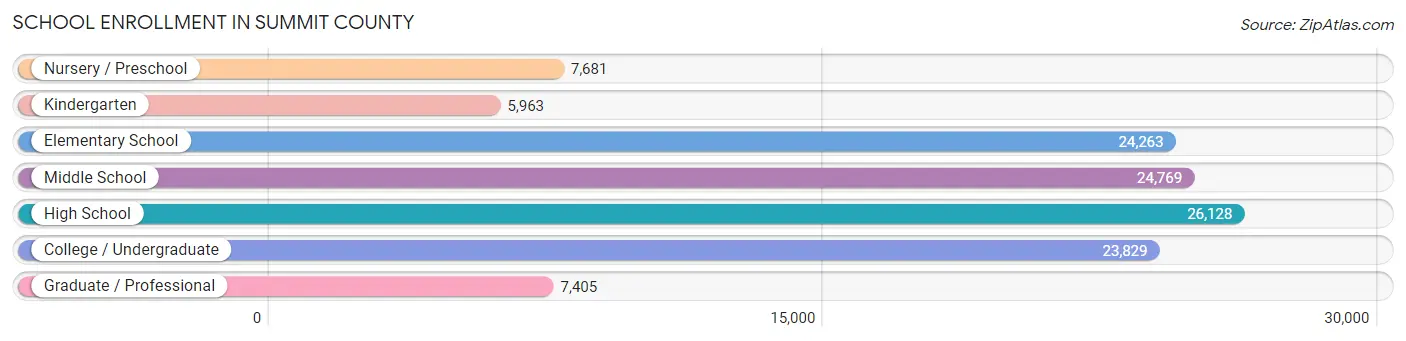
The most common levels of schooling among the 120,038 students in Summit County are high school (26,128 | 21.8%), middle school (24,769 | 20.6%), and elementary school (24,263 | 20.2%).
| School Level | # Students | % Students |
| Nursery / Preschool | 7,681 | 6.4% |
| Kindergarten | 5,963 | 5.0% |
| Elementary School | 24,263 | 20.2% |
| Middle School | 24,769 | 20.6% |
| High School | 26,128 | 21.8% |
| College / Undergraduate | 23,829 | 19.9% |
| Graduate / Professional | 7,405 | 6.2% |
| Total | 120,038 | 100.0% |
School Enrollment by Age by Funding Source in Summit County
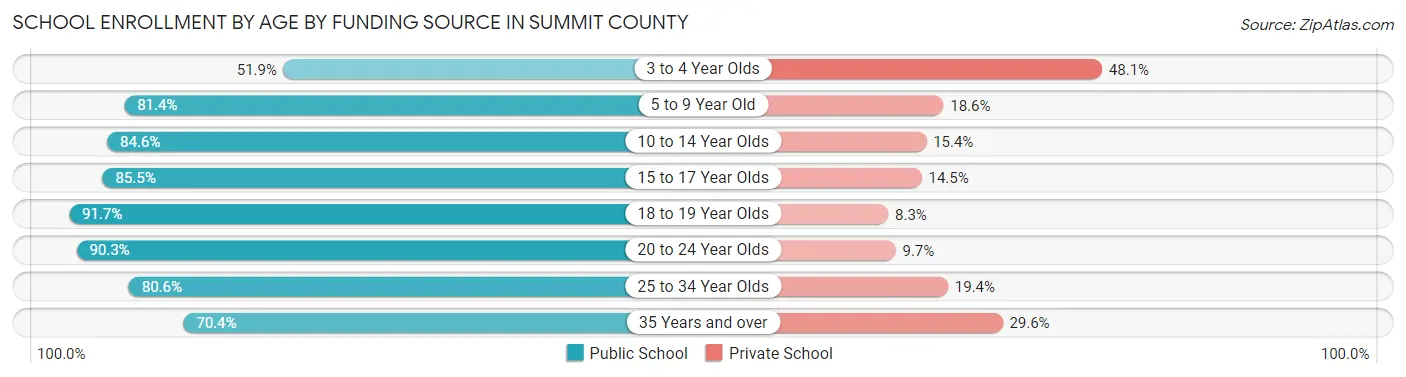
Out of a total of 120,038 students who are enrolled in schools in Summit County, 20,887 (17.4%) attend a private institution, while the remaining 99,151 (82.6%) are enrolled in public schools. The age group of 3 to 4 year olds has the highest likelihood of being enrolled in private schools, with 2,748 (48.1% in the age bracket) enrolled. Conversely, the age group of 18 to 19 year olds has the lowest likelihood of being enrolled in a private school, with 8,373 (91.7% in the age bracket) attending a public institution.
| Age Bracket | Public School | Private School |
| 3 to 4 Year Olds | 2,965 (51.9%) | 2,748 (48.1%) |
| 5 to 9 Year Old | 23,411 (81.4%) | 5,337 (18.6%) |
| 10 to 14 Year Olds | 25,918 (84.6%) | 4,708 (15.4%) |
| 15 to 17 Year Olds | 16,620 (85.5%) | 2,820 (14.5%) |
| 18 to 19 Year Olds | 8,373 (91.7%) | 756 (8.3%) |
| 20 to 24 Year Olds | 11,169 (90.3%) | 1,194 (9.7%) |
| 25 to 34 Year Olds | 6,293 (80.6%) | 1,516 (19.4%) |
| 35 Years and over | 4,374 (70.4%) | 1,836 (29.6%) |
| Total | 99,151 (82.6%) | 20,887 (17.4%) |
Educational Attainment by Field of Study in Summit County
Business (30,787 | 21.6%), education (19,983 | 14.1%), science & technology (16,556 | 11.7%), engineering (10,461 | 7.4%), and arts & humanities (8,349 | 5.9%) are the most common fields of study among 142,171 individuals in Summit County who have obtained a bachelor's degree or higher.
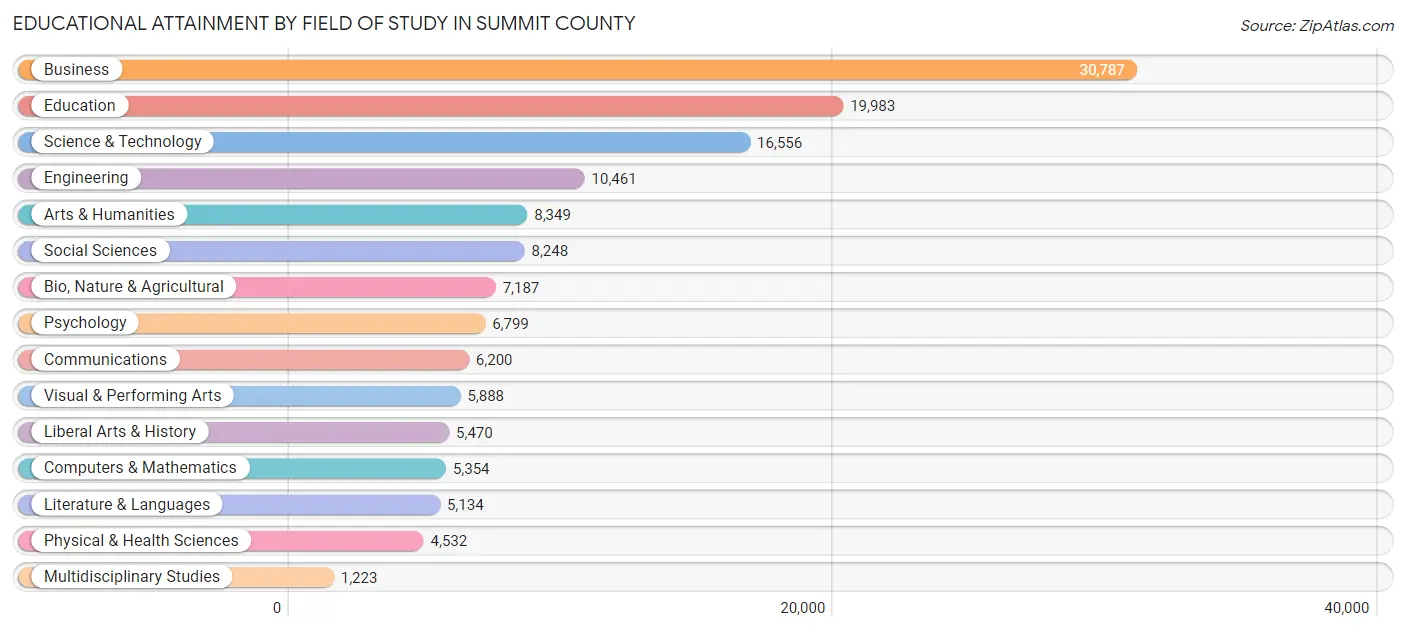
| Field of Study | # Graduates | % Graduates |
| Computers & Mathematics | 5,354 | 3.8% |
| Bio, Nature & Agricultural | 7,187 | 5.1% |
| Physical & Health Sciences | 4,532 | 3.2% |
| Psychology | 6,799 | 4.8% |
| Social Sciences | 8,248 | 5.8% |
| Engineering | 10,461 | 7.4% |
| Multidisciplinary Studies | 1,223 | 0.9% |
| Science & Technology | 16,556 | 11.7% |
| Business | 30,787 | 21.6% |
| Education | 19,983 | 14.1% |
| Literature & Languages | 5,134 | 3.6% |
| Liberal Arts & History | 5,470 | 3.8% |
| Visual & Performing Arts | 5,888 | 4.1% |
| Communications | 6,200 | 4.4% |
| Arts & Humanities | 8,349 | 5.9% |
| Total | 142,171 | 100.0% |
Transportation & Commute in Summit County
Vehicle Availability by Sex in Summit County
The most prevalent vehicle ownership categories in Summit County are males with 2 vehicles (63,663, accounting for 46.3%) and females with 2 vehicles (55,292, making up 50.5%).
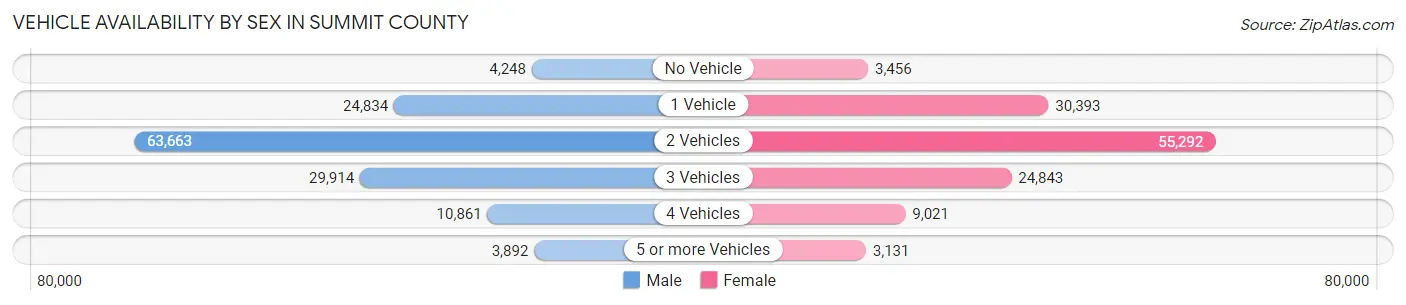
| Vehicles Available | Male | Female |
| No Vehicle | 4,248 (3.1%) | 3,456 (2.7%) |
| 1 Vehicle | 24,834 (18.1%) | 30,393 (24.1%) |
| 2 Vehicles | 63,663 (46.3%) | 55,292 (43.8%) |
| 3 Vehicles | 29,914 (21.8%) | 24,843 (19.7%) |
| 4 Vehicles | 10,861 (7.9%) | 9,021 (7.1%) |
| 5 or more Vehicles | 3,892 (2.8%) | 3,131 (2.5%) |
| Total | 137,412 (100.0%) | 126,136 (100.0%) |
Commute Time in Summit County
The most frequently occuring commute durations in Summit County are 15 to 19 minutes (41,739 commuters, 17.7%), 10 to 14 minutes (36,692 commuters, 15.5%), and 20 to 24 minutes (36,532 commuters, 15.5%).
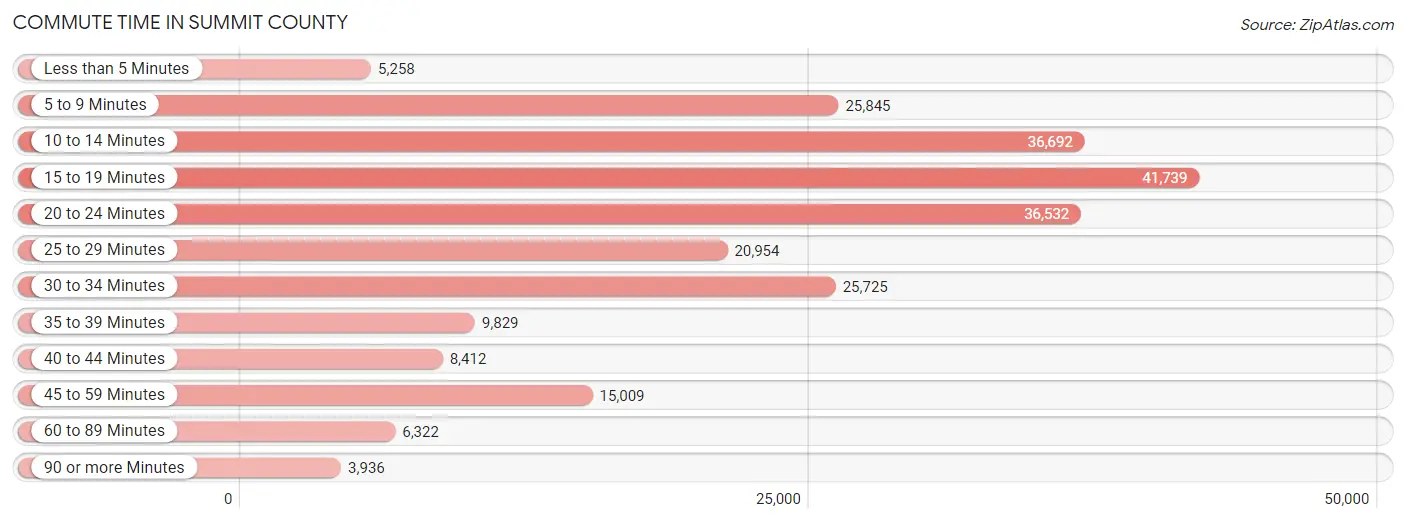
| Commute Time | # Commuters | % Commuters |
| Less than 5 Minutes | 5,258 | 2.2% |
| 5 to 9 Minutes | 25,845 | 10.9% |
| 10 to 14 Minutes | 36,692 | 15.5% |
| 15 to 19 Minutes | 41,739 | 17.7% |
| 20 to 24 Minutes | 36,532 | 15.5% |
| 25 to 29 Minutes | 20,954 | 8.9% |
| 30 to 34 Minutes | 25,725 | 10.9% |
| 35 to 39 Minutes | 9,829 | 4.2% |
| 40 to 44 Minutes | 8,412 | 3.6% |
| 45 to 59 Minutes | 15,009 | 6.4% |
| 60 to 89 Minutes | 6,322 | 2.7% |
| 90 or more Minutes | 3,936 | 1.7% |
Commute Time by Sex in Summit County
The most common commute times in Summit County are 15 to 19 minutes (20,777 commuters, 16.7%) for males and 15 to 19 minutes (20,962 commuters, 18.8%) for females.
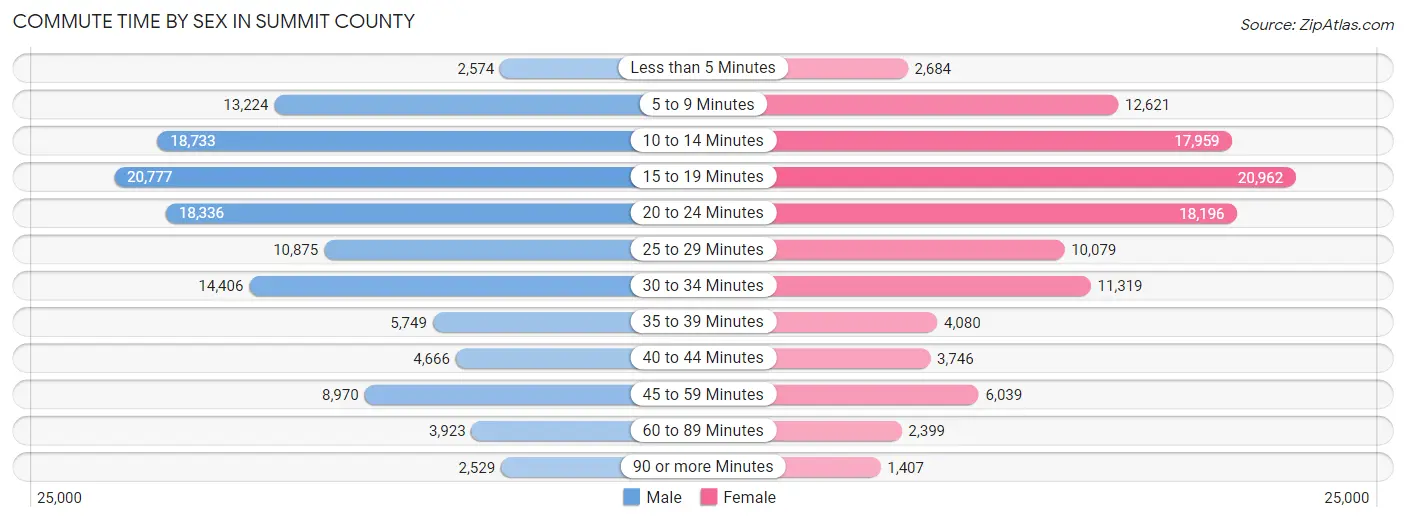
| Commute Time | Male | Female |
| Less than 5 Minutes | 2,574 (2.1%) | 2,684 (2.4%) |
| 5 to 9 Minutes | 13,224 (10.6%) | 12,621 (11.3%) |
| 10 to 14 Minutes | 18,733 (15.0%) | 17,959 (16.1%) |
| 15 to 19 Minutes | 20,777 (16.7%) | 20,962 (18.8%) |
| 20 to 24 Minutes | 18,336 (14.7%) | 18,196 (16.3%) |
| 25 to 29 Minutes | 10,875 (8.7%) | 10,079 (9.0%) |
| 30 to 34 Minutes | 14,406 (11.6%) | 11,319 (10.2%) |
| 35 to 39 Minutes | 5,749 (4.6%) | 4,080 (3.7%) |
| 40 to 44 Minutes | 4,666 (3.7%) | 3,746 (3.4%) |
| 45 to 59 Minutes | 8,970 (7.2%) | 6,039 (5.4%) |
| 60 to 89 Minutes | 3,923 (3.1%) | 2,399 (2.1%) |
| 90 or more Minutes | 2,529 (2.0%) | 1,407 (1.3%) |
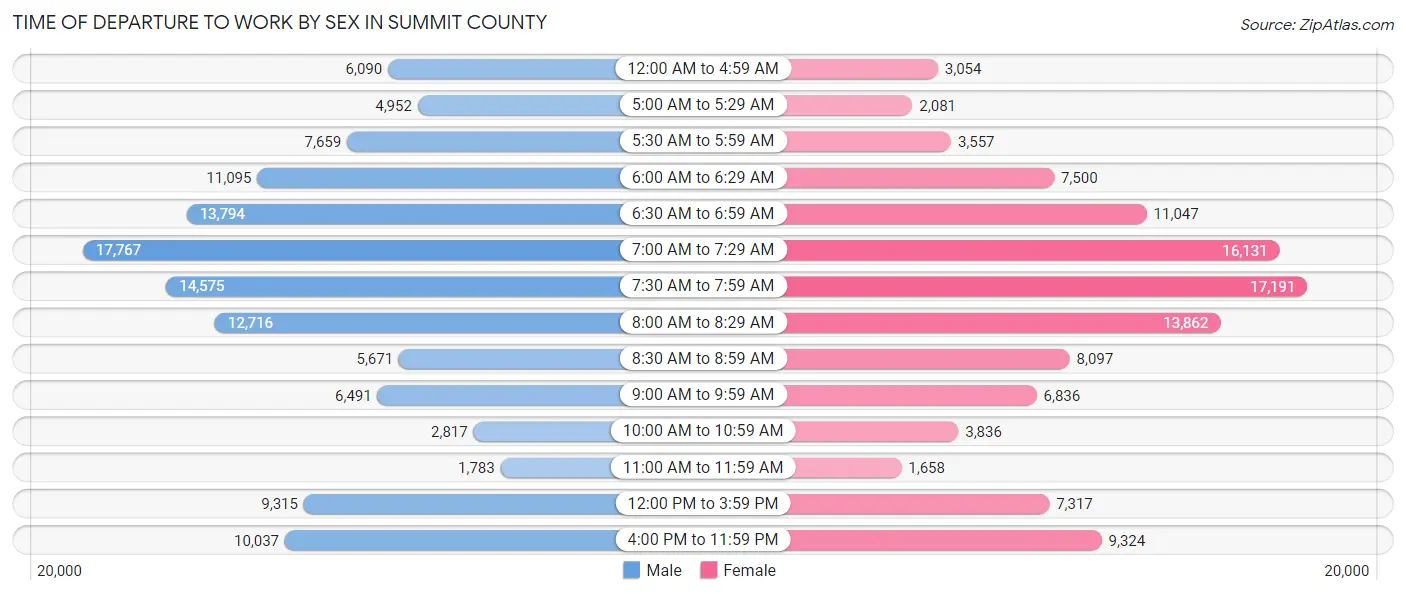
Time of Departure to Work by Sex in Summit County
The most frequent times of departure to work in Summit County are 7:00 AM to 7:29 AM (17,767, 14.2%) for males and 7:30 AM to 7:59 AM (17,191, 15.4%) for females.
| Time of Departure | Male | Female |
| 12:00 AM to 4:59 AM | 6,090 (4.9%) | 3,054 (2.7%) |
| 5:00 AM to 5:29 AM | 4,952 (4.0%) | 2,081 (1.9%) |
| 5:30 AM to 5:59 AM | 7,659 (6.1%) | 3,557 (3.2%) |
| 6:00 AM to 6:29 AM | 11,095 (8.9%) | 7,500 (6.7%) |
| 6:30 AM to 6:59 AM | 13,794 (11.1%) | 11,047 (9.9%) |
| 7:00 AM to 7:29 AM | 17,767 (14.2%) | 16,131 (14.5%) |
| 7:30 AM to 7:59 AM | 14,575 (11.7%) | 17,191 (15.4%) |
| 8:00 AM to 8:29 AM | 12,716 (10.2%) | 13,862 (12.4%) |
| 8:30 AM to 8:59 AM | 5,671 (4.5%) | 8,097 (7.3%) |
| 9:00 AM to 9:59 AM | 6,491 (5.2%) | 6,836 (6.1%) |
| 10:00 AM to 10:59 AM | 2,817 (2.3%) | 3,836 (3.4%) |
| 11:00 AM to 11:59 AM | 1,783 (1.4%) | 1,658 (1.5%) |
| 12:00 PM to 3:59 PM | 9,315 (7.5%) | 7,317 (6.6%) |
| 4:00 PM to 11:59 PM | 10,037 (8.0%) | 9,324 (8.4%) |
| Total | 124,762 (100.0%) | 111,491 (100.0%) |
Housing Occupancy in Summit County
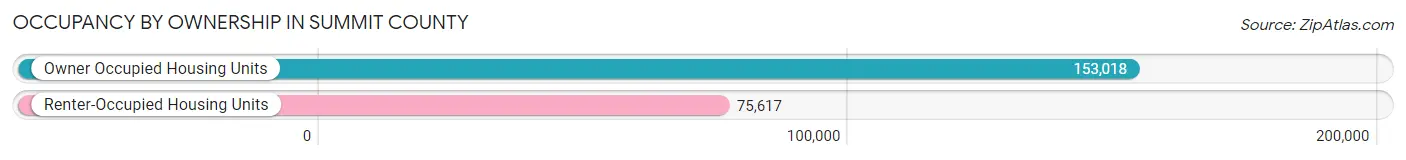
Occupancy by Ownership in Summit County
Of the total 228,635 dwellings in Summit County, owner-occupied units account for 153,018 (66.9%), while renter-occupied units make up 75,617 (33.1%).
| Occupancy | # Housing Units | % Housing Units |
| Owner Occupied Housing Units | 153,018 | 66.9% |
| Renter-Occupied Housing Units | 75,617 | 33.1% |
| Total Occupied Housing Units | 228,635 | 100.0% |
Occupancy by Household Size in Summit County
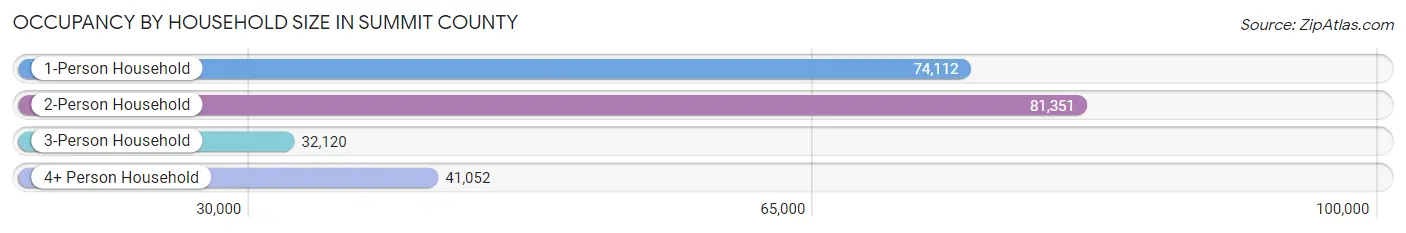
| Household Size | # Housing Units | % Housing Units |
| 1-Person Household | 74,112 | 32.4% |
| 2-Person Household | 81,351 | 35.6% |
| 3-Person Household | 32,120 | 14.1% |
| 4+ Person Household | 41,052 | 18.0% |
| Total Housing Units | 228,635 | 100.0% |
Occupancy by Ownership by Household Size in Summit County
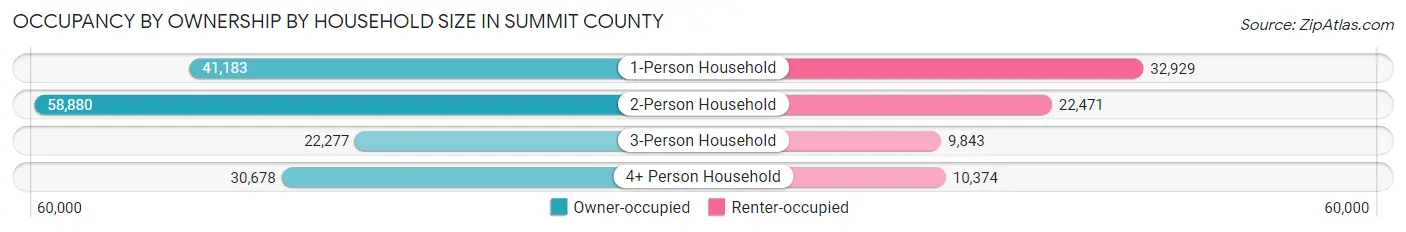
| Household Size | Owner-occupied | Renter-occupied |
| 1-Person Household | 41,183 (55.6%) | 32,929 (44.4%) |
| 2-Person Household | 58,880 (72.4%) | 22,471 (27.6%) |
| 3-Person Household | 22,277 (69.4%) | 9,843 (30.6%) |
| 4+ Person Household | 30,678 (74.7%) | 10,374 (25.3%) |
| Total Housing Units | 153,018 (66.9%) | 75,617 (33.1%) |
Occupancy by Educational Attainment in Summit County
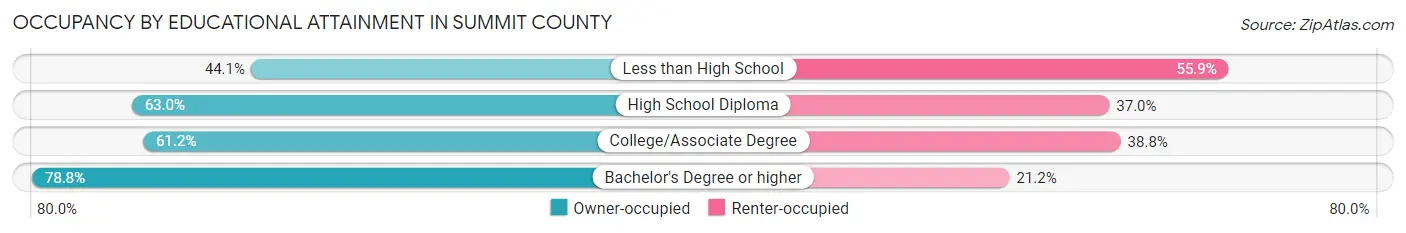
| Household Size | Owner-occupied | Renter-occupied |
| Less than High School | 6,503 (44.1%) | 8,237 (55.9%) |
| High School Diploma | 37,822 (63.0%) | 22,201 (37.0%) |
| College/Associate Degree | 43,836 (61.2%) | 27,769 (38.8%) |
| Bachelor's Degree or higher | 64,857 (78.8%) | 17,410 (21.2%) |
Occupancy by Age of Householder in Summit County
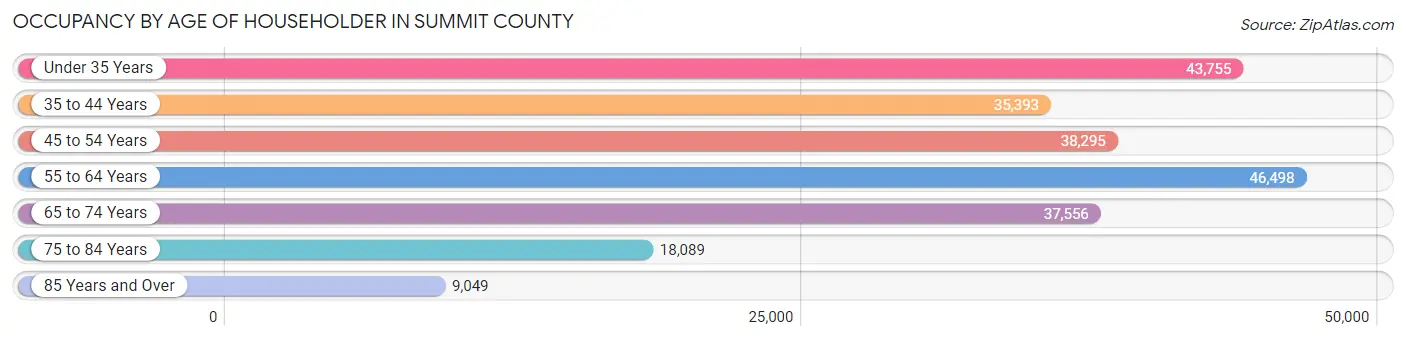
| Age Bracket | # Households | % Households |
| Under 35 Years | 43,755 | 19.1% |
| 35 to 44 Years | 35,393 | 15.5% |
| 45 to 54 Years | 38,295 | 16.8% |
| 55 to 64 Years | 46,498 | 20.3% |
| 65 to 74 Years | 37,556 | 16.4% |
| 75 to 84 Years | 18,089 | 7.9% |
| 85 Years and Over | 9,049 | 4.0% |
| Total | 228,635 | 100.0% |
Housing Finances in Summit County
Median Income by Occupancy in Summit County
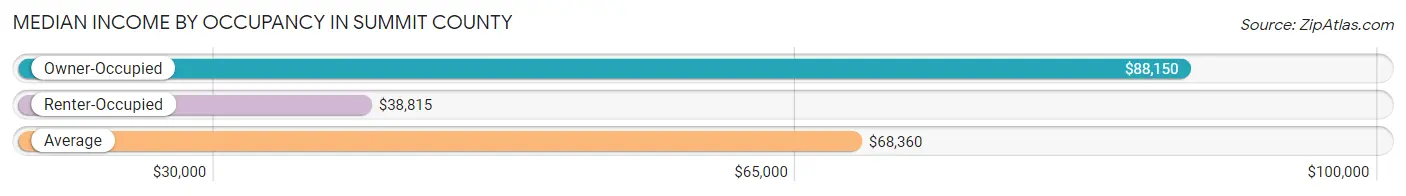
| Occupancy Type | # Households | Median Income |
| Owner-Occupied | 153,018 (66.9%) | $88,150 |
| Renter-Occupied | 75,617 (33.1%) | $38,815 |
| Average | 228,635 (100.0%) | $68,360 |
Occupancy by Householder Income Bracket in Summit County
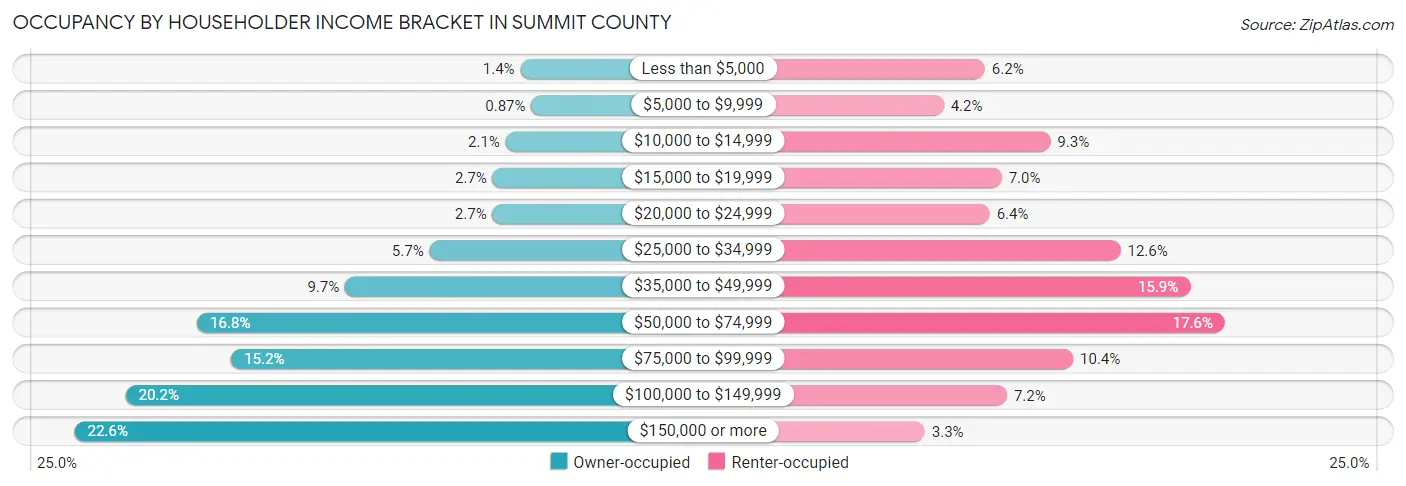
| Income Bracket | Owner-occupied | Renter-occupied |
| Less than $5,000 | 2,125 (1.4%) | 4,659 (6.2%) |
| $5,000 to $9,999 | 1,333 (0.9%) | 3,174 (4.2%) |
| $10,000 to $14,999 | 3,197 (2.1%) | 7,016 (9.3%) |
| $15,000 to $19,999 | 4,145 (2.7%) | 5,264 (7.0%) |
| $20,000 to $24,999 | 4,166 (2.7%) | 4,831 (6.4%) |
| $25,000 to $34,999 | 8,746 (5.7%) | 9,544 (12.6%) |
| $35,000 to $49,999 | 14,906 (9.7%) | 12,049 (15.9%) |
| $50,000 to $74,999 | 25,693 (16.8%) | 13,296 (17.6%) |
| $75,000 to $99,999 | 23,202 (15.2%) | 7,837 (10.4%) |
| $100,000 to $149,999 | 30,896 (20.2%) | 5,451 (7.2%) |
| $150,000 or more | 34,609 (22.6%) | 2,496 (3.3%) |
| Total | 153,018 (100.0%) | 75,617 (100.0%) |
Monthly Housing Cost Tiers in Summit County
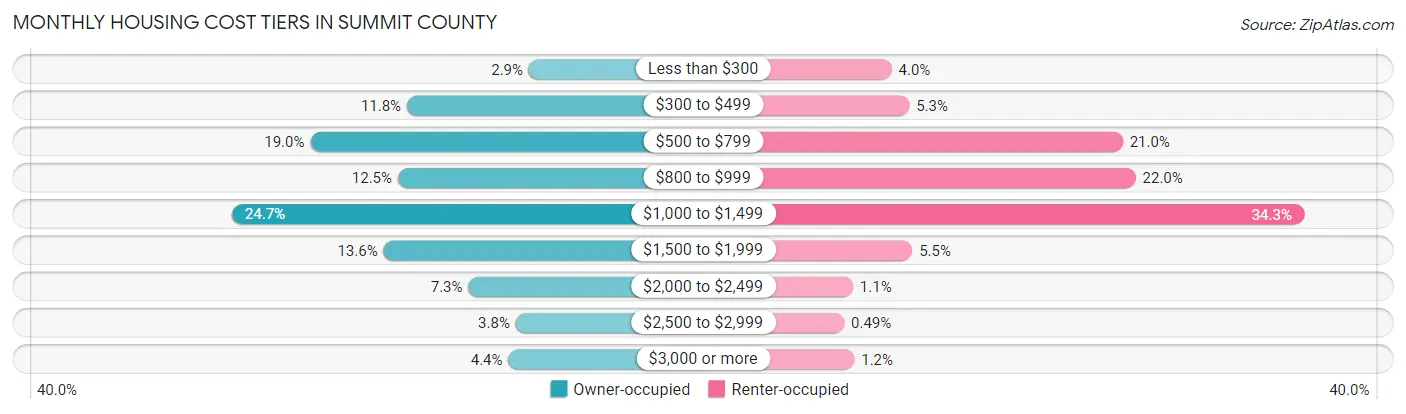
| Monthly Cost | Owner-occupied | Renter-occupied |
| Less than $300 | 4,377 (2.9%) | 3,016 (4.0%) |
| $300 to $499 | 18,119 (11.8%) | 4,002 (5.3%) |
| $500 to $799 | 29,012 (19.0%) | 15,885 (21.0%) |
| $800 to $999 | 19,140 (12.5%) | 16,609 (22.0%) |
| $1,000 to $1,499 | 37,848 (24.7%) | 25,967 (34.3%) |
| $1,500 to $1,999 | 20,767 (13.6%) | 4,164 (5.5%) |
| $2,000 to $2,499 | 11,206 (7.3%) | 859 (1.1%) |
| $2,500 to $2,999 | 5,859 (3.8%) | 368 (0.5%) |
| $3,000 or more | 6,690 (4.4%) | 939 (1.2%) |
| Total | 153,018 (100.0%) | 75,617 (100.0%) |
Physical Housing Characteristics in Summit County
Housing Structures in Summit County
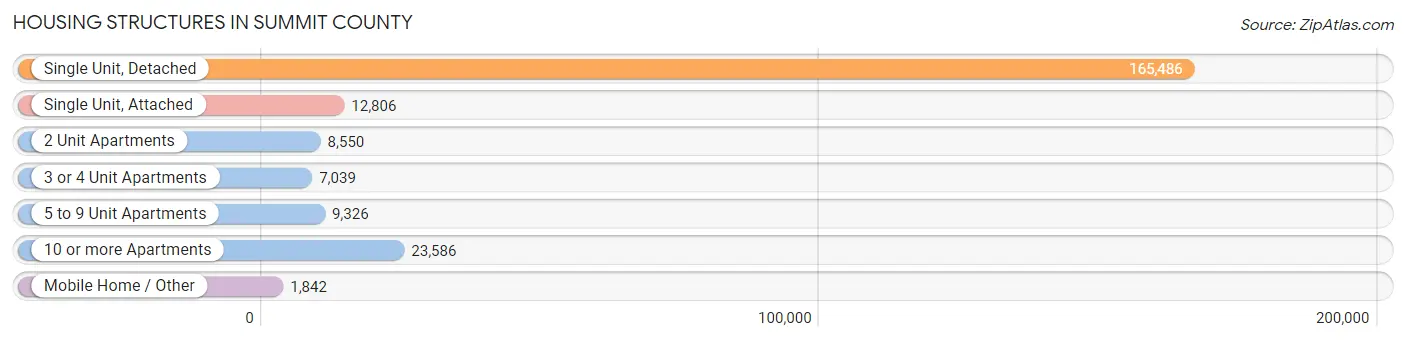
| Structure Type | # Housing Units | % Housing Units |
| Single Unit, Detached | 165,486 | 72.4% |
| Single Unit, Attached | 12,806 | 5.6% |
| 2 Unit Apartments | 8,550 | 3.7% |
| 3 or 4 Unit Apartments | 7,039 | 3.1% |
| 5 to 9 Unit Apartments | 9,326 | 4.1% |
| 10 or more Apartments | 23,586 | 10.3% |
| Mobile Home / Other | 1,842 | 0.8% |
| Total | 228,635 | 100.0% |
Housing Structures by Occupancy in Summit County
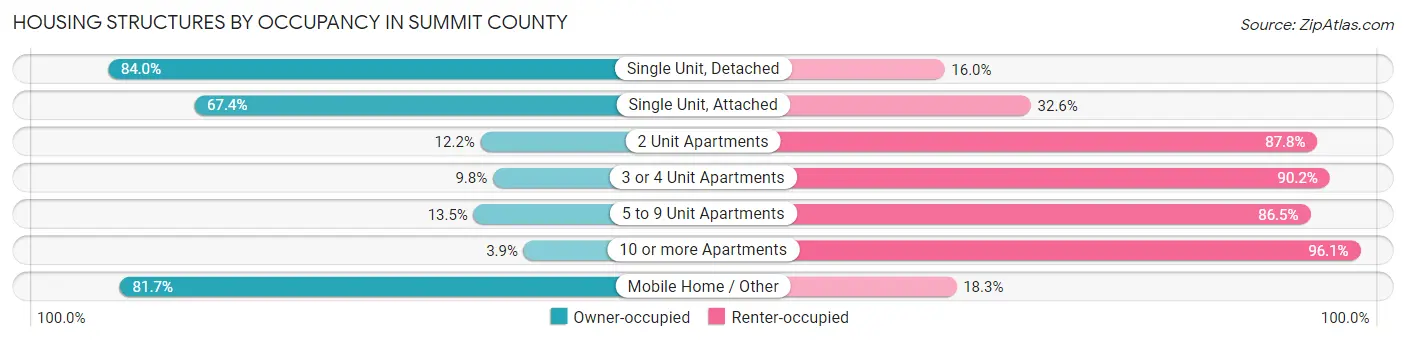
| Structure Type | Owner-occupied | Renter-occupied |
| Single Unit, Detached | 138,975 (84.0%) | 26,511 (16.0%) |
| Single Unit, Attached | 8,629 (67.4%) | 4,177 (32.6%) |
| 2 Unit Apartments | 1,042 (12.2%) | 7,508 (87.8%) |
| 3 or 4 Unit Apartments | 690 (9.8%) | 6,349 (90.2%) |
| 5 to 9 Unit Apartments | 1,262 (13.5%) | 8,064 (86.5%) |
| 10 or more Apartments | 915 (3.9%) | 22,671 (96.1%) |
| Mobile Home / Other | 1,505 (81.7%) | 337 (18.3%) |
| Total | 153,018 (66.9%) | 75,617 (33.1%) |
Housing Structures by Number of Rooms in Summit County
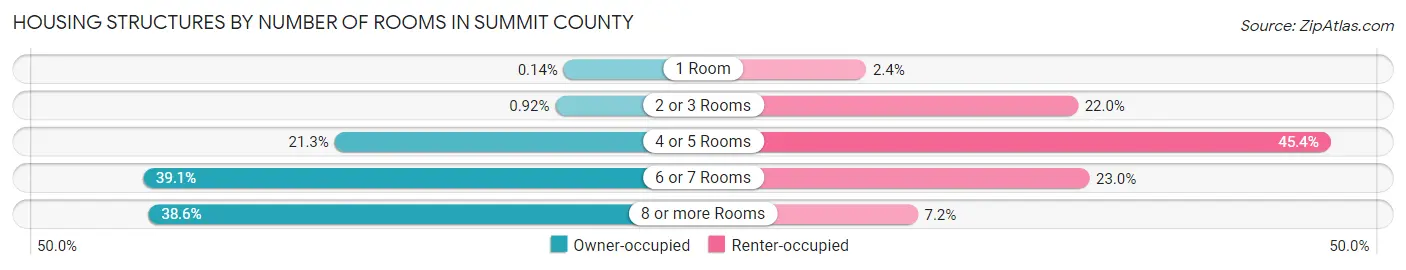
| Number of Rooms | Owner-occupied | Renter-occupied |
| 1 Room | 210 (0.1%) | 1,826 (2.4%) |
| 2 or 3 Rooms | 1,408 (0.9%) | 16,628 (22.0%) |
| 4 or 5 Rooms | 32,634 (21.3%) | 34,310 (45.4%) |
| 6 or 7 Rooms | 59,766 (39.1%) | 17,424 (23.0%) |
| 8 or more Rooms | 59,000 (38.6%) | 5,429 (7.2%) |
| Total | 153,018 (100.0%) | 75,617 (100.0%) |
Housing Structure by Heating Type in Summit County
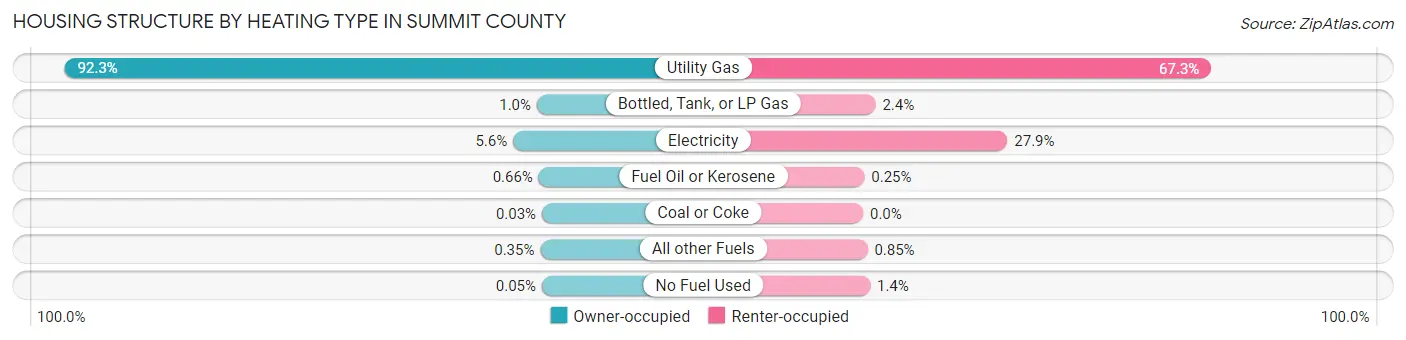
| Heating Type | Owner-occupied | Renter-occupied |
| Utility Gas | 141,227 (92.3%) | 50,859 (67.3%) |
| Bottled, Tank, or LP Gas | 1,538 (1.0%) | 1,817 (2.4%) |
| Electricity | 8,589 (5.6%) | 21,087 (27.9%) |
| Fuel Oil or Kerosene | 1,009 (0.7%) | 189 (0.3%) |
| Coal or Coke | 42 (0.0%) | 0 (0.0%) |
| All other Fuels | 534 (0.4%) | 645 (0.9%) |
| No Fuel Used | 79 (0.1%) | 1,020 (1.3%) |
| Total | 153,018 (100.0%) | 75,617 (100.0%) |
Household Vehicle Usage in Summit County
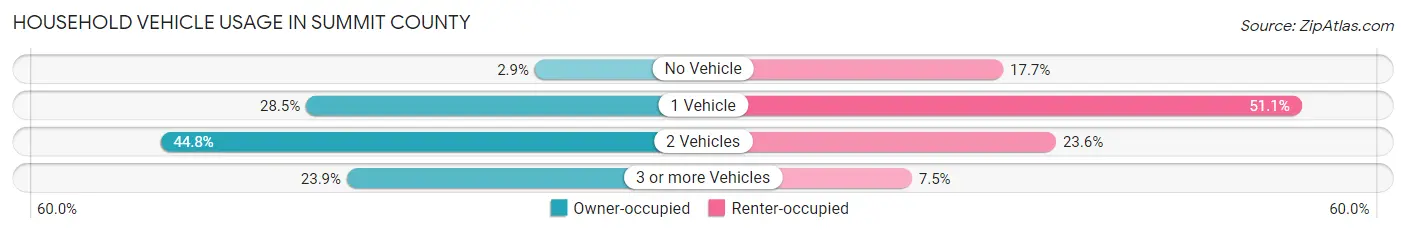
| Vehicles per Household | Owner-occupied | Renter-occupied |
| No Vehicle | 4,366 (2.9%) | 13,403 (17.7%) |
| 1 Vehicle | 43,565 (28.5%) | 38,672 (51.1%) |
| 2 Vehicles | 68,520 (44.8%) | 17,873 (23.6%) |
| 3 or more Vehicles | 36,567 (23.9%) | 5,669 (7.5%) |
| Total | 153,018 (100.0%) | 75,617 (100.0%) |
Real Estate & Mortgages in Summit County
Real Estate and Mortgage Overview in Summit County
| Characteristic | Without Mortgage | With Mortgage |
| Housing Units | 54,204 | 98,814 |
| Median Property Value | $164,600 | $192,100 |
| Median Household Income | $66,289 | $25,753 |
| Monthly Housing Costs | $562 | $6,569 |
| Real Estate Taxes | $2,703 | $1,806 |
Property Value by Mortgage Status in Summit County
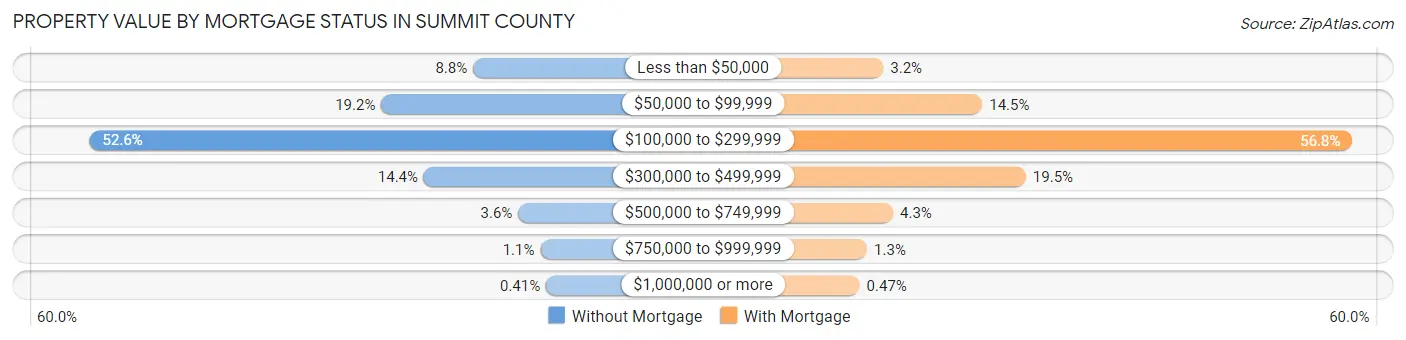
| Property Value | Without Mortgage | With Mortgage |
| Less than $50,000 | 4,743 (8.7%) | 3,145 (3.2%) |
| $50,000 to $99,999 | 10,431 (19.2%) | 14,316 (14.5%) |
| $100,000 to $299,999 | 28,505 (52.6%) | 56,097 (56.8%) |
| $300,000 to $499,999 | 7,787 (14.4%) | 19,239 (19.5%) |
| $500,000 to $749,999 | 1,945 (3.6%) | 4,238 (4.3%) |
| $750,000 to $999,999 | 573 (1.1%) | 1,314 (1.3%) |
| $1,000,000 or more | 220 (0.4%) | 465 (0.5%) |
| Total | 54,204 (100.0%) | 98,814 (100.0%) |
Household Income by Mortgage Status in Summit County
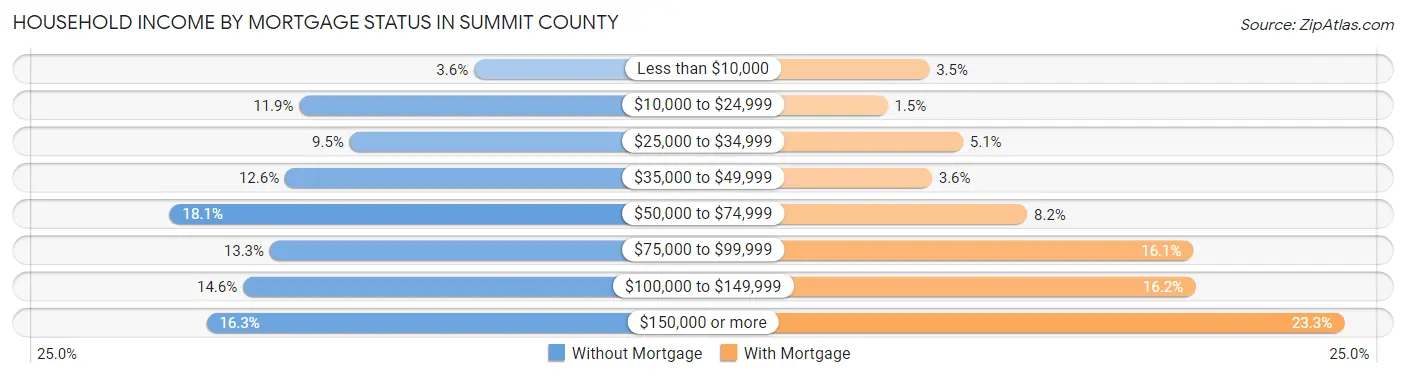
| Household Income | Without Mortgage | With Mortgage |
| Less than $10,000 | 1,953 (3.6%) | 3,465 (3.5%) |
| $10,000 to $24,999 | 6,461 (11.9%) | 1,505 (1.5%) |
| $25,000 to $34,999 | 5,162 (9.5%) | 5,047 (5.1%) |
| $35,000 to $49,999 | 6,830 (12.6%) | 3,584 (3.6%) |
| $50,000 to $74,999 | 9,805 (18.1%) | 8,076 (8.2%) |
| $75,000 to $99,999 | 7,222 (13.3%) | 15,888 (16.1%) |
| $100,000 to $149,999 | 7,915 (14.6%) | 15,980 (16.2%) |
| $150,000 or more | 8,856 (16.3%) | 22,981 (23.3%) |
| Total | 54,204 (100.0%) | 98,814 (100.0%) |
Property Value to Household Income Ratio in Summit County
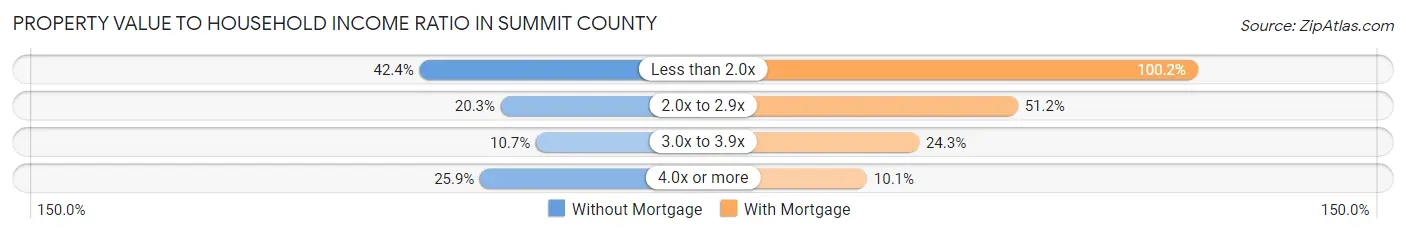
| Value-to-Income Ratio | Without Mortgage | With Mortgage |
| Less than 2.0x | 22,989 (42.4%) | 99,042 (100.2%) |
| 2.0x to 2.9x | 10,981 (20.3%) | 50,544 (51.1%) |
| 3.0x to 3.9x | 5,790 (10.7%) | 23,971 (24.3%) |
| 4.0x or more | 14,032 (25.9%) | 9,943 (10.1%) |
| Total | 54,204 (100.0%) | 98,814 (100.0%) |
Real Estate Taxes by Mortgage Status in Summit County
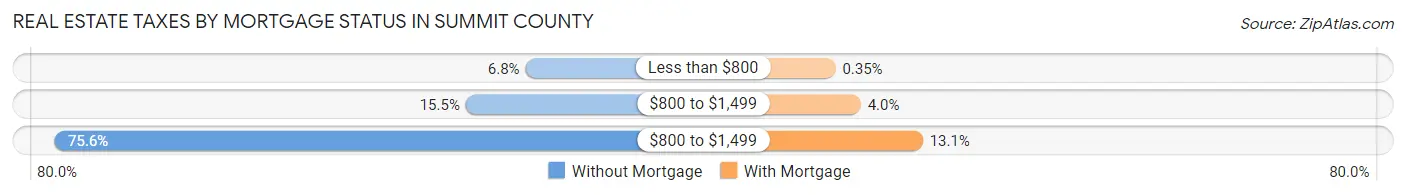
| Property Taxes | Without Mortgage | With Mortgage |
| Less than $800 | 3,697 (6.8%) | 346 (0.4%) |
| $800 to $1,499 | 8,423 (15.5%) | 3,988 (4.0%) |
| $800 to $1,499 | 40,956 (75.6%) | 12,947 (13.1%) |
| Total | 54,204 (100.0%) | 98,814 (100.0%) |
Health & Disability in Summit County
Health Insurance Coverage by Age in Summit County
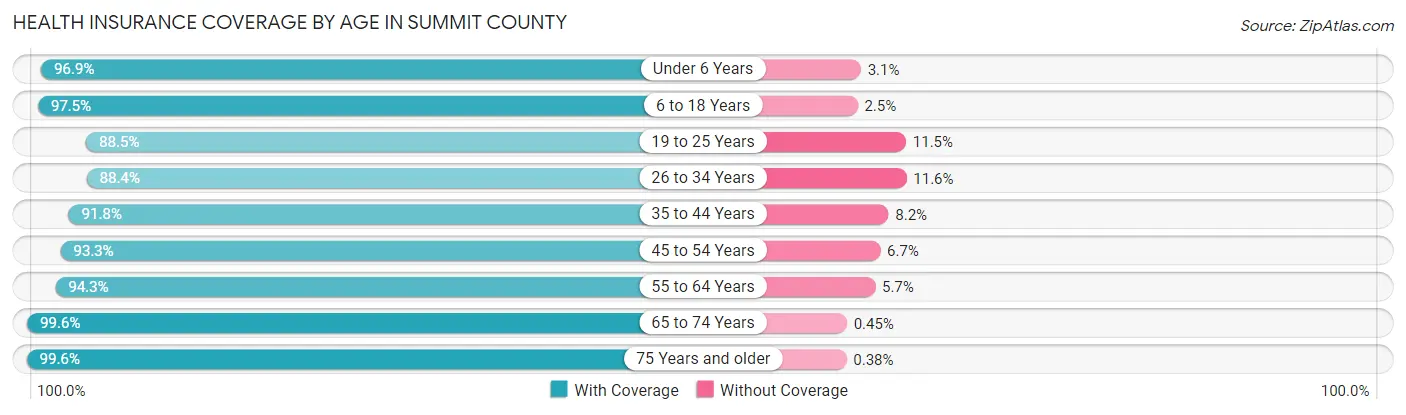
| Age Bracket | With Coverage | Without Coverage |
| Under 6 Years | 34,741 (96.9%) | 1,096 (3.1%) |
| 6 to 18 Years | 80,086 (97.5%) | 2,024 (2.5%) |
| 19 to 25 Years | 41,374 (88.5%) | 5,366 (11.5%) |
| 26 to 34 Years | 56,353 (88.4%) | 7,375 (11.6%) |
| 35 to 44 Years | 59,443 (91.8%) | 5,319 (8.2%) |
| 45 to 54 Years | 62,519 (93.3%) | 4,468 (6.7%) |
| 55 to 64 Years | 71,687 (94.3%) | 4,355 (5.7%) |
| 65 to 74 Years | 58,545 (99.6%) | 266 (0.4%) |
| 75 Years and older | 38,584 (99.6%) | 146 (0.4%) |
| Total | 503,332 (94.3%) | 30,415 (5.7%) |
Health Insurance Coverage by Citizenship Status in Summit County
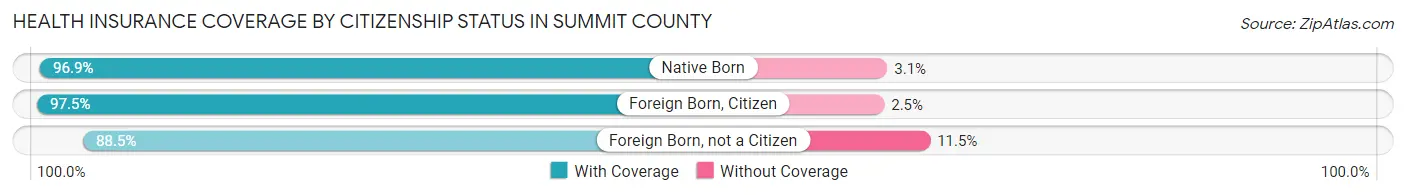
| Citizenship Status | With Coverage | Without Coverage |
| Native Born | 34,741 (96.9%) | 1,096 (3.1%) |
| Foreign Born, Citizen | 80,086 (97.5%) | 2,024 (2.5%) |
| Foreign Born, not a Citizen | 41,374 (88.5%) | 5,366 (11.5%) |
Health Insurance Coverage by Household Income in Summit County
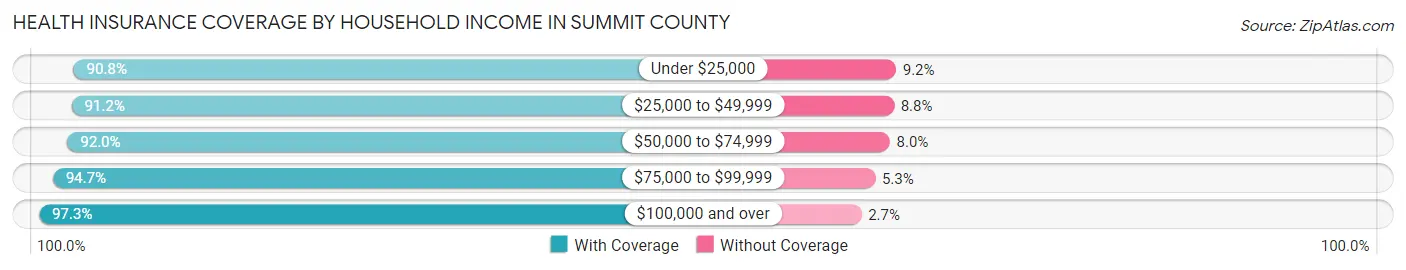
| Household Income | With Coverage | Without Coverage |
| Under $25,000 | 57,312 (90.8%) | 5,790 (9.2%) |
| $25,000 to $49,999 | 78,171 (91.2%) | 7,538 (8.8%) |
| $50,000 to $74,999 | 80,191 (92.0%) | 6,996 (8.0%) |
| $75,000 to $99,999 | 72,537 (94.7%) | 4,047 (5.3%) |
| $100,000 and over | 211,591 (97.3%) | 5,877 (2.7%) |
Public vs Private Health Insurance Coverage by Age in Summit County
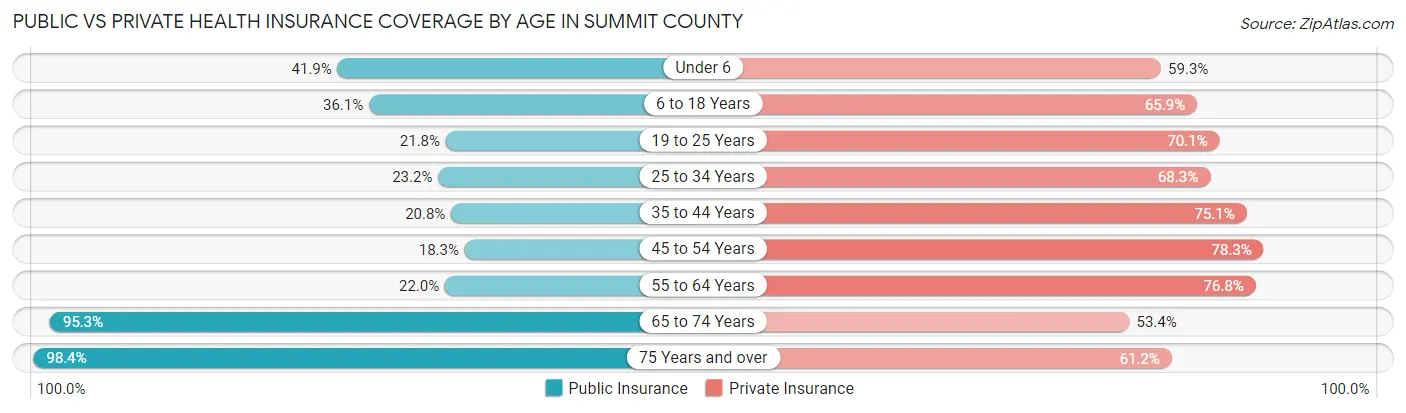
| Age Bracket | Public Insurance | Private Insurance |
| Under 6 | 15,014 (41.9%) | 21,243 (59.3%) |
| 6 to 18 Years | 29,611 (36.1%) | 54,126 (65.9%) |
| 19 to 25 Years | 10,193 (21.8%) | 32,765 (70.1%) |
| 25 to 34 Years | 14,799 (23.2%) | 43,552 (68.3%) |
| 35 to 44 Years | 13,486 (20.8%) | 48,653 (75.1%) |
| 45 to 54 Years | 12,250 (18.3%) | 52,447 (78.3%) |
| 55 to 64 Years | 16,698 (22.0%) | 58,406 (76.8%) |
| 65 to 74 Years | 56,054 (95.3%) | 31,410 (53.4%) |
| 75 Years and over | 38,099 (98.4%) | 23,716 (61.2%) |
| Total | 206,204 (38.6%) | 366,318 (68.6%) |
Disability Status by Sex by Age in Summit County
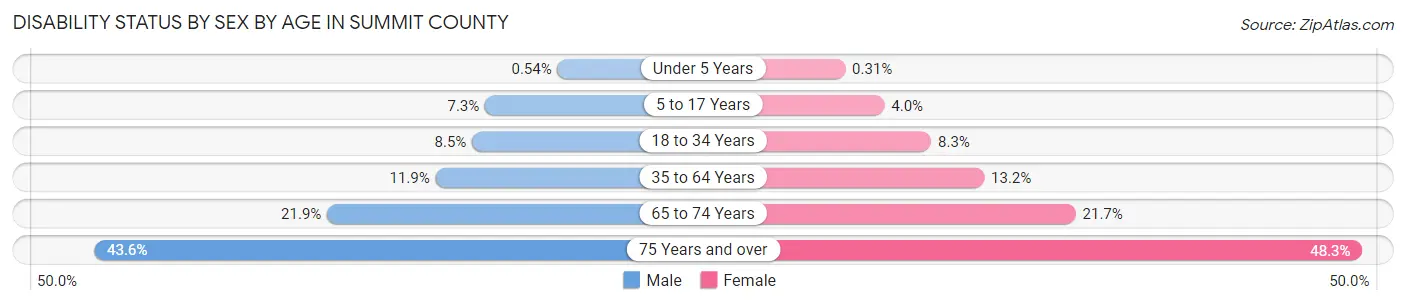
| Age Bracket | Male | Female |
| Under 5 Years | 80 (0.5%) | 44 (0.3%) |
| 5 to 17 Years | 3,054 (7.3%) | 1,604 (4.0%) |
| 18 to 34 Years | 4,951 (8.5%) | 4,812 (8.3%) |
| 35 to 64 Years | 12,083 (11.9%) | 13,986 (13.2%) |
| 65 to 74 Years | 6,012 (21.9%) | 6,809 (21.7%) |
| 75 Years and over | 6,863 (43.5%) | 11,096 (48.3%) |
Disability Class by Sex by Age in Summit County
Disability Class: Hearing Difficulty
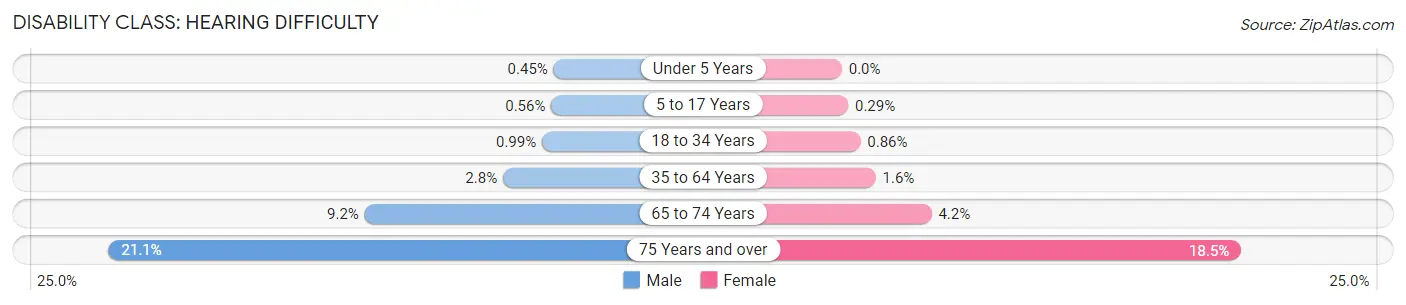
| Age Bracket | Male | Female |
| Under 5 Years | 67 (0.4%) | 0 (0.0%) |
| 5 to 17 Years | 235 (0.6%) | 118 (0.3%) |
| 18 to 34 Years | 582 (1.0%) | 497 (0.9%) |
| 35 to 64 Years | 2,856 (2.8%) | 1,668 (1.6%) |
| 65 to 74 Years | 2,528 (9.2%) | 1,304 (4.2%) |
| 75 Years and over | 3,327 (21.1%) | 4,256 (18.5%) |
Disability Class: Vision Difficulty
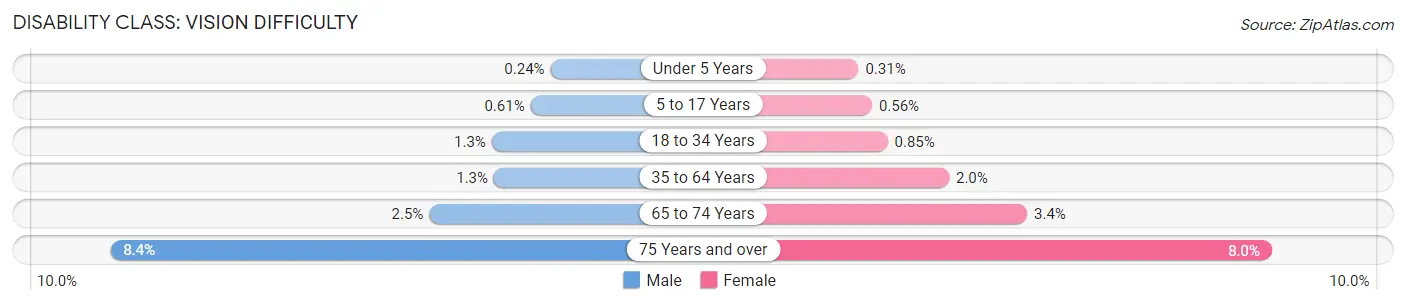
| Age Bracket | Male | Female |
| Under 5 Years | 35 (0.2%) | 44 (0.3%) |
| 5 to 17 Years | 255 (0.6%) | 227 (0.6%) |
| 18 to 34 Years | 776 (1.3%) | 491 (0.9%) |
| 35 to 64 Years | 1,319 (1.3%) | 2,112 (2.0%) |
| 65 to 74 Years | 682 (2.5%) | 1,081 (3.4%) |
| 75 Years and over | 1,326 (8.4%) | 1,834 (8.0%) |
Disability Class: Cognitive Difficulty
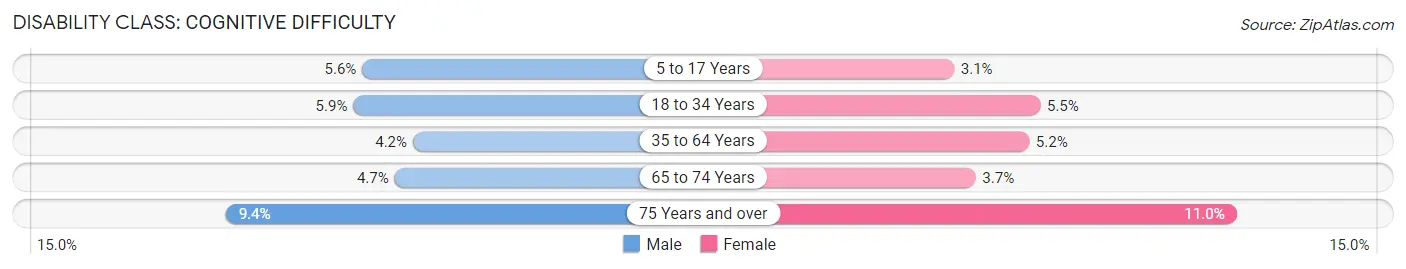
| Age Bracket | Male | Female |
| 5 to 17 Years | 2,356 (5.6%) | 1,269 (3.1%) |
| 18 to 34 Years | 3,425 (5.9%) | 3,206 (5.5%) |
| 35 to 64 Years | 4,267 (4.2%) | 5,520 (5.2%) |
| 65 to 74 Years | 1,290 (4.7%) | 1,166 (3.7%) |
| 75 Years and over | 1,482 (9.4%) | 2,524 (11.0%) |
Disability Class: Ambulatory Difficulty
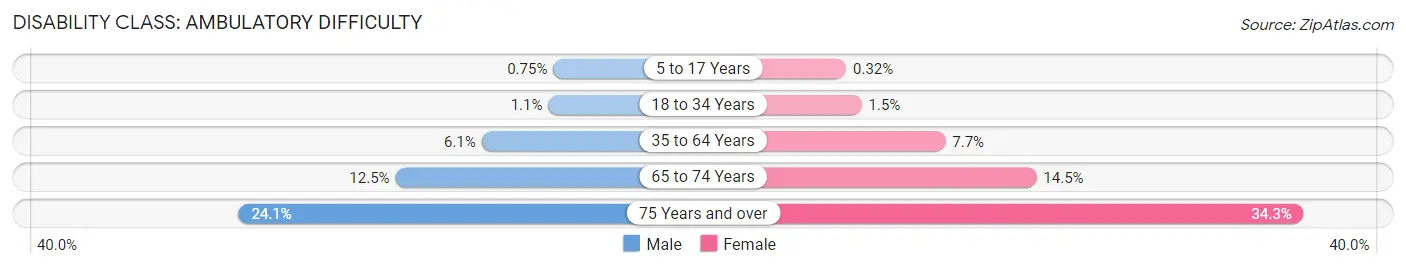
| Age Bracket | Male | Female |
| 5 to 17 Years | 314 (0.7%) | 129 (0.3%) |
| 18 to 34 Years | 657 (1.1%) | 856 (1.5%) |
| 35 to 64 Years | 6,185 (6.1%) | 8,149 (7.7%) |
| 65 to 74 Years | 3,420 (12.5%) | 4,535 (14.4%) |
| 75 Years and over | 3,801 (24.1%) | 7,876 (34.3%) |
Disability Class: Self-Care Difficulty
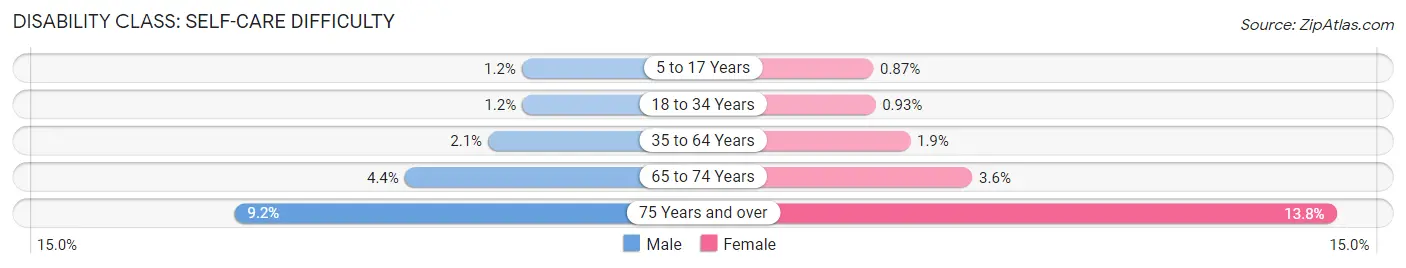
| Age Bracket | Male | Female |
| 5 to 17 Years | 489 (1.2%) | 354 (0.9%) |
| 18 to 34 Years | 671 (1.1%) | 542 (0.9%) |
| 35 to 64 Years | 2,141 (2.1%) | 2,015 (1.9%) |
| 65 to 74 Years | 1,213 (4.4%) | 1,140 (3.6%) |
| 75 Years and over | 1,443 (9.2%) | 3,162 (13.8%) |
Technology Access in Summit County
Computing Device Access in Summit County
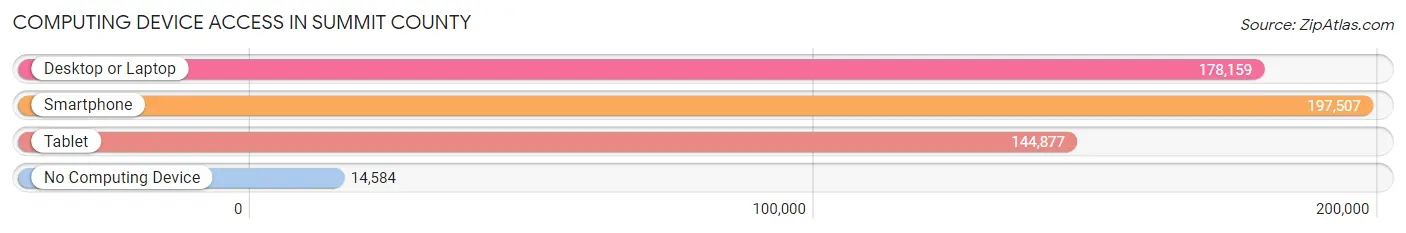
| Device Type | # Households | % Households |
| Desktop or Laptop | 178,159 | 77.9% |
| Smartphone | 197,507 | 86.4% |
| Tablet | 144,877 | 63.4% |
| No Computing Device | 14,584 | 6.4% |
| Total | 228,635 | 100.0% |
Internet Access in Summit County
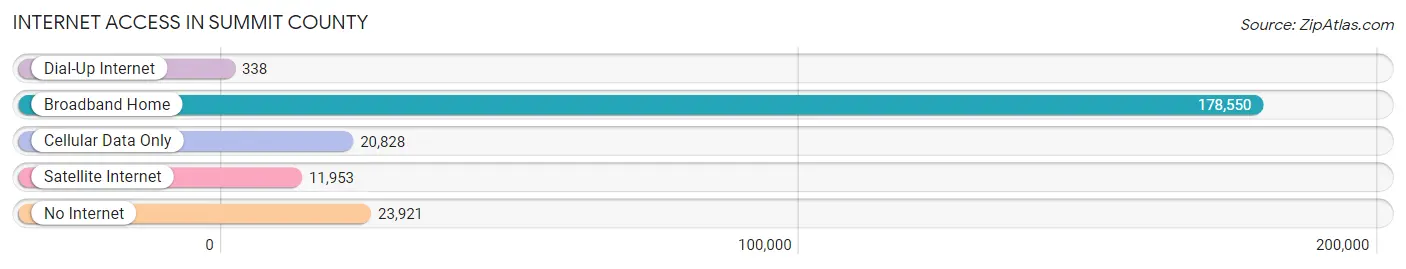
| Internet Type | # Households | % Households |
| Dial-Up Internet | 338 | 0.2% |
| Broadband Home | 178,550 | 78.1% |
| Cellular Data Only | 20,828 | 9.1% |
| Satellite Internet | 11,953 | 5.2% |
| No Internet | 23,921 | 10.5% |
| Total | 228,635 | 100.0% |
Summit County Summary
Summit County, Ohio is located in the northeastern part of the state and is part of the Akron Metropolitan Statistical Area. It is bordered by Portage County to the north, Medina County to the east, Stark County to the south, and Cuyahoga County to the west. The county seat is Akron, which is also the largest city in the county. Summit County has a population of 541,781, making it the fourth most populous county in Ohio.
History
Summit County was formed in 1840 from portions of Medina, Portage, and Stark Counties. It was named for the highest point in the area, which is now known as Mount Union. The county was originally home to the Iroquois and Delaware Native American tribes. The first settlers arrived in the area in the late 1700s and early 1800s. The county was officially organized in 1842 and Akron was chosen as the county seat.
The county experienced rapid growth in the late 1800s and early 1900s due to the development of the rubber industry. Akron was the center of the rubber industry in the United States and was home to several major rubber companies, including Goodyear, Firestone, and General Tire. The county also experienced a boom in population during this time, as many people moved to the area to work in the rubber factories.
Geography
Summit County covers an area of 437 square miles and is located in the northeastern part of Ohio. The county is mostly flat, with some rolling hills in the northern and western parts. The Cuyahoga River runs through the county, and there are several lakes and reservoirs in the area. The highest point in the county is Mount Union, which is 1,077 feet above sea level.
The climate in Summit County is humid continental, with hot summers and cold winters. The average annual temperature is around 50 degrees Fahrenheit, and the average annual precipitation is around 40 inches.
Economy
Summit County has a diverse economy, with a mix of manufacturing, healthcare, education, and service industries. The largest employers in the county are Akron General Medical Center, Summa Health System, and the University of Akron. Other major employers include Goodyear Tire & Rubber Company, FirstEnergy, and the Akron Metropolitan Area Transportation Study.
The county also has a strong agricultural sector, with corn, soybeans, and hay being the main crops. Livestock production is also important, with dairy and beef cattle being the main animals raised.
Demographics
As of the 2010 census, Summit County had a population of 541,781. The racial makeup of the county was 79.3% White, 15.2% African American, 0.5% Native American, 2.2% Asian, 0.1% Pacific Islander, and 2.7% from other races. Hispanic or Latino of any race were 4.3% of the population.
The median household income in the county was $48,945, and the median family income was $60,945. The per capita income was $25,945. About 11.2% of the population was below the poverty line.
Summit County is home to several colleges and universities, including the University of Akron, Kent State University, and the University of Mount Union. The county also has a strong cultural scene, with several museums, theaters, and other attractions.
Common Questions
What is the Total Population of Summit County?
Total Population of Summit County is 539,361.
What is the Total Male Population of Summit County?
Total Male Population of Summit County is 263,300.
What is the Total Female Population of Summit County?
Total Female Population of Summit County is 276,061.
What is the Ratio of Males per 100 Females in Summit County?
There are 95.38 Males per 100 Females in Summit County.
What is the Ratio of Females per 100 Males in Summit County?
There are 104.85 Females per 100 Males in Summit County.
What is the Median Population Age in Summit County?
Median Population Age in Summit County is 41.1 Years.
What is the Average Family Size in Summit County
Average Family Size in Summit County is 3.0 People.
What is the Average Household Size in Summit County
Average Household Size in Summit County is 2.3 People.
What is Per Capita Income in Summit County?
Per Capita income in Summit County is $40,786.
What is the Median Family Income in Summit County?
Median Family Income in Summit County is $89,685.
What is the Median Household income in Summit County?
Median Household Income in Summit County is $68,360.
What is Income or Wage Gap in Summit County?
Income or Wage Gap in Summit County is 28.0%.
Women in Summit County earn 72.0 cents for every dollar earned by a man.
What is Family Income Deficit in Summit County?
Family Income Deficit in Summit County is $10,636.
Families that are below poverty line in Summit County earn $10,636 less on average than the poverty threshold level.
What is Inequality or Gini Index in Summit County?
Inequality or Gini Index in Summit County is 0.48.
How Large is the Labor Force in Summit County?
There are 285,747 People in the Labor Forcein in Summit County.
What is the Percentage of People in the Labor Force in Summit County?
64.8% of People are in the Labor Force in Summit County.
What is the Unemployment Rate in Summit County?
Unemployment Rate in Summit County is 5.3%.