Stark County, OH
Stark County Map
Stark County Overview
374,199
TOTAL POPULATION
183,232
MALE POPULATION
190,967
FEMALE POPULATION
95.95
MALES / 100 FEMALES
104.22
FEMALES / 100 MALES
41.8
MEDIAN AGE
2.9
AVG FAMILY SIZE
2.4
AVG HOUSEHOLD SIZE
$34,652
PER CAPITA INCOME
$80,400
AVG FAMILY INCOME
$63,130
AVG HOUSEHOLD INCOME
30.5%
WAGE / INCOME GAP [ % ]
69.5¢/ $1
WAGE / INCOME GAP [ $ ]
$10,844
FAMILY INCOME DEFICIT
0.45
INEQUALITY / GINI INDEX
187,968
LABOR FORCE [ PEOPLE ]
62.0%
PERCENT IN LABOR FORCE
4.3%
UNEMPLOYMENT RATE
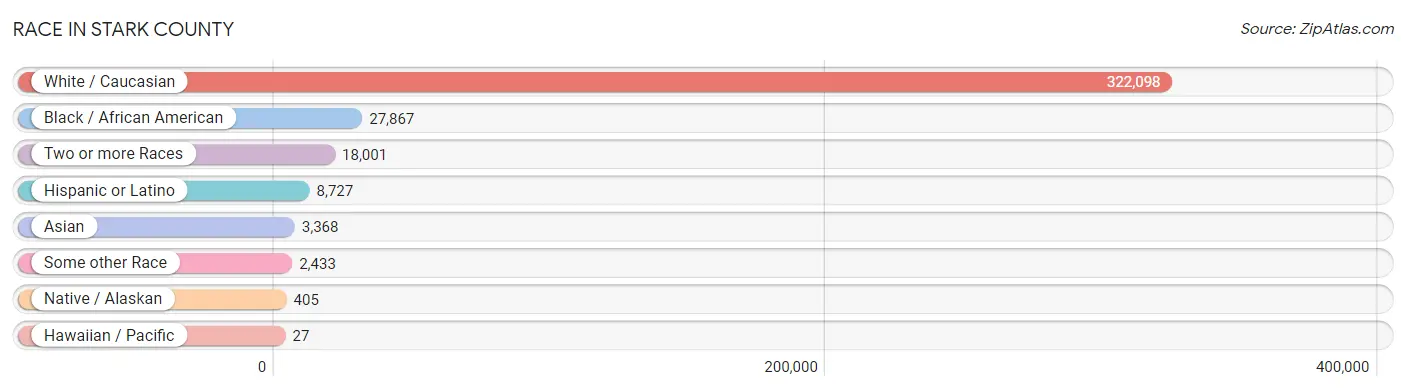
Race in Stark County
The most populous races in Stark County are White / Caucasian (322,098 | 86.1%), Black / African American (27,867 | 7.4%), and Two or more Races (18,001 | 4.8%).
| Race | # Population | % Population |
| Asian | 3,368 | 0.9% |
| Black / African American | 27,867 | 7.4% |
| Hawaiian / Pacific | 27 | 0.0% |
| Hispanic or Latino | 8,727 | 2.3% |
| Native / Alaskan | 405 | 0.1% |
| White / Caucasian | 322,098 | 86.1% |
| Two or more Races | 18,001 | 4.8% |
| Some other Race | 2,433 | 0.6% |
| Total | 374,199 | 100.0% |
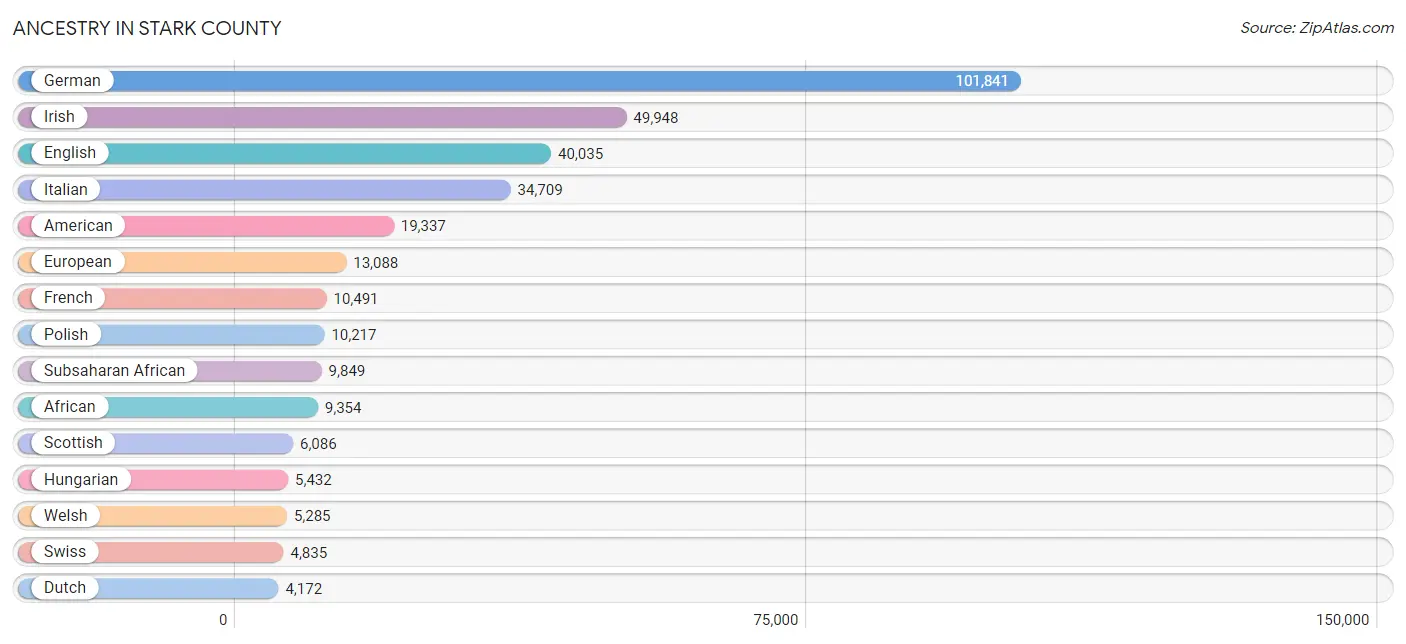
Ancestry in Stark County
The most populous ancestries reported in Stark County are German (101,841 | 27.2%), Irish (49,948 | 13.4%), English (40,035 | 10.7%), Italian (34,709 | 9.3%), and American (19,337 | 5.2%), together accounting for 65.7% of all Stark County residents.
| Ancestry | # Population | % Population |
| Afghan | 12 | 0.0% |
| African | 9,354 | 2.5% |
| Alaska Native | 5 | 0.0% |
| Albanian | 102 | 0.0% |
| Alsatian | 12 | 0.0% |
| American | 19,337 | 5.2% |
| Apache | 69 | 0.0% |
| Arab | 1,771 | 0.5% |
| Argentinean | 203 | 0.1% |
| Armenian | 173 | 0.1% |
| Assyrian / Chaldean / Syriac | 16 | 0.0% |
| Australian | 88 | 0.0% |
| Austrian | 948 | 0.3% |
| Bangladeshi | 171 | 0.1% |
| Belgian | 241 | 0.1% |
| Bhutanese | 372 | 0.1% |
| Blackfeet | 372 | 0.1% |
| Brazilian | 93 | 0.0% |
| British | 1,711 | 0.5% |
| Bulgarian | 88 | 0.0% |
| Burmese | 446 | 0.1% |
| Canadian | 595 | 0.2% |
| Cape Verdean | 109 | 0.0% |
| Celtic | 27 | 0.0% |
| Central American | 1,687 | 0.4% |
| Central American Indian | 147 | 0.0% |
| Cherokee | 1,631 | 0.4% |
| Cheyenne | 42 | 0.0% |
| Chinese | 21 | 0.0% |
| Chippewa | 95 | 0.0% |
| Choctaw | 44 | 0.0% |
| Colombian | 93 | 0.0% |
| Comanche | 6 | 0.0% |
| Costa Rican | 26 | 0.0% |
| Creek | 26 | 0.0% |
| Croatian | 1,653 | 0.4% |
| Crow | 19 | 0.0% |
| Cuban | 227 | 0.1% |
| Cypriot | 2 | 0.0% |
| Czech | 1,607 | 0.4% |
| Czechoslovakian | 964 | 0.3% |
| Danish | 636 | 0.2% |
| Delaware | 170 | 0.1% |
| Dominican | 146 | 0.0% |
| Dutch | 4,172 | 1.1% |
| Eastern European | 1,101 | 0.3% |
| Egyptian | 38 | 0.0% |
| English | 40,035 | 10.7% |
| European | 13,088 | 3.5% |
| Filipino | 14 | 0.0% |
| Finnish | 237 | 0.1% |
| French | 10,491 | 2.8% |
| French American Indian | 11 | 0.0% |
| French Canadian | 686 | 0.2% |
| German | 101,841 | 27.2% |
| German Russian | 4 | 0.0% |
| Greek | 4,007 | 1.1% |
| Guamanian / Chamorro | 17 | 0.0% |
| Guatemalan | 697 | 0.2% |
| Haitian | 144 | 0.0% |
| Honduran | 429 | 0.1% |
| Hungarian | 5,432 | 1.5% |
| Icelander | 125 | 0.0% |
| Indian (Asian) | 936 | 0.3% |
| Indonesian | 10 | 0.0% |
| Inupiat | 35 | 0.0% |
| Iranian | 69 | 0.0% |
| Iraqi | 8 | 0.0% |
| Irish | 49,948 | 13.4% |
| Iroquois | 36 | 0.0% |
| Israeli | 30 | 0.0% |
| Italian | 34,709 | 9.3% |
| Jamaican | 120 | 0.0% |
| Japanese | 248 | 0.1% |
| Jordanian | 106 | 0.0% |
| Korean | 1,094 | 0.3% |
| Laotian | 26 | 0.0% |
| Latvian | 109 | 0.0% |
| Lebanese | 704 | 0.2% |
| Lithuanian | 438 | 0.1% |
| Luxembourger | 25 | 0.0% |
| Macedonian | 780 | 0.2% |
| Malaysian | 103 | 0.0% |
| Mexican | 3,263 | 0.9% |
| Mexican American Indian | 73 | 0.0% |
| Mongolian | 90 | 0.0% |
| Native Hawaiian | 130 | 0.0% |
| Navajo | 23 | 0.0% |
| Nicaraguan | 6 | 0.0% |
| Nigerian | 110 | 0.0% |
| Northern European | 385 | 0.1% |
| Norwegian | 890 | 0.2% |
| Pakistani | 104 | 0.0% |
| Palestinian | 104 | 0.0% |
| Panamanian | 23 | 0.0% |
| Pennsylvania German | 752 | 0.2% |
| Peruvian | 78 | 0.0% |
| Polish | 10,217 | 2.7% |
| Portuguese | 841 | 0.2% |
| Potawatomi | 26 | 0.0% |
| Puerto Rican | 1,679 | 0.4% |
| Romanian | 3,273 | 0.9% |
| Russian | 1,454 | 0.4% |
| Salvadoran | 506 | 0.1% |
| Scandinavian | 803 | 0.2% |
| Scotch-Irish | 3,843 | 1.0% |
| Scottish | 6,086 | 1.6% |
| Serbian | 895 | 0.2% |
| Shoshone | 12 | 0.0% |
| Sioux | 106 | 0.0% |
| Slavic | 251 | 0.1% |
| Slovak | 3,048 | 0.8% |
| Slovene | 632 | 0.2% |
| South African | 224 | 0.1% |
| South American | 374 | 0.1% |
| Spaniard | 227 | 0.1% |
| Spanish | 688 | 0.2% |
| Sri Lankan | 261 | 0.1% |
| Subsaharan African | 9,849 | 2.6% |
| Swedish | 1,905 | 0.5% |
| Swiss | 4,835 | 1.3% |
| Syrian | 565 | 0.2% |
| Thai | 1,142 | 0.3% |
| Turkish | 85 | 0.0% |
| U.S. Virgin Islander | 10 | 0.0% |
| Ukrainian | 1,084 | 0.3% |
| Vietnamese | 48 | 0.0% |
| Welsh | 5,285 | 1.4% |
| West Indian | 13 | 0.0% |
| Yugoslavian | 323 | 0.1% | View All 130 Rows |
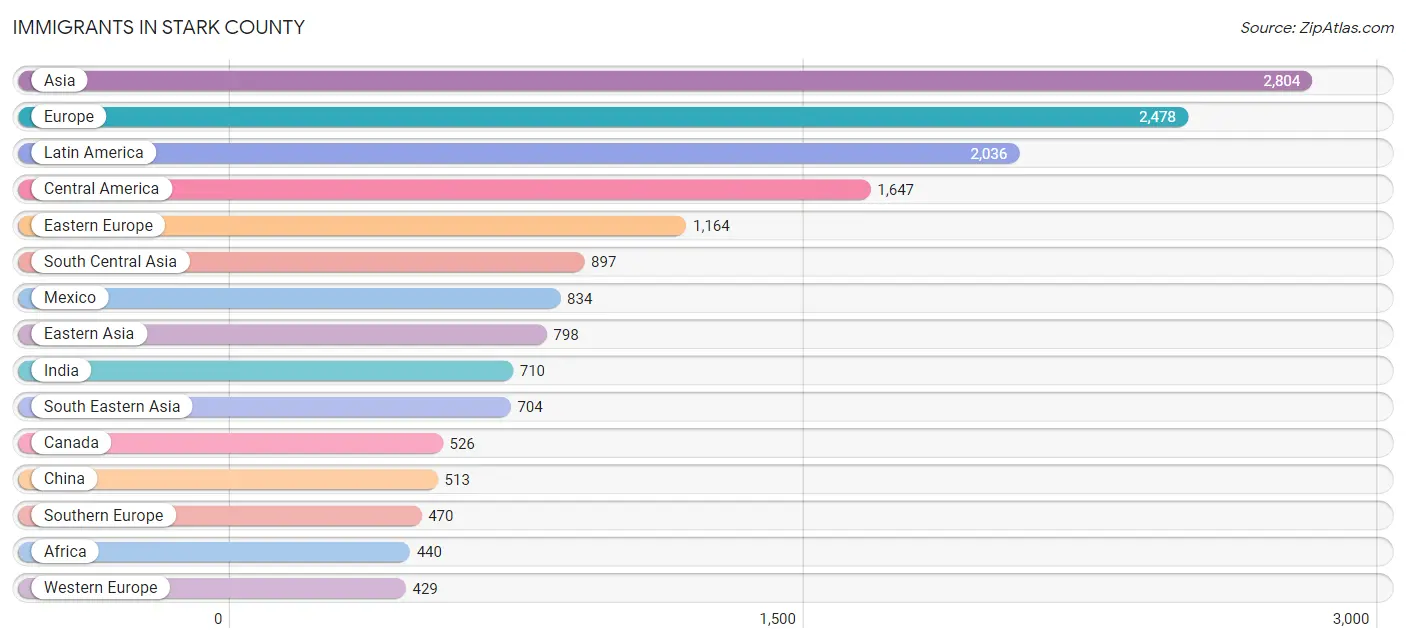
Immigrants in Stark County
The most numerous immigrant groups reported in Stark County came from Asia (2,804 | 0.7%), Europe (2,478 | 0.7%), Latin America (2,036 | 0.5%), Central America (1,647 | 0.4%), and Eastern Europe (1,164 | 0.3%), together accounting for 2.7% of all Stark County residents.
| Immigration Origin | # Population | % Population |
| Afghanistan | 12 | 0.0% |
| Africa | 440 | 0.1% |
| Argentina | 44 | 0.0% |
| Armenia | 33 | 0.0% |
| Asia | 2,804 | 0.7% |
| Australia | 44 | 0.0% |
| Austria | 64 | 0.0% |
| Bangladesh | 26 | 0.0% |
| Belgium | 14 | 0.0% |
| Brazil | 125 | 0.0% |
| Bulgaria | 6 | 0.0% |
| Cabo Verde | 33 | 0.0% |
| Cambodia | 50 | 0.0% |
| Canada | 526 | 0.1% |
| Caribbean | 84 | 0.0% |
| Central America | 1,647 | 0.4% |
| China | 513 | 0.1% |
| Colombia | 68 | 0.0% |
| Costa Rica | 11 | 0.0% |
| Croatia | 32 | 0.0% |
| Cuba | 7 | 0.0% |
| Czechoslovakia | 55 | 0.0% |
| Denmark | 53 | 0.0% |
| Dominican Republic | 26 | 0.0% |
| Eastern Africa | 78 | 0.0% |
| Eastern Asia | 798 | 0.2% |
| Eastern Europe | 1,164 | 0.3% |
| El Salvador | 258 | 0.1% |
| England | 225 | 0.1% |
| Ethiopia | 16 | 0.0% |
| Europe | 2,478 | 0.7% |
| France | 30 | 0.0% |
| Germany | 282 | 0.1% |
| Greece | 232 | 0.1% |
| Guatemala | 334 | 0.1% |
| Haiti | 28 | 0.0% |
| Honduras | 198 | 0.1% |
| Hong Kong | 7 | 0.0% |
| India | 710 | 0.2% |
| Iran | 26 | 0.0% |
| Iraq | 8 | 0.0% |
| Israel | 19 | 0.0% |
| Italy | 210 | 0.1% |
| Jamaica | 23 | 0.0% |
| Japan | 68 | 0.0% |
| Jordan | 53 | 0.0% |
| Kazakhstan | 17 | 0.0% |
| Kenya | 16 | 0.0% |
| Korea | 217 | 0.1% |
| Kuwait | 39 | 0.0% |
| Latin America | 2,036 | 0.5% |
| Latvia | 25 | 0.0% |
| Lebanon | 28 | 0.0% |
| Liberia | 15 | 0.0% |
| Lithuania | 18 | 0.0% |
| Malaysia | 27 | 0.0% |
| Mexico | 834 | 0.2% |
| Nepal | 44 | 0.0% |
| Netherlands | 39 | 0.0% |
| Nigeria | 41 | 0.0% |
| North Macedonia | 325 | 0.1% |
| Northern Europe | 415 | 0.1% |
| Norway | 8 | 0.0% |
| Oceania | 44 | 0.0% |
| Pakistan | 41 | 0.0% |
| Panama | 12 | 0.0% |
| Peru | 60 | 0.0% |
| Philippines | 401 | 0.1% |
| Poland | 21 | 0.0% |
| Portugal | 16 | 0.0% |
| Romania | 192 | 0.1% |
| Russia | 107 | 0.0% |
| Scotland | 20 | 0.0% |
| Senegal | 9 | 0.0% |
| Serbia | 172 | 0.1% |
| Sierra Leone | 21 | 0.0% |
| South Africa | 243 | 0.1% |
| South America | 305 | 0.1% |
| South Central Asia | 897 | 0.2% |
| South Eastern Asia | 704 | 0.2% |
| Southern Europe | 470 | 0.1% |
| Spain | 12 | 0.0% |
| Sweden | 25 | 0.0% |
| Syria | 101 | 0.0% |
| Taiwan | 23 | 0.0% |
| Thailand | 35 | 0.0% |
| Ukraine | 188 | 0.1% |
| Venezuela | 8 | 0.0% |
| Vietnam | 166 | 0.0% |
| Western Africa | 119 | 0.0% |
| Western Asia | 378 | 0.1% |
| Western Europe | 429 | 0.1% |
| Yemen | 10 | 0.0% |
| Zimbabwe | 20 | 0.0% | View All 94 Rows |
Sex and Age in Stark County
Sex and Age in Stark County
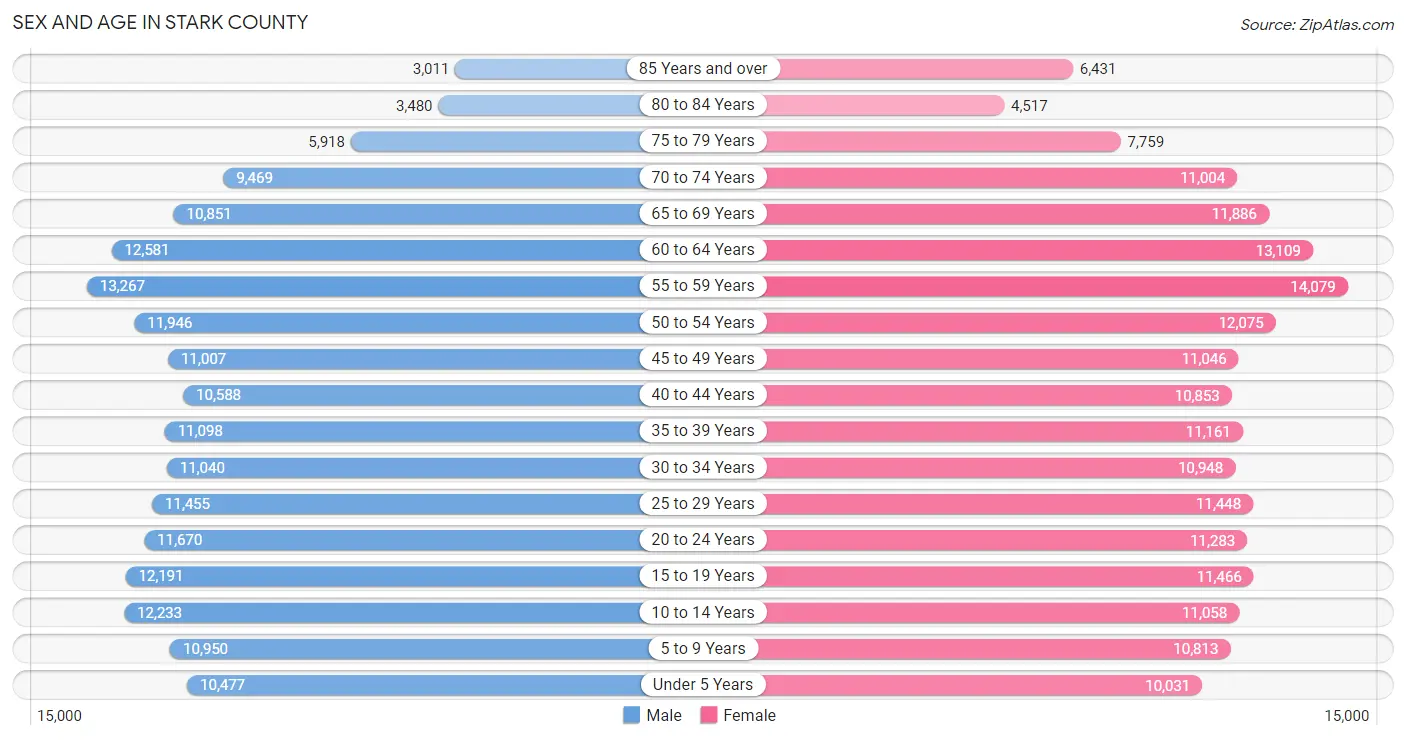
The most populous age groups in Stark County are 55 to 59 Years (13,267 | 7.2%) for men and 55 to 59 Years (14,079 | 7.4%) for women.
| Age Bracket | Male | Female |
| Under 5 Years | 10,477 (5.7%) | 10,031 (5.2%) |
| 5 to 9 Years | 10,950 (6.0%) | 10,813 (5.7%) |
| 10 to 14 Years | 12,233 (6.7%) | 11,058 (5.8%) |
| 15 to 19 Years | 12,191 (6.7%) | 11,466 (6.0%) |
| 20 to 24 Years | 11,670 (6.4%) | 11,283 (5.9%) |
| 25 to 29 Years | 11,455 (6.2%) | 11,448 (6.0%) |
| 30 to 34 Years | 11,040 (6.0%) | 10,948 (5.7%) |
| 35 to 39 Years | 11,098 (6.1%) | 11,161 (5.8%) |
| 40 to 44 Years | 10,588 (5.8%) | 10,853 (5.7%) |
| 45 to 49 Years | 11,007 (6.0%) | 11,046 (5.8%) |
| 50 to 54 Years | 11,946 (6.5%) | 12,075 (6.3%) |
| 55 to 59 Years | 13,267 (7.2%) | 14,079 (7.4%) |
| 60 to 64 Years | 12,581 (6.9%) | 13,109 (6.9%) |
| 65 to 69 Years | 10,851 (5.9%) | 11,886 (6.2%) |
| 70 to 74 Years | 9,469 (5.2%) | 11,004 (5.8%) |
| 75 to 79 Years | 5,918 (3.2%) | 7,759 (4.1%) |
| 80 to 84 Years | 3,480 (1.9%) | 4,517 (2.4%) |
| 85 Years and over | 3,011 (1.6%) | 6,431 (3.4%) |
| Total | 183,232 (100.0%) | 190,967 (100.0%) |
Families and Households in Stark County
Median Family Size in Stark County
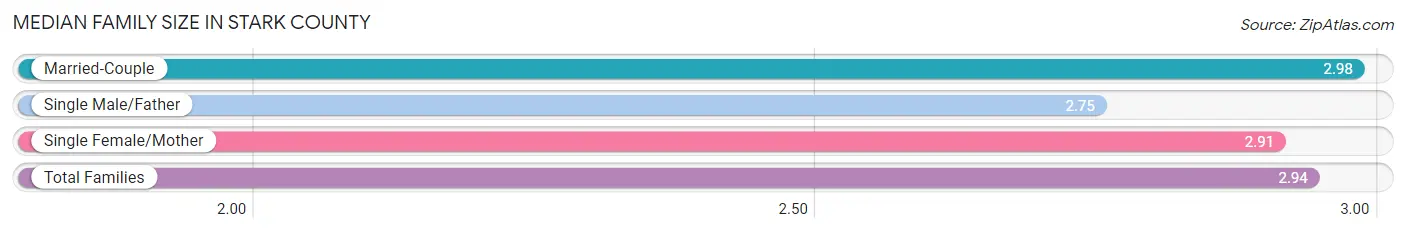
The median family size in Stark County is 2.94 persons per family, with married-couple families (69,709 | 71.9%) accounting for the largest median family size of 2.98 persons per family. On the other hand, single male/father families (7,741 | 8.0%) represent the smallest median family size with 2.75 persons per family.
| Family Type | # Families | Family Size |
| Married-Couple | 69,709 (71.9%) | 2.98 |
| Single Male/Father | 7,741 (8.0%) | 2.75 |
| Single Female/Mother | 19,485 (20.1%) | 2.91 |
| Total Families | 96,935 (100.0%) | 2.94 |
Median Household Size in Stark County
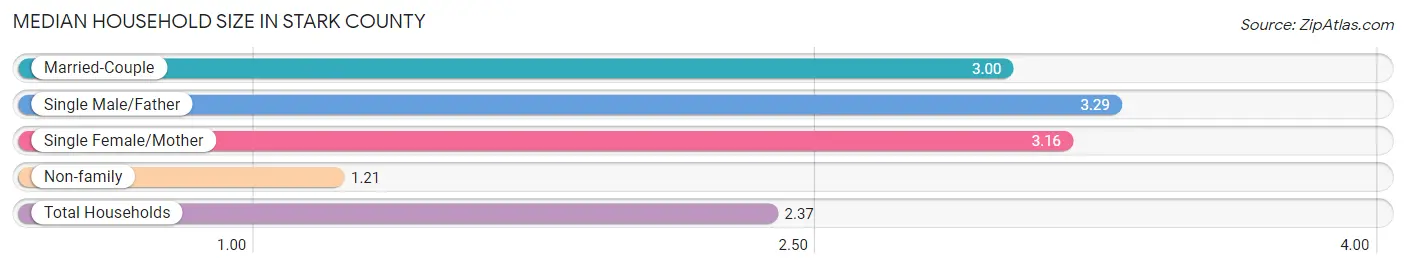
The median household size in Stark County is 2.37 persons per household, with single male/father households (7,741 | 5.0%) accounting for the largest median household size of 3.29 persons per household. non-family households (57,755 | 37.3%) represent the smallest median household size with 1.21 persons per household.
| Household Type | # Households | Household Size |
| Married-Couple | 69,709 (45.1%) | 3.00 |
| Single Male/Father | 7,741 (5.0%) | 3.29 |
| Single Female/Mother | 19,485 (12.6%) | 3.16 |
| Non-family | 57,755 (37.3%) | 1.21 |
| Total Households | 154,690 (100.0%) | 2.37 |
Household Size by Marriage Status in Stark County
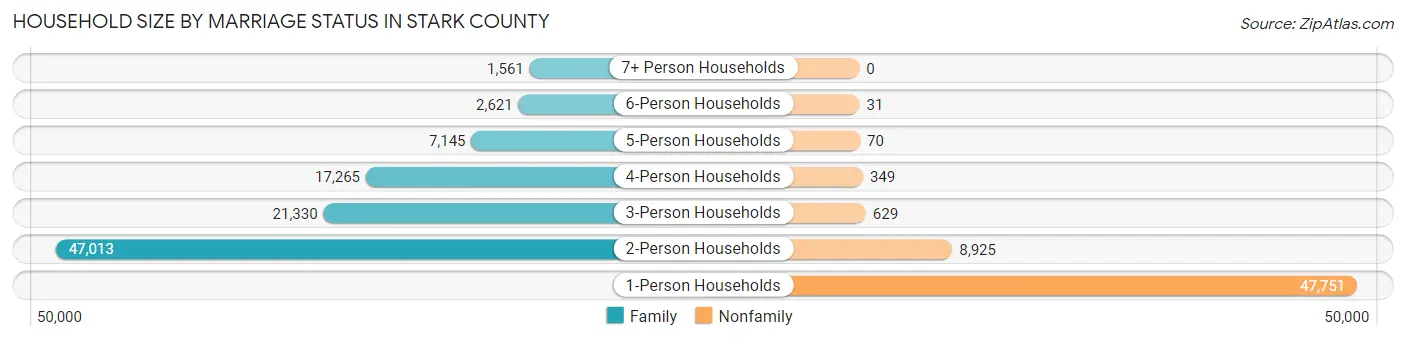
Out of a total of 154,690 households in Stark County, 96,935 (62.7%) are family households, while 57,755 (37.3%) are nonfamily households. The most numerous type of family households are 2-person households, comprising 47,013, and the most common type of nonfamily households are 1-person households, comprising 47,751.
| Household Size | Family Households | Nonfamily Households |
| 1-Person Households | - | 47,751 (30.9%) |
| 2-Person Households | 47,013 (30.4%) | 8,925 (5.8%) |
| 3-Person Households | 21,330 (13.8%) | 629 (0.4%) |
| 4-Person Households | 17,265 (11.2%) | 349 (0.2%) |
| 5-Person Households | 7,145 (4.6%) | 70 (0.1%) |
| 6-Person Households | 2,621 (1.7%) | 31 (0.0%) |
| 7+ Person Households | 1,561 (1.0%) | 0 (0.0%) |
| Total | 96,935 (62.7%) | 57,755 (37.3%) |
Female Fertility in Stark County
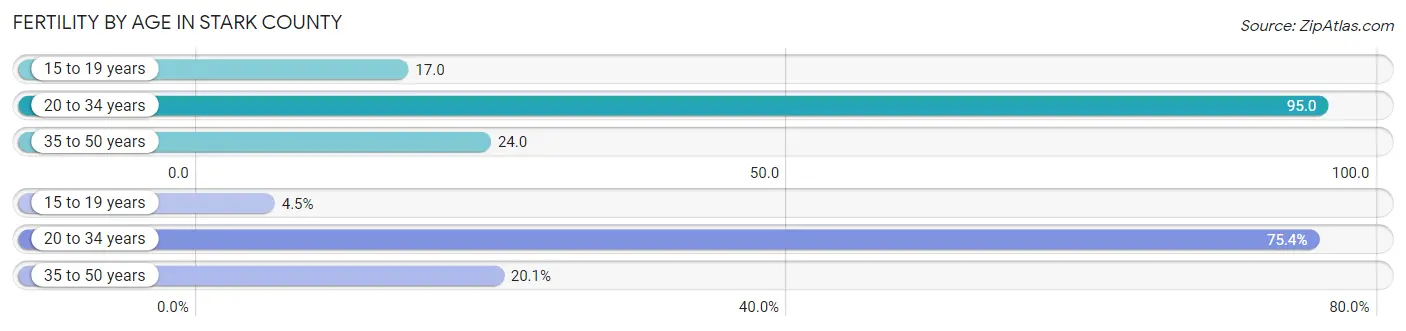
Fertility by Age in Stark County
Average fertility rate in Stark County is 53.0 births per 1,000 women. Women in the age bracket of 20 to 34 years have the highest fertility rate with 95.0 births per 1,000 women. Women in the age bracket of 20 to 34 years acount for 75.4% of all women with births.
| Age Bracket | Women with Births | Births / 1,000 Women |
| 15 to 19 years | 193 (4.5%) | 17.0 |
| 20 to 34 years | 3,216 (75.4%) | 95.0 |
| 35 to 50 years | 856 (20.1%) | 24.0 |
| Total | 4,265 (100.0%) | 53.0 |
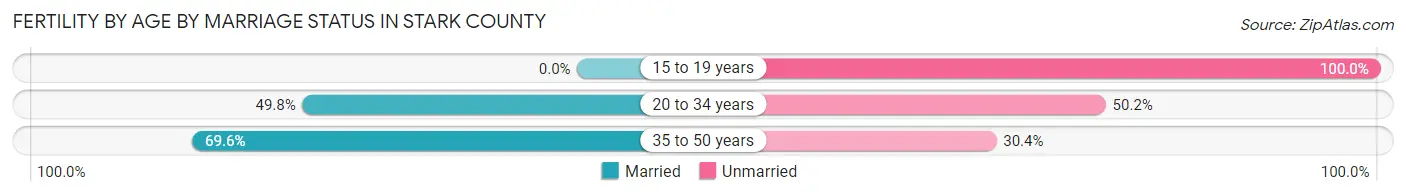
Fertility by Age by Marriage Status in Stark County
51.5% of women with births (4,265) in Stark County are married. The highest percentage of unmarried women with births falls into 15 to 19 years age bracket with 100.0% of them unmarried at the time of birth, while the lowest percentage of unmarried women with births belong to 35 to 50 years age bracket with 30.4% of them unmarried.
| Age Bracket | Married | Unmarried |
| 15 to 19 years | 0 (0.0%) | 193 (100.0%) |
| 20 to 34 years | 1,602 (49.8%) | 1,614 (50.2%) |
| 35 to 50 years | 596 (69.6%) | 260 (30.4%) |
| Total | 2,196 (51.5%) | 2,069 (48.5%) |
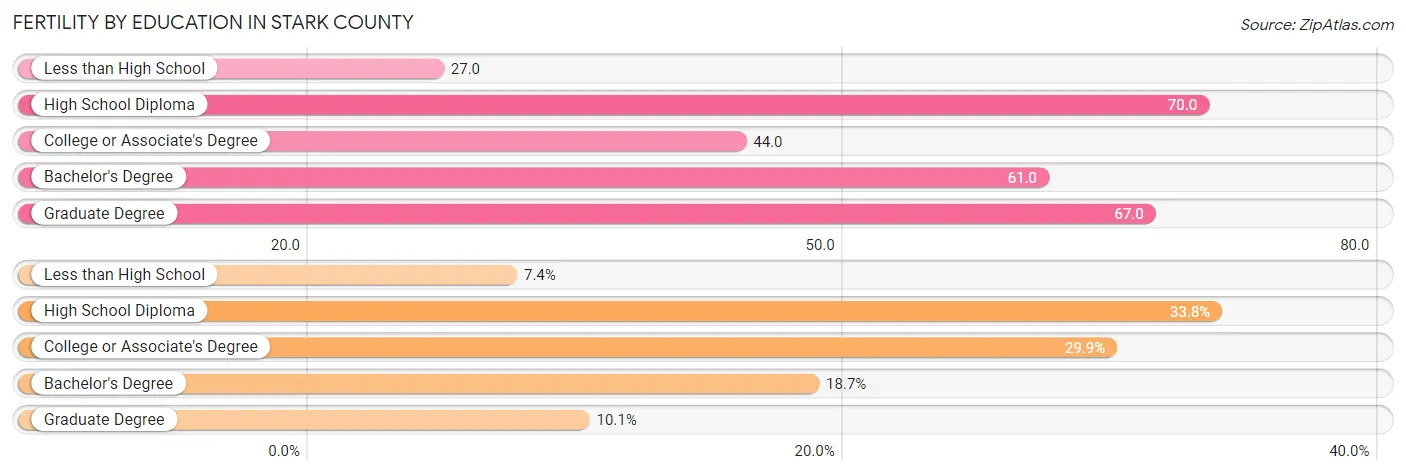
Fertility by Education in Stark County
Average fertility rate in Stark County is 53.0 births per 1,000 women. Women with the education attainment of high school diploma have the highest fertility rate of 70.0 births per 1,000 women, while women with the education attainment of less than high school have the lowest fertility at 27.0 births per 1,000 women. Women with the education attainment of high school diploma represent 33.8% of all women with births.
| Educational Attainment | Women with Births | Births / 1,000 Women |
| Less than High School | 316 (7.4%) | 27.0 |
| High School Diploma | 1,443 (33.8%) | 70.0 |
| College or Associate's Degree | 1,275 (29.9%) | 44.0 |
| Bachelor's Degree | 799 (18.7%) | 61.0 |
| Graduate Degree | 432 (10.1%) | 67.0 |
| Total | 4,265 (100.0%) | 53.0 |
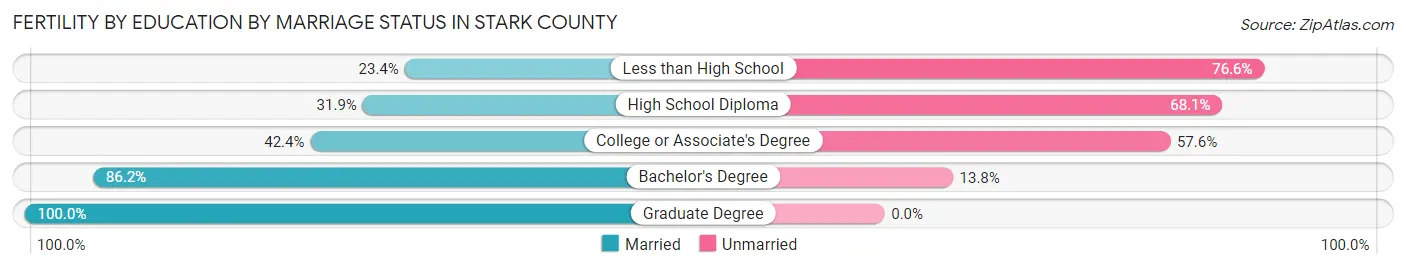
Fertility by Education by Marriage Status in Stark County
48.5% of women with births in Stark County are unmarried. Women with the educational attainment of graduate degree are most likely to be married with 100.0% of them married at childbirth, while women with the educational attainment of less than high school are least likely to be married with 76.6% of them unmarried at childbirth.
| Educational Attainment | Married | Unmarried |
| Less than High School | 74 (23.4%) | 242 (76.6%) |
| High School Diploma | 460 (31.9%) | 983 (68.1%) |
| College or Associate's Degree | 541 (42.4%) | 734 (57.6%) |
| Bachelor's Degree | 689 (86.2%) | 110 (13.8%) |
| Graduate Degree | 432 (100.0%) | 0 (0.0%) |
| Total | 2,196 (51.5%) | 2,069 (48.5%) |
Income in Stark County
Income Overview in Stark County
Per Capita Income in Stark County is $34,652, while median incomes of families and households are $80,400 and $63,130 respectively.
| Characteristic | Number | Measure |
| Per Capita Income | 374,199 | $34,652 |
| Median Family Income | 96,935 | $80,400 |
| Mean Family Income | 96,935 | $99,164 |
| Median Household Income | 154,690 | $63,130 |
| Mean Household Income | 154,690 | $82,357 |
| Income Deficit | 96,935 | $10,844 |
| Wage / Income Gap (%) | 374,199 | 30.54% |
| Wage / Income Gap ($) | 374,199 | 69.46¢ per $1 |
| Gini / Inequality Index | 374,199 | 0.45 |
Earnings by Sex in Stark County
Average Earnings in Stark County are $37,265, $45,141 for men and $31,353 for women, a difference of 30.5%.
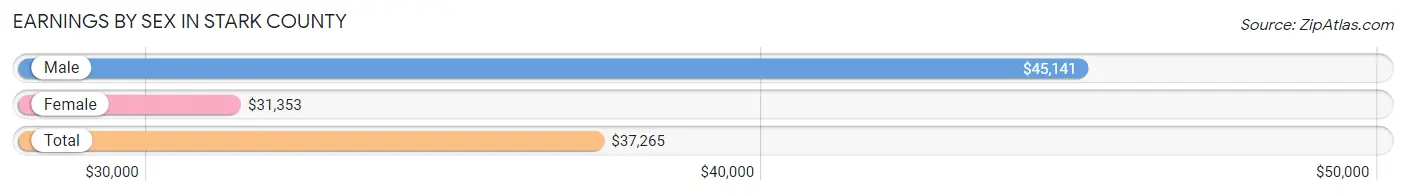
| Sex | Number | Average Earnings |
| Male | 103,260 (52.4%) | $45,141 |
| Female | 93,641 (47.6%) | $31,353 |
| Total | 196,901 (100.0%) | $37,265 |
Earnings by Sex by Income Bracket in Stark County
The most common earnings brackets in Stark County are $100,000+ for men (13,304 | 12.9%) and $30,000 to $34,999 for women (6,534 | 7.0%).
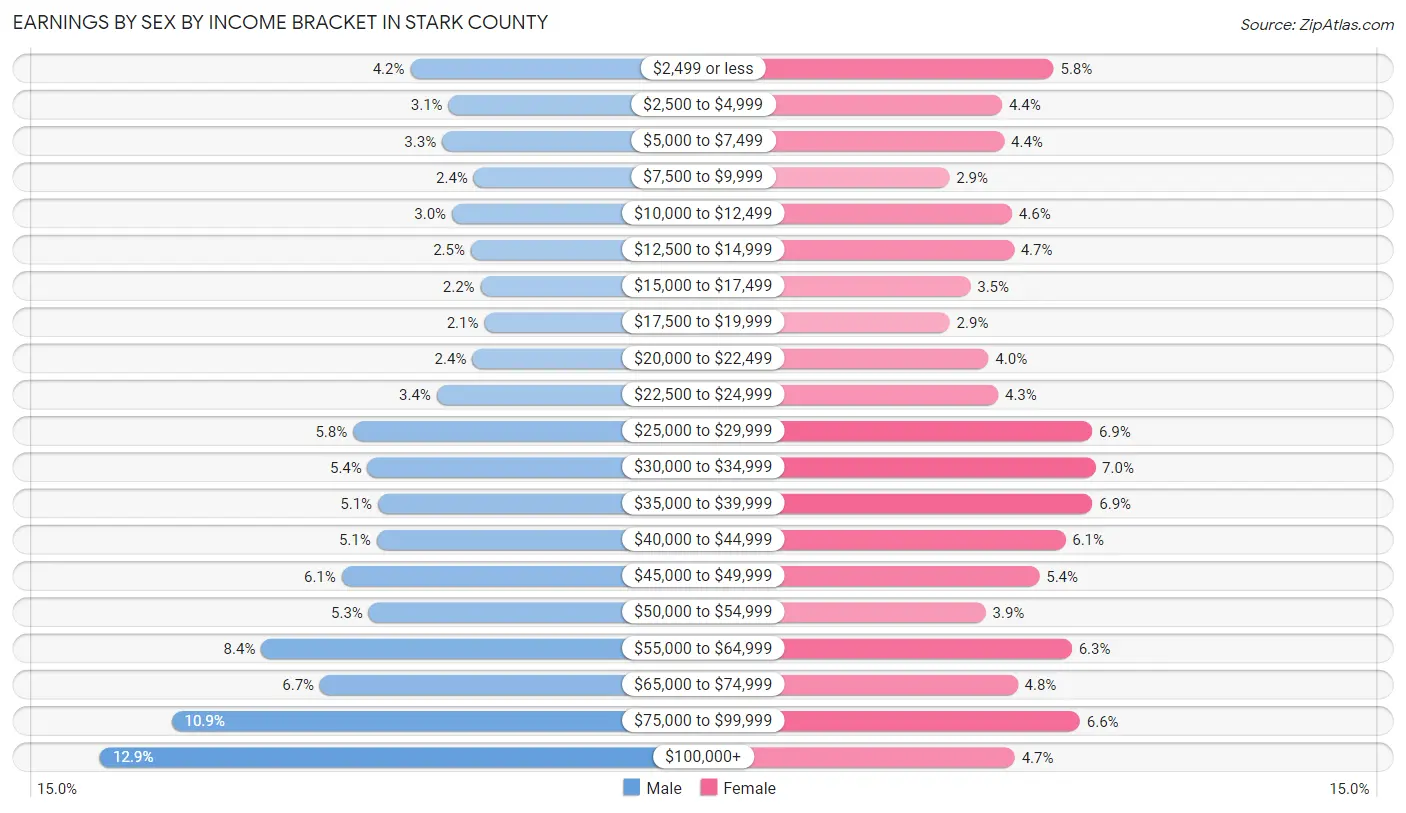
| Income | Male | Female |
| $2,499 or less | 4,296 (4.2%) | 5,444 (5.8%) |
| $2,500 to $4,999 | 3,194 (3.1%) | 4,087 (4.4%) |
| $5,000 to $7,499 | 3,372 (3.3%) | 4,142 (4.4%) |
| $7,500 to $9,999 | 2,456 (2.4%) | 2,696 (2.9%) |
| $10,000 to $12,499 | 3,086 (3.0%) | 4,345 (4.6%) |
| $12,500 to $14,999 | 2,542 (2.5%) | 4,392 (4.7%) |
| $15,000 to $17,499 | 2,261 (2.2%) | 3,254 (3.5%) |
| $17,500 to $19,999 | 2,144 (2.1%) | 2,708 (2.9%) |
| $20,000 to $22,499 | 2,502 (2.4%) | 3,726 (4.0%) |
| $22,500 to $24,999 | 3,536 (3.4%) | 3,976 (4.3%) |
| $25,000 to $29,999 | 5,953 (5.8%) | 6,448 (6.9%) |
| $30,000 to $34,999 | 5,539 (5.4%) | 6,534 (7.0%) |
| $35,000 to $39,999 | 5,231 (5.1%) | 6,461 (6.9%) |
| $40,000 to $44,999 | 5,281 (5.1%) | 5,747 (6.1%) |
| $45,000 to $49,999 | 6,286 (6.1%) | 5,069 (5.4%) |
| $50,000 to $54,999 | 5,508 (5.3%) | 3,648 (3.9%) |
| $55,000 to $64,999 | 8,623 (8.4%) | 5,916 (6.3%) |
| $65,000 to $74,999 | 6,923 (6.7%) | 4,491 (4.8%) |
| $75,000 to $99,999 | 11,223 (10.9%) | 6,138 (6.6%) |
| $100,000+ | 13,304 (12.9%) | 4,419 (4.7%) |
| Total | 103,260 (100.0%) | 93,641 (100.0%) |
Earnings by Sex by Educational Attainment in Stark County
Average earnings in Stark County are $50,680 for men and $35,694 for women, a difference of 29.6%. Men with an educational attainment of graduate degree enjoy the highest average annual earnings of $88,422, while those with less than high school education earn the least with $32,987. Women with an educational attainment of graduate degree earn the most with the average annual earnings of $67,986, while those with less than high school education have the smallest earnings of $21,546.
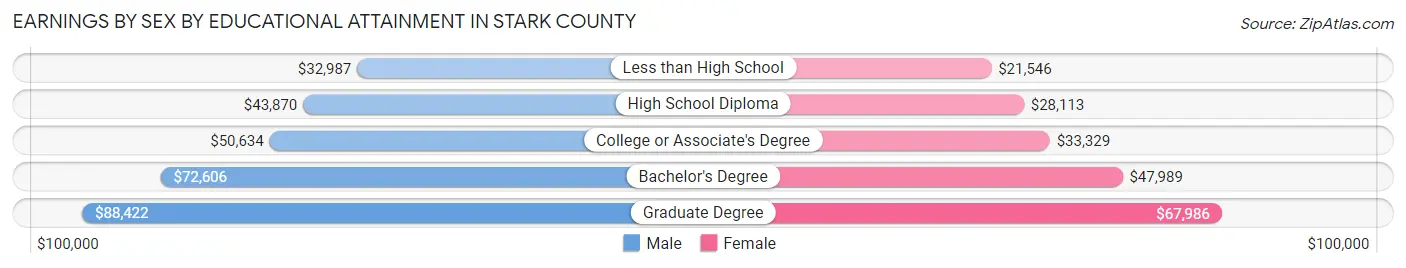
| Educational Attainment | Male Income | Female Income |
| Less than High School | $32,987 | $21,546 |
| High School Diploma | $43,870 | $28,113 |
| College or Associate's Degree | $50,634 | $33,329 |
| Bachelor's Degree | $72,606 | $47,989 |
| Graduate Degree | $88,422 | $67,986 |
| Total | $50,680 | $35,694 |
Family Income in Stark County
Family Income Brackets in Stark County
According to the Stark County family income data, there are 20,647 families falling into the $100,000 to $149,999 income range, which is the most common income bracket and makes up 21.3% of all families. Conversely, the $10,000 to $14,999 income bracket is the least frequent group with only 2,036 families (2.1%) belonging to this category.
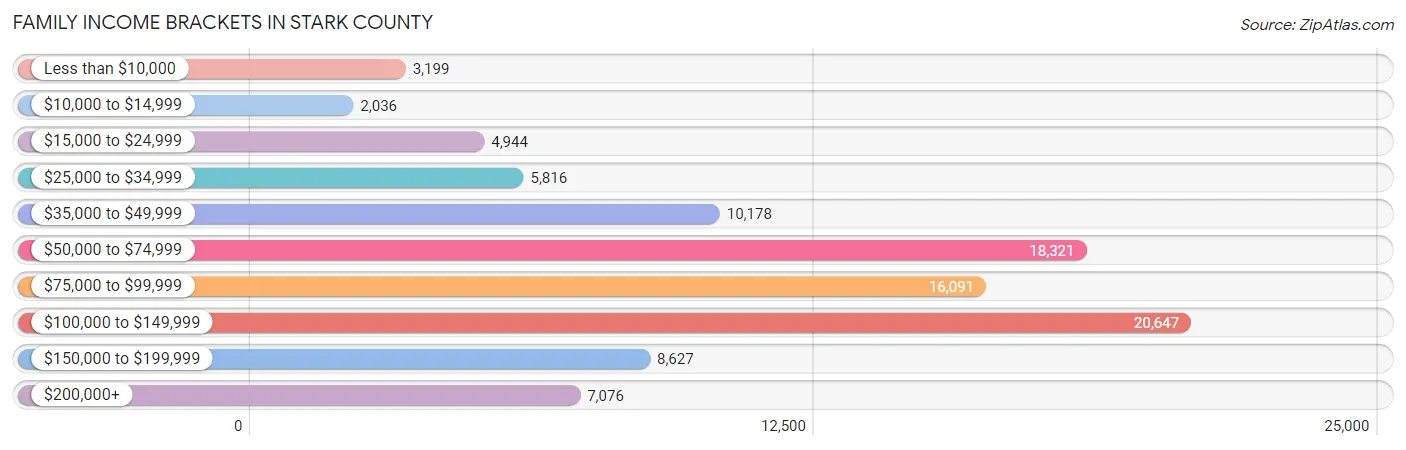
| Income Bracket | # Families | % Families |
| Less than $10,000 | 3,199 | 3.3% |
| $10,000 to $14,999 | 2,036 | 2.1% |
| $15,000 to $24,999 | 4,944 | 5.1% |
| $25,000 to $34,999 | 5,816 | 6.0% |
| $35,000 to $49,999 | 10,178 | 10.5% |
| $50,000 to $74,999 | 18,321 | 18.9% |
| $75,000 to $99,999 | 16,091 | 16.6% |
| $100,000 to $149,999 | 20,647 | 21.3% |
| $150,000 to $199,999 | 8,627 | 8.9% |
| $200,000+ | 7,076 | 7.3% |
Family Income by Famaliy Size in Stark County
5-person families (6,323 | 6.5%) account for the highest median family income in Stark County with $104,363 per family, while 2-person families (50,859 | 52.5%) have the highest median income of $35,461 per family member.
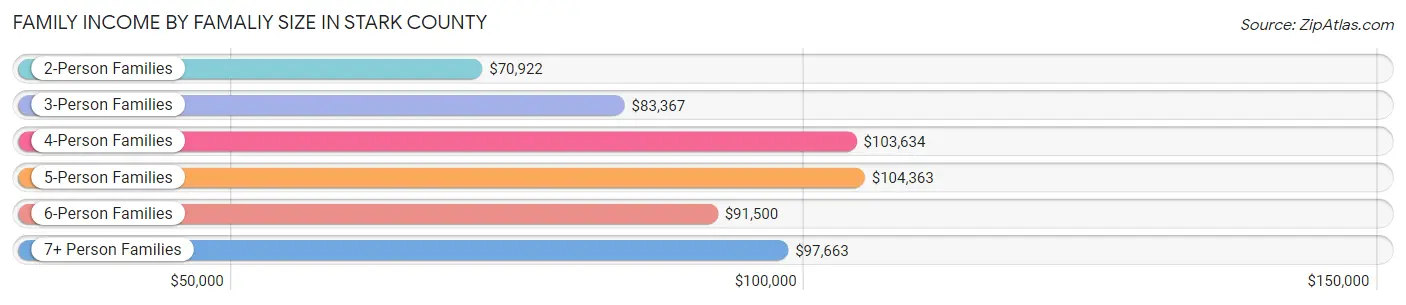
| Income Bracket | # Families | Median Income |
| 2-Person Families | 50,859 (52.5%) | $70,922 |
| 3-Person Families | 20,750 (21.4%) | $83,367 |
| 4-Person Families | 15,662 (16.2%) | $103,634 |
| 5-Person Families | 6,323 (6.5%) | $104,363 |
| 6-Person Families | 1,896 (2.0%) | $91,500 |
| 7+ Person Families | 1,445 (1.5%) | $97,663 |
| Total | 96,935 (100.0%) | $80,400 |
Family Income by Number of Earners in Stark County
The median family income in Stark County is $80,400, with families comprising 3+ earners (10,614) having the highest median family income of $136,109, while families with no earners (15,913) have the lowest median family income of $50,884, accounting for 11.0% and 16.4% of families, respectively.
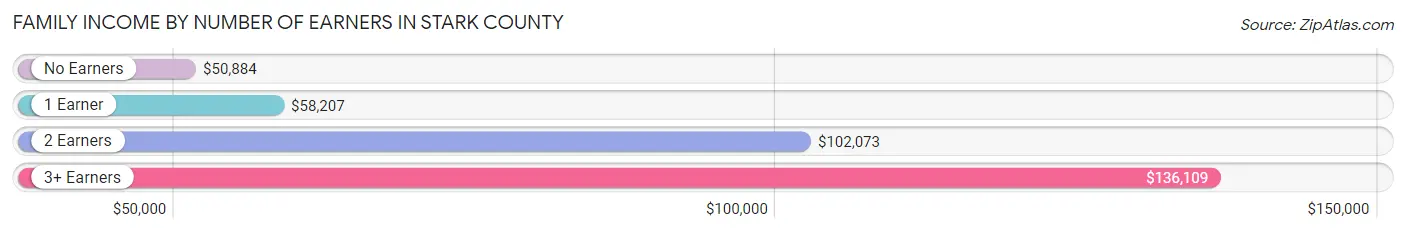
| Number of Earners | # Families | Median Income |
| No Earners | 15,913 (16.4%) | $50,884 |
| 1 Earner | 33,395 (34.4%) | $58,207 |
| 2 Earners | 37,013 (38.2%) | $102,073 |
| 3+ Earners | 10,614 (11.0%) | $136,109 |
| Total | 96,935 (100.0%) | $80,400 |
Household Income in Stark County
Household Income Brackets in Stark County
With 27,535 households falling in the category, the $50,000 to $74,999 income range is the most frequent in Stark County, accounting for 17.8% of all households. In contrast, only 6,806 households (4.4%) fall into the less than $10,000 income bracket, making it the least populous group.
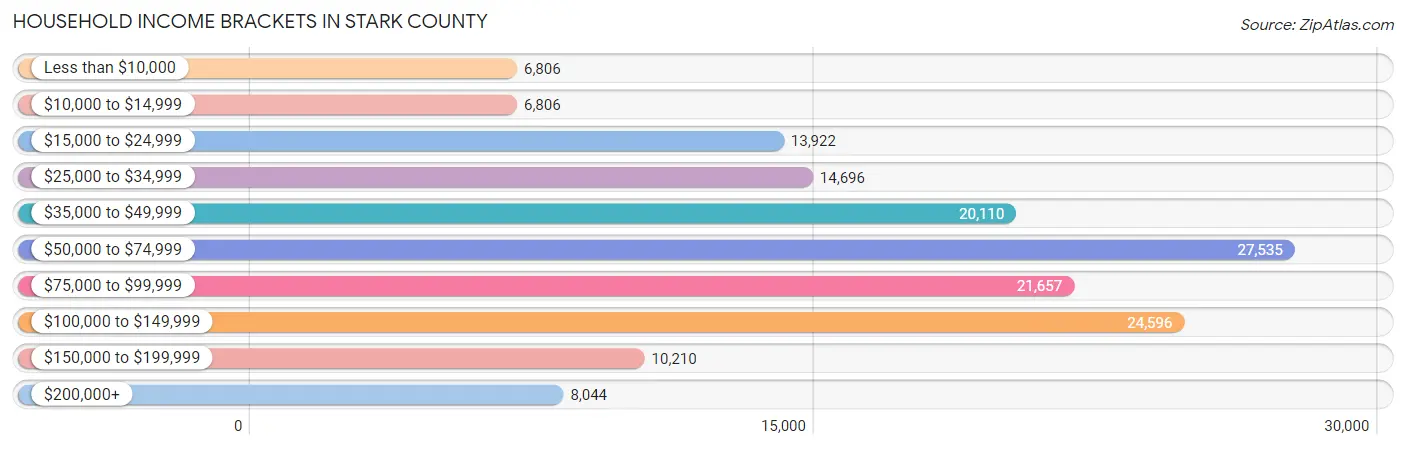
| Income Bracket | # Households | % Households |
| Less than $10,000 | 6,806 | 4.4% |
| $10,000 to $14,999 | 6,806 | 4.4% |
| $15,000 to $24,999 | 13,922 | 9.0% |
| $25,000 to $34,999 | 14,696 | 9.5% |
| $35,000 to $49,999 | 20,110 | 13.0% |
| $50,000 to $74,999 | 27,535 | 17.8% |
| $75,000 to $99,999 | 21,657 | 14.0% |
| $100,000 to $149,999 | 24,596 | 15.9% |
| $150,000 to $199,999 | 10,210 | 6.6% |
| $200,000+ | 8,044 | 5.2% |
Household Income by Householder Age in Stark County
The median household income in Stark County is $63,130, with the highest median household income of $78,661 found in the 45 to 64 years age bracket for the primary householder. A total of 57,750 households (37.3%) fall into this category. Meanwhile, the 15 to 24 years age bracket for the primary householder has the lowest median household income of $45,138, with 5,126 households (3.3%) in this group.
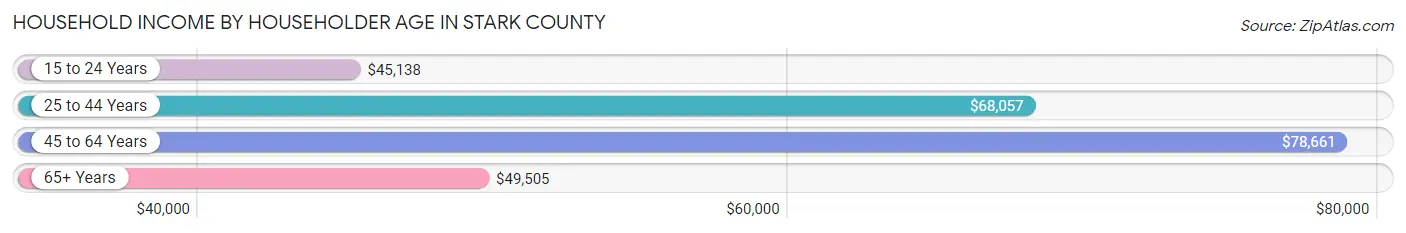
| Income Bracket | # Households | Median Income |
| 15 to 24 Years | 5,126 (3.3%) | $45,138 |
| 25 to 44 Years | 44,885 (29.0%) | $68,057 |
| 45 to 64 Years | 57,750 (37.3%) | $78,661 |
| 65+ Years | 46,929 (30.3%) | $49,505 |
| Total | 154,690 (100.0%) | $63,130 |
Poverty in Stark County
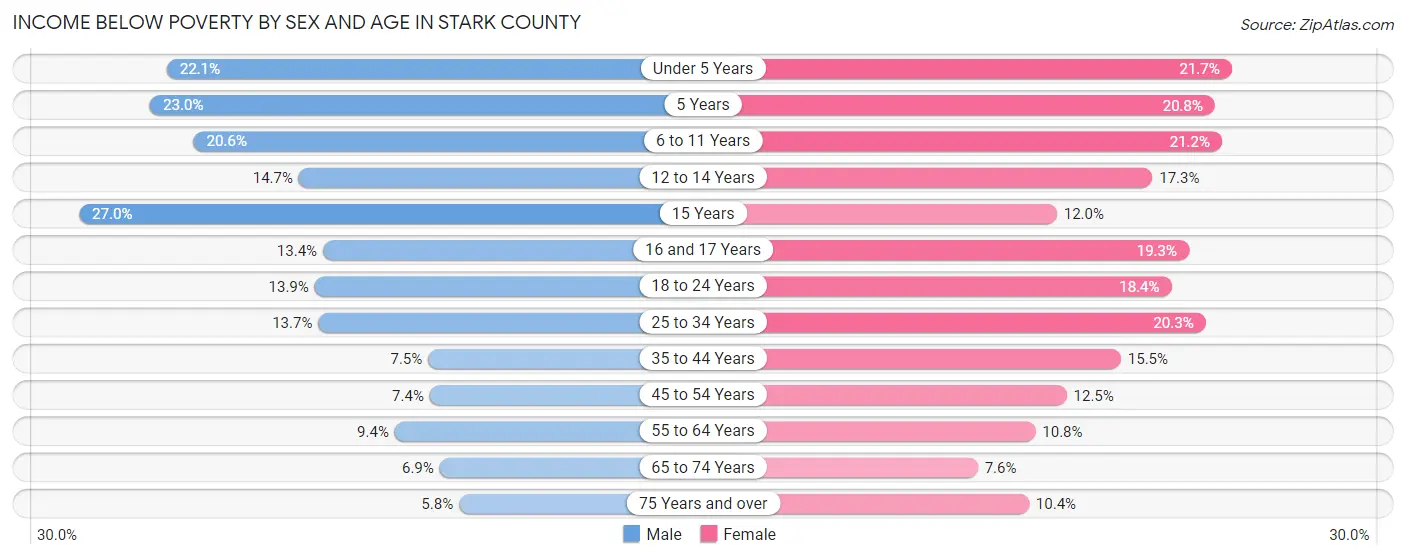
Income Below Poverty by Sex and Age in Stark County
With 11.6% poverty level for males and 14.7% for females among the residents of Stark County, 15 year old males and under 5 year old females are the most vulnerable to poverty, with 706 males (27.0%) and 2,101 females (21.7%) in their respective age groups living below the poverty level.
| Age Bracket | Male | Female |
| Under 5 Years | 2,278 (22.1%) | 2,101 (21.7%) |
| 5 Years | 471 (23.0%) | 404 (20.8%) |
| 6 to 11 Years | 2,743 (20.6%) | 2,775 (21.2%) |
| 12 to 14 Years | 1,057 (14.7%) | 1,085 (17.3%) |
| 15 Years | 706 (27.0%) | 336 (12.0%) |
| 16 and 17 Years | 636 (13.4%) | 823 (19.3%) |
| 18 to 24 Years | 2,081 (13.9%) | 2,610 (18.3%) |
| 25 to 34 Years | 3,034 (13.7%) | 4,526 (20.3%) |
| 35 to 44 Years | 1,617 (7.5%) | 3,417 (15.5%) |
| 45 to 54 Years | 1,701 (7.4%) | 2,885 (12.5%) |
| 55 to 64 Years | 2,403 (9.4%) | 2,900 (10.8%) |
| 65 to 74 Years | 1,379 (6.9%) | 1,704 (7.6%) |
| 75 Years and over | 696 (5.8%) | 1,765 (10.4%) |
| Total | 20,802 (11.6%) | 27,331 (14.7%) |
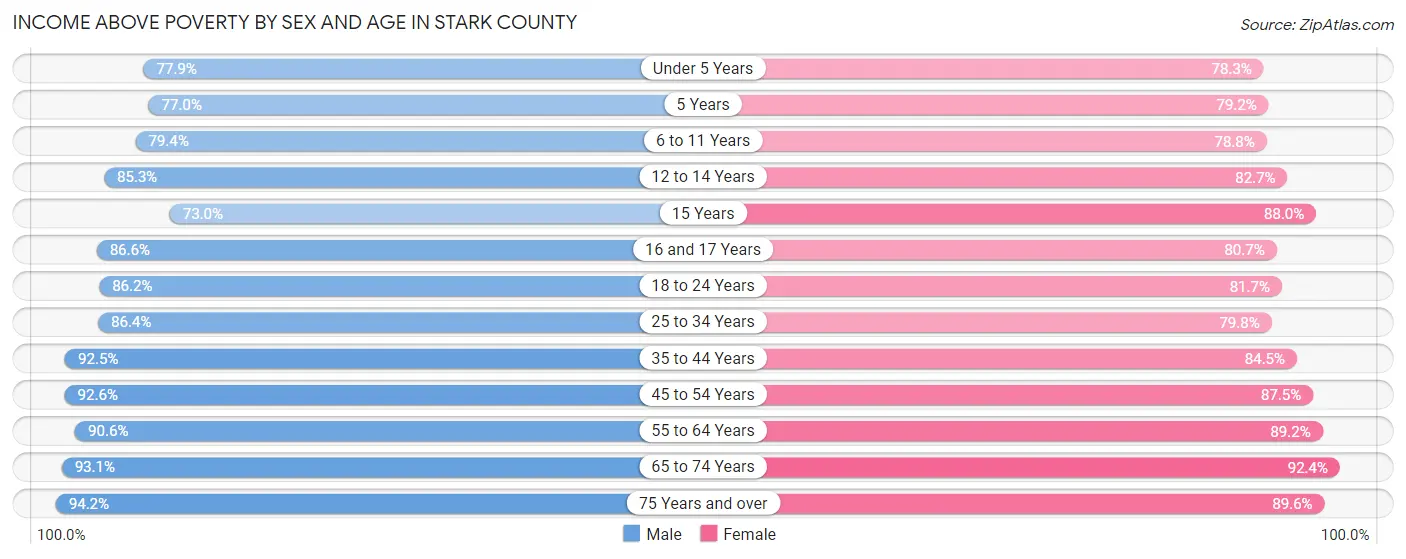
Income Above Poverty by Sex and Age in Stark County
According to the poverty statistics in Stark County, males aged 75 years and over and females aged 65 to 74 years are the age groups that are most secure financially, with 94.2% of males and 92.4% of females in these age groups living above the poverty line.
| Age Bracket | Male | Female |
| Under 5 Years | 8,037 (77.9%) | 7,581 (78.3%) |
| 5 Years | 1,576 (77.0%) | 1,541 (79.2%) |
| 6 to 11 Years | 10,582 (79.4%) | 10,341 (78.8%) |
| 12 to 14 Years | 6,121 (85.3%) | 5,191 (82.7%) |
| 15 Years | 1,913 (73.0%) | 2,471 (88.0%) |
| 16 and 17 Years | 4,113 (86.6%) | 3,437 (80.7%) |
| 18 to 24 Years | 12,945 (86.2%) | 11,617 (81.7%) |
| 25 to 34 Years | 19,195 (86.4%) | 17,825 (79.7%) |
| 35 to 44 Years | 19,865 (92.5%) | 18,574 (84.5%) |
| 45 to 54 Years | 21,168 (92.6%) | 20,156 (87.5%) |
| 55 to 64 Years | 23,194 (90.6%) | 24,007 (89.2%) |
| 65 to 74 Years | 18,645 (93.1%) | 20,792 (92.4%) |
| 75 Years and over | 11,274 (94.2%) | 15,168 (89.6%) |
| Total | 158,628 (88.4%) | 158,701 (85.3%) |
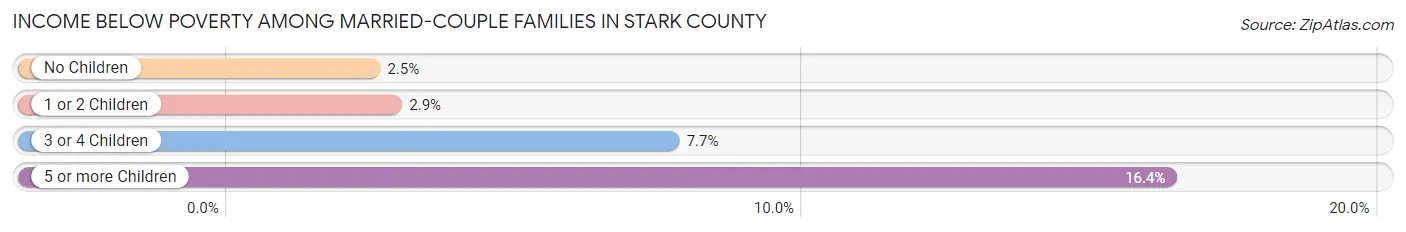
Income Below Poverty Among Married-Couple Families in Stark County
The poverty statistics for married-couple families in Stark County show that 3.1% or 2,157 of the total 69,709 families live below the poverty line. Families with 5 or more children have the highest poverty rate of 16.4%, comprising of 121 families. On the other hand, families with no children have the lowest poverty rate of 2.5%, which includes 1,136 families.
| Children | Above Poverty | Below Poverty |
| No Children | 44,690 (97.5%) | 1,136 (2.5%) |
| 1 or 2 Children | 17,694 (97.1%) | 521 (2.9%) |
| 3 or 4 Children | 4,549 (92.3%) | 379 (7.7%) |
| 5 or more Children | 619 (83.7%) | 121 (16.4%) |
| Total | 67,552 (96.9%) | 2,157 (3.1%) |
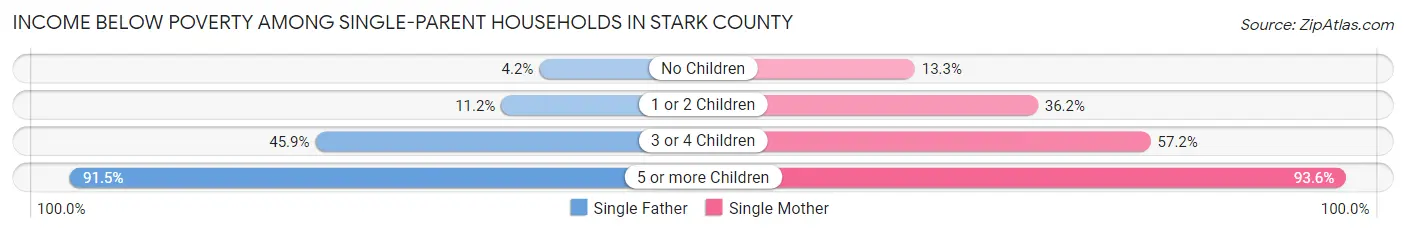
Income Below Poverty Among Single-Parent Households in Stark County
According to the poverty data in Stark County, 11.5% or 893 single-father households and 31.2% or 6,083 single-mother households are living below the poverty line. Among single-father households, those with 5 or more children have the highest poverty rate, with 54 households (91.5%) experiencing poverty. Likewise, among single-mother households, those with 5 or more children have the highest poverty rate, with 204 households (93.6%) falling below the poverty line.
| Children | Single Father | Single Mother |
| No Children | 127 (4.2%) | 902 (13.3%) |
| 1 or 2 Children | 457 (11.2%) | 3,694 (36.2%) |
| 3 or 4 Children | 255 (45.9%) | 1,283 (57.2%) |
| 5 or more Children | 54 (91.5%) | 204 (93.6%) |
| Total | 893 (11.5%) | 6,083 (31.2%) |
Income Below Poverty Among Married-Couple vs Single-Parent Households in Stark County
The poverty data for Stark County shows that 2,157 of the married-couple family households (3.1%) and 6,976 of the single-parent households (25.6%) are living below the poverty level. Within the married-couple family households, those with 5 or more children have the highest poverty rate, with 121 households (16.4%) falling below the poverty line. Among the single-parent households, those with 5 or more children have the highest poverty rate, with 258 household (93.1%) living below poverty.
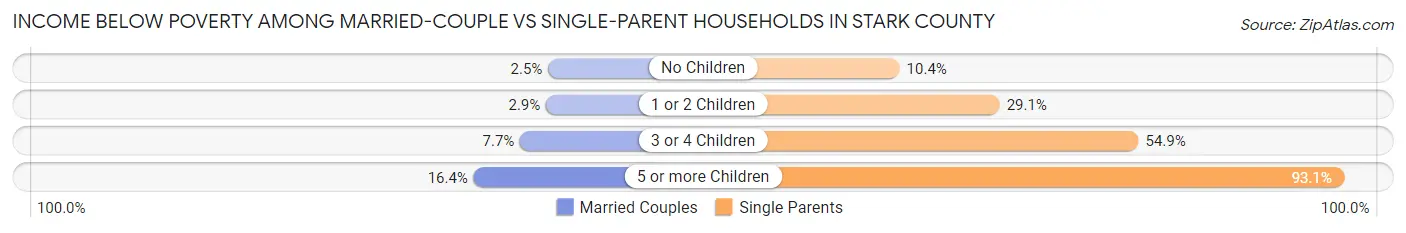
| Children | Married-Couple Families | Single-Parent Households |
| No Children | 1,136 (2.5%) | 1,029 (10.4%) |
| 1 or 2 Children | 521 (2.9%) | 4,151 (29.1%) |
| 3 or 4 Children | 379 (7.7%) | 1,538 (54.9%) |
| 5 or more Children | 121 (16.4%) | 258 (93.1%) |
| Total | 2,157 (3.1%) | 6,976 (25.6%) |
Employment Characteristics in Stark County
Employment by Class of Employer in Stark County
Among the 177,007 employed individuals in Stark County, private company employees (125,881 | 71.1%), not-for-profit organizations (18,013 | 10.2%), and local government employees (13,339 | 7.5%) make up the most common classes of employment.
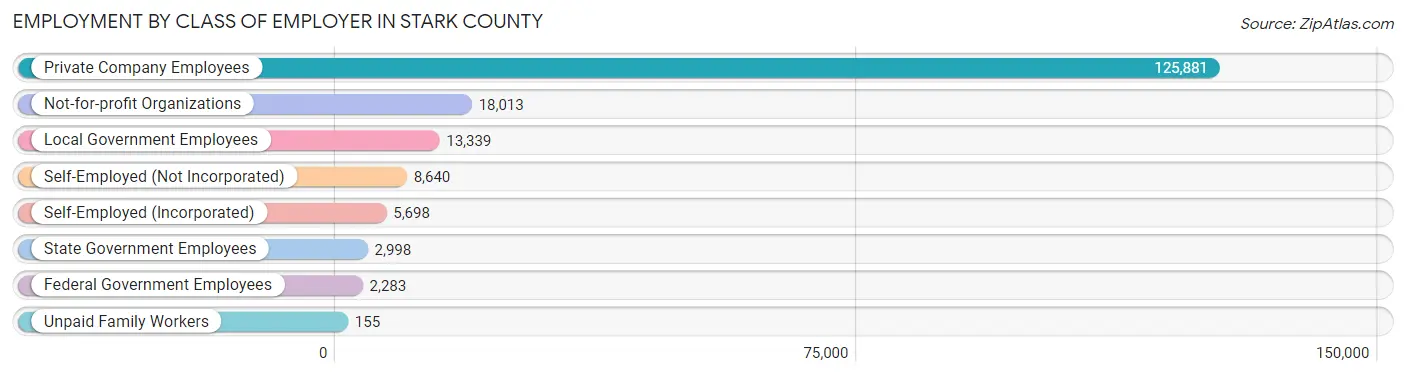
| Employer Class | # Employees | % Employees |
| Private Company Employees | 125,881 | 71.1% |
| Self-Employed (Incorporated) | 5,698 | 3.2% |
| Self-Employed (Not Incorporated) | 8,640 | 4.9% |
| Not-for-profit Organizations | 18,013 | 10.2% |
| Local Government Employees | 13,339 | 7.5% |
| State Government Employees | 2,998 | 1.7% |
| Federal Government Employees | 2,283 | 1.3% |
| Unpaid Family Workers | 155 | 0.1% |
| Total | 177,007 | 100.0% |
Employment Status by Age in Stark County
According to the labor force statistics for Stark County, out of the total population over 16 years of age (303,175), 62.0% or 187,968 individuals are in the labor force, with 4.3% or 8,083 of them unemployed. The age group with the highest labor force participation rate is 35 to 44 years, with 84.7% or 37,014 individuals in the labor force. Within the labor force, the 16 to 19 years age range has the highest percentage of unemployed individuals, with 12.5% or 1,046 of them being unemployed.
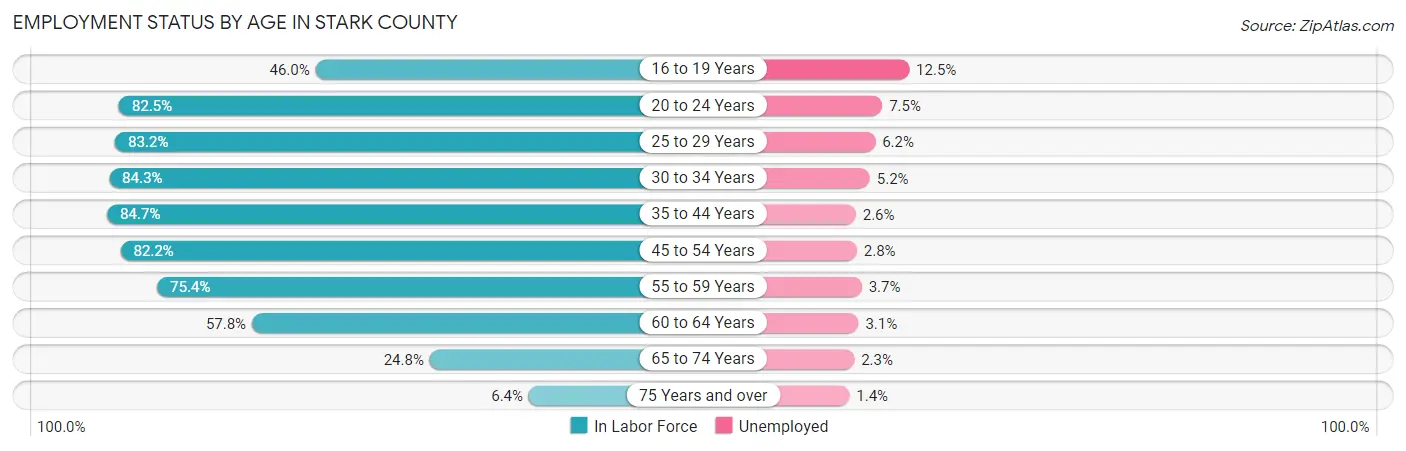
| Age Bracket | In Labor Force | Unemployed |
| 16 to 19 Years | 8,370 (46.0%) | 1,046 (12.5%) |
| 20 to 24 Years | 18,936 (82.5%) | 1,420 (7.5%) |
| 25 to 29 Years | 19,055 (83.2%) | 1,181 (6.2%) |
| 30 to 34 Years | 18,536 (84.3%) | 964 (5.2%) |
| 35 to 44 Years | 37,014 (84.7%) | 962 (2.6%) |
| 45 to 54 Years | 37,873 (82.2%) | 1,060 (2.8%) |
| 55 to 59 Years | 20,619 (75.4%) | 763 (3.7%) |
| 60 to 64 Years | 14,849 (57.8%) | 460 (3.1%) |
| 65 to 74 Years | 10,716 (24.8%) | 246 (2.3%) |
| 75 Years and over | 1,991 (6.4%) | 28 (1.4%) |
| Total | 187,968 (62.0%) | 8,083 (4.3%) |
Employment Status by Educational Attainment in Stark County
According to labor force statistics for Stark County, 78.8% of individuals (147,908) out of the total population between 25 and 64 years of age (187,701) are in the labor force, with 3.6% or 5,325 of them being unemployed. The group with the highest labor force participation rate are those with the educational attainment of bachelor's degree or higher, with 87.5% or 41,694 individuals in the labor force. Within the labor force, individuals with less than high school education have the highest percentage of unemployment, with 11.5% or 736 of them being unemployed.
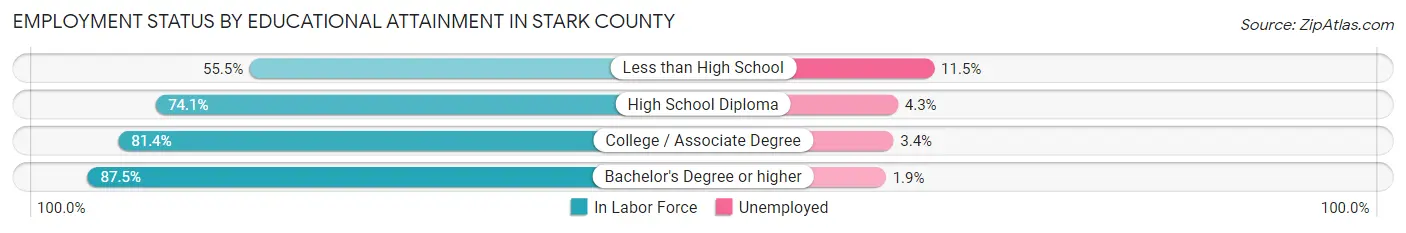
| Educational Attainment | In Labor Force | Unemployed |
| Less than High School | 6,396 (55.5%) | 1,325 (11.5%) |
| High School Diploma | 48,922 (74.1%) | 2,839 (4.3%) |
| College / Associate Degree | 50,880 (81.4%) | 2,125 (3.4%) |
| Bachelor's Degree or higher | 41,694 (87.5%) | 905 (1.9%) |
| Total | 147,908 (78.8%) | 6,757 (3.6%) |
Employment Occupations by Sex in Stark County
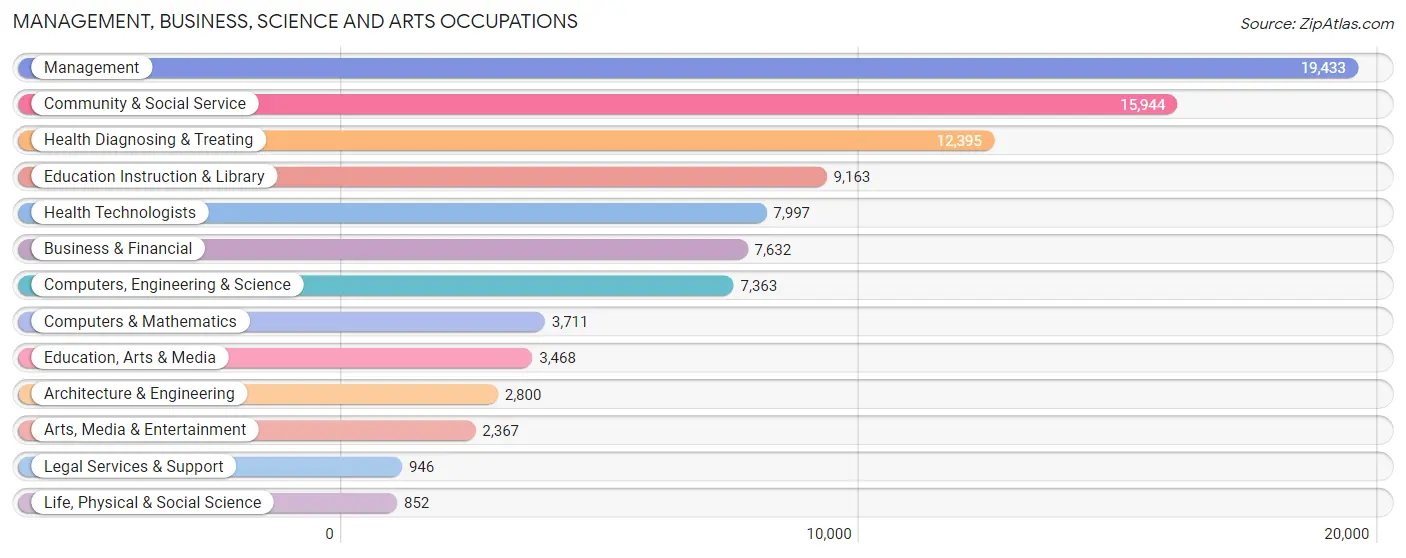
Management, Business, Science and Arts Occupations
The most common Management, Business, Science and Arts occupations in Stark County are Management (19,433 | 10.8%), Community & Social Service (15,944 | 8.9%), Health Diagnosing & Treating (12,395 | 6.9%), Education Instruction & Library (9,163 | 5.1%), and Health Technologists (7,997 | 4.4%).
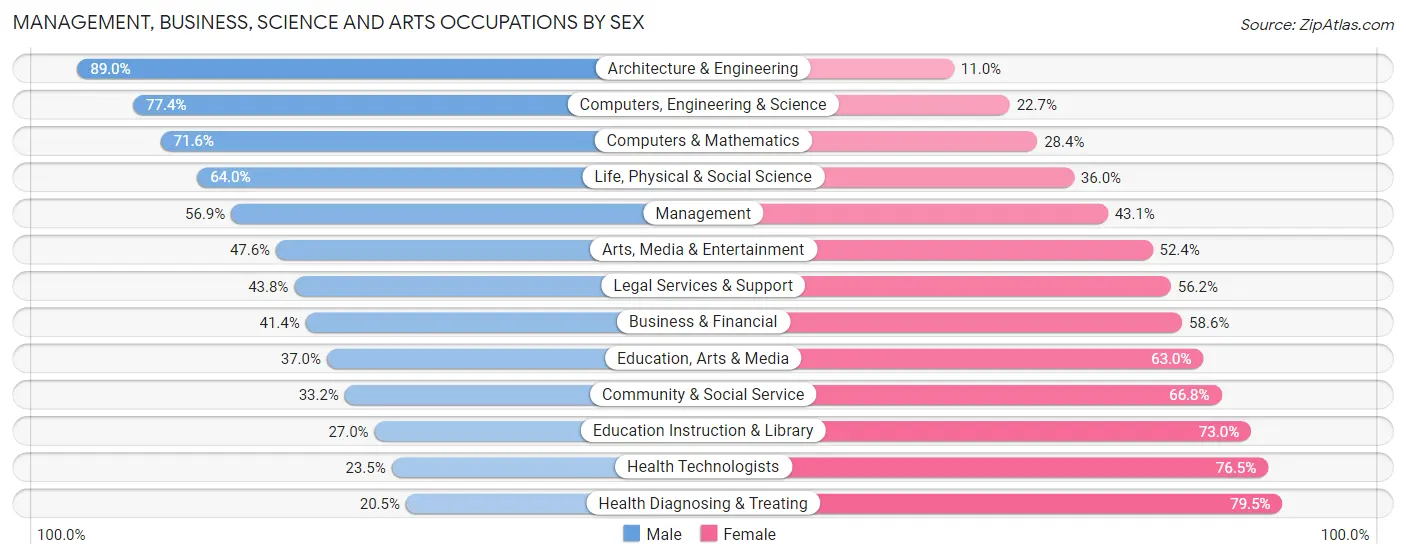
Management, Business, Science and Arts Occupations by Sex
Within the Management, Business, Science and Arts occupations in Stark County, the most male-oriented occupations are Architecture & Engineering (89.0%), Computers, Engineering & Science (77.3%), and Computers & Mathematics (71.6%), while the most female-oriented occupations are Health Diagnosing & Treating (79.5%), Health Technologists (76.5%), and Education Instruction & Library (73.0%).
| Occupation | Male | Female |
| Management | 11,061 (56.9%) | 8,372 (43.1%) |
| Business & Financial | 3,159 (41.4%) | 4,473 (58.6%) |
| Computers, Engineering & Science | 5,695 (77.3%) | 1,668 (22.7%) |
| Computers & Mathematics | 2,658 (71.6%) | 1,053 (28.4%) |
| Architecture & Engineering | 2,492 (89.0%) | 308 (11.0%) |
| Life, Physical & Social Science | 545 (64.0%) | 307 (36.0%) |
| Community & Social Service | 5,298 (33.2%) | 10,646 (66.8%) |
| Education, Arts & Media | 1,282 (37.0%) | 2,186 (63.0%) |
| Legal Services & Support | 414 (43.8%) | 532 (56.2%) |
| Education Instruction & Library | 2,476 (27.0%) | 6,687 (73.0%) |
| Arts, Media & Entertainment | 1,126 (47.6%) | 1,241 (52.4%) |
| Health Diagnosing & Treating | 2,539 (20.5%) | 9,856 (79.5%) |
| Health Technologists | 1,876 (23.5%) | 6,121 (76.5%) |
| Total (Category) | 27,752 (44.2%) | 35,015 (55.8%) |
| Total (Overall) | 93,678 (52.1%) | 85,961 (47.8%) |
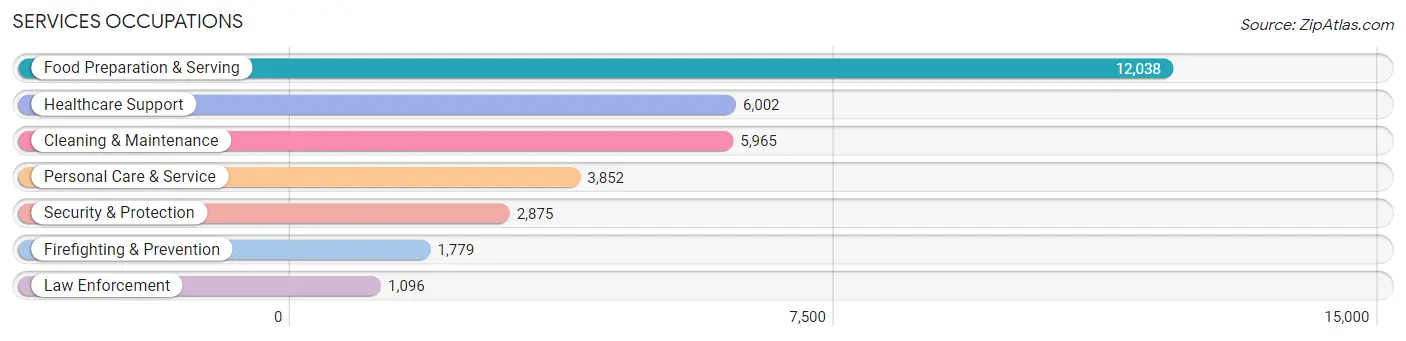
Services Occupations
The most common Services occupations in Stark County are Food Preparation & Serving (12,038 | 6.7%), Healthcare Support (6,002 | 3.3%), Cleaning & Maintenance (5,965 | 3.3%), Personal Care & Service (3,852 | 2.1%), and Security & Protection (2,875 | 1.6%).
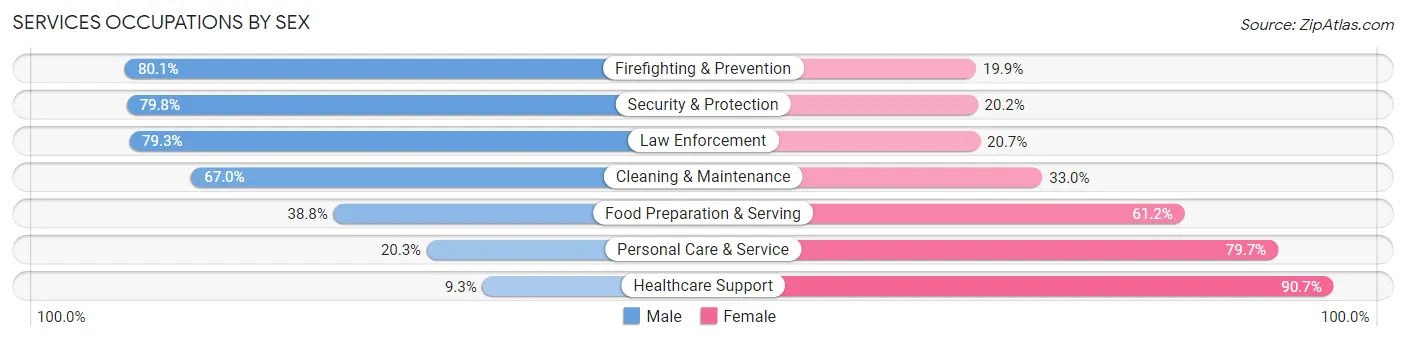
Services Occupations by Sex
Within the Services occupations in Stark County, the most male-oriented occupations are Firefighting & Prevention (80.1%), Security & Protection (79.8%), and Law Enforcement (79.3%), while the most female-oriented occupations are Healthcare Support (90.7%), Personal Care & Service (79.7%), and Food Preparation & Serving (61.2%).
| Occupation | Male | Female |
| Healthcare Support | 559 (9.3%) | 5,443 (90.7%) |
| Security & Protection | 2,294 (79.8%) | 581 (20.2%) |
| Firefighting & Prevention | 1,425 (80.1%) | 354 (19.9%) |
| Law Enforcement | 869 (79.3%) | 227 (20.7%) |
| Food Preparation & Serving | 4,672 (38.8%) | 7,366 (61.2%) |
| Cleaning & Maintenance | 3,995 (67.0%) | 1,970 (33.0%) |
| Personal Care & Service | 783 (20.3%) | 3,069 (79.7%) |
| Total (Category) | 12,303 (40.0%) | 18,429 (60.0%) |
| Total (Overall) | 93,678 (52.1%) | 85,961 (47.8%) |
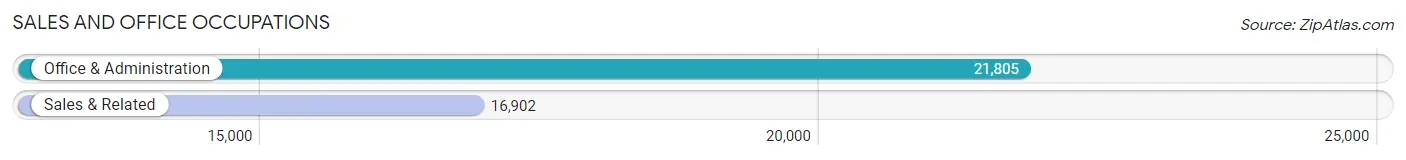
Sales and Office Occupations
The most common Sales and Office occupations in Stark County are Office & Administration (21,805 | 12.1%), and Sales & Related (16,902 | 9.4%).
Sales and Office Occupations by Sex
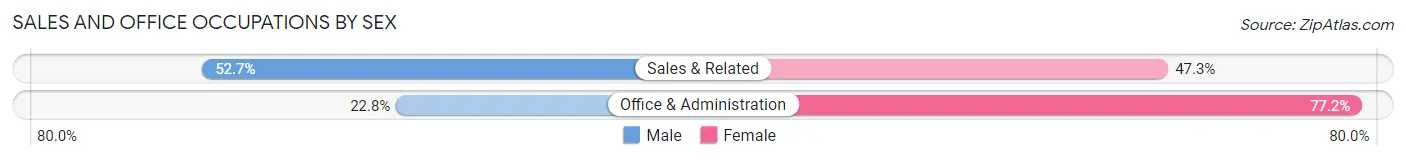
| Occupation | Male | Female |
| Sales & Related | 8,903 (52.7%) | 7,999 (47.3%) |
| Office & Administration | 4,978 (22.8%) | 16,827 (77.2%) |
| Total (Category) | 13,881 (35.9%) | 24,826 (64.1%) |
| Total (Overall) | 93,678 (52.1%) | 85,961 (47.8%) |
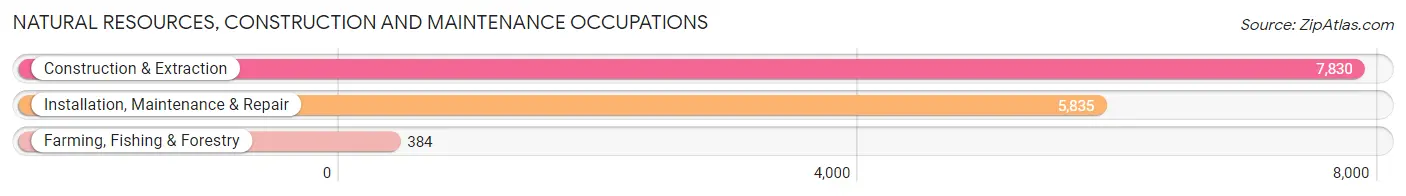
Natural Resources, Construction and Maintenance Occupations
The most common Natural Resources, Construction and Maintenance occupations in Stark County are Construction & Extraction (7,830 | 4.4%), Installation, Maintenance & Repair (5,835 | 3.3%), and Farming, Fishing & Forestry (384 | 0.2%).
Natural Resources, Construction and Maintenance Occupations by Sex
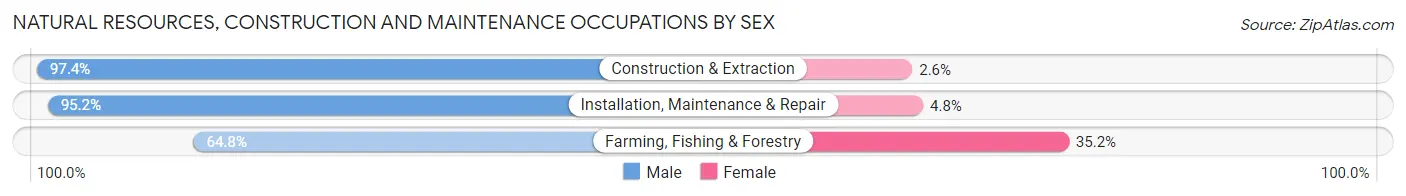
| Occupation | Male | Female |
| Farming, Fishing & Forestry | 249 (64.8%) | 135 (35.2%) |
| Construction & Extraction | 7,629 (97.4%) | 201 (2.6%) |
| Installation, Maintenance & Repair | 5,554 (95.2%) | 281 (4.8%) |
| Total (Category) | 13,432 (95.6%) | 617 (4.4%) |
| Total (Overall) | 93,678 (52.1%) | 85,961 (47.8%) |
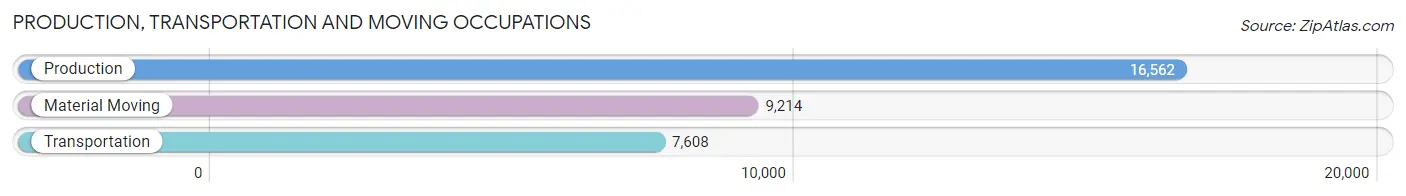
Production, Transportation and Moving Occupations
The most common Production, Transportation and Moving occupations in Stark County are Production (16,562 | 9.2%), Material Moving (9,214 | 5.1%), and Transportation (7,608 | 4.2%).
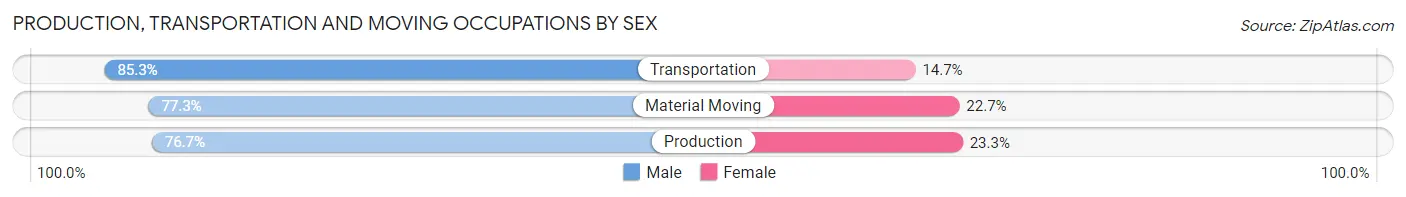
Production, Transportation and Moving Occupations by Sex
| Occupation | Male | Female |
| Production | 12,697 (76.7%) | 3,865 (23.3%) |
| Transportation | 6,493 (85.3%) | 1,115 (14.7%) |
| Material Moving | 7,120 (77.3%) | 2,094 (22.7%) |
| Total (Category) | 26,310 (78.8%) | 7,074 (21.2%) |
| Total (Overall) | 93,678 (52.1%) | 85,961 (47.8%) |
Employment Industries by Sex in Stark County
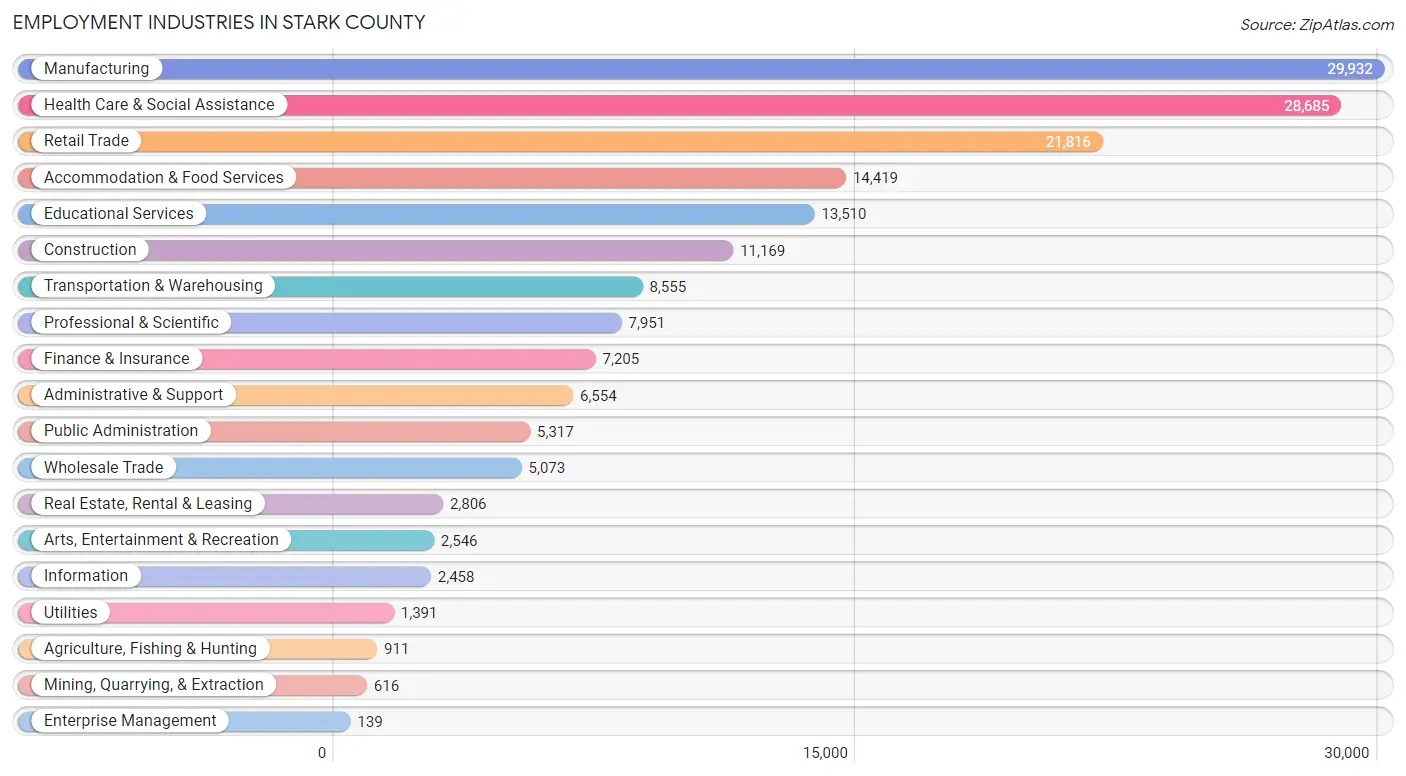
Employment Industries in Stark County
The major employment industries in Stark County include Manufacturing (29,932 | 16.7%), Health Care & Social Assistance (28,685 | 16.0%), Retail Trade (21,816 | 12.1%), Accommodation & Food Services (14,419 | 8.0%), and Educational Services (13,510 | 7.5%).
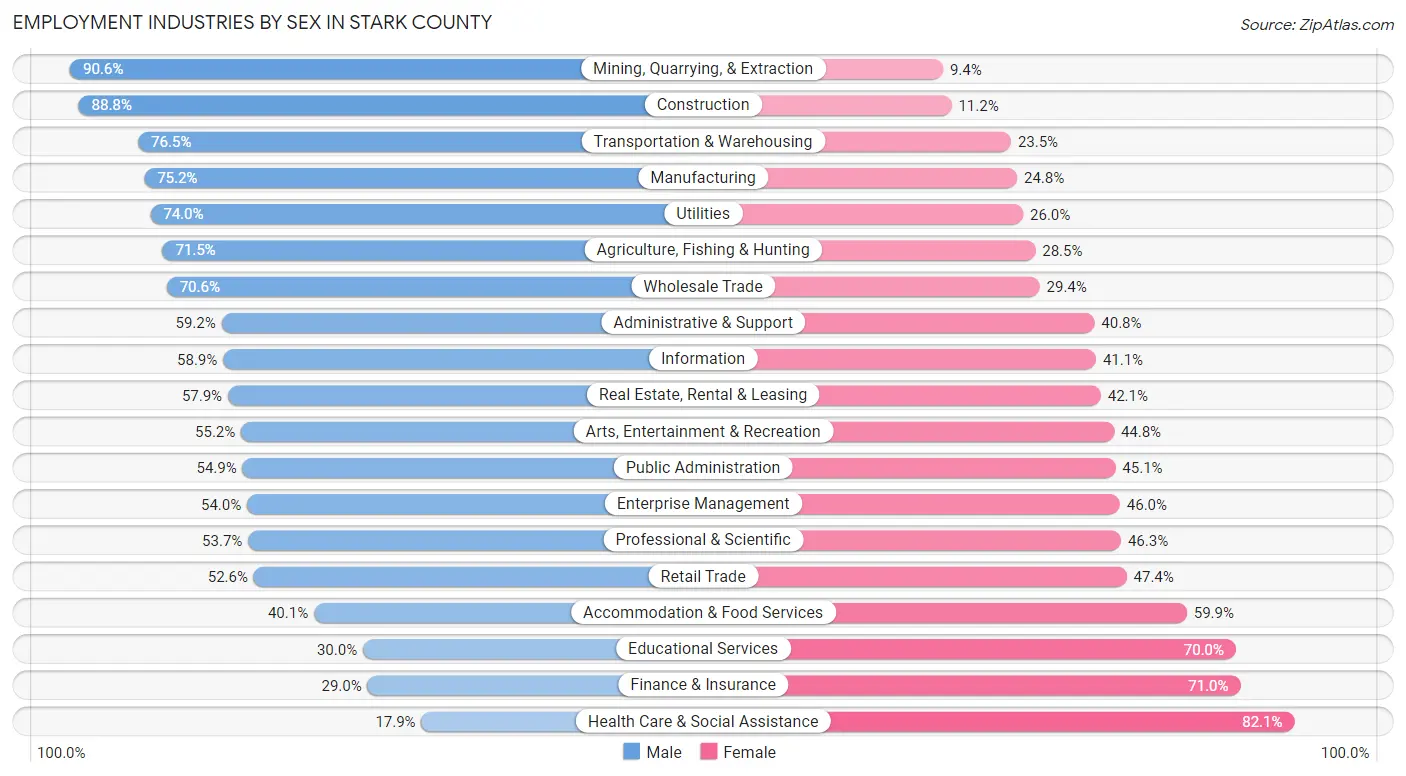
Employment Industries by Sex in Stark County
The Stark County industries that see more men than women are Mining, Quarrying, & Extraction (90.6%), Construction (88.8%), and Transportation & Warehousing (76.5%), whereas the industries that tend to have a higher number of women are Health Care & Social Assistance (82.1%), Finance & Insurance (71.0%), and Educational Services (70.0%).
| Industry | Male | Female |
| Agriculture, Fishing & Hunting | 651 (71.5%) | 260 (28.5%) |
| Mining, Quarrying, & Extraction | 558 (90.6%) | 58 (9.4%) |
| Construction | 9,919 (88.8%) | 1,250 (11.2%) |
| Manufacturing | 22,521 (75.2%) | 7,411 (24.8%) |
| Wholesale Trade | 3,580 (70.6%) | 1,493 (29.4%) |
| Retail Trade | 11,466 (52.6%) | 10,350 (47.4%) |
| Transportation & Warehousing | 6,545 (76.5%) | 2,010 (23.5%) |
| Utilities | 1,029 (74.0%) | 362 (26.0%) |
| Information | 1,448 (58.9%) | 1,010 (41.1%) |
| Finance & Insurance | 2,091 (29.0%) | 5,114 (71.0%) |
| Real Estate, Rental & Leasing | 1,625 (57.9%) | 1,181 (42.1%) |
| Professional & Scientific | 4,272 (53.7%) | 3,679 (46.3%) |
| Enterprise Management | 75 (54.0%) | 64 (46.0%) |
| Administrative & Support | 3,882 (59.2%) | 2,672 (40.8%) |
| Educational Services | 4,047 (30.0%) | 9,463 (70.0%) |
| Health Care & Social Assistance | 5,123 (17.9%) | 23,562 (82.1%) |
| Arts, Entertainment & Recreation | 1,405 (55.2%) | 1,141 (44.8%) |
| Accommodation & Food Services | 5,782 (40.1%) | 8,637 (59.9%) |
| Public Administration | 2,918 (54.9%) | 2,399 (45.1%) |
| Total | 93,678 (52.1%) | 85,961 (47.8%) |
Education in Stark County
School Enrollment in Stark County
The most common levels of schooling among the 82,986 students in Stark County are high school (19,184 | 23.1%), middle school (18,772 | 22.6%), and elementary school (17,054 | 20.5%).
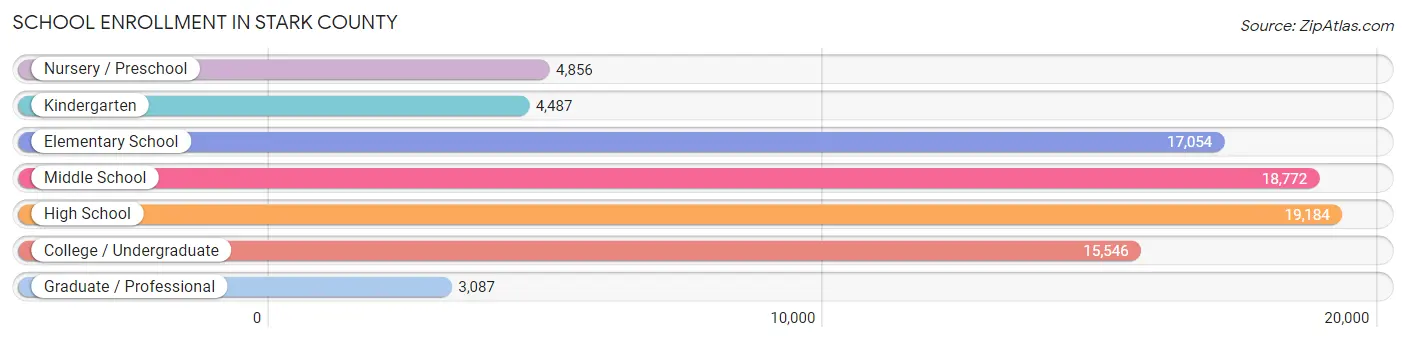
| School Level | # Students | % Students |
| Nursery / Preschool | 4,856 | 5.9% |
| Kindergarten | 4,487 | 5.4% |
| Elementary School | 17,054 | 20.5% |
| Middle School | 18,772 | 22.6% |
| High School | 19,184 | 23.1% |
| College / Undergraduate | 15,546 | 18.7% |
| Graduate / Professional | 3,087 | 3.7% |
| Total | 82,986 | 100.0% |
School Enrollment by Age by Funding Source in Stark County
Out of a total of 82,986 students who are enrolled in schools in Stark County, 14,025 (16.9%) attend a private institution, while the remaining 68,961 (83.1%) are enrolled in public schools. The age group of 18 to 19 year olds has the highest likelihood of being enrolled in private schools, with 2,304 (35.5% in the age bracket) enrolled. Conversely, the age group of 15 to 17 year olds has the lowest likelihood of being enrolled in a private school, with 13,235 (94.2% in the age bracket) attending a public institution.
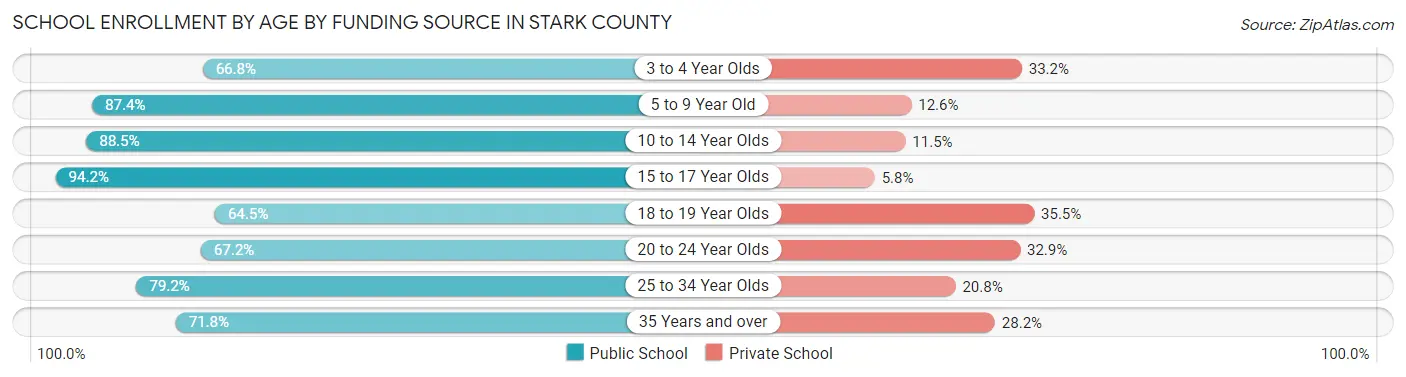
| Age Bracket | Public School | Private School |
| 3 to 4 Year Olds | 2,437 (66.8%) | 1,210 (33.2%) |
| 5 to 9 Year Old | 17,932 (87.4%) | 2,583 (12.6%) |
| 10 to 14 Year Olds | 20,020 (88.5%) | 2,601 (11.5%) |
| 15 to 17 Year Olds | 13,235 (94.2%) | 813 (5.8%) |
| 18 to 19 Year Olds | 4,192 (64.5%) | 2,304 (35.5%) |
| 20 to 24 Year Olds | 5,484 (67.1%) | 2,683 (32.9%) |
| 25 to 34 Year Olds | 2,992 (79.2%) | 787 (20.8%) |
| 35 Years and over | 2,667 (71.8%) | 1,046 (28.2%) |
| Total | 68,961 (83.1%) | 14,025 (16.9%) |
Educational Attainment by Field of Study in Stark County
Business (15,055 | 22.4%), education (12,797 | 19.0%), science & technology (8,837 | 13.1%), engineering (4,167 | 6.2%), and arts & humanities (4,162 | 6.2%) are the most common fields of study among 67,343 individuals in Stark County who have obtained a bachelor's degree or higher.
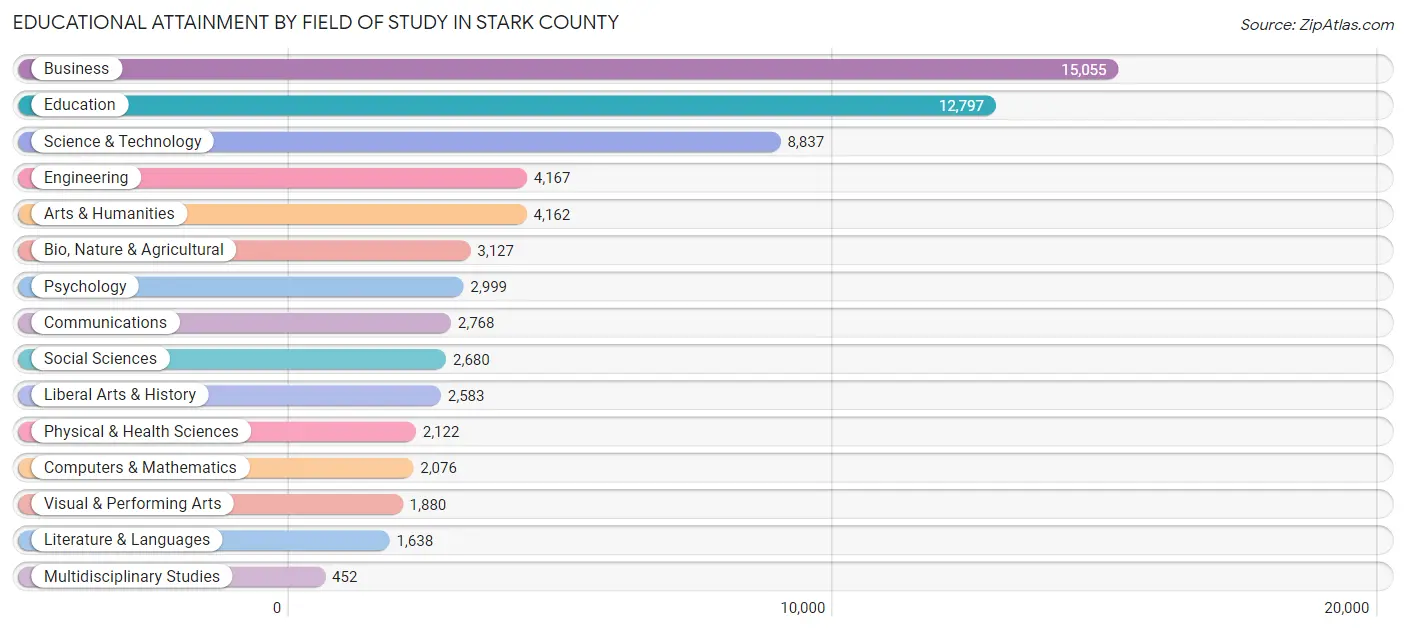
| Field of Study | # Graduates | % Graduates |
| Computers & Mathematics | 2,076 | 3.1% |
| Bio, Nature & Agricultural | 3,127 | 4.6% |
| Physical & Health Sciences | 2,122 | 3.2% |
| Psychology | 2,999 | 4.4% |
| Social Sciences | 2,680 | 4.0% |
| Engineering | 4,167 | 6.2% |
| Multidisciplinary Studies | 452 | 0.7% |
| Science & Technology | 8,837 | 13.1% |
| Business | 15,055 | 22.4% |
| Education | 12,797 | 19.0% |
| Literature & Languages | 1,638 | 2.4% |
| Liberal Arts & History | 2,583 | 3.8% |
| Visual & Performing Arts | 1,880 | 2.8% |
| Communications | 2,768 | 4.1% |
| Arts & Humanities | 4,162 | 6.2% |
| Total | 67,343 | 100.0% |
Transportation & Commute in Stark County
Vehicle Availability by Sex in Stark County
The most prevalent vehicle ownership categories in Stark County are males with 2 vehicles (40,051, accounting for 43.5%) and females with 2 vehicles (34,049, making up 47.8%).
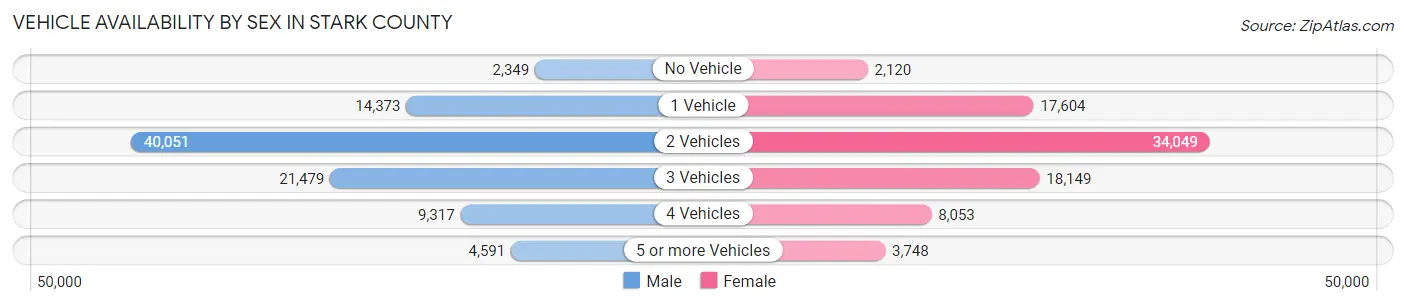
| Vehicles Available | Male | Female |
| No Vehicle | 2,349 (2.5%) | 2,120 (2.5%) |
| 1 Vehicle | 14,373 (15.6%) | 17,604 (21.0%) |
| 2 Vehicles | 40,051 (43.5%) | 34,049 (40.7%) |
| 3 Vehicles | 21,479 (23.3%) | 18,149 (21.7%) |
| 4 Vehicles | 9,317 (10.1%) | 8,053 (9.6%) |
| 5 or more Vehicles | 4,591 (5.0%) | 3,748 (4.5%) |
| Total | 92,160 (100.0%) | 83,723 (100.0%) |
Commute Time in Stark County
The most frequently occuring commute durations in Stark County are 15 to 19 minutes (28,038 commuters, 17.4%), 10 to 14 minutes (27,279 commuters, 17.0%), and 20 to 24 minutes (24,827 commuters, 15.4%).
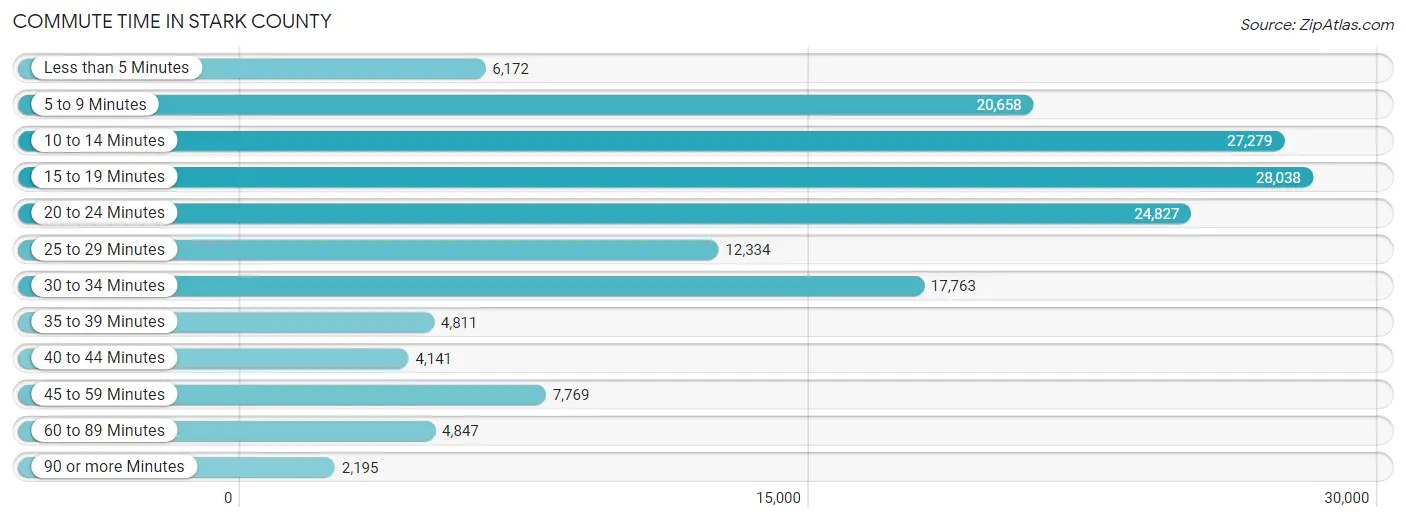
| Commute Time | # Commuters | % Commuters |
| Less than 5 Minutes | 6,172 | 3.8% |
| 5 to 9 Minutes | 20,658 | 12.8% |
| 10 to 14 Minutes | 27,279 | 17.0% |
| 15 to 19 Minutes | 28,038 | 17.4% |
| 20 to 24 Minutes | 24,827 | 15.4% |
| 25 to 29 Minutes | 12,334 | 7.7% |
| 30 to 34 Minutes | 17,763 | 11.0% |
| 35 to 39 Minutes | 4,811 | 3.0% |
| 40 to 44 Minutes | 4,141 | 2.6% |
| 45 to 59 Minutes | 7,769 | 4.8% |
| 60 to 89 Minutes | 4,847 | 3.0% |
| 90 or more Minutes | 2,195 | 1.4% |
Commute Time by Sex in Stark County
The most common commute times in Stark County are 20 to 24 minutes (14,103 commuters, 16.5%) for males and 15 to 19 minutes (14,656 commuters, 19.4%) for females.
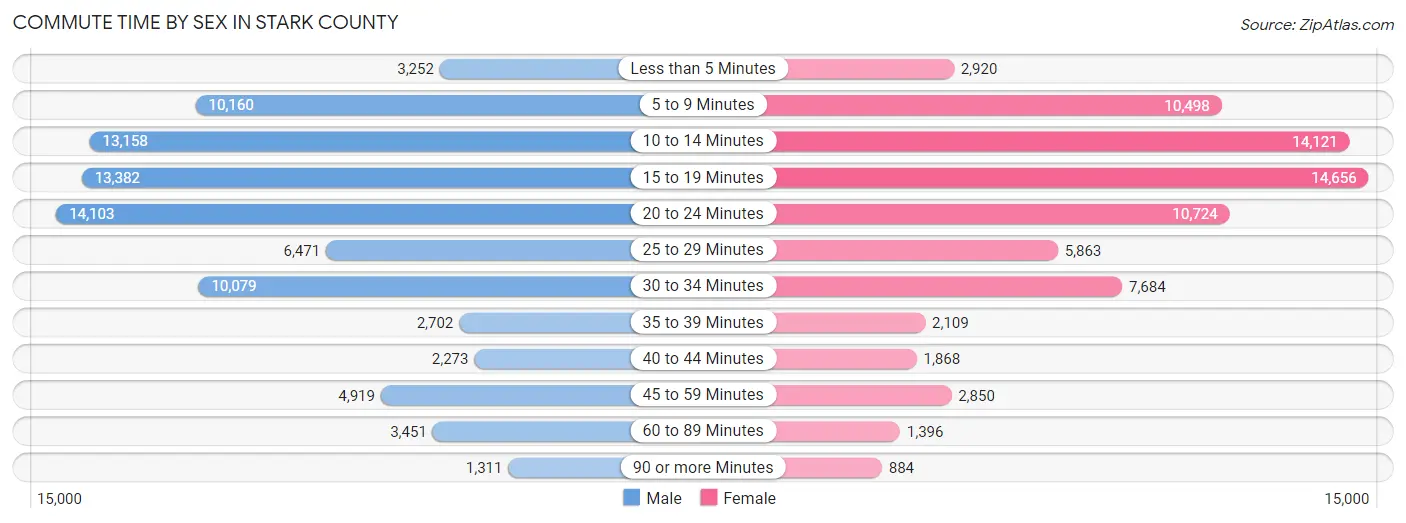
| Commute Time | Male | Female |
| Less than 5 Minutes | 3,252 (3.8%) | 2,920 (3.9%) |
| 5 to 9 Minutes | 10,160 (11.9%) | 10,498 (13.9%) |
| 10 to 14 Minutes | 13,158 (15.4%) | 14,121 (18.7%) |
| 15 to 19 Minutes | 13,382 (15.7%) | 14,656 (19.4%) |
| 20 to 24 Minutes | 14,103 (16.5%) | 10,724 (14.2%) |
| 25 to 29 Minutes | 6,471 (7.6%) | 5,863 (7.8%) |
| 30 to 34 Minutes | 10,079 (11.8%) | 7,684 (10.2%) |
| 35 to 39 Minutes | 2,702 (3.2%) | 2,109 (2.8%) |
| 40 to 44 Minutes | 2,273 (2.7%) | 1,868 (2.5%) |
| 45 to 59 Minutes | 4,919 (5.8%) | 2,850 (3.8%) |
| 60 to 89 Minutes | 3,451 (4.1%) | 1,396 (1.8%) |
| 90 or more Minutes | 1,311 (1.5%) | 884 (1.2%) |
Time of Departure to Work by Sex in Stark County
The most frequent times of departure to work in Stark County are 7:00 AM to 7:29 AM (12,108, 14.2%) for males and 7:30 AM to 7:59 AM (11,447, 15.1%) for females.
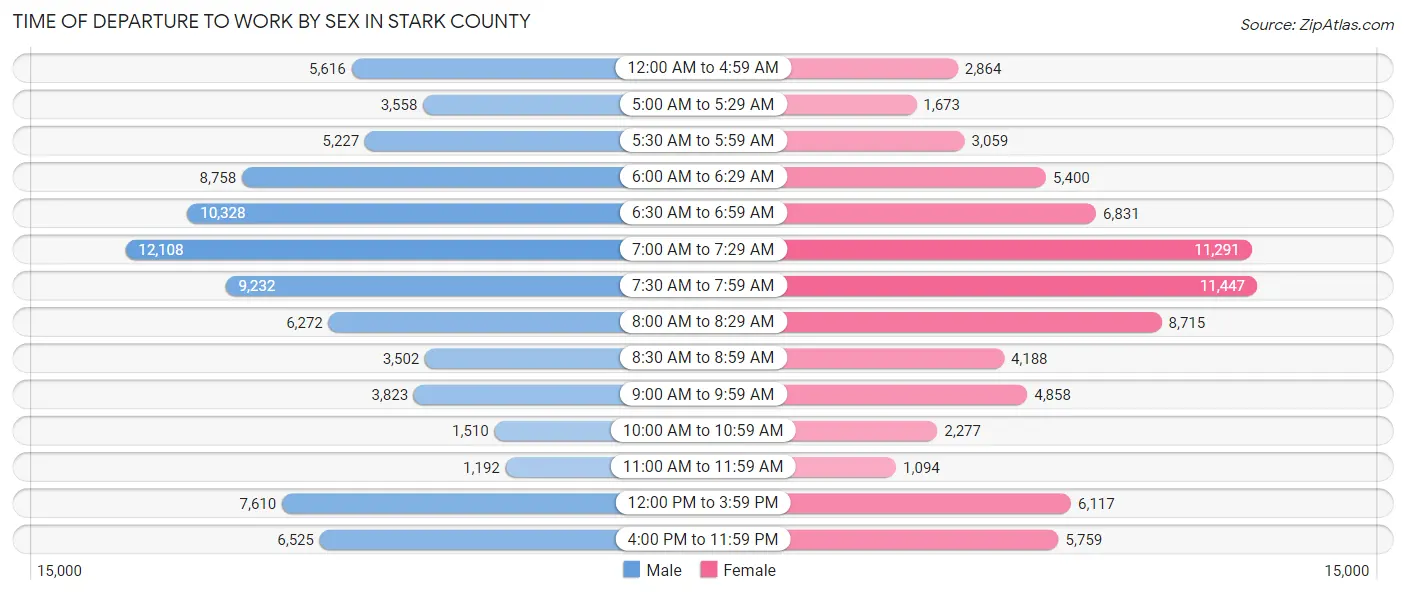
| Time of Departure | Male | Female |
| 12:00 AM to 4:59 AM | 5,616 (6.6%) | 2,864 (3.8%) |
| 5:00 AM to 5:29 AM | 3,558 (4.2%) | 1,673 (2.2%) |
| 5:30 AM to 5:59 AM | 5,227 (6.1%) | 3,059 (4.1%) |
| 6:00 AM to 6:29 AM | 8,758 (10.3%) | 5,400 (7.1%) |
| 6:30 AM to 6:59 AM | 10,328 (12.1%) | 6,831 (9.0%) |
| 7:00 AM to 7:29 AM | 12,108 (14.2%) | 11,291 (14.9%) |
| 7:30 AM to 7:59 AM | 9,232 (10.8%) | 11,447 (15.1%) |
| 8:00 AM to 8:29 AM | 6,272 (7.4%) | 8,715 (11.5%) |
| 8:30 AM to 8:59 AM | 3,502 (4.1%) | 4,188 (5.5%) |
| 9:00 AM to 9:59 AM | 3,823 (4.5%) | 4,858 (6.4%) |
| 10:00 AM to 10:59 AM | 1,510 (1.8%) | 2,277 (3.0%) |
| 11:00 AM to 11:59 AM | 1,192 (1.4%) | 1,094 (1.5%) |
| 12:00 PM to 3:59 PM | 7,610 (8.9%) | 6,117 (8.1%) |
| 4:00 PM to 11:59 PM | 6,525 (7.6%) | 5,759 (7.6%) |
| Total | 85,261 (100.0%) | 75,573 (100.0%) |
Housing Occupancy in Stark County
Occupancy by Ownership in Stark County
Of the total 154,690 dwellings in Stark County, owner-occupied units account for 105,443 (68.2%), while renter-occupied units make up 49,247 (31.8%).
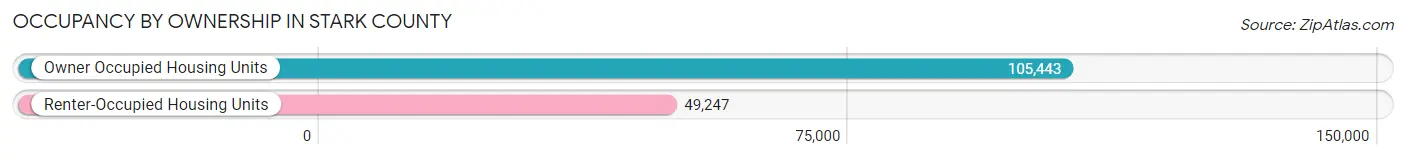
| Occupancy | # Housing Units | % Housing Units |
| Owner Occupied Housing Units | 105,443 | 68.2% |
| Renter-Occupied Housing Units | 49,247 | 31.8% |
| Total Occupied Housing Units | 154,690 | 100.0% |
Occupancy by Household Size in Stark County
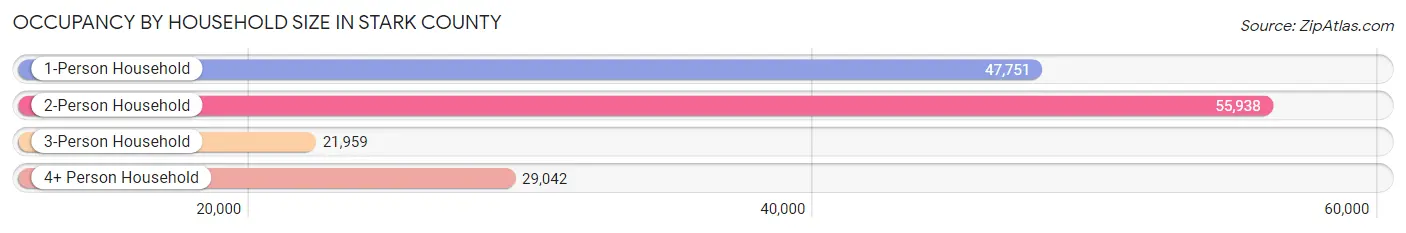
| Household Size | # Housing Units | % Housing Units |
| 1-Person Household | 47,751 | 30.9% |
| 2-Person Household | 55,938 | 36.2% |
| 3-Person Household | 21,959 | 14.2% |
| 4+ Person Household | 29,042 | 18.8% |
| Total Housing Units | 154,690 | 100.0% |
Occupancy by Ownership by Household Size in Stark County
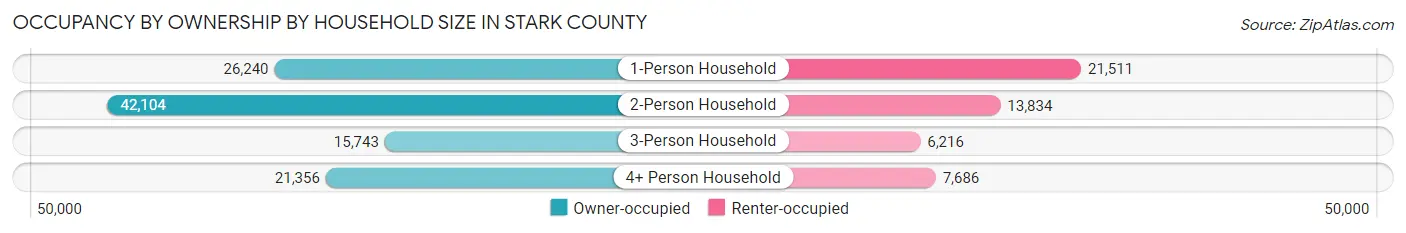
| Household Size | Owner-occupied | Renter-occupied |
| 1-Person Household | 26,240 (54.9%) | 21,511 (45.1%) |
| 2-Person Household | 42,104 (75.3%) | 13,834 (24.7%) |
| 3-Person Household | 15,743 (71.7%) | 6,216 (28.3%) |
| 4+ Person Household | 21,356 (73.5%) | 7,686 (26.5%) |
| Total Housing Units | 105,443 (68.2%) | 49,247 (31.8%) |
Occupancy by Educational Attainment in Stark County
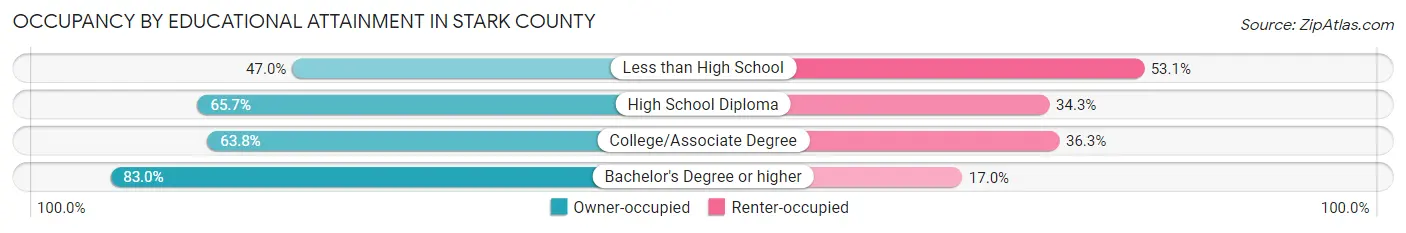
| Household Size | Owner-occupied | Renter-occupied |
| Less than High School | 4,888 (46.9%) | 5,524 (53.0%) |
| High School Diploma | 35,778 (65.7%) | 18,680 (34.3%) |
| College/Associate Degree | 32,367 (63.7%) | 18,404 (36.2%) |
| Bachelor's Degree or higher | 32,410 (83.0%) | 6,639 (17.0%) |
Occupancy by Age of Householder in Stark County
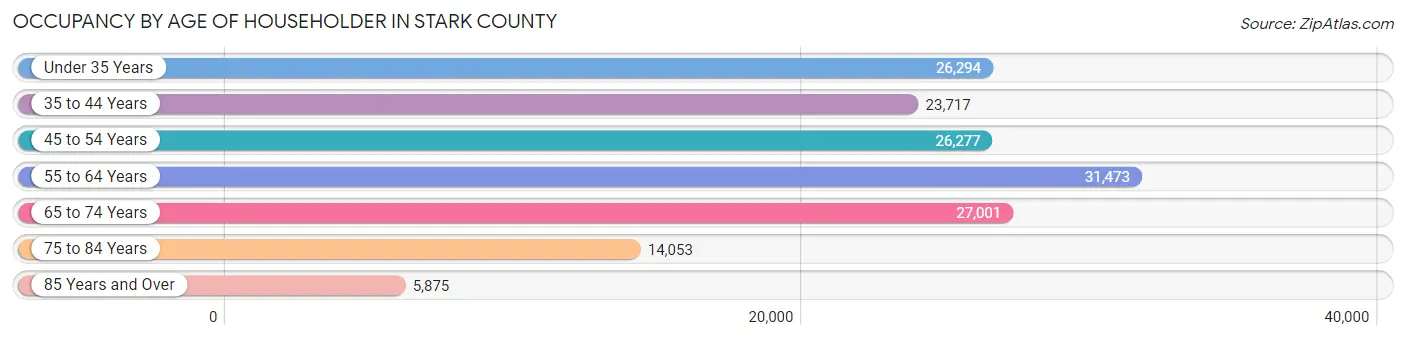
| Age Bracket | # Households | % Households |
| Under 35 Years | 26,294 | 17.0% |
| 35 to 44 Years | 23,717 | 15.3% |
| 45 to 54 Years | 26,277 | 17.0% |
| 55 to 64 Years | 31,473 | 20.3% |
| 65 to 74 Years | 27,001 | 17.4% |
| 75 to 84 Years | 14,053 | 9.1% |
| 85 Years and Over | 5,875 | 3.8% |
| Total | 154,690 | 100.0% |
Housing Finances in Stark County
Median Income by Occupancy in Stark County
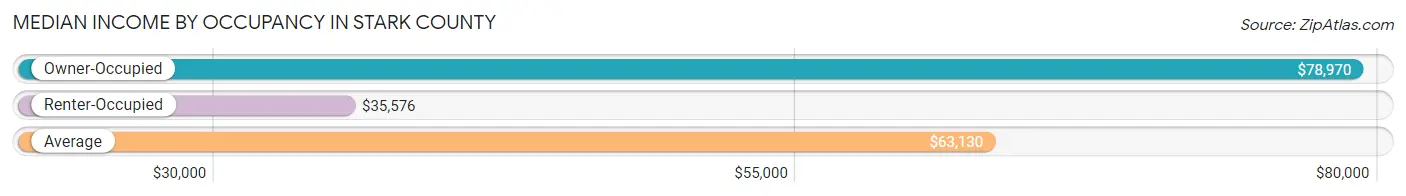
| Occupancy Type | # Households | Median Income |
| Owner-Occupied | 105,443 (68.2%) | $78,970 |
| Renter-Occupied | 49,247 (31.8%) | $35,576 |
| Average | 154,690 (100.0%) | $63,130 |
Occupancy by Householder Income Bracket in Stark County
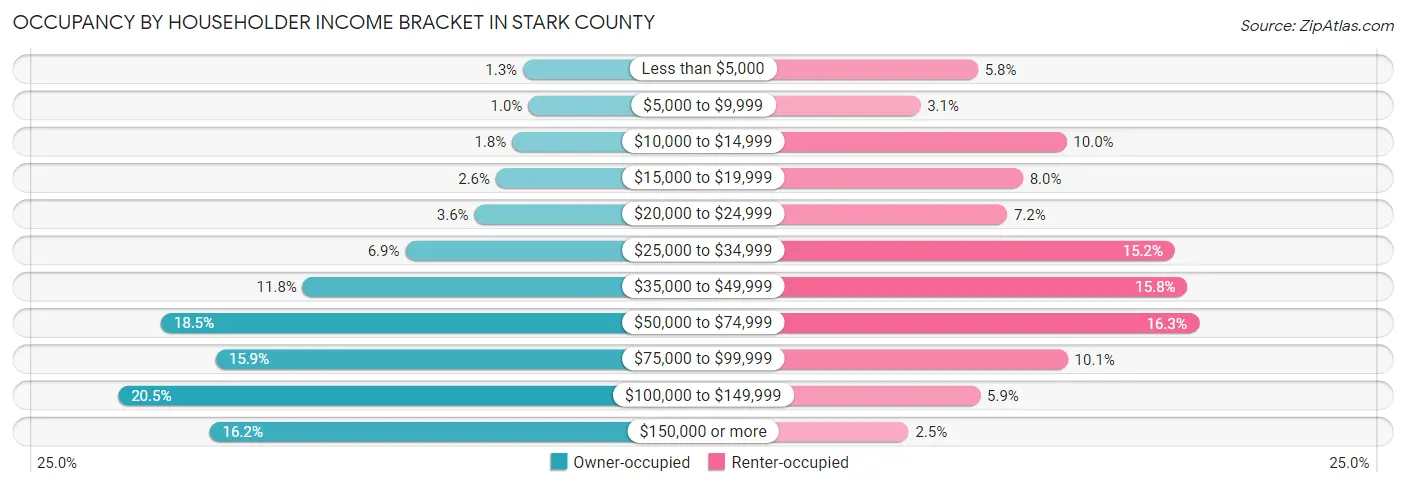
| Income Bracket | Owner-occupied | Renter-occupied |
| Less than $5,000 | 1,343 (1.3%) | 2,864 (5.8%) |
| $5,000 to $9,999 | 1,079 (1.0%) | 1,519 (3.1%) |
| $10,000 to $14,999 | 1,891 (1.8%) | 4,943 (10.0%) |
| $15,000 to $19,999 | 2,702 (2.6%) | 3,918 (8.0%) |
| $20,000 to $24,999 | 3,771 (3.6%) | 3,552 (7.2%) |
| $25,000 to $34,999 | 7,248 (6.9%) | 7,485 (15.2%) |
| $35,000 to $49,999 | 12,405 (11.8%) | 7,781 (15.8%) |
| $50,000 to $74,999 | 19,521 (18.5%) | 8,049 (16.3%) |
| $75,000 to $99,999 | 16,750 (15.9%) | 4,974 (10.1%) |
| $100,000 to $149,999 | 21,661 (20.5%) | 2,920 (5.9%) |
| $150,000 or more | 17,072 (16.2%) | 1,242 (2.5%) |
| Total | 105,443 (100.0%) | 49,247 (100.0%) |
Monthly Housing Cost Tiers in Stark County
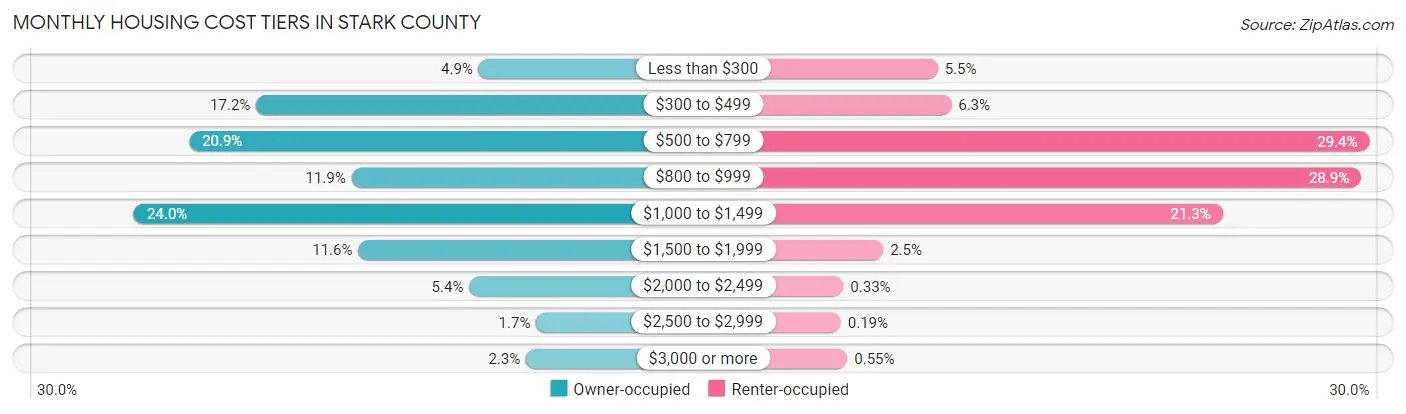
| Monthly Cost | Owner-occupied | Renter-occupied |
| Less than $300 | 5,189 (4.9%) | 2,726 (5.5%) |
| $300 to $499 | 18,143 (17.2%) | 3,100 (6.3%) |
| $500 to $799 | 22,056 (20.9%) | 14,468 (29.4%) |
| $800 to $999 | 12,590 (11.9%) | 14,243 (28.9%) |
| $1,000 to $1,499 | 25,269 (24.0%) | 10,473 (21.3%) |
| $1,500 to $1,999 | 12,200 (11.6%) | 1,246 (2.5%) |
| $2,000 to $2,499 | 5,741 (5.4%) | 161 (0.3%) |
| $2,500 to $2,999 | 1,835 (1.7%) | 93 (0.2%) |
| $3,000 or more | 2,420 (2.3%) | 272 (0.5%) |
| Total | 105,443 (100.0%) | 49,247 (100.0%) |
Physical Housing Characteristics in Stark County
Housing Structures in Stark County
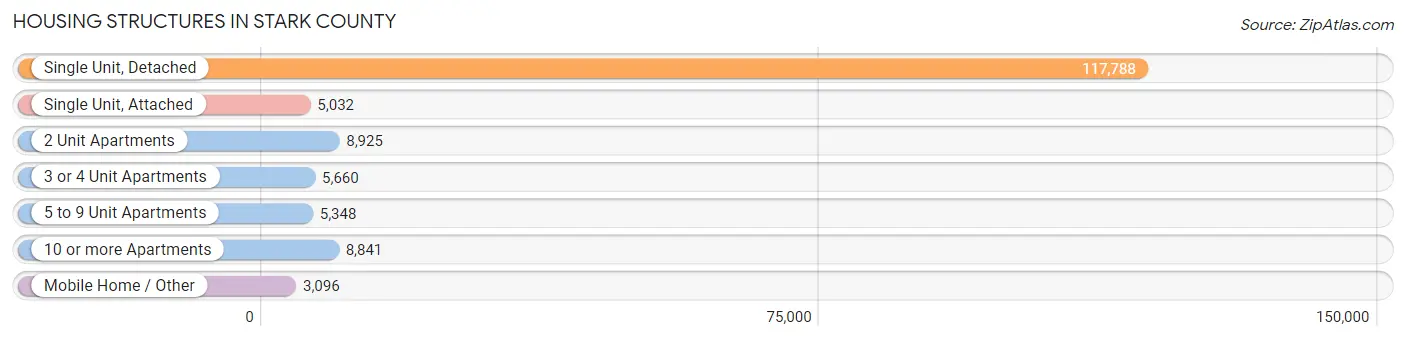
| Structure Type | # Housing Units | % Housing Units |
| Single Unit, Detached | 117,788 | 76.1% |
| Single Unit, Attached | 5,032 | 3.3% |
| 2 Unit Apartments | 8,925 | 5.8% |
| 3 or 4 Unit Apartments | 5,660 | 3.7% |
| 5 to 9 Unit Apartments | 5,348 | 3.5% |
| 10 or more Apartments | 8,841 | 5.7% |
| Mobile Home / Other | 3,096 | 2.0% |
| Total | 154,690 | 100.0% |
Housing Structures by Occupancy in Stark County
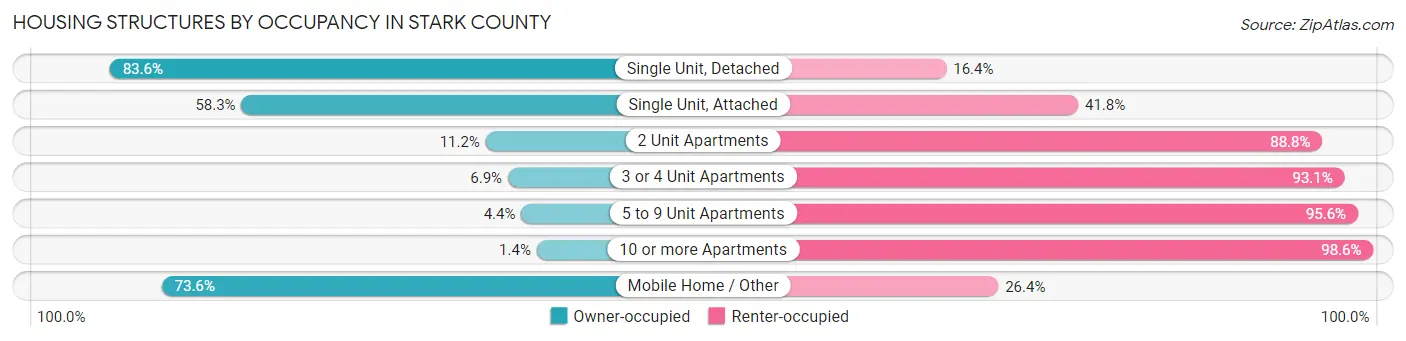
| Structure Type | Owner-occupied | Renter-occupied |
| Single Unit, Detached | 98,483 (83.6%) | 19,305 (16.4%) |
| Single Unit, Attached | 2,931 (58.3%) | 2,101 (41.7%) |
| 2 Unit Apartments | 1,001 (11.2%) | 7,924 (88.8%) |
| 3 or 4 Unit Apartments | 393 (6.9%) | 5,267 (93.1%) |
| 5 to 9 Unit Apartments | 233 (4.4%) | 5,115 (95.6%) |
| 10 or more Apartments | 123 (1.4%) | 8,718 (98.6%) |
| Mobile Home / Other | 2,279 (73.6%) | 817 (26.4%) |
| Total | 105,443 (68.2%) | 49,247 (31.8%) |
Housing Structures by Number of Rooms in Stark County
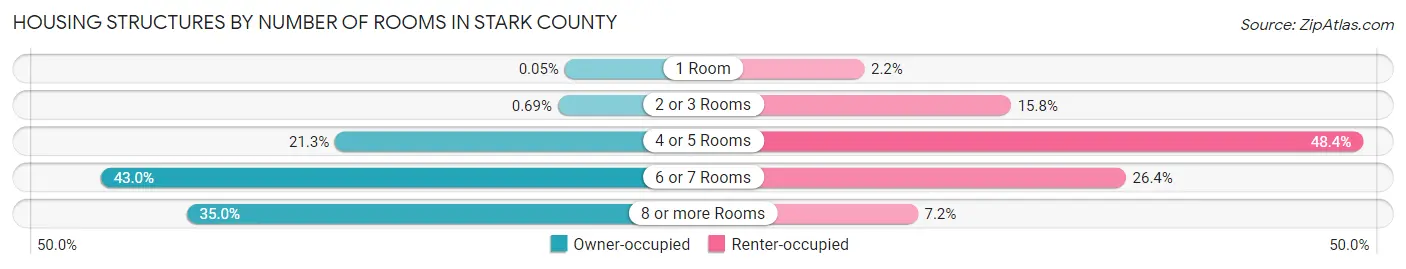
| Number of Rooms | Owner-occupied | Renter-occupied |
| 1 Room | 51 (0.1%) | 1,097 (2.2%) |
| 2 or 3 Rooms | 730 (0.7%) | 7,779 (15.8%) |
| 4 or 5 Rooms | 22,446 (21.3%) | 23,825 (48.4%) |
| 6 or 7 Rooms | 45,303 (43.0%) | 13,010 (26.4%) |
| 8 or more Rooms | 36,913 (35.0%) | 3,536 (7.2%) |
| Total | 105,443 (100.0%) | 49,247 (100.0%) |
Housing Structure by Heating Type in Stark County
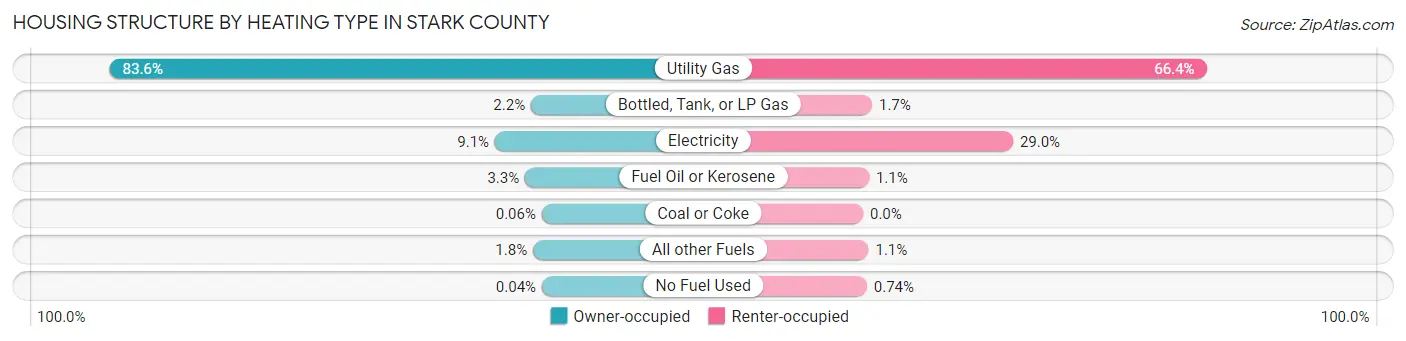
| Heating Type | Owner-occupied | Renter-occupied |
| Utility Gas | 88,119 (83.6%) | 32,673 (66.3%) |
| Bottled, Tank, or LP Gas | 2,263 (2.1%) | 859 (1.7%) |
| Electricity | 9,612 (9.1%) | 14,267 (29.0%) |
| Fuel Oil or Kerosene | 3,479 (3.3%) | 561 (1.1%) |
| Coal or Coke | 68 (0.1%) | 0 (0.0%) |
| All other Fuels | 1,856 (1.8%) | 523 (1.1%) |
| No Fuel Used | 46 (0.0%) | 364 (0.7%) |
| Total | 105,443 (100.0%) | 49,247 (100.0%) |
Household Vehicle Usage in Stark County
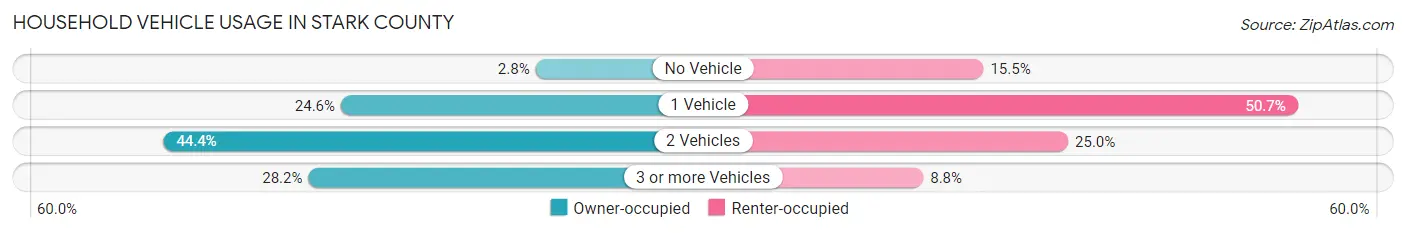
| Vehicles per Household | Owner-occupied | Renter-occupied |
| No Vehicle | 2,920 (2.8%) | 7,642 (15.5%) |
| 1 Vehicle | 25,909 (24.6%) | 24,970 (50.7%) |
| 2 Vehicles | 46,857 (44.4%) | 12,313 (25.0%) |
| 3 or more Vehicles | 29,757 (28.2%) | 4,322 (8.8%) |
| Total | 105,443 (100.0%) | 49,247 (100.0%) |
Real Estate & Mortgages in Stark County
Real Estate and Mortgage Overview in Stark County
| Characteristic | Without Mortgage | With Mortgage |
| Housing Units | 41,225 | 64,218 |
| Median Property Value | $154,600 | $171,800 |
| Median Household Income | $59,925 | $12,355 |
| Monthly Housing Costs | $483 | $2,270 |
| Real Estate Taxes | $2,119 | $1,093 |
Property Value by Mortgage Status in Stark County
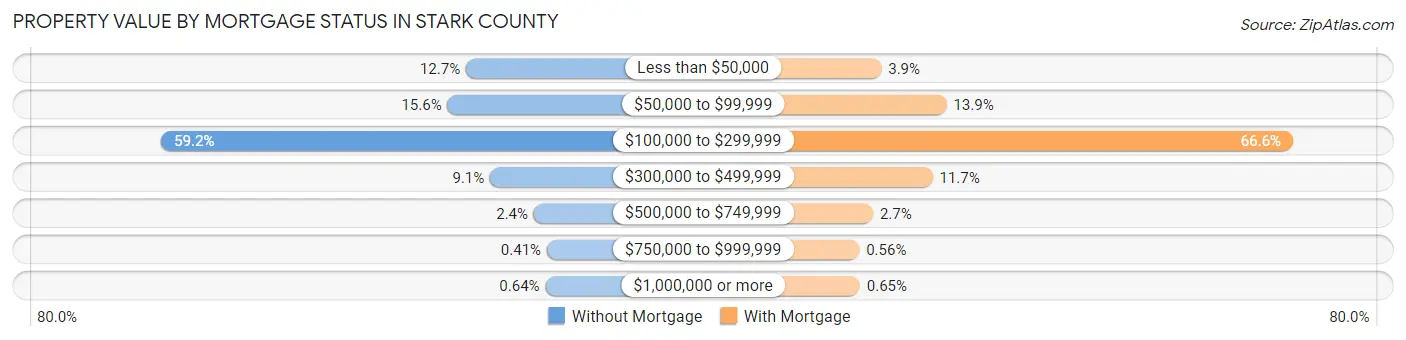
| Property Value | Without Mortgage | With Mortgage |
| Less than $50,000 | 5,253 (12.7%) | 2,519 (3.9%) |
| $50,000 to $99,999 | 6,413 (15.6%) | 8,898 (13.9%) |
| $100,000 to $299,999 | 24,401 (59.2%) | 42,793 (66.6%) |
| $300,000 to $499,999 | 3,734 (9.1%) | 7,530 (11.7%) |
| $500,000 to $749,999 | 991 (2.4%) | 1,700 (2.6%) |
| $750,000 to $999,999 | 171 (0.4%) | 362 (0.6%) |
| $1,000,000 or more | 262 (0.6%) | 416 (0.6%) |
| Total | 41,225 (100.0%) | 64,218 (100.0%) |
Household Income by Mortgage Status in Stark County
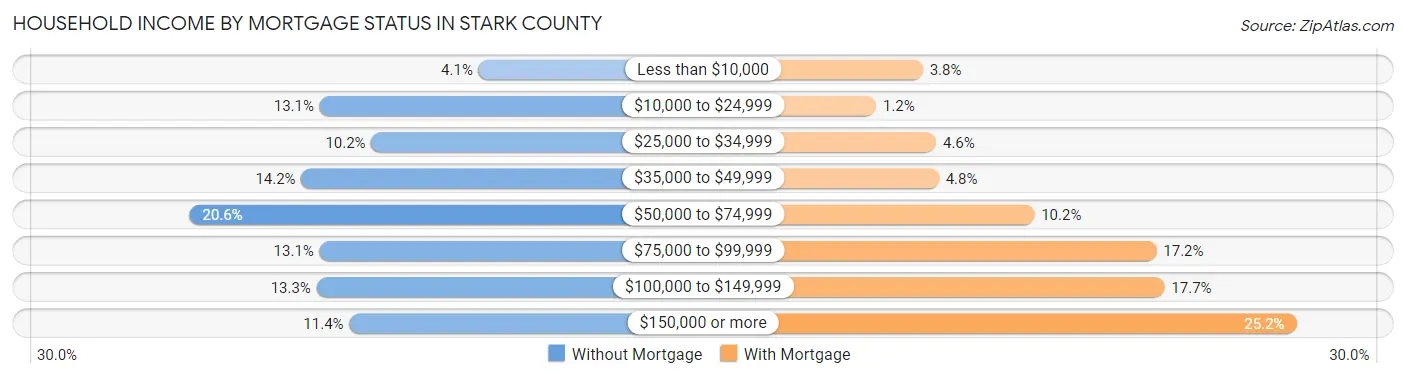
| Household Income | Without Mortgage | With Mortgage |
| Less than $10,000 | 1,668 (4.1%) | 2,464 (3.8%) |
| $10,000 to $24,999 | 5,412 (13.1%) | 754 (1.2%) |
| $25,000 to $34,999 | 4,198 (10.2%) | 2,952 (4.6%) |
| $35,000 to $49,999 | 5,847 (14.2%) | 3,050 (4.8%) |
| $50,000 to $74,999 | 8,483 (20.6%) | 6,558 (10.2%) |
| $75,000 to $99,999 | 5,415 (13.1%) | 11,038 (17.2%) |
| $100,000 to $149,999 | 5,485 (13.3%) | 11,335 (17.6%) |
| $150,000 or more | 4,717 (11.4%) | 16,176 (25.2%) |
| Total | 41,225 (100.0%) | 64,218 (100.0%) |
Property Value to Household Income Ratio in Stark County
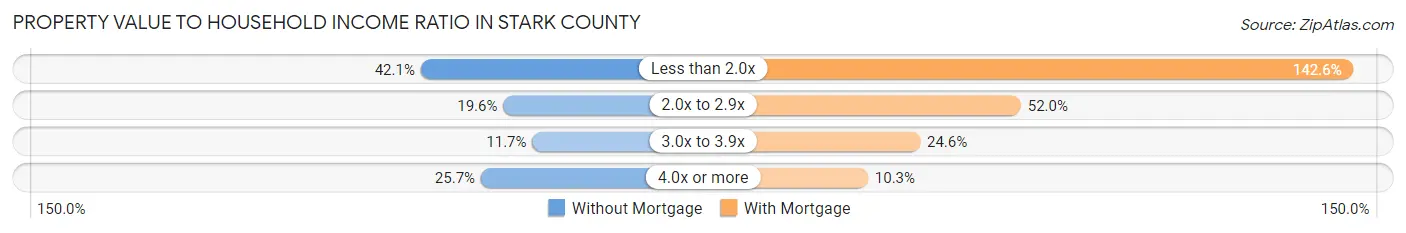
| Value-to-Income Ratio | Without Mortgage | With Mortgage |
| Less than 2.0x | 17,352 (42.1%) | 91,587 (142.6%) |
| 2.0x to 2.9x | 8,075 (19.6%) | 33,385 (52.0%) |
| 3.0x to 3.9x | 4,811 (11.7%) | 15,764 (24.5%) |
| 4.0x or more | 10,589 (25.7%) | 6,633 (10.3%) |
| Total | 41,225 (100.0%) | 64,218 (100.0%) |
Real Estate Taxes by Mortgage Status in Stark County
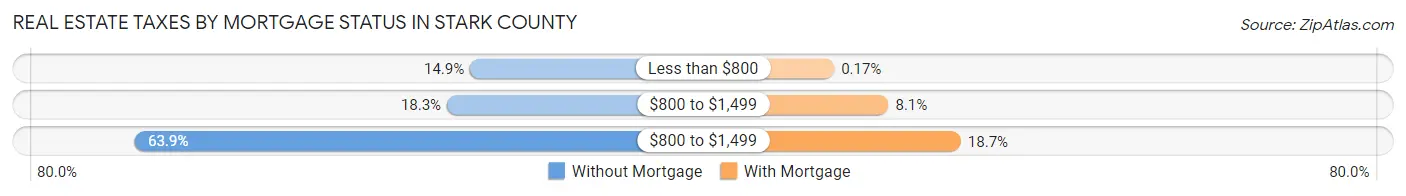
| Property Taxes | Without Mortgage | With Mortgage |
| Less than $800 | 6,148 (14.9%) | 109 (0.2%) |
| $800 to $1,499 | 7,541 (18.3%) | 5,210 (8.1%) |
| $800 to $1,499 | 26,321 (63.8%) | 11,996 (18.7%) |
| Total | 41,225 (100.0%) | 64,218 (100.0%) |
Health & Disability in Stark County
Health Insurance Coverage by Age in Stark County
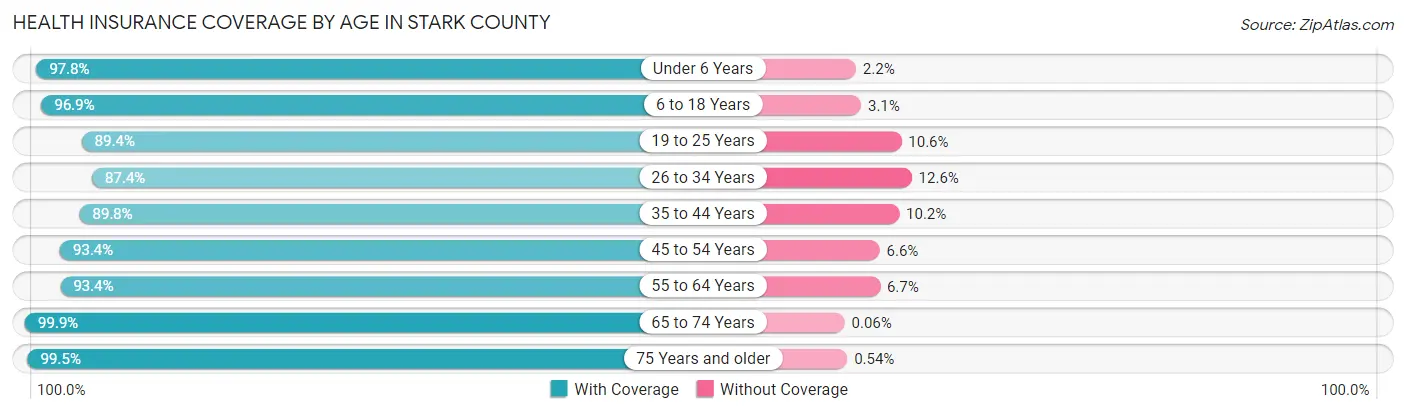
| Age Bracket | With Coverage | Without Coverage |
| Under 6 Years | 24,120 (97.8%) | 535 (2.2%) |
| 6 to 18 Years | 58,351 (96.9%) | 1,878 (3.1%) |
| 19 to 25 Years | 27,803 (89.4%) | 3,310 (10.6%) |
| 26 to 34 Years | 35,330 (87.4%) | 5,074 (12.6%) |
| 35 to 44 Years | 38,986 (89.8%) | 4,438 (10.2%) |
| 45 to 54 Years | 42,888 (93.4%) | 3,022 (6.6%) |
| 55 to 64 Years | 49,015 (93.3%) | 3,489 (6.7%) |
| 65 to 74 Years | 42,495 (99.9%) | 25 (0.1%) |
| 75 Years and older | 28,746 (99.5%) | 157 (0.5%) |
| Total | 347,734 (94.1%) | 21,928 (5.9%) |
Health Insurance Coverage by Citizenship Status in Stark County
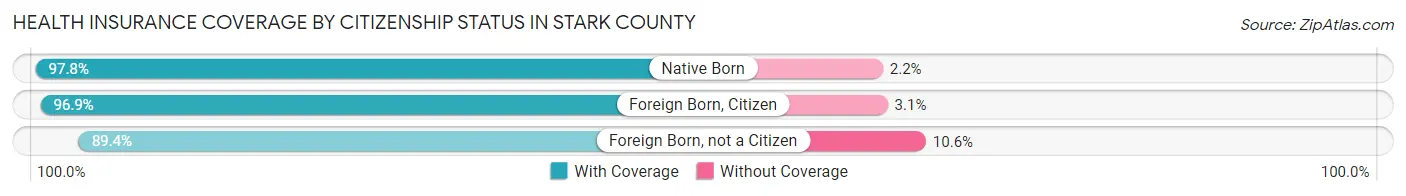
| Citizenship Status | With Coverage | Without Coverage |
| Native Born | 24,120 (97.8%) | 535 (2.2%) |
| Foreign Born, Citizen | 58,351 (96.9%) | 1,878 (3.1%) |
| Foreign Born, not a Citizen | 27,803 (89.4%) | 3,310 (10.6%) |
Health Insurance Coverage by Household Income in Stark County
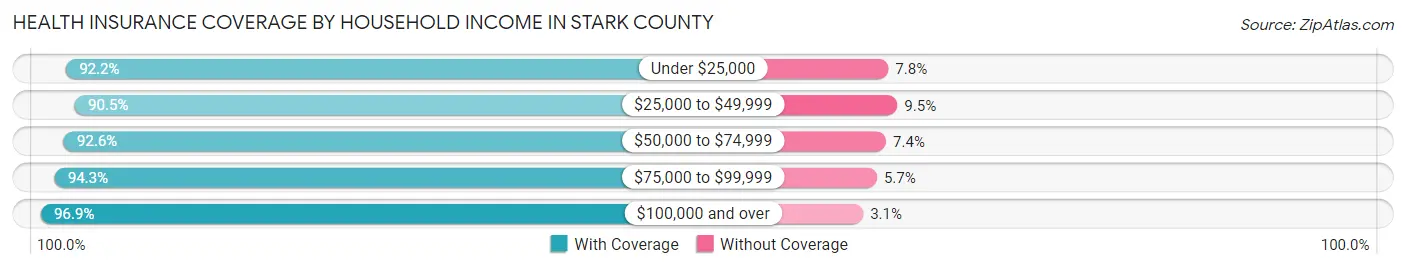
| Household Income | With Coverage | Without Coverage |
| Under $25,000 | 41,544 (92.2%) | 3,516 (7.8%) |
| $25,000 to $49,999 | 57,954 (90.5%) | 6,070 (9.5%) |
| $50,000 to $74,999 | 60,754 (92.6%) | 4,833 (7.4%) |
| $75,000 to $99,999 | 55,265 (94.3%) | 3,316 (5.7%) |
| $100,000 and over | 128,510 (96.9%) | 4,082 (3.1%) |
Public vs Private Health Insurance Coverage by Age in Stark County
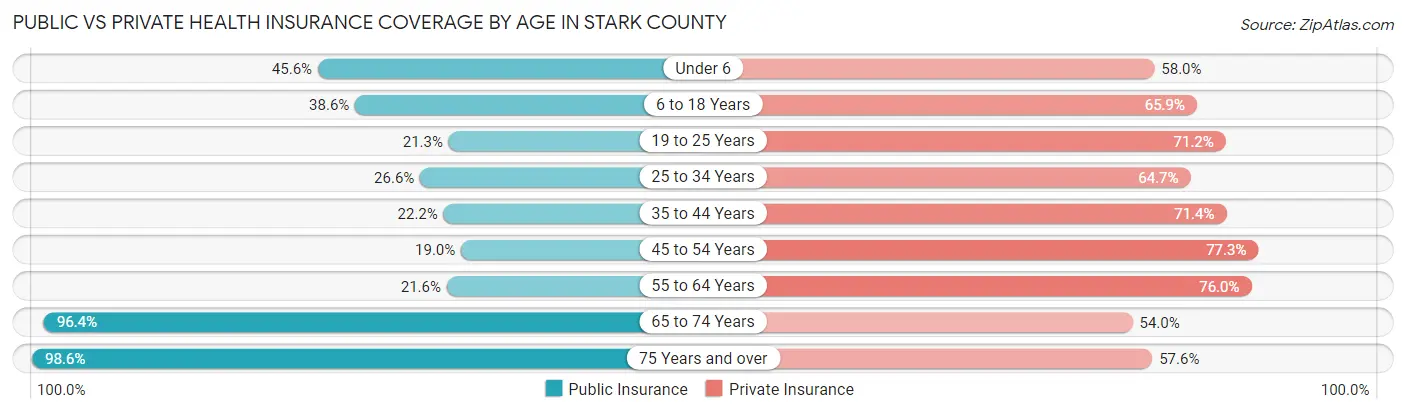
| Age Bracket | Public Insurance | Private Insurance |
| Under 6 | 11,233 (45.6%) | 14,306 (58.0%) |
| 6 to 18 Years | 23,273 (38.6%) | 39,687 (65.9%) |
| 19 to 25 Years | 6,614 (21.3%) | 22,163 (71.2%) |
| 25 to 34 Years | 10,738 (26.6%) | 26,139 (64.7%) |
| 35 to 44 Years | 9,647 (22.2%) | 30,989 (71.4%) |
| 45 to 54 Years | 8,716 (19.0%) | 35,486 (77.3%) |
| 55 to 64 Years | 11,360 (21.6%) | 39,909 (76.0%) |
| 65 to 74 Years | 41,004 (96.4%) | 22,949 (54.0%) |
| 75 Years and over | 28,502 (98.6%) | 16,654 (57.6%) |
| Total | 151,087 (40.9%) | 248,282 (67.2%) |
Disability Status by Sex by Age in Stark County
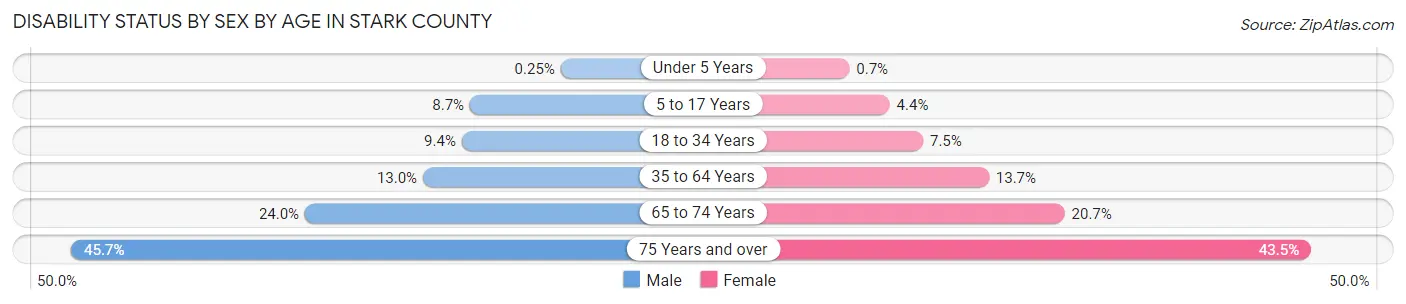
| Age Bracket | Male | Female |
| Under 5 Years | 26 (0.3%) | 70 (0.7%) |
| 5 to 17 Years | 2,646 (8.7%) | 1,284 (4.4%) |
| 18 to 34 Years | 3,623 (9.4%) | 2,867 (7.5%) |
| 35 to 64 Years | 9,110 (13.0%) | 9,819 (13.7%) |
| 65 to 74 Years | 4,802 (24.0%) | 4,653 (20.7%) |
| 75 Years and over | 5,468 (45.7%) | 7,372 (43.5%) |
Disability Class by Sex by Age in Stark County
Disability Class: Hearing Difficulty
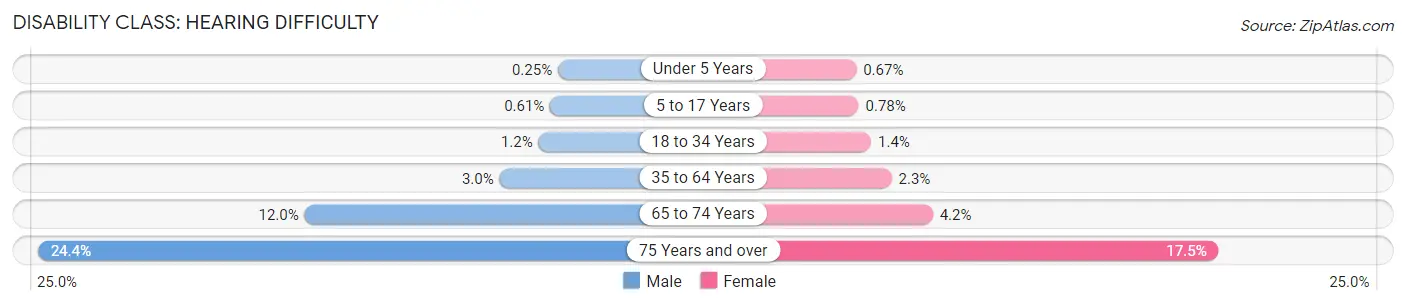
| Age Bracket | Male | Female |
| Under 5 Years | 26 (0.3%) | 67 (0.7%) |
| 5 to 17 Years | 187 (0.6%) | 226 (0.8%) |
| 18 to 34 Years | 440 (1.1%) | 518 (1.4%) |
| 35 to 64 Years | 2,068 (3.0%) | 1,659 (2.3%) |
| 65 to 74 Years | 2,404 (12.0%) | 949 (4.2%) |
| 75 Years and over | 2,919 (24.4%) | 2,960 (17.5%) |
Disability Class: Vision Difficulty
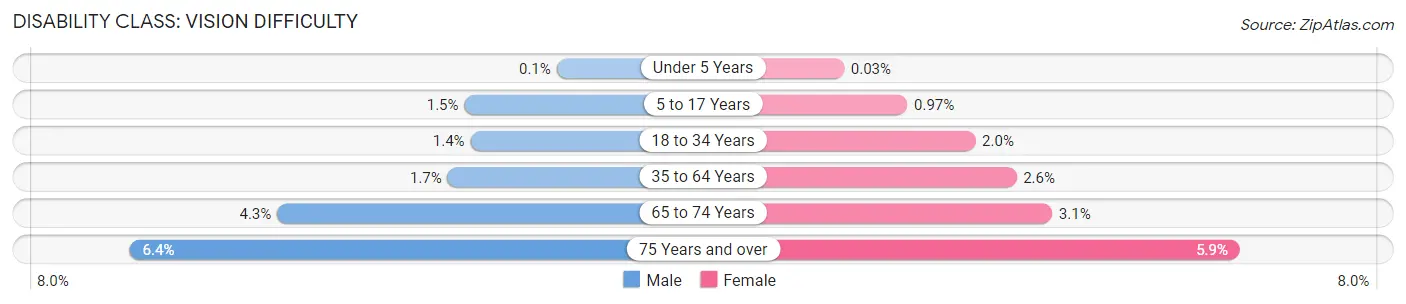
| Age Bracket | Male | Female |
| Under 5 Years | 10 (0.1%) | 3 (0.0%) |
| 5 to 17 Years | 448 (1.5%) | 281 (1.0%) |
| 18 to 34 Years | 530 (1.4%) | 753 (2.0%) |
| 35 to 64 Years | 1,202 (1.7%) | 1,860 (2.6%) |
| 65 to 74 Years | 851 (4.3%) | 701 (3.1%) |
| 75 Years and over | 771 (6.4%) | 1,000 (5.9%) |
Disability Class: Cognitive Difficulty
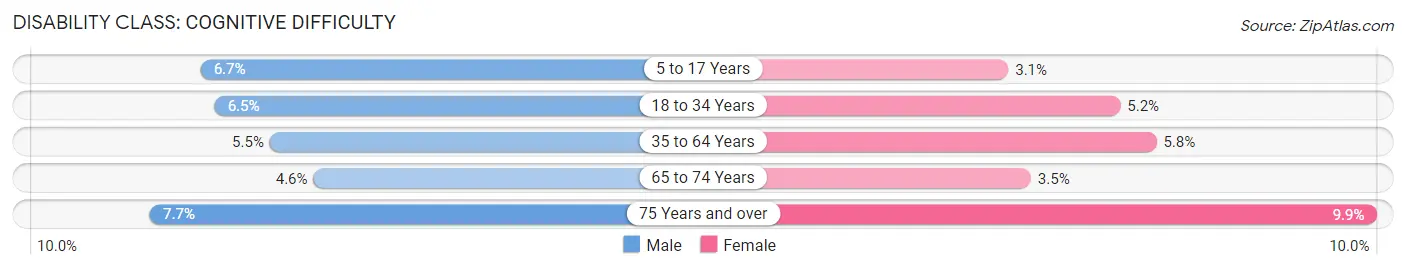
| Age Bracket | Male | Female |
| 5 to 17 Years | 2,055 (6.7%) | 895 (3.1%) |
| 18 to 34 Years | 2,487 (6.5%) | 1,965 (5.2%) |
| 35 to 64 Years | 3,809 (5.4%) | 4,204 (5.8%) |
| 65 to 74 Years | 930 (4.6%) | 789 (3.5%) |
| 75 Years and over | 918 (7.7%) | 1,680 (9.9%) |
Disability Class: Ambulatory Difficulty
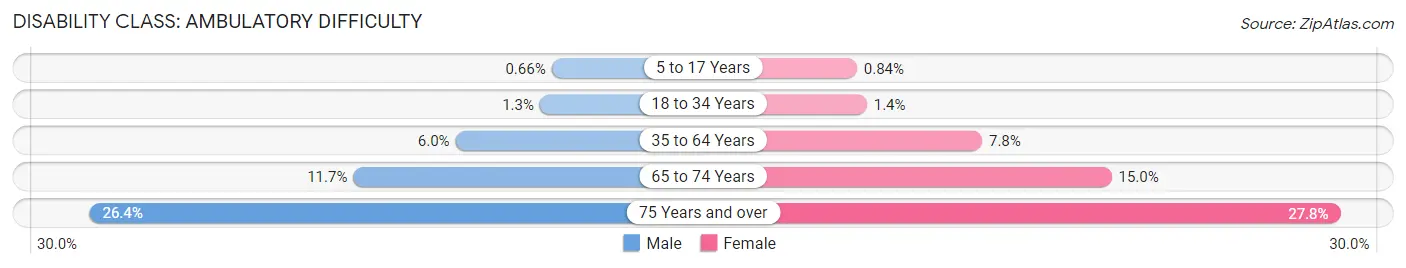
| Age Bracket | Male | Female |
| 5 to 17 Years | 202 (0.7%) | 242 (0.8%) |
| 18 to 34 Years | 502 (1.3%) | 529 (1.4%) |
| 35 to 64 Years | 4,204 (6.0%) | 5,616 (7.8%) |
| 65 to 74 Years | 2,343 (11.7%) | 3,380 (15.0%) |
| 75 Years and over | 3,158 (26.4%) | 4,701 (27.8%) |
Disability Class: Self-Care Difficulty
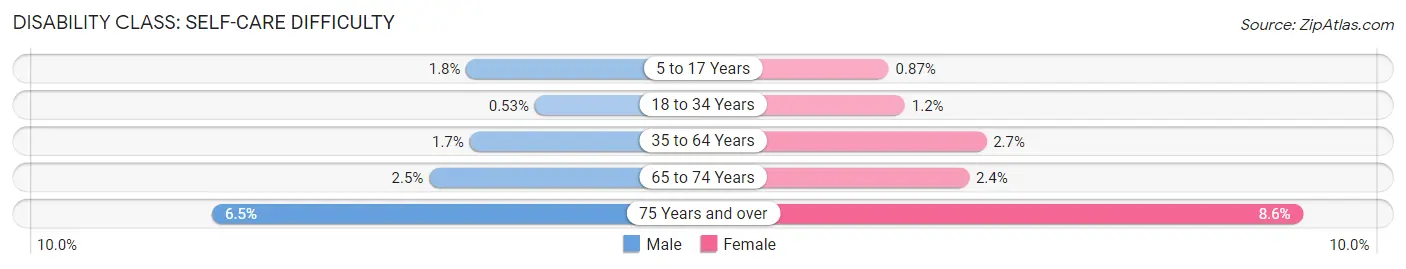
| Age Bracket | Male | Female |
| 5 to 17 Years | 550 (1.8%) | 251 (0.9%) |
| 18 to 34 Years | 204 (0.5%) | 444 (1.2%) |
| 35 to 64 Years | 1,213 (1.7%) | 1,925 (2.7%) |
| 65 to 74 Years | 499 (2.5%) | 530 (2.4%) |
| 75 Years and over | 780 (6.5%) | 1,447 (8.6%) |
Technology Access in Stark County
Computing Device Access in Stark County
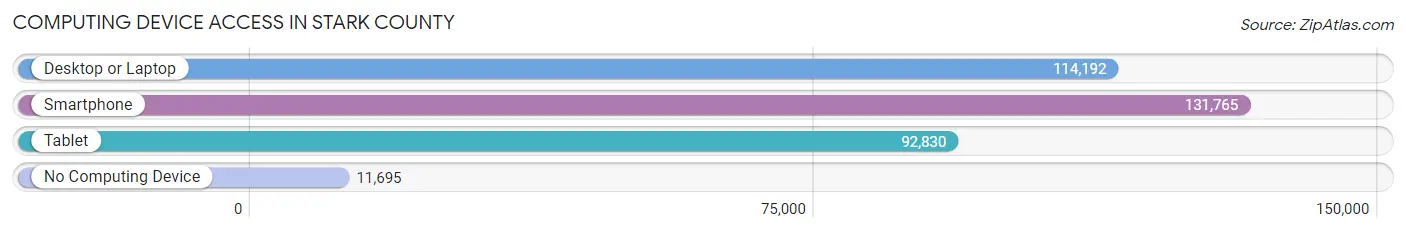
| Device Type | # Households | % Households |
| Desktop or Laptop | 114,192 | 73.8% |
| Smartphone | 131,765 | 85.2% |
| Tablet | 92,830 | 60.0% |
| No Computing Device | 11,695 | 7.6% |
| Total | 154,690 | 100.0% |
Internet Access in Stark County
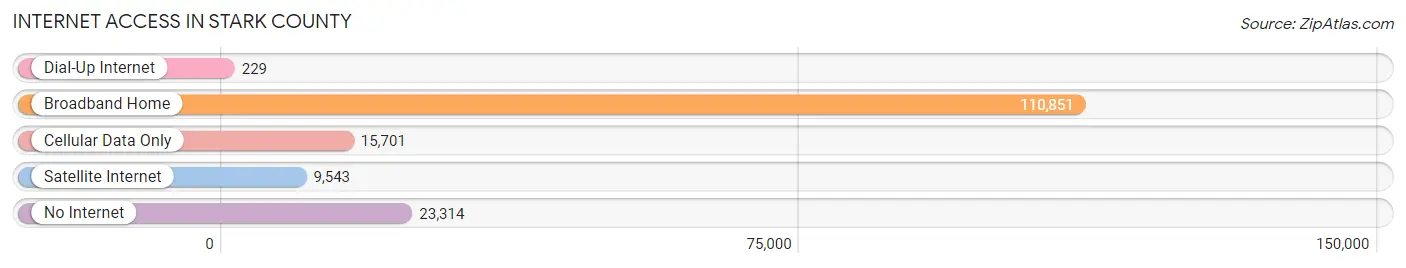
| Internet Type | # Households | % Households |
| Dial-Up Internet | 229 | 0.2% |
| Broadband Home | 110,851 | 71.7% |
| Cellular Data Only | 15,701 | 10.2% |
| Satellite Internet | 9,543 | 6.2% |
| No Internet | 23,314 | 15.1% |
| Total | 154,690 | 100.0% |
Stark County Summary
Stark County, Ohio is located in the northeastern part of the state and is part of the Akron Metropolitan Statistical Area. It is bordered by Summit, Portage, Wayne, Tuscarawas, and Carroll counties. The county seat is Canton, and the largest city is Massillon. As of the 2010 census, the population was 375,586, making it the 16th most populous county in Ohio.
History
Stark County was formed in 1808 from portions of Columbiana, Wayne, and Tuscarawas counties. It was named after General John Stark, a Revolutionary War hero. The county was originally divided into six townships: Canton, Osnaburg, Paris, Pike, Plain, and Sandy. The county was home to several Native American tribes, including the Shawnee, Delaware, and Wyandot.
The county was an important part of the Underground Railroad, with many stops in the area. The county was also home to several prominent abolitionists, including John Brown and William Lloyd Garrison.
Geography
Stark County covers an area of 576 square miles and is located in the Appalachian Plateau region of Ohio. The county is mostly flat, with some rolling hills in the northern and western parts. The county is drained by the Tuscarawas and Mahoning rivers. The highest point in the county is 1,092 feet above sea level.
The county is home to several state parks, including Atwood Lake Park, Clay's Park Resort, and Sippo Lake Park. The county also contains several wildlife areas, including the Atwood Lake Wildlife Area, the Bolivar Marsh Wildlife Area, and the Nimishillen Creek Wildlife Area.
Economy
Stark County has a diverse economy, with a mix of manufacturing, retail, and service industries. The county is home to several major employers, including the Timken Company, Aultman Hospital, and the Pro Football Hall of Fame. The county is also home to several colleges and universities, including Kent State University at Stark, Malone University, and Walsh University.
The county's unemployment rate was 4.7% in 2019, lower than the state average of 4.9%. The median household income was $54,845 in 2019, slightly lower than the state average of $56,521.
Demographics
As of the 2010 census, there were 375,586 people, 145,945 households, and 101,945 families living in the county. The population density was 651.3 people per square mile. The racial makeup of the county was 90.2% White, 5.3% African American, 0.4% Native American, 1.2% Asian, 0.1% Pacific Islander, 1.2% from other races, and 1.6% from two or more races. Hispanic or Latino of any race were 3.2% of the population.
The median age was 40.2 years. The gender makeup of the county was 48.7% male and 51.3% female. The median household income was $54,845 and the median family income was $64,919. The per capita income was $25,945. About 8.7% of families and 11.2% of the population were below the poverty line.
Common Questions
What is the Total Population of Stark County?
Total Population of Stark County is 374,199.
What is the Total Male Population of Stark County?
Total Male Population of Stark County is 183,232.
What is the Total Female Population of Stark County?
Total Female Population of Stark County is 190,967.
What is the Ratio of Males per 100 Females in Stark County?
There are 95.95 Males per 100 Females in Stark County.
What is the Ratio of Females per 100 Males in Stark County?
There are 104.22 Females per 100 Males in Stark County.
What is the Median Population Age in Stark County?
Median Population Age in Stark County is 41.8 Years.
What is the Average Family Size in Stark County
Average Family Size in Stark County is 2.9 People.
What is the Average Household Size in Stark County
Average Household Size in Stark County is 2.4 People.
What is Per Capita Income in Stark County?
Per Capita income in Stark County is $34,652.
What is the Median Family Income in Stark County?
Median Family Income in Stark County is $80,400.
What is the Median Household income in Stark County?
Median Household Income in Stark County is $63,130.
What is Income or Wage Gap in Stark County?
Income or Wage Gap in Stark County is 30.5%.
Women in Stark County earn 69.5 cents for every dollar earned by a man.
What is Family Income Deficit in Stark County?
Family Income Deficit in Stark County is $10,844.
Families that are below poverty line in Stark County earn $10,844 less on average than the poverty threshold level.
What is Inequality or Gini Index in Stark County?
Inequality or Gini Index in Stark County is 0.45.
How Large is the Labor Force in Stark County?
There are 187,968 People in the Labor Forcein in Stark County.
What is the Percentage of People in the Labor Force in Stark County?
62.0% of People are in the Labor Force in Stark County.
What is the Unemployment Rate in Stark County?
Unemployment Rate in Stark County is 4.3%.