Seneca County, OH
Seneca County Map

Seneca County Overview
55,062
TOTAL POPULATION
27,744
MALE POPULATION
27,318
FEMALE POPULATION
101.56
MALES / 100 FEMALES
98.46
FEMALES / 100 MALES
40.6
MEDIAN AGE
2.9
AVG FAMILY SIZE
2.4
AVG HOUSEHOLD SIZE
$31,770
PER CAPITA INCOME
$74,863
AVG FAMILY INCOME
$62,476
AVG HOUSEHOLD INCOME
34.3%
WAGE / INCOME GAP [ % ]
65.7¢/ $1
WAGE / INCOME GAP [ $ ]
$10,193
FAMILY INCOME DEFICIT
0.43
INEQUALITY / GINI INDEX
28,069
LABOR FORCE [ PEOPLE ]
62.6%
PERCENT IN LABOR FORCE
4.2%
UNEMPLOYMENT RATE
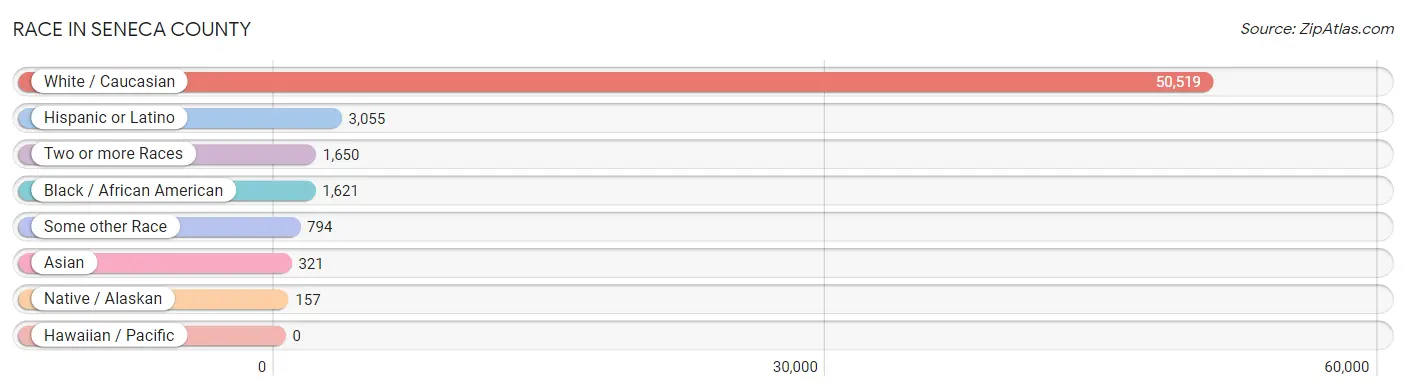
Race in Seneca County
The most populous races in Seneca County are White / Caucasian (50,519 | 91.7%), Hispanic or Latino (3,055 | 5.6%), and Two or more Races (1,650 | 3.0%).
| Race | # Population | % Population |
| Asian | 321 | 0.6% |
| Black / African American | 1,621 | 2.9% |
| Hawaiian / Pacific | 0 | 0.0% |
| Hispanic or Latino | 3,055 | 5.6% |
| Native / Alaskan | 157 | 0.3% |
| White / Caucasian | 50,519 | 91.7% |
| Two or more Races | 1,650 | 3.0% |
| Some other Race | 794 | 1.4% |
| Total | 55,062 | 100.0% |
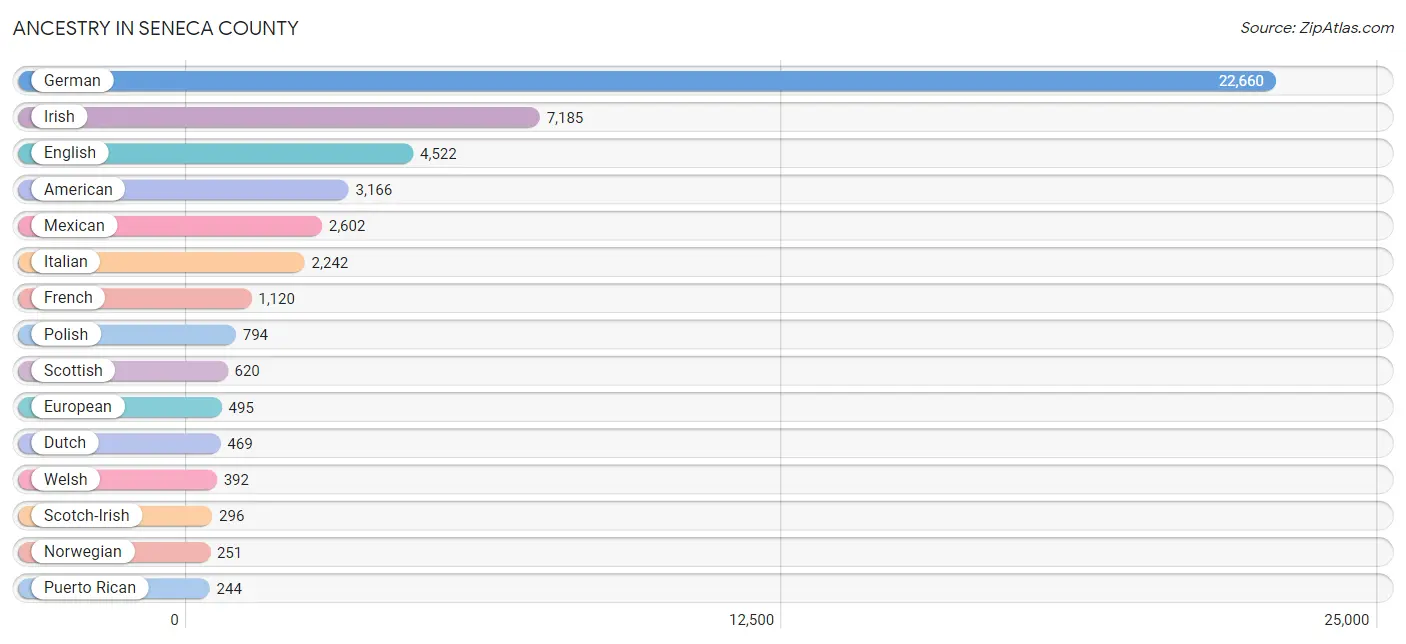
Ancestry in Seneca County
The most populous ancestries reported in Seneca County are German (22,660 | 41.1%), Irish (7,185 | 13.1%), English (4,522 | 8.2%), American (3,166 | 5.8%), and Mexican (2,602 | 4.7%), together accounting for 72.9% of all Seneca County residents.
| Ancestry | # Population | % Population |
| African | 65 | 0.1% |
| Albanian | 22 | 0.0% |
| Alsatian | 15 | 0.0% |
| American | 3,166 | 5.8% |
| Apache | 63 | 0.1% |
| Arab | 114 | 0.2% |
| Arapaho | 28 | 0.1% |
| Armenian | 24 | 0.0% |
| Australian | 1 | 0.0% |
| Austrian | 65 | 0.1% |
| Belgian | 124 | 0.2% |
| Bhutanese | 57 | 0.1% |
| Blackfeet | 94 | 0.2% |
| Bolivian | 7 | 0.0% |
| Brazilian | 1 | 0.0% |
| British | 243 | 0.4% |
| Bulgarian | 30 | 0.1% |
| Burmese | 233 | 0.4% |
| Cambodian | 22 | 0.0% |
| Canadian | 80 | 0.2% |
| Central American | 45 | 0.1% |
| Cherokee | 146 | 0.3% |
| Chippewa | 13 | 0.0% |
| Croatian | 27 | 0.1% |
| Crow | 21 | 0.0% |
| Czech | 33 | 0.1% |
| Czechoslovakian | 19 | 0.0% |
| Danish | 31 | 0.1% |
| Dutch | 469 | 0.9% |
| Eastern European | 97 | 0.2% |
| English | 4,522 | 8.2% |
| European | 495 | 0.9% |
| Finnish | 35 | 0.1% |
| French | 1,120 | 2.0% |
| French Canadian | 177 | 0.3% |
| German | 22,660 | 41.1% |
| Greek | 89 | 0.2% |
| Guatemalan | 32 | 0.1% |
| Hungarian | 187 | 0.3% |
| Icelander | 6 | 0.0% |
| Indian (Asian) | 50 | 0.1% |
| Irish | 7,185 | 13.1% |
| Iroquois | 9 | 0.0% |
| Italian | 2,242 | 4.1% |
| Kenyan | 37 | 0.1% |
| Korean | 45 | 0.1% |
| Latvian | 26 | 0.1% |
| Lebanese | 19 | 0.0% |
| Luxembourger | 19 | 0.0% |
| Malaysian | 18 | 0.0% |
| Mexican | 2,602 | 4.7% |
| Native Hawaiian | 10 | 0.0% |
| New Zealander | 5 | 0.0% |
| Nicaraguan | 13 | 0.0% |
| Nigerian | 83 | 0.2% |
| Northern European | 49 | 0.1% |
| Norwegian | 251 | 0.5% |
| Pakistani | 20 | 0.0% |
| Palestinian | 53 | 0.1% |
| Pennsylvania German | 21 | 0.0% |
| Polish | 794 | 1.4% |
| Portuguese | 18 | 0.0% |
| Puerto Rican | 244 | 0.4% |
| Romanian | 37 | 0.1% |
| Russian | 161 | 0.3% |
| Scandinavian | 99 | 0.2% |
| Scotch-Irish | 296 | 0.5% |
| Scottish | 620 | 1.1% |
| Seminole | 30 | 0.1% |
| Serbian | 5 | 0.0% |
| Sioux | 24 | 0.0% |
| Slavic | 30 | 0.1% |
| Slovak | 41 | 0.1% |
| Slovene | 10 | 0.0% |
| South American | 7 | 0.0% |
| Spaniard | 62 | 0.1% |
| Spanish | 9 | 0.0% |
| Sri Lankan | 73 | 0.1% |
| Subsaharan African | 185 | 0.3% |
| Swedish | 155 | 0.3% |
| Swiss | 185 | 0.3% |
| Thai | 29 | 0.1% |
| Ukrainian | 23 | 0.0% |
| Welsh | 392 | 0.7% |
| Yugoslavian | 54 | 0.1% | View All 85 Rows |
Immigrants in Seneca County
The most numerous immigrant groups reported in Seneca County came from Asia (313 | 0.6%), Europe (261 | 0.5%), Eastern Asia (136 | 0.3%), Central America (135 | 0.3%), and Latin America (135 | 0.3%), together accounting for 1.8% of all Seneca County residents.

| Immigration Origin | # Population | % Population |
| Africa | 67 | 0.1% |
| Asia | 313 | 0.6% |
| Austria | 10 | 0.0% |
| Canada | 28 | 0.1% |
| Central America | 135 | 0.3% |
| Croatia | 11 | 0.0% |
| Eastern Africa | 48 | 0.1% |
| Eastern Asia | 136 | 0.3% |
| Eastern Europe | 44 | 0.1% |
| England | 16 | 0.0% |
| Europe | 261 | 0.5% |
| Germany | 65 | 0.1% |
| Hungary | 2 | 0.0% |
| India | 63 | 0.1% |
| Ireland | 2 | 0.0% |
| Italy | 39 | 0.1% |
| Kenya | 12 | 0.0% |
| Korea | 114 | 0.2% |
| Laos | 18 | 0.0% |
| Latin America | 135 | 0.3% |
| Lebanon | 13 | 0.0% |
| Mexico | 135 | 0.3% |
| Netherlands | 6 | 0.0% |
| Northern Europe | 97 | 0.2% |
| Philippines | 15 | 0.0% |
| Saudi Arabia | 42 | 0.1% |
| Senegal | 19 | 0.0% |
| South Central Asia | 63 | 0.1% |
| South Eastern Asia | 53 | 0.1% |
| Southern Europe | 39 | 0.1% |
| Thailand | 20 | 0.0% |
| Uganda | 36 | 0.1% |
| Western Africa | 19 | 0.0% |
| Western Asia | 55 | 0.1% |
| Western Europe | 81 | 0.2% | View All 35 Rows |
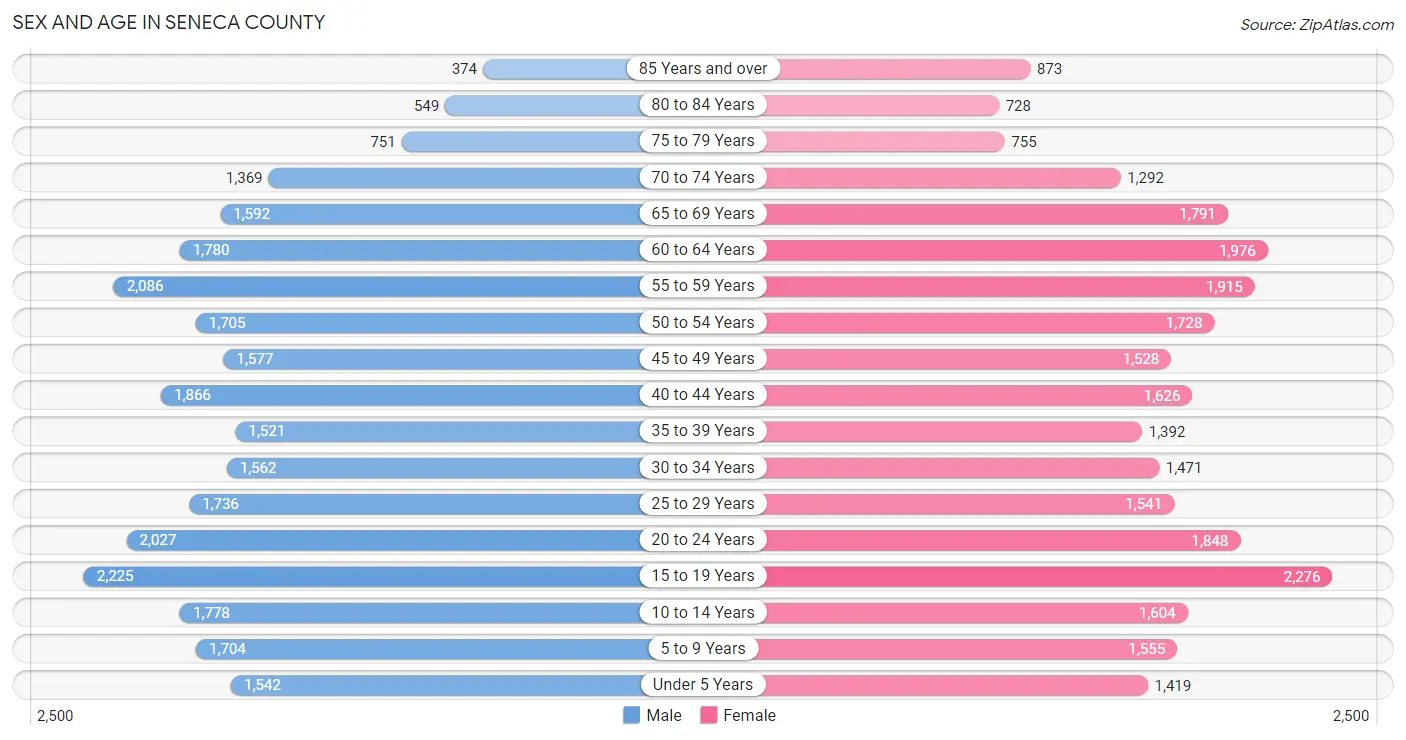
Sex and Age in Seneca County
Sex and Age in Seneca County
The most populous age groups in Seneca County are 15 to 19 Years (2,225 | 8.0%) for men and 15 to 19 Years (2,276 | 8.3%) for women.
| Age Bracket | Male | Female |
| Under 5 Years | 1,542 (5.6%) | 1,419 (5.2%) |
| 5 to 9 Years | 1,704 (6.1%) | 1,555 (5.7%) |
| 10 to 14 Years | 1,778 (6.4%) | 1,604 (5.9%) |
| 15 to 19 Years | 2,225 (8.0%) | 2,276 (8.3%) |
| 20 to 24 Years | 2,027 (7.3%) | 1,848 (6.8%) |
| 25 to 29 Years | 1,736 (6.3%) | 1,541 (5.6%) |
| 30 to 34 Years | 1,562 (5.6%) | 1,471 (5.4%) |
| 35 to 39 Years | 1,521 (5.5%) | 1,392 (5.1%) |
| 40 to 44 Years | 1,866 (6.7%) | 1,626 (5.9%) |
| 45 to 49 Years | 1,577 (5.7%) | 1,528 (5.6%) |
| 50 to 54 Years | 1,705 (6.1%) | 1,728 (6.3%) |
| 55 to 59 Years | 2,086 (7.5%) | 1,915 (7.0%) |
| 60 to 64 Years | 1,780 (6.4%) | 1,976 (7.2%) |
| 65 to 69 Years | 1,592 (5.7%) | 1,791 (6.6%) |
| 70 to 74 Years | 1,369 (4.9%) | 1,292 (4.7%) |
| 75 to 79 Years | 751 (2.7%) | 755 (2.8%) |
| 80 to 84 Years | 549 (2.0%) | 728 (2.7%) |
| 85 Years and over | 374 (1.3%) | 873 (3.2%) |
| Total | 27,744 (100.0%) | 27,318 (100.0%) |
Families and Households in Seneca County
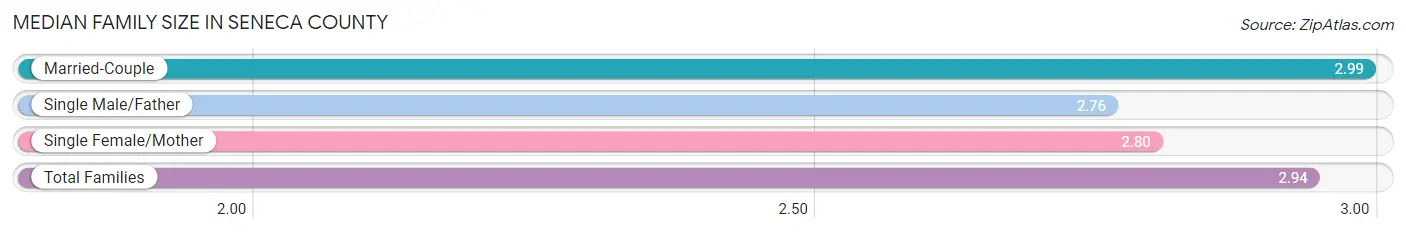
Median Family Size in Seneca County
The median family size in Seneca County is 2.94 persons per family, with married-couple families (10,256 | 73.5%) accounting for the largest median family size of 2.99 persons per family. On the other hand, single male/father families (1,215 | 8.7%) represent the smallest median family size with 2.76 persons per family.
| Family Type | # Families | Family Size |
| Married-Couple | 10,256 (73.5%) | 2.99 |
| Single Male/Father | 1,215 (8.7%) | 2.76 |
| Single Female/Mother | 2,493 (17.8%) | 2.80 |
| Total Families | 13,964 (100.0%) | 2.94 |
Median Household Size in Seneca County
The median household size in Seneca County is 2.38 persons per household, with single male/father households (1,215 | 5.6%) accounting for the largest median household size of 3.25 persons per household. non-family households (7,946 | 36.3%) represent the smallest median household size with 1.20 persons per household.

| Household Type | # Households | Household Size |
| Married-Couple | 10,256 (46.8%) | 3.01 |
| Single Male/Father | 1,215 (5.6%) | 3.25 |
| Single Female/Mother | 2,493 (11.4%) | 3.11 |
| Non-family | 7,946 (36.3%) | 1.20 |
| Total Households | 21,910 (100.0%) | 2.38 |
Household Size by Marriage Status in Seneca County
Out of a total of 21,910 households in Seneca County, 13,964 (63.7%) are family households, while 7,946 (36.3%) are nonfamily households. The most numerous type of family households are 2-person households, comprising 6,716, and the most common type of nonfamily households are 1-person households, comprising 6,635.

| Household Size | Family Households | Nonfamily Households |
| 1-Person Households | - | 6,635 (30.3%) |
| 2-Person Households | 6,716 (30.6%) | 1,108 (5.1%) |
| 3-Person Households | 3,046 (13.9%) | 186 (0.9%) |
| 4-Person Households | 2,447 (11.2%) | 12 (0.1%) |
| 5-Person Households | 1,094 (5.0%) | 5 (0.0%) |
| 6-Person Households | 492 (2.2%) | 0 (0.0%) |
| 7+ Person Households | 169 (0.8%) | 0 (0.0%) |
| Total | 13,964 (63.7%) | 7,946 (36.3%) |
Female Fertility in Seneca County
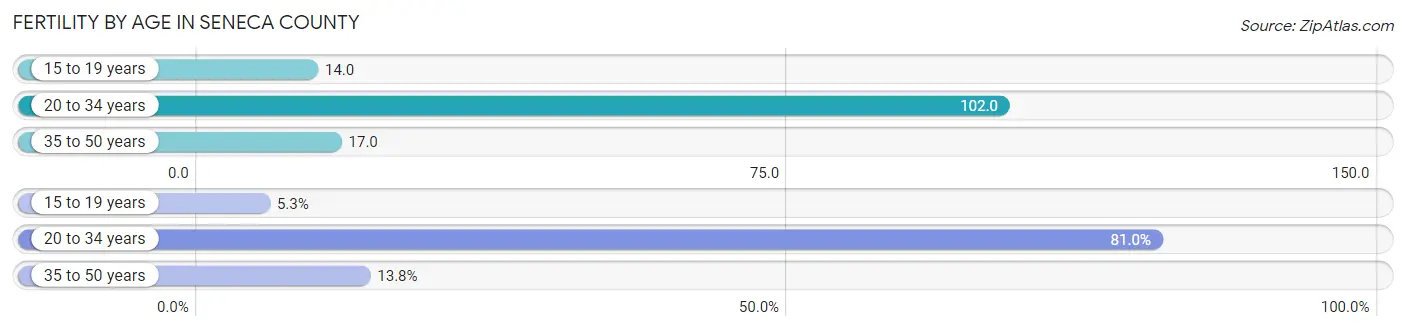
Fertility by Age in Seneca County
Average fertility rate in Seneca County is 51.0 births per 1,000 women. Women in the age bracket of 20 to 34 years have the highest fertility rate with 102.0 births per 1,000 women. Women in the age bracket of 20 to 34 years acount for 81.0% of all women with births.
| Age Bracket | Women with Births | Births / 1,000 Women |
| 15 to 19 years | 32 (5.2%) | 14.0 |
| 20 to 34 years | 494 (81.0%) | 102.0 |
| 35 to 50 years | 84 (13.8%) | 17.0 |
| Total | 610 (100.0%) | 51.0 |
Fertility by Age by Marriage Status in Seneca County
69.0% of women with births (610) in Seneca County are married. The highest percentage of unmarried women with births falls into 15 to 19 years age bracket with 65.6% of them unmarried at the time of birth, while the lowest percentage of unmarried women with births belong to 35 to 50 years age bracket with 3.6% of them unmarried.

| Age Bracket | Married | Unmarried |
| 15 to 19 years | 11 (34.4%) | 21 (65.6%) |
| 20 to 34 years | 329 (66.6%) | 165 (33.4%) |
| 35 to 50 years | 81 (96.4%) | 3 (3.6%) |
| Total | 421 (69.0%) | 189 (31.0%) |
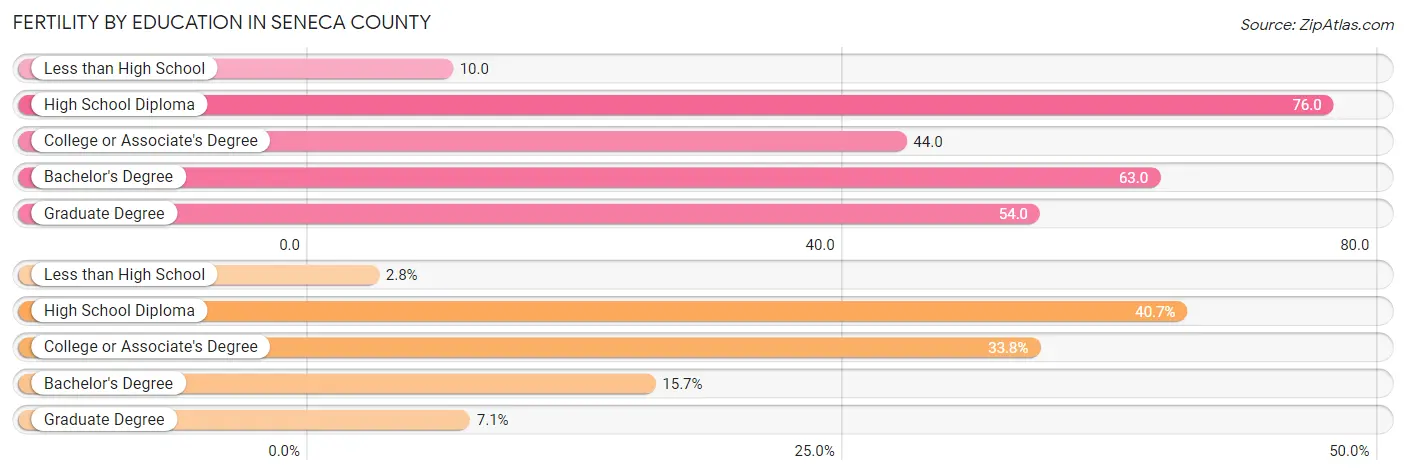
Fertility by Education in Seneca County
Average fertility rate in Seneca County is 51.0 births per 1,000 women. Women with the education attainment of high school diploma have the highest fertility rate of 76.0 births per 1,000 women, while women with the education attainment of less than high school have the lowest fertility at 10.0 births per 1,000 women. Women with the education attainment of high school diploma represent 40.7% of all women with births.
| Educational Attainment | Women with Births | Births / 1,000 Women |
| Less than High School | 17 (2.8%) | 10.0 |
| High School Diploma | 248 (40.7%) | 76.0 |
| College or Associate's Degree | 206 (33.8%) | 44.0 |
| Bachelor's Degree | 96 (15.7%) | 63.0 |
| Graduate Degree | 43 (7.0%) | 54.0 |
| Total | 610 (100.0%) | 51.0 |
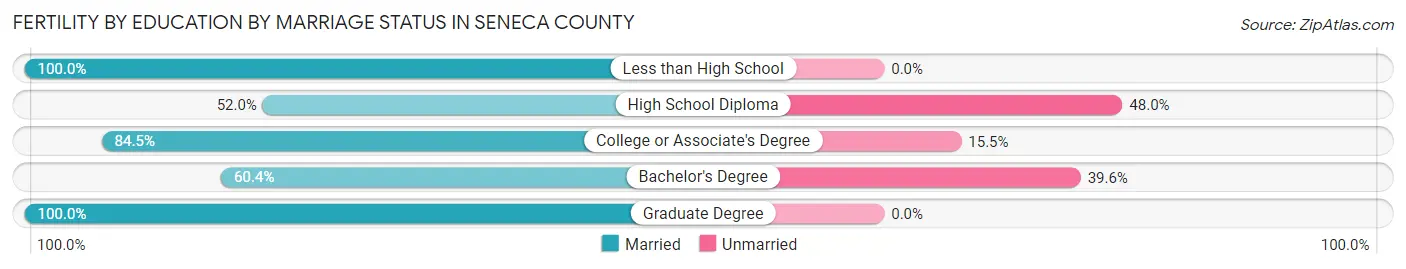
Fertility by Education by Marriage Status in Seneca County
31.0% of women with births in Seneca County are unmarried. Women with the educational attainment of less than high school are most likely to be married with 100.0% of them married at childbirth, while women with the educational attainment of high school diploma are least likely to be married with 48.0% of them unmarried at childbirth.
| Educational Attainment | Married | Unmarried |
| Less than High School | 17 (100.0%) | 0 (0.0%) |
| High School Diploma | 129 (52.0%) | 119 (48.0%) |
| College or Associate's Degree | 174 (84.5%) | 32 (15.5%) |
| Bachelor's Degree | 58 (60.4%) | 38 (39.6%) |
| Graduate Degree | 43 (100.0%) | 0 (0.0%) |
| Total | 421 (69.0%) | 189 (31.0%) |
Income in Seneca County
Income Overview in Seneca County
Per Capita Income in Seneca County is $31,770, while median incomes of families and households are $74,863 and $62,476 respectively.
| Characteristic | Number | Measure |
| Per Capita Income | 55,062 | $31,770 |
| Median Family Income | 13,964 | $74,863 |
| Mean Family Income | 13,964 | $91,781 |
| Median Household Income | 21,910 | $62,476 |
| Mean Household Income | 21,910 | $77,866 |
| Income Deficit | 13,964 | $10,193 |
| Wage / Income Gap (%) | 55,062 | 34.34% |
| Wage / Income Gap ($) | 55,062 | 65.66¢ per $1 |
| Gini / Inequality Index | 55,062 | 0.43 |
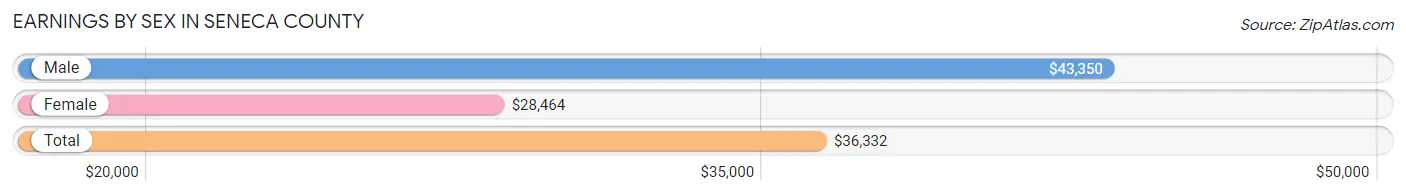
Earnings by Sex in Seneca County
Average Earnings in Seneca County are $36,332, $43,350 for men and $28,464 for women, a difference of 34.3%.
| Sex | Number | Average Earnings |
| Male | 16,219 (53.4%) | $43,350 |
| Female | 14,129 (46.6%) | $28,464 |
| Total | 30,348 (100.0%) | $36,332 |
Earnings by Sex by Income Bracket in Seneca County
The most common earnings brackets in Seneca County are $55,000 to $64,999 for men (1,542 | 9.5%) and $2,499 or less for women (1,244 | 8.8%).
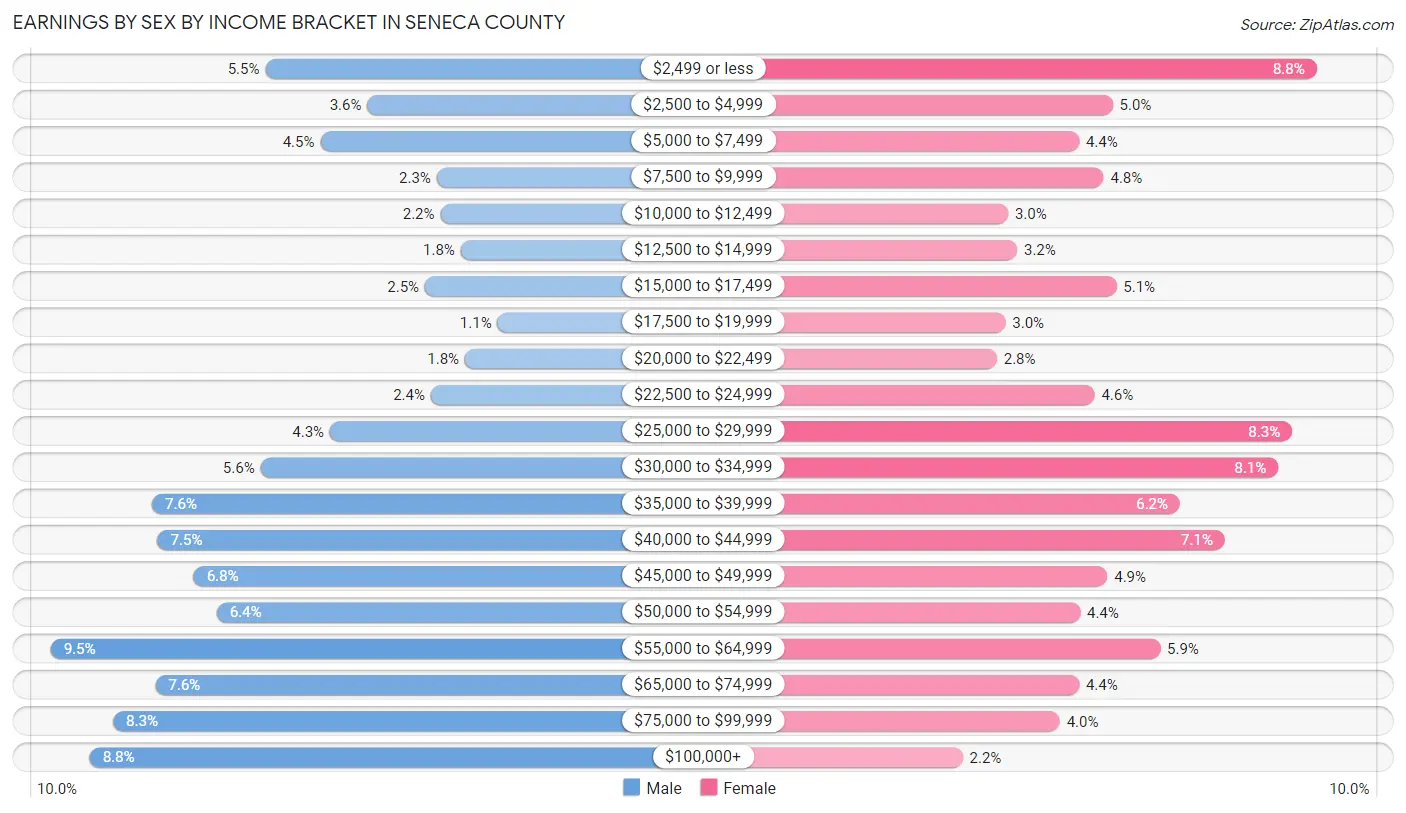
| Income | Male | Female |
| $2,499 or less | 891 (5.5%) | 1,244 (8.8%) |
| $2,500 to $4,999 | 580 (3.6%) | 703 (5.0%) |
| $5,000 to $7,499 | 724 (4.5%) | 615 (4.3%) |
| $7,500 to $9,999 | 370 (2.3%) | 679 (4.8%) |
| $10,000 to $12,499 | 359 (2.2%) | 427 (3.0%) |
| $12,500 to $14,999 | 296 (1.8%) | 451 (3.2%) |
| $15,000 to $17,499 | 405 (2.5%) | 714 (5.1%) |
| $17,500 to $19,999 | 185 (1.1%) | 420 (3.0%) |
| $20,000 to $22,499 | 284 (1.8%) | 397 (2.8%) |
| $22,500 to $24,999 | 387 (2.4%) | 656 (4.6%) |
| $25,000 to $29,999 | 694 (4.3%) | 1,178 (8.3%) |
| $30,000 to $34,999 | 905 (5.6%) | 1,141 (8.1%) |
| $35,000 to $39,999 | 1,234 (7.6%) | 881 (6.2%) |
| $40,000 to $44,999 | 1,218 (7.5%) | 1,001 (7.1%) |
| $45,000 to $49,999 | 1,107 (6.8%) | 689 (4.9%) |
| $50,000 to $54,999 | 1,038 (6.4%) | 618 (4.4%) |
| $55,000 to $64,999 | 1,542 (9.5%) | 830 (5.9%) |
| $65,000 to $74,999 | 1,224 (7.5%) | 615 (4.3%) |
| $75,000 to $99,999 | 1,352 (8.3%) | 564 (4.0%) |
| $100,000+ | 1,424 (8.8%) | 306 (2.2%) |
| Total | 16,219 (100.0%) | 14,129 (100.0%) |
Earnings by Sex by Educational Attainment in Seneca County
Average earnings in Seneca County are $48,023 for men and $33,490 for women, a difference of 30.3%. Men with an educational attainment of graduate degree enjoy the highest average annual earnings of $72,571, while those with less than high school education earn the least with $37,877. Women with an educational attainment of graduate degree earn the most with the average annual earnings of $58,051, while those with high school diploma education have the smallest earnings of $28,198.

| Educational Attainment | Male Income | Female Income |
| Less than High School | $37,877 | $28,884 |
| High School Diploma | $43,723 | $28,198 |
| College or Associate's Degree | $53,640 | $32,122 |
| Bachelor's Degree | $58,409 | $45,735 |
| Graduate Degree | $72,571 | $58,051 |
| Total | $48,023 | $33,490 |
Family Income in Seneca County
Family Income Brackets in Seneca County
According to the Seneca County family income data, there are 3,170 families falling into the $50,000 to $74,999 income range, which is the most common income bracket and makes up 22.7% of all families. Conversely, the $10,000 to $14,999 income bracket is the least frequent group with only 209 families (1.5%) belonging to this category.
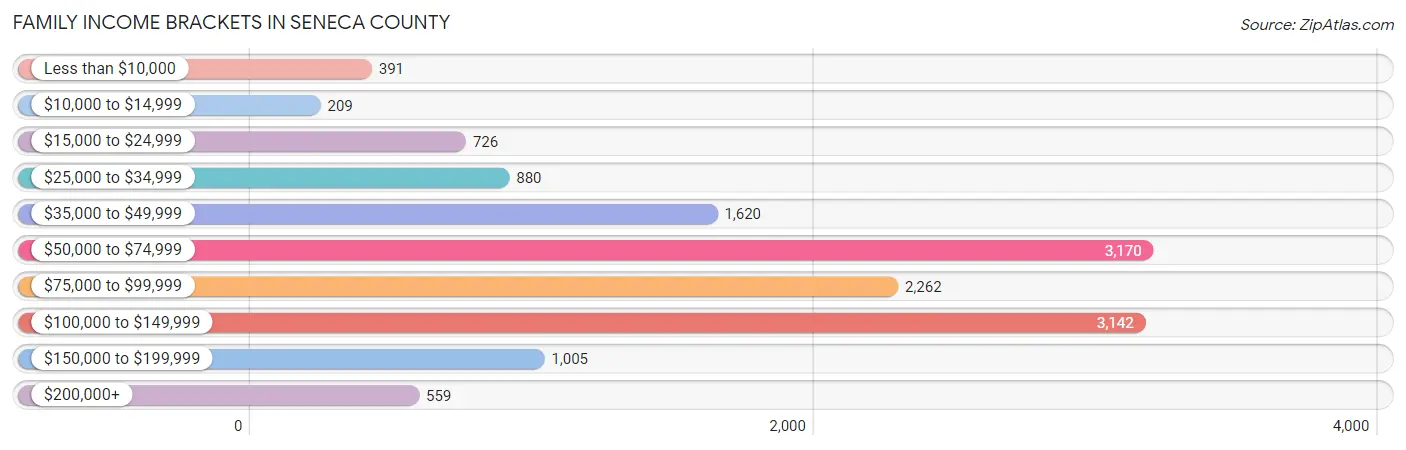
| Income Bracket | # Families | % Families |
| Less than $10,000 | 391 | 2.8% |
| $10,000 to $14,999 | 209 | 1.5% |
| $15,000 to $24,999 | 726 | 5.2% |
| $25,000 to $34,999 | 880 | 6.3% |
| $35,000 to $49,999 | 1,620 | 11.6% |
| $50,000 to $74,999 | 3,170 | 22.7% |
| $75,000 to $99,999 | 2,262 | 16.2% |
| $100,000 to $149,999 | 3,142 | 22.5% |
| $150,000 to $199,999 | 1,005 | 7.2% |
| $200,000+ | 559 | 4.0% |
Family Income by Famaliy Size in Seneca County
6-person families (428 | 3.1%) account for the highest median family income in Seneca County with $103,714 per family, while 2-person families (7,353 | 52.7%) have the highest median income of $33,295 per family member.
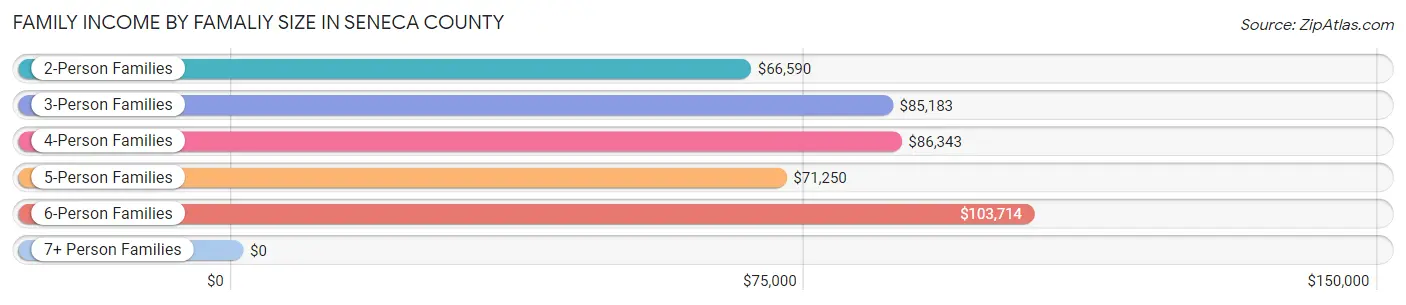
| Income Bracket | # Families | Median Income |
| 2-Person Families | 7,353 (52.7%) | $66,590 |
| 3-Person Families | 2,801 (20.1%) | $85,183 |
| 4-Person Families | 2,272 (16.3%) | $86,343 |
| 5-Person Families | 996 (7.1%) | $71,250 |
| 6-Person Families | 428 (3.1%) | $103,714 |
| 7+ Person Families | 114 (0.8%) | $0 |
| Total | 13,964 (100.0%) | $74,863 |
Family Income by Number of Earners in Seneca County
The median family income in Seneca County is $74,863, with families comprising 3+ earners (1,500) having the highest median family income of $119,665, while families with no earners (2,102) have the lowest median family income of $45,307, accounting for 10.7% and 15.0% of families, respectively.
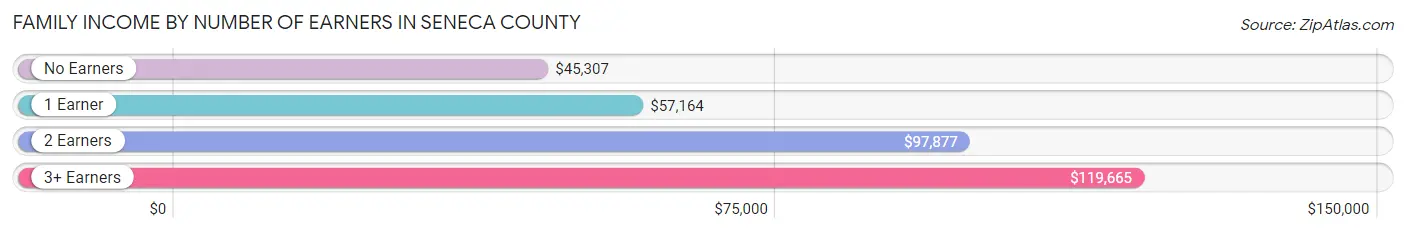
| Number of Earners | # Families | Median Income |
| No Earners | 2,102 (15.0%) | $45,307 |
| 1 Earner | 4,524 (32.4%) | $57,164 |
| 2 Earners | 5,838 (41.8%) | $97,877 |
| 3+ Earners | 1,500 (10.7%) | $119,665 |
| Total | 13,964 (100.0%) | $74,863 |
Household Income in Seneca County
Household Income Brackets in Seneca County
With 4,645 households falling in the category, the $50,000 to $74,999 income range is the most frequent in Seneca County, accounting for 21.2% of all households. In contrast, only 701 households (3.2%) fall into the $200,000+ income bracket, making it the least populous group.
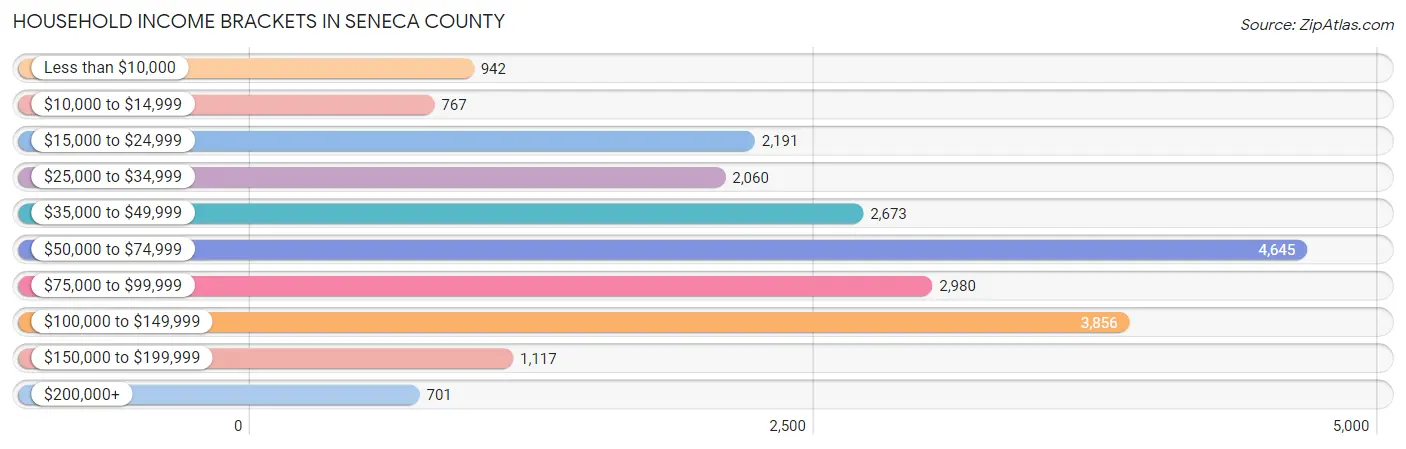
| Income Bracket | # Households | % Households |
| Less than $10,000 | 942 | 4.3% |
| $10,000 to $14,999 | 767 | 3.5% |
| $15,000 to $24,999 | 2,191 | 10.0% |
| $25,000 to $34,999 | 2,060 | 9.4% |
| $35,000 to $49,999 | 2,673 | 12.2% |
| $50,000 to $74,999 | 4,645 | 21.2% |
| $75,000 to $99,999 | 2,980 | 13.6% |
| $100,000 to $149,999 | 3,856 | 17.6% |
| $150,000 to $199,999 | 1,117 | 5.1% |
| $200,000+ | 701 | 3.2% |
Household Income by Householder Age in Seneca County
The median household income in Seneca County is $62,476, with the highest median household income of $73,113 found in the 25 to 44 years age bracket for the primary householder. A total of 6,018 households (27.5%) fall into this category. Meanwhile, the 15 to 24 years age bracket for the primary householder has the lowest median household income of $41,130, with 1,213 households (5.5%) in this group.
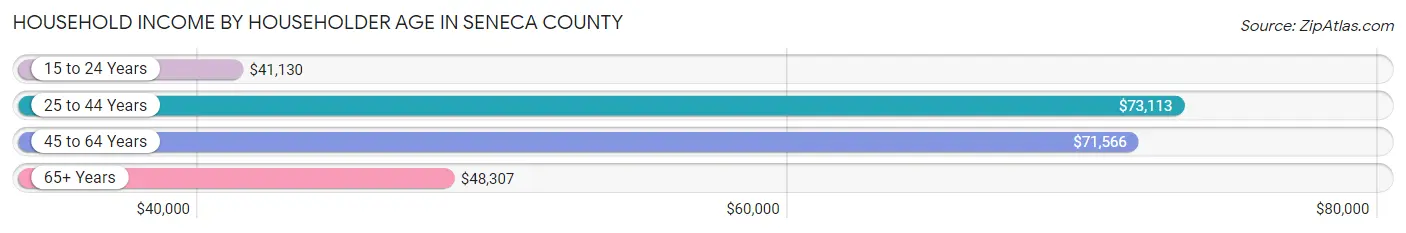
| Income Bracket | # Households | Median Income |
| 15 to 24 Years | 1,213 (5.5%) | $41,130 |
| 25 to 44 Years | 6,018 (27.5%) | $73,113 |
| 45 to 64 Years | 8,399 (38.3%) | $71,566 |
| 65+ Years | 6,280 (28.7%) | $48,307 |
| Total | 21,910 (100.0%) | $62,476 |
Poverty in Seneca County
Income Below Poverty by Sex and Age in Seneca County
With 10.0% poverty level for males and 13.3% for females among the residents of Seneca County, under 5 year old males and 5 year old females are the most vulnerable to poverty, with 445 males (29.5%) and 118 females (38.8%) in their respective age groups living below the poverty level.
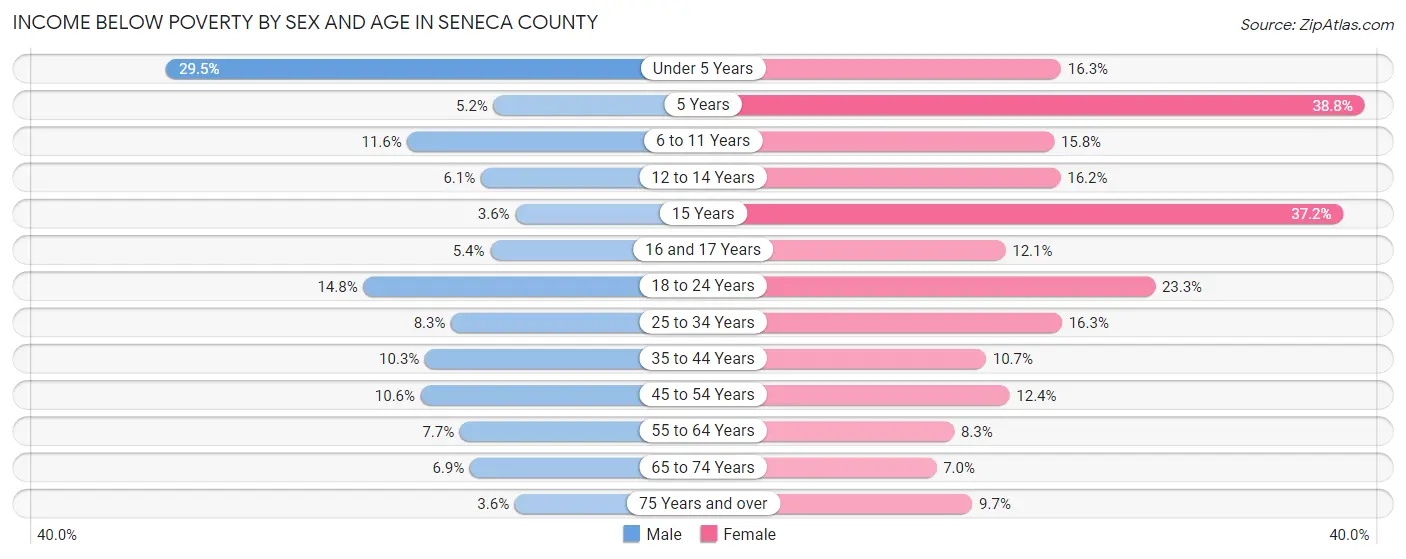
| Age Bracket | Male | Female |
| Under 5 Years | 445 (29.5%) | 228 (16.3%) |
| 5 Years | 15 (5.2%) | 118 (38.8%) |
| 6 to 11 Years | 224 (11.6%) | 278 (15.8%) |
| 12 to 14 Years | 72 (6.1%) | 165 (16.2%) |
| 15 Years | 12 (3.6%) | 105 (37.2%) |
| 16 and 17 Years | 41 (5.4%) | 110 (12.1%) |
| 18 to 24 Years | 305 (14.8%) | 496 (23.3%) |
| 25 to 34 Years | 267 (8.3%) | 488 (16.3%) |
| 35 to 44 Years | 340 (10.3%) | 321 (10.7%) |
| 45 to 54 Years | 344 (10.6%) | 400 (12.4%) |
| 55 to 64 Years | 293 (7.7%) | 321 (8.3%) |
| 65 to 74 Years | 204 (6.9%) | 213 (7.0%) |
| 75 Years and over | 55 (3.6%) | 203 (9.7%) |
| Total | 2,617 (10.0%) | 3,446 (13.3%) |
Income Above Poverty by Sex and Age in Seneca County
According to the poverty statistics in Seneca County, males aged 15 years and females aged 65 to 74 years are the age groups that are most secure financially, with 96.4% of males and 93.0% of females in these age groups living above the poverty line.
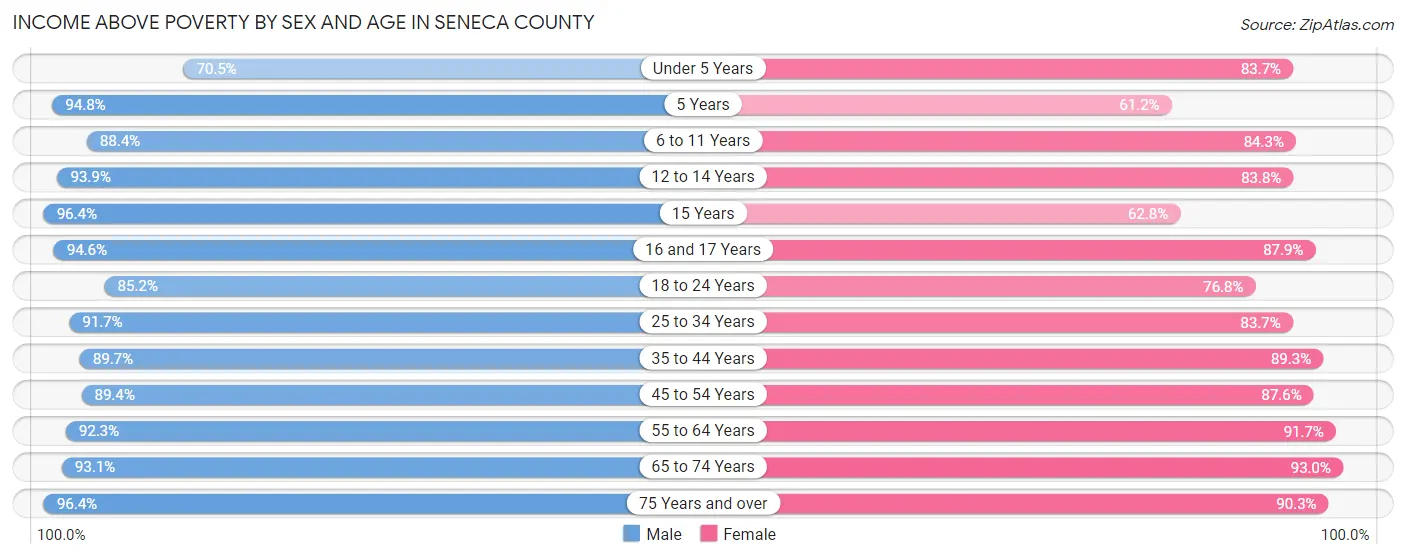
| Age Bracket | Male | Female |
| Under 5 Years | 1,064 (70.5%) | 1,173 (83.7%) |
| 5 Years | 275 (94.8%) | 186 (61.2%) |
| 6 to 11 Years | 1,712 (88.4%) | 1,487 (84.3%) |
| 12 to 14 Years | 1,106 (93.9%) | 852 (83.8%) |
| 15 Years | 325 (96.4%) | 177 (62.8%) |
| 16 and 17 Years | 715 (94.6%) | 796 (87.9%) |
| 18 to 24 Years | 1,750 (85.2%) | 1,637 (76.7%) |
| 25 to 34 Years | 2,942 (91.7%) | 2,501 (83.7%) |
| 35 to 44 Years | 2,975 (89.7%) | 2,682 (89.3%) |
| 45 to 54 Years | 2,908 (89.4%) | 2,816 (87.6%) |
| 55 to 64 Years | 3,529 (92.3%) | 3,532 (91.7%) |
| 65 to 74 Years | 2,741 (93.1%) | 2,824 (93.0%) |
| 75 Years and over | 1,478 (96.4%) | 1,894 (90.3%) |
| Total | 23,520 (90.0%) | 22,557 (86.8%) |
Income Below Poverty Among Married-Couple Families in Seneca County
The poverty statistics for married-couple families in Seneca County show that 3.3% or 341 of the total 10,256 families live below the poverty line. Families with 3 or 4 children have the highest poverty rate of 4.1%, comprising of 37 families. On the other hand, families with 5 or more children have the lowest poverty rate of 0.0%, which includes 0 families.

| Children | Above Poverty | Below Poverty |
| No Children | 6,116 (97.0%) | 189 (3.0%) |
| 1 or 2 Children | 2,880 (96.2%) | 115 (3.8%) |
| 3 or 4 Children | 869 (95.9%) | 37 (4.1%) |
| 5 or more Children | 50 (100.0%) | 0 (0.0%) |
| Total | 9,915 (96.7%) | 341 (3.3%) |
Income Below Poverty Among Single-Parent Households in Seneca County
According to the poverty data in Seneca County, 13.4% or 163 single-father households and 29.3% or 730 single-mother households are living below the poverty line. Among single-father households, those with 3 or 4 children have the highest poverty rate, with 63 households (51.2%) experiencing poverty. Likewise, among single-mother households, those with 3 or 4 children have the highest poverty rate, with 173 households (57.9%) falling below the poverty line.
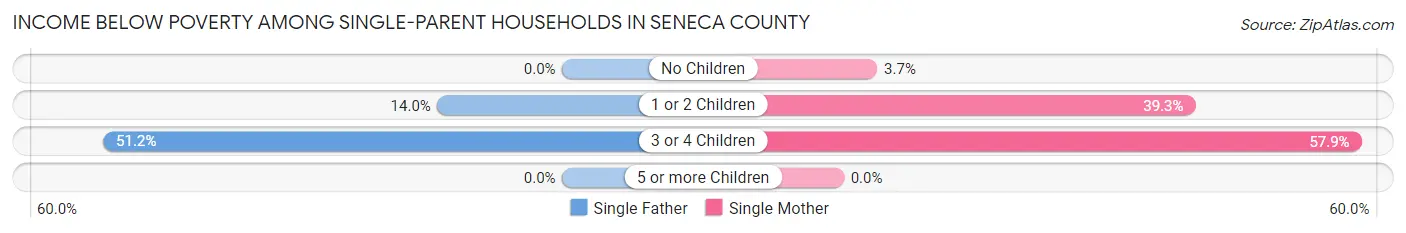
| Children | Single Father | Single Mother |
| No Children | 0 (0.0%) | 32 (3.7%) |
| 1 or 2 Children | 100 (14.0%) | 525 (39.3%) |
| 3 or 4 Children | 63 (51.2%) | 173 (57.9%) |
| 5 or more Children | 0 (0.0%) | 0 (0.0%) |
| Total | 163 (13.4%) | 730 (29.3%) |
Income Below Poverty Among Married-Couple vs Single-Parent Households in Seneca County
The poverty data for Seneca County shows that 341 of the married-couple family households (3.3%) and 893 of the single-parent households (24.1%) are living below the poverty level. Within the married-couple family households, those with 3 or 4 children have the highest poverty rate, with 37 households (4.1%) falling below the poverty line. Among the single-parent households, those with 3 or 4 children have the highest poverty rate, with 236 household (55.9%) living below poverty.
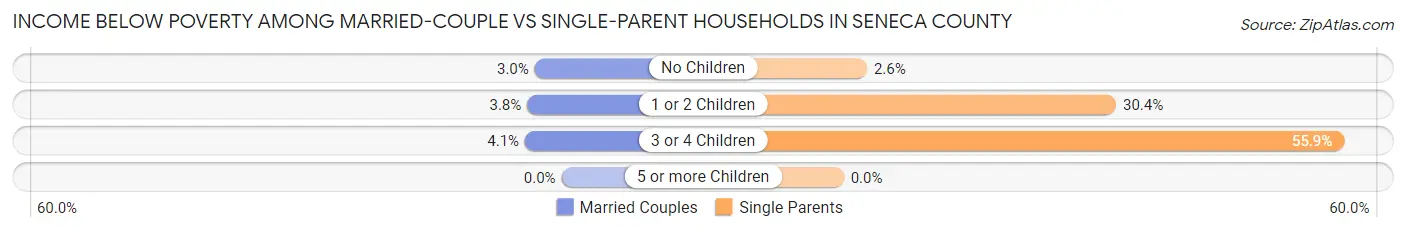
| Children | Married-Couple Families | Single-Parent Households |
| No Children | 189 (3.0%) | 32 (2.6%) |
| 1 or 2 Children | 115 (3.8%) | 625 (30.4%) |
| 3 or 4 Children | 37 (4.1%) | 236 (55.9%) |
| 5 or more Children | 0 (0.0%) | 0 (0.0%) |
| Total | 341 (3.3%) | 893 (24.1%) |
Employment Characteristics in Seneca County
Employment by Class of Employer in Seneca County
Among the 26,313 employed individuals in Seneca County, private company employees (18,994 | 72.2%), not-for-profit organizations (2,483 | 9.4%), and local government employees (1,939 | 7.4%) make up the most common classes of employment.

| Employer Class | # Employees | % Employees |
| Private Company Employees | 18,994 | 72.2% |
| Self-Employed (Incorporated) | 880 | 3.3% |
| Self-Employed (Not Incorporated) | 1,311 | 5.0% |
| Not-for-profit Organizations | 2,483 | 9.4% |
| Local Government Employees | 1,939 | 7.4% |
| State Government Employees | 520 | 2.0% |
| Federal Government Employees | 178 | 0.7% |
| Unpaid Family Workers | 8 | 0.0% |
| Total | 26,313 | 100.0% |
Employment Status by Age in Seneca County
According to the labor force statistics for Seneca County, out of the total population over 16 years of age (44,839), 62.6% or 28,069 individuals are in the labor force, with 4.2% or 1,179 of them unemployed. The age group with the highest labor force participation rate is 30 to 34 years, with 88.9% or 2,696 individuals in the labor force. Within the labor force, the 16 to 19 years age range has the highest percentage of unemployed individuals, with 20.9% or 374 of them being unemployed.
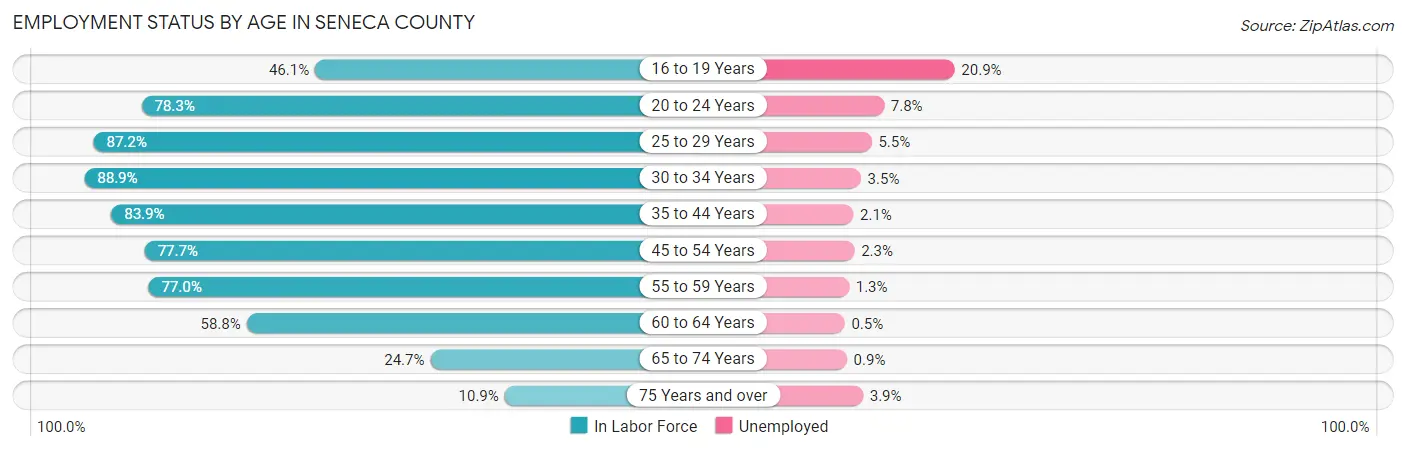
| Age Bracket | In Labor Force | Unemployed |
| 16 to 19 Years | 1,789 (46.1%) | 374 (20.9%) |
| 20 to 24 Years | 3,034 (78.3%) | 237 (7.8%) |
| 25 to 29 Years | 2,858 (87.2%) | 157 (5.5%) |
| 30 to 34 Years | 2,696 (88.9%) | 94 (3.5%) |
| 35 to 44 Years | 5,374 (83.9%) | 113 (2.1%) |
| 45 to 54 Years | 5,080 (77.7%) | 117 (2.3%) |
| 55 to 59 Years | 3,081 (77.0%) | 40 (1.3%) |
| 60 to 64 Years | 2,209 (58.8%) | 11 (0.5%) |
| 65 to 74 Years | 1,493 (24.7%) | 13 (0.9%) |
| 75 Years and over | 439 (10.9%) | 17 (3.9%) |
| Total | 28,069 (62.6%) | 1,179 (4.2%) |
Employment Status by Educational Attainment in Seneca County
According to labor force statistics for Seneca County, 78.8% of individuals (21,284) out of the total population between 25 and 64 years of age (27,010) are in the labor force, with 2.5% or 532 of them being unemployed. The group with the highest labor force participation rate are those with the educational attainment of bachelor's degree or higher, with 89.2% or 4,505 individuals in the labor force. Within the labor force, individuals with college / associate degree education have the highest percentage of unemployment, with 3.2% or 241 of them being unemployed.
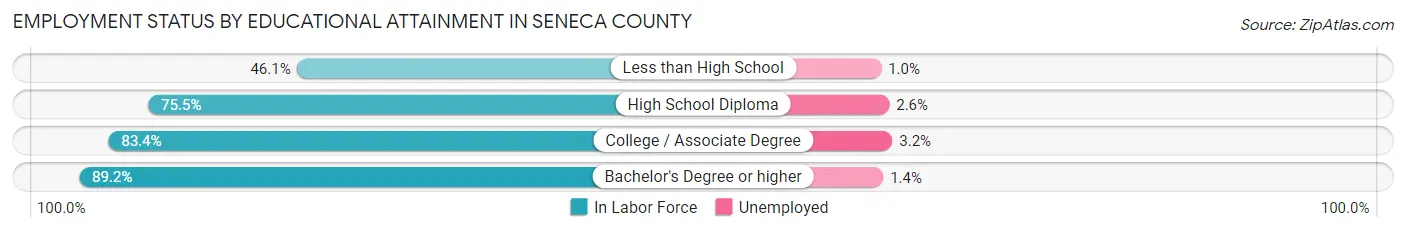
| Educational Attainment | In Labor Force | Unemployed |
| Less than High School | 798 (46.1%) | 17 (1.0%) |
| High School Diploma | 8,463 (75.5%) | 291 (2.6%) |
| College / Associate Degree | 7,522 (83.4%) | 289 (3.2%) |
| Bachelor's Degree or higher | 4,505 (89.2%) | 71 (1.4%) |
| Total | 21,284 (78.8%) | 675 (2.5%) |
Employment Occupations by Sex in Seneca County
Management, Business, Science and Arts Occupations
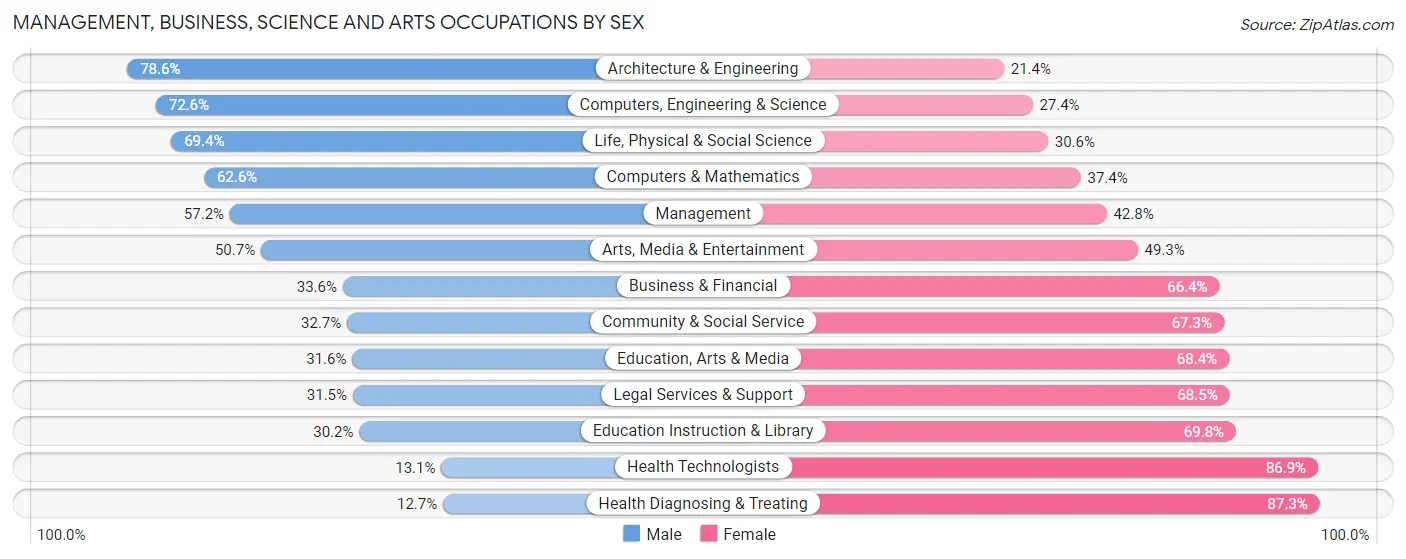
The most common Management, Business, Science and Arts occupations in Seneca County are Community & Social Service (2,158 | 8.0%), Management (2,141 | 8.0%), Health Diagnosing & Treating (1,486 | 5.5%), Education Instruction & Library (1,226 | 4.6%), and Computers, Engineering & Science (1,136 | 4.2%).

Management, Business, Science and Arts Occupations by Sex
Within the Management, Business, Science and Arts occupations in Seneca County, the most male-oriented occupations are Architecture & Engineering (78.6%), Computers, Engineering & Science (72.6%), and Life, Physical & Social Science (69.4%), while the most female-oriented occupations are Health Diagnosing & Treating (87.3%), Health Technologists (86.9%), and Education Instruction & Library (69.8%).
| Occupation | Male | Female |
| Management | 1,224 (57.2%) | 917 (42.8%) |
| Business & Financial | 271 (33.6%) | 535 (66.4%) |
| Computers, Engineering & Science | 825 (72.6%) | 311 (27.4%) |
| Computers & Mathematics | 204 (62.6%) | 122 (37.4%) |
| Architecture & Engineering | 503 (78.6%) | 137 (21.4%) |
| Life, Physical & Social Science | 118 (69.4%) | 52 (30.6%) |
| Community & Social Service | 706 (32.7%) | 1,452 (67.3%) |
| Education, Arts & Media | 174 (31.6%) | 376 (68.4%) |
| Legal Services & Support | 52 (31.5%) | 113 (68.5%) |
| Education Instruction & Library | 370 (30.2%) | 856 (69.8%) |
| Arts, Media & Entertainment | 110 (50.7%) | 107 (49.3%) |
| Health Diagnosing & Treating | 189 (12.7%) | 1,297 (87.3%) |
| Health Technologists | 123 (13.1%) | 818 (86.9%) |
| Total (Category) | 3,215 (41.6%) | 4,512 (58.4%) |
| Total (Overall) | 14,363 (53.4%) | 12,515 (46.6%) |
Services Occupations
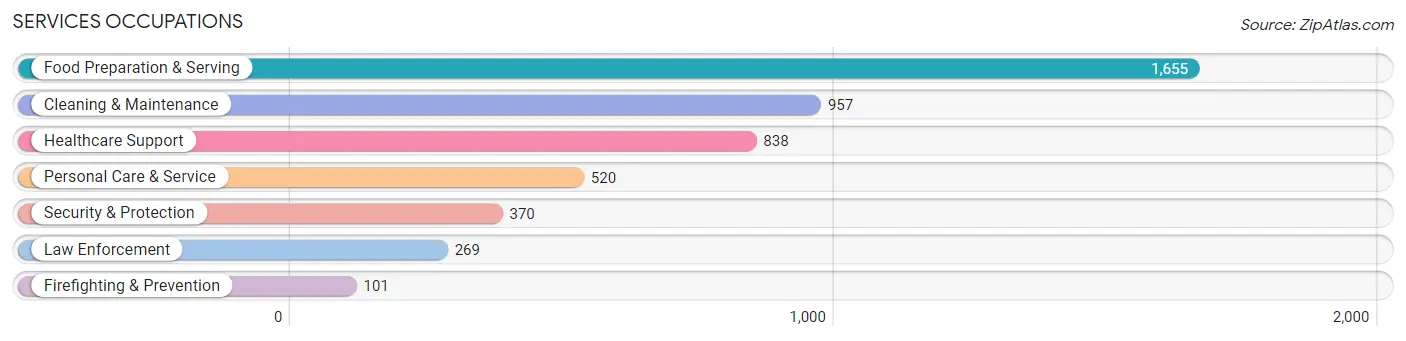
The most common Services occupations in Seneca County are Food Preparation & Serving (1,655 | 6.2%), Cleaning & Maintenance (957 | 3.6%), Healthcare Support (838 | 3.1%), Personal Care & Service (520 | 1.9%), and Security & Protection (370 | 1.4%).
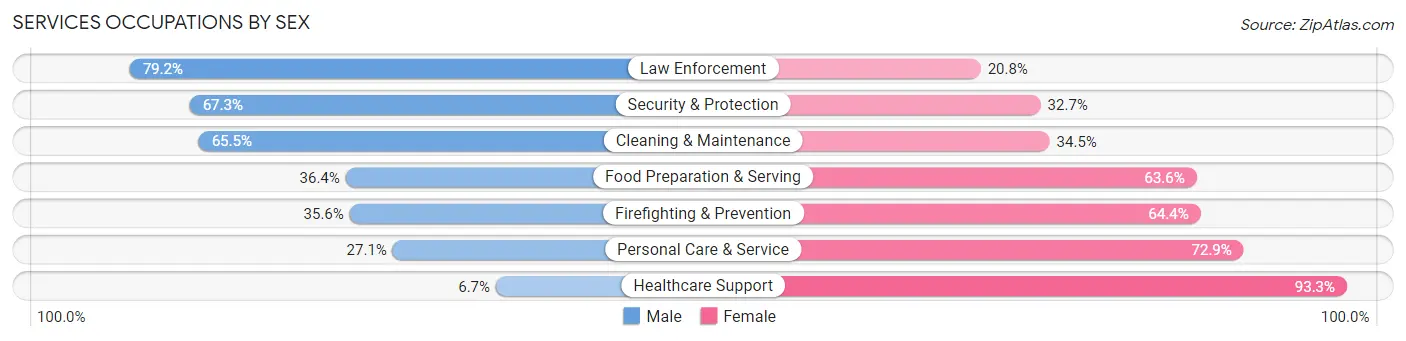
Services Occupations by Sex
Within the Services occupations in Seneca County, the most male-oriented occupations are Law Enforcement (79.2%), Security & Protection (67.3%), and Cleaning & Maintenance (65.5%), while the most female-oriented occupations are Healthcare Support (93.3%), Personal Care & Service (72.9%), and Firefighting & Prevention (64.4%).
| Occupation | Male | Female |
| Healthcare Support | 56 (6.7%) | 782 (93.3%) |
| Security & Protection | 249 (67.3%) | 121 (32.7%) |
| Firefighting & Prevention | 36 (35.6%) | 65 (64.4%) |
| Law Enforcement | 213 (79.2%) | 56 (20.8%) |
| Food Preparation & Serving | 603 (36.4%) | 1,052 (63.6%) |
| Cleaning & Maintenance | 627 (65.5%) | 330 (34.5%) |
| Personal Care & Service | 141 (27.1%) | 379 (72.9%) |
| Total (Category) | 1,676 (38.6%) | 2,664 (61.4%) |
| Total (Overall) | 14,363 (53.4%) | 12,515 (46.6%) |
Sales and Office Occupations
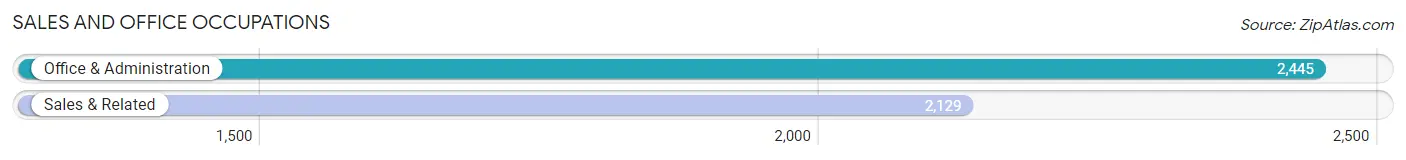
The most common Sales and Office occupations in Seneca County are Office & Administration (2,445 | 9.1%), and Sales & Related (2,129 | 7.9%).
Sales and Office Occupations by Sex

| Occupation | Male | Female |
| Sales & Related | 883 (41.5%) | 1,246 (58.5%) |
| Office & Administration | 553 (22.6%) | 1,892 (77.4%) |
| Total (Category) | 1,436 (31.4%) | 3,138 (68.6%) |
| Total (Overall) | 14,363 (53.4%) | 12,515 (46.6%) |
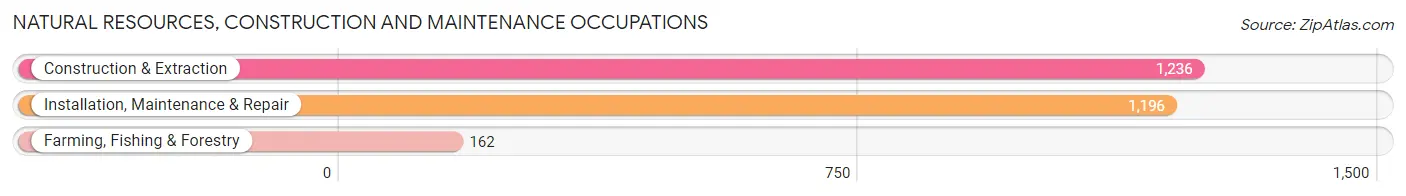
Natural Resources, Construction and Maintenance Occupations
The most common Natural Resources, Construction and Maintenance occupations in Seneca County are Construction & Extraction (1,236 | 4.6%), Installation, Maintenance & Repair (1,196 | 4.4%), and Farming, Fishing & Forestry (162 | 0.6%).
Natural Resources, Construction and Maintenance Occupations by Sex

| Occupation | Male | Female |
| Farming, Fishing & Forestry | 94 (58.0%) | 68 (42.0%) |
| Construction & Extraction | 1,226 (99.2%) | 10 (0.8%) |
| Installation, Maintenance & Repair | 1,183 (98.9%) | 13 (1.1%) |
| Total (Category) | 2,503 (96.5%) | 91 (3.5%) |
| Total (Overall) | 14,363 (53.4%) | 12,515 (46.6%) |
Production, Transportation and Moving Occupations
The most common Production, Transportation and Moving occupations in Seneca County are Production (4,476 | 16.7%), Material Moving (1,990 | 7.4%), and Transportation (1,177 | 4.4%).

Production, Transportation and Moving Occupations by Sex
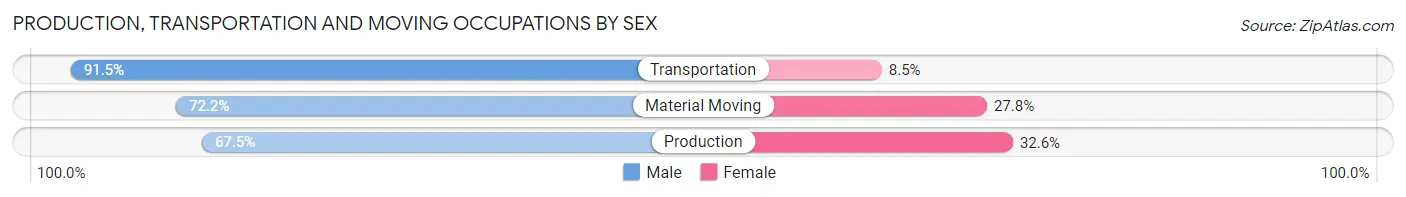
| Occupation | Male | Female |
| Production | 3,019 (67.4%) | 1,457 (32.6%) |
| Transportation | 1,077 (91.5%) | 100 (8.5%) |
| Material Moving | 1,437 (72.2%) | 553 (27.8%) |
| Total (Category) | 5,533 (72.4%) | 2,110 (27.6%) |
| Total (Overall) | 14,363 (53.4%) | 12,515 (46.6%) |
Employment Industries by Sex in Seneca County
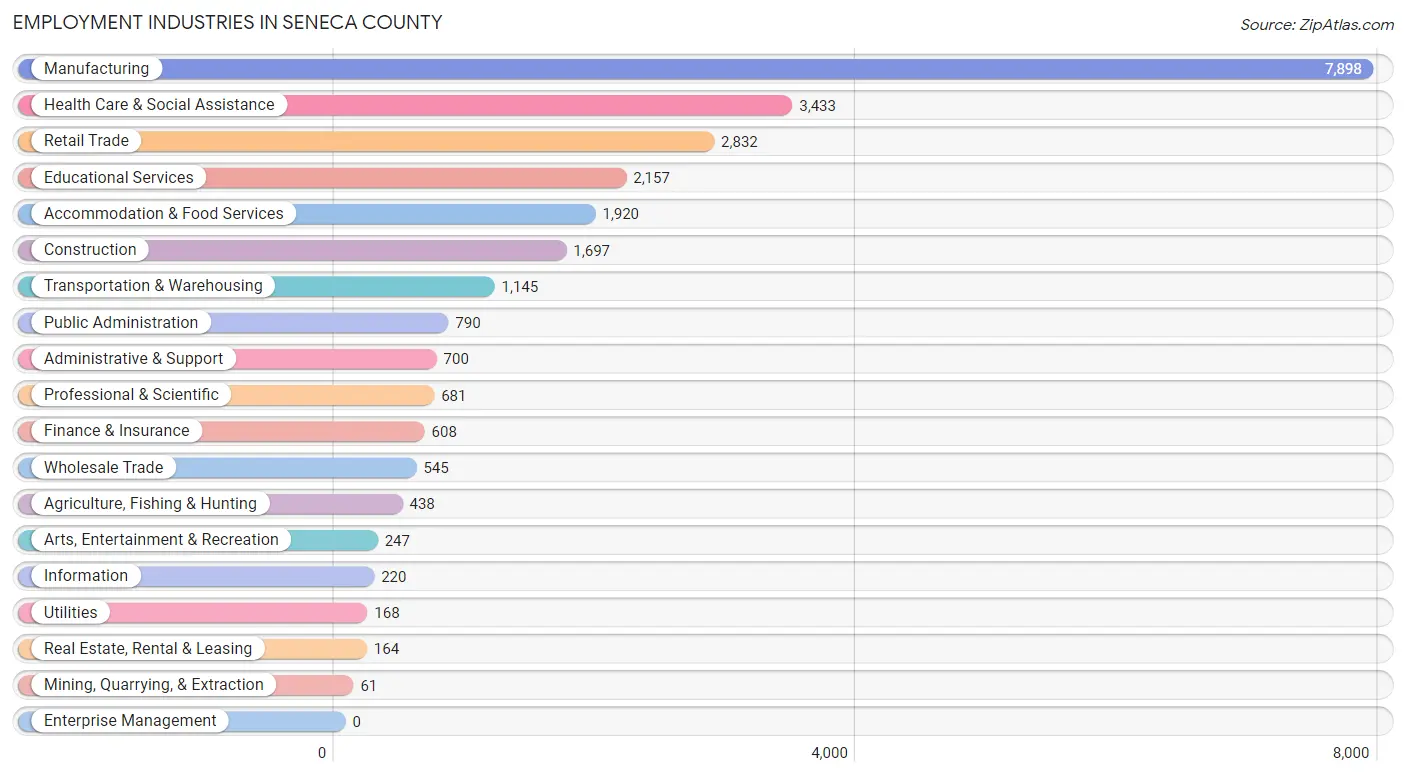
Employment Industries in Seneca County
The major employment industries in Seneca County include Manufacturing (7,898 | 29.4%), Health Care & Social Assistance (3,433 | 12.8%), Retail Trade (2,832 | 10.5%), Educational Services (2,157 | 8.0%), and Accommodation & Food Services (1,920 | 7.1%).
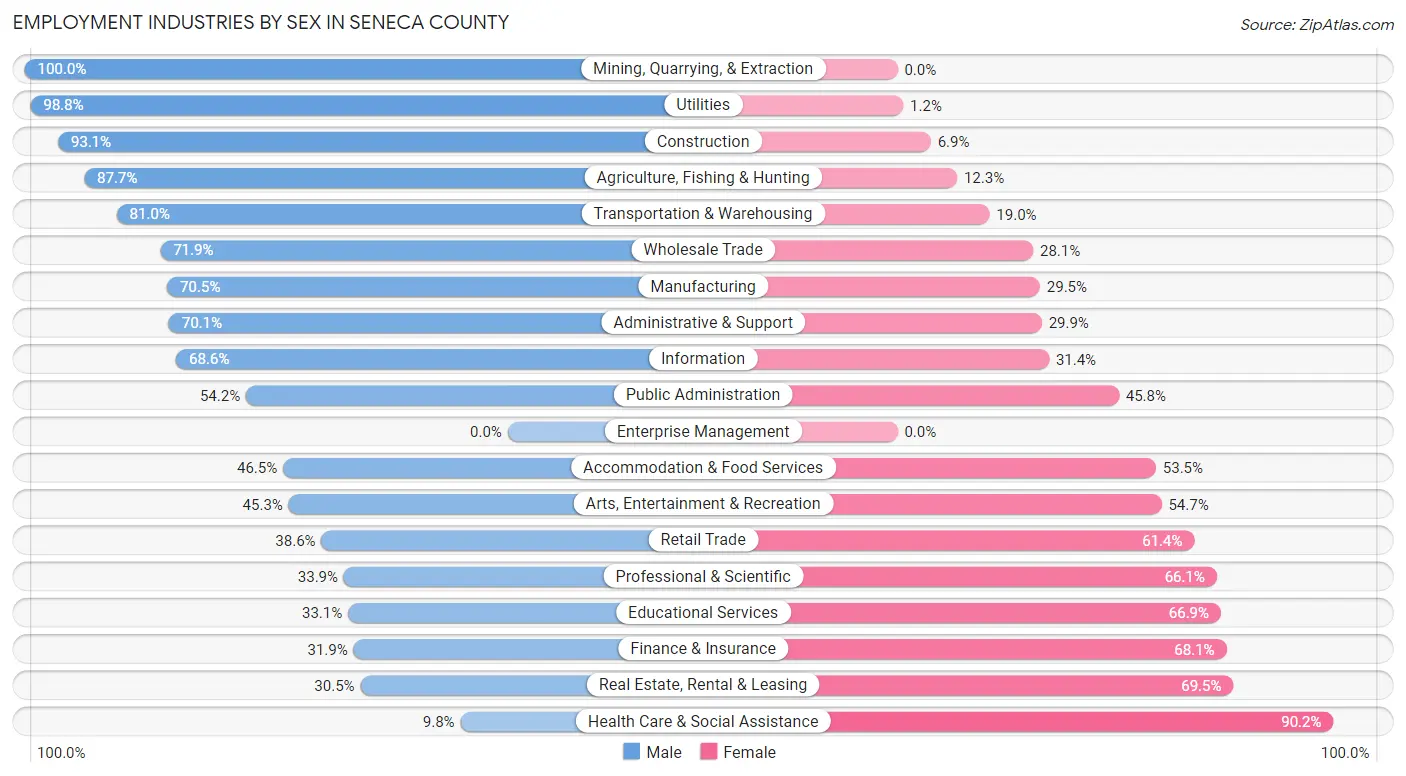
Employment Industries by Sex in Seneca County
The Seneca County industries that see more men than women are Mining, Quarrying, & Extraction (100.0%), Utilities (98.8%), and Construction (93.1%), whereas the industries that tend to have a higher number of women are Health Care & Social Assistance (90.2%), Real Estate, Rental & Leasing (69.5%), and Finance & Insurance (68.1%).
| Industry | Male | Female |
| Agriculture, Fishing & Hunting | 384 (87.7%) | 54 (12.3%) |
| Mining, Quarrying, & Extraction | 61 (100.0%) | 0 (0.0%) |
| Construction | 1,580 (93.1%) | 117 (6.9%) |
| Manufacturing | 5,570 (70.5%) | 2,328 (29.5%) |
| Wholesale Trade | 392 (71.9%) | 153 (28.1%) |
| Retail Trade | 1,092 (38.6%) | 1,740 (61.4%) |
| Transportation & Warehousing | 927 (81.0%) | 218 (19.0%) |
| Utilities | 166 (98.8%) | 2 (1.2%) |
| Information | 151 (68.6%) | 69 (31.4%) |
| Finance & Insurance | 194 (31.9%) | 414 (68.1%) |
| Real Estate, Rental & Leasing | 50 (30.5%) | 114 (69.5%) |
| Professional & Scientific | 231 (33.9%) | 450 (66.1%) |
| Enterprise Management | 0 (0.0%) | 0 (0.0%) |
| Administrative & Support | 491 (70.1%) | 209 (29.9%) |
| Educational Services | 713 (33.1%) | 1,444 (66.9%) |
| Health Care & Social Assistance | 336 (9.8%) | 3,097 (90.2%) |
| Arts, Entertainment & Recreation | 112 (45.3%) | 135 (54.7%) |
| Accommodation & Food Services | 893 (46.5%) | 1,027 (53.5%) |
| Public Administration | 428 (54.2%) | 362 (45.8%) |
| Total | 14,363 (53.4%) | 12,515 (46.6%) |
Education in Seneca County
School Enrollment in Seneca County
The most common levels of schooling among the 13,532 students in Seneca County are college / undergraduate (3,395 | 25.1%), middle school (2,823 | 20.9%), and high school (2,767 | 20.4%).
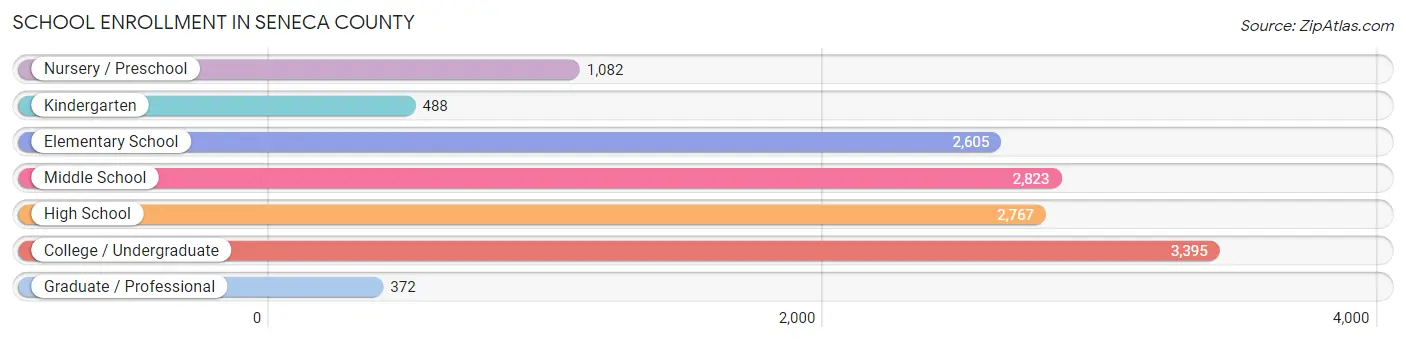
| School Level | # Students | % Students |
| Nursery / Preschool | 1,082 | 8.0% |
| Kindergarten | 488 | 3.6% |
| Elementary School | 2,605 | 19.3% |
| Middle School | 2,823 | 20.9% |
| High School | 2,767 | 20.4% |
| College / Undergraduate | 3,395 | 25.1% |
| Graduate / Professional | 372 | 2.8% |
| Total | 13,532 | 100.0% |
School Enrollment by Age by Funding Source in Seneca County
Out of a total of 13,532 students who are enrolled in schools in Seneca County, 3,464 (25.6%) attend a private institution, while the remaining 10,068 (74.4%) are enrolled in public schools. The age group of 18 to 19 year olds has the highest likelihood of being enrolled in private schools, with 1,433 (75.1% in the age bracket) enrolled. Conversely, the age group of 15 to 17 year olds has the lowest likelihood of being enrolled in a private school, with 2,075 (93.8% in the age bracket) attending a public institution.

| Age Bracket | Public School | Private School |
| 3 to 4 Year Olds | 619 (84.1%) | 117 (15.9%) |
| 5 to 9 Year Old | 2,655 (86.3%) | 422 (13.7%) |
| 10 to 14 Year Olds | 2,968 (89.4%) | 352 (10.6%) |
| 15 to 17 Year Olds | 2,075 (93.8%) | 137 (6.2%) |
| 18 to 19 Year Olds | 475 (24.9%) | 1,433 (75.1%) |
| 20 to 24 Year Olds | 461 (40.3%) | 684 (59.7%) |
| 25 to 34 Year Olds | 311 (62.6%) | 186 (37.4%) |
| 35 Years and over | 498 (78.2%) | 139 (21.8%) |
| Total | 10,068 (74.4%) | 3,464 (25.6%) |
Educational Attainment by Field of Study in Seneca County
Education (1,525 | 19.7%), business (1,410 | 18.2%), science & technology (933 | 12.1%), bio, nature & agricultural (569 | 7.4%), and arts & humanities (560 | 7.2%) are the most common fields of study among 7,736 individuals in Seneca County who have obtained a bachelor's degree or higher.

| Field of Study | # Graduates | % Graduates |
| Computers & Mathematics | 232 | 3.0% |
| Bio, Nature & Agricultural | 569 | 7.4% |
| Physical & Health Sciences | 336 | 4.3% |
| Psychology | 437 | 5.7% |
| Social Sciences | 304 | 3.9% |
| Engineering | 249 | 3.2% |
| Multidisciplinary Studies | 76 | 1.0% |
| Science & Technology | 933 | 12.1% |
| Business | 1,410 | 18.2% |
| Education | 1,525 | 19.7% |
| Literature & Languages | 201 | 2.6% |
| Liberal Arts & History | 431 | 5.6% |
| Visual & Performing Arts | 235 | 3.0% |
| Communications | 238 | 3.1% |
| Arts & Humanities | 560 | 7.2% |
| Total | 7,736 | 100.0% |
Transportation & Commute in Seneca County
Vehicle Availability by Sex in Seneca County
The most prevalent vehicle ownership categories in Seneca County are males with 2 vehicles (5,641, accounting for 40.9%) and females with 2 vehicles (5,009, making up 47.5%).
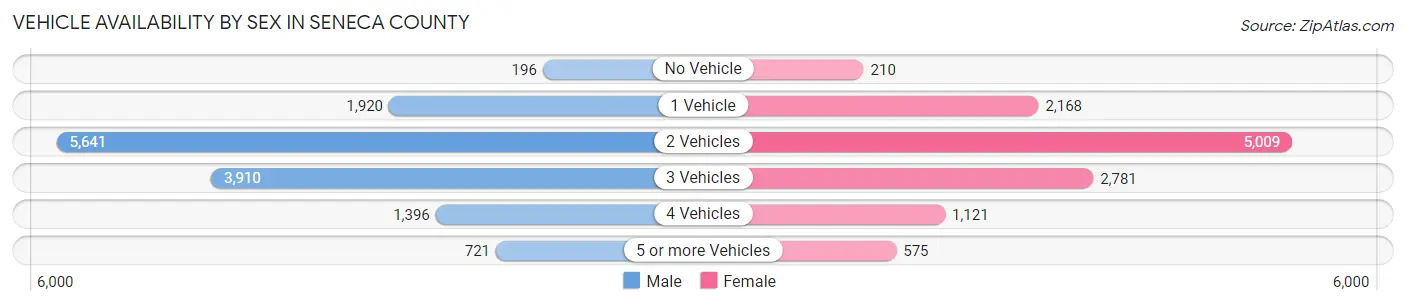
| Vehicles Available | Male | Female |
| No Vehicle | 196 (1.4%) | 210 (1.8%) |
| 1 Vehicle | 1,920 (13.9%) | 2,168 (18.3%) |
| 2 Vehicles | 5,641 (40.9%) | 5,009 (42.2%) |
| 3 Vehicles | 3,910 (28.4%) | 2,781 (23.4%) |
| 4 Vehicles | 1,396 (10.1%) | 1,121 (9.5%) |
| 5 or more Vehicles | 721 (5.2%) | 575 (4.9%) |
| Total | 13,784 (100.0%) | 11,864 (100.0%) |
Commute Time in Seneca County
The most frequently occuring commute durations in Seneca County are 10 to 14 minutes (4,621 commuters, 18.4%), 5 to 9 minutes (4,410 commuters, 17.6%), and 20 to 24 minutes (3,072 commuters, 12.3%).
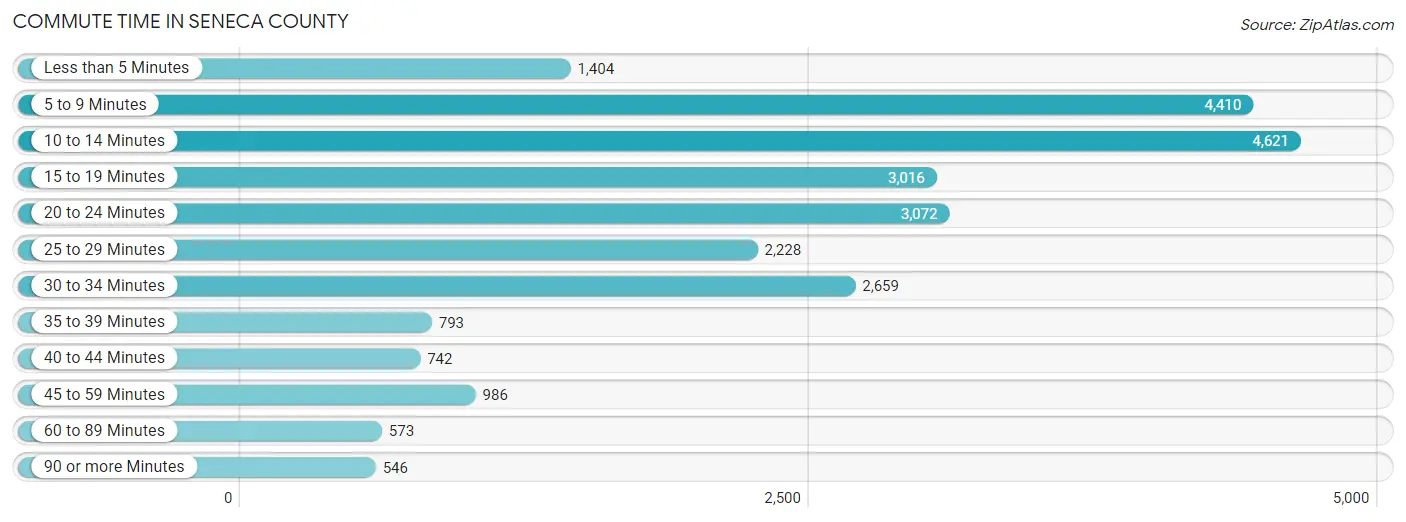
| Commute Time | # Commuters | % Commuters |
| Less than 5 Minutes | 1,404 | 5.6% |
| 5 to 9 Minutes | 4,410 | 17.6% |
| 10 to 14 Minutes | 4,621 | 18.4% |
| 15 to 19 Minutes | 3,016 | 12.0% |
| 20 to 24 Minutes | 3,072 | 12.3% |
| 25 to 29 Minutes | 2,228 | 8.9% |
| 30 to 34 Minutes | 2,659 | 10.6% |
| 35 to 39 Minutes | 793 | 3.2% |
| 40 to 44 Minutes | 742 | 3.0% |
| 45 to 59 Minutes | 986 | 3.9% |
| 60 to 89 Minutes | 573 | 2.3% |
| 90 or more Minutes | 546 | 2.2% |
Commute Time by Sex in Seneca County
The most common commute times in Seneca County are 10 to 14 minutes (2,280 commuters, 16.8%) for males and 10 to 14 minutes (2,341 commuters, 20.4%) for females.
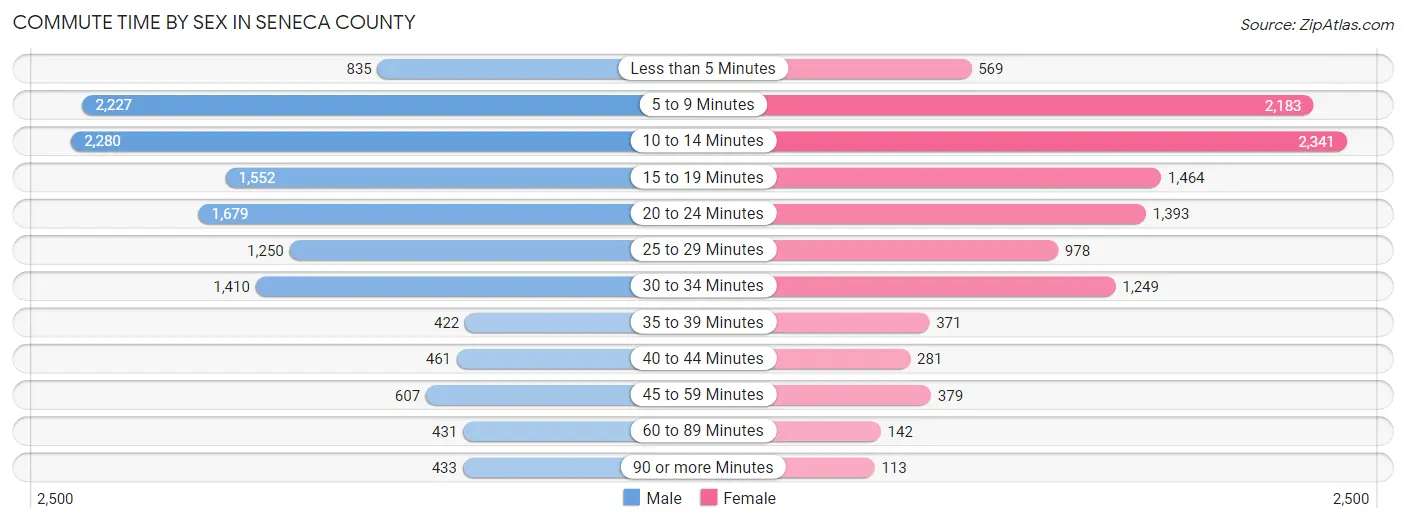
| Commute Time | Male | Female |
| Less than 5 Minutes | 835 (6.1%) | 569 (5.0%) |
| 5 to 9 Minutes | 2,227 (16.4%) | 2,183 (19.0%) |
| 10 to 14 Minutes | 2,280 (16.8%) | 2,341 (20.4%) |
| 15 to 19 Minutes | 1,552 (11.4%) | 1,464 (12.8%) |
| 20 to 24 Minutes | 1,679 (12.4%) | 1,393 (12.1%) |
| 25 to 29 Minutes | 1,250 (9.2%) | 978 (8.5%) |
| 30 to 34 Minutes | 1,410 (10.4%) | 1,249 (10.9%) |
| 35 to 39 Minutes | 422 (3.1%) | 371 (3.2%) |
| 40 to 44 Minutes | 461 (3.4%) | 281 (2.5%) |
| 45 to 59 Minutes | 607 (4.5%) | 379 (3.3%) |
| 60 to 89 Minutes | 431 (3.2%) | 142 (1.2%) |
| 90 or more Minutes | 433 (3.2%) | 113 (1.0%) |
Time of Departure to Work by Sex in Seneca County
The most frequent times of departure to work in Seneca County are 4:00 PM to 11:59 PM (1,837, 13.5%) for males and 7:30 AM to 7:59 AM (1,678, 14.6%) for females.
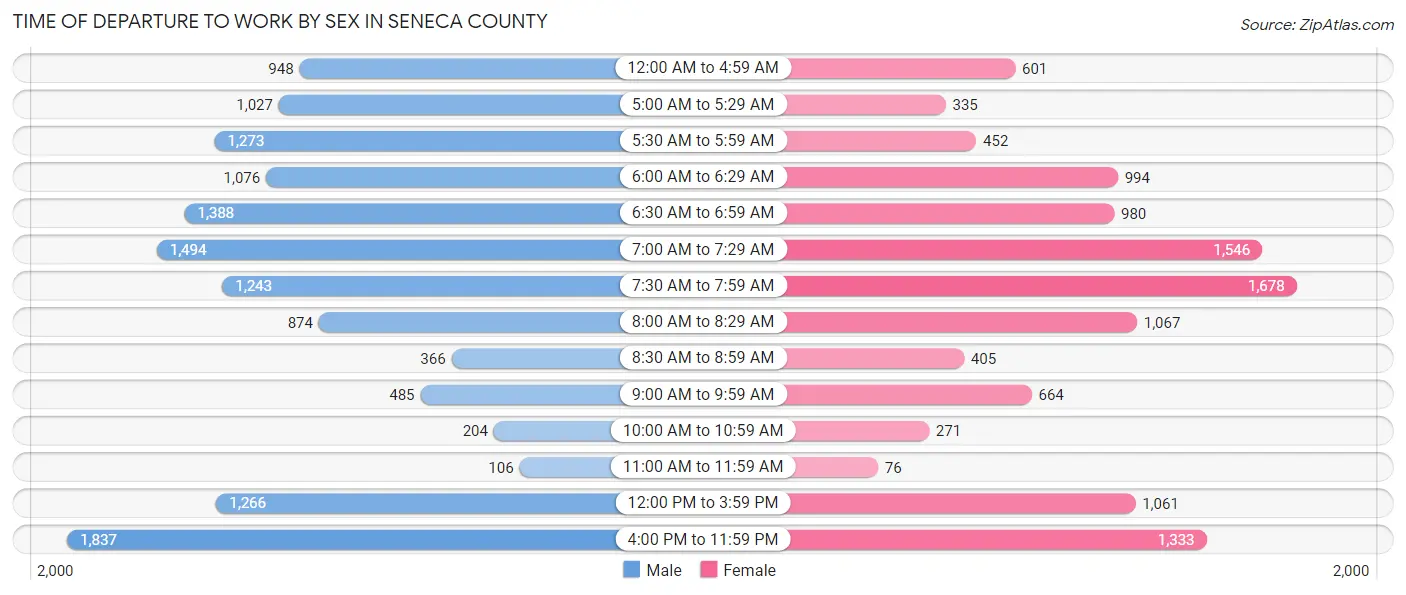
| Time of Departure | Male | Female |
| 12:00 AM to 4:59 AM | 948 (7.0%) | 601 (5.2%) |
| 5:00 AM to 5:29 AM | 1,027 (7.6%) | 335 (2.9%) |
| 5:30 AM to 5:59 AM | 1,273 (9.4%) | 452 (3.9%) |
| 6:00 AM to 6:29 AM | 1,076 (7.9%) | 994 (8.7%) |
| 6:30 AM to 6:59 AM | 1,388 (10.2%) | 980 (8.6%) |
| 7:00 AM to 7:29 AM | 1,494 (11.0%) | 1,546 (13.5%) |
| 7:30 AM to 7:59 AM | 1,243 (9.1%) | 1,678 (14.6%) |
| 8:00 AM to 8:29 AM | 874 (6.4%) | 1,067 (9.3%) |
| 8:30 AM to 8:59 AM | 366 (2.7%) | 405 (3.5%) |
| 9:00 AM to 9:59 AM | 485 (3.6%) | 664 (5.8%) |
| 10:00 AM to 10:59 AM | 204 (1.5%) | 271 (2.4%) |
| 11:00 AM to 11:59 AM | 106 (0.8%) | 76 (0.7%) |
| 12:00 PM to 3:59 PM | 1,266 (9.3%) | 1,061 (9.3%) |
| 4:00 PM to 11:59 PM | 1,837 (13.5%) | 1,333 (11.6%) |
| Total | 13,587 (100.0%) | 11,463 (100.0%) |
Housing Occupancy in Seneca County
Occupancy by Ownership in Seneca County
Of the total 21,910 dwellings in Seneca County, owner-occupied units account for 15,779 (72.0%), while renter-occupied units make up 6,131 (28.0%).
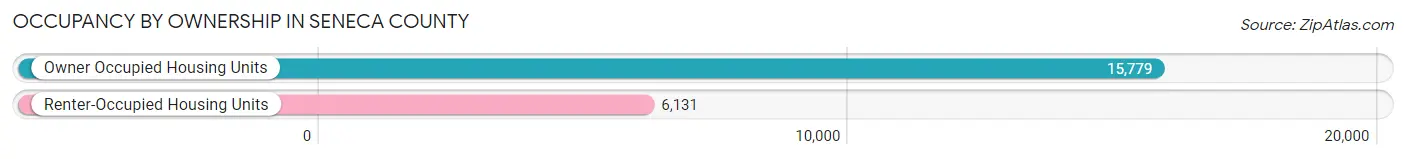
| Occupancy | # Housing Units | % Housing Units |
| Owner Occupied Housing Units | 15,779 | 72.0% |
| Renter-Occupied Housing Units | 6,131 | 28.0% |
| Total Occupied Housing Units | 21,910 | 100.0% |
Occupancy by Household Size in Seneca County
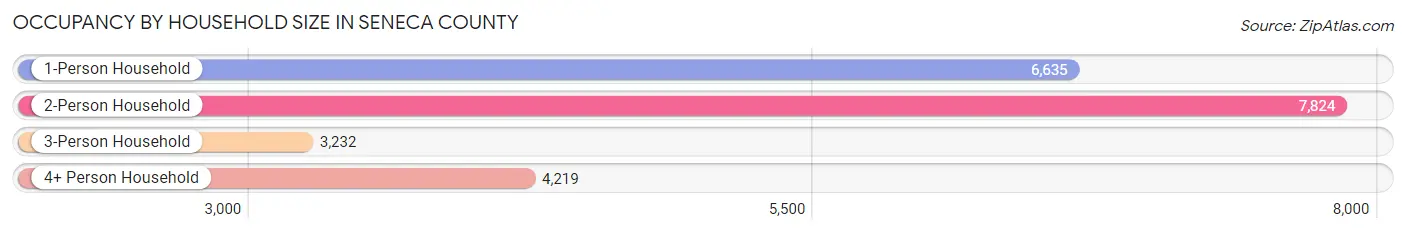
| Household Size | # Housing Units | % Housing Units |
| 1-Person Household | 6,635 | 30.3% |
| 2-Person Household | 7,824 | 35.7% |
| 3-Person Household | 3,232 | 14.7% |
| 4+ Person Household | 4,219 | 19.3% |
| Total Housing Units | 21,910 | 100.0% |
Occupancy by Ownership by Household Size in Seneca County
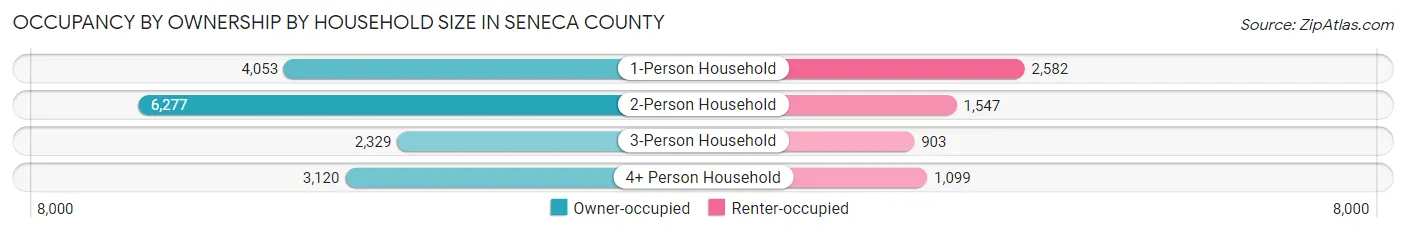
| Household Size | Owner-occupied | Renter-occupied |
| 1-Person Household | 4,053 (61.1%) | 2,582 (38.9%) |
| 2-Person Household | 6,277 (80.2%) | 1,547 (19.8%) |
| 3-Person Household | 2,329 (72.1%) | 903 (27.9%) |
| 4+ Person Household | 3,120 (74.0%) | 1,099 (26.1%) |
| Total Housing Units | 15,779 (72.0%) | 6,131 (28.0%) |
Occupancy by Educational Attainment in Seneca County

| Household Size | Owner-occupied | Renter-occupied |
| Less than High School | 605 (57.4%) | 449 (42.6%) |
| High School Diploma | 6,256 (69.4%) | 2,764 (30.6%) |
| College/Associate Degree | 5,392 (73.5%) | 1,946 (26.5%) |
| Bachelor's Degree or higher | 3,526 (78.4%) | 972 (21.6%) |
Occupancy by Age of Householder in Seneca County
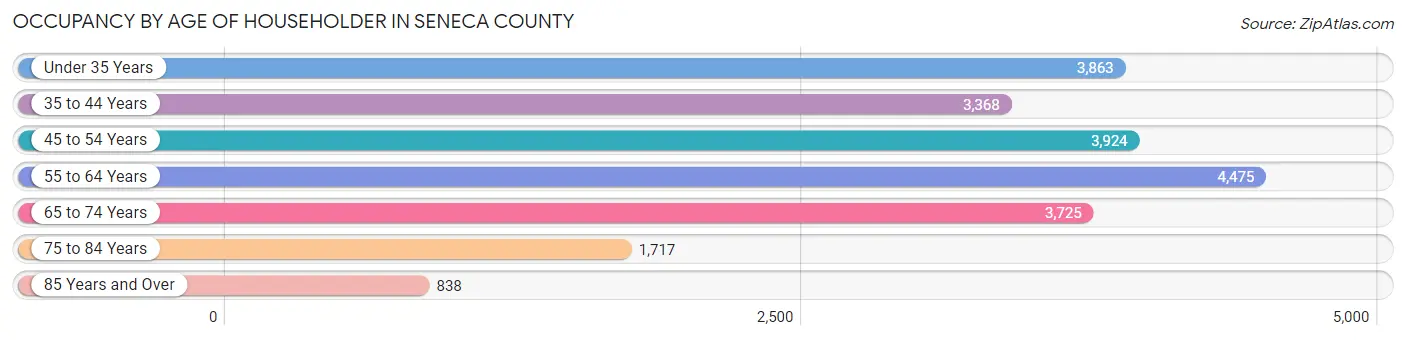
| Age Bracket | # Households | % Households |
| Under 35 Years | 3,863 | 17.6% |
| 35 to 44 Years | 3,368 | 15.4% |
| 45 to 54 Years | 3,924 | 17.9% |
| 55 to 64 Years | 4,475 | 20.4% |
| 65 to 74 Years | 3,725 | 17.0% |
| 75 to 84 Years | 1,717 | 7.8% |
| 85 Years and Over | 838 | 3.8% |
| Total | 21,910 | 100.0% |
Housing Finances in Seneca County
Median Income by Occupancy in Seneca County
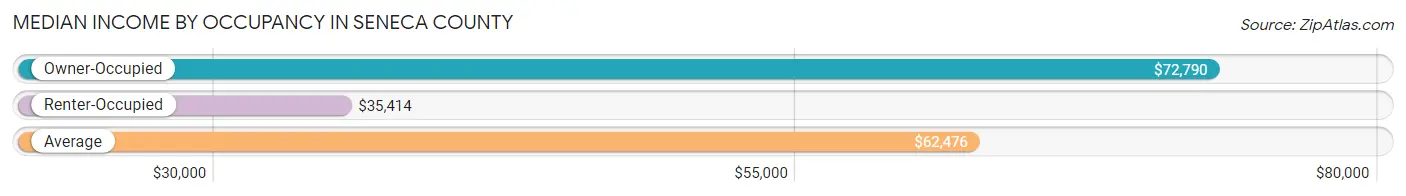
| Occupancy Type | # Households | Median Income |
| Owner-Occupied | 15,779 (72.0%) | $72,790 |
| Renter-Occupied | 6,131 (28.0%) | $35,414 |
| Average | 21,910 (100.0%) | $62,476 |
Occupancy by Householder Income Bracket in Seneca County
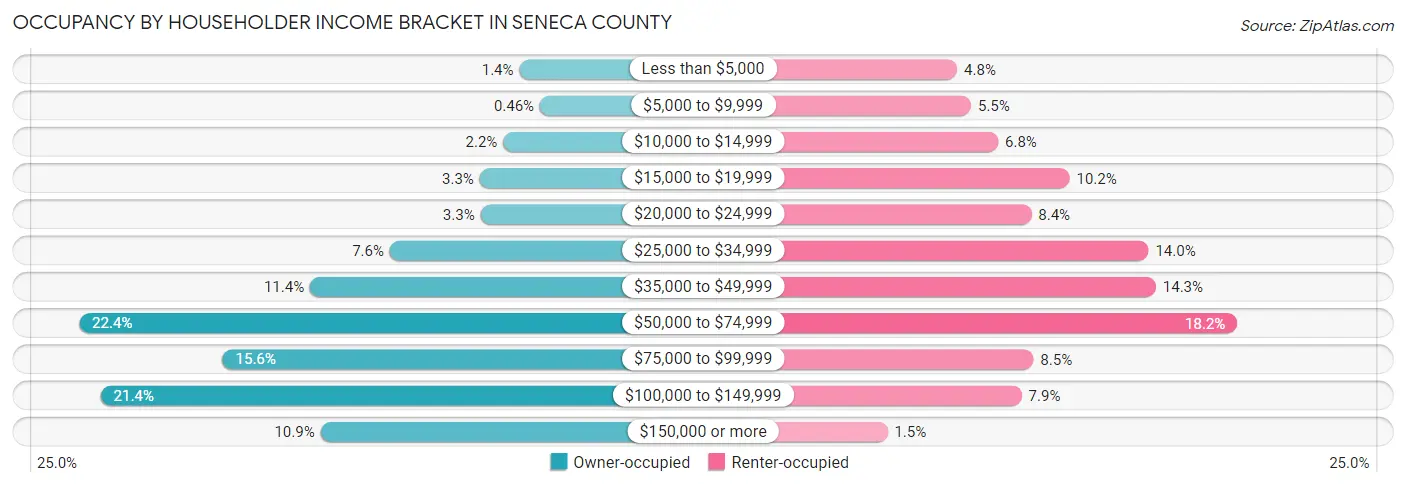
| Income Bracket | Owner-occupied | Renter-occupied |
| Less than $5,000 | 228 (1.4%) | 297 (4.8%) |
| $5,000 to $9,999 | 73 (0.5%) | 337 (5.5%) |
| $10,000 to $14,999 | 348 (2.2%) | 416 (6.8%) |
| $15,000 to $19,999 | 525 (3.3%) | 625 (10.2%) |
| $20,000 to $24,999 | 519 (3.3%) | 513 (8.4%) |
| $25,000 to $34,999 | 1,201 (7.6%) | 855 (14.0%) |
| $35,000 to $49,999 | 1,800 (11.4%) | 877 (14.3%) |
| $50,000 to $74,999 | 3,534 (22.4%) | 1,114 (18.2%) |
| $75,000 to $99,999 | 2,457 (15.6%) | 519 (8.5%) |
| $100,000 to $149,999 | 3,373 (21.4%) | 485 (7.9%) |
| $150,000 or more | 1,721 (10.9%) | 93 (1.5%) |
| Total | 15,779 (100.0%) | 6,131 (100.0%) |
Monthly Housing Cost Tiers in Seneca County

| Monthly Cost | Owner-occupied | Renter-occupied |
| Less than $300 | 923 (5.9%) | 223 (3.6%) |
| $300 to $499 | 3,658 (23.2%) | 611 (10.0%) |
| $500 to $799 | 3,662 (23.2%) | 2,128 (34.7%) |
| $800 to $999 | 2,130 (13.5%) | 1,719 (28.0%) |
| $1,000 to $1,499 | 3,446 (21.8%) | 958 (15.6%) |
| $1,500 to $1,999 | 1,177 (7.5%) | 31 (0.5%) |
| $2,000 to $2,499 | 401 (2.5%) | 8 (0.1%) |
| $2,500 to $2,999 | 184 (1.2%) | 0 (0.0%) |
| $3,000 or more | 198 (1.3%) | 10 (0.2%) |
| Total | 15,779 (100.0%) | 6,131 (100.0%) |
Physical Housing Characteristics in Seneca County
Housing Structures in Seneca County
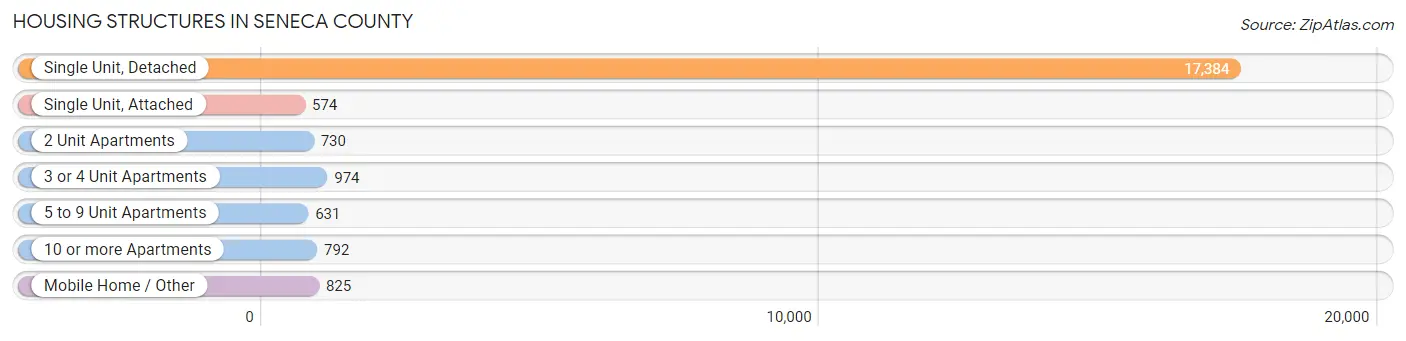
| Structure Type | # Housing Units | % Housing Units |
| Single Unit, Detached | 17,384 | 79.3% |
| Single Unit, Attached | 574 | 2.6% |
| 2 Unit Apartments | 730 | 3.3% |
| 3 or 4 Unit Apartments | 974 | 4.4% |
| 5 to 9 Unit Apartments | 631 | 2.9% |
| 10 or more Apartments | 792 | 3.6% |
| Mobile Home / Other | 825 | 3.8% |
| Total | 21,910 | 100.0% |
Housing Structures by Occupancy in Seneca County
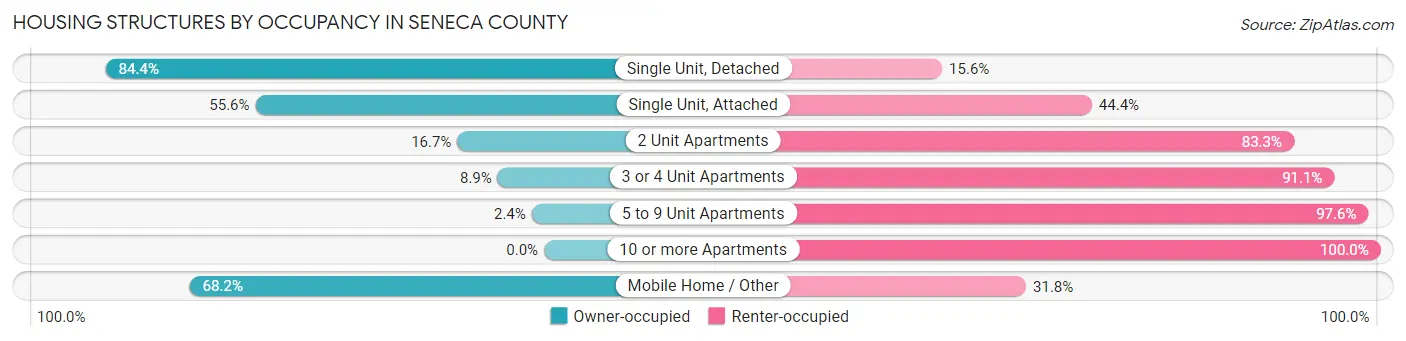
| Structure Type | Owner-occupied | Renter-occupied |
| Single Unit, Detached | 14,673 (84.4%) | 2,711 (15.6%) |
| Single Unit, Attached | 319 (55.6%) | 255 (44.4%) |
| 2 Unit Apartments | 122 (16.7%) | 608 (83.3%) |
| 3 or 4 Unit Apartments | 87 (8.9%) | 887 (91.1%) |
| 5 to 9 Unit Apartments | 15 (2.4%) | 616 (97.6%) |
| 10 or more Apartments | 0 (0.0%) | 792 (100.0%) |
| Mobile Home / Other | 563 (68.2%) | 262 (31.8%) |
| Total | 15,779 (72.0%) | 6,131 (28.0%) |
Housing Structures by Number of Rooms in Seneca County

| Number of Rooms | Owner-occupied | Renter-occupied |
| 1 Room | 62 (0.4%) | 336 (5.5%) |
| 2 or 3 Rooms | 202 (1.3%) | 1,097 (17.9%) |
| 4 or 5 Rooms | 3,503 (22.2%) | 2,162 (35.3%) |
| 6 or 7 Rooms | 6,629 (42.0%) | 1,803 (29.4%) |
| 8 or more Rooms | 5,383 (34.1%) | 733 (12.0%) |
| Total | 15,779 (100.0%) | 6,131 (100.0%) |
Housing Structure by Heating Type in Seneca County
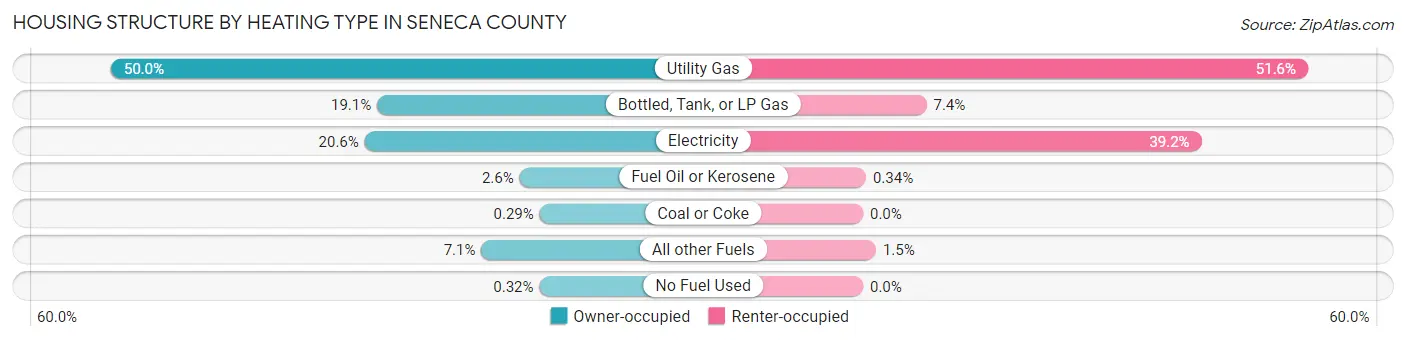
| Heating Type | Owner-occupied | Renter-occupied |
| Utility Gas | 7,889 (50.0%) | 3,162 (51.6%) |
| Bottled, Tank, or LP Gas | 3,020 (19.1%) | 451 (7.4%) |
| Electricity | 3,248 (20.6%) | 2,405 (39.2%) |
| Fuel Oil or Kerosene | 414 (2.6%) | 21 (0.3%) |
| Coal or Coke | 45 (0.3%) | 0 (0.0%) |
| All other Fuels | 1,112 (7.0%) | 92 (1.5%) |
| No Fuel Used | 51 (0.3%) | 0 (0.0%) |
| Total | 15,779 (100.0%) | 6,131 (100.0%) |
Household Vehicle Usage in Seneca County

| Vehicles per Household | Owner-occupied | Renter-occupied |
| No Vehicle | 298 (1.9%) | 960 (15.7%) |
| 1 Vehicle | 3,493 (22.1%) | 2,780 (45.3%) |
| 2 Vehicles | 6,846 (43.4%) | 1,778 (29.0%) |
| 3 or more Vehicles | 5,142 (32.6%) | 613 (10.0%) |
| Total | 15,779 (100.0%) | 6,131 (100.0%) |
Real Estate & Mortgages in Seneca County
Real Estate and Mortgage Overview in Seneca County
| Characteristic | Without Mortgage | With Mortgage |
| Housing Units | 7,404 | 8,375 |
| Median Property Value | $125,200 | $130,000 |
| Median Household Income | $60,857 | $1,068 |
| Monthly Housing Costs | $464 | $198 |
| Real Estate Taxes | $1,400 | $208 |
Property Value by Mortgage Status in Seneca County
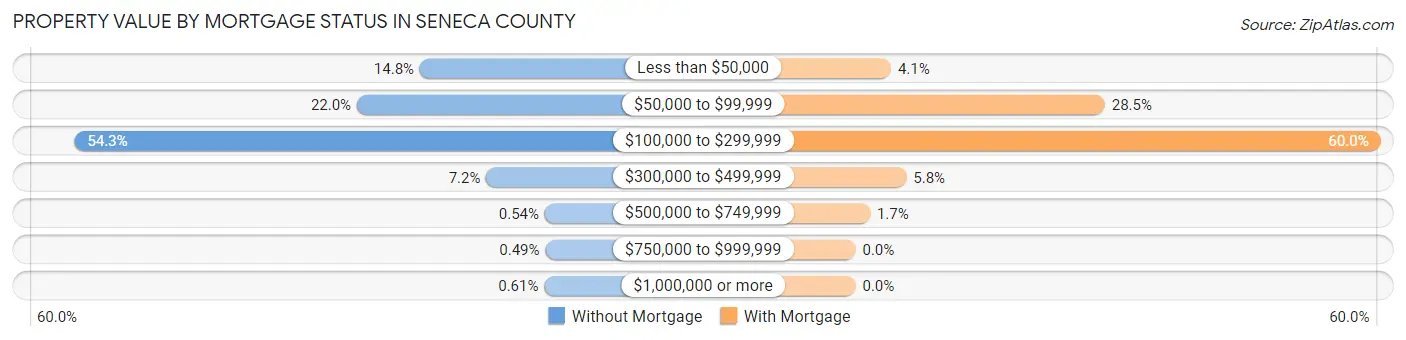
| Property Value | Without Mortgage | With Mortgage |
| Less than $50,000 | 1,097 (14.8%) | 339 (4.1%) |
| $50,000 to $99,999 | 1,630 (22.0%) | 2,386 (28.5%) |
| $100,000 to $299,999 | 4,021 (54.3%) | 5,025 (60.0%) |
| $300,000 to $499,999 | 535 (7.2%) | 487 (5.8%) |
| $500,000 to $749,999 | 40 (0.5%) | 138 (1.7%) |
| $750,000 to $999,999 | 36 (0.5%) | 0 (0.0%) |
| $1,000,000 or more | 45 (0.6%) | 0 (0.0%) |
| Total | 7,404 (100.0%) | 8,375 (100.0%) |
Household Income by Mortgage Status in Seneca County
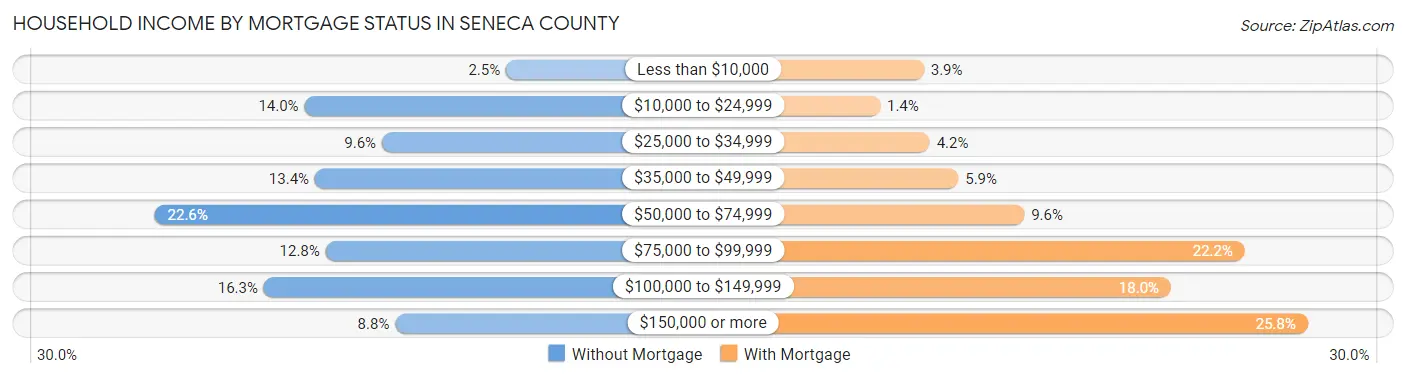
| Household Income | Without Mortgage | With Mortgage |
| Less than $10,000 | 184 (2.5%) | 327 (3.9%) |
| $10,000 to $24,999 | 1,037 (14.0%) | 117 (1.4%) |
| $25,000 to $34,999 | 709 (9.6%) | 355 (4.2%) |
| $35,000 to $49,999 | 993 (13.4%) | 492 (5.9%) |
| $50,000 to $74,999 | 1,671 (22.6%) | 807 (9.6%) |
| $75,000 to $99,999 | 948 (12.8%) | 1,863 (22.2%) |
| $100,000 to $149,999 | 1,209 (16.3%) | 1,509 (18.0%) |
| $150,000 or more | 653 (8.8%) | 2,164 (25.8%) |
| Total | 7,404 (100.0%) | 8,375 (100.0%) |
Property Value to Household Income Ratio in Seneca County
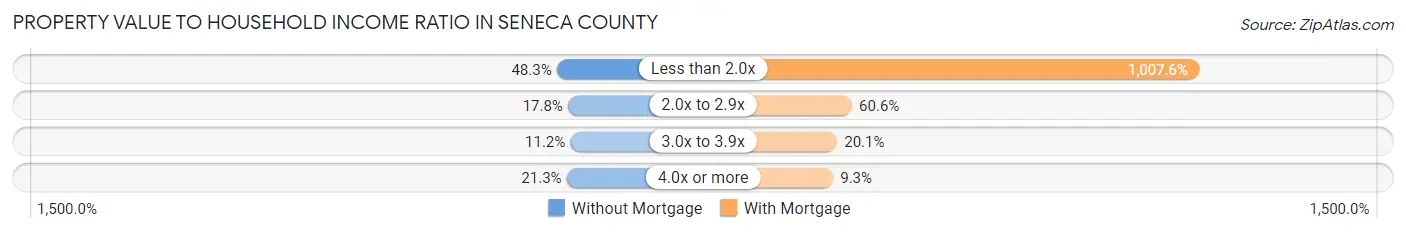
| Value-to-Income Ratio | Without Mortgage | With Mortgage |
| Less than 2.0x | 3,578 (48.3%) | 84,386 (1,007.6%) |
| 2.0x to 2.9x | 1,317 (17.8%) | 5,074 (60.6%) |
| 3.0x to 3.9x | 828 (11.2%) | 1,682 (20.1%) |
| 4.0x or more | 1,574 (21.3%) | 775 (9.2%) |
| Total | 7,404 (100.0%) | 8,375 (100.0%) |
Real Estate Taxes by Mortgage Status in Seneca County

| Property Taxes | Without Mortgage | With Mortgage |
| Less than $800 | 1,413 (19.1%) | 26 (0.3%) |
| $800 to $1,499 | 2,613 (35.3%) | 953 (11.4%) |
| $800 to $1,499 | 3,280 (44.3%) | 3,215 (38.4%) |
| Total | 7,404 (100.0%) | 8,375 (100.0%) |
Health & Disability in Seneca County
Health Insurance Coverage by Age in Seneca County

| Age Bracket | With Coverage | Without Coverage |
| Under 6 Years | 3,474 (97.7%) | 81 (2.3%) |
| 6 to 18 Years | 9,015 (96.7%) | 305 (3.3%) |
| 19 to 25 Years | 5,361 (90.7%) | 549 (9.3%) |
| 26 to 34 Years | 4,914 (91.9%) | 432 (8.1%) |
| 35 to 44 Years | 5,693 (90.1%) | 625 (9.9%) |
| 45 to 54 Years | 6,073 (93.9%) | 395 (6.1%) |
| 55 to 64 Years | 7,132 (92.9%) | 543 (7.1%) |
| 65 to 74 Years | 5,979 (100.0%) | 3 (0.1%) |
| 75 Years and older | 3,629 (100.0%) | 1 (0.0%) |
| Total | 51,270 (94.6%) | 2,934 (5.4%) |
Health Insurance Coverage by Citizenship Status in Seneca County
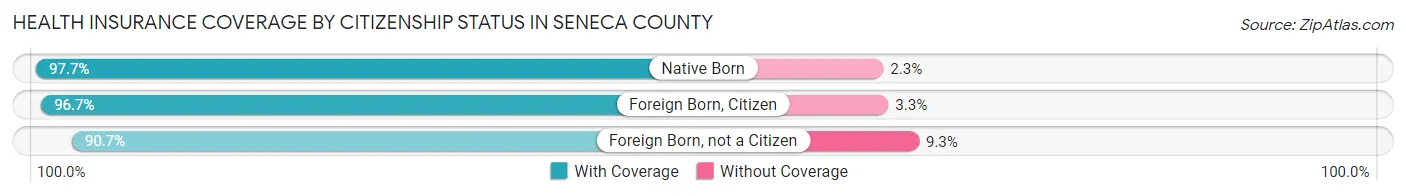
| Citizenship Status | With Coverage | Without Coverage |
| Native Born | 3,474 (97.7%) | 81 (2.3%) |
| Foreign Born, Citizen | 9,015 (96.7%) | 305 (3.3%) |
| Foreign Born, not a Citizen | 5,361 (90.7%) | 549 (9.3%) |
Health Insurance Coverage by Household Income in Seneca County
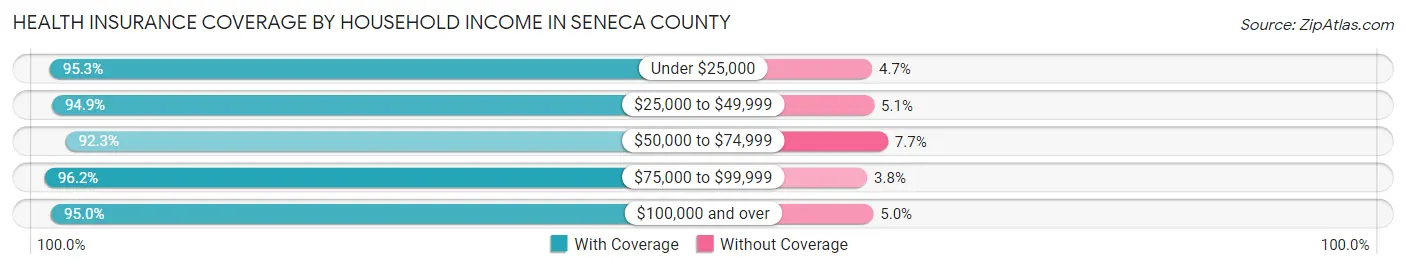
| Household Income | With Coverage | Without Coverage |
| Under $25,000 | 5,683 (95.3%) | 283 (4.7%) |
| $25,000 to $49,999 | 8,307 (94.9%) | 449 (5.1%) |
| $50,000 to $74,999 | 11,021 (92.3%) | 920 (7.7%) |
| $75,000 to $99,999 | 8,028 (96.2%) | 318 (3.8%) |
| $100,000 and over | 16,288 (95.0%) | 853 (5.0%) |
Public vs Private Health Insurance Coverage by Age in Seneca County
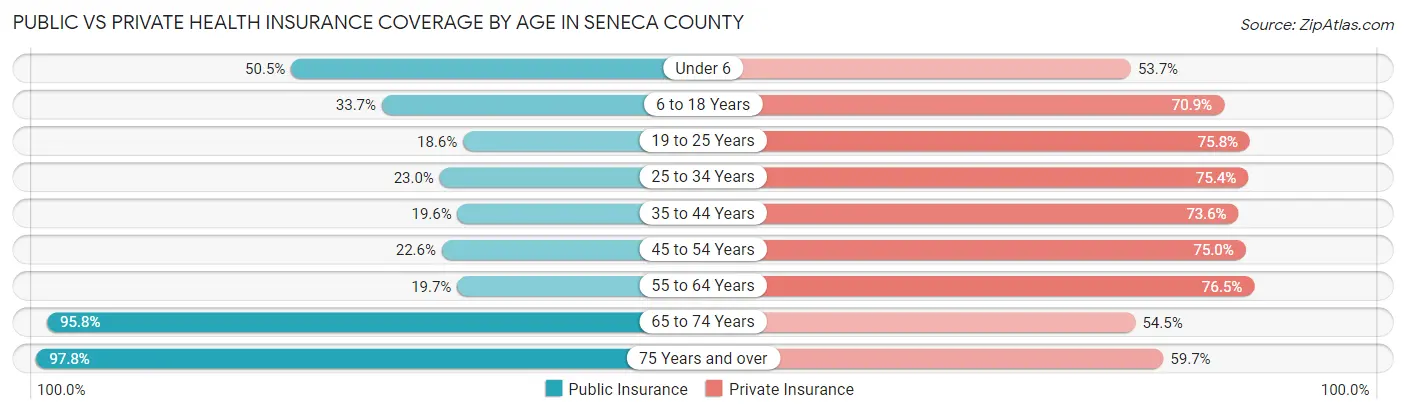
| Age Bracket | Public Insurance | Private Insurance |
| Under 6 | 1,796 (50.5%) | 1,908 (53.7%) |
| 6 to 18 Years | 3,140 (33.7%) | 6,610 (70.9%) |
| 19 to 25 Years | 1,100 (18.6%) | 4,477 (75.7%) |
| 25 to 34 Years | 1,227 (23.0%) | 4,032 (75.4%) |
| 35 to 44 Years | 1,241 (19.6%) | 4,651 (73.6%) |
| 45 to 54 Years | 1,459 (22.6%) | 4,848 (75.0%) |
| 55 to 64 Years | 1,512 (19.7%) | 5,874 (76.5%) |
| 65 to 74 Years | 5,733 (95.8%) | 3,261 (54.5%) |
| 75 Years and over | 3,550 (97.8%) | 2,167 (59.7%) |
| Total | 20,758 (38.3%) | 37,828 (69.8%) |
Disability Status by Sex by Age in Seneca County
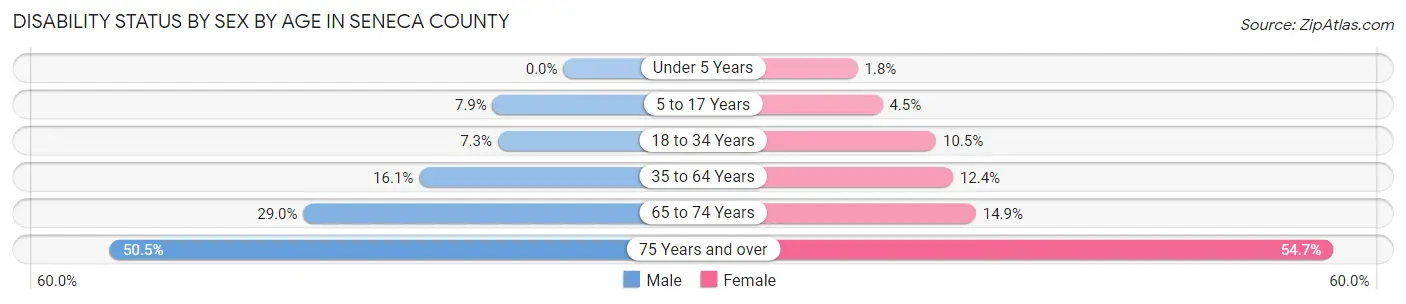
| Age Bracket | Male | Female |
| Under 5 Years | 0 (0.0%) | 25 (1.8%) |
| 5 to 17 Years | 360 (7.9%) | 197 (4.5%) |
| 18 to 34 Years | 462 (7.3%) | 622 (10.5%) |
| 35 to 64 Years | 1,668 (16.1%) | 1,247 (12.4%) |
| 65 to 74 Years | 853 (29.0%) | 453 (14.9%) |
| 75 Years and over | 774 (50.5%) | 1,147 (54.7%) |
Disability Class by Sex by Age in Seneca County
Disability Class: Hearing Difficulty
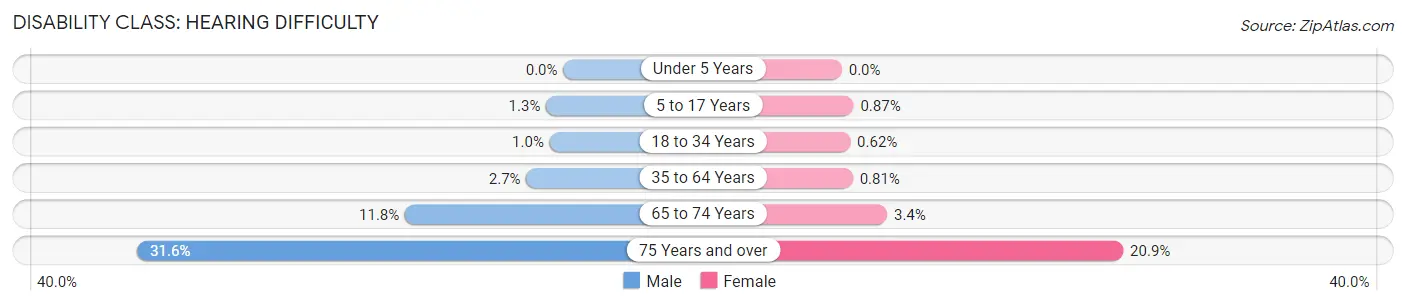
| Age Bracket | Male | Female |
| Under 5 Years | 0 (0.0%) | 0 (0.0%) |
| 5 to 17 Years | 58 (1.3%) | 38 (0.9%) |
| 18 to 34 Years | 64 (1.0%) | 37 (0.6%) |
| 35 to 64 Years | 285 (2.7%) | 82 (0.8%) |
| 65 to 74 Years | 346 (11.7%) | 102 (3.4%) |
| 75 Years and over | 485 (31.6%) | 438 (20.9%) |
Disability Class: Vision Difficulty
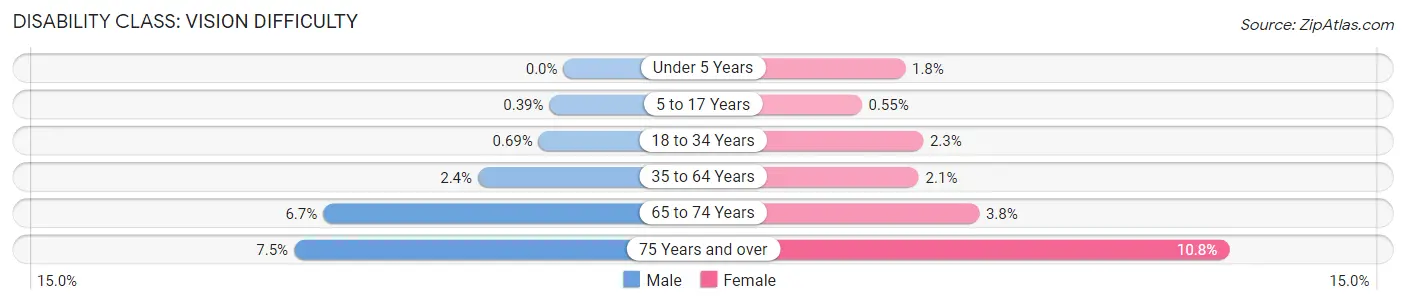
| Age Bracket | Male | Female |
| Under 5 Years | 0 (0.0%) | 25 (1.8%) |
| 5 to 17 Years | 18 (0.4%) | 24 (0.5%) |
| 18 to 34 Years | 44 (0.7%) | 134 (2.3%) |
| 35 to 64 Years | 247 (2.4%) | 216 (2.1%) |
| 65 to 74 Years | 197 (6.7%) | 116 (3.8%) |
| 75 Years and over | 115 (7.5%) | 226 (10.8%) |
Disability Class: Cognitive Difficulty

| Age Bracket | Male | Female |
| 5 to 17 Years | 347 (7.6%) | 113 (2.6%) |
| 18 to 34 Years | 306 (4.8%) | 507 (8.6%) |
| 35 to 64 Years | 692 (6.7%) | 415 (4.1%) |
| 65 to 74 Years | 174 (5.9%) | 53 (1.8%) |
| 75 Years and over | 129 (8.4%) | 207 (9.9%) |
Disability Class: Ambulatory Difficulty
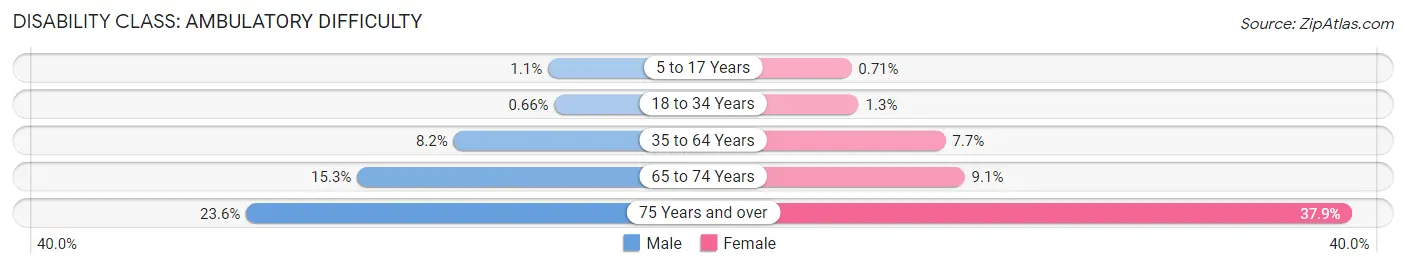
| Age Bracket | Male | Female |
| 5 to 17 Years | 52 (1.1%) | 31 (0.7%) |
| 18 to 34 Years | 42 (0.7%) | 74 (1.3%) |
| 35 to 64 Years | 847 (8.2%) | 776 (7.7%) |
| 65 to 74 Years | 451 (15.3%) | 277 (9.1%) |
| 75 Years and over | 361 (23.5%) | 795 (37.9%) |
Disability Class: Self-Care Difficulty

| Age Bracket | Male | Female |
| 5 to 17 Years | 79 (1.7%) | 26 (0.6%) |
| 18 to 34 Years | 15 (0.2%) | 11 (0.2%) |
| 35 to 64 Years | 381 (3.7%) | 167 (1.7%) |
| 65 to 74 Years | 193 (6.6%) | 54 (1.8%) |
| 75 Years and over | 144 (9.4%) | 215 (10.2%) |
Technology Access in Seneca County
Computing Device Access in Seneca County
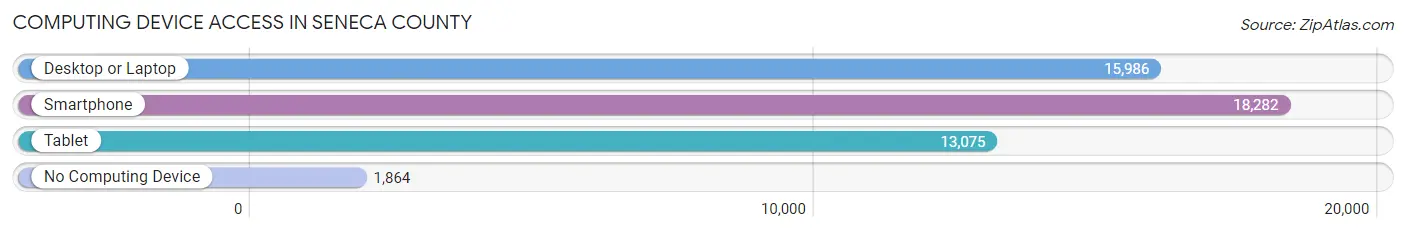
| Device Type | # Households | % Households |
| Desktop or Laptop | 15,986 | 73.0% |
| Smartphone | 18,282 | 83.4% |
| Tablet | 13,075 | 59.7% |
| No Computing Device | 1,864 | 8.5% |
| Total | 21,910 | 100.0% |
Internet Access in Seneca County
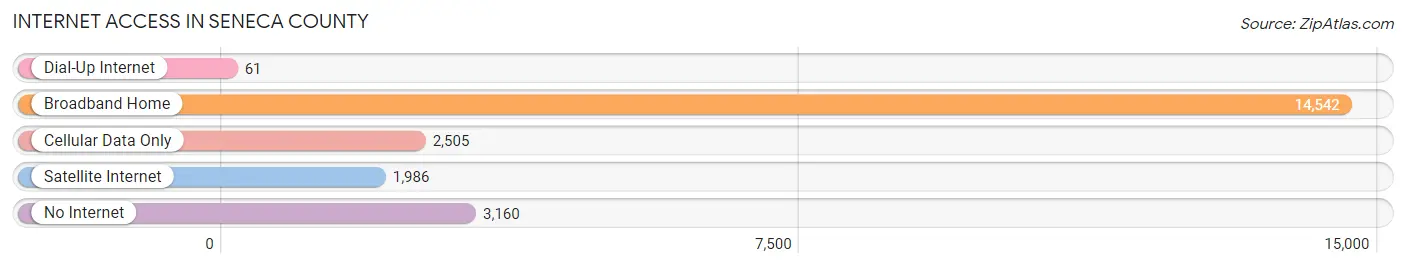
| Internet Type | # Households | % Households |
| Dial-Up Internet | 61 | 0.3% |
| Broadband Home | 14,542 | 66.4% |
| Cellular Data Only | 2,505 | 11.4% |
| Satellite Internet | 1,986 | 9.1% |
| No Internet | 3,160 | 14.4% |
| Total | 21,910 | 100.0% |
Seneca County Summary
Seneca County is located in the northwestern corner of Ohio, and is part of the Toledo Metropolitan Statistical Area. It is bordered by Sandusky County to the north, Wyandot County to the east, Crawford County to the south, and Wood County to the west. The county seat is Tiffin, and the county is named after the Seneca tribe of Native Americans.
Geography
Seneca County covers an area of 437 square miles, of which 434 square miles is land and 3 square miles is water. The county is located in the glaciated plains region of Ohio, and is characterized by rolling hills and valleys. The Sandusky River flows through the county, and is a major tributary of Lake Erie. The county is also home to several small lakes, including Big and Little Sandusky Lakes, and Wolf Creek Lake.
The county is divided into two distinct regions: the upland and the lowland. The upland region is located in the northern and western parts of the county, and is characterized by rolling hills and valleys. The lowland region is located in the southern and eastern parts of the county, and is characterized by flat terrain.
Demographics
As of the 2010 census, Seneca County had a population of 56,745. The racial makeup of the county was 94.2% White, 2.3% African American, 0.4% Native American, 0.7% Asian, 0.1% Pacific Islander, 0.7% from other races, and 1.6% from two or more races. Hispanic or Latino of any race were 2.2% of the population.
The median income for a household in the county was $45,837, and the median income for a family was $54,837. The per capita income for the county was $21,945. About 8.2% of families and 11.2% of the population were below the poverty line, including 15.2% of those under age 18 and 7.2% of those age 65 or over.
Economy
Seneca County has a diverse economy, with a mix of manufacturing, agriculture, and service industries. The county is home to several large employers, including Whirlpool Corporation, Seneca Industrial and Marine, and Seneca Foods. The county is also home to several small businesses, including restaurants, retail stores, and professional services.
Agriculture is an important part of the county's economy, and the county is home to several large farms. The county is also home to several wineries, and is a popular destination for wine tours.
The county is home to several tourist attractions, including the Seneca County Museum, the Seneca Caverns, and the Seneca County Fairgrounds. The county is also home to several parks, including the Tiffin Riverwalk, the Seneca County Park, and the Seneca Lake State Park.
Conclusion
Seneca County is a diverse county located in the northwestern corner of Ohio. It is home to a mix of manufacturing, agriculture, and service industries, and is a popular destination for tourists. The county is home to several large employers, and is also home to several small businesses. Agriculture is an important part of the county's economy, and the county is home to several large farms and wineries. The county is also home to several tourist attractions, including the Seneca County Museum, the Seneca Caverns, and the Seneca County Fairgrounds.
Common Questions
What is the Total Population of Seneca County?
Total Population of Seneca County is 55,062.
What is the Total Male Population of Seneca County?
Total Male Population of Seneca County is 27,744.
What is the Total Female Population of Seneca County?
Total Female Population of Seneca County is 27,318.
What is the Ratio of Males per 100 Females in Seneca County?
There are 101.56 Males per 100 Females in Seneca County.
What is the Ratio of Females per 100 Males in Seneca County?
There are 98.46 Females per 100 Males in Seneca County.
What is the Median Population Age in Seneca County?
Median Population Age in Seneca County is 40.6 Years.
What is the Average Family Size in Seneca County
Average Family Size in Seneca County is 2.9 People.
What is the Average Household Size in Seneca County
Average Household Size in Seneca County is 2.4 People.
What is Per Capita Income in Seneca County?
Per Capita income in Seneca County is $31,770.
What is the Median Family Income in Seneca County?
Median Family Income in Seneca County is $74,863.
What is the Median Household income in Seneca County?
Median Household Income in Seneca County is $62,476.
What is Income or Wage Gap in Seneca County?
Income or Wage Gap in Seneca County is 34.3%.
Women in Seneca County earn 65.7 cents for every dollar earned by a man.
What is Family Income Deficit in Seneca County?
Family Income Deficit in Seneca County is $10,193.
Families that are below poverty line in Seneca County earn $10,193 less on average than the poverty threshold level.
What is Inequality or Gini Index in Seneca County?
Inequality or Gini Index in Seneca County is 0.43.
How Large is the Labor Force in Seneca County?
There are 28,069 People in the Labor Forcein in Seneca County.
What is the Percentage of People in the Labor Force in Seneca County?
62.6% of People are in the Labor Force in Seneca County.
What is the Unemployment Rate in Seneca County?
Unemployment Rate in Seneca County is 4.2%.