Preble County, OH
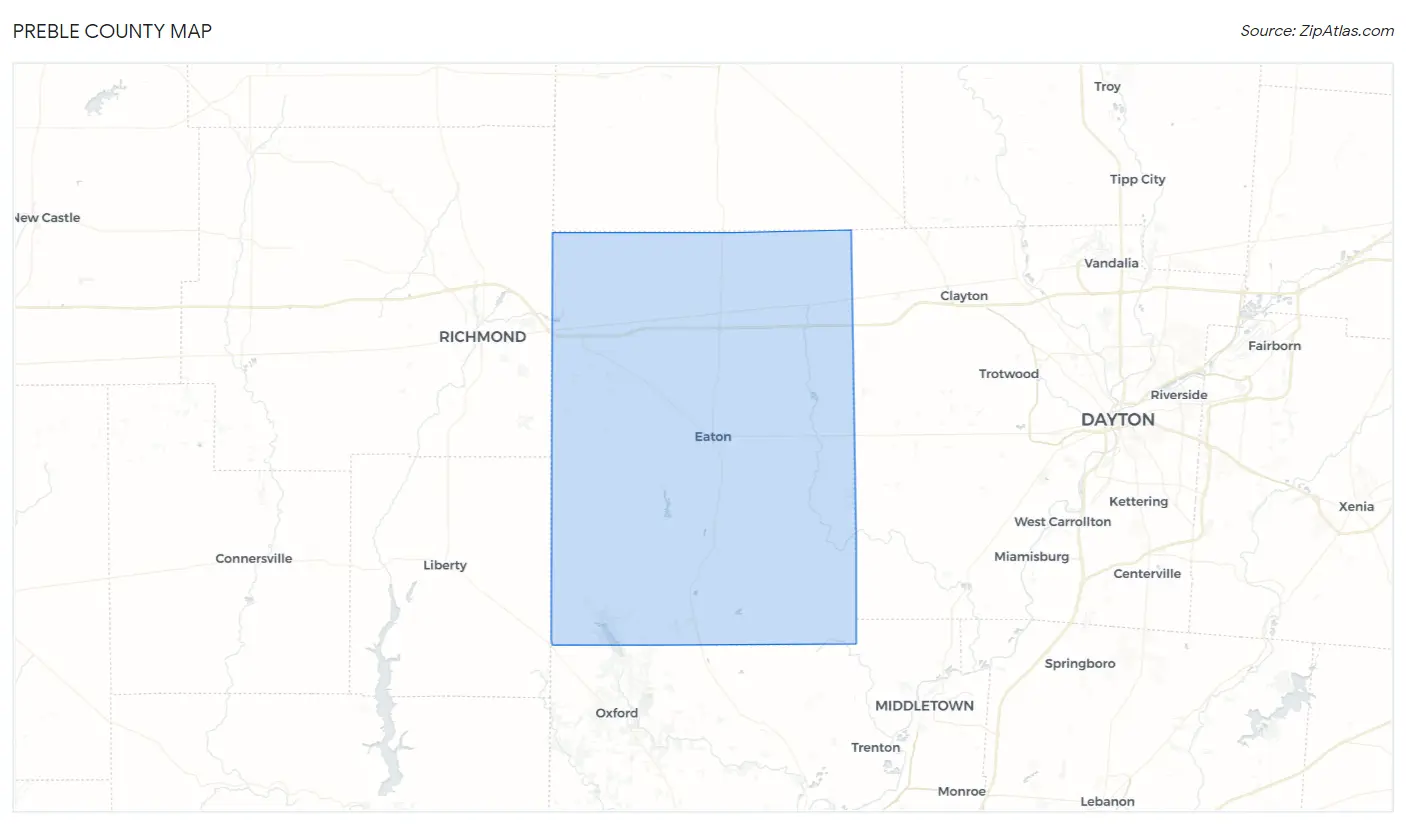
Preble County Map
Preble County Overview
40,929
TOTAL POPULATION
20,382
MALE POPULATION
20,547
FEMALE POPULATION
99.20
MALES / 100 FEMALES
100.81
FEMALES / 100 MALES
43.0
MEDIAN AGE
2.9
AVG FAMILY SIZE
2.4
AVG HOUSEHOLD SIZE
$33,627
PER CAPITA INCOME
$80,000
AVG FAMILY INCOME
$66,355
AVG HOUSEHOLD INCOME
41.4%
WAGE / INCOME GAP [ % ]
58.6¢/ $1
WAGE / INCOME GAP [ $ ]
$10,211
FAMILY INCOME DEFICIT
0.40
INEQUALITY / GINI INDEX
20,632
LABOR FORCE [ PEOPLE ]
62.7%
PERCENT IN LABOR FORCE
3.4%
UNEMPLOYMENT RATE
Race in Preble County
The most populous races in Preble County are White / Caucasian (39,238 | 95.9%), Two or more Races (1,097 | 2.7%), and Hispanic or Latino (443 | 1.1%).
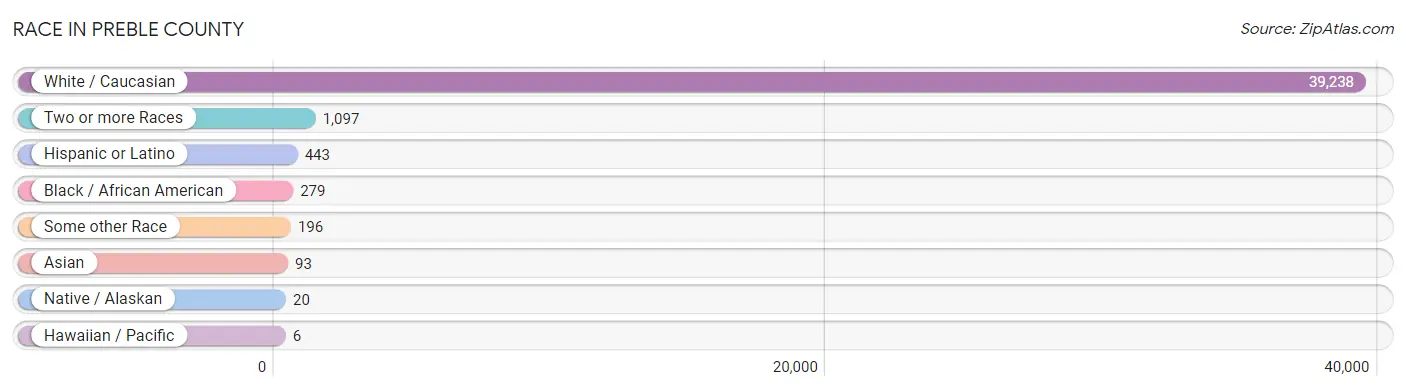
| Race | # Population | % Population |
| Asian | 93 | 0.2% |
| Black / African American | 279 | 0.7% |
| Hawaiian / Pacific | 6 | 0.0% |
| Hispanic or Latino | 443 | 1.1% |
| Native / Alaskan | 20 | 0.1% |
| White / Caucasian | 39,238 | 95.9% |
| Two or more Races | 1,097 | 2.7% |
| Some other Race | 196 | 0.5% |
| Total | 40,929 | 100.0% |
Ancestry in Preble County
The most populous ancestries reported in Preble County are German (9,894 | 24.2%), American (4,477 | 10.9%), English (4,457 | 10.9%), Irish (4,048 | 9.9%), and Italian (1,087 | 2.7%), together accounting for 58.5% of all Preble County residents.
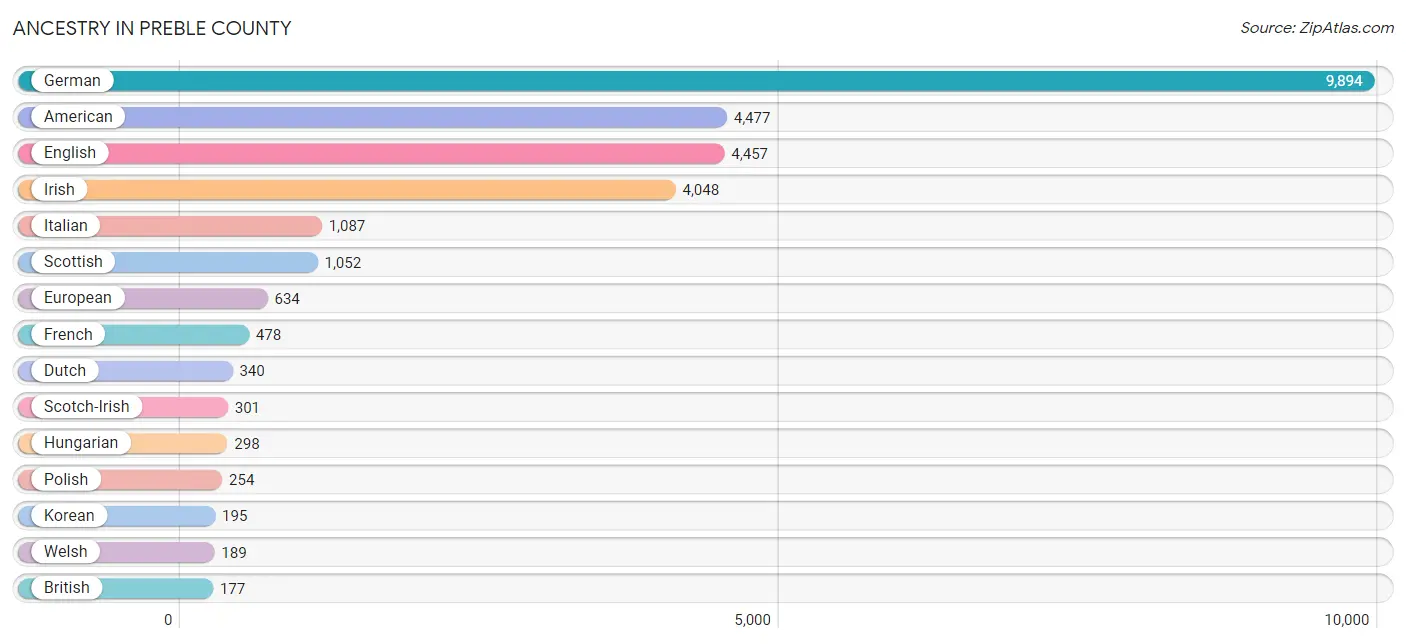
| Ancestry | # Population | % Population |
| African | 20 | 0.1% |
| American | 4,477 | 10.9% |
| Apache | 1 | 0.0% |
| Arab | 46 | 0.1% |
| Armenian | 38 | 0.1% |
| Austrian | 41 | 0.1% |
| Belgian | 10 | 0.0% |
| Blackfeet | 19 | 0.1% |
| Brazilian | 8 | 0.0% |
| British | 177 | 0.4% |
| Burmese | 63 | 0.2% |
| Canadian | 17 | 0.0% |
| Cherokee | 93 | 0.2% |
| Chickasaw | 82 | 0.2% |
| Chippewa | 28 | 0.1% |
| Colombian | 9 | 0.0% |
| Cree | 4 | 0.0% |
| Creek | 5 | 0.0% |
| Croatian | 16 | 0.0% |
| Czech | 40 | 0.1% |
| Czechoslovakian | 14 | 0.0% |
| Danish | 13 | 0.0% |
| Dutch | 340 | 0.8% |
| Eastern European | 89 | 0.2% |
| Ecuadorian | 62 | 0.2% |
| English | 4,457 | 10.9% |
| European | 634 | 1.5% |
| Finnish | 11 | 0.0% |
| French | 478 | 1.2% |
| French Canadian | 16 | 0.0% |
| German | 9,894 | 24.2% |
| Greek | 57 | 0.1% |
| Hungarian | 298 | 0.7% |
| Indian (Asian) | 17 | 0.0% |
| Inupiat | 6 | 0.0% |
| Iranian | 2 | 0.0% |
| Irish | 4,048 | 9.9% |
| Iroquois | 4 | 0.0% |
| Italian | 1,087 | 2.7% |
| Jamaican | 31 | 0.1% |
| Korean | 195 | 0.5% |
| Lebanese | 46 | 0.1% |
| Lithuanian | 97 | 0.2% |
| Macedonian | 4 | 0.0% |
| Mexican | 177 | 0.4% |
| Native Hawaiian | 62 | 0.2% |
| Navajo | 1 | 0.0% |
| Northern European | 59 | 0.1% |
| Norwegian | 105 | 0.3% |
| Pennsylvania German | 17 | 0.0% |
| Peruvian | 19 | 0.1% |
| Polish | 254 | 0.6% |
| Portuguese | 3 | 0.0% |
| Potawatomi | 4 | 0.0% |
| Puerto Rican | 25 | 0.1% |
| Romanian | 2 | 0.0% |
| Russian | 100 | 0.2% |
| Scandinavian | 56 | 0.1% |
| Scotch-Irish | 301 | 0.7% |
| Scottish | 1,052 | 2.6% |
| Slovak | 33 | 0.1% |
| Slovene | 12 | 0.0% |
| South American | 90 | 0.2% |
| South American Indian | 19 | 0.1% |
| Spaniard | 45 | 0.1% |
| Spanish | 20 | 0.1% |
| Sri Lankan | 9 | 0.0% |
| Subsaharan African | 20 | 0.1% |
| Swedish | 81 | 0.2% |
| Swiss | 163 | 0.4% |
| Thai | 32 | 0.1% |
| Tsimshian | 2 | 0.0% |
| Ukrainian | 15 | 0.0% |
| Welsh | 189 | 0.5% |
| Yugoslavian | 15 | 0.0% | View All 75 Rows |
Immigrants in Preble County
The most numerous immigrant groups reported in Preble County came from Asia (101 | 0.3%), Canada (64 | 0.2%), Eastern Asia (64 | 0.2%), Korea (58 | 0.1%), and Europe (56 | 0.1%), together accounting for 0.9% of all Preble County residents.
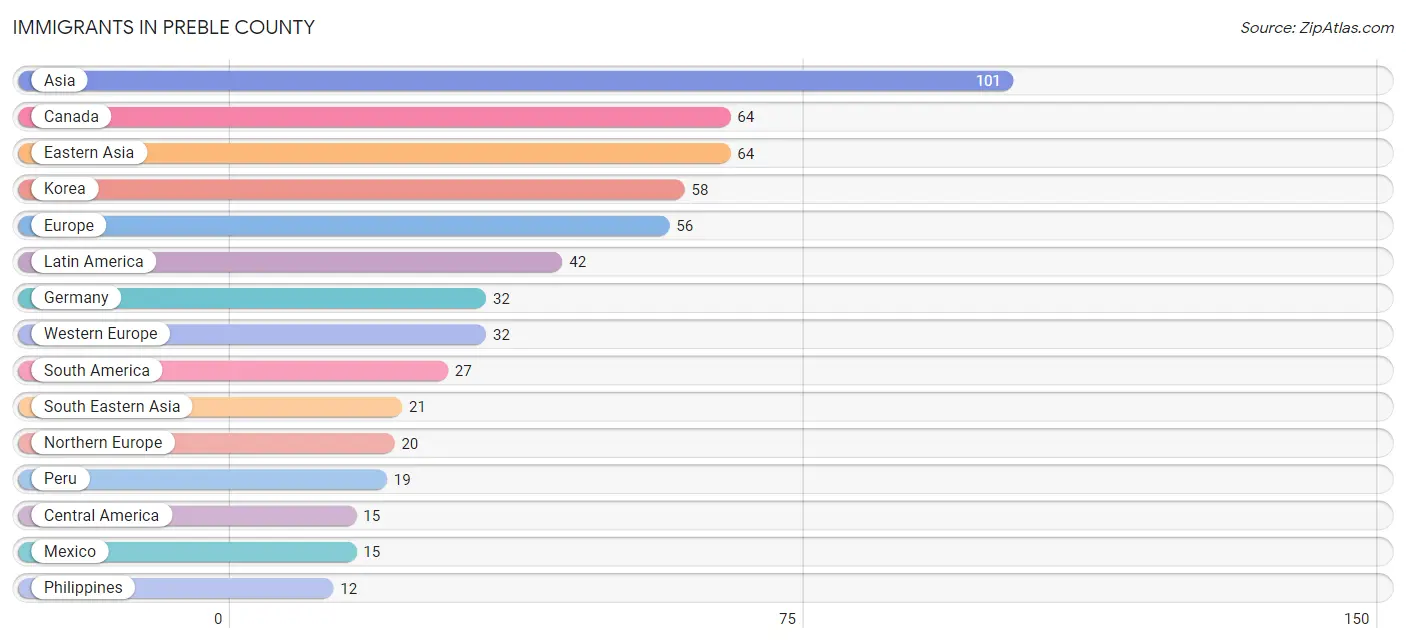
| Immigration Origin | # Population | % Population |
| Asia | 101 | 0.3% |
| Australia | 4 | 0.0% |
| Brazil | 8 | 0.0% |
| Canada | 64 | 0.2% |
| Central America | 15 | 0.0% |
| Eastern Asia | 64 | 0.2% |
| Eastern Europe | 4 | 0.0% |
| Europe | 56 | 0.1% |
| Germany | 32 | 0.1% |
| India | 10 | 0.0% |
| Japan | 6 | 0.0% |
| Korea | 58 | 0.1% |
| Latin America | 42 | 0.1% |
| Mexico | 15 | 0.0% |
| North Macedonia | 4 | 0.0% |
| Northern Europe | 20 | 0.1% |
| Oceania | 5 | 0.0% |
| Peru | 19 | 0.1% |
| Philippines | 12 | 0.0% |
| Scotland | 7 | 0.0% |
| South America | 27 | 0.1% |
| South Central Asia | 10 | 0.0% |
| South Eastern Asia | 21 | 0.1% |
| Vietnam | 9 | 0.0% |
| Western Asia | 6 | 0.0% |
| Western Europe | 32 | 0.1% | View All 26 Rows |
Sex and Age in Preble County
Sex and Age in Preble County
The most populous age groups in Preble County are 55 to 59 Years (1,736 | 8.5%) for men and 55 to 59 Years (1,596 | 7.8%) for women.
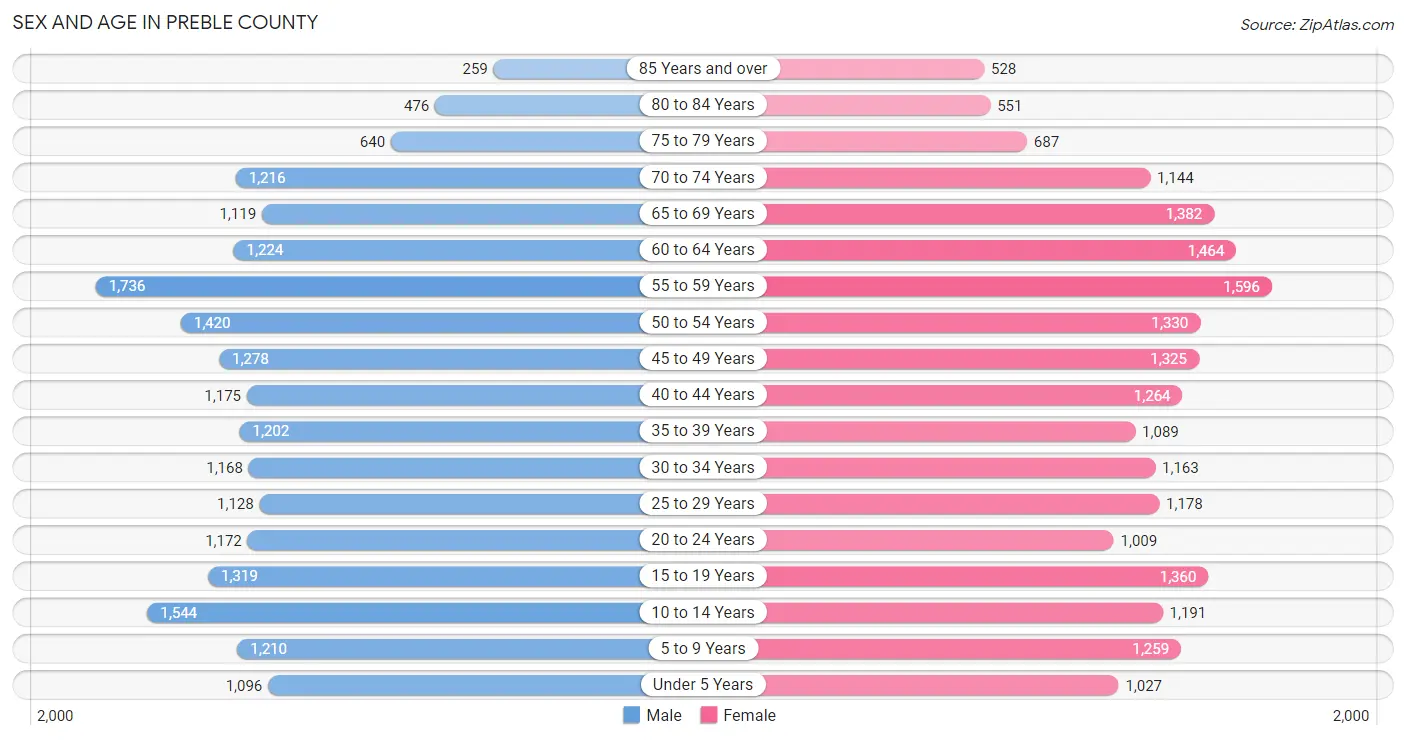
| Age Bracket | Male | Female |
| Under 5 Years | 1,096 (5.4%) | 1,027 (5.0%) |
| 5 to 9 Years | 1,210 (5.9%) | 1,259 (6.1%) |
| 10 to 14 Years | 1,544 (7.6%) | 1,191 (5.8%) |
| 15 to 19 Years | 1,319 (6.5%) | 1,360 (6.6%) |
| 20 to 24 Years | 1,172 (5.8%) | 1,009 (4.9%) |
| 25 to 29 Years | 1,128 (5.5%) | 1,178 (5.7%) |
| 30 to 34 Years | 1,168 (5.7%) | 1,163 (5.7%) |
| 35 to 39 Years | 1,202 (5.9%) | 1,089 (5.3%) |
| 40 to 44 Years | 1,175 (5.8%) | 1,264 (6.1%) |
| 45 to 49 Years | 1,278 (6.3%) | 1,325 (6.5%) |
| 50 to 54 Years | 1,420 (7.0%) | 1,330 (6.5%) |
| 55 to 59 Years | 1,736 (8.5%) | 1,596 (7.8%) |
| 60 to 64 Years | 1,224 (6.0%) | 1,464 (7.1%) |
| 65 to 69 Years | 1,119 (5.5%) | 1,382 (6.7%) |
| 70 to 74 Years | 1,216 (6.0%) | 1,144 (5.6%) |
| 75 to 79 Years | 640 (3.1%) | 687 (3.3%) |
| 80 to 84 Years | 476 (2.3%) | 551 (2.7%) |
| 85 Years and over | 259 (1.3%) | 528 (2.6%) |
| Total | 20,382 (100.0%) | 20,547 (100.0%) |
Families and Households in Preble County
Median Family Size in Preble County
The median family size in Preble County is 2.93 persons per family, with married-couple families (8,970 | 78.2%) accounting for the largest median family size of 2.98 persons per family. On the other hand, single male/father families (651 | 5.7%) represent the smallest median family size with 2.69 persons per family.
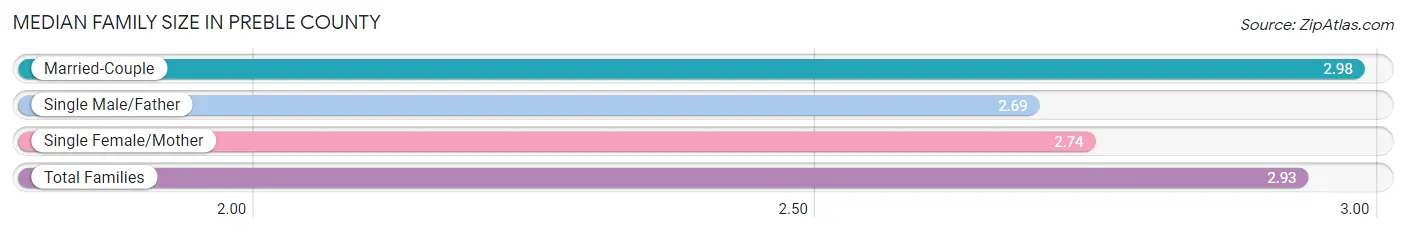
| Family Type | # Families | Family Size |
| Married-Couple | 8,970 (78.2%) | 2.98 |
| Single Male/Father | 651 (5.7%) | 2.69 |
| Single Female/Mother | 1,851 (16.1%) | 2.74 |
| Total Families | 11,472 (100.0%) | 2.93 |
Median Household Size in Preble County
The median household size in Preble County is 2.44 persons per household, with single female/mother households (1,851 | 11.2%) accounting for the largest median household size of 3.02 persons per household. non-family households (5,134 | 30.9%) represent the smallest median household size with 1.18 persons per household.
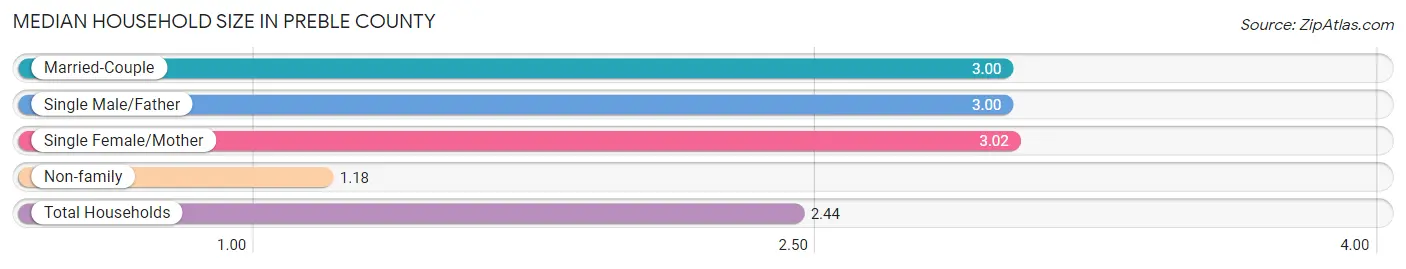
| Household Type | # Households | Household Size |
| Married-Couple | 8,970 (54.0%) | 3.00 |
| Single Male/Father | 651 (3.9%) | 3.00 |
| Single Female/Mother | 1,851 (11.2%) | 3.02 |
| Non-family | 5,134 (30.9%) | 1.18 |
| Total Households | 16,606 (100.0%) | 2.44 |
Household Size by Marriage Status in Preble County
Out of a total of 16,606 households in Preble County, 11,472 (69.1%) are family households, while 5,134 (30.9%) are nonfamily households. The most numerous type of family households are 2-person households, comprising 5,635, and the most common type of nonfamily households are 1-person households, comprising 4,375.
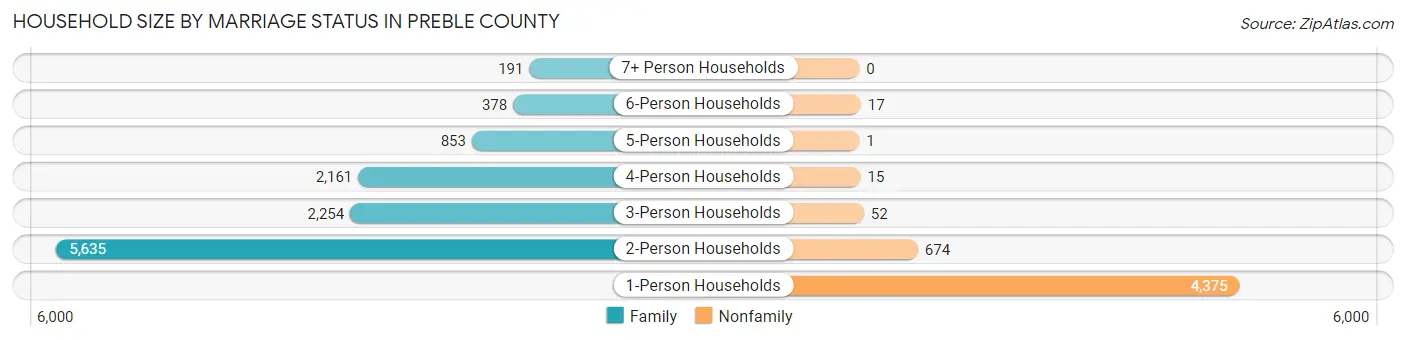
| Household Size | Family Households | Nonfamily Households |
| 1-Person Households | - | 4,375 (26.4%) |
| 2-Person Households | 5,635 (33.9%) | 674 (4.1%) |
| 3-Person Households | 2,254 (13.6%) | 52 (0.3%) |
| 4-Person Households | 2,161 (13.0%) | 15 (0.1%) |
| 5-Person Households | 853 (5.1%) | 1 (0.0%) |
| 6-Person Households | 378 (2.3%) | 17 (0.1%) |
| 7+ Person Households | 191 (1.1%) | 0 (0.0%) |
| Total | 11,472 (69.1%) | 5,134 (30.9%) |
Female Fertility in Preble County
Fertility by Age in Preble County
Average fertility rate in Preble County is 50.0 births per 1,000 women. Women in the age bracket of 20 to 34 years have the highest fertility rate with 112.0 births per 1,000 women. Women in the age bracket of 20 to 34 years acount for 85.7% of all women with births.

| Age Bracket | Women with Births | Births / 1,000 Women |
| 15 to 19 years | 6 (1.4%) | 4.0 |
| 20 to 34 years | 376 (85.7%) | 112.0 |
| 35 to 50 years | 57 (13.0%) | 14.0 |
| Total | 439 (100.0%) | 50.0 |
Fertility by Age by Marriage Status in Preble County
66.5% of women with births (439) in Preble County are married. The highest percentage of unmarried women with births falls into 20 to 34 years age bracket with 36.4% of them unmarried at the time of birth, while the lowest percentage of unmarried women with births belong to 35 to 50 years age bracket with 15.8% of them unmarried.
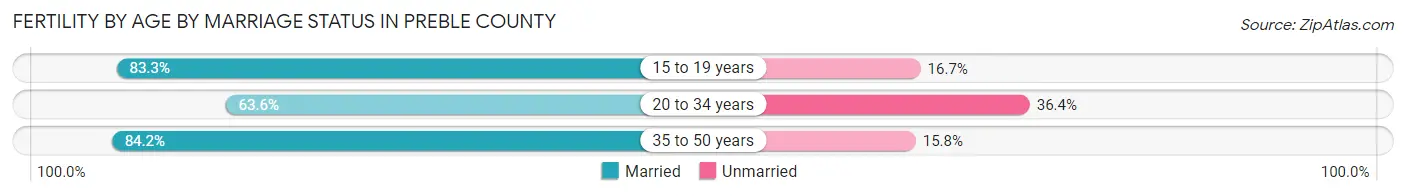
| Age Bracket | Married | Unmarried |
| 15 to 19 years | 5 (83.3%) | 1 (16.7%) |
| 20 to 34 years | 239 (63.6%) | 137 (36.4%) |
| 35 to 50 years | 48 (84.2%) | 9 (15.8%) |
| Total | 292 (66.5%) | 147 (33.5%) |
Fertility by Education in Preble County
Average fertility rate in Preble County is 50.0 births per 1,000 women. Women with the education attainment of college or associate's degree have the highest fertility rate of 77.0 births per 1,000 women, while women with the education attainment of less than high school have the lowest fertility at 4.0 births per 1,000 women. Women with the education attainment of college or associate's degree represent 48.1% of all women with births.
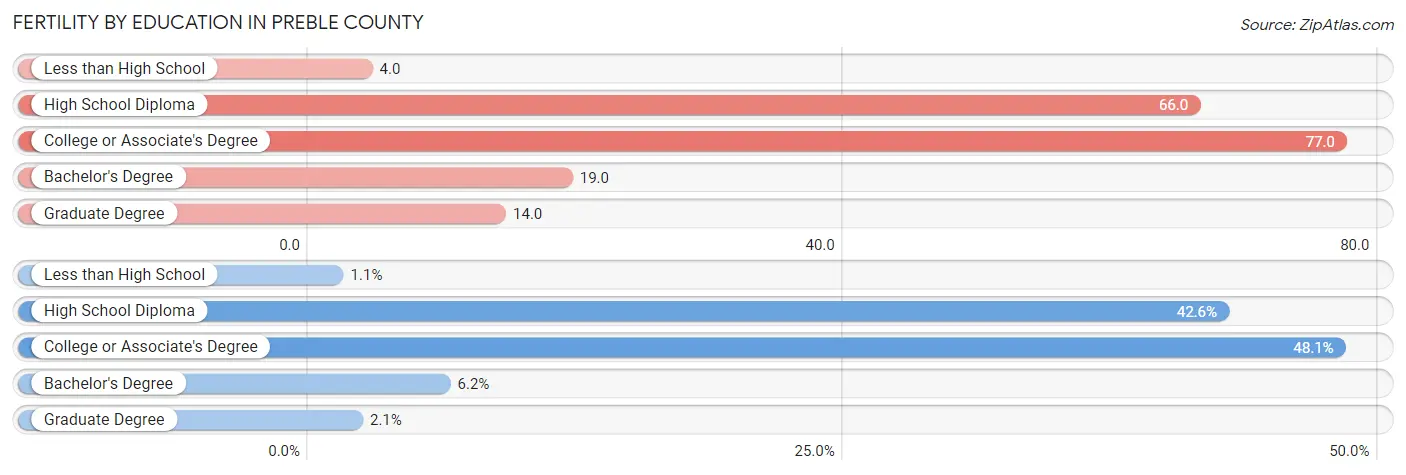
| Educational Attainment | Women with Births | Births / 1,000 Women |
| Less than High School | 5 (1.1%) | 4.0 |
| High School Diploma | 187 (42.6%) | 66.0 |
| College or Associate's Degree | 211 (48.1%) | 77.0 |
| Bachelor's Degree | 27 (6.1%) | 19.0 |
| Graduate Degree | 9 (2.1%) | 14.0 |
| Total | 439 (100.0%) | 50.0 |
Fertility by Education by Marriage Status in Preble County
33.5% of women with births in Preble County are unmarried. Women with the educational attainment of bachelor's degree are most likely to be married with 100.0% of them married at childbirth, while women with the educational attainment of college or associate's degree are least likely to be married with 40.8% of them unmarried at childbirth.
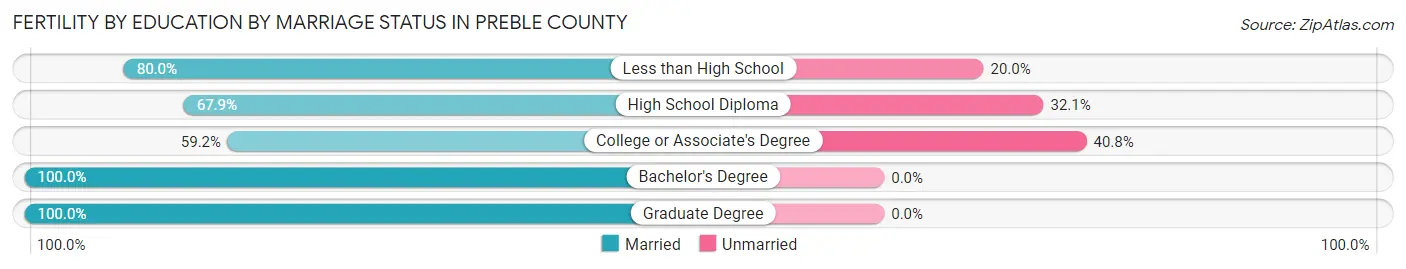
| Educational Attainment | Married | Unmarried |
| Less than High School | 4 (80.0%) | 1 (20.0%) |
| High School Diploma | 127 (67.9%) | 60 (32.1%) |
| College or Associate's Degree | 125 (59.2%) | 86 (40.8%) |
| Bachelor's Degree | 27 (100.0%) | 0 (0.0%) |
| Graduate Degree | 9 (100.0%) | 0 (0.0%) |
| Total | 292 (66.5%) | 147 (33.5%) |
Income in Preble County
Income Overview in Preble County
Per Capita Income in Preble County is $33,627, while median incomes of families and households are $80,000 and $66,355 respectively.
| Characteristic | Number | Measure |
| Per Capita Income | 40,929 | $33,627 |
| Median Family Income | 11,472 | $80,000 |
| Mean Family Income | 11,472 | $95,122 |
| Median Household Income | 16,606 | $66,355 |
| Mean Household Income | 16,606 | $81,529 |
| Income Deficit | 11,472 | $10,211 |
| Wage / Income Gap (%) | 40,929 | 41.45% |
| Wage / Income Gap ($) | 40,929 | 58.55¢ per $1 |
| Gini / Inequality Index | 40,929 | 0.40 |
Earnings by Sex in Preble County
Average Earnings in Preble County are $39,813, $51,994 for men and $30,444 for women, a difference of 41.4%.
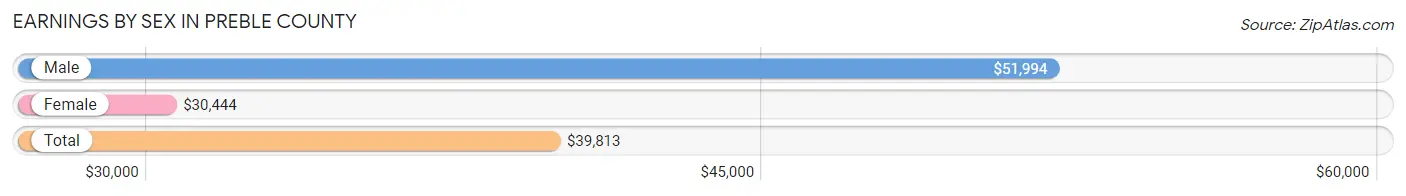
| Sex | Number | Average Earnings |
| Male | 11,354 (52.2%) | $51,994 |
| Female | 10,386 (47.8%) | $30,444 |
| Total | 21,740 (100.0%) | $39,813 |
Earnings by Sex by Income Bracket in Preble County
The most common earnings brackets in Preble County are $75,000 to $99,999 for men (1,642 | 14.5%) and $35,000 to $39,999 for women (852 | 8.2%).
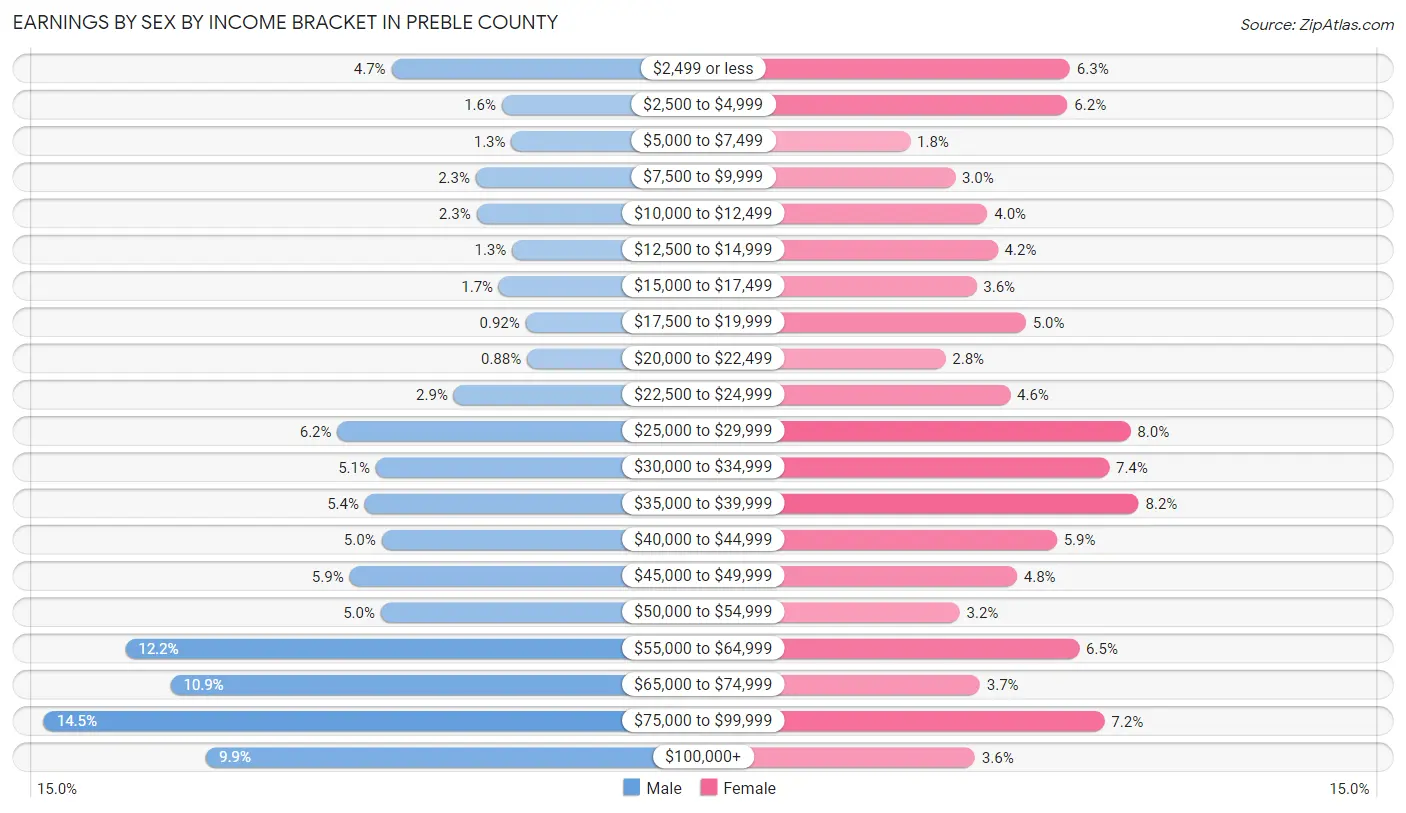
| Income | Male | Female |
| $2,499 or less | 533 (4.7%) | 651 (6.3%) |
| $2,500 to $4,999 | 181 (1.6%) | 644 (6.2%) |
| $5,000 to $7,499 | 150 (1.3%) | 185 (1.8%) |
| $7,500 to $9,999 | 263 (2.3%) | 316 (3.0%) |
| $10,000 to $12,499 | 261 (2.3%) | 410 (4.0%) |
| $12,500 to $14,999 | 148 (1.3%) | 440 (4.2%) |
| $15,000 to $17,499 | 190 (1.7%) | 378 (3.6%) |
| $17,500 to $19,999 | 105 (0.9%) | 522 (5.0%) |
| $20,000 to $22,499 | 100 (0.9%) | 288 (2.8%) |
| $22,500 to $24,999 | 334 (2.9%) | 477 (4.6%) |
| $25,000 to $29,999 | 705 (6.2%) | 828 (8.0%) |
| $30,000 to $34,999 | 582 (5.1%) | 765 (7.4%) |
| $35,000 to $39,999 | 618 (5.4%) | 852 (8.2%) |
| $40,000 to $44,999 | 564 (5.0%) | 613 (5.9%) |
| $45,000 to $49,999 | 667 (5.9%) | 496 (4.8%) |
| $50,000 to $54,999 | 567 (5.0%) | 329 (3.2%) |
| $55,000 to $64,999 | 1,382 (12.2%) | 678 (6.5%) |
| $65,000 to $74,999 | 1,238 (10.9%) | 388 (3.7%) |
| $75,000 to $99,999 | 1,642 (14.5%) | 752 (7.2%) |
| $100,000+ | 1,124 (9.9%) | 374 (3.6%) |
| Total | 11,354 (100.0%) | 10,386 (100.0%) |
Earnings by Sex by Educational Attainment in Preble County
Average earnings in Preble County are $57,245 for men and $34,724 for women, a difference of 39.3%. Men with an educational attainment of graduate degree enjoy the highest average annual earnings of $80,000, while those with high school diploma education earn the least with $50,420. Women with an educational attainment of graduate degree earn the most with the average annual earnings of $75,536, while those with high school diploma education have the smallest earnings of $27,449.
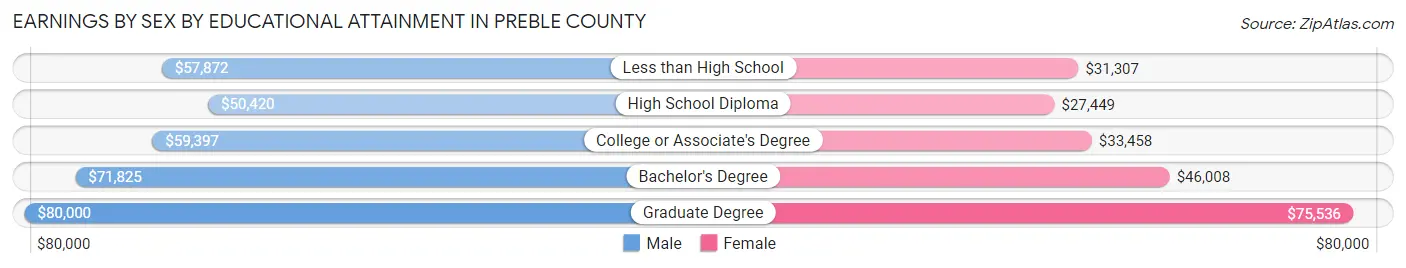
| Educational Attainment | Male Income | Female Income |
| Less than High School | $57,872 | $31,307 |
| High School Diploma | $50,420 | $27,449 |
| College or Associate's Degree | $59,397 | $33,458 |
| Bachelor's Degree | $71,825 | $46,008 |
| Graduate Degree | $80,000 | $75,536 |
| Total | $57,245 | $34,724 |
Family Income in Preble County
Family Income Brackets in Preble County
According to the Preble County family income data, there are 2,593 families falling into the $100,000 to $149,999 income range, which is the most common income bracket and makes up 22.6% of all families. Conversely, the $10,000 to $14,999 income bracket is the least frequent group with only 126 families (1.1%) belonging to this category.

| Income Bracket | # Families | % Families |
| Less than $10,000 | 413 | 3.6% |
| $10,000 to $14,999 | 126 | 1.1% |
| $15,000 to $24,999 | 459 | 4.0% |
| $25,000 to $34,999 | 505 | 4.4% |
| $35,000 to $49,999 | 1,411 | 12.3% |
| $50,000 to $74,999 | 2,398 | 20.9% |
| $75,000 to $99,999 | 1,790 | 15.6% |
| $100,000 to $149,999 | 2,593 | 22.6% |
| $150,000 to $199,999 | 1,124 | 9.8% |
| $200,000+ | 677 | 5.9% |
Family Income by Famaliy Size in Preble County
7+ person families (86 | 0.7%) account for the highest median family income in Preble County with $108,750 per family, while 2-person families (5,951 | 51.9%) have the highest median income of $33,428 per family member.
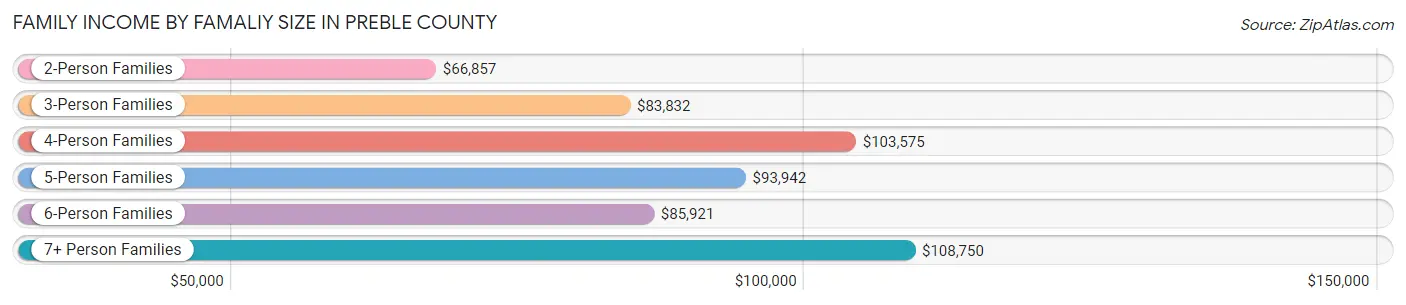
| Income Bracket | # Families | Median Income |
| 2-Person Families | 5,951 (51.9%) | $66,857 |
| 3-Person Families | 2,248 (19.6%) | $83,832 |
| 4-Person Families | 1,917 (16.7%) | $103,575 |
| 5-Person Families | 848 (7.4%) | $93,942 |
| 6-Person Families | 422 (3.7%) | $85,921 |
| 7+ Person Families | 86 (0.7%) | $108,750 |
| Total | 11,472 (100.0%) | $80,000 |
Family Income by Number of Earners in Preble County
The median family income in Preble County is $80,000, with families comprising 3+ earners (1,384) having the highest median family income of $135,000, while families with no earners (1,704) have the lowest median family income of $49,561, accounting for 12.1% and 14.8% of families, respectively.
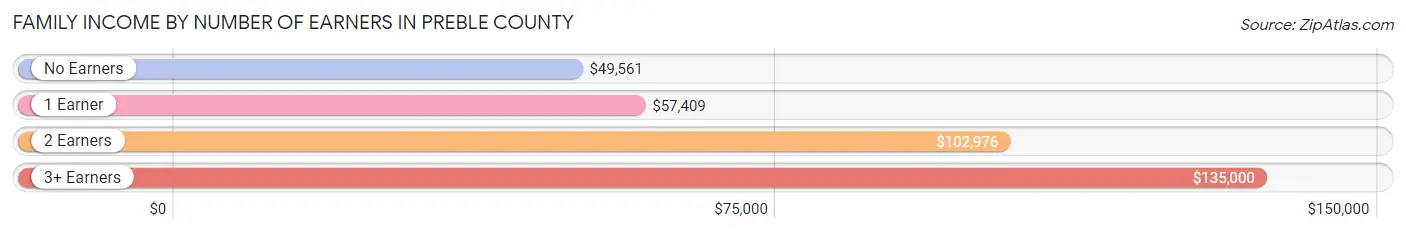
| Number of Earners | # Families | Median Income |
| No Earners | 1,704 (14.8%) | $49,561 |
| 1 Earner | 3,686 (32.1%) | $57,409 |
| 2 Earners | 4,698 (40.9%) | $102,976 |
| 3+ Earners | 1,384 (12.1%) | $135,000 |
| Total | 11,472 (100.0%) | $80,000 |
Household Income in Preble County
Household Income Brackets in Preble County
With 3,338 households falling in the category, the $50,000 to $74,999 income range is the most frequent in Preble County, accounting for 20.1% of all households. In contrast, only 565 households (3.4%) fall into the $10,000 to $14,999 income bracket, making it the least populous group.
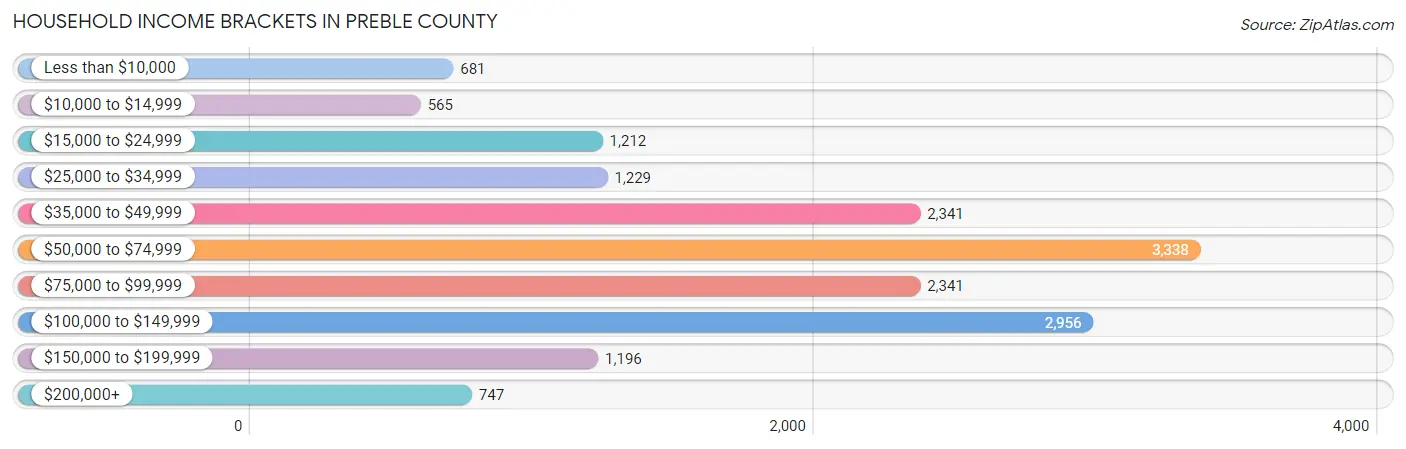
| Income Bracket | # Households | % Households |
| Less than $10,000 | 681 | 4.1% |
| $10,000 to $14,999 | 565 | 3.4% |
| $15,000 to $24,999 | 1,212 | 7.3% |
| $25,000 to $34,999 | 1,229 | 7.4% |
| $35,000 to $49,999 | 2,341 | 14.1% |
| $50,000 to $74,999 | 3,338 | 20.1% |
| $75,000 to $99,999 | 2,341 | 14.1% |
| $100,000 to $149,999 | 2,956 | 17.8% |
| $150,000 to $199,999 | 1,196 | 7.2% |
| $200,000+ | 747 | 4.5% |
Household Income by Householder Age in Preble County
The median household income in Preble County is $66,355, with the highest median household income of $82,542 found in the 45 to 64 years age bracket for the primary householder. A total of 6,416 households (38.6%) fall into this category. Meanwhile, the 15 to 24 years age bracket for the primary householder has the lowest median household income of $43,810, with 466 households (2.8%) in this group.
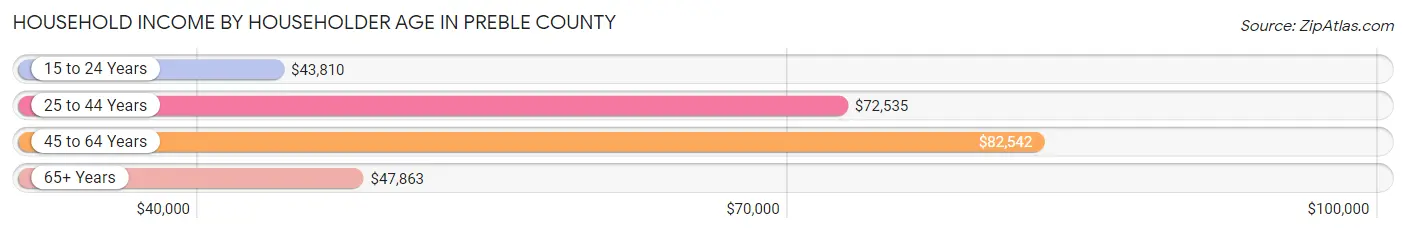
| Income Bracket | # Households | Median Income |
| 15 to 24 Years | 466 (2.8%) | $43,810 |
| 25 to 44 Years | 4,607 (27.7%) | $72,535 |
| 45 to 64 Years | 6,416 (38.6%) | $82,542 |
| 65+ Years | 5,117 (30.8%) | $47,863 |
| Total | 16,606 (100.0%) | $66,355 |
Poverty in Preble County
Income Below Poverty by Sex and Age in Preble County
With 8.4% poverty level for males and 12.3% for females among the residents of Preble County, under 5 year old males and 12 to 14 year old females are the most vulnerable to poverty, with 261 males (24.0%) and 191 females (28.1%) in their respective age groups living below the poverty level.
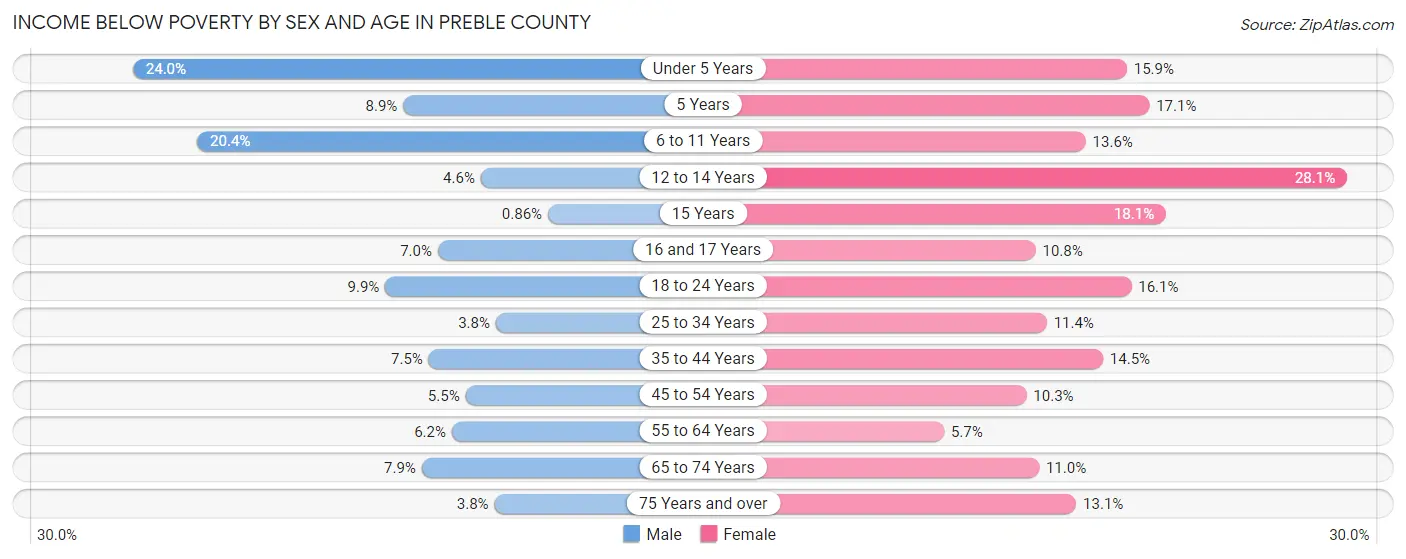
| Age Bracket | Male | Female |
| Under 5 Years | 261 (24.0%) | 163 (15.9%) |
| 5 Years | 14 (8.9%) | 44 (17.1%) |
| 6 to 11 Years | 347 (20.4%) | 200 (13.6%) |
| 12 to 14 Years | 38 (4.6%) | 191 (28.1%) |
| 15 Years | 3 (0.9%) | 63 (18.0%) |
| 16 and 17 Years | 36 (7.0%) | 56 (10.8%) |
| 18 to 24 Years | 161 (9.9%) | 242 (16.1%) |
| 25 to 34 Years | 86 (3.8%) | 267 (11.4%) |
| 35 to 44 Years | 178 (7.5%) | 341 (14.5%) |
| 45 to 54 Years | 147 (5.4%) | 273 (10.3%) |
| 55 to 64 Years | 183 (6.2%) | 174 (5.7%) |
| 65 to 74 Years | 180 (7.9%) | 273 (11.0%) |
| 75 Years and over | 52 (3.8%) | 218 (13.1%) |
| Total | 1,686 (8.4%) | 2,505 (12.3%) |
Income Above Poverty by Sex and Age in Preble County
According to the poverty statistics in Preble County, males aged 15 years and females aged 55 to 64 years are the age groups that are most secure financially, with 99.1% of males and 94.3% of females in these age groups living above the poverty line.
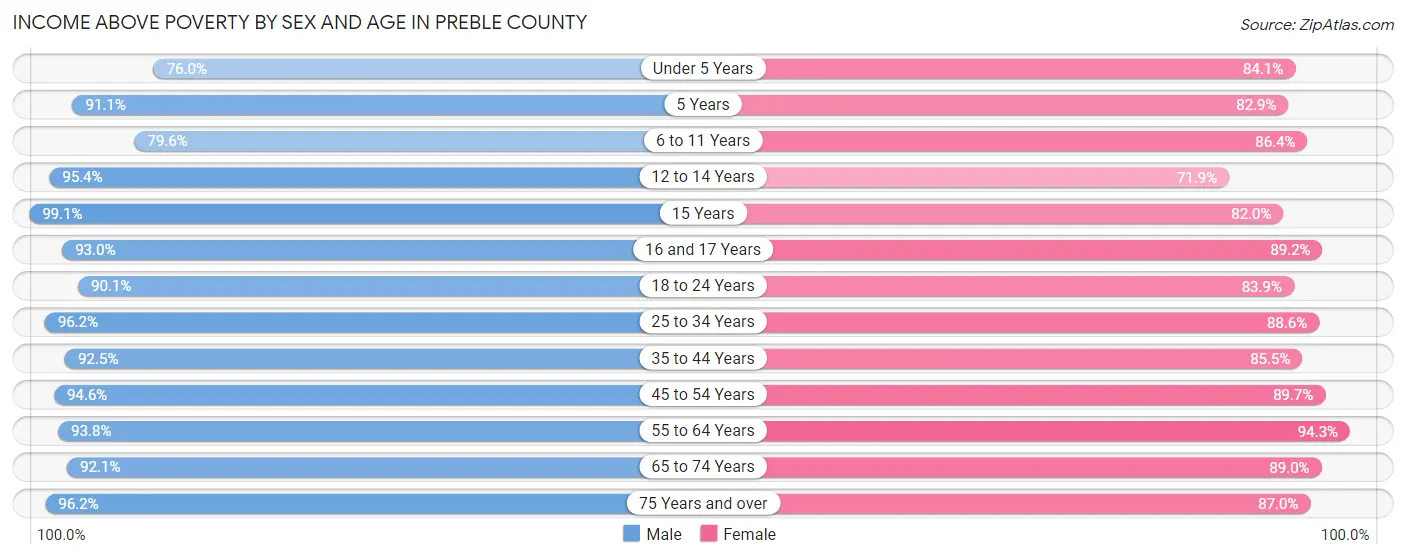
| Age Bracket | Male | Female |
| Under 5 Years | 828 (76.0%) | 864 (84.1%) |
| 5 Years | 143 (91.1%) | 213 (82.9%) |
| 6 to 11 Years | 1,355 (79.6%) | 1,273 (86.4%) |
| 12 to 14 Years | 788 (95.4%) | 488 (71.9%) |
| 15 Years | 344 (99.1%) | 286 (82.0%) |
| 16 and 17 Years | 479 (93.0%) | 463 (89.2%) |
| 18 to 24 Years | 1,462 (90.1%) | 1,259 (83.9%) |
| 25 to 34 Years | 2,200 (96.2%) | 2,074 (88.6%) |
| 35 to 44 Years | 2,194 (92.5%) | 2,005 (85.5%) |
| 45 to 54 Years | 2,551 (94.6%) | 2,382 (89.7%) |
| 55 to 64 Years | 2,766 (93.8%) | 2,886 (94.3%) |
| 65 to 74 Years | 2,100 (92.1%) | 2,214 (89.0%) |
| 75 Years and over | 1,301 (96.2%) | 1,453 (87.0%) |
| Total | 18,511 (91.6%) | 17,860 (87.7%) |
Income Below Poverty Among Married-Couple Families in Preble County
The poverty statistics for married-couple families in Preble County show that 3.4% or 305 of the total 8,970 families live below the poverty line. Families with 5 or more children have the highest poverty rate of 15.1%, comprising of 10 families. On the other hand, families with no children have the lowest poverty rate of 2.5%, which includes 137 families.
| Children | Above Poverty | Below Poverty |
| No Children | 5,415 (97.5%) | 137 (2.5%) |
| 1 or 2 Children | 2,519 (97.5%) | 65 (2.5%) |
| 3 or 4 Children | 675 (87.9%) | 93 (12.1%) |
| 5 or more Children | 56 (84.9%) | 10 (15.1%) |
| Total | 8,665 (96.6%) | 305 (3.4%) |
Income Below Poverty Among Single-Parent Households in Preble County
According to the poverty data in Preble County, 14.7% or 96 single-father households and 29.5% or 547 single-mother households are living below the poverty line. Among single-father households, those with 5 or more children have the highest poverty rate, with 32 households (100.0%) experiencing poverty. Likewise, among single-mother households, those with 3 or 4 children have the highest poverty rate, with 64 households (73.6%) falling below the poverty line.
| Children | Single Father | Single Mother |
| No Children | 32 (10.8%) | 62 (11.0%) |
| 1 or 2 Children | 29 (9.8%) | 381 (33.6%) |
| 3 or 4 Children | 3 (11.1%) | 64 (73.6%) |
| 5 or more Children | 32 (100.0%) | 40 (62.5%) |
| Total | 96 (14.7%) | 547 (29.5%) |
Income Below Poverty Among Married-Couple vs Single-Parent Households in Preble County
The poverty data for Preble County shows that 305 of the married-couple family households (3.4%) and 643 of the single-parent households (25.7%) are living below the poverty level. Within the married-couple family households, those with 5 or more children have the highest poverty rate, with 10 households (15.1%) falling below the poverty line. Among the single-parent households, those with 5 or more children have the highest poverty rate, with 72 household (75.0%) living below poverty.
| Children | Married-Couple Families | Single-Parent Households |
| No Children | 137 (2.5%) | 94 (10.9%) |
| 1 or 2 Children | 65 (2.5%) | 410 (28.6%) |
| 3 or 4 Children | 93 (12.1%) | 67 (58.8%) |
| 5 or more Children | 10 (15.1%) | 72 (75.0%) |
| Total | 305 (3.4%) | 643 (25.7%) |
Employment Characteristics in Preble County
Employment by Class of Employer in Preble County
Among the 19,524 employed individuals in Preble County, private company employees (13,688 | 70.1%), local government employees (1,813 | 9.3%), and not-for-profit organizations (1,632 | 8.4%) make up the most common classes of employment.
| Employer Class | # Employees | % Employees |
| Private Company Employees | 13,688 | 70.1% |
| Self-Employed (Incorporated) | 430 | 2.2% |
| Self-Employed (Not Incorporated) | 1,066 | 5.5% |
| Not-for-profit Organizations | 1,632 | 8.4% |
| Local Government Employees | 1,813 | 9.3% |
| State Government Employees | 624 | 3.2% |
| Federal Government Employees | 261 | 1.3% |
| Unpaid Family Workers | 10 | 0.1% |
| Total | 19,524 | 100.0% |
Employment Status by Age in Preble County
According to the labor force statistics for Preble County, out of the total population over 16 years of age (32,906), 62.7% or 20,632 individuals are in the labor force, with 3.4% or 701 of them unemployed. The age group with the highest labor force participation rate is 35 to 44 years, with 88.6% or 4,191 individuals in the labor force. Within the labor force, the 16 to 19 years age range has the highest percentage of unemployed individuals, with 13.6% or 126 of them being unemployed.
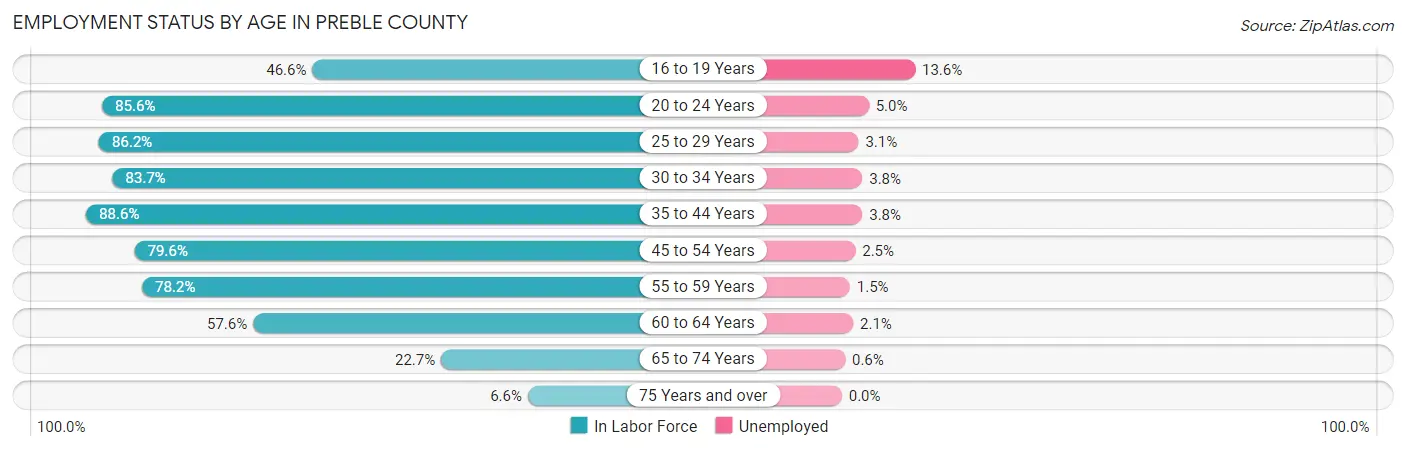
| Age Bracket | In Labor Force | Unemployed |
| 16 to 19 Years | 924 (46.6%) | 126 (13.6%) |
| 20 to 24 Years | 1,867 (85.6%) | 93 (5.0%) |
| 25 to 29 Years | 1,988 (86.2%) | 62 (3.1%) |
| 30 to 34 Years | 1,951 (83.7%) | 74 (3.8%) |
| 35 to 44 Years | 4,191 (88.6%) | 159 (3.8%) |
| 45 to 54 Years | 4,261 (79.6%) | 107 (2.5%) |
| 55 to 59 Years | 2,606 (78.2%) | 39 (1.5%) |
| 60 to 64 Years | 1,548 (57.6%) | 33 (2.1%) |
| 65 to 74 Years | 1,103 (22.7%) | 7 (0.6%) |
| 75 Years and over | 207 (6.6%) | 0 (0.0%) |
| Total | 20,632 (62.7%) | 701 (3.4%) |
Employment Status by Educational Attainment in Preble County
According to labor force statistics for Preble County, 79.8% of individuals (16,551) out of the total population between 25 and 64 years of age (20,740) are in the labor force, with 2.9% or 480 of them being unemployed. The group with the highest labor force participation rate are those with the educational attainment of bachelor's degree or higher, with 88.6% or 3,756 individuals in the labor force. Within the labor force, individuals with less than high school education have the highest percentage of unemployment, with 9.3% or 79 of them being unemployed.
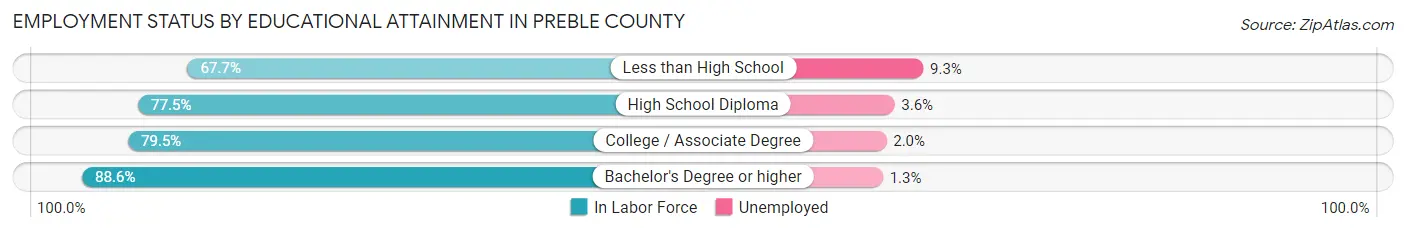
| Educational Attainment | In Labor Force | Unemployed |
| Less than High School | 848 (67.7%) | 116 (9.3%) |
| High School Diploma | 6,904 (77.5%) | 321 (3.6%) |
| College / Associate Degree | 5,041 (79.5%) | 127 (2.0%) |
| Bachelor's Degree or higher | 3,756 (88.6%) | 55 (1.3%) |
| Total | 16,551 (79.8%) | 601 (2.9%) |
Employment Occupations by Sex in Preble County
Management, Business, Science and Arts Occupations
The most common Management, Business, Science and Arts occupations in Preble County are Management (2,184 | 11.0%), Community & Social Service (1,469 | 7.4%), Health Diagnosing & Treating (1,460 | 7.3%), Computers, Engineering & Science (988 | 5.0%), and Health Technologists (976 | 4.9%).

Management, Business, Science and Arts Occupations by Sex
Within the Management, Business, Science and Arts occupations in Preble County, the most male-oriented occupations are Architecture & Engineering (94.8%), Computers, Engineering & Science (82.4%), and Computers & Mathematics (76.5%), while the most female-oriented occupations are Health Technologists (92.1%), Health Diagnosing & Treating (90.0%), and Education, Arts & Media (77.1%).
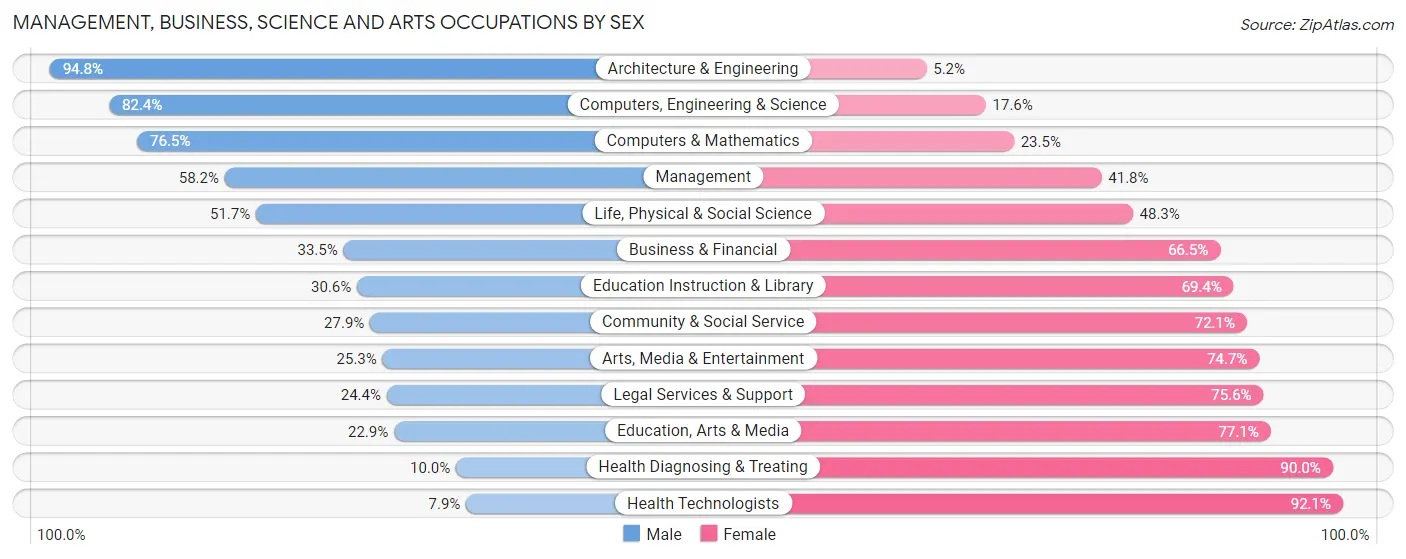
| Occupation | Male | Female |
| Management | 1,272 (58.2%) | 912 (41.8%) |
| Business & Financial | 180 (33.5%) | 358 (66.5%) |
| Computers, Engineering & Science | 814 (82.4%) | 174 (17.6%) |
| Computers & Mathematics | 251 (76.5%) | 77 (23.5%) |
| Architecture & Engineering | 488 (94.8%) | 27 (5.2%) |
| Life, Physical & Social Science | 75 (51.7%) | 70 (48.3%) |
| Community & Social Service | 410 (27.9%) | 1,059 (72.1%) |
| Education, Arts & Media | 86 (22.9%) | 289 (77.1%) |
| Legal Services & Support | 11 (24.4%) | 34 (75.6%) |
| Education Instruction & Library | 273 (30.6%) | 618 (69.4%) |
| Arts, Media & Entertainment | 40 (25.3%) | 118 (74.7%) |
| Health Diagnosing & Treating | 146 (10.0%) | 1,314 (90.0%) |
| Health Technologists | 77 (7.9%) | 899 (92.1%) |
| Total (Category) | 2,822 (42.5%) | 3,817 (57.5%) |
| Total (Overall) | 10,602 (53.2%) | 9,336 (46.8%) |
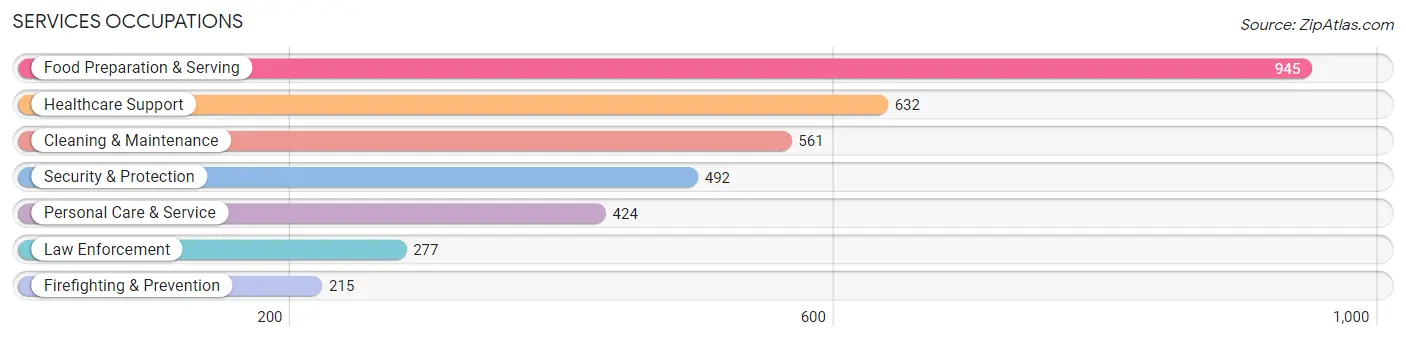
Services Occupations
The most common Services occupations in Preble County are Food Preparation & Serving (945 | 4.7%), Healthcare Support (632 | 3.2%), Cleaning & Maintenance (561 | 2.8%), Security & Protection (492 | 2.5%), and Personal Care & Service (424 | 2.1%).
Services Occupations by Sex
Within the Services occupations in Preble County, the most male-oriented occupations are Firefighting & Prevention (82.8%), Cleaning & Maintenance (59.2%), and Security & Protection (55.3%), while the most female-oriented occupations are Healthcare Support (94.0%), Personal Care & Service (92.4%), and Law Enforcement (66.1%).
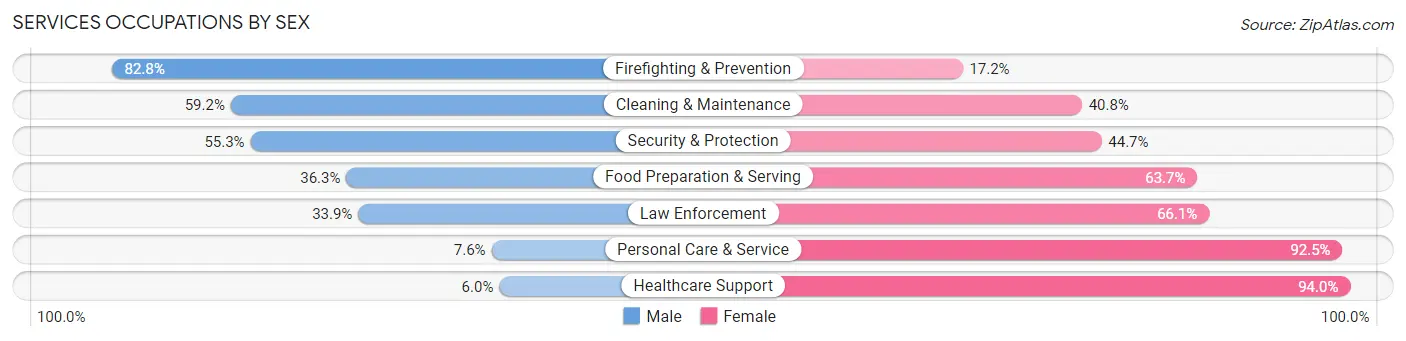
| Occupation | Male | Female |
| Healthcare Support | 38 (6.0%) | 594 (94.0%) |
| Security & Protection | 272 (55.3%) | 220 (44.7%) |
| Firefighting & Prevention | 178 (82.8%) | 37 (17.2%) |
| Law Enforcement | 94 (33.9%) | 183 (66.1%) |
| Food Preparation & Serving | 343 (36.3%) | 602 (63.7%) |
| Cleaning & Maintenance | 332 (59.2%) | 229 (40.8%) |
| Personal Care & Service | 32 (7.5%) | 392 (92.4%) |
| Total (Category) | 1,017 (33.3%) | 2,037 (66.7%) |
| Total (Overall) | 10,602 (53.2%) | 9,336 (46.8%) |
Sales and Office Occupations
The most common Sales and Office occupations in Preble County are Office & Administration (2,036 | 10.2%), and Sales & Related (1,491 | 7.5%).

Sales and Office Occupations by Sex

| Occupation | Male | Female |
| Sales & Related | 624 (41.8%) | 867 (58.2%) |
| Office & Administration | 489 (24.0%) | 1,547 (76.0%) |
| Total (Category) | 1,113 (31.6%) | 2,414 (68.4%) |
| Total (Overall) | 10,602 (53.2%) | 9,336 (46.8%) |
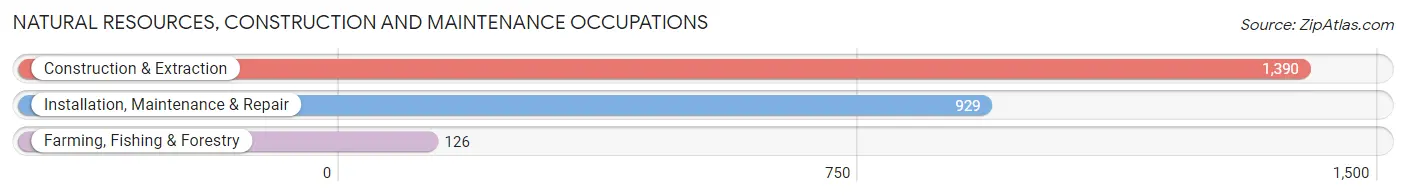
Natural Resources, Construction and Maintenance Occupations
The most common Natural Resources, Construction and Maintenance occupations in Preble County are Construction & Extraction (1,390 | 7.0%), Installation, Maintenance & Repair (929 | 4.7%), and Farming, Fishing & Forestry (126 | 0.6%).
Natural Resources, Construction and Maintenance Occupations by Sex
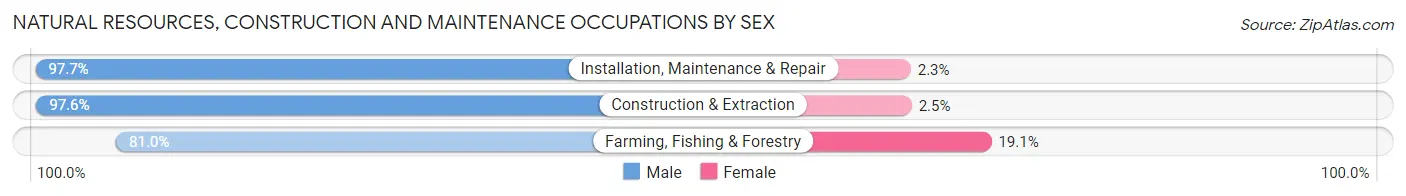
| Occupation | Male | Female |
| Farming, Fishing & Forestry | 102 (80.9%) | 24 (19.1%) |
| Construction & Extraction | 1,356 (97.6%) | 34 (2.5%) |
| Installation, Maintenance & Repair | 908 (97.7%) | 21 (2.3%) |
| Total (Category) | 2,366 (96.8%) | 79 (3.2%) |
| Total (Overall) | 10,602 (53.2%) | 9,336 (46.8%) |
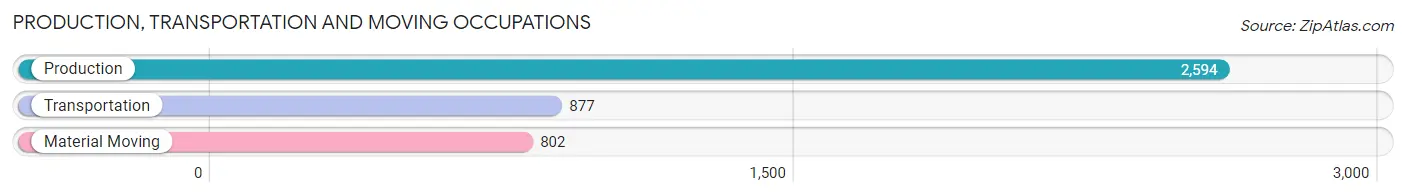
Production, Transportation and Moving Occupations
The most common Production, Transportation and Moving occupations in Preble County are Production (2,594 | 13.0%), Transportation (877 | 4.4%), and Material Moving (802 | 4.0%).
Production, Transportation and Moving Occupations by Sex

| Occupation | Male | Female |
| Production | 1,929 (74.4%) | 665 (25.6%) |
| Transportation | 751 (85.6%) | 126 (14.4%) |
| Material Moving | 604 (75.3%) | 198 (24.7%) |
| Total (Category) | 3,284 (76.8%) | 989 (23.2%) |
| Total (Overall) | 10,602 (53.2%) | 9,336 (46.8%) |
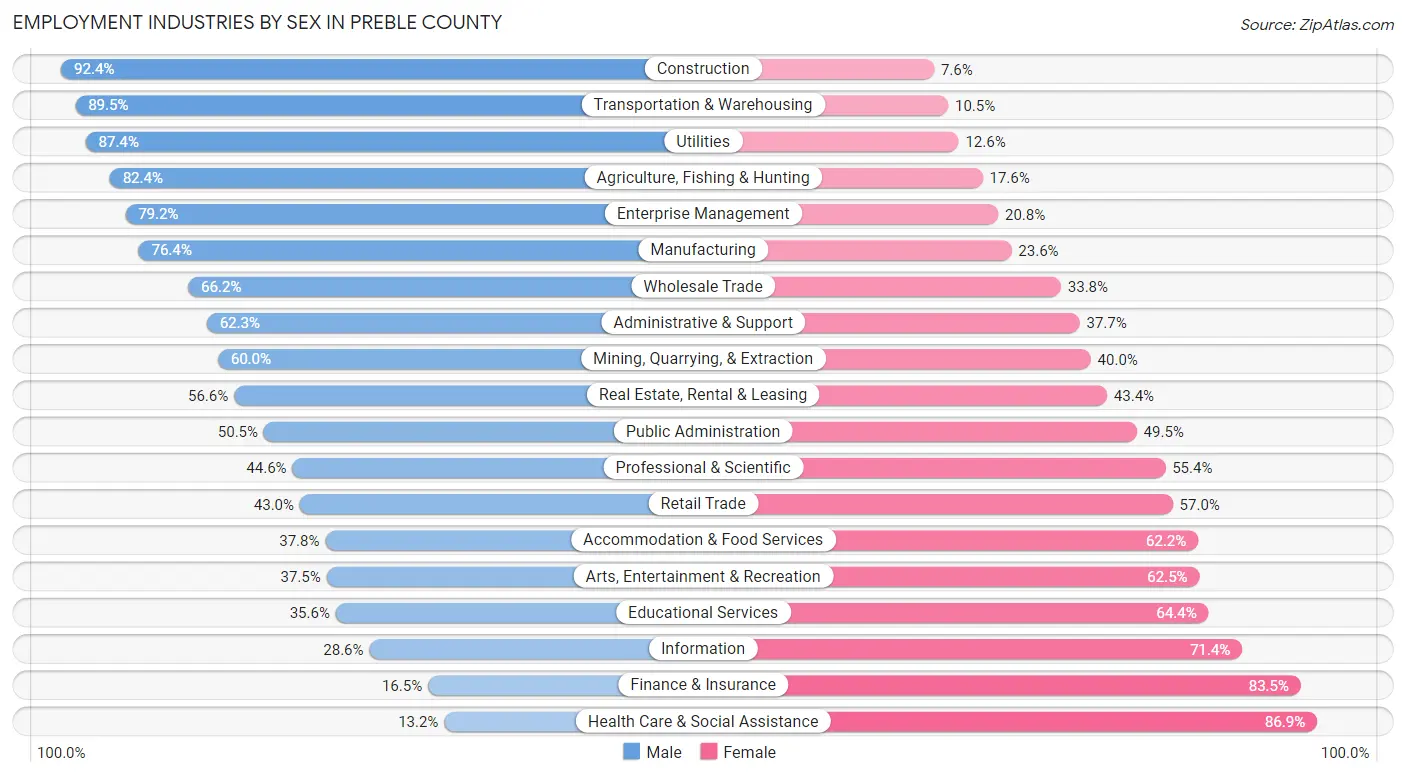
Employment Industries by Sex in Preble County
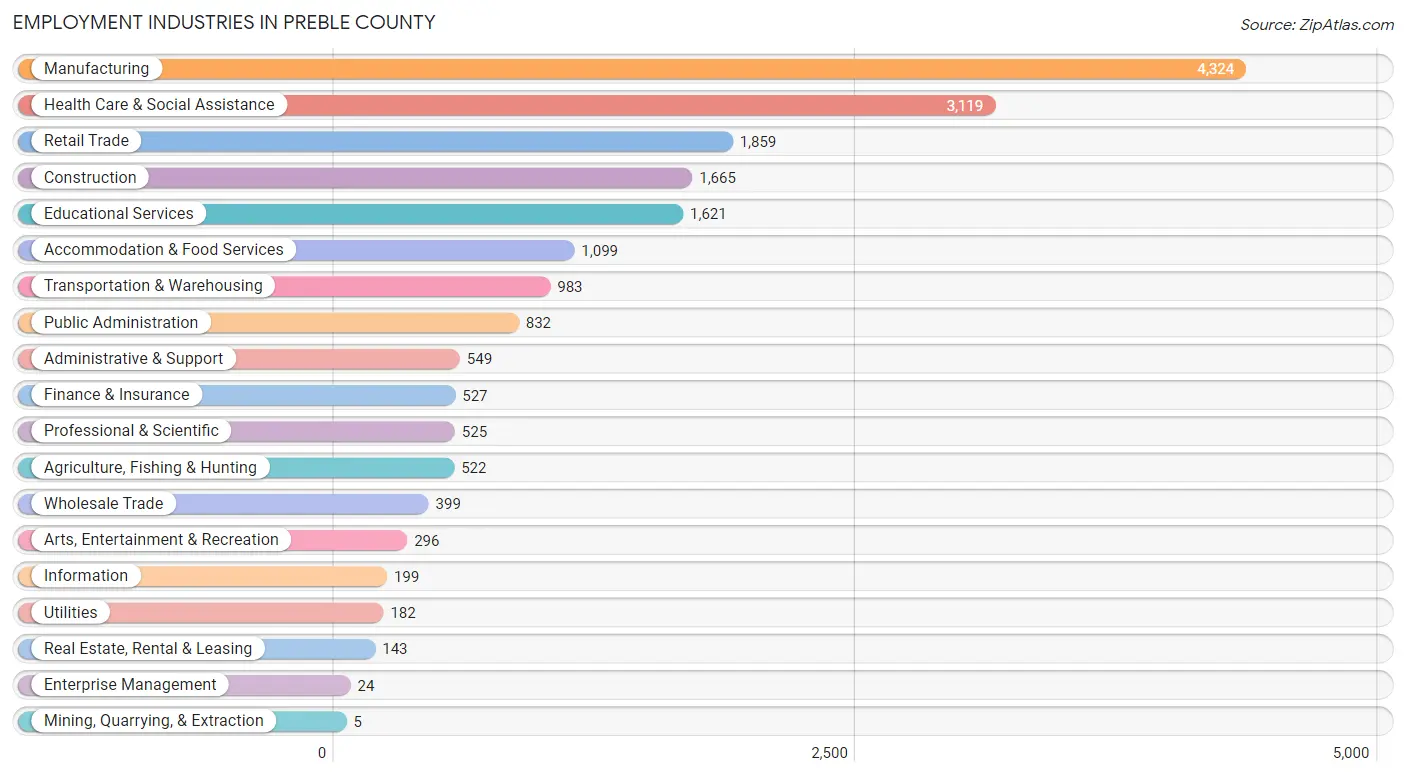
Employment Industries in Preble County
The major employment industries in Preble County include Manufacturing (4,324 | 21.7%), Health Care & Social Assistance (3,119 | 15.6%), Retail Trade (1,859 | 9.3%), Construction (1,665 | 8.4%), and Educational Services (1,621 | 8.1%).
Employment Industries by Sex in Preble County
The Preble County industries that see more men than women are Construction (92.4%), Transportation & Warehousing (89.5%), and Utilities (87.4%), whereas the industries that tend to have a higher number of women are Health Care & Social Assistance (86.9%), Finance & Insurance (83.5%), and Information (71.4%).
| Industry | Male | Female |
| Agriculture, Fishing & Hunting | 430 (82.4%) | 92 (17.6%) |
| Mining, Quarrying, & Extraction | 3 (60.0%) | 2 (40.0%) |
| Construction | 1,539 (92.4%) | 126 (7.6%) |
| Manufacturing | 3,304 (76.4%) | 1,020 (23.6%) |
| Wholesale Trade | 264 (66.2%) | 135 (33.8%) |
| Retail Trade | 800 (43.0%) | 1,059 (57.0%) |
| Transportation & Warehousing | 880 (89.5%) | 103 (10.5%) |
| Utilities | 159 (87.4%) | 23 (12.6%) |
| Information | 57 (28.6%) | 142 (71.4%) |
| Finance & Insurance | 87 (16.5%) | 440 (83.5%) |
| Real Estate, Rental & Leasing | 81 (56.6%) | 62 (43.4%) |
| Professional & Scientific | 234 (44.6%) | 291 (55.4%) |
| Enterprise Management | 19 (79.2%) | 5 (20.8%) |
| Administrative & Support | 342 (62.3%) | 207 (37.7%) |
| Educational Services | 577 (35.6%) | 1,044 (64.4%) |
| Health Care & Social Assistance | 410 (13.2%) | 2,709 (86.9%) |
| Arts, Entertainment & Recreation | 111 (37.5%) | 185 (62.5%) |
| Accommodation & Food Services | 415 (37.8%) | 684 (62.2%) |
| Public Administration | 420 (50.5%) | 412 (49.5%) |
| Total | 10,602 (53.2%) | 9,336 (46.8%) |
Education in Preble County
School Enrollment in Preble County
The most common levels of schooling among the 8,435 students in Preble County are high school (2,247 | 26.6%), middle school (2,117 | 25.1%), and elementary school (1,782 | 21.1%).

| School Level | # Students | % Students |
| Nursery / Preschool | 409 | 4.9% |
| Kindergarten | 405 | 4.8% |
| Elementary School | 1,782 | 21.1% |
| Middle School | 2,117 | 25.1% |
| High School | 2,247 | 26.6% |
| College / Undergraduate | 1,311 | 15.5% |
| Graduate / Professional | 164 | 1.9% |
| Total | 8,435 | 100.0% |
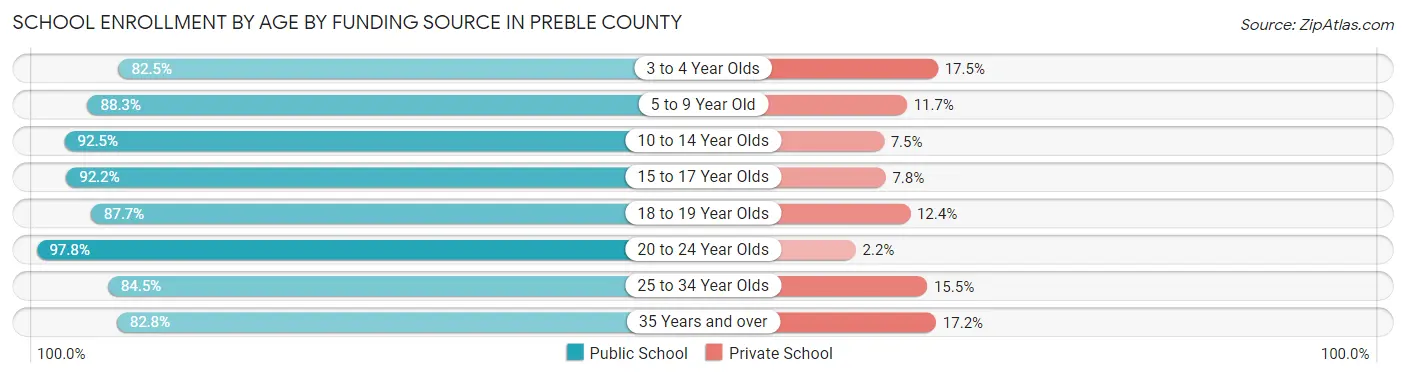
School Enrollment by Age by Funding Source in Preble County
Out of a total of 8,435 students who are enrolled in schools in Preble County, 793 (9.4%) attend a private institution, while the remaining 7,642 (90.6%) are enrolled in public schools. The age group of 3 to 4 year olds has the highest likelihood of being enrolled in private schools, with 48 (17.5% in the age bracket) enrolled. Conversely, the age group of 20 to 24 year olds has the lowest likelihood of being enrolled in a private school, with 661 (97.8% in the age bracket) attending a public institution.
| Age Bracket | Public School | Private School |
| 3 to 4 Year Olds | 226 (82.5%) | 48 (17.5%) |
| 5 to 9 Year Old | 1,707 (88.3%) | 227 (11.7%) |
| 10 to 14 Year Olds | 2,481 (92.5%) | 200 (7.5%) |
| 15 to 17 Year Olds | 1,530 (92.2%) | 129 (7.8%) |
| 18 to 19 Year Olds | 589 (87.6%) | 83 (12.3%) |
| 20 to 24 Year Olds | 661 (97.8%) | 15 (2.2%) |
| 25 to 34 Year Olds | 234 (84.5%) | 43 (15.5%) |
| 35 Years and over | 217 (82.8%) | 45 (17.2%) |
| Total | 7,642 (90.6%) | 793 (9.4%) |
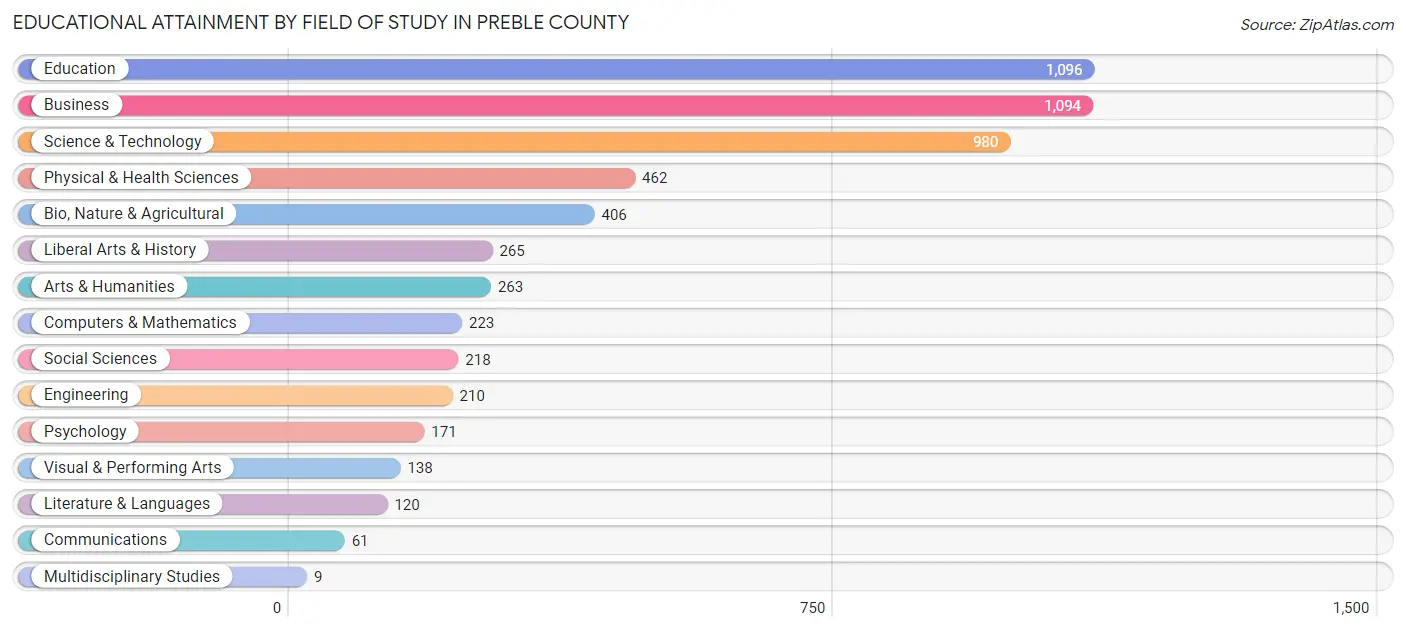
Educational Attainment by Field of Study in Preble County
Education (1,096 | 19.2%), business (1,094 | 19.1%), science & technology (980 | 17.1%), physical & health sciences (462 | 8.1%), and bio, nature & agricultural (406 | 7.1%) are the most common fields of study among 5,716 individuals in Preble County who have obtained a bachelor's degree or higher.
| Field of Study | # Graduates | % Graduates |
| Computers & Mathematics | 223 | 3.9% |
| Bio, Nature & Agricultural | 406 | 7.1% |
| Physical & Health Sciences | 462 | 8.1% |
| Psychology | 171 | 3.0% |
| Social Sciences | 218 | 3.8% |
| Engineering | 210 | 3.7% |
| Multidisciplinary Studies | 9 | 0.2% |
| Science & Technology | 980 | 17.1% |
| Business | 1,094 | 19.1% |
| Education | 1,096 | 19.2% |
| Literature & Languages | 120 | 2.1% |
| Liberal Arts & History | 265 | 4.6% |
| Visual & Performing Arts | 138 | 2.4% |
| Communications | 61 | 1.1% |
| Arts & Humanities | 263 | 4.6% |
| Total | 5,716 | 100.0% |
Transportation & Commute in Preble County
Vehicle Availability by Sex in Preble County
The most prevalent vehicle ownership categories in Preble County are males with 2 vehicles (3,993, accounting for 38.1%) and females with 2 vehicles (3,516, making up 44.4%).
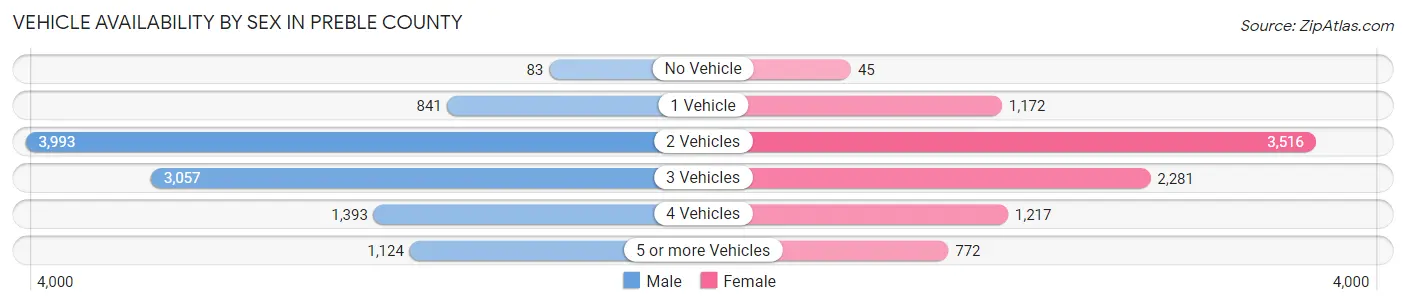
| Vehicles Available | Male | Female |
| No Vehicle | 83 (0.8%) | 45 (0.5%) |
| 1 Vehicle | 841 (8.0%) | 1,172 (13.0%) |
| 2 Vehicles | 3,993 (38.1%) | 3,516 (39.1%) |
| 3 Vehicles | 3,057 (29.1%) | 2,281 (25.3%) |
| 4 Vehicles | 1,393 (13.3%) | 1,217 (13.5%) |
| 5 or more Vehicles | 1,124 (10.7%) | 772 (8.6%) |
| Total | 10,491 (100.0%) | 9,003 (100.0%) |
Commute Time in Preble County
The most frequently occuring commute durations in Preble County are 15 to 19 minutes (2,451 commuters, 13.4%), 45 to 59 minutes (2,238 commuters, 12.2%), and 20 to 24 minutes (2,221 commuters, 12.1%).
| Commute Time | # Commuters | % Commuters |
| Less than 5 Minutes | 874 | 4.8% |
| 5 to 9 Minutes | 2,181 | 11.9% |
| 10 to 14 Minutes | 2,100 | 11.5% |
| 15 to 19 Minutes | 2,451 | 13.4% |
| 20 to 24 Minutes | 2,221 | 12.1% |
| 25 to 29 Minutes | 1,217 | 6.6% |
| 30 to 34 Minutes | 1,938 | 10.6% |
| 35 to 39 Minutes | 814 | 4.4% |
| 40 to 44 Minutes | 1,114 | 6.1% |
| 45 to 59 Minutes | 2,238 | 12.2% |
| 60 to 89 Minutes | 898 | 4.9% |
| 90 or more Minutes | 299 | 1.6% |
Commute Time by Sex in Preble County
The most common commute times in Preble County are 45 to 59 minutes (1,373 commuters, 13.6%) for males and 15 to 19 minutes (1,258 commuters, 15.2%) for females.

| Commute Time | Male | Female |
| Less than 5 Minutes | 420 (4.2%) | 454 (5.5%) |
| 5 to 9 Minutes | 1,292 (12.8%) | 889 (10.7%) |
| 10 to 14 Minutes | 986 (9.8%) | 1,114 (13.5%) |
| 15 to 19 Minutes | 1,193 (11.8%) | 1,258 (15.2%) |
| 20 to 24 Minutes | 1,105 (11.0%) | 1,116 (13.5%) |
| 25 to 29 Minutes | 630 (6.2%) | 587 (7.1%) |
| 30 to 34 Minutes | 986 (9.8%) | 952 (11.5%) |
| 35 to 39 Minutes | 484 (4.8%) | 330 (4.0%) |
| 40 to 44 Minutes | 750 (7.4%) | 364 (4.4%) |
| 45 to 59 Minutes | 1,373 (13.6%) | 865 (10.5%) |
| 60 to 89 Minutes | 600 (6.0%) | 298 (3.6%) |
| 90 or more Minutes | 256 (2.5%) | 43 (0.5%) |
Time of Departure to Work by Sex in Preble County
The most frequent times of departure to work in Preble County are 6:30 AM to 6:59 AM (1,378, 13.7%) for males and 7:00 AM to 7:29 AM (1,342, 16.2%) for females.

| Time of Departure | Male | Female |
| 12:00 AM to 4:59 AM | 623 (6.2%) | 347 (4.2%) |
| 5:00 AM to 5:29 AM | 728 (7.2%) | 194 (2.4%) |
| 5:30 AM to 5:59 AM | 797 (7.9%) | 606 (7.3%) |
| 6:00 AM to 6:29 AM | 1,073 (10.6%) | 486 (5.9%) |
| 6:30 AM to 6:59 AM | 1,378 (13.7%) | 867 (10.5%) |
| 7:00 AM to 7:29 AM | 1,259 (12.5%) | 1,342 (16.2%) |
| 7:30 AM to 7:59 AM | 960 (9.5%) | 1,270 (15.4%) |
| 8:00 AM to 8:29 AM | 620 (6.1%) | 784 (9.5%) |
| 8:30 AM to 8:59 AM | 194 (1.9%) | 252 (3.0%) |
| 9:00 AM to 9:59 AM | 218 (2.2%) | 481 (5.8%) |
| 10:00 AM to 10:59 AM | 130 (1.3%) | 221 (2.7%) |
| 11:00 AM to 11:59 AM | 147 (1.5%) | 39 (0.5%) |
| 12:00 PM to 3:59 PM | 868 (8.6%) | 770 (9.3%) |
| 4:00 PM to 11:59 PM | 1,080 (10.7%) | 611 (7.4%) |
| Total | 10,075 (100.0%) | 8,270 (100.0%) |
Housing Occupancy in Preble County
Occupancy by Ownership in Preble County
Of the total 16,606 dwellings in Preble County, owner-occupied units account for 13,260 (79.8%), while renter-occupied units make up 3,346 (20.2%).
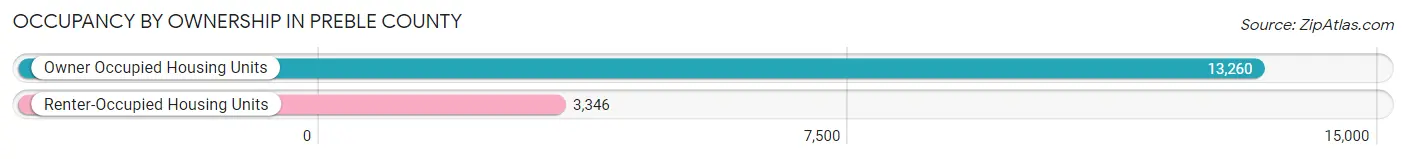
| Occupancy | # Housing Units | % Housing Units |
| Owner Occupied Housing Units | 13,260 | 79.8% |
| Renter-Occupied Housing Units | 3,346 | 20.2% |
| Total Occupied Housing Units | 16,606 | 100.0% |
Occupancy by Household Size in Preble County
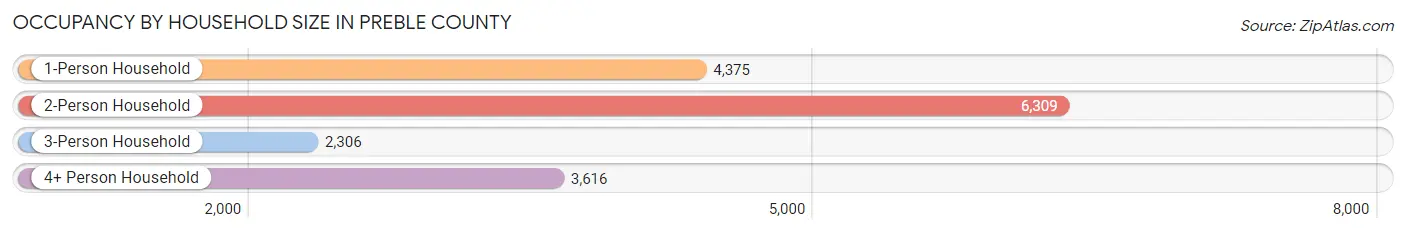
| Household Size | # Housing Units | % Housing Units |
| 1-Person Household | 4,375 | 26.4% |
| 2-Person Household | 6,309 | 38.0% |
| 3-Person Household | 2,306 | 13.9% |
| 4+ Person Household | 3,616 | 21.8% |
| Total Housing Units | 16,606 | 100.0% |
Occupancy by Ownership by Household Size in Preble County
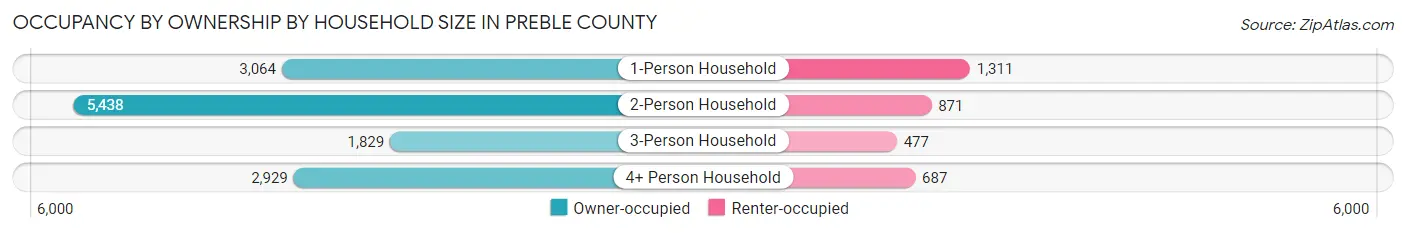
| Household Size | Owner-occupied | Renter-occupied |
| 1-Person Household | 3,064 (70.0%) | 1,311 (30.0%) |
| 2-Person Household | 5,438 (86.2%) | 871 (13.8%) |
| 3-Person Household | 1,829 (79.3%) | 477 (20.7%) |
| 4+ Person Household | 2,929 (81.0%) | 687 (19.0%) |
| Total Housing Units | 13,260 (79.8%) | 3,346 (20.2%) |
Occupancy by Educational Attainment in Preble County
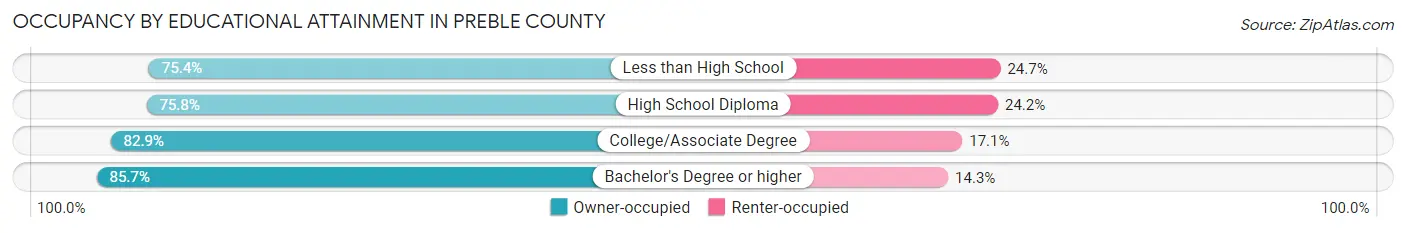
| Household Size | Owner-occupied | Renter-occupied |
| Less than High School | 981 (75.3%) | 321 (24.6%) |
| High School Diploma | 5,290 (75.8%) | 1,686 (24.2%) |
| College/Associate Degree | 4,460 (82.9%) | 918 (17.1%) |
| Bachelor's Degree or higher | 2,529 (85.7%) | 421 (14.3%) |
Occupancy by Age of Householder in Preble County
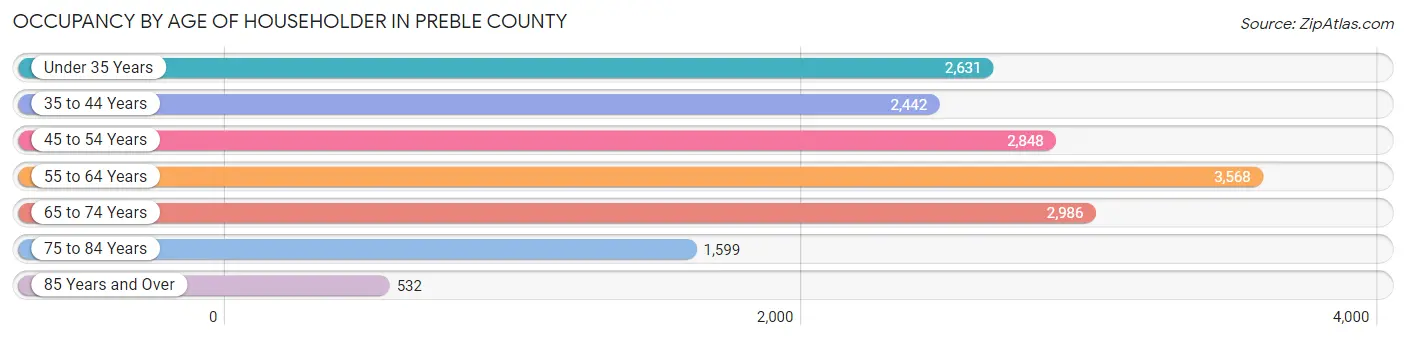
| Age Bracket | # Households | % Households |
| Under 35 Years | 2,631 | 15.8% |
| 35 to 44 Years | 2,442 | 14.7% |
| 45 to 54 Years | 2,848 | 17.2% |
| 55 to 64 Years | 3,568 | 21.5% |
| 65 to 74 Years | 2,986 | 18.0% |
| 75 to 84 Years | 1,599 | 9.6% |
| 85 Years and Over | 532 | 3.2% |
| Total | 16,606 | 100.0% |
Housing Finances in Preble County
Median Income by Occupancy in Preble County
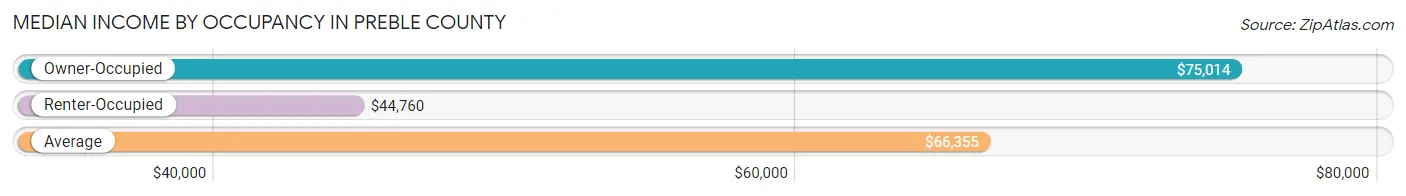
| Occupancy Type | # Households | Median Income |
| Owner-Occupied | 13,260 (79.8%) | $75,014 |
| Renter-Occupied | 3,346 (20.2%) | $44,760 |
| Average | 16,606 (100.0%) | $66,355 |
Occupancy by Householder Income Bracket in Preble County

| Income Bracket | Owner-occupied | Renter-occupied |
| Less than $5,000 | 240 (1.8%) | 153 (4.6%) |
| $5,000 to $9,999 | 113 (0.9%) | 180 (5.4%) |
| $10,000 to $14,999 | 325 (2.5%) | 240 (7.2%) |
| $15,000 to $19,999 | 420 (3.2%) | 171 (5.1%) |
| $20,000 to $24,999 | 453 (3.4%) | 161 (4.8%) |
| $25,000 to $34,999 | 772 (5.8%) | 465 (13.9%) |
| $35,000 to $49,999 | 1,796 (13.5%) | 544 (16.3%) |
| $50,000 to $74,999 | 2,509 (18.9%) | 835 (25.0%) |
| $75,000 to $99,999 | 1,960 (14.8%) | 376 (11.2%) |
| $100,000 to $149,999 | 2,833 (21.4%) | 116 (3.5%) |
| $150,000 or more | 1,839 (13.9%) | 105 (3.1%) |
| Total | 13,260 (100.0%) | 3,346 (100.0%) |
Monthly Housing Cost Tiers in Preble County
| Monthly Cost | Owner-occupied | Renter-occupied |
| Less than $300 | 494 (3.7%) | 118 (3.5%) |
| $300 to $499 | 2,499 (18.9%) | 324 (9.7%) |
| $500 to $799 | 2,874 (21.7%) | 1,056 (31.6%) |
| $800 to $999 | 1,519 (11.5%) | 877 (26.2%) |
| $1,000 to $1,499 | 3,626 (27.4%) | 505 (15.1%) |
| $1,500 to $1,999 | 1,455 (11.0%) | 82 (2.5%) |
| $2,000 to $2,499 | 471 (3.5%) | 32 (1.0%) |
| $2,500 to $2,999 | 119 (0.9%) | 26 (0.8%) |
| $3,000 or more | 203 (1.5%) | 0 (0.0%) |
| Total | 13,260 (100.0%) | 3,346 (100.0%) |
Physical Housing Characteristics in Preble County
Housing Structures in Preble County
| Structure Type | # Housing Units | % Housing Units |
| Single Unit, Detached | 14,716 | 88.6% |
| Single Unit, Attached | 302 | 1.8% |
| 2 Unit Apartments | 349 | 2.1% |
| 3 or 4 Unit Apartments | 348 | 2.1% |
| 5 to 9 Unit Apartments | 219 | 1.3% |
| 10 or more Apartments | 221 | 1.3% |
| Mobile Home / Other | 451 | 2.7% |
| Total | 16,606 | 100.0% |
Housing Structures by Occupancy in Preble County
| Structure Type | Owner-occupied | Renter-occupied |
| Single Unit, Detached | 12,794 (86.9%) | 1,922 (13.1%) |
| Single Unit, Attached | 144 (47.7%) | 158 (52.3%) |
| 2 Unit Apartments | 38 (10.9%) | 311 (89.1%) |
| 3 or 4 Unit Apartments | 0 (0.0%) | 348 (100.0%) |
| 5 to 9 Unit Apartments | 0 (0.0%) | 219 (100.0%) |
| 10 or more Apartments | 0 (0.0%) | 221 (100.0%) |
| Mobile Home / Other | 284 (63.0%) | 167 (37.0%) |
| Total | 13,260 (79.8%) | 3,346 (20.2%) |
Housing Structures by Number of Rooms in Preble County
| Number of Rooms | Owner-occupied | Renter-occupied |
| 1 Room | 30 (0.2%) | 23 (0.7%) |
| 2 or 3 Rooms | 237 (1.8%) | 382 (11.4%) |
| 4 or 5 Rooms | 3,462 (26.1%) | 1,482 (44.3%) |
| 6 or 7 Rooms | 5,859 (44.2%) | 1,133 (33.9%) |
| 8 or more Rooms | 3,672 (27.7%) | 326 (9.7%) |
| Total | 13,260 (100.0%) | 3,346 (100.0%) |
Housing Structure by Heating Type in Preble County
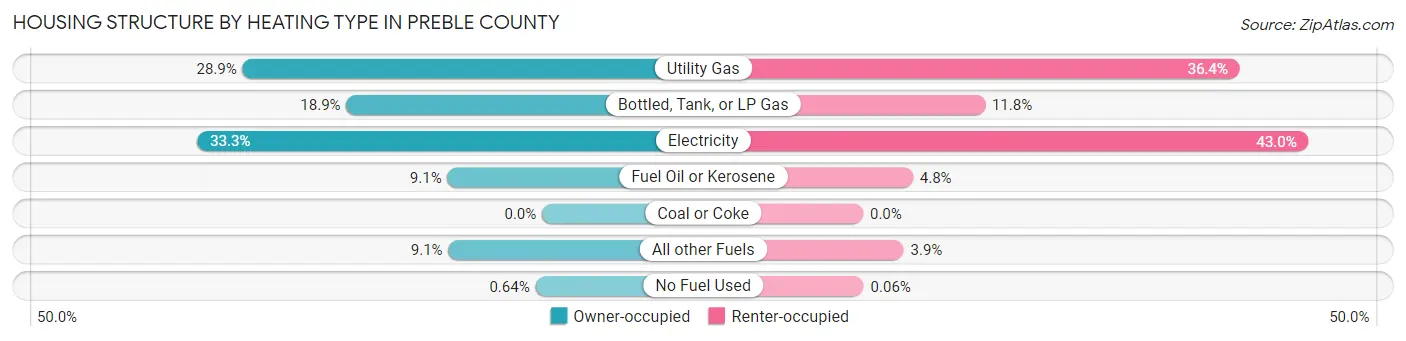
| Heating Type | Owner-occupied | Renter-occupied |
| Utility Gas | 3,837 (28.9%) | 1,218 (36.4%) |
| Bottled, Tank, or LP Gas | 2,507 (18.9%) | 394 (11.8%) |
| Electricity | 4,419 (33.3%) | 1,440 (43.0%) |
| Fuel Oil or Kerosene | 1,212 (9.1%) | 161 (4.8%) |
| Coal or Coke | 0 (0.0%) | 0 (0.0%) |
| All other Fuels | 1,200 (9.0%) | 131 (3.9%) |
| No Fuel Used | 85 (0.6%) | 2 (0.1%) |
| Total | 13,260 (100.0%) | 3,346 (100.0%) |
Household Vehicle Usage in Preble County
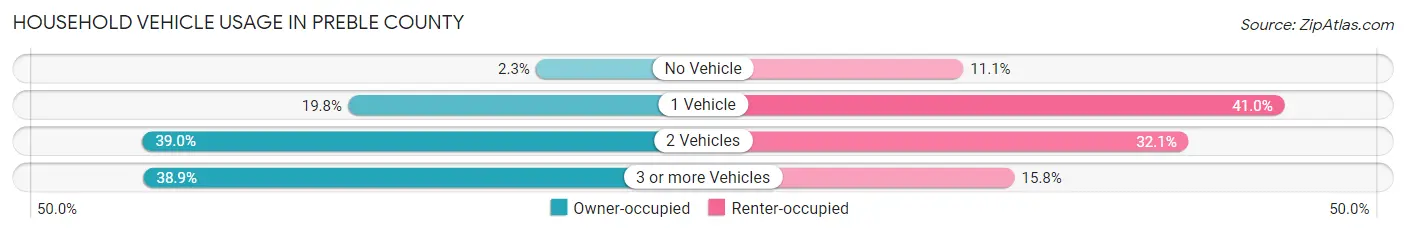
| Vehicles per Household | Owner-occupied | Renter-occupied |
| No Vehicle | 304 (2.3%) | 370 (11.1%) |
| 1 Vehicle | 2,629 (19.8%) | 1,373 (41.0%) |
| 2 Vehicles | 5,170 (39.0%) | 1,073 (32.1%) |
| 3 or more Vehicles | 5,157 (38.9%) | 530 (15.8%) |
| Total | 13,260 (100.0%) | 3,346 (100.0%) |
Real Estate & Mortgages in Preble County
Real Estate and Mortgage Overview in Preble County
| Characteristic | Without Mortgage | With Mortgage |
| Housing Units | 5,417 | 7,843 |
| Median Property Value | $145,000 | $167,200 |
| Median Household Income | $58,006 | $1,402 |
| Monthly Housing Costs | $485 | $203 |
| Real Estate Taxes | $1,737 | $136 |
Property Value by Mortgage Status in Preble County
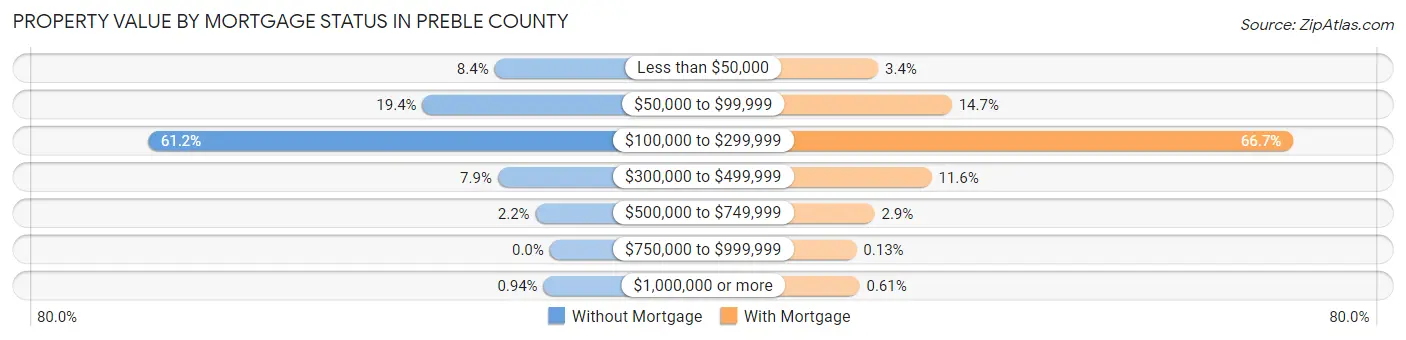
| Property Value | Without Mortgage | With Mortgage |
| Less than $50,000 | 455 (8.4%) | 270 (3.4%) |
| $50,000 to $99,999 | 1,050 (19.4%) | 1,150 (14.7%) |
| $100,000 to $299,999 | 3,316 (61.2%) | 5,230 (66.7%) |
| $300,000 to $499,999 | 428 (7.9%) | 908 (11.6%) |
| $500,000 to $749,999 | 117 (2.2%) | 227 (2.9%) |
| $750,000 to $999,999 | 0 (0.0%) | 10 (0.1%) |
| $1,000,000 or more | 51 (0.9%) | 48 (0.6%) |
| Total | 5,417 (100.0%) | 7,843 (100.0%) |
Household Income by Mortgage Status in Preble County
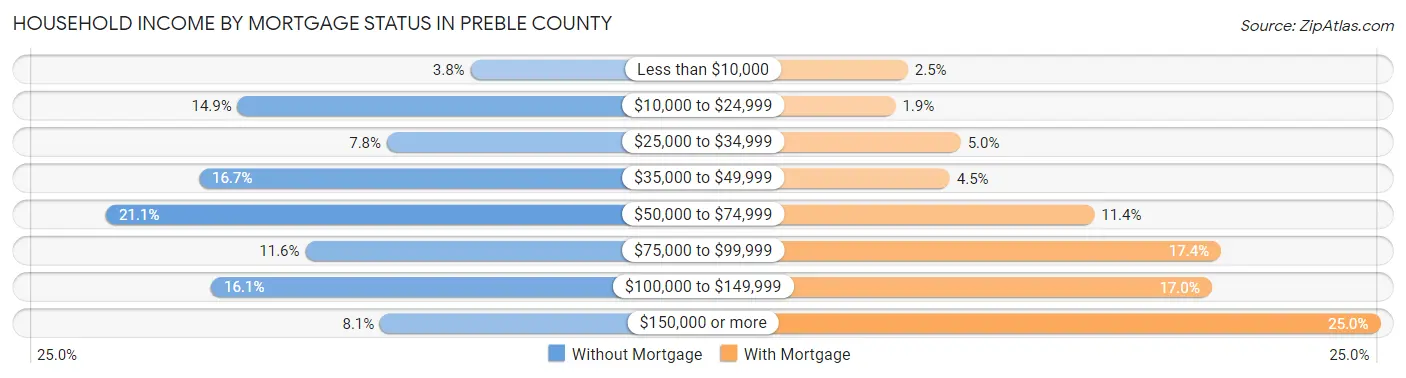
| Household Income | Without Mortgage | With Mortgage |
| Less than $10,000 | 204 (3.8%) | 195 (2.5%) |
| $10,000 to $24,999 | 805 (14.9%) | 149 (1.9%) |
| $25,000 to $34,999 | 420 (7.7%) | 393 (5.0%) |
| $35,000 to $49,999 | 904 (16.7%) | 352 (4.5%) |
| $50,000 to $74,999 | 1,144 (21.1%) | 892 (11.4%) |
| $75,000 to $99,999 | 630 (11.6%) | 1,365 (17.4%) |
| $100,000 to $149,999 | 873 (16.1%) | 1,330 (17.0%) |
| $150,000 or more | 437 (8.1%) | 1,960 (25.0%) |
| Total | 5,417 (100.0%) | 7,843 (100.0%) |
Property Value to Household Income Ratio in Preble County

| Value-to-Income Ratio | Without Mortgage | With Mortgage |
| Less than 2.0x | 2,095 (38.7%) | 86,755 (1,106.2%) |
| 2.0x to 2.9x | 1,132 (20.9%) | 4,130 (52.7%) |
| 3.0x to 3.9x | 610 (11.3%) | 1,644 (21.0%) |
| 4.0x or more | 1,535 (28.3%) | 682 (8.7%) |
| Total | 5,417 (100.0%) | 7,843 (100.0%) |
Real Estate Taxes by Mortgage Status in Preble County
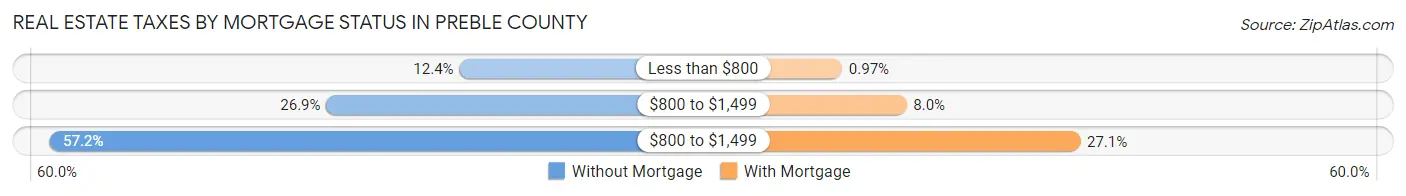
| Property Taxes | Without Mortgage | With Mortgage |
| Less than $800 | 669 (12.3%) | 76 (1.0%) |
| $800 to $1,499 | 1,459 (26.9%) | 630 (8.0%) |
| $800 to $1,499 | 3,099 (57.2%) | 2,123 (27.1%) |
| Total | 5,417 (100.0%) | 7,843 (100.0%) |
Health & Disability in Preble County
Health Insurance Coverage by Age in Preble County
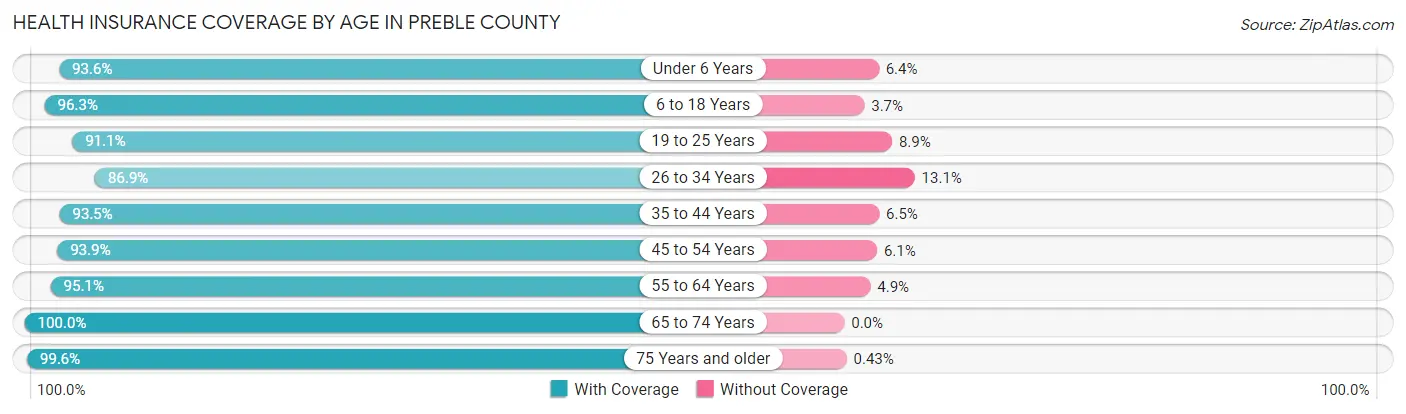
| Age Bracket | With Coverage | Without Coverage |
| Under 6 Years | 2,405 (93.6%) | 165 (6.4%) |
| 6 to 18 Years | 6,744 (96.3%) | 261 (3.7%) |
| 19 to 25 Years | 2,787 (91.1%) | 272 (8.9%) |
| 26 to 34 Years | 3,621 (86.9%) | 547 (13.1%) |
| 35 to 44 Years | 4,412 (93.5%) | 306 (6.5%) |
| 45 to 54 Years | 5,024 (93.9%) | 326 (6.1%) |
| 55 to 64 Years | 5,717 (95.1%) | 292 (4.9%) |
| 65 to 74 Years | 4,767 (100.0%) | 0 (0.0%) |
| 75 Years and older | 3,011 (99.6%) | 13 (0.4%) |
| Total | 38,488 (94.6%) | 2,182 (5.4%) |
Health Insurance Coverage by Citizenship Status in Preble County
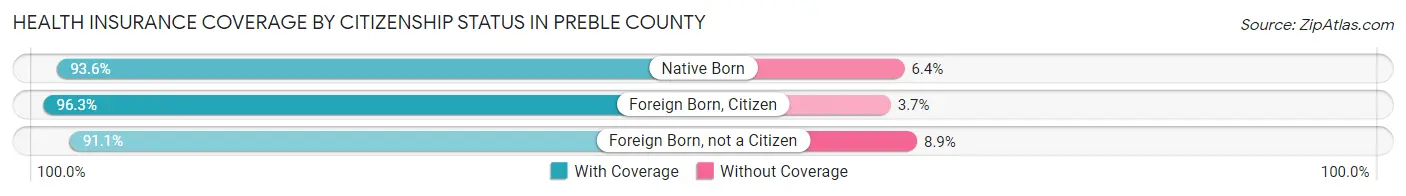
| Citizenship Status | With Coverage | Without Coverage |
| Native Born | 2,405 (93.6%) | 165 (6.4%) |
| Foreign Born, Citizen | 6,744 (96.3%) | 261 (3.7%) |
| Foreign Born, not a Citizen | 2,787 (91.1%) | 272 (8.9%) |
Health Insurance Coverage by Household Income in Preble County
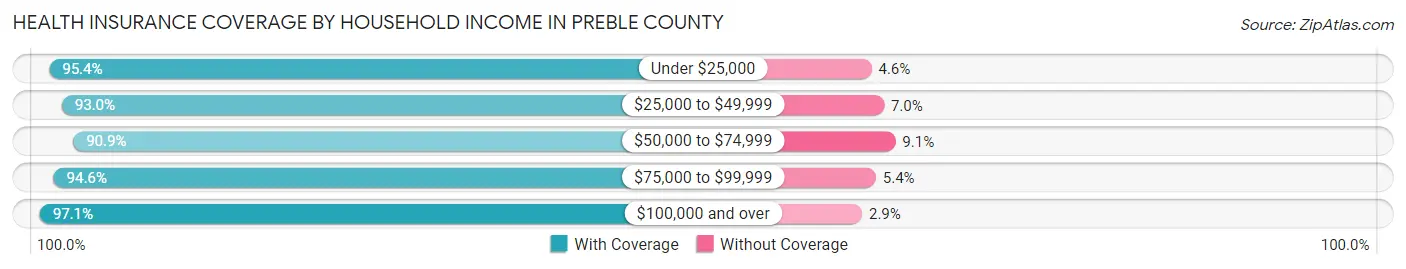
| Household Income | With Coverage | Without Coverage |
| Under $25,000 | 3,690 (95.4%) | 179 (4.6%) |
| $25,000 to $49,999 | 6,517 (93.0%) | 488 (7.0%) |
| $50,000 to $74,999 | 7,255 (90.9%) | 727 (9.1%) |
| $75,000 to $99,999 | 6,166 (94.6%) | 355 (5.4%) |
| $100,000 and over | 14,710 (97.1%) | 433 (2.9%) |
Public vs Private Health Insurance Coverage by Age in Preble County
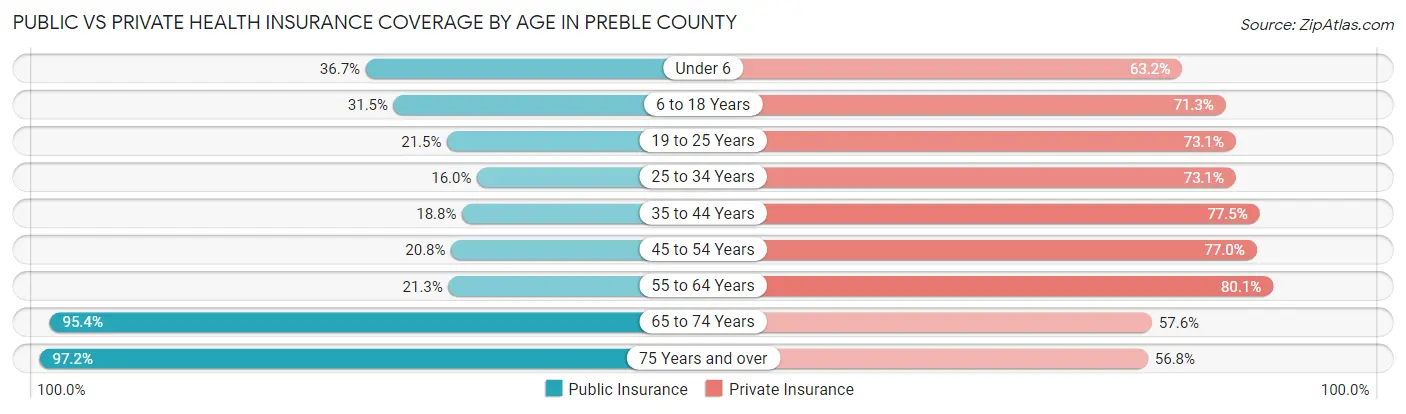
| Age Bracket | Public Insurance | Private Insurance |
| Under 6 | 942 (36.6%) | 1,623 (63.1%) |
| 6 to 18 Years | 2,204 (31.5%) | 4,991 (71.3%) |
| 19 to 25 Years | 659 (21.5%) | 2,237 (73.1%) |
| 25 to 34 Years | 666 (16.0%) | 3,048 (73.1%) |
| 35 to 44 Years | 885 (18.8%) | 3,658 (77.5%) |
| 45 to 54 Years | 1,112 (20.8%) | 4,119 (77.0%) |
| 55 to 64 Years | 1,280 (21.3%) | 4,811 (80.1%) |
| 65 to 74 Years | 4,546 (95.4%) | 2,744 (57.6%) |
| 75 Years and over | 2,940 (97.2%) | 1,718 (56.8%) |
| Total | 15,234 (37.5%) | 28,949 (71.2%) |
Disability Status by Sex by Age in Preble County
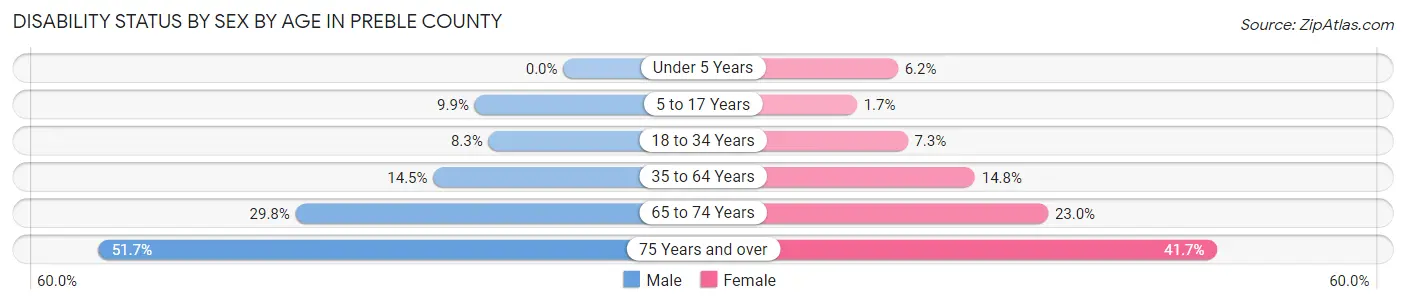
| Age Bracket | Male | Female |
| Under 5 Years | 0 (0.0%) | 64 (6.2%) |
| 5 to 17 Years | 357 (9.9%) | 55 (1.7%) |
| 18 to 34 Years | 325 (8.3%) | 281 (7.3%) |
| 35 to 64 Years | 1,161 (14.5%) | 1,194 (14.8%) |
| 65 to 74 Years | 680 (29.8%) | 571 (23.0%) |
| 75 Years and over | 700 (51.7%) | 697 (41.7%) |
Disability Class by Sex by Age in Preble County
Disability Class: Hearing Difficulty
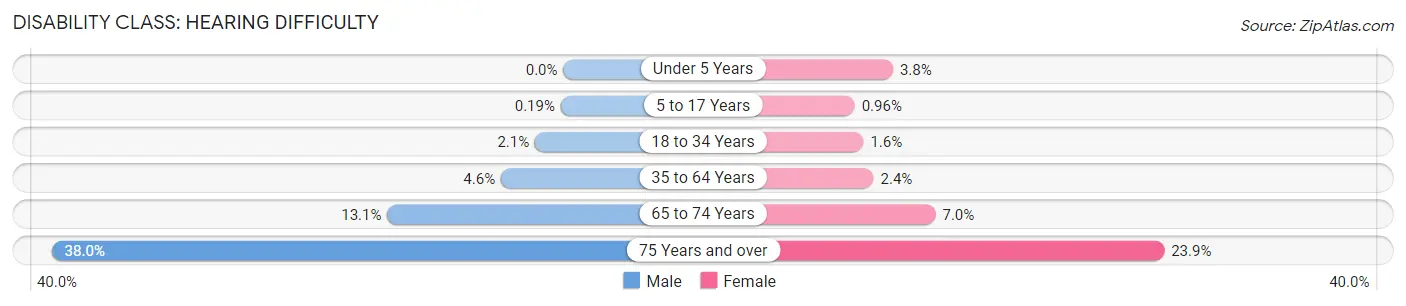
| Age Bracket | Male | Female |
| Under 5 Years | 0 (0.0%) | 39 (3.8%) |
| 5 to 17 Years | 7 (0.2%) | 32 (1.0%) |
| 18 to 34 Years | 82 (2.1%) | 62 (1.6%) |
| 35 to 64 Years | 371 (4.6%) | 190 (2.4%) |
| 65 to 74 Years | 298 (13.1%) | 173 (7.0%) |
| 75 Years and over | 514 (38.0%) | 400 (23.9%) |
Disability Class: Vision Difficulty

| Age Bracket | Male | Female |
| Under 5 Years | 0 (0.0%) | 25 (2.4%) |
| 5 to 17 Years | 41 (1.1%) | 0 (0.0%) |
| 18 to 34 Years | 13 (0.3%) | 36 (0.9%) |
| 35 to 64 Years | 232 (2.9%) | 79 (1.0%) |
| 65 to 74 Years | 132 (5.8%) | 135 (5.4%) |
| 75 Years and over | 206 (15.2%) | 204 (12.2%) |
Disability Class: Cognitive Difficulty
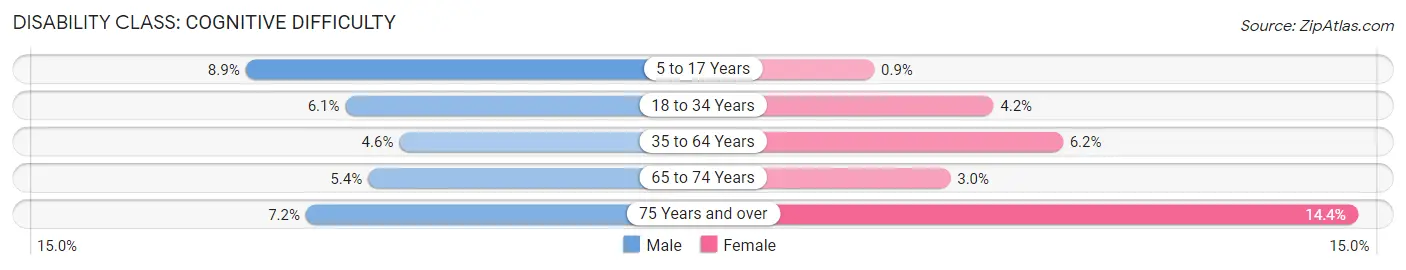
| Age Bracket | Male | Female |
| 5 to 17 Years | 320 (8.8%) | 30 (0.9%) |
| 18 to 34 Years | 237 (6.1%) | 162 (4.2%) |
| 35 to 64 Years | 366 (4.6%) | 496 (6.1%) |
| 65 to 74 Years | 124 (5.4%) | 75 (3.0%) |
| 75 Years and over | 97 (7.2%) | 240 (14.4%) |
Disability Class: Ambulatory Difficulty
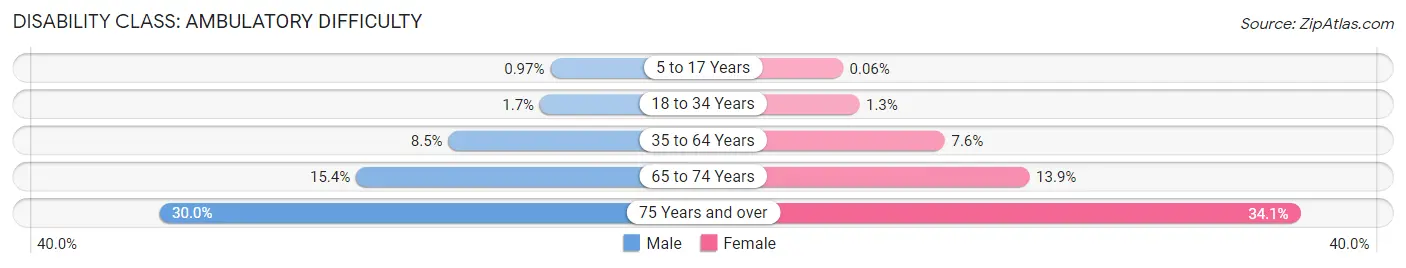
| Age Bracket | Male | Female |
| 5 to 17 Years | 35 (1.0%) | 2 (0.1%) |
| 18 to 34 Years | 68 (1.7%) | 49 (1.3%) |
| 35 to 64 Years | 684 (8.5%) | 615 (7.6%) |
| 65 to 74 Years | 351 (15.4%) | 346 (13.9%) |
| 75 Years and over | 406 (30.0%) | 569 (34.1%) |
Disability Class: Self-Care Difficulty
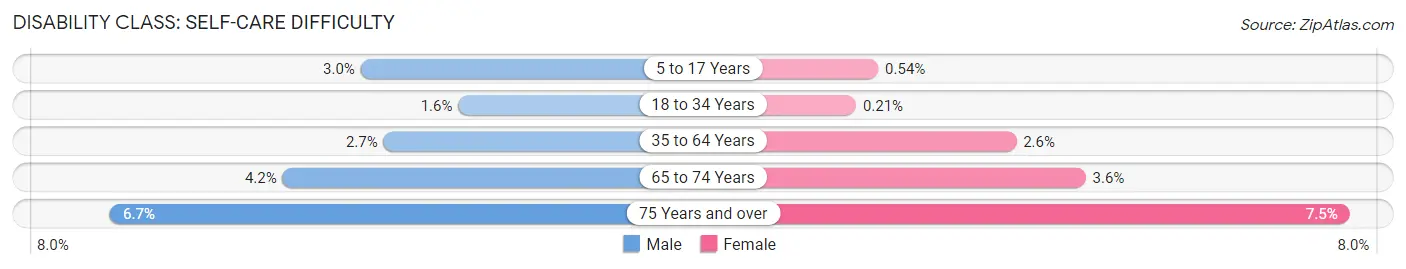
| Age Bracket | Male | Female |
| 5 to 17 Years | 109 (3.0%) | 18 (0.5%) |
| 18 to 34 Years | 61 (1.6%) | 8 (0.2%) |
| 35 to 64 Years | 214 (2.7%) | 209 (2.6%) |
| 65 to 74 Years | 95 (4.2%) | 90 (3.6%) |
| 75 Years and over | 91 (6.7%) | 126 (7.5%) |
Technology Access in Preble County
Computing Device Access in Preble County
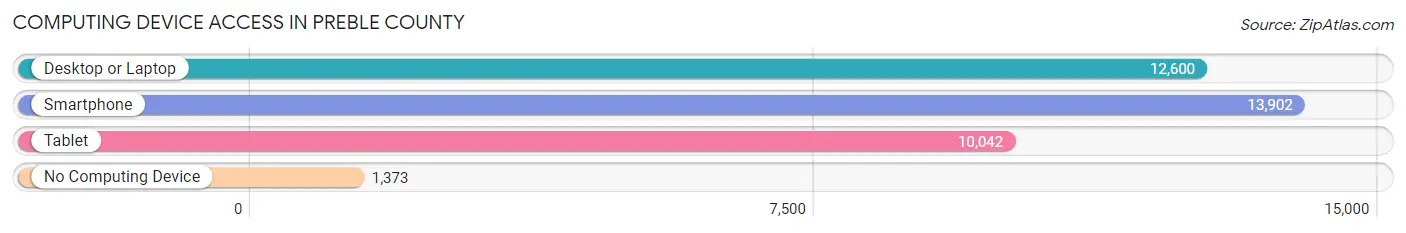
| Device Type | # Households | % Households |
| Desktop or Laptop | 12,600 | 75.9% |
| Smartphone | 13,902 | 83.7% |
| Tablet | 10,042 | 60.5% |
| No Computing Device | 1,373 | 8.3% |
| Total | 16,606 | 100.0% |
Internet Access in Preble County

| Internet Type | # Households | % Households |
| Dial-Up Internet | 60 | 0.4% |
| Broadband Home | 10,702 | 64.4% |
| Cellular Data Only | 2,281 | 13.7% |
| Satellite Internet | 1,372 | 8.3% |
| No Internet | 2,359 | 14.2% |
| Total | 16,606 | 100.0% |
Preble County Summary
Preble County is located in the southwestern corner of Ohio, and is part of the Dayton Metropolitan Statistical Area. It is bordered by Darke, Montgomery, Butler, and Warren counties. The county seat is Eaton, and the largest city is West Alexandria. The county was named after Commodore Edward Preble, an American naval officer during the War of 1812.
Geography
Preble County covers an area of 437 square miles, of which 434 square miles is land and 3 square miles is water. The county is located in the Great Black Swamp region of Ohio, and is mostly flat with some rolling hills. The county is drained by the Great Miami River, which flows through the county from north to south. The county is also home to several small lakes, including Twin Lakes, Lake Lakengren, and Lake Loramie.
The county is mostly rural, with the majority of the population living in small towns and villages. The largest city in the county is West Alexandria, with a population of 1,845. Other notable towns and villages include Eaton, Camden, West Elkton, Gratis, and Lewisburg.
Demographics
As of the 2010 census, Preble County had a population of 42,270. The racial makeup of the county was 95.3% White, 1.7% African American, 0.3% Native American, 0.5% Asian, 0.1% Pacific Islander, 0.7% from other races, and 1.4% from two or more races. Hispanic or Latino of any race were 2.2% of the population.
The median income for a household in the county was $45,845, and the median income for a family was $54,845. The per capita income for the county was $21,845. About 8.7% of families and 11.2% of the population were below the poverty line, including 15.2% of those under age 18 and 8.2% of those age 65 or over.
Economy
Preble County is largely agricultural, with the majority of the land being used for farming. The county is home to several large farms, including the Preble County Farm Bureau, which is the largest farm in the county. The county is also home to several small businesses, including manufacturing, retail, and service industries.
The county is home to several large employers, including the Preble County Board of Education, the Preble County Sheriff's Office, and the Preble County Courthouse. The county is also home to several small businesses, including restaurants, retail stores, and service providers.
The county is served by several major highways, including Interstate 70, U.S. Route 40, and State Route 127. The county is also served by several airports, including the Dayton International Airport, the Cincinnati/Northern Kentucky International Airport, and the James M. Cox Dayton International Airport.
Preble County is a great place to live, work, and play. With its rural setting, small towns, and friendly people, it is a great place to call home. The county is home to a variety of attractions, including the Preble County Historical Society, the Preble County Fairgrounds, and the Preble County Park District. The county is also home to several golf courses, parks, and recreational areas.
Common Questions
What is the Total Population of Preble County?
Total Population of Preble County is 40,929.
What is the Total Male Population of Preble County?
Total Male Population of Preble County is 20,382.
What is the Total Female Population of Preble County?
Total Female Population of Preble County is 20,547.
What is the Ratio of Males per 100 Females in Preble County?
There are 99.20 Males per 100 Females in Preble County.
What is the Ratio of Females per 100 Males in Preble County?
There are 100.81 Females per 100 Males in Preble County.
What is the Median Population Age in Preble County?
Median Population Age in Preble County is 43.0 Years.
What is the Average Family Size in Preble County
Average Family Size in Preble County is 2.9 People.
What is the Average Household Size in Preble County
Average Household Size in Preble County is 2.4 People.
What is Per Capita Income in Preble County?
Per Capita income in Preble County is $33,627.
What is the Median Family Income in Preble County?
Median Family Income in Preble County is $80,000.
What is the Median Household income in Preble County?
Median Household Income in Preble County is $66,355.
What is Income or Wage Gap in Preble County?
Income or Wage Gap in Preble County is 41.4%.
Women in Preble County earn 58.6 cents for every dollar earned by a man.
What is Family Income Deficit in Preble County?
Family Income Deficit in Preble County is $10,211.
Families that are below poverty line in Preble County earn $10,211 less on average than the poverty threshold level.
What is Inequality or Gini Index in Preble County?
Inequality or Gini Index in Preble County is 0.40.
How Large is the Labor Force in Preble County?
There are 20,632 People in the Labor Forcein in Preble County.
What is the Percentage of People in the Labor Force in Preble County?
62.7% of People are in the Labor Force in Preble County.
What is the Unemployment Rate in Preble County?
Unemployment Rate in Preble County is 3.4%.