Portage County, OH
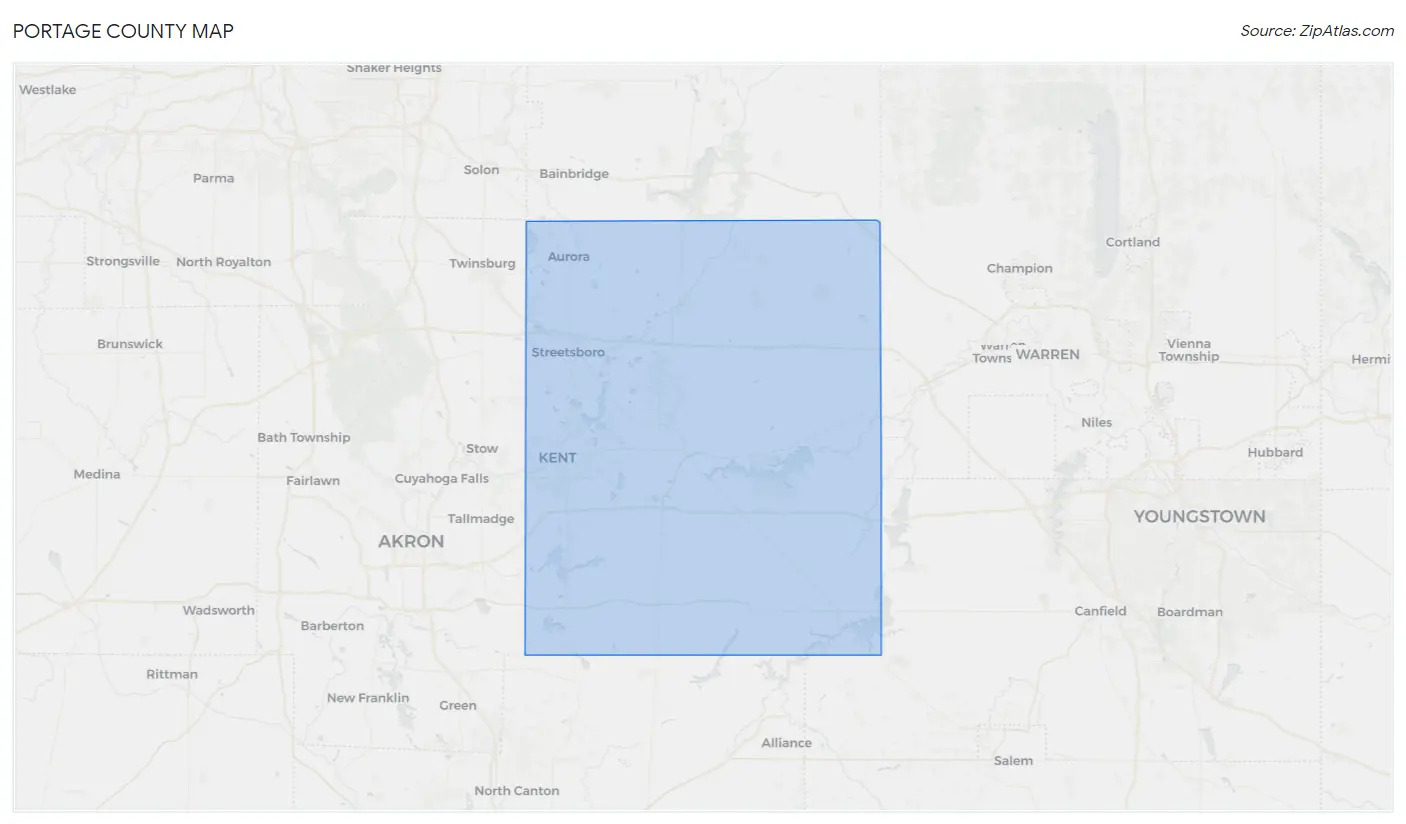
Portage County Map
Portage County Overview
161,217
TOTAL POPULATION
79,722
MALE POPULATION
81,495
FEMALE POPULATION
97.82
MALES / 100 FEMALES
102.22
FEMALES / 100 MALES
39.1
MEDIAN AGE
3.0
AVG FAMILY SIZE
2.4
AVG HOUSEHOLD SIZE
$37,771
PER CAPITA INCOME
$93,013
AVG FAMILY INCOME
$69,796
AVG HOUSEHOLD INCOME
34.5%
WAGE / INCOME GAP [ % ]
65.5¢/ $1
WAGE / INCOME GAP [ $ ]
$9,759
FAMILY INCOME DEFICIT
0.45
INEQUALITY / GINI INDEX
88,431
LABOR FORCE [ PEOPLE ]
65.2%
PERCENT IN LABOR FORCE
5.6%
UNEMPLOYMENT RATE
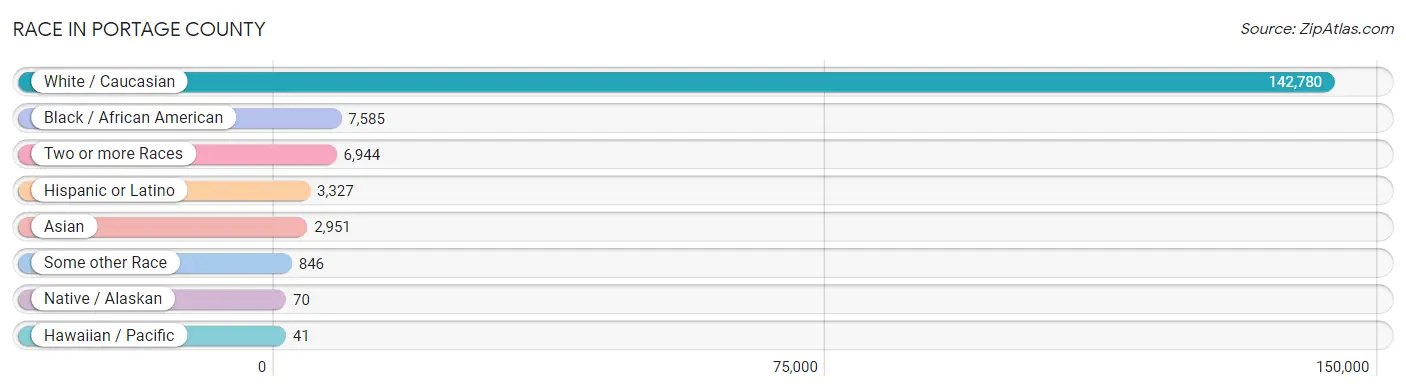
Race in Portage County
The most populous races in Portage County are White / Caucasian (142,780 | 88.6%), Black / African American (7,585 | 4.7%), and Two or more Races (6,944 | 4.3%).
| Race | # Population | % Population |
| Asian | 2,951 | 1.8% |
| Black / African American | 7,585 | 4.7% |
| Hawaiian / Pacific | 41 | 0.0% |
| Hispanic or Latino | 3,327 | 2.1% |
| Native / Alaskan | 70 | 0.0% |
| White / Caucasian | 142,780 | 88.6% |
| Two or more Races | 6,944 | 4.3% |
| Some other Race | 846 | 0.5% |
| Total | 161,217 | 100.0% |
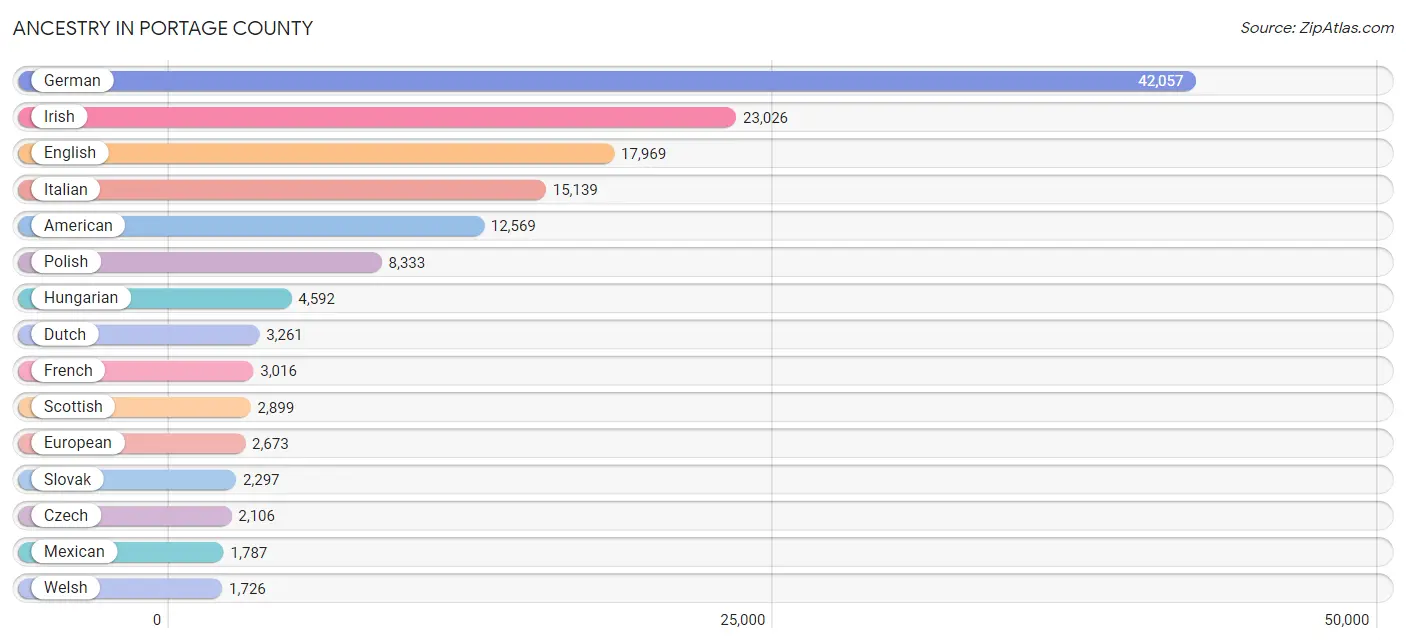
Ancestry in Portage County
The most populous ancestries reported in Portage County are German (42,057 | 26.1%), Irish (23,026 | 14.3%), English (17,969 | 11.2%), Italian (15,139 | 9.4%), and American (12,569 | 7.8%), together accounting for 68.7% of all Portage County residents.
| Ancestry | # Population | % Population |
| African | 223 | 0.1% |
| Albanian | 15 | 0.0% |
| Alsatian | 25 | 0.0% |
| American | 12,569 | 7.8% |
| Apache | 2 | 0.0% |
| Arab | 1,350 | 0.8% |
| Argentinean | 16 | 0.0% |
| Armenian | 71 | 0.0% |
| Australian | 51 | 0.0% |
| Austrian | 378 | 0.2% |
| Belgian | 57 | 0.0% |
| Bhutanese | 268 | 0.2% |
| Blackfeet | 393 | 0.2% |
| Brazilian | 96 | 0.1% |
| British | 822 | 0.5% |
| Bulgarian | 81 | 0.1% |
| Burmese | 323 | 0.2% |
| Canadian | 98 | 0.1% |
| Celtic | 12 | 0.0% |
| Central American | 214 | 0.1% |
| Central American Indian | 1 | 0.0% |
| Cherokee | 563 | 0.4% |
| Chippewa | 6 | 0.0% |
| Choctaw | 16 | 0.0% |
| Colombian | 81 | 0.1% |
| Costa Rican | 8 | 0.0% |
| Croatian | 968 | 0.6% |
| Cuban | 208 | 0.1% |
| Czech | 2,106 | 1.3% |
| Czechoslovakian | 717 | 0.4% |
| Danish | 282 | 0.2% |
| Delaware | 45 | 0.0% |
| Dominican | 61 | 0.0% |
| Dutch | 3,261 | 2.0% |
| Dutch West Indian | 10 | 0.0% |
| Eastern European | 541 | 0.3% |
| Egyptian | 105 | 0.1% |
| English | 17,969 | 11.2% |
| Ethiopian | 6 | 0.0% |
| European | 2,673 | 1.7% |
| Filipino | 294 | 0.2% |
| Finnish | 372 | 0.2% |
| French | 3,016 | 1.9% |
| French Canadian | 317 | 0.2% |
| German | 42,057 | 26.1% |
| Ghanaian | 11 | 0.0% |
| Greek | 820 | 0.5% |
| Guamanian / Chamorro | 21 | 0.0% |
| Guatemalan | 30 | 0.0% |
| Honduran | 114 | 0.1% |
| Hungarian | 4,592 | 2.9% |
| Icelander | 6 | 0.0% |
| Indian (Asian) | 685 | 0.4% |
| Iranian | 358 | 0.2% |
| Irish | 23,026 | 14.3% |
| Iroquois | 40 | 0.0% |
| Italian | 15,139 | 9.4% |
| Jamaican | 128 | 0.1% |
| Japanese | 96 | 0.1% |
| Jordanian | 172 | 0.1% |
| Korean | 620 | 0.4% |
| Latvian | 148 | 0.1% |
| Lebanese | 325 | 0.2% |
| Lithuanian | 438 | 0.3% |
| Macedonian | 14 | 0.0% |
| Maltese | 16 | 0.0% |
| Mexican | 1,787 | 1.1% |
| Moroccan | 16 | 0.0% |
| Native Hawaiian | 44 | 0.0% |
| Nicaraguan | 49 | 0.0% |
| Nigerian | 110 | 0.1% |
| Northern European | 87 | 0.1% |
| Norwegian | 1,046 | 0.6% |
| Pakistani | 43 | 0.0% |
| Panamanian | 13 | 0.0% |
| Pennsylvania German | 331 | 0.2% |
| Polish | 8,333 | 5.2% |
| Puerto Rican | 666 | 0.4% |
| Romanian | 356 | 0.2% |
| Russian | 1,184 | 0.7% |
| Samoan | 25 | 0.0% |
| Scandinavian | 322 | 0.2% |
| Scotch-Irish | 1,335 | 0.8% |
| Scottish | 2,899 | 1.8% |
| Serbian | 111 | 0.1% |
| Slavic | 129 | 0.1% |
| Slovak | 2,297 | 1.4% |
| Slovene | 912 | 0.6% |
| South African | 45 | 0.0% |
| South American | 97 | 0.1% |
| Soviet Union | 5 | 0.0% |
| Spaniard | 141 | 0.1% |
| Spanish | 91 | 0.1% |
| Spanish American | 37 | 0.0% |
| Sri Lankan | 264 | 0.2% |
| Subsaharan African | 400 | 0.3% |
| Swedish | 797 | 0.5% |
| Swiss | 813 | 0.5% |
| Syrian | 54 | 0.0% |
| Thai | 869 | 0.5% |
| Trinidadian and Tobagonian | 9 | 0.0% |
| Turkish | 30 | 0.0% |
| Ukrainian | 640 | 0.4% |
| Ute | 8 | 0.0% |
| Vietnamese | 34 | 0.0% |
| Welsh | 1,726 | 1.1% |
| West Indian | 68 | 0.0% |
| Yugoslavian | 81 | 0.1% | View All 108 Rows |
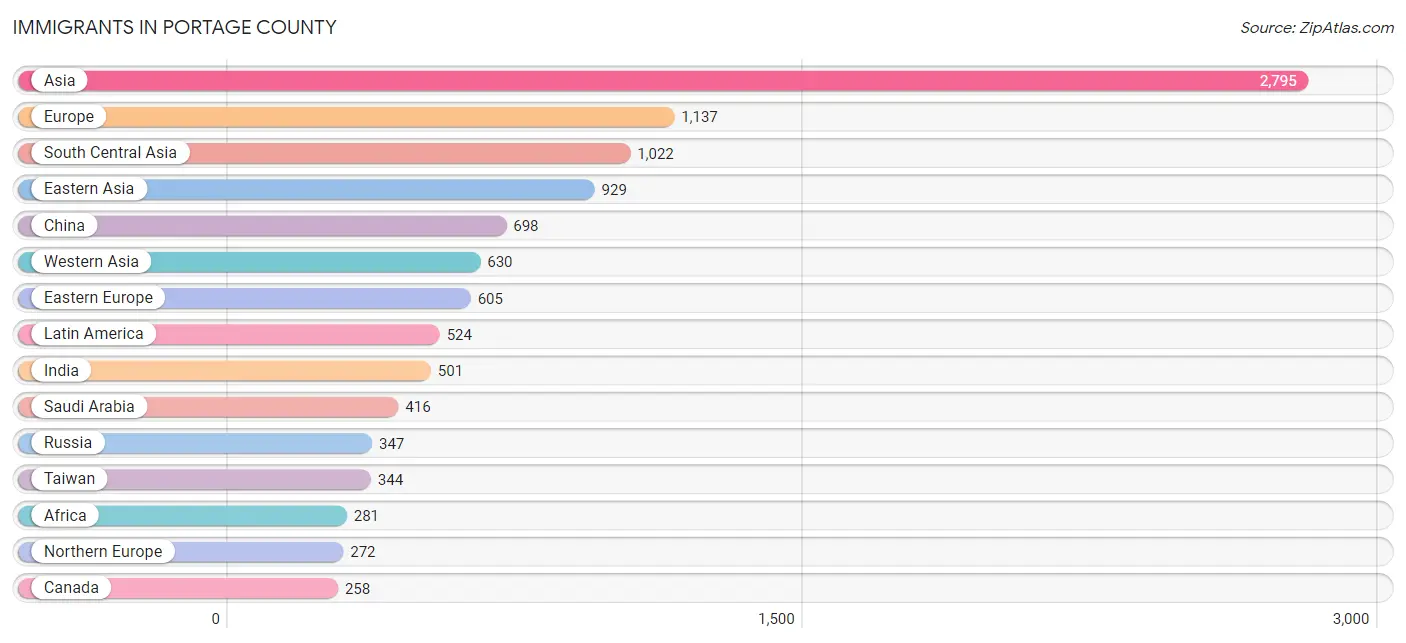
Immigrants in Portage County
The most numerous immigrant groups reported in Portage County came from Asia (2,795 | 1.7%), Europe (1,137 | 0.7%), South Central Asia (1,022 | 0.6%), Eastern Asia (929 | 0.6%), and China (698 | 0.4%), together accounting for 4.1% of all Portage County residents.
| Immigration Origin | # Population | % Population |
| Africa | 281 | 0.2% |
| Argentina | 5 | 0.0% |
| Asia | 2,795 | 1.7% |
| Australia | 22 | 0.0% |
| Austria | 11 | 0.0% |
| Bahamas | 5 | 0.0% |
| Bangladesh | 194 | 0.1% |
| Belarus | 24 | 0.0% |
| Brazil | 99 | 0.1% |
| Canada | 258 | 0.2% |
| Caribbean | 84 | 0.1% |
| Central America | 218 | 0.1% |
| China | 698 | 0.4% |
| Colombia | 42 | 0.0% |
| Croatia | 6 | 0.0% |
| Czechoslovakia | 28 | 0.0% |
| Denmark | 14 | 0.0% |
| Eastern Africa | 19 | 0.0% |
| Eastern Asia | 929 | 0.6% |
| Eastern Europe | 605 | 0.4% |
| Ecuador | 57 | 0.0% |
| Egypt | 105 | 0.1% |
| England | 162 | 0.1% |
| Ethiopia | 6 | 0.0% |
| Europe | 1,137 | 0.7% |
| Germany | 201 | 0.1% |
| Ghana | 30 | 0.0% |
| Guatemala | 12 | 0.0% |
| Honduras | 23 | 0.0% |
| Hungary | 46 | 0.0% |
| India | 501 | 0.3% |
| Iran | 144 | 0.1% |
| Ireland | 22 | 0.0% |
| Italy | 33 | 0.0% |
| Jamaica | 35 | 0.0% |
| Japan | 104 | 0.1% |
| Jordan | 172 | 0.1% |
| Kazakhstan | 50 | 0.0% |
| Korea | 127 | 0.1% |
| Latin America | 524 | 0.3% |
| Latvia | 27 | 0.0% |
| Mexico | 163 | 0.1% |
| Nepal | 31 | 0.0% |
| Netherlands | 6 | 0.0% |
| Nigeria | 39 | 0.0% |
| Northern Africa | 147 | 0.1% |
| Northern Europe | 272 | 0.2% |
| Oceania | 22 | 0.0% |
| Pakistan | 71 | 0.0% |
| Panama | 20 | 0.0% |
| Philippines | 188 | 0.1% |
| Poland | 46 | 0.0% |
| Romania | 22 | 0.0% |
| Russia | 347 | 0.2% |
| Saudi Arabia | 416 | 0.3% |
| Scotland | 17 | 0.0% |
| South Africa | 40 | 0.0% |
| South America | 222 | 0.1% |
| South Central Asia | 1,022 | 0.6% |
| South Eastern Asia | 214 | 0.1% |
| Southern Europe | 33 | 0.0% |
| Sri Lanka | 19 | 0.0% |
| St. Vincent and the Grenadines | 31 | 0.0% |
| Switzerland | 9 | 0.0% |
| Syria | 16 | 0.0% |
| Taiwan | 344 | 0.2% |
| Thailand | 15 | 0.0% |
| Trinidad and Tobago | 13 | 0.0% |
| Ukraine | 59 | 0.0% |
| Uzbekistan | 12 | 0.0% |
| Venezuela | 19 | 0.0% |
| Vietnam | 11 | 0.0% |
| Western Africa | 69 | 0.0% |
| Western Asia | 630 | 0.4% |
| Western Europe | 227 | 0.1% | View All 75 Rows |
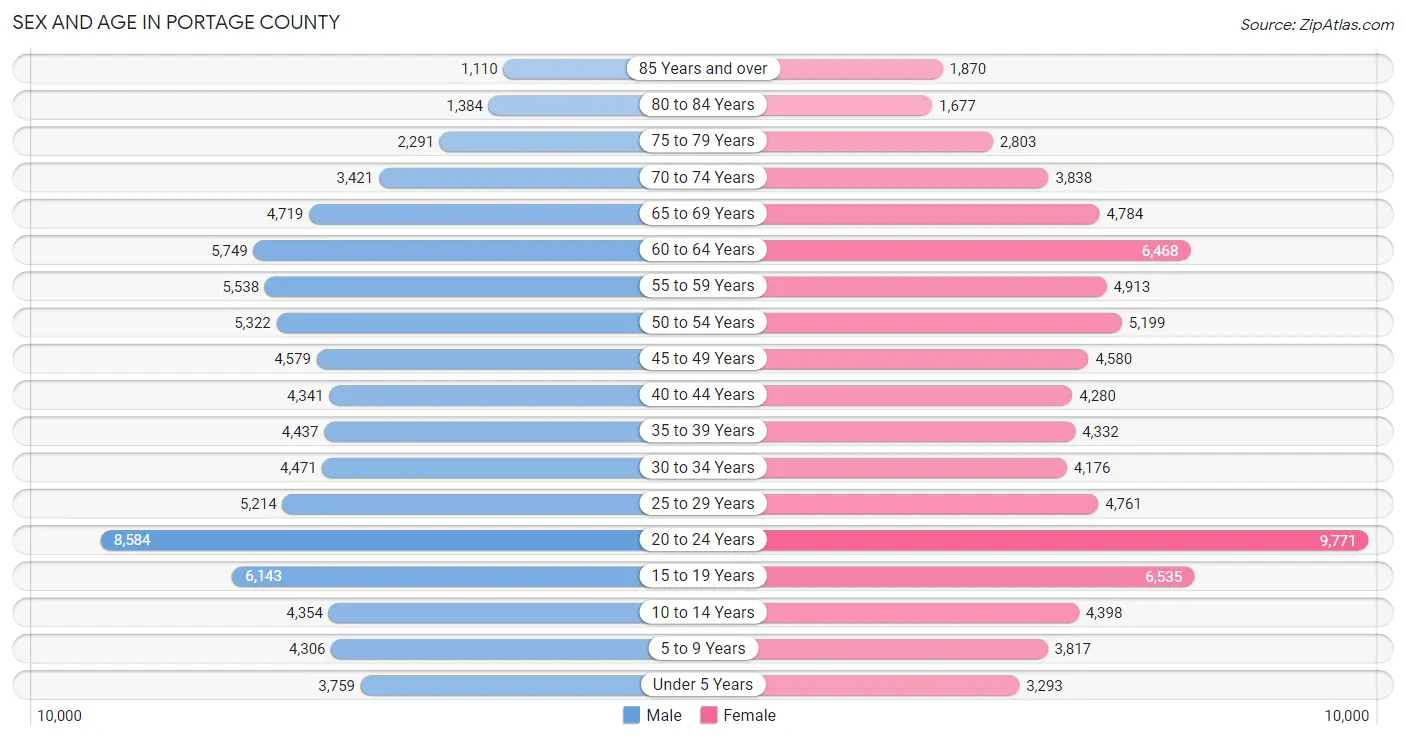
Sex and Age in Portage County
Sex and Age in Portage County
The most populous age groups in Portage County are 20 to 24 Years (8,584 | 10.8%) for men and 20 to 24 Years (9,771 | 12.0%) for women.
| Age Bracket | Male | Female |
| Under 5 Years | 3,759 (4.7%) | 3,293 (4.0%) |
| 5 to 9 Years | 4,306 (5.4%) | 3,817 (4.7%) |
| 10 to 14 Years | 4,354 (5.5%) | 4,398 (5.4%) |
| 15 to 19 Years | 6,143 (7.7%) | 6,535 (8.0%) |
| 20 to 24 Years | 8,584 (10.8%) | 9,771 (12.0%) |
| 25 to 29 Years | 5,214 (6.5%) | 4,761 (5.8%) |
| 30 to 34 Years | 4,471 (5.6%) | 4,176 (5.1%) |
| 35 to 39 Years | 4,437 (5.6%) | 4,332 (5.3%) |
| 40 to 44 Years | 4,341 (5.4%) | 4,280 (5.2%) |
| 45 to 49 Years | 4,579 (5.7%) | 4,580 (5.6%) |
| 50 to 54 Years | 5,322 (6.7%) | 5,199 (6.4%) |
| 55 to 59 Years | 5,538 (7.0%) | 4,913 (6.0%) |
| 60 to 64 Years | 5,749 (7.2%) | 6,468 (7.9%) |
| 65 to 69 Years | 4,719 (5.9%) | 4,784 (5.9%) |
| 70 to 74 Years | 3,421 (4.3%) | 3,838 (4.7%) |
| 75 to 79 Years | 2,291 (2.9%) | 2,803 (3.4%) |
| 80 to 84 Years | 1,384 (1.7%) | 1,677 (2.1%) |
| 85 Years and over | 1,110 (1.4%) | 1,870 (2.3%) |
| Total | 79,722 (100.0%) | 81,495 (100.0%) |
Families and Households in Portage County
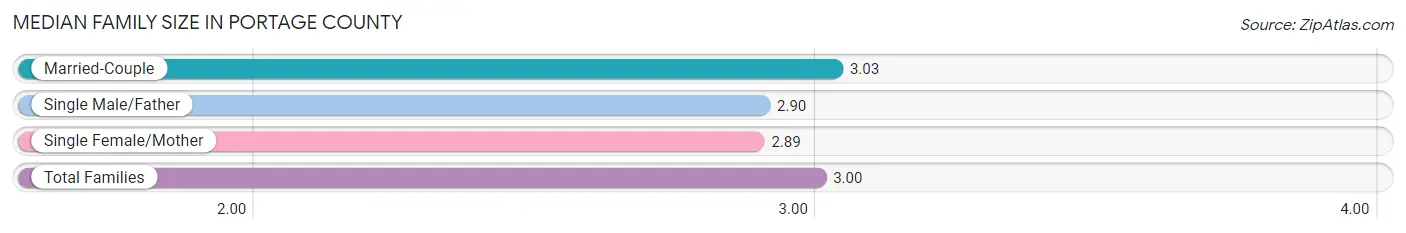
Median Family Size in Portage County
The median family size in Portage County is 3.00 persons per family, with married-couple families (30,295 | 76.3%) accounting for the largest median family size of 3.03 persons per family. On the other hand, single female/mother families (6,543 | 16.5%) represent the smallest median family size with 2.89 persons per family.
| Family Type | # Families | Family Size |
| Married-Couple | 30,295 (76.3%) | 3.03 |
| Single Male/Father | 2,847 (7.2%) | 2.90 |
| Single Female/Mother | 6,543 (16.5%) | 2.89 |
| Total Families | 39,685 (100.0%) | 3.00 |
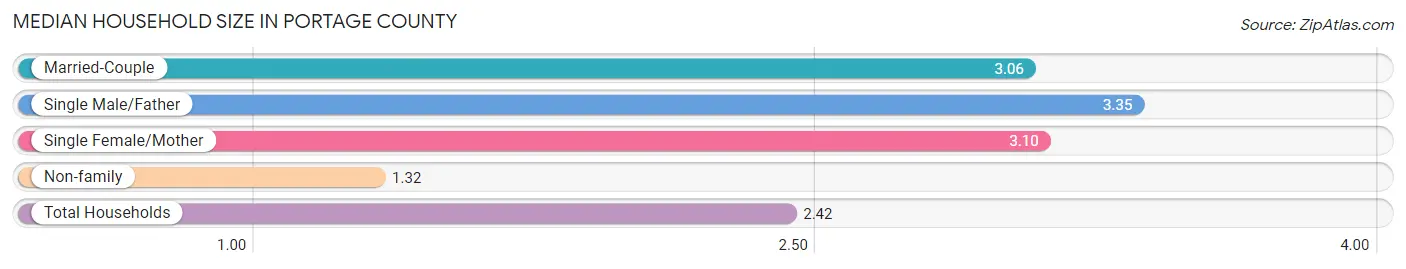
Median Household Size in Portage County
The median household size in Portage County is 2.42 persons per household, with single male/father households (2,847 | 4.5%) accounting for the largest median household size of 3.35 persons per household. non-family households (23,903 | 37.6%) represent the smallest median household size with 1.32 persons per household.
| Household Type | # Households | Household Size |
| Married-Couple | 30,295 (47.6%) | 3.06 |
| Single Male/Father | 2,847 (4.5%) | 3.35 |
| Single Female/Mother | 6,543 (10.3%) | 3.10 |
| Non-family | 23,903 (37.6%) | 1.32 |
| Total Households | 63,588 (100.0%) | 2.42 |
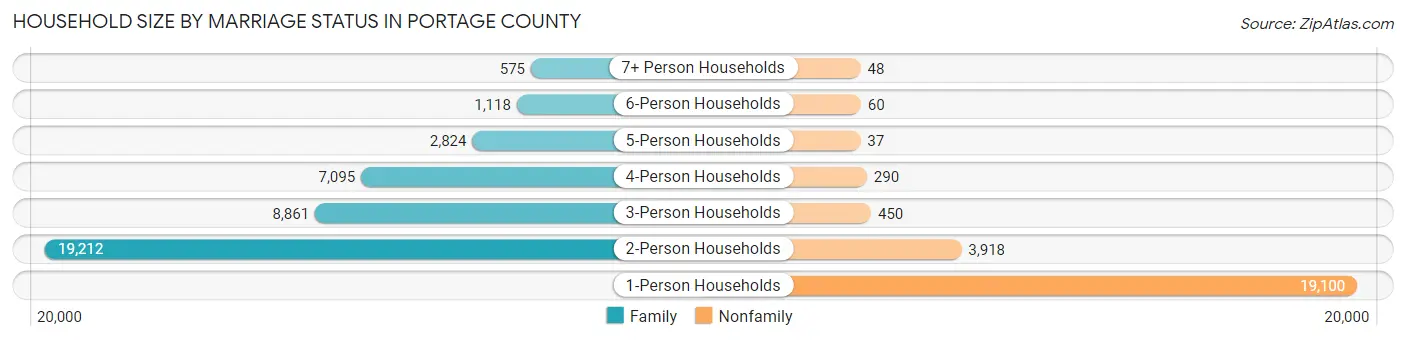
Household Size by Marriage Status in Portage County
Out of a total of 63,588 households in Portage County, 39,685 (62.4%) are family households, while 23,903 (37.6%) are nonfamily households. The most numerous type of family households are 2-person households, comprising 19,212, and the most common type of nonfamily households are 1-person households, comprising 19,100.
| Household Size | Family Households | Nonfamily Households |
| 1-Person Households | - | 19,100 (30.0%) |
| 2-Person Households | 19,212 (30.2%) | 3,918 (6.2%) |
| 3-Person Households | 8,861 (13.9%) | 450 (0.7%) |
| 4-Person Households | 7,095 (11.2%) | 290 (0.5%) |
| 5-Person Households | 2,824 (4.4%) | 37 (0.1%) |
| 6-Person Households | 1,118 (1.8%) | 60 (0.1%) |
| 7+ Person Households | 575 (0.9%) | 48 (0.1%) |
| Total | 39,685 (62.4%) | 23,903 (37.6%) |
Female Fertility in Portage County
Fertility by Age in Portage County
Average fertility rate in Portage County is 37.0 births per 1,000 women. Women in the age bracket of 20 to 34 years have the highest fertility rate with 58.0 births per 1,000 women. Women in the age bracket of 20 to 34 years acount for 75.2% of all women with births.
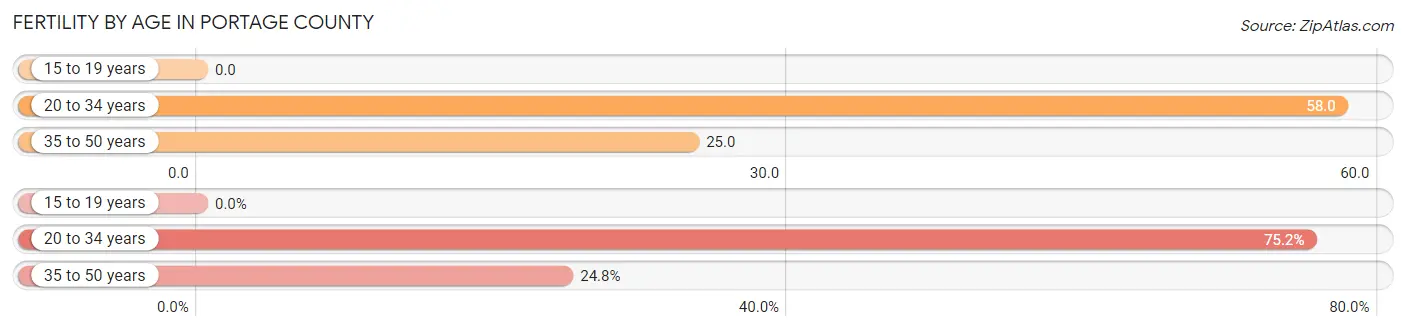
| Age Bracket | Women with Births | Births / 1,000 Women |
| 15 to 19 years | 0 (0.0%) | 0.0 |
| 20 to 34 years | 1,089 (75.2%) | 58.0 |
| 35 to 50 years | 359 (24.8%) | 25.0 |
| Total | 1,448 (100.0%) | 37.0 |
Fertility by Age by Marriage Status in Portage County
54.8% of women with births (1,448) in Portage County are married. The highest percentage of unmarried women with births falls into 20 to 34 years age bracket with 49.7% of them unmarried at the time of birth, while the lowest percentage of unmarried women with births belong to 35 to 50 years age bracket with 31.8% of them unmarried.
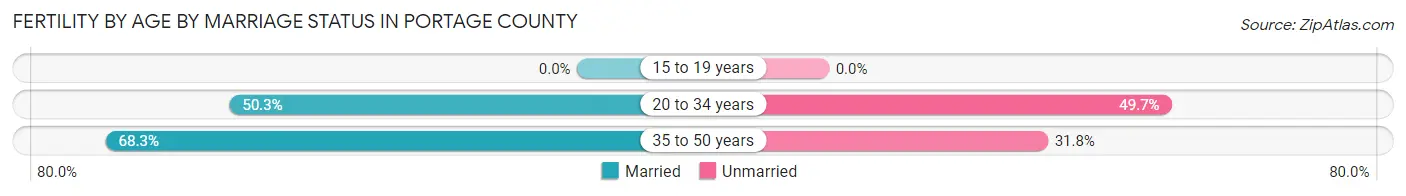
| Age Bracket | Married | Unmarried |
| 15 to 19 years | 0 (0.0%) | 0 (0.0%) |
| 20 to 34 years | 548 (50.3%) | 541 (49.7%) |
| 35 to 50 years | 245 (68.2%) | 114 (31.8%) |
| Total | 794 (54.8%) | 654 (45.2%) |
Fertility by Education in Portage County
Average fertility rate in Portage County is 37.0 births per 1,000 women. Women with the education attainment of graduate degree have the highest fertility rate of 72.0 births per 1,000 women, while women with the education attainment of less than high school have the lowest fertility at 3.0 births per 1,000 women. Women with the education attainment of high school diploma represent 28.9% of all women with births.
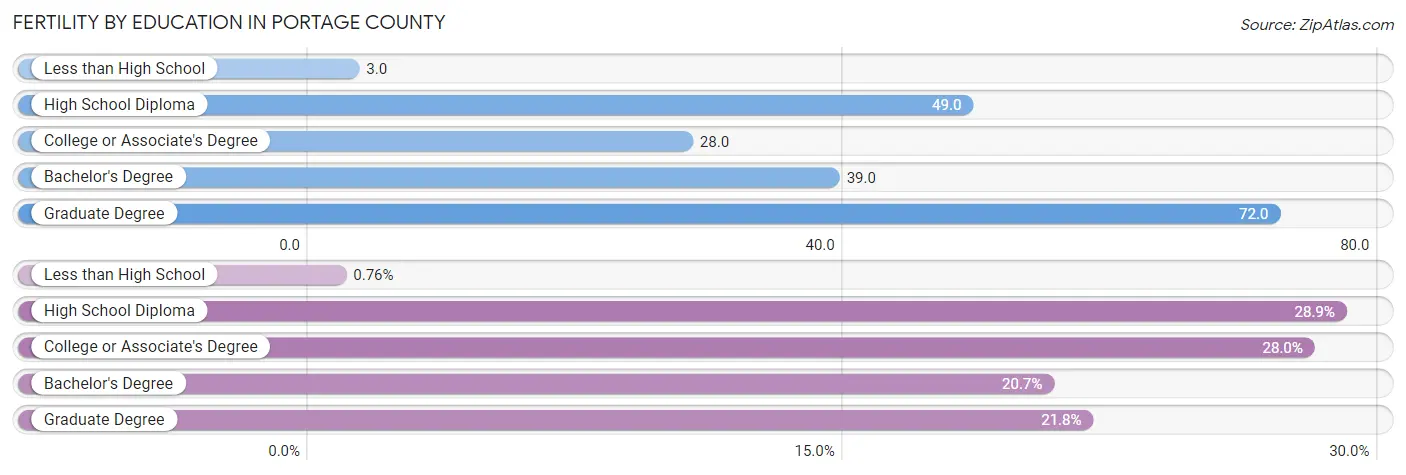
| Educational Attainment | Women with Births | Births / 1,000 Women |
| Less than High School | 11 (0.8%) | 3.0 |
| High School Diploma | 418 (28.9%) | 49.0 |
| College or Associate's Degree | 405 (28.0%) | 28.0 |
| Bachelor's Degree | 299 (20.6%) | 39.0 |
| Graduate Degree | 315 (21.7%) | 72.0 |
| Total | 1,448 (100.0%) | 37.0 |
Fertility by Education by Marriage Status in Portage County
45.2% of women with births in Portage County are unmarried. Women with the educational attainment of less than high school are most likely to be married with 100.0% of them married at childbirth, while women with the educational attainment of high school diploma are least likely to be married with 78.9% of them unmarried at childbirth.
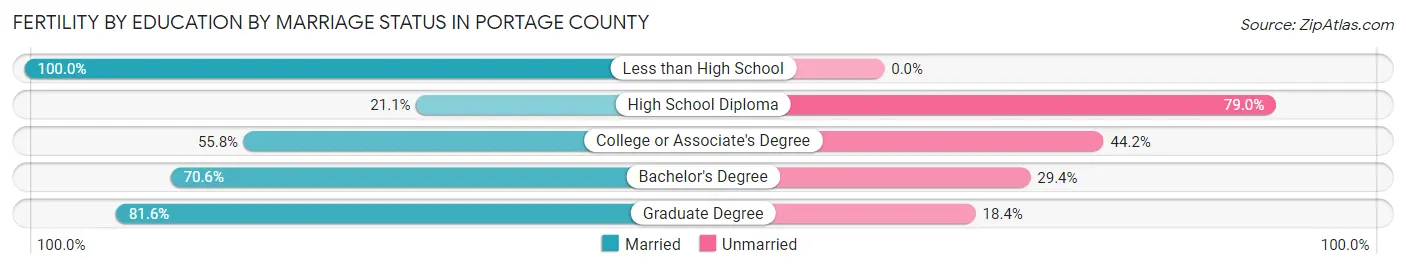
| Educational Attainment | Married | Unmarried |
| Less than High School | 11 (100.0%) | 0 (0.0%) |
| High School Diploma | 88 (21.0%) | 330 (78.9%) |
| College or Associate's Degree | 226 (55.8%) | 179 (44.2%) |
| Bachelor's Degree | 211 (70.6%) | 88 (29.4%) |
| Graduate Degree | 257 (81.6%) | 58 (18.4%) |
| Total | 794 (54.8%) | 654 (45.2%) |
Income in Portage County
Income Overview in Portage County
Per Capita Income in Portage County is $37,771, while median incomes of families and households are $93,013 and $69,796 respectively.
| Characteristic | Number | Measure |
| Per Capita Income | 161,217 | $37,771 |
| Median Family Income | 39,685 | $93,013 |
| Mean Family Income | 39,685 | $113,996 |
| Median Household Income | 63,588 | $69,796 |
| Mean Household Income | 63,588 | $92,344 |
| Income Deficit | 39,685 | $9,759 |
| Wage / Income Gap (%) | 161,217 | 34.52% |
| Wage / Income Gap ($) | 161,217 | 65.48¢ per $1 |
| Gini / Inequality Index | 161,217 | 0.45 |
Earnings by Sex in Portage County
Average Earnings in Portage County are $36,139, $45,234 for men and $29,619 for women, a difference of 34.5%.
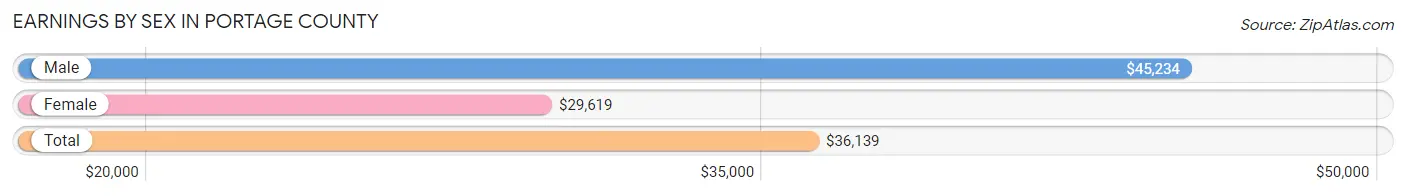
| Sex | Number | Average Earnings |
| Male | 49,029 (51.8%) | $45,234 |
| Female | 45,581 (48.2%) | $29,619 |
| Total | 94,610 (100.0%) | $36,139 |
Earnings by Sex by Income Bracket in Portage County
The most common earnings brackets in Portage County are $100,000+ for men (6,950 | 14.2%) and $75,000 to $99,999 for women (3,677 | 8.1%).
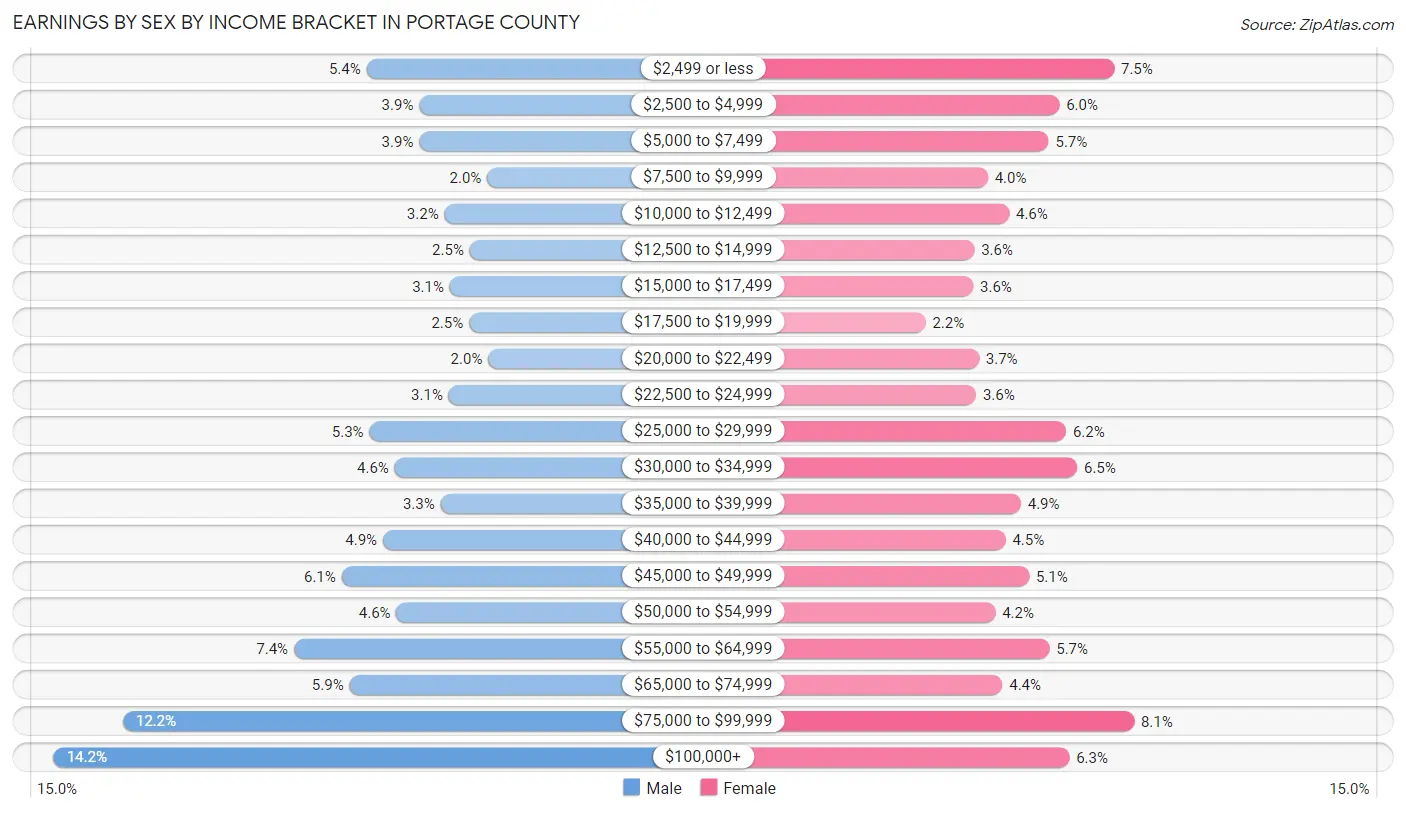
| Income | Male | Female |
| $2,499 or less | 2,641 (5.4%) | 3,422 (7.5%) |
| $2,500 to $4,999 | 1,915 (3.9%) | 2,723 (6.0%) |
| $5,000 to $7,499 | 1,916 (3.9%) | 2,586 (5.7%) |
| $7,500 to $9,999 | 982 (2.0%) | 1,803 (4.0%) |
| $10,000 to $12,499 | 1,567 (3.2%) | 2,079 (4.6%) |
| $12,500 to $14,999 | 1,219 (2.5%) | 1,630 (3.6%) |
| $15,000 to $17,499 | 1,493 (3.0%) | 1,616 (3.5%) |
| $17,500 to $19,999 | 1,230 (2.5%) | 1,009 (2.2%) |
| $20,000 to $22,499 | 968 (2.0%) | 1,693 (3.7%) |
| $22,500 to $24,999 | 1,510 (3.1%) | 1,656 (3.6%) |
| $25,000 to $29,999 | 2,603 (5.3%) | 2,808 (6.2%) |
| $30,000 to $34,999 | 2,253 (4.6%) | 2,948 (6.5%) |
| $35,000 to $39,999 | 1,623 (3.3%) | 2,229 (4.9%) |
| $40,000 to $44,999 | 2,419 (4.9%) | 2,031 (4.5%) |
| $45,000 to $49,999 | 2,984 (6.1%) | 2,335 (5.1%) |
| $50,000 to $54,999 | 2,230 (4.5%) | 1,901 (4.2%) |
| $55,000 to $64,999 | 3,644 (7.4%) | 2,595 (5.7%) |
| $65,000 to $74,999 | 2,879 (5.9%) | 1,993 (4.4%) |
| $75,000 to $99,999 | 6,003 (12.2%) | 3,677 (8.1%) |
| $100,000+ | 6,950 (14.2%) | 2,847 (6.2%) |
| Total | 49,029 (100.0%) | 45,581 (100.0%) |
Earnings by Sex by Educational Attainment in Portage County
Average earnings in Portage County are $55,009 for men and $40,303 for women, a difference of 26.7%. Men with an educational attainment of graduate degree enjoy the highest average annual earnings of $97,619, while those with less than high school education earn the least with $40,298. Women with an educational attainment of graduate degree earn the most with the average annual earnings of $70,622, while those with less than high school education have the smallest earnings of $26,715.
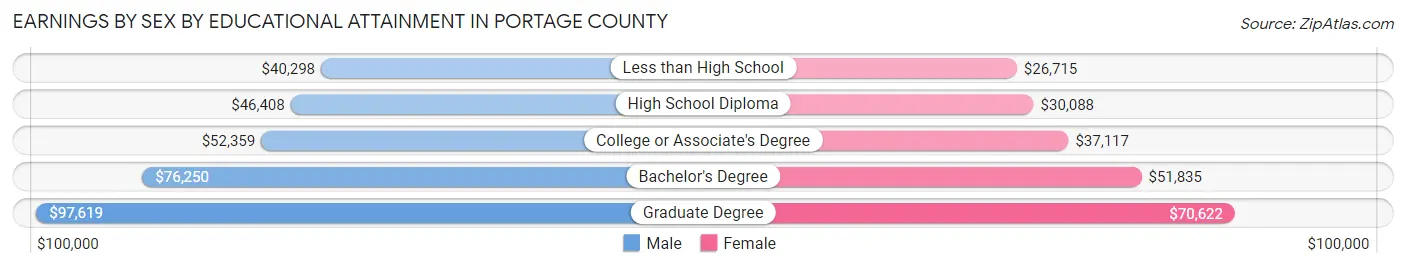
| Educational Attainment | Male Income | Female Income |
| Less than High School | $40,298 | $26,715 |
| High School Diploma | $46,408 | $30,088 |
| College or Associate's Degree | $52,359 | $37,117 |
| Bachelor's Degree | $76,250 | $51,835 |
| Graduate Degree | $97,619 | $70,622 |
| Total | $55,009 | $40,303 |
Family Income in Portage County
Family Income Brackets in Portage County
According to the Portage County family income data, there are 9,405 families falling into the $100,000 to $149,999 income range, which is the most common income bracket and makes up 23.7% of all families. Conversely, the $10,000 to $14,999 income bracket is the least frequent group with only 833 families (2.1%) belonging to this category.
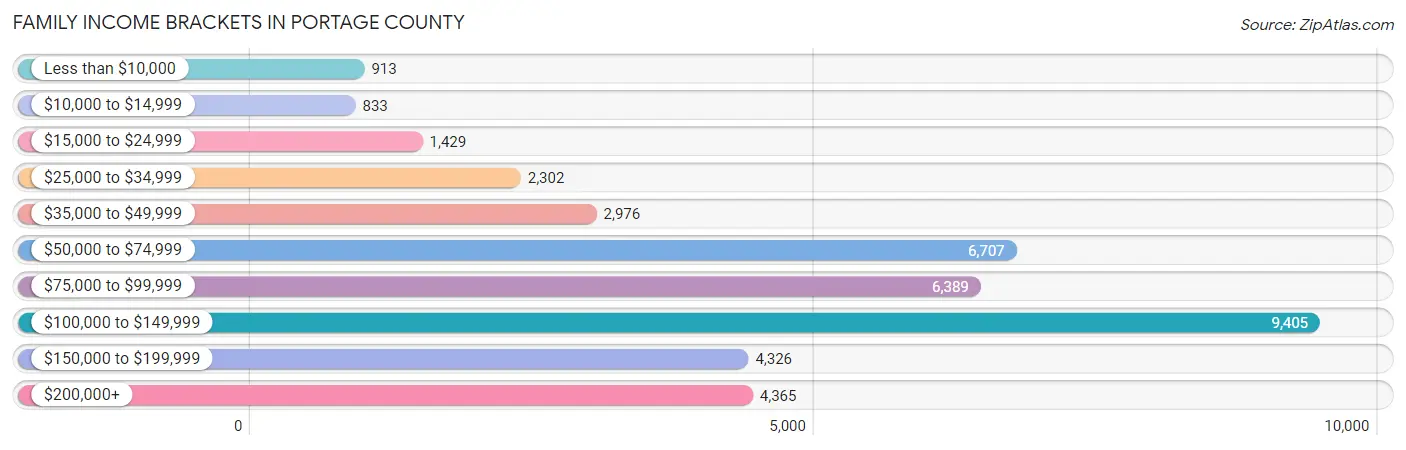
| Income Bracket | # Families | % Families |
| Less than $10,000 | 913 | 2.3% |
| $10,000 to $14,999 | 833 | 2.1% |
| $15,000 to $24,999 | 1,429 | 3.6% |
| $25,000 to $34,999 | 2,302 | 5.8% |
| $35,000 to $49,999 | 2,976 | 7.5% |
| $50,000 to $74,999 | 6,707 | 16.9% |
| $75,000 to $99,999 | 6,389 | 16.1% |
| $100,000 to $149,999 | 9,405 | 23.7% |
| $150,000 to $199,999 | 4,326 | 10.9% |
| $200,000+ | 4,365 | 11.0% |
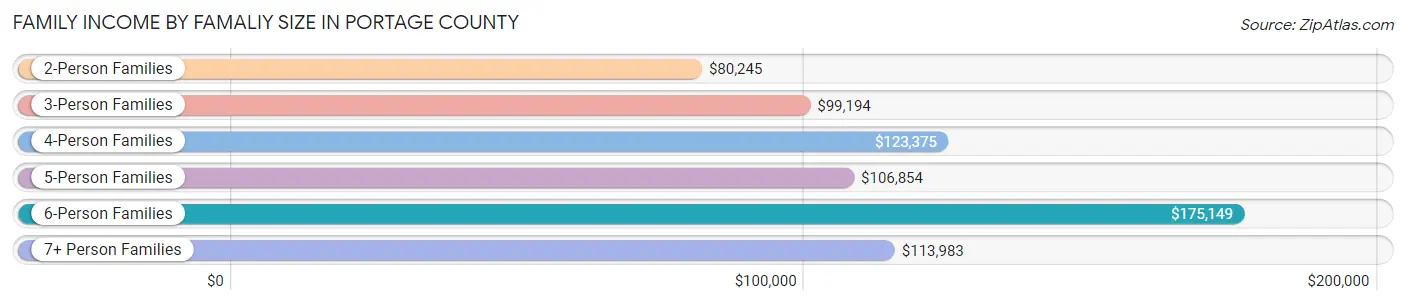
Family Income by Famaliy Size in Portage County
6-person families (923 | 2.3%) account for the highest median family income in Portage County with $175,149 per family, while 2-person families (20,580 | 51.9%) have the highest median income of $40,122 per family member.
| Income Bracket | # Families | Median Income |
| 2-Person Families | 20,580 (51.9%) | $80,245 |
| 3-Person Families | 8,286 (20.9%) | $99,194 |
| 4-Person Families | 6,910 (17.4%) | $123,375 |
| 5-Person Families | 2,445 (6.2%) | $106,854 |
| 6-Person Families | 923 (2.3%) | $175,149 |
| 7+ Person Families | 541 (1.4%) | $113,983 |
| Total | 39,685 (100.0%) | $93,013 |
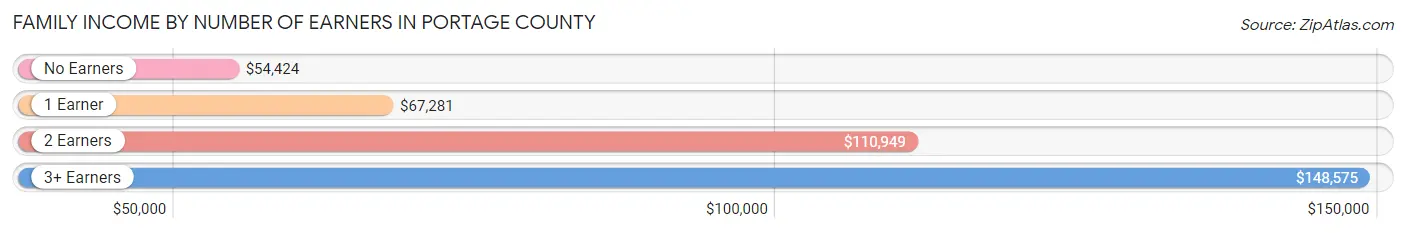
Family Income by Number of Earners in Portage County
The median family income in Portage County is $93,013, with families comprising 3+ earners (5,162) having the highest median family income of $148,575, while families with no earners (5,460) have the lowest median family income of $54,424, accounting for 13.0% and 13.8% of families, respectively.
| Number of Earners | # Families | Median Income |
| No Earners | 5,460 (13.8%) | $54,424 |
| 1 Earner | 12,432 (31.3%) | $67,281 |
| 2 Earners | 16,631 (41.9%) | $110,949 |
| 3+ Earners | 5,162 (13.0%) | $148,575 |
| Total | 39,685 (100.0%) | $93,013 |
Household Income in Portage County
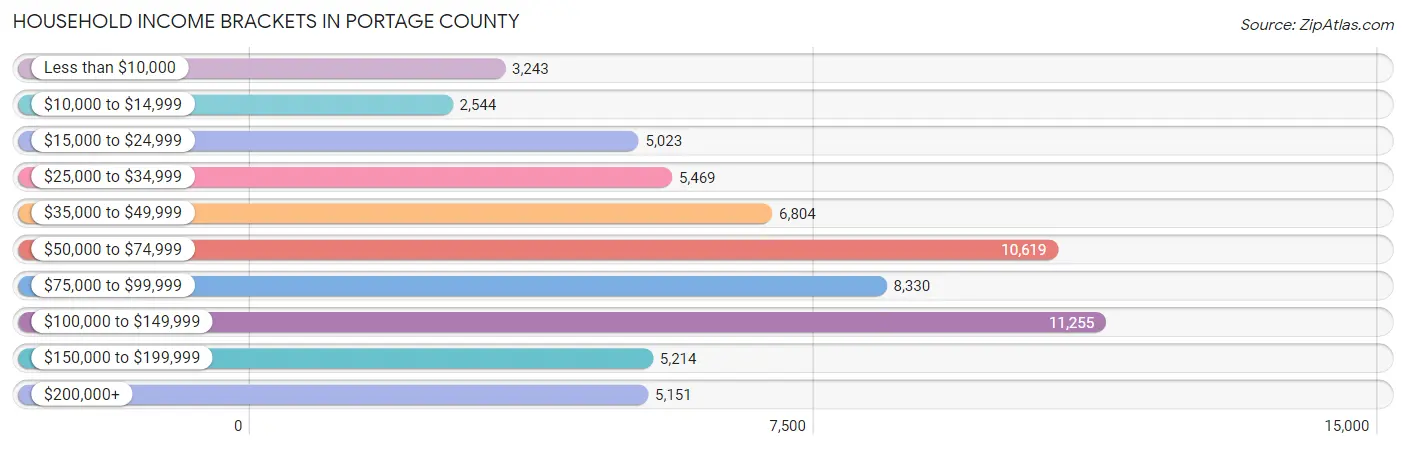
Household Income Brackets in Portage County
With 11,255 households falling in the category, the $100,000 to $149,999 income range is the most frequent in Portage County, accounting for 17.7% of all households. In contrast, only 2,544 households (4.0%) fall into the $10,000 to $14,999 income bracket, making it the least populous group.
| Income Bracket | # Households | % Households |
| Less than $10,000 | 3,243 | 5.1% |
| $10,000 to $14,999 | 2,544 | 4.0% |
| $15,000 to $24,999 | 5,023 | 7.9% |
| $25,000 to $34,999 | 5,469 | 8.6% |
| $35,000 to $49,999 | 6,804 | 10.7% |
| $50,000 to $74,999 | 10,619 | 16.7% |
| $75,000 to $99,999 | 8,330 | 13.1% |
| $100,000 to $149,999 | 11,255 | 17.7% |
| $150,000 to $199,999 | 5,214 | 8.2% |
| $200,000+ | 5,151 | 8.1% |
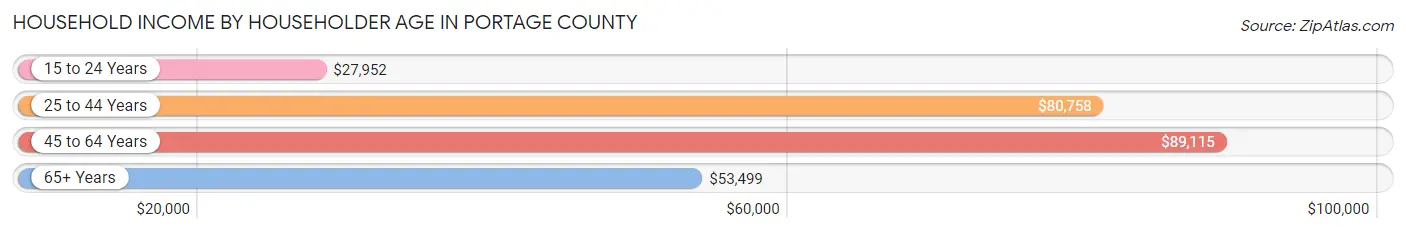
Household Income by Householder Age in Portage County
The median household income in Portage County is $69,796, with the highest median household income of $89,115 found in the 45 to 64 years age bracket for the primary householder. A total of 23,870 households (37.5%) fall into this category. Meanwhile, the 15 to 24 years age bracket for the primary householder has the lowest median household income of $27,952, with 4,363 households (6.9%) in this group.
| Income Bracket | # Households | Median Income |
| 15 to 24 Years | 4,363 (6.9%) | $27,952 |
| 25 to 44 Years | 17,814 (28.0%) | $80,758 |
| 45 to 64 Years | 23,870 (37.5%) | $89,115 |
| 65+ Years | 17,541 (27.6%) | $53,499 |
| Total | 63,588 (100.0%) | $69,796 |
Poverty in Portage County
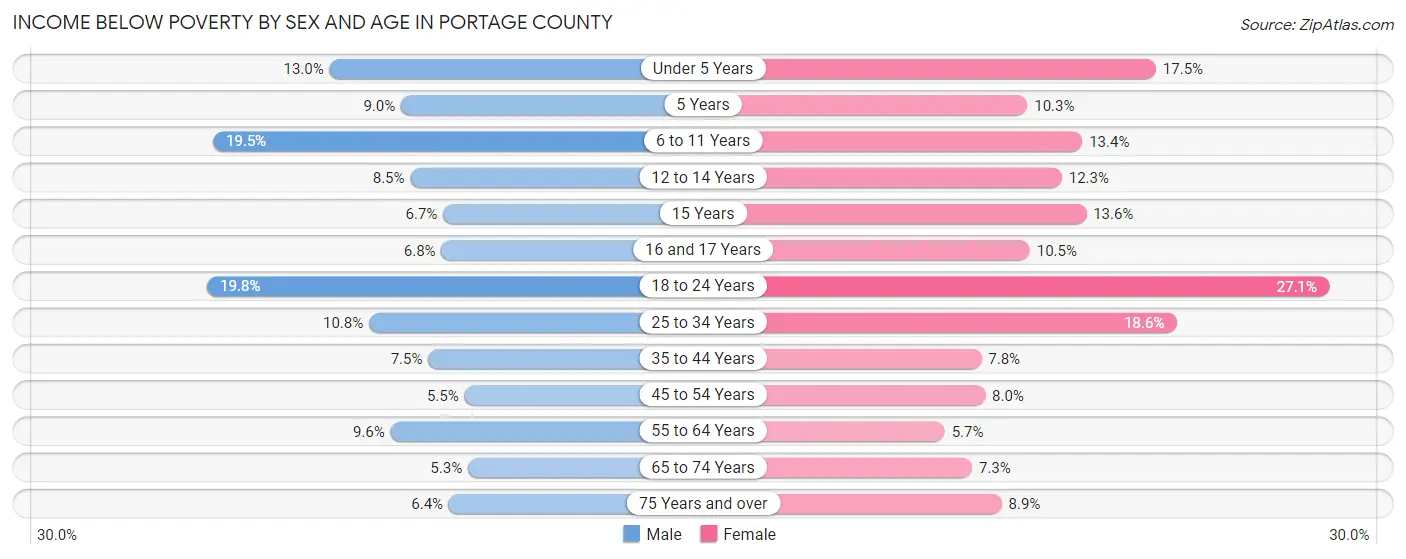
Income Below Poverty by Sex and Age in Portage County
With 10.3% poverty level for males and 12.3% for females among the residents of Portage County, 18 to 24 year old males and 18 to 24 year old females are the most vulnerable to poverty, with 1,915 males (19.8%) and 2,652 females (27.1%) in their respective age groups living below the poverty level.
| Age Bracket | Male | Female |
| Under 5 Years | 486 (13.0%) | 565 (17.5%) |
| 5 Years | 75 (9.0%) | 75 (10.3%) |
| 6 to 11 Years | 985 (19.5%) | 657 (13.4%) |
| 12 to 14 Years | 221 (8.5%) | 298 (12.2%) |
| 15 Years | 71 (6.7%) | 81 (13.6%) |
| 16 and 17 Years | 125 (6.8%) | 219 (10.5%) |
| 18 to 24 Years | 1,915 (19.8%) | 2,652 (27.1%) |
| 25 to 34 Years | 1,044 (10.8%) | 1,651 (18.6%) |
| 35 to 44 Years | 654 (7.5%) | 666 (7.8%) |
| 45 to 54 Years | 543 (5.5%) | 780 (8.0%) |
| 55 to 64 Years | 1,083 (9.6%) | 650 (5.7%) |
| 65 to 74 Years | 423 (5.3%) | 621 (7.2%) |
| 75 Years and over | 297 (6.4%) | 537 (8.9%) |
| Total | 7,922 (10.3%) | 9,452 (12.3%) |
Income Above Poverty by Sex and Age in Portage County
According to the poverty statistics in Portage County, males aged 65 to 74 years and females aged 55 to 64 years are the age groups that are most secure financially, with 94.7% of males and 94.3% of females in these age groups living above the poverty line.
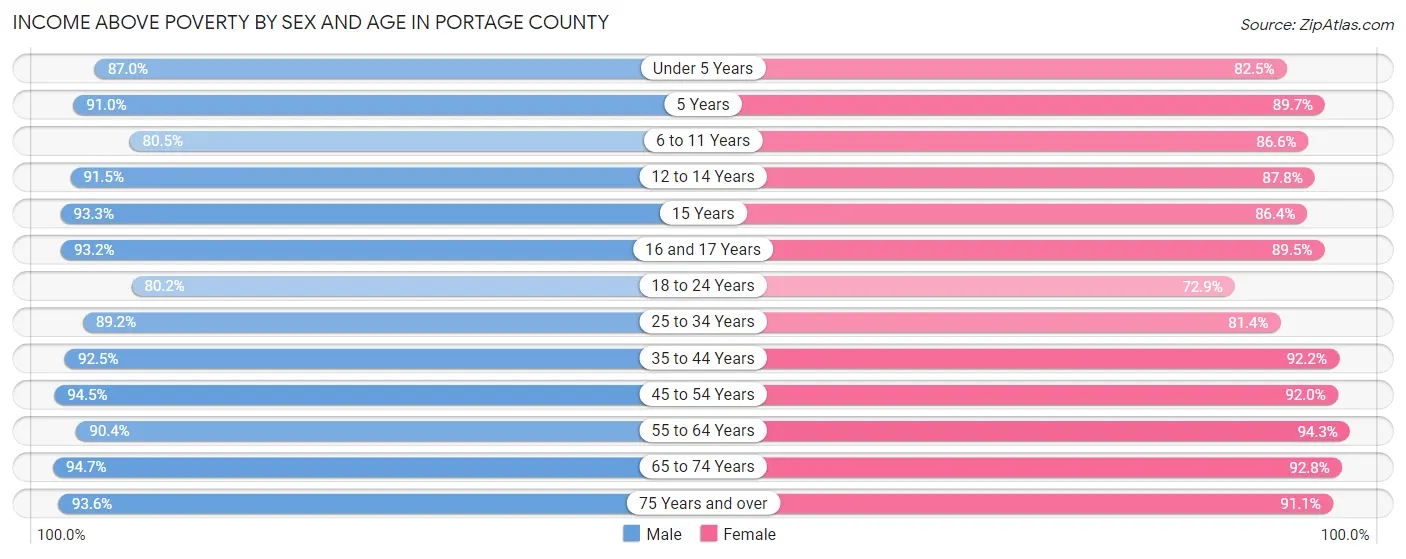
| Age Bracket | Male | Female |
| Under 5 Years | 3,246 (87.0%) | 2,665 (82.5%) |
| 5 Years | 755 (91.0%) | 651 (89.7%) |
| 6 to 11 Years | 4,064 (80.5%) | 4,251 (86.6%) |
| 12 to 14 Years | 2,374 (91.5%) | 2,134 (87.7%) |
| 15 Years | 990 (93.3%) | 514 (86.4%) |
| 16 and 17 Years | 1,716 (93.2%) | 1,872 (89.5%) |
| 18 to 24 Years | 7,735 (80.2%) | 7,127 (72.9%) |
| 25 to 34 Years | 8,605 (89.2%) | 7,214 (81.4%) |
| 35 to 44 Years | 8,038 (92.5%) | 7,909 (92.2%) |
| 45 to 54 Years | 9,328 (94.5%) | 8,999 (92.0%) |
| 55 to 64 Years | 10,174 (90.4%) | 10,688 (94.3%) |
| 65 to 74 Years | 7,548 (94.7%) | 7,946 (92.7%) |
| 75 Years and over | 4,368 (93.6%) | 5,499 (91.1%) |
| Total | 68,941 (89.7%) | 67,469 (87.7%) |
Income Below Poverty Among Married-Couple Families in Portage County
The poverty statistics for married-couple families in Portage County show that 3.1% or 952 of the total 30,295 families live below the poverty line. Families with 5 or more children have the highest poverty rate of 15.2%, comprising of 34 families. On the other hand, families with 1 or 2 children have the lowest poverty rate of 2.6%, which includes 233 families.
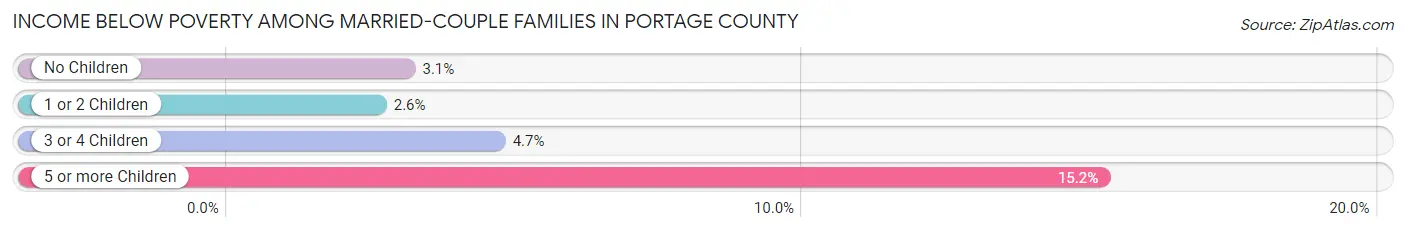
| Children | Above Poverty | Below Poverty |
| No Children | 18,356 (96.9%) | 585 (3.1%) |
| 1 or 2 Children | 8,749 (97.4%) | 233 (2.6%) |
| 3 or 4 Children | 2,048 (95.3%) | 100 (4.7%) |
| 5 or more Children | 190 (84.8%) | 34 (15.2%) |
| Total | 29,343 (96.9%) | 952 (3.1%) |
Income Below Poverty Among Single-Parent Households in Portage County
According to the poverty data in Portage County, 10.6% or 301 single-father households and 23.9% or 1,566 single-mother households are living below the poverty line. Among single-father households, those with 3 or 4 children have the highest poverty rate, with 87 households (35.2%) experiencing poverty. Likewise, among single-mother households, those with 3 or 4 children have the highest poverty rate, with 439 households (85.4%) falling below the poverty line.
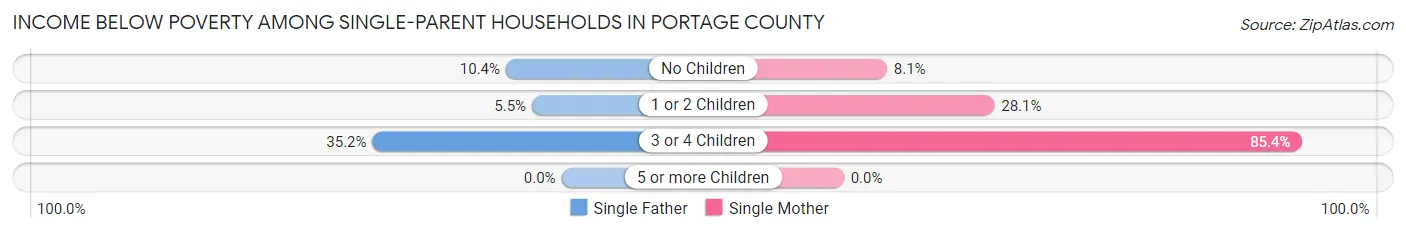
| Children | Single Father | Single Mother |
| No Children | 151 (10.4%) | 227 (8.1%) |
| 1 or 2 Children | 63 (5.5%) | 900 (28.1%) |
| 3 or 4 Children | 87 (35.2%) | 439 (85.4%) |
| 5 or more Children | 0 (0.0%) | 0 (0.0%) |
| Total | 301 (10.6%) | 1,566 (23.9%) |
Income Below Poverty Among Married-Couple vs Single-Parent Households in Portage County
The poverty data for Portage County shows that 952 of the married-couple family households (3.1%) and 1,867 of the single-parent households (19.9%) are living below the poverty level. Within the married-couple family households, those with 5 or more children have the highest poverty rate, with 34 households (15.2%) falling below the poverty line. Among the single-parent households, those with 3 or 4 children have the highest poverty rate, with 526 household (69.1%) living below poverty.
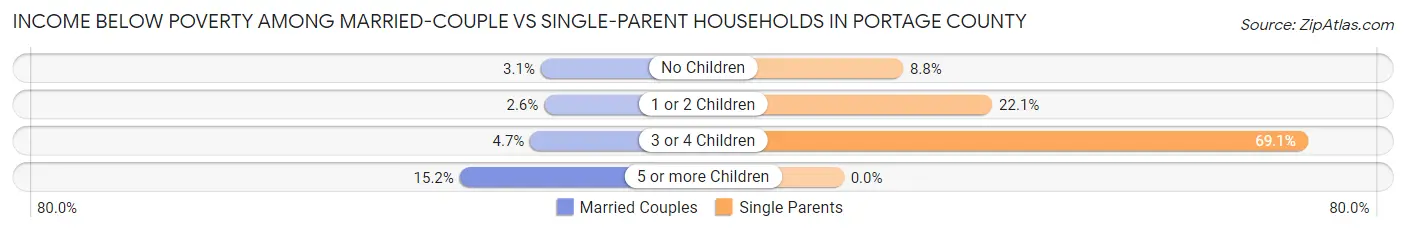
| Children | Married-Couple Families | Single-Parent Households |
| No Children | 585 (3.1%) | 378 (8.8%) |
| 1 or 2 Children | 233 (2.6%) | 963 (22.1%) |
| 3 or 4 Children | 100 (4.7%) | 526 (69.1%) |
| 5 or more Children | 34 (15.2%) | 0 (0.0%) |
| Total | 952 (3.1%) | 1,867 (19.9%) |
Employment Characteristics in Portage County
Employment by Class of Employer in Portage County
Among the 80,900 employed individuals in Portage County, private company employees (59,250 | 73.2%), local government employees (6,428 | 8.0%), and not-for-profit organizations (4,961 | 6.1%) make up the most common classes of employment.
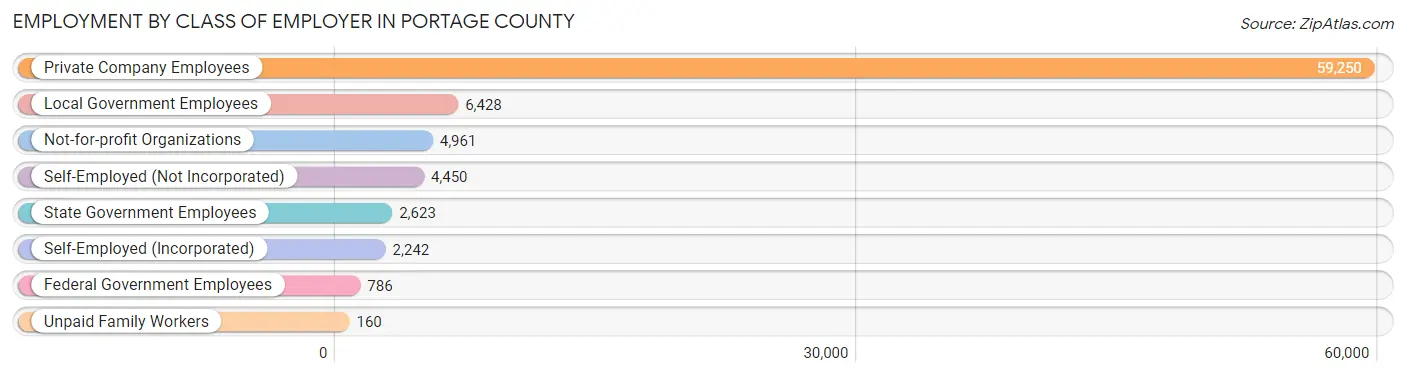
| Employer Class | # Employees | % Employees |
| Private Company Employees | 59,250 | 73.2% |
| Self-Employed (Incorporated) | 2,242 | 2.8% |
| Self-Employed (Not Incorporated) | 4,450 | 5.5% |
| Not-for-profit Organizations | 4,961 | 6.1% |
| Local Government Employees | 6,428 | 8.0% |
| State Government Employees | 2,623 | 3.2% |
| Federal Government Employees | 786 | 1.0% |
| Unpaid Family Workers | 160 | 0.2% |
| Total | 80,900 | 100.0% |
Employment Status by Age in Portage County
According to the labor force statistics for Portage County, out of the total population over 16 years of age (135,631), 65.2% or 88,431 individuals are in the labor force, with 5.6% or 4,952 of them unemployed. The age group with the highest labor force participation rate is 30 to 34 years, with 87.2% or 7,540 individuals in the labor force. Within the labor force, the 16 to 19 years age range has the highest percentage of unemployed individuals, with 15.8% or 912 of them being unemployed.
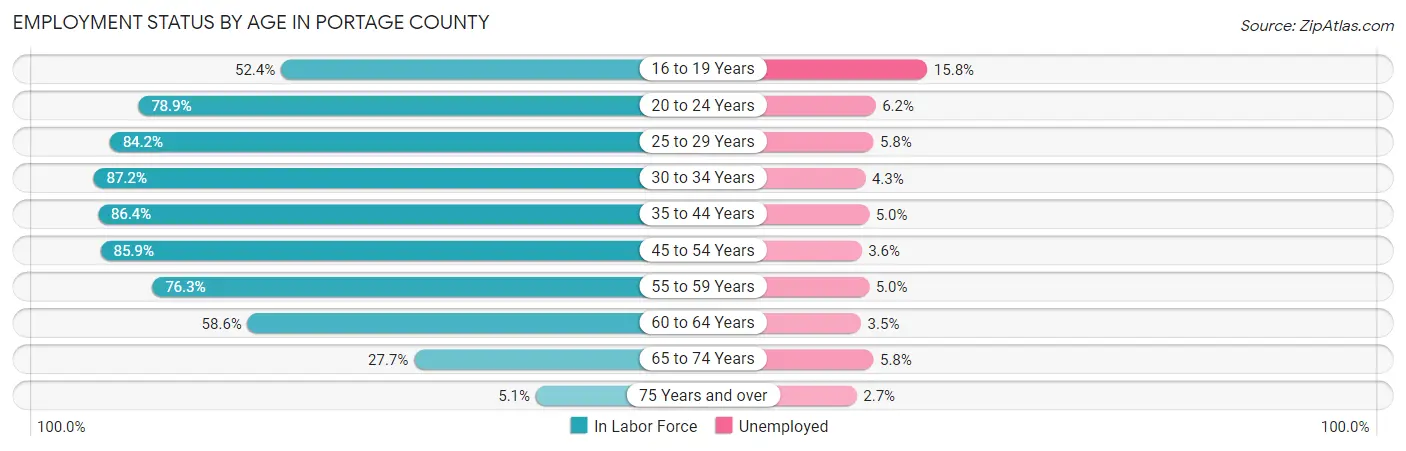
| Age Bracket | In Labor Force | Unemployed |
| 16 to 19 Years | 5,774 (52.4%) | 912 (15.8%) |
| 20 to 24 Years | 14,482 (78.9%) | 898 (6.2%) |
| 25 to 29 Years | 8,399 (84.2%) | 487 (5.8%) |
| 30 to 34 Years | 7,540 (87.2%) | 324 (4.3%) |
| 35 to 44 Years | 15,025 (86.4%) | 751 (5.0%) |
| 45 to 54 Years | 16,905 (85.9%) | 609 (3.6%) |
| 55 to 59 Years | 7,974 (76.3%) | 399 (5.0%) |
| 60 to 64 Years | 7,159 (58.6%) | 251 (3.5%) |
| 65 to 74 Years | 4,643 (27.7%) | 269 (5.8%) |
| 75 Years and over | 568 (5.1%) | 15 (2.7%) |
| Total | 88,431 (65.2%) | 4,952 (5.6%) |
Employment Status by Educational Attainment in Portage County
According to labor force statistics for Portage County, 80.4% of individuals (63,001) out of the total population between 25 and 64 years of age (78,360) are in the labor force, with 4.5% or 2,835 of them being unemployed. The group with the highest labor force participation rate are those with the educational attainment of bachelor's degree or higher, with 86.4% or 22,674 individuals in the labor force. Within the labor force, individuals with high school diploma education have the highest percentage of unemployment, with 6.9% or 1,450 of them being unemployed.
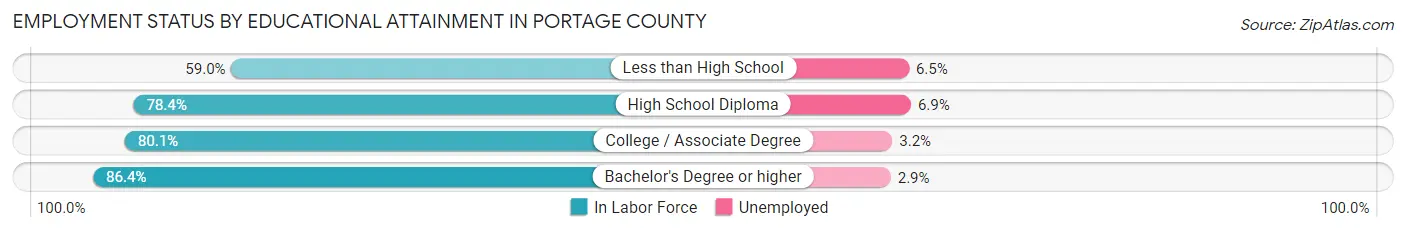
| Educational Attainment | In Labor Force | Unemployed |
| Less than High School | 2,745 (59.0%) | 302 (6.5%) |
| High School Diploma | 21,009 (78.4%) | 1,849 (6.9%) |
| College / Associate Degree | 16,554 (80.1%) | 661 (3.2%) |
| Bachelor's Degree or higher | 22,674 (86.4%) | 761 (2.9%) |
| Total | 63,001 (80.4%) | 3,526 (4.5%) |
Employment Occupations by Sex in Portage County
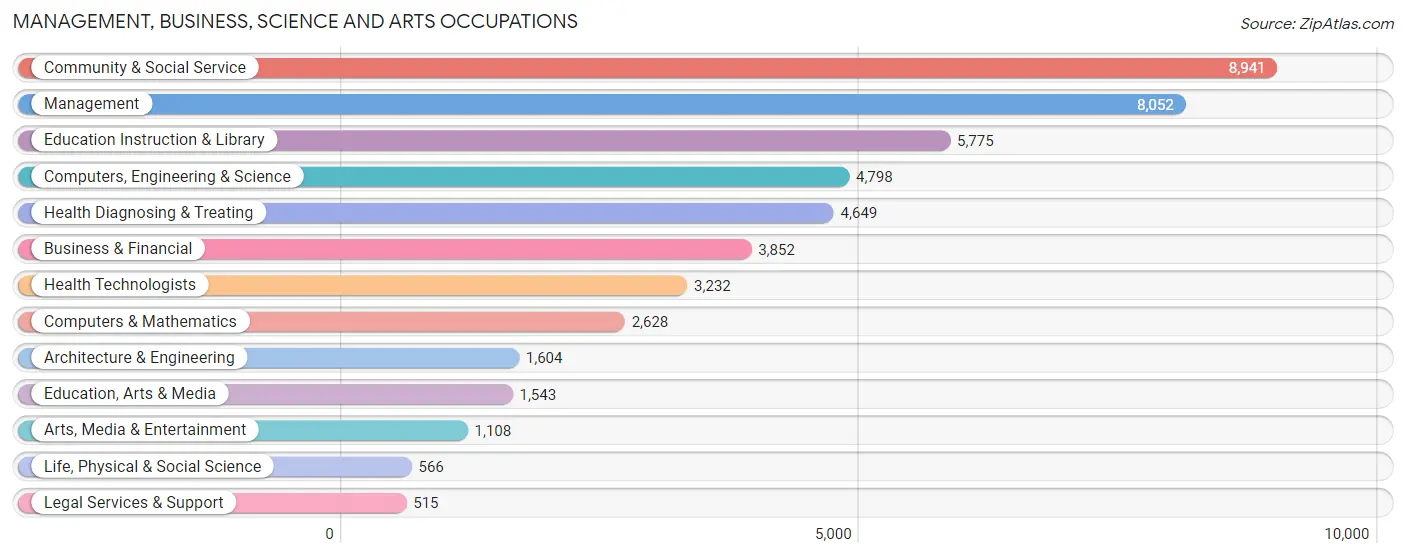
Management, Business, Science and Arts Occupations
The most common Management, Business, Science and Arts occupations in Portage County are Community & Social Service (8,941 | 10.7%), Management (8,052 | 9.7%), Education Instruction & Library (5,775 | 6.9%), Computers, Engineering & Science (4,798 | 5.8%), and Health Diagnosing & Treating (4,649 | 5.6%).
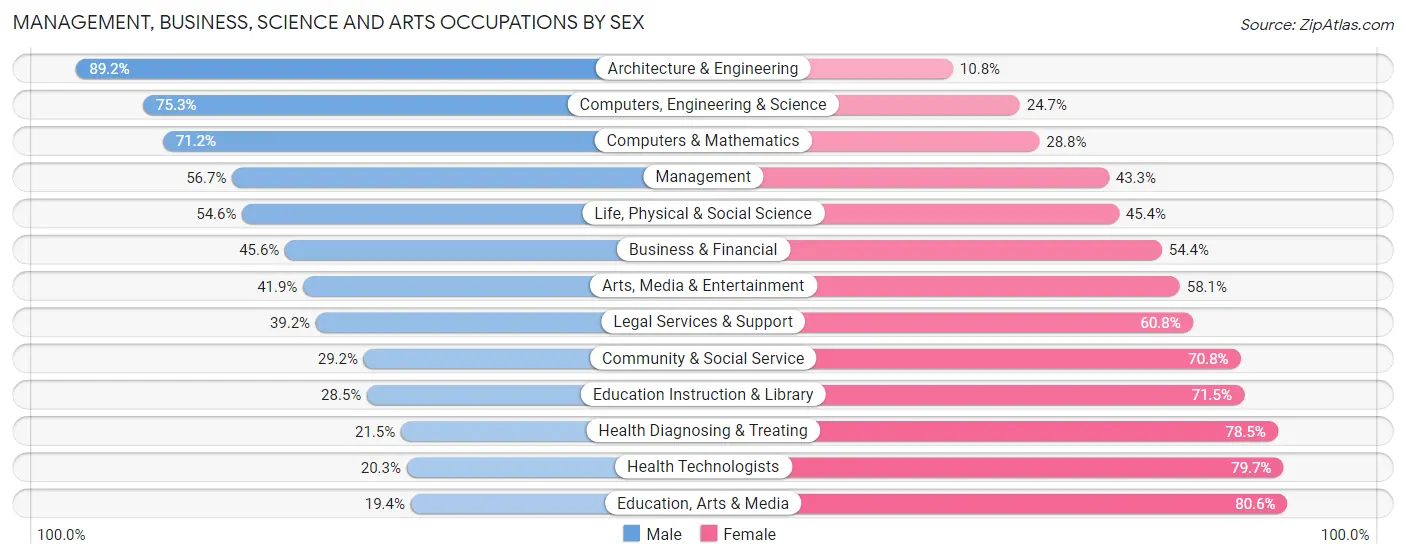
Management, Business, Science and Arts Occupations by Sex
Within the Management, Business, Science and Arts occupations in Portage County, the most male-oriented occupations are Architecture & Engineering (89.2%), Computers, Engineering & Science (75.3%), and Computers & Mathematics (71.2%), while the most female-oriented occupations are Education, Arts & Media (80.6%), Health Technologists (79.7%), and Health Diagnosing & Treating (78.5%).
| Occupation | Male | Female |
| Management | 4,565 (56.7%) | 3,487 (43.3%) |
| Business & Financial | 1,758 (45.6%) | 2,094 (54.4%) |
| Computers, Engineering & Science | 3,611 (75.3%) | 1,187 (24.7%) |
| Computers & Mathematics | 1,871 (71.2%) | 757 (28.8%) |
| Architecture & Engineering | 1,431 (89.2%) | 173 (10.8%) |
| Life, Physical & Social Science | 309 (54.6%) | 257 (45.4%) |
| Community & Social Service | 2,614 (29.2%) | 6,327 (70.8%) |
| Education, Arts & Media | 300 (19.4%) | 1,243 (80.6%) |
| Legal Services & Support | 202 (39.2%) | 313 (60.8%) |
| Education Instruction & Library | 1,648 (28.5%) | 4,127 (71.5%) |
| Arts, Media & Entertainment | 464 (41.9%) | 644 (58.1%) |
| Health Diagnosing & Treating | 998 (21.5%) | 3,651 (78.5%) |
| Health Technologists | 655 (20.3%) | 2,577 (79.7%) |
| Total (Category) | 13,546 (44.7%) | 16,746 (55.3%) |
| Total (Overall) | 43,187 (51.7%) | 40,265 (48.2%) |
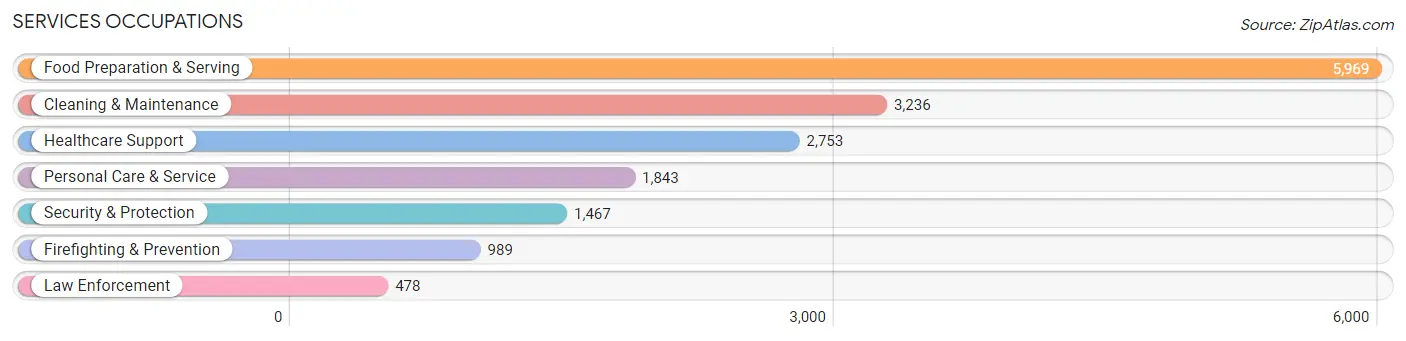
Services Occupations
The most common Services occupations in Portage County are Food Preparation & Serving (5,969 | 7.1%), Cleaning & Maintenance (3,236 | 3.9%), Healthcare Support (2,753 | 3.3%), Personal Care & Service (1,843 | 2.2%), and Security & Protection (1,467 | 1.8%).
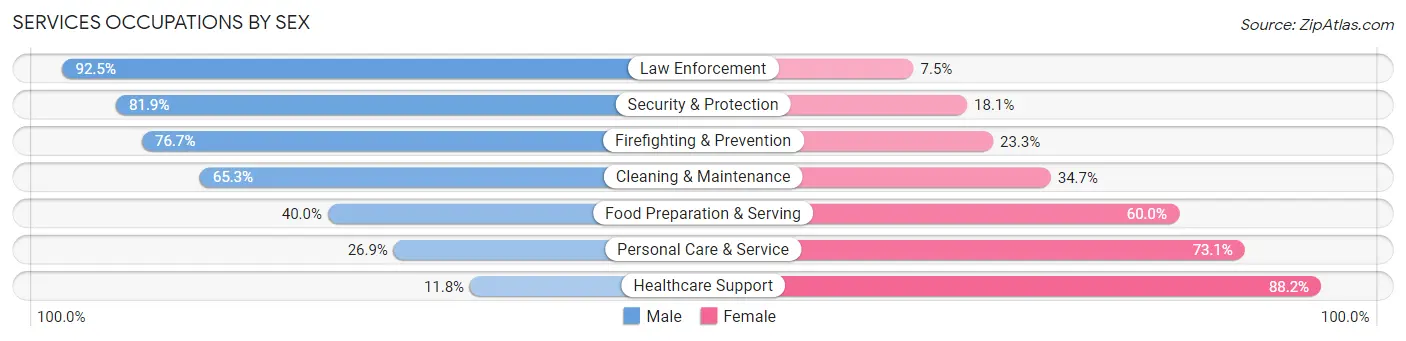
Services Occupations by Sex
Within the Services occupations in Portage County, the most male-oriented occupations are Law Enforcement (92.5%), Security & Protection (81.9%), and Firefighting & Prevention (76.7%), while the most female-oriented occupations are Healthcare Support (88.2%), Personal Care & Service (73.1%), and Food Preparation & Serving (60.0%).
| Occupation | Male | Female |
| Healthcare Support | 325 (11.8%) | 2,428 (88.2%) |
| Security & Protection | 1,201 (81.9%) | 266 (18.1%) |
| Firefighting & Prevention | 759 (76.7%) | 230 (23.3%) |
| Law Enforcement | 442 (92.5%) | 36 (7.5%) |
| Food Preparation & Serving | 2,385 (40.0%) | 3,584 (60.0%) |
| Cleaning & Maintenance | 2,113 (65.3%) | 1,123 (34.7%) |
| Personal Care & Service | 496 (26.9%) | 1,347 (73.1%) |
| Total (Category) | 6,520 (42.7%) | 8,748 (57.3%) |
| Total (Overall) | 43,187 (51.7%) | 40,265 (48.2%) |
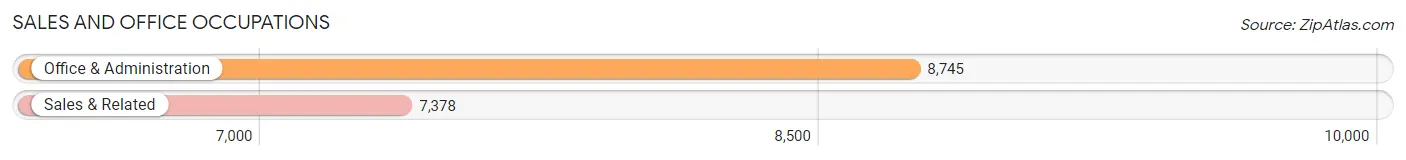
Sales and Office Occupations
The most common Sales and Office occupations in Portage County are Office & Administration (8,745 | 10.5%), and Sales & Related (7,378 | 8.8%).
Sales and Office Occupations by Sex
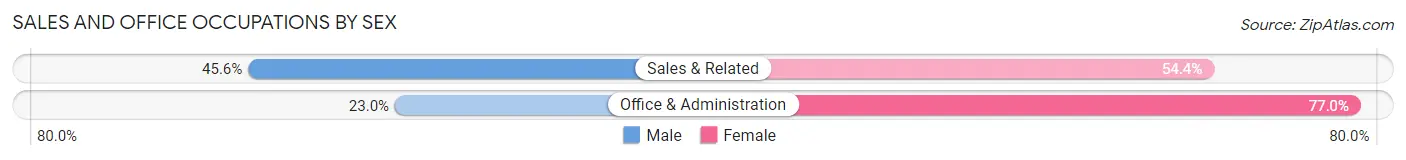
| Occupation | Male | Female |
| Sales & Related | 3,365 (45.6%) | 4,013 (54.4%) |
| Office & Administration | 2,014 (23.0%) | 6,731 (77.0%) |
| Total (Category) | 5,379 (33.4%) | 10,744 (66.6%) |
| Total (Overall) | 43,187 (51.7%) | 40,265 (48.2%) |
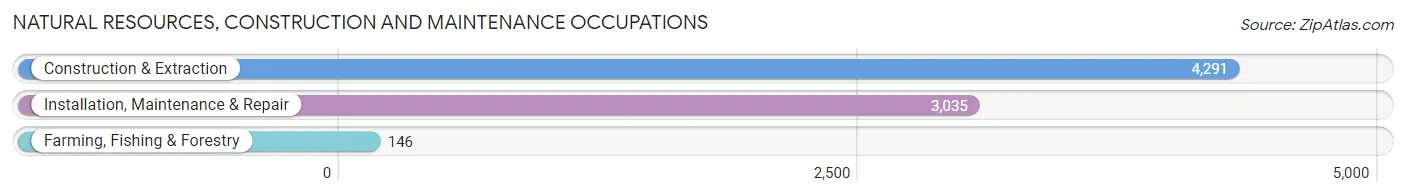
Natural Resources, Construction and Maintenance Occupations
The most common Natural Resources, Construction and Maintenance occupations in Portage County are Construction & Extraction (4,291 | 5.1%), Installation, Maintenance & Repair (3,035 | 3.6%), and Farming, Fishing & Forestry (146 | 0.2%).
Natural Resources, Construction and Maintenance Occupations by Sex
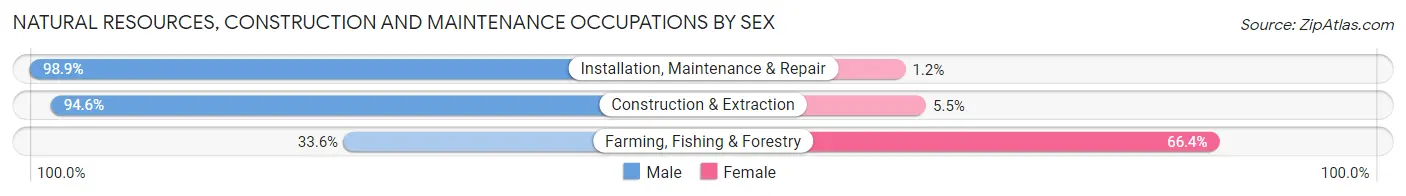
| Occupation | Male | Female |
| Farming, Fishing & Forestry | 49 (33.6%) | 97 (66.4%) |
| Construction & Extraction | 4,057 (94.6%) | 234 (5.4%) |
| Installation, Maintenance & Repair | 3,000 (98.9%) | 35 (1.1%) |
| Total (Category) | 7,106 (95.1%) | 366 (4.9%) |
| Total (Overall) | 43,187 (51.7%) | 40,265 (48.2%) |
Production, Transportation and Moving Occupations
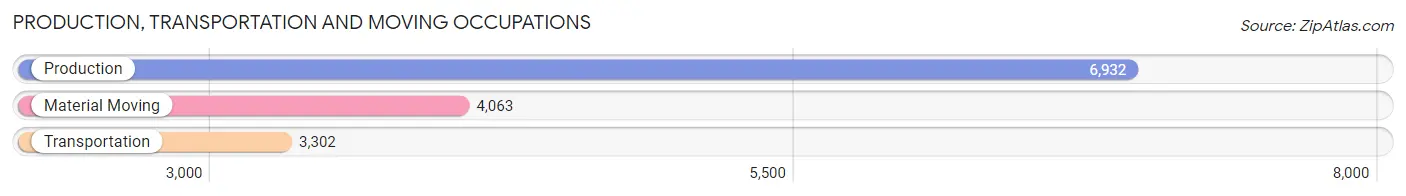
The most common Production, Transportation and Moving occupations in Portage County are Production (6,932 | 8.3%), Material Moving (4,063 | 4.9%), and Transportation (3,302 | 4.0%).
Production, Transportation and Moving Occupations by Sex
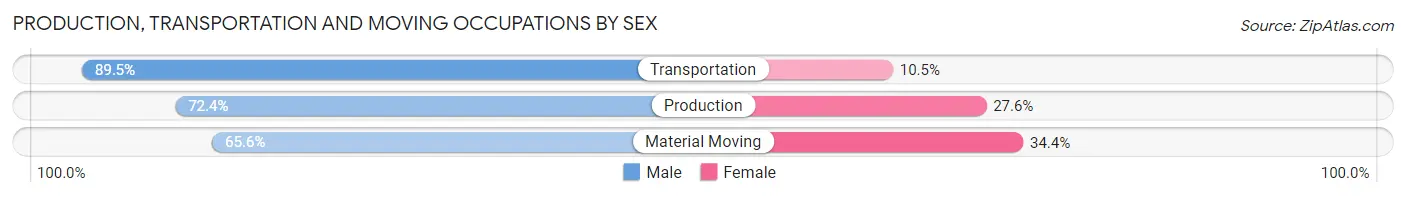
| Occupation | Male | Female |
| Production | 5,016 (72.4%) | 1,916 (27.6%) |
| Transportation | 2,955 (89.5%) | 347 (10.5%) |
| Material Moving | 2,665 (65.6%) | 1,398 (34.4%) |
| Total (Category) | 10,636 (74.4%) | 3,661 (25.6%) |
| Total (Overall) | 43,187 (51.7%) | 40,265 (48.2%) |
Employment Industries by Sex in Portage County
Employment Industries in Portage County
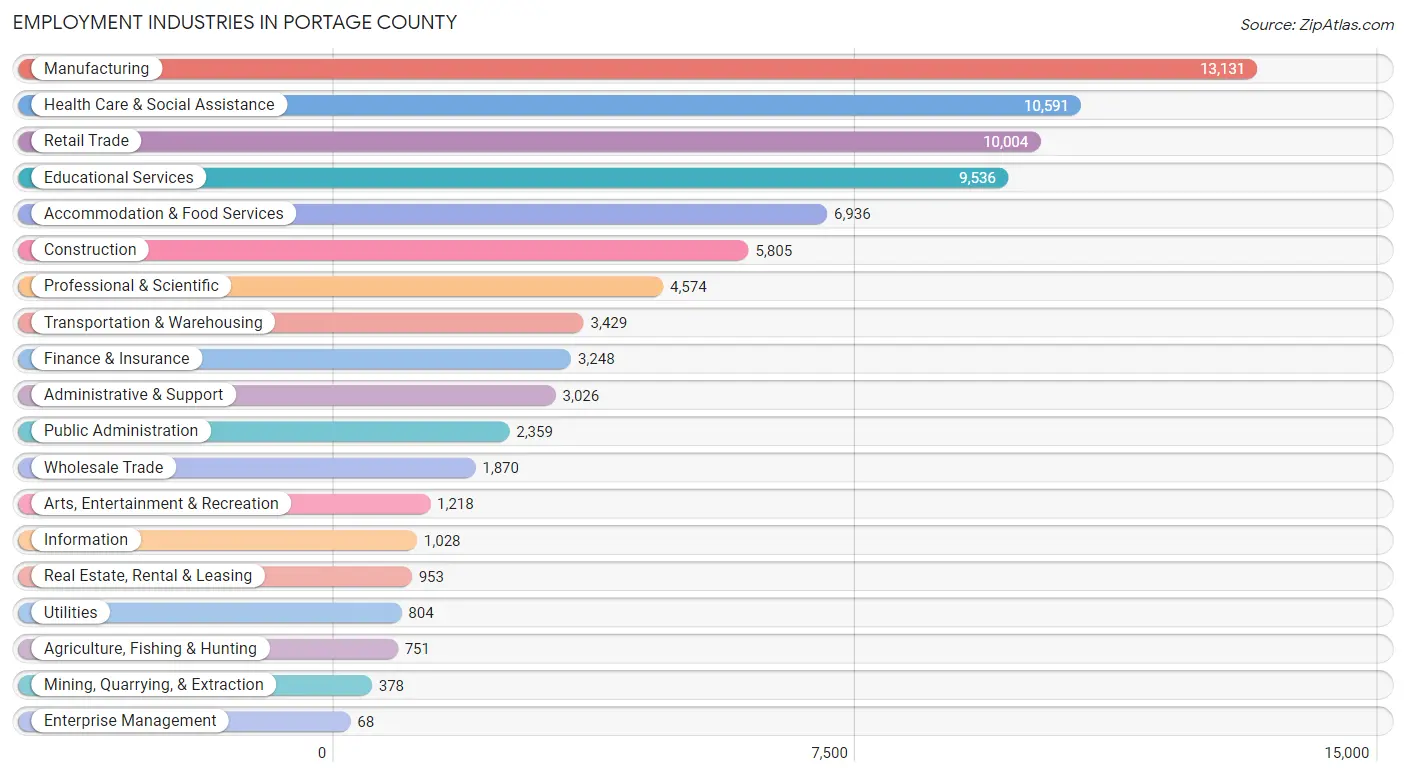
The major employment industries in Portage County include Manufacturing (13,131 | 15.7%), Health Care & Social Assistance (10,591 | 12.7%), Retail Trade (10,004 | 12.0%), Educational Services (9,536 | 11.4%), and Accommodation & Food Services (6,936 | 8.3%).
Employment Industries by Sex in Portage County
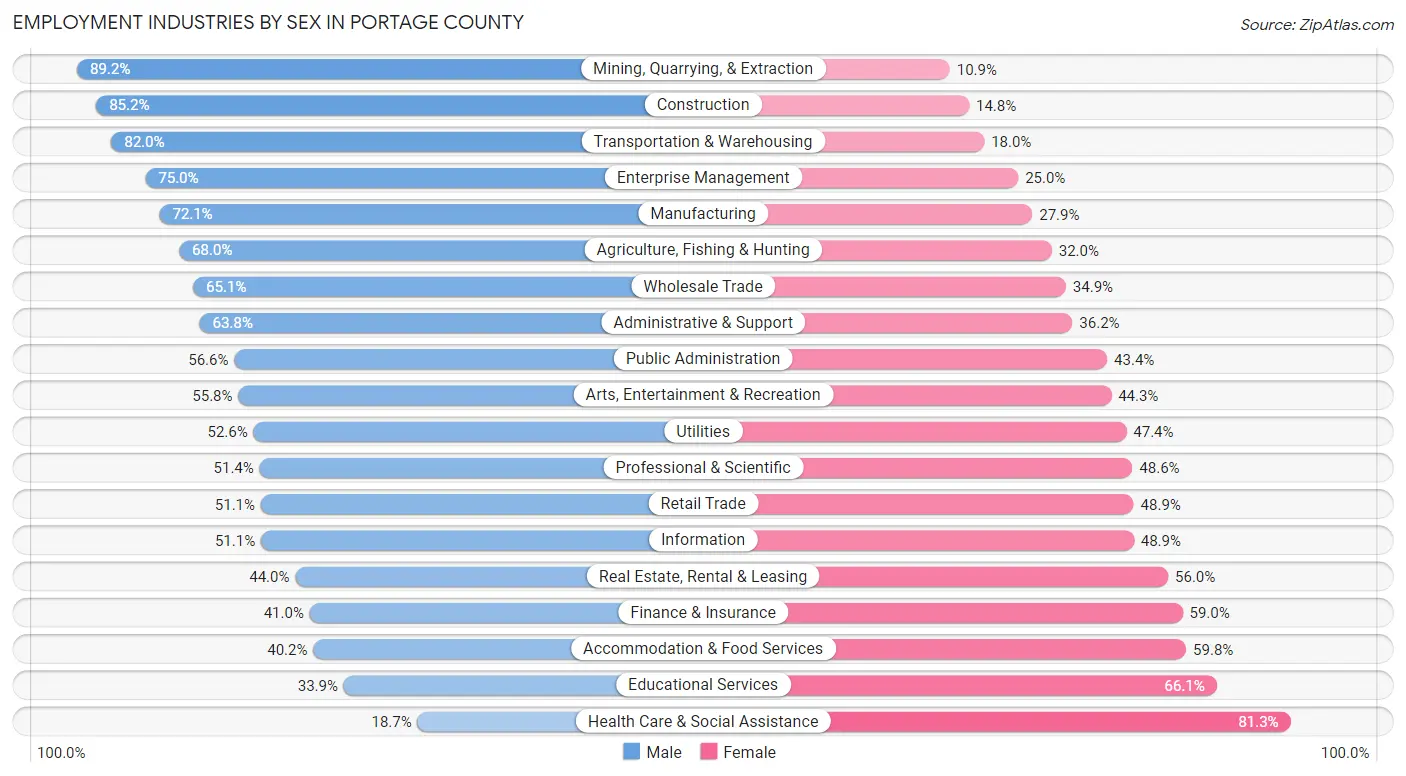
The Portage County industries that see more men than women are Mining, Quarrying, & Extraction (89.1%), Construction (85.2%), and Transportation & Warehousing (82.0%), whereas the industries that tend to have a higher number of women are Health Care & Social Assistance (81.3%), Educational Services (66.1%), and Accommodation & Food Services (59.8%).
| Industry | Male | Female |
| Agriculture, Fishing & Hunting | 511 (68.0%) | 240 (32.0%) |
| Mining, Quarrying, & Extraction | 337 (89.1%) | 41 (10.8%) |
| Construction | 4,944 (85.2%) | 861 (14.8%) |
| Manufacturing | 9,465 (72.1%) | 3,666 (27.9%) |
| Wholesale Trade | 1,218 (65.1%) | 652 (34.9%) |
| Retail Trade | 5,112 (51.1%) | 4,892 (48.9%) |
| Transportation & Warehousing | 2,813 (82.0%) | 616 (18.0%) |
| Utilities | 423 (52.6%) | 381 (47.4%) |
| Information | 525 (51.1%) | 503 (48.9%) |
| Finance & Insurance | 1,331 (41.0%) | 1,917 (59.0%) |
| Real Estate, Rental & Leasing | 419 (44.0%) | 534 (56.0%) |
| Professional & Scientific | 2,349 (51.4%) | 2,225 (48.6%) |
| Enterprise Management | 51 (75.0%) | 17 (25.0%) |
| Administrative & Support | 1,930 (63.8%) | 1,096 (36.2%) |
| Educational Services | 3,236 (33.9%) | 6,300 (66.1%) |
| Health Care & Social Assistance | 1,976 (18.7%) | 8,615 (81.3%) |
| Arts, Entertainment & Recreation | 679 (55.7%) | 539 (44.3%) |
| Accommodation & Food Services | 2,791 (40.2%) | 4,145 (59.8%) |
| Public Administration | 1,335 (56.6%) | 1,024 (43.4%) |
| Total | 43,187 (51.7%) | 40,265 (48.2%) |
Education in Portage County
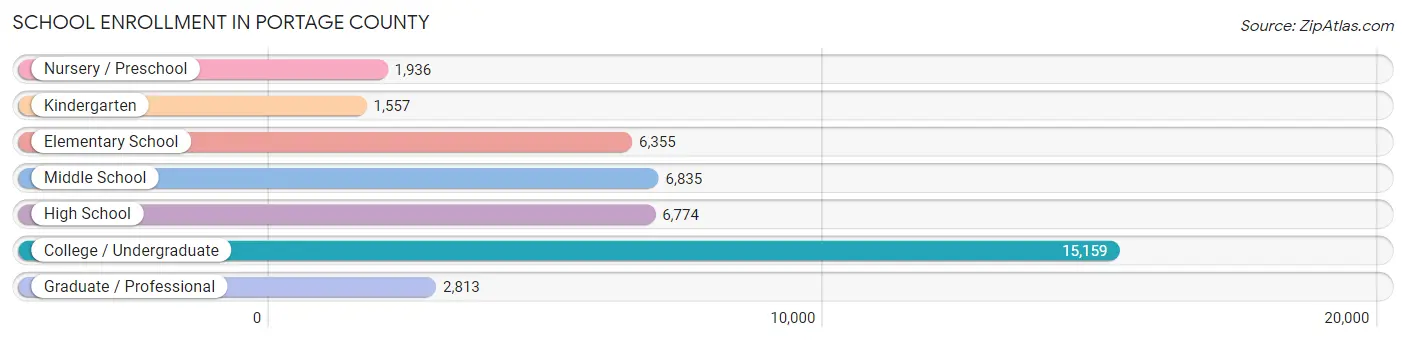
School Enrollment in Portage County
The most common levels of schooling among the 41,429 students in Portage County are college / undergraduate (15,159 | 36.6%), middle school (6,835 | 16.5%), and high school (6,774 | 16.4%).
| School Level | # Students | % Students |
| Nursery / Preschool | 1,936 | 4.7% |
| Kindergarten | 1,557 | 3.8% |
| Elementary School | 6,355 | 15.3% |
| Middle School | 6,835 | 16.5% |
| High School | 6,774 | 16.4% |
| College / Undergraduate | 15,159 | 36.6% |
| Graduate / Professional | 2,813 | 6.8% |
| Total | 41,429 | 100.0% |
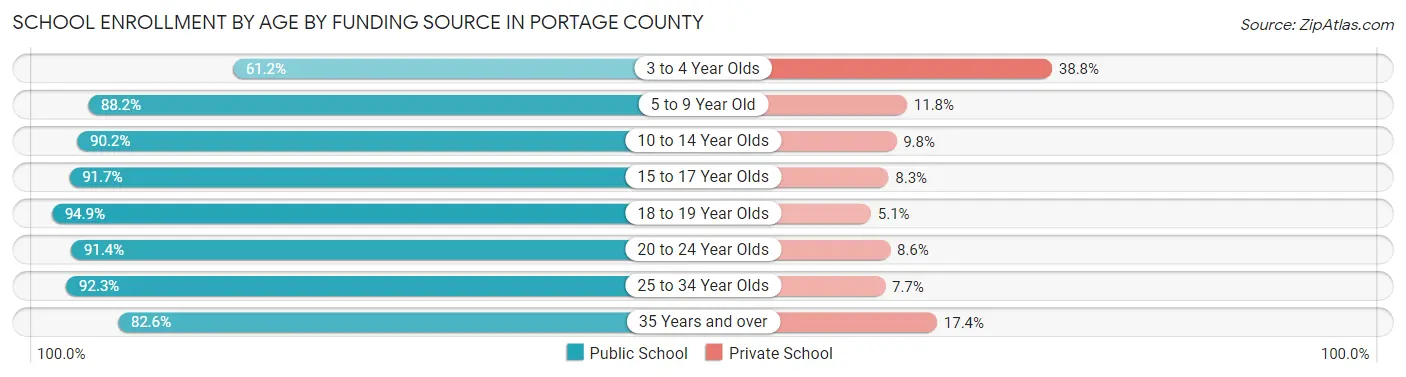
School Enrollment by Age by Funding Source in Portage County
Out of a total of 41,429 students who are enrolled in schools in Portage County, 4,309 (10.4%) attend a private institution, while the remaining 37,120 (89.6%) are enrolled in public schools. The age group of 3 to 4 year olds has the highest likelihood of being enrolled in private schools, with 593 (38.8% in the age bracket) enrolled. Conversely, the age group of 18 to 19 year olds has the lowest likelihood of being enrolled in a private school, with 5,615 (94.9% in the age bracket) attending a public institution.
| Age Bracket | Public School | Private School |
| 3 to 4 Year Olds | 936 (61.2%) | 593 (38.8%) |
| 5 to 9 Year Old | 6,599 (88.2%) | 880 (11.8%) |
| 10 to 14 Year Olds | 7,399 (90.2%) | 803 (9.8%) |
| 15 to 17 Year Olds | 4,924 (91.7%) | 447 (8.3%) |
| 18 to 19 Year Olds | 5,615 (94.9%) | 299 (5.1%) |
| 20 to 24 Year Olds | 8,143 (91.4%) | 768 (8.6%) |
| 25 to 34 Year Olds | 1,858 (92.3%) | 155 (7.7%) |
| 35 Years and over | 1,661 (82.6%) | 349 (17.4%) |
| Total | 37,120 (89.6%) | 4,309 (10.4%) |
Educational Attainment by Field of Study in Portage County
Business (7,275 | 20.0%), education (5,494 | 15.1%), science & technology (4,323 | 11.8%), arts & humanities (2,200 | 6.0%), and social sciences (2,198 | 6.0%) are the most common fields of study among 36,466 individuals in Portage County who have obtained a bachelor's degree or higher.
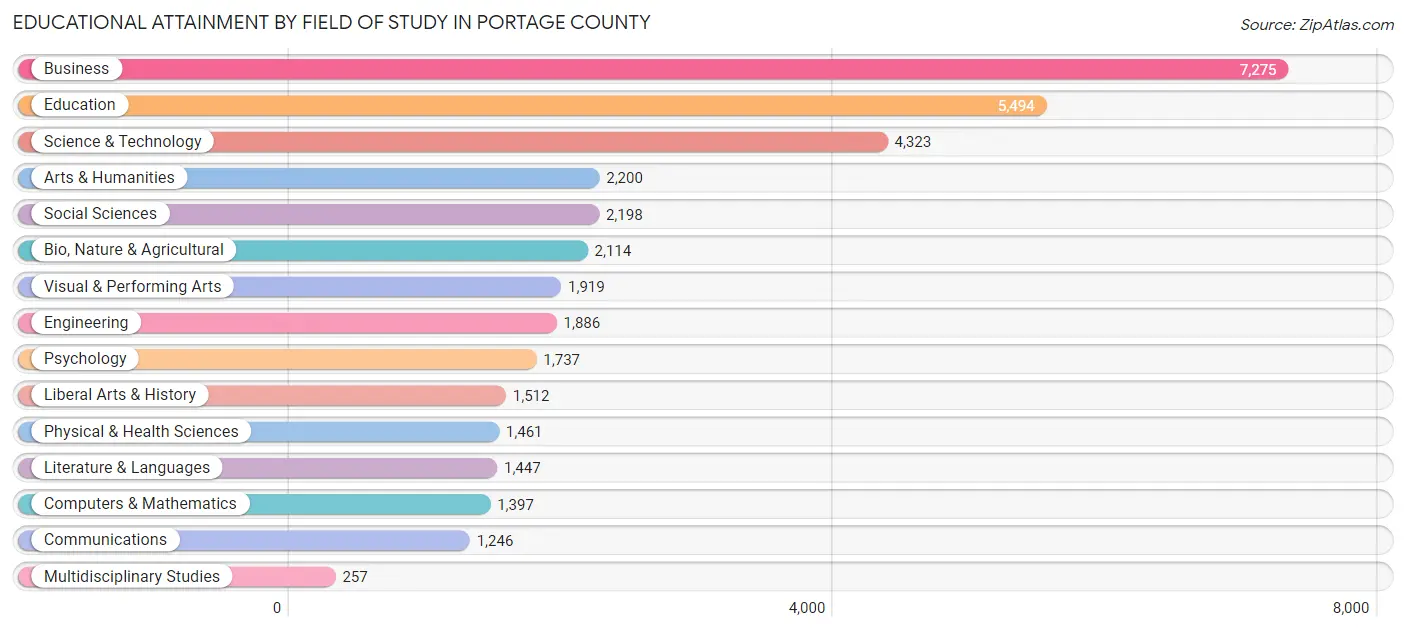
| Field of Study | # Graduates | % Graduates |
| Computers & Mathematics | 1,397 | 3.8% |
| Bio, Nature & Agricultural | 2,114 | 5.8% |
| Physical & Health Sciences | 1,461 | 4.0% |
| Psychology | 1,737 | 4.8% |
| Social Sciences | 2,198 | 6.0% |
| Engineering | 1,886 | 5.2% |
| Multidisciplinary Studies | 257 | 0.7% |
| Science & Technology | 4,323 | 11.8% |
| Business | 7,275 | 20.0% |
| Education | 5,494 | 15.1% |
| Literature & Languages | 1,447 | 4.0% |
| Liberal Arts & History | 1,512 | 4.2% |
| Visual & Performing Arts | 1,919 | 5.3% |
| Communications | 1,246 | 3.4% |
| Arts & Humanities | 2,200 | 6.0% |
| Total | 36,466 | 100.0% |
Transportation & Commute in Portage County
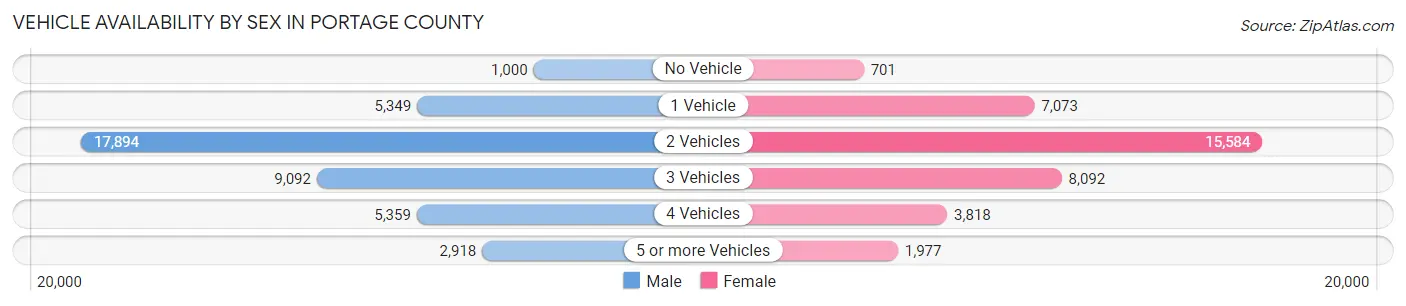
Vehicle Availability by Sex in Portage County
The most prevalent vehicle ownership categories in Portage County are males with 2 vehicles (17,894, accounting for 43.0%) and females with 2 vehicles (15,584, making up 48.0%).
| Vehicles Available | Male | Female |
| No Vehicle | 1,000 (2.4%) | 701 (1.9%) |
| 1 Vehicle | 5,349 (12.9%) | 7,073 (19.0%) |
| 2 Vehicles | 17,894 (43.0%) | 15,584 (41.8%) |
| 3 Vehicles | 9,092 (21.8%) | 8,092 (21.7%) |
| 4 Vehicles | 5,359 (12.9%) | 3,818 (10.2%) |
| 5 or more Vehicles | 2,918 (7.0%) | 1,977 (5.3%) |
| Total | 41,612 (100.0%) | 37,245 (100.0%) |
Commute Time in Portage County
The most frequently occuring commute durations in Portage County are 20 to 24 minutes (10,101 commuters, 14.2%), 15 to 19 minutes (9,660 commuters, 13.5%), and 30 to 34 minutes (9,408 commuters, 13.2%).
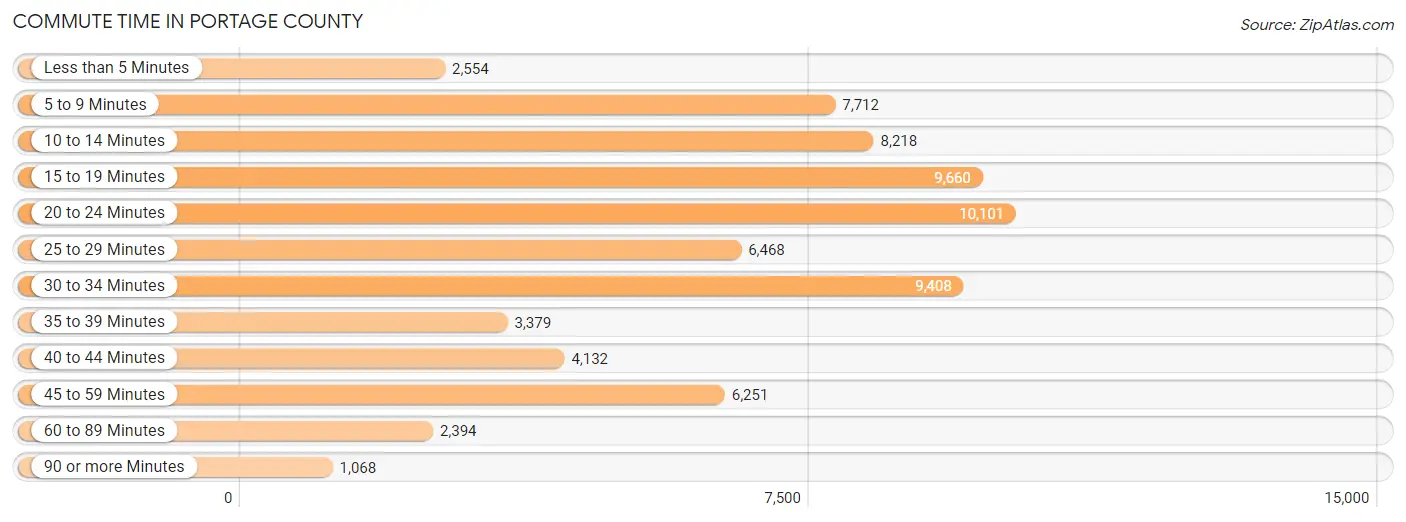
| Commute Time | # Commuters | % Commuters |
| Less than 5 Minutes | 2,554 | 3.6% |
| 5 to 9 Minutes | 7,712 | 10.8% |
| 10 to 14 Minutes | 8,218 | 11.5% |
| 15 to 19 Minutes | 9,660 | 13.5% |
| 20 to 24 Minutes | 10,101 | 14.2% |
| 25 to 29 Minutes | 6,468 | 9.1% |
| 30 to 34 Minutes | 9,408 | 13.2% |
| 35 to 39 Minutes | 3,379 | 4.7% |
| 40 to 44 Minutes | 4,132 | 5.8% |
| 45 to 59 Minutes | 6,251 | 8.8% |
| 60 to 89 Minutes | 2,394 | 3.4% |
| 90 or more Minutes | 1,068 | 1.5% |
Commute Time by Sex in Portage County
The most common commute times in Portage County are 20 to 24 minutes (5,371 commuters, 14.2%) for males and 15 to 19 minutes (4,875 commuters, 14.5%) for females.
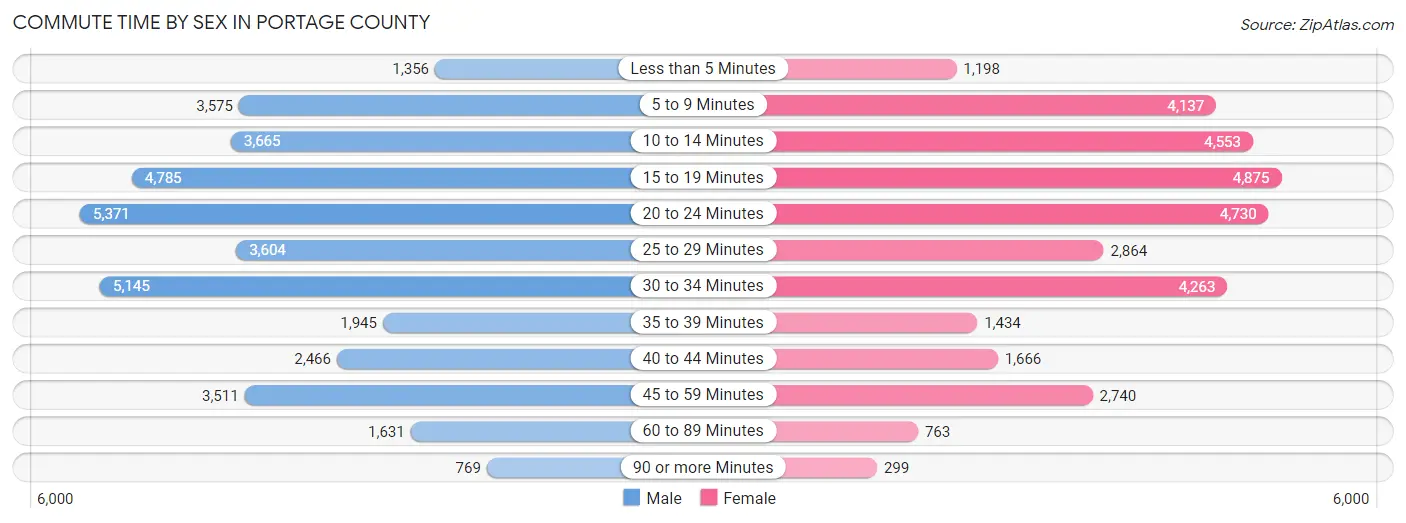
| Commute Time | Male | Female |
| Less than 5 Minutes | 1,356 (3.6%) | 1,198 (3.6%) |
| 5 to 9 Minutes | 3,575 (9.5%) | 4,137 (12.3%) |
| 10 to 14 Minutes | 3,665 (9.7%) | 4,553 (13.6%) |
| 15 to 19 Minutes | 4,785 (12.7%) | 4,875 (14.5%) |
| 20 to 24 Minutes | 5,371 (14.2%) | 4,730 (14.1%) |
| 25 to 29 Minutes | 3,604 (9.5%) | 2,864 (8.5%) |
| 30 to 34 Minutes | 5,145 (13.6%) | 4,263 (12.7%) |
| 35 to 39 Minutes | 1,945 (5.1%) | 1,434 (4.3%) |
| 40 to 44 Minutes | 2,466 (6.5%) | 1,666 (5.0%) |
| 45 to 59 Minutes | 3,511 (9.3%) | 2,740 (8.2%) |
| 60 to 89 Minutes | 1,631 (4.3%) | 763 (2.3%) |
| 90 or more Minutes | 769 (2.0%) | 299 (0.9%) |
Time of Departure to Work by Sex in Portage County
The most frequent times of departure to work in Portage County are 7:00 AM to 7:29 AM (4,832, 12.8%) for males and 7:00 AM to 7:29 AM (4,773, 14.2%) for females.
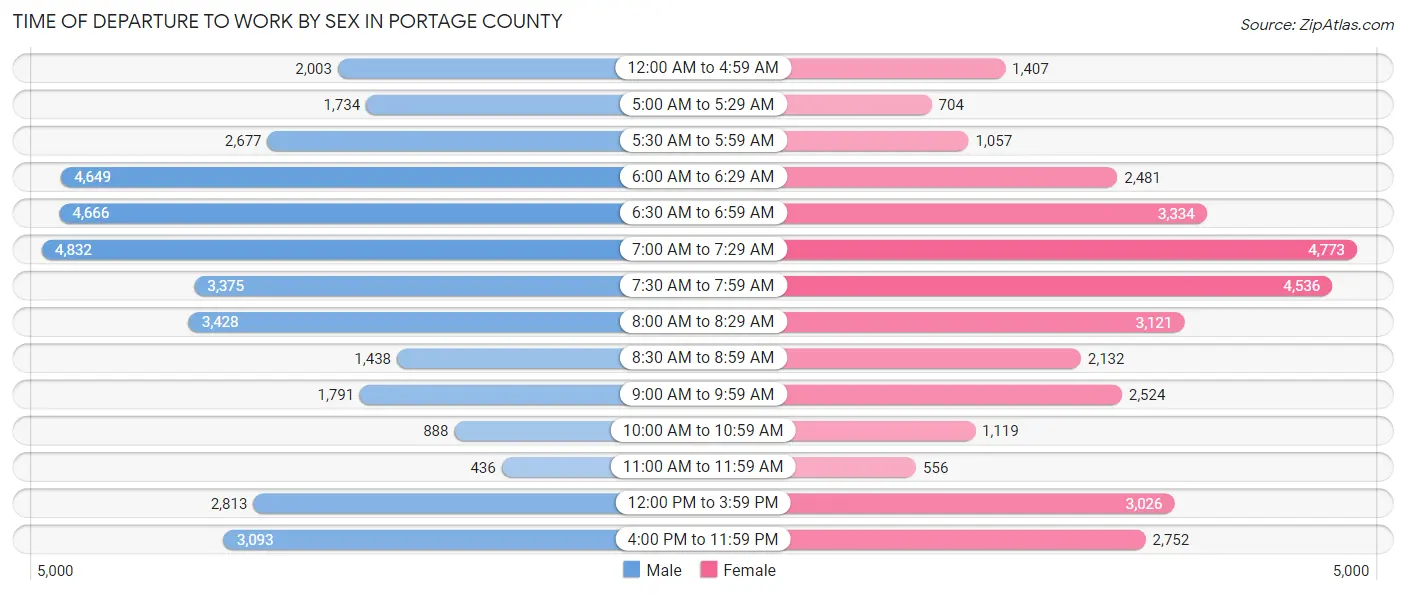
| Time of Departure | Male | Female |
| 12:00 AM to 4:59 AM | 2,003 (5.3%) | 1,407 (4.2%) |
| 5:00 AM to 5:29 AM | 1,734 (4.6%) | 704 (2.1%) |
| 5:30 AM to 5:59 AM | 2,677 (7.1%) | 1,057 (3.2%) |
| 6:00 AM to 6:29 AM | 4,649 (12.3%) | 2,481 (7.4%) |
| 6:30 AM to 6:59 AM | 4,666 (12.3%) | 3,334 (10.0%) |
| 7:00 AM to 7:29 AM | 4,832 (12.8%) | 4,773 (14.2%) |
| 7:30 AM to 7:59 AM | 3,375 (8.9%) | 4,536 (13.5%) |
| 8:00 AM to 8:29 AM | 3,428 (9.1%) | 3,121 (9.3%) |
| 8:30 AM to 8:59 AM | 1,438 (3.8%) | 2,132 (6.4%) |
| 9:00 AM to 9:59 AM | 1,791 (4.7%) | 2,524 (7.5%) |
| 10:00 AM to 10:59 AM | 888 (2.4%) | 1,119 (3.3%) |
| 11:00 AM to 11:59 AM | 436 (1.1%) | 556 (1.7%) |
| 12:00 PM to 3:59 PM | 2,813 (7.4%) | 3,026 (9.0%) |
| 4:00 PM to 11:59 PM | 3,093 (8.2%) | 2,752 (8.2%) |
| Total | 37,823 (100.0%) | 33,522 (100.0%) |
Housing Occupancy in Portage County
Occupancy by Ownership in Portage County
Of the total 63,588 dwellings in Portage County, owner-occupied units account for 44,931 (70.7%), while renter-occupied units make up 18,657 (29.3%).
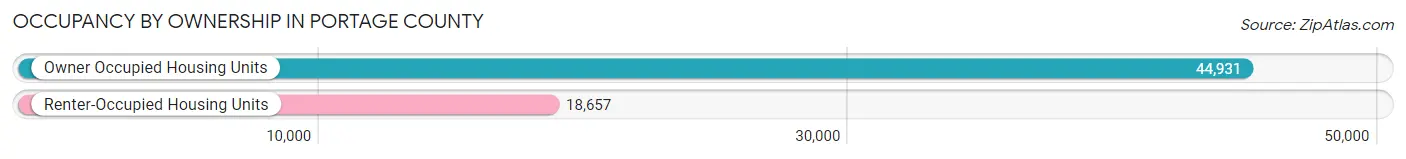
| Occupancy | # Housing Units | % Housing Units |
| Owner Occupied Housing Units | 44,931 | 70.7% |
| Renter-Occupied Housing Units | 18,657 | 29.3% |
| Total Occupied Housing Units | 63,588 | 100.0% |
Occupancy by Household Size in Portage County
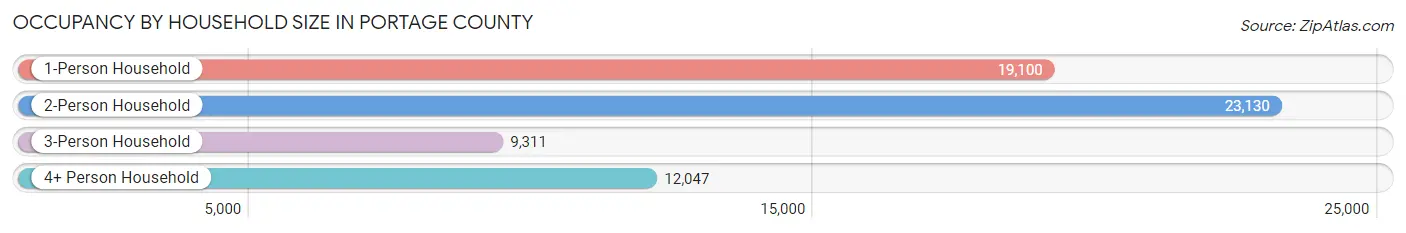
| Household Size | # Housing Units | % Housing Units |
| 1-Person Household | 19,100 | 30.0% |
| 2-Person Household | 23,130 | 36.4% |
| 3-Person Household | 9,311 | 14.6% |
| 4+ Person Household | 12,047 | 19.0% |
| Total Housing Units | 63,588 | 100.0% |
Occupancy by Ownership by Household Size in Portage County
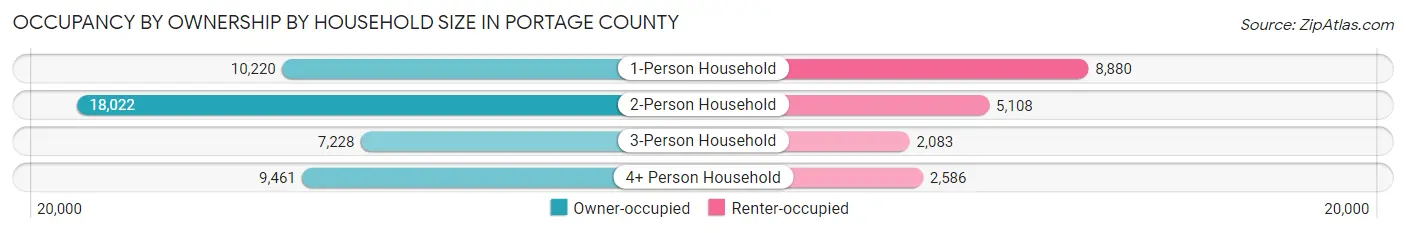
| Household Size | Owner-occupied | Renter-occupied |
| 1-Person Household | 10,220 (53.5%) | 8,880 (46.5%) |
| 2-Person Household | 18,022 (77.9%) | 5,108 (22.1%) |
| 3-Person Household | 7,228 (77.6%) | 2,083 (22.4%) |
| 4+ Person Household | 9,461 (78.5%) | 2,586 (21.5%) |
| Total Housing Units | 44,931 (70.7%) | 18,657 (29.3%) |
Occupancy by Educational Attainment in Portage County
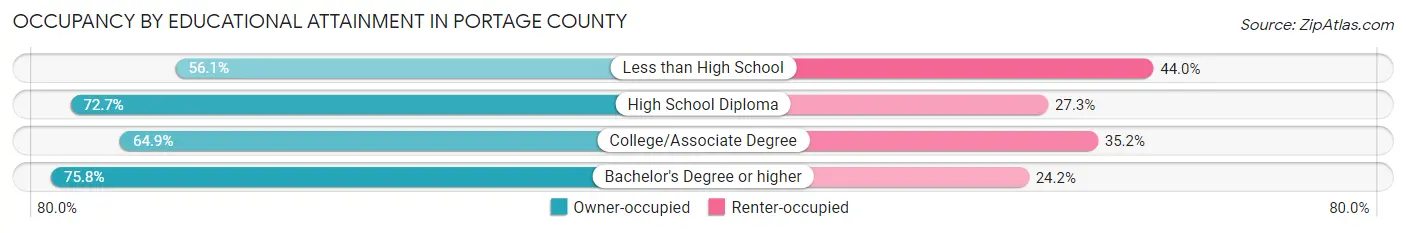
| Household Size | Owner-occupied | Renter-occupied |
| Less than High School | 2,302 (56.0%) | 1,805 (44.0%) |
| High School Diploma | 15,041 (72.7%) | 5,641 (27.3%) |
| College/Associate Degree | 10,789 (64.8%) | 5,849 (35.1%) |
| Bachelor's Degree or higher | 16,799 (75.8%) | 5,362 (24.2%) |
Occupancy by Age of Householder in Portage County
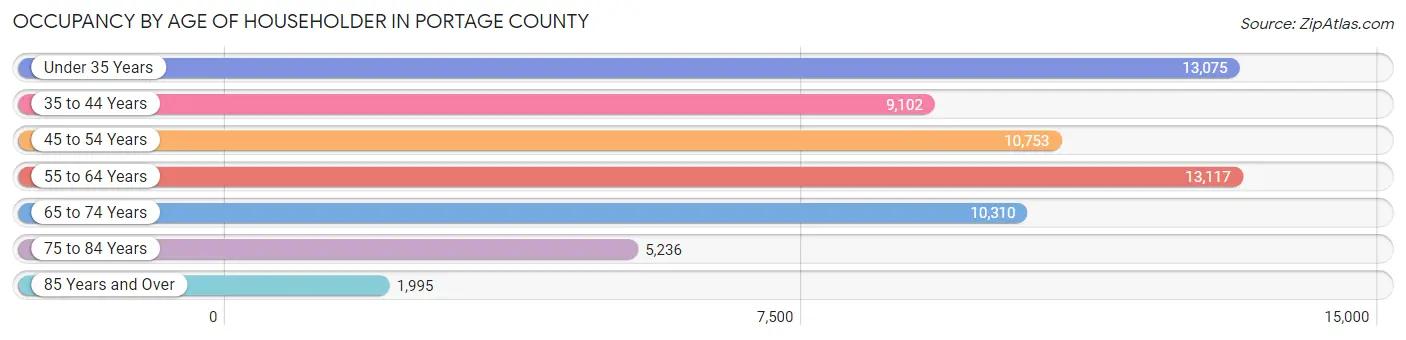
| Age Bracket | # Households | % Households |
| Under 35 Years | 13,075 | 20.6% |
| 35 to 44 Years | 9,102 | 14.3% |
| 45 to 54 Years | 10,753 | 16.9% |
| 55 to 64 Years | 13,117 | 20.6% |
| 65 to 74 Years | 10,310 | 16.2% |
| 75 to 84 Years | 5,236 | 8.2% |
| 85 Years and Over | 1,995 | 3.1% |
| Total | 63,588 | 100.0% |
Housing Finances in Portage County
Median Income by Occupancy in Portage County
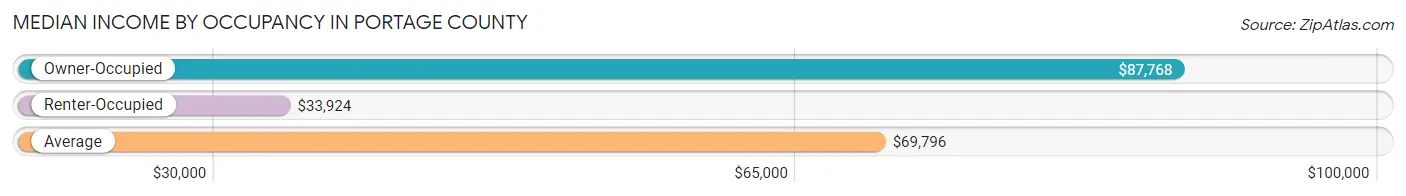
| Occupancy Type | # Households | Median Income |
| Owner-Occupied | 44,931 (70.7%) | $87,768 |
| Renter-Occupied | 18,657 (29.3%) | $33,924 |
| Average | 63,588 (100.0%) | $69,796 |
Occupancy by Householder Income Bracket in Portage County
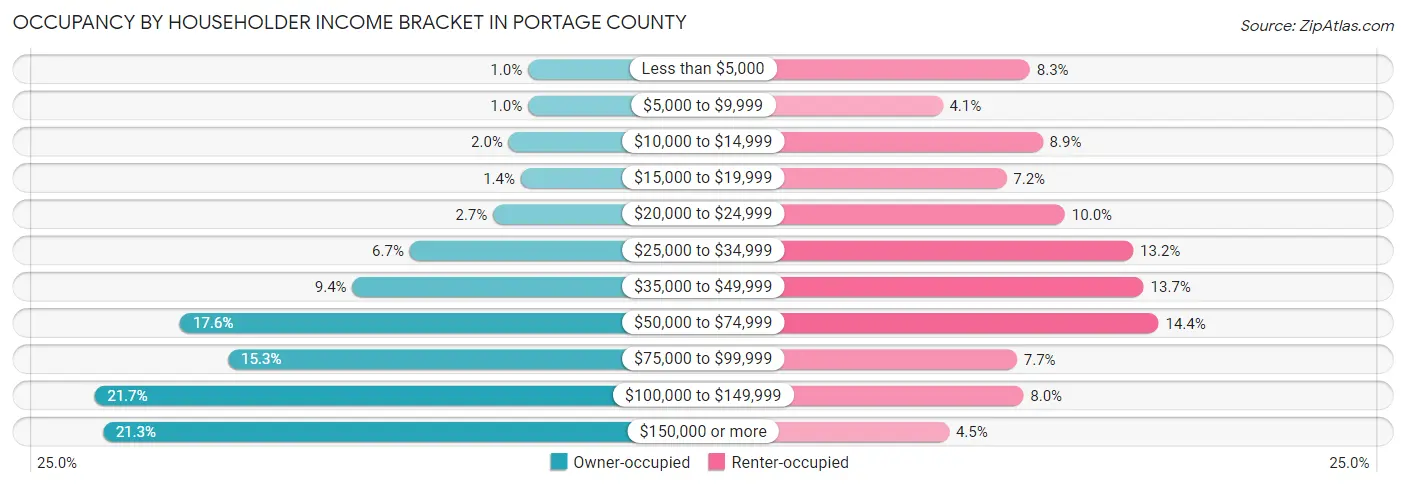
| Income Bracket | Owner-occupied | Renter-occupied |
| Less than $5,000 | 465 (1.0%) | 1,548 (8.3%) |
| $5,000 to $9,999 | 464 (1.0%) | 773 (4.1%) |
| $10,000 to $14,999 | 877 (1.9%) | 1,663 (8.9%) |
| $15,000 to $19,999 | 615 (1.4%) | 1,339 (7.2%) |
| $20,000 to $24,999 | 1,210 (2.7%) | 1,860 (10.0%) |
| $25,000 to $34,999 | 2,993 (6.7%) | 2,467 (13.2%) |
| $35,000 to $49,999 | 4,217 (9.4%) | 2,560 (13.7%) |
| $50,000 to $74,999 | 7,910 (17.6%) | 2,692 (14.4%) |
| $75,000 to $99,999 | 6,879 (15.3%) | 1,433 (7.7%) |
| $100,000 to $149,999 | 9,739 (21.7%) | 1,491 (8.0%) |
| $150,000 or more | 9,562 (21.3%) | 831 (4.4%) |
| Total | 44,931 (100.0%) | 18,657 (100.0%) |
Monthly Housing Cost Tiers in Portage County
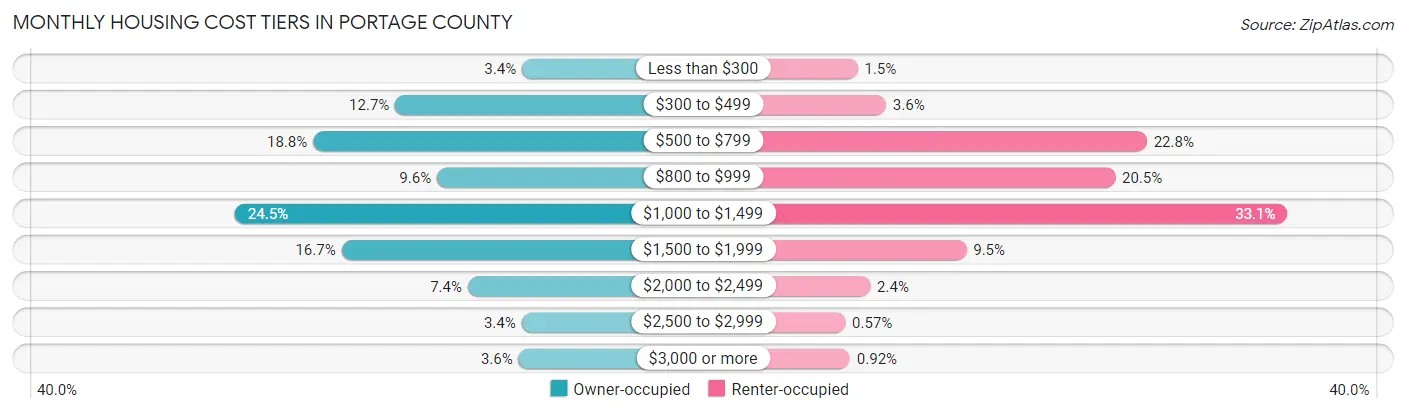
| Monthly Cost | Owner-occupied | Renter-occupied |
| Less than $300 | 1,516 (3.4%) | 277 (1.5%) |
| $300 to $499 | 5,709 (12.7%) | 666 (3.6%) |
| $500 to $799 | 8,423 (18.8%) | 4,250 (22.8%) |
| $800 to $999 | 4,325 (9.6%) | 3,815 (20.4%) |
| $1,000 to $1,499 | 11,012 (24.5%) | 6,181 (33.1%) |
| $1,500 to $1,999 | 7,486 (16.7%) | 1,770 (9.5%) |
| $2,000 to $2,499 | 3,307 (7.4%) | 450 (2.4%) |
| $2,500 to $2,999 | 1,527 (3.4%) | 107 (0.6%) |
| $3,000 or more | 1,626 (3.6%) | 172 (0.9%) |
| Total | 44,931 (100.0%) | 18,657 (100.0%) |
Physical Housing Characteristics in Portage County
Housing Structures in Portage County
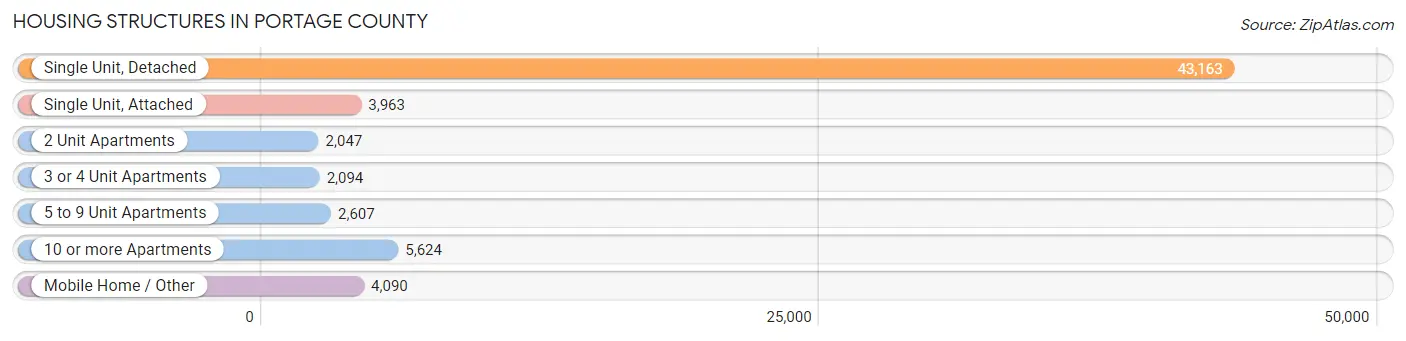
| Structure Type | # Housing Units | % Housing Units |
| Single Unit, Detached | 43,163 | 67.9% |
| Single Unit, Attached | 3,963 | 6.2% |
| 2 Unit Apartments | 2,047 | 3.2% |
| 3 or 4 Unit Apartments | 2,094 | 3.3% |
| 5 to 9 Unit Apartments | 2,607 | 4.1% |
| 10 or more Apartments | 5,624 | 8.8% |
| Mobile Home / Other | 4,090 | 6.4% |
| Total | 63,588 | 100.0% |
Housing Structures by Occupancy in Portage County
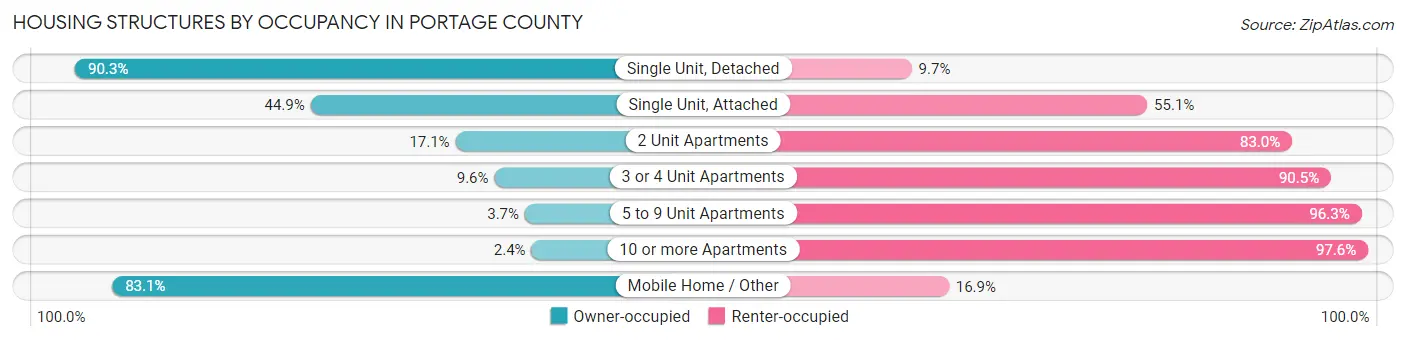
| Structure Type | Owner-occupied | Renter-occupied |
| Single Unit, Detached | 38,969 (90.3%) | 4,194 (9.7%) |
| Single Unit, Attached | 1,781 (44.9%) | 2,182 (55.1%) |
| 2 Unit Apartments | 349 (17.1%) | 1,698 (83.0%) |
| 3 or 4 Unit Apartments | 200 (9.6%) | 1,894 (90.4%) |
| 5 to 9 Unit Apartments | 96 (3.7%) | 2,511 (96.3%) |
| 10 or more Apartments | 136 (2.4%) | 5,488 (97.6%) |
| Mobile Home / Other | 3,400 (83.1%) | 690 (16.9%) |
| Total | 44,931 (70.7%) | 18,657 (29.3%) |
Housing Structures by Number of Rooms in Portage County
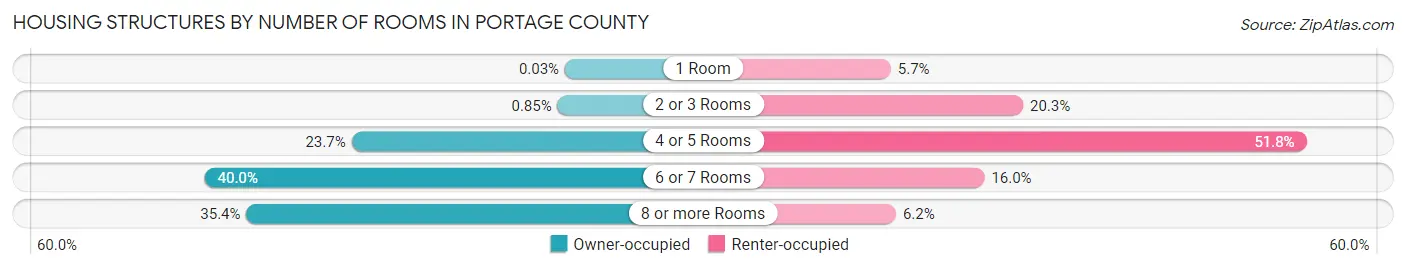
| Number of Rooms | Owner-occupied | Renter-occupied |
| 1 Room | 12 (0.0%) | 1,054 (5.7%) |
| 2 or 3 Rooms | 382 (0.9%) | 3,792 (20.3%) |
| 4 or 5 Rooms | 10,658 (23.7%) | 9,658 (51.8%) |
| 6 or 7 Rooms | 17,980 (40.0%) | 2,993 (16.0%) |
| 8 or more Rooms | 15,899 (35.4%) | 1,160 (6.2%) |
| Total | 44,931 (100.0%) | 18,657 (100.0%) |
Housing Structure by Heating Type in Portage County
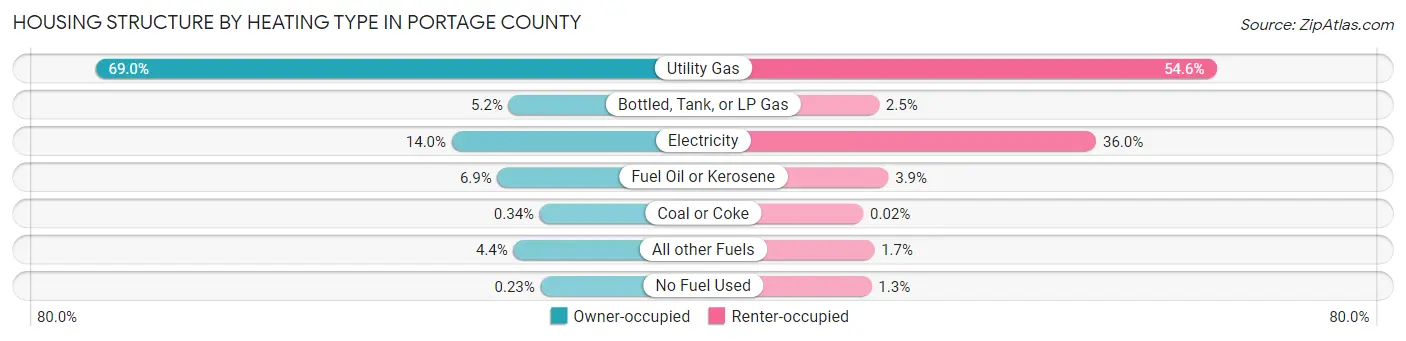
| Heating Type | Owner-occupied | Renter-occupied |
| Utility Gas | 31,014 (69.0%) | 10,185 (54.6%) |
| Bottled, Tank, or LP Gas | 2,319 (5.2%) | 458 (2.5%) |
| Electricity | 6,270 (14.0%) | 6,720 (36.0%) |
| Fuel Oil or Kerosene | 3,094 (6.9%) | 727 (3.9%) |
| Coal or Coke | 153 (0.3%) | 4 (0.0%) |
| All other Fuels | 1,979 (4.4%) | 322 (1.7%) |
| No Fuel Used | 102 (0.2%) | 241 (1.3%) |
| Total | 44,931 (100.0%) | 18,657 (100.0%) |
Household Vehicle Usage in Portage County
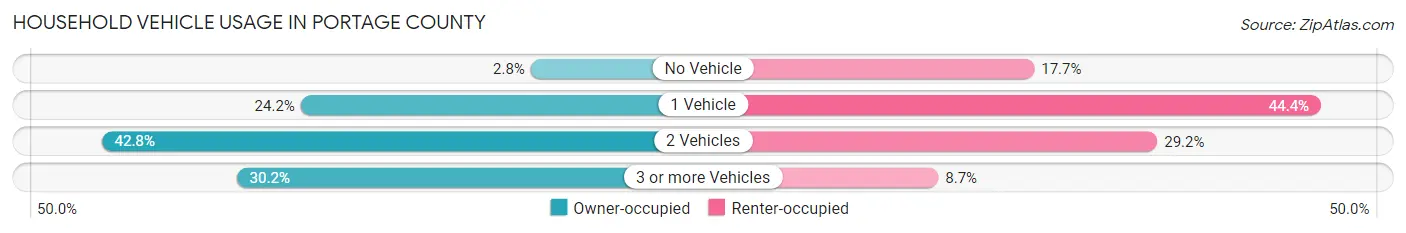
| Vehicles per Household | Owner-occupied | Renter-occupied |
| No Vehicle | 1,240 (2.8%) | 3,299 (17.7%) |
| 1 Vehicle | 10,888 (24.2%) | 8,290 (44.4%) |
| 2 Vehicles | 19,234 (42.8%) | 5,441 (29.2%) |
| 3 or more Vehicles | 13,569 (30.2%) | 1,627 (8.7%) |
| Total | 44,931 (100.0%) | 18,657 (100.0%) |
Real Estate & Mortgages in Portage County
Real Estate and Mortgage Overview in Portage County
| Characteristic | Without Mortgage | With Mortgage |
| Housing Units | 17,377 | 27,554 |
| Median Property Value | $162,200 | $216,200 |
| Median Household Income | $64,348 | $7,320 |
| Monthly Housing Costs | $567 | $1,618 |
| Real Estate Taxes | $2,331 | $574 |
Property Value by Mortgage Status in Portage County
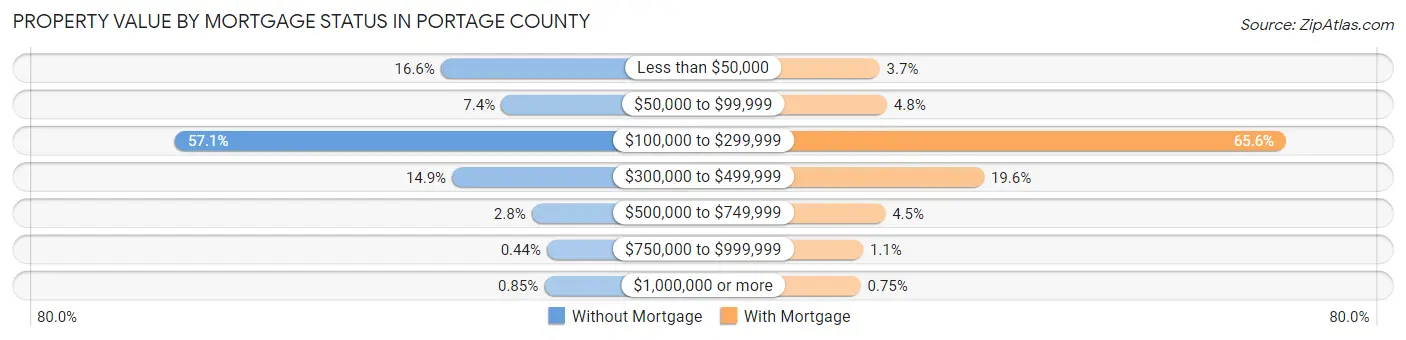
| Property Value | Without Mortgage | With Mortgage |
| Less than $50,000 | 2,886 (16.6%) | 1,010 (3.7%) |
| $50,000 to $99,999 | 1,287 (7.4%) | 1,318 (4.8%) |
| $100,000 to $299,999 | 9,916 (57.1%) | 18,071 (65.6%) |
| $300,000 to $499,999 | 2,586 (14.9%) | 5,391 (19.6%) |
| $500,000 to $749,999 | 479 (2.8%) | 1,246 (4.5%) |
| $750,000 to $999,999 | 76 (0.4%) | 311 (1.1%) |
| $1,000,000 or more | 147 (0.9%) | 207 (0.7%) |
| Total | 17,377 (100.0%) | 27,554 (100.0%) |
Household Income by Mortgage Status in Portage County
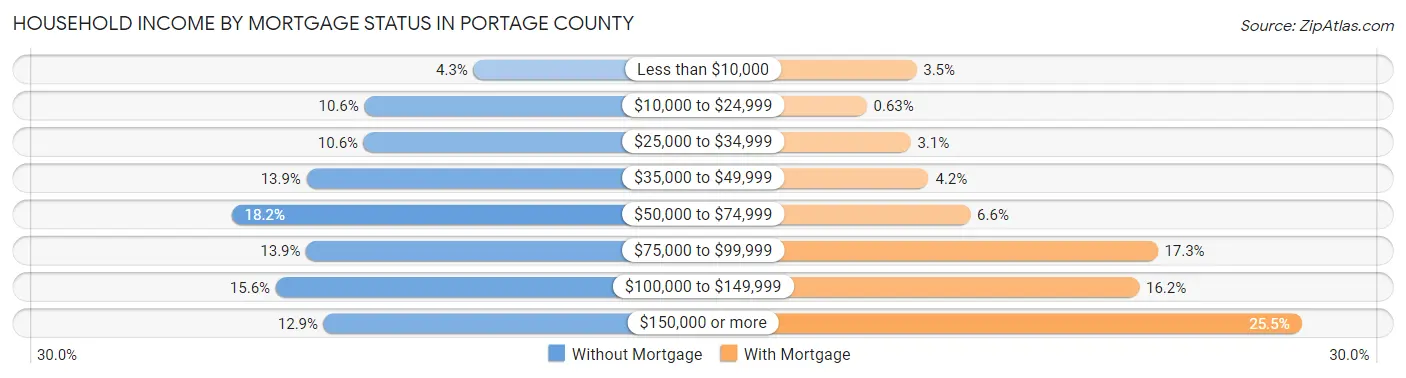
| Household Income | Without Mortgage | With Mortgage |
| Less than $10,000 | 755 (4.3%) | 957 (3.5%) |
| $10,000 to $24,999 | 1,836 (10.6%) | 174 (0.6%) |
| $25,000 to $34,999 | 1,843 (10.6%) | 866 (3.1%) |
| $35,000 to $49,999 | 2,412 (13.9%) | 1,150 (4.2%) |
| $50,000 to $74,999 | 3,157 (18.2%) | 1,805 (6.6%) |
| $75,000 to $99,999 | 2,415 (13.9%) | 4,753 (17.2%) |
| $100,000 to $149,999 | 2,717 (15.6%) | 4,464 (16.2%) |
| $150,000 or more | 2,242 (12.9%) | 7,022 (25.5%) |
| Total | 17,377 (100.0%) | 27,554 (100.0%) |
Property Value to Household Income Ratio in Portage County
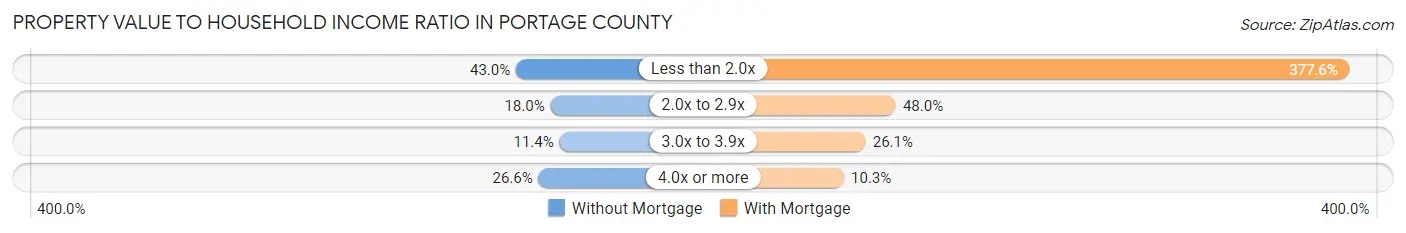
| Value-to-Income Ratio | Without Mortgage | With Mortgage |
| Less than 2.0x | 7,468 (43.0%) | 104,056 (377.6%) |
| 2.0x to 2.9x | 3,124 (18.0%) | 13,220 (48.0%) |
| 3.0x to 3.9x | 1,985 (11.4%) | 7,187 (26.1%) |
| 4.0x or more | 4,618 (26.6%) | 2,841 (10.3%) |
| Total | 17,377 (100.0%) | 27,554 (100.0%) |
Real Estate Taxes by Mortgage Status in Portage County
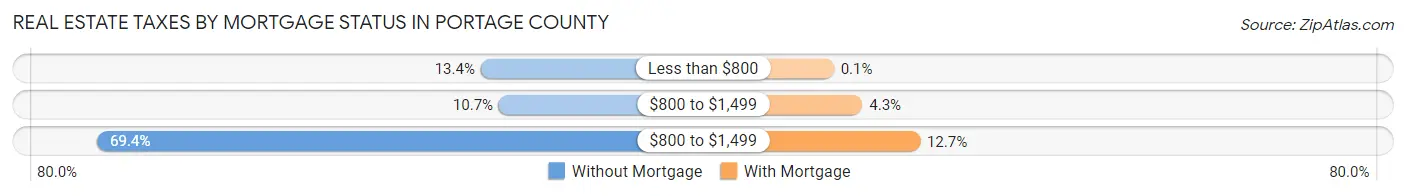
| Property Taxes | Without Mortgage | With Mortgage |
| Less than $800 | 2,319 (13.4%) | 27 (0.1%) |
| $800 to $1,499 | 1,857 (10.7%) | 1,180 (4.3%) |
| $800 to $1,499 | 12,063 (69.4%) | 3,499 (12.7%) |
| Total | 17,377 (100.0%) | 27,554 (100.0%) |
Health & Disability in Portage County
Health Insurance Coverage by Age in Portage County
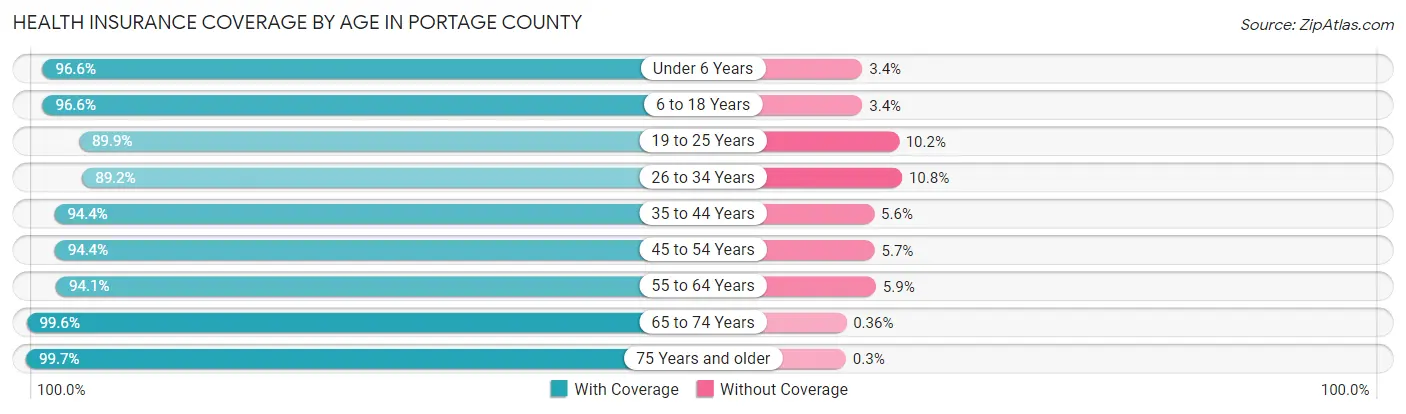
| Age Bracket | With Coverage | Without Coverage |
| Under 6 Years | 8,319 (96.6%) | 289 (3.4%) |
| 6 to 18 Years | 23,856 (96.6%) | 830 (3.4%) |
| 19 to 25 Years | 21,602 (89.8%) | 2,441 (10.2%) |
| 26 to 34 Years | 14,354 (89.2%) | 1,730 (10.8%) |
| 35 to 44 Years | 16,323 (94.4%) | 963 (5.6%) |
| 45 to 54 Years | 18,529 (94.4%) | 1,109 (5.7%) |
| 55 to 64 Years | 21,264 (94.1%) | 1,331 (5.9%) |
| 65 to 74 Years | 16,478 (99.6%) | 60 (0.4%) |
| 75 Years and older | 10,669 (99.7%) | 32 (0.3%) |
| Total | 151,394 (94.5%) | 8,785 (5.5%) |
Health Insurance Coverage by Citizenship Status in Portage County
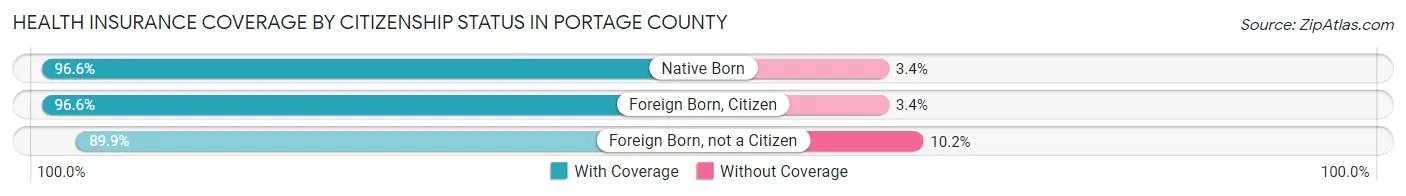
| Citizenship Status | With Coverage | Without Coverage |
| Native Born | 8,319 (96.6%) | 289 (3.4%) |
| Foreign Born, Citizen | 23,856 (96.6%) | 830 (3.4%) |
| Foreign Born, not a Citizen | 21,602 (89.8%) | 2,441 (10.2%) |
Health Insurance Coverage by Household Income in Portage County
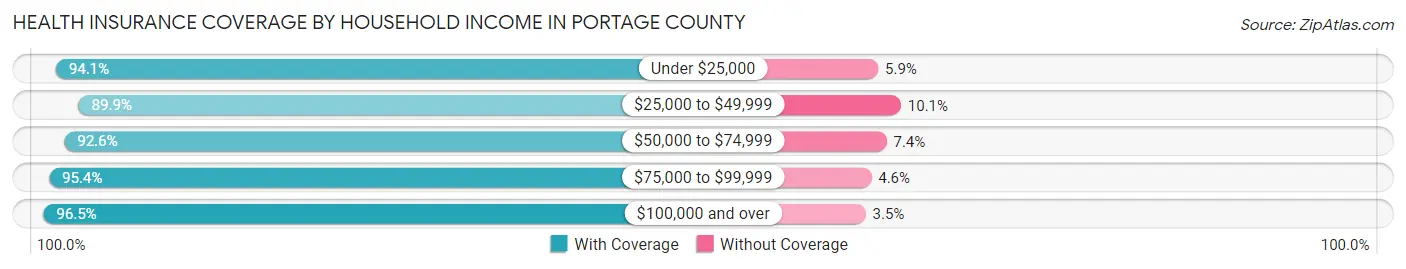
| Household Income | With Coverage | Without Coverage |
| Under $25,000 | 16,292 (94.1%) | 1,015 (5.9%) |
| $25,000 to $49,999 | 20,532 (89.9%) | 2,314 (10.1%) |
| $50,000 to $74,999 | 22,512 (92.6%) | 1,809 (7.4%) |
| $75,000 to $99,999 | 20,088 (95.4%) | 966 (4.6%) |
| $100,000 and over | 66,020 (96.5%) | 2,414 (3.5%) |
Public vs Private Health Insurance Coverage by Age in Portage County
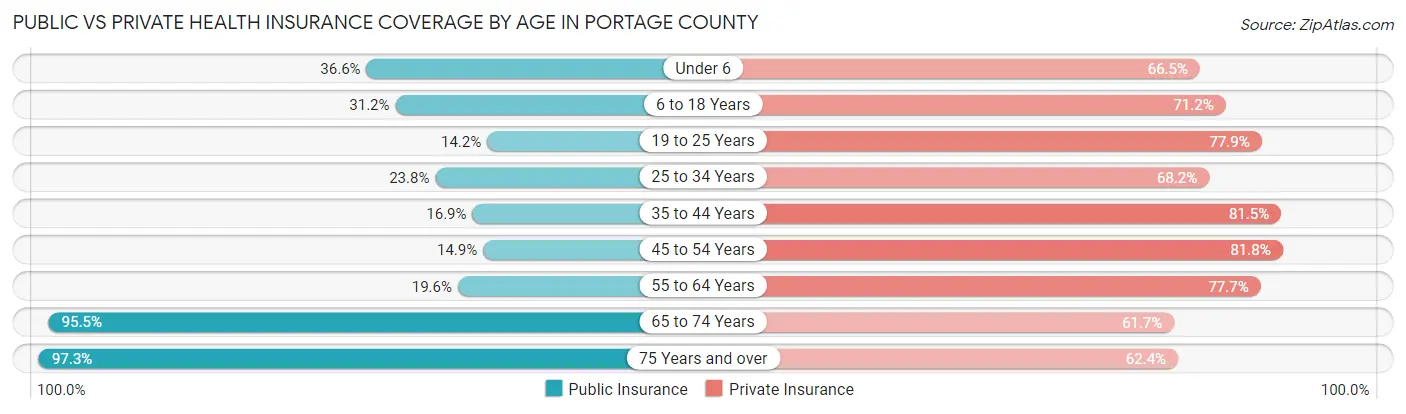
| Age Bracket | Public Insurance | Private Insurance |
| Under 6 | 3,147 (36.6%) | 5,720 (66.4%) |
| 6 to 18 Years | 7,698 (31.2%) | 17,578 (71.2%) |
| 19 to 25 Years | 3,406 (14.2%) | 18,730 (77.9%) |
| 25 to 34 Years | 3,824 (23.8%) | 10,963 (68.2%) |
| 35 to 44 Years | 2,920 (16.9%) | 14,091 (81.5%) |
| 45 to 54 Years | 2,928 (14.9%) | 16,062 (81.8%) |
| 55 to 64 Years | 4,427 (19.6%) | 17,559 (77.7%) |
| 65 to 74 Years | 15,800 (95.5%) | 10,202 (61.7%) |
| 75 Years and over | 10,416 (97.3%) | 6,675 (62.4%) |
| Total | 54,566 (34.1%) | 117,580 (73.4%) |
Disability Status by Sex by Age in Portage County
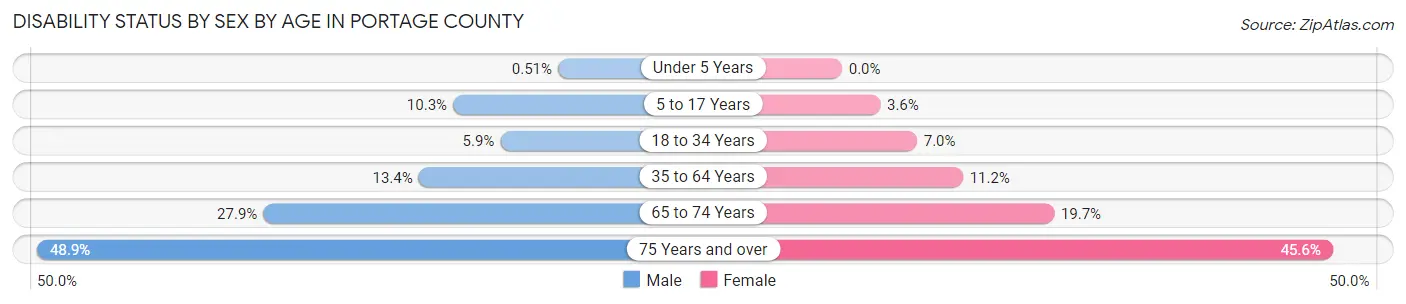
| Age Bracket | Male | Female |
| Under 5 Years | 19 (0.5%) | 0 (0.0%) |
| 5 to 17 Years | 1,185 (10.2%) | 387 (3.5%) |
| 18 to 34 Years | 1,254 (5.9%) | 1,566 (7.0%) |
| 35 to 64 Years | 4,009 (13.4%) | 3,331 (11.2%) |
| 65 to 74 Years | 2,221 (27.9%) | 1,687 (19.7%) |
| 75 Years and over | 2,279 (48.8%) | 2,750 (45.6%) |
Disability Class by Sex by Age in Portage County
Disability Class: Hearing Difficulty
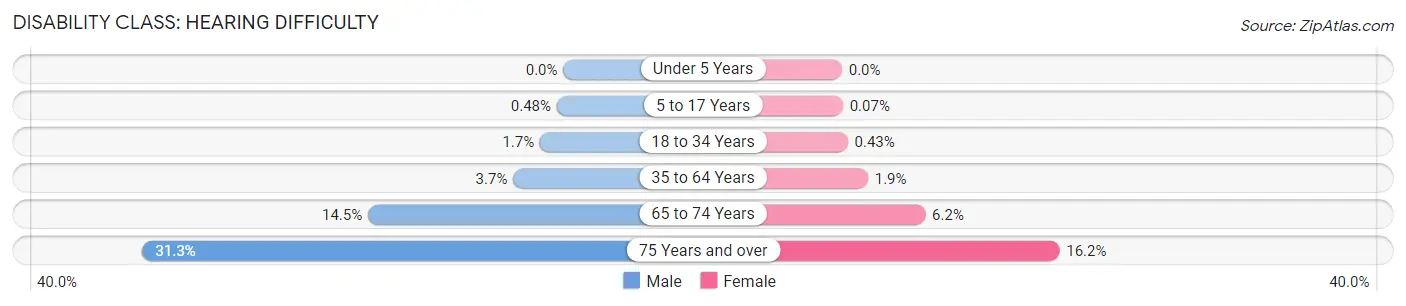
| Age Bracket | Male | Female |
| Under 5 Years | 0 (0.0%) | 0 (0.0%) |
| 5 to 17 Years | 56 (0.5%) | 8 (0.1%) |
| 18 to 34 Years | 370 (1.7%) | 97 (0.4%) |
| 35 to 64 Years | 1,110 (3.7%) | 572 (1.9%) |
| 65 to 74 Years | 1,156 (14.5%) | 530 (6.2%) |
| 75 Years and over | 1,458 (31.2%) | 975 (16.2%) |
Disability Class: Vision Difficulty
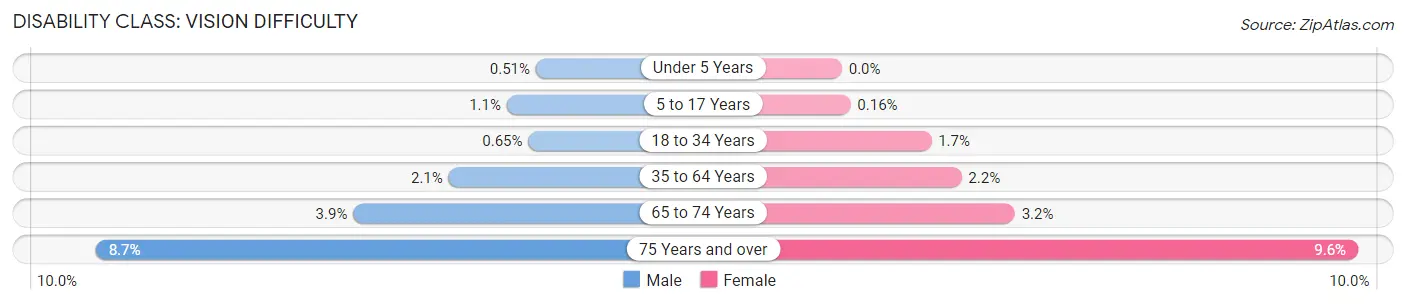
| Age Bracket | Male | Female |
| Under 5 Years | 19 (0.5%) | 0 (0.0%) |
| 5 to 17 Years | 121 (1.1%) | 17 (0.2%) |
| 18 to 34 Years | 140 (0.6%) | 373 (1.7%) |
| 35 to 64 Years | 635 (2.1%) | 659 (2.2%) |
| 65 to 74 Years | 311 (3.9%) | 275 (3.2%) |
| 75 Years and over | 405 (8.7%) | 578 (9.6%) |
Disability Class: Cognitive Difficulty
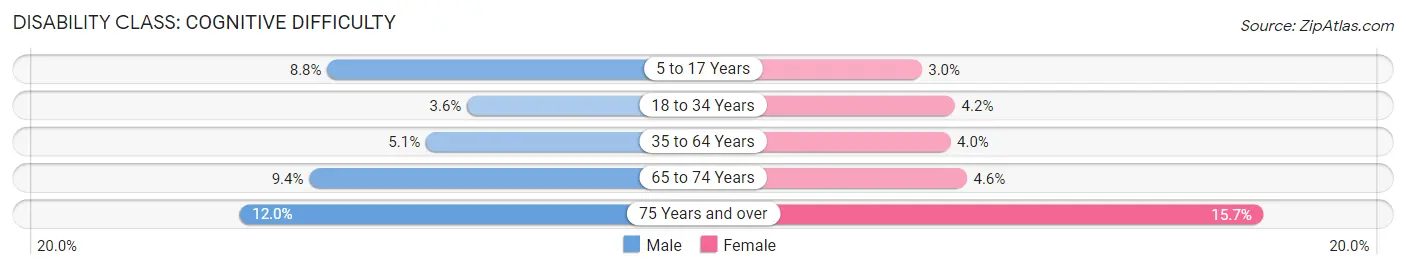
| Age Bracket | Male | Female |
| 5 to 17 Years | 1,013 (8.8%) | 322 (2.9%) |
| 18 to 34 Years | 764 (3.6%) | 941 (4.2%) |
| 35 to 64 Years | 1,522 (5.1%) | 1,195 (4.0%) |
| 65 to 74 Years | 752 (9.4%) | 397 (4.6%) |
| 75 Years and over | 561 (12.0%) | 945 (15.7%) |
Disability Class: Ambulatory Difficulty
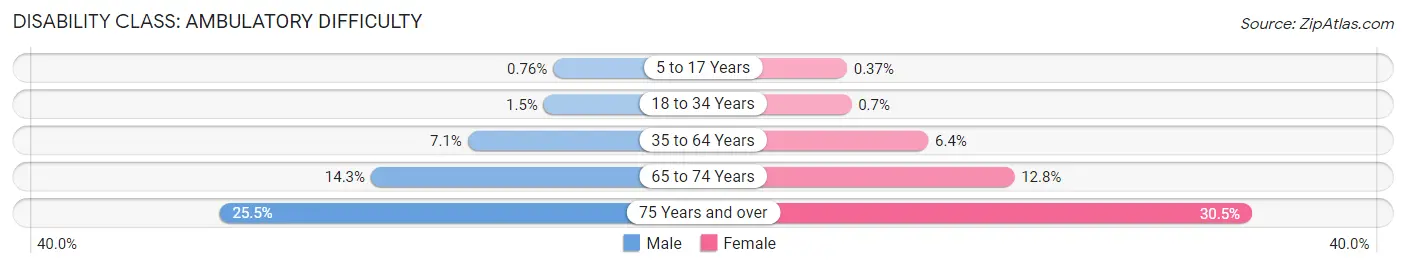
| Age Bracket | Male | Female |
| 5 to 17 Years | 88 (0.8%) | 40 (0.4%) |
| 18 to 34 Years | 312 (1.5%) | 157 (0.7%) |
| 35 to 64 Years | 2,119 (7.1%) | 1,903 (6.4%) |
| 65 to 74 Years | 1,139 (14.3%) | 1,097 (12.8%) |
| 75 Years and over | 1,191 (25.5%) | 1,838 (30.4%) |
Disability Class: Self-Care Difficulty
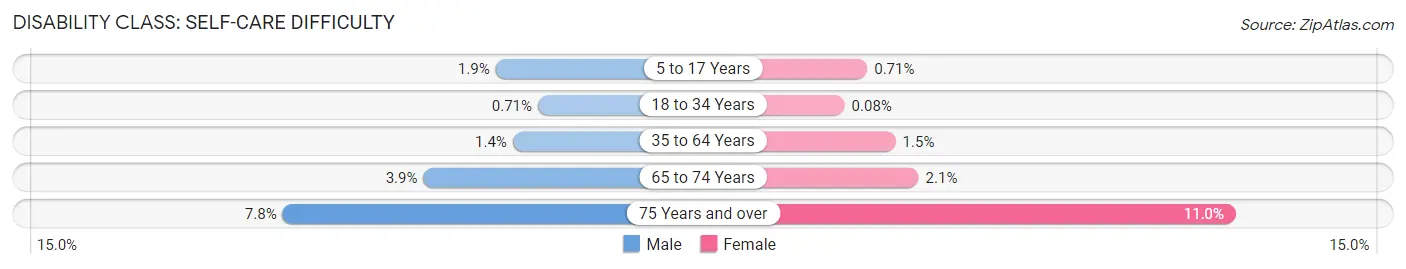
| Age Bracket | Male | Female |
| 5 to 17 Years | 218 (1.9%) | 77 (0.7%) |
| 18 to 34 Years | 151 (0.7%) | 18 (0.1%) |
| 35 to 64 Years | 420 (1.4%) | 445 (1.5%) |
| 65 to 74 Years | 311 (3.9%) | 183 (2.1%) |
| 75 Years and over | 365 (7.8%) | 662 (11.0%) |
Technology Access in Portage County
Computing Device Access in Portage County
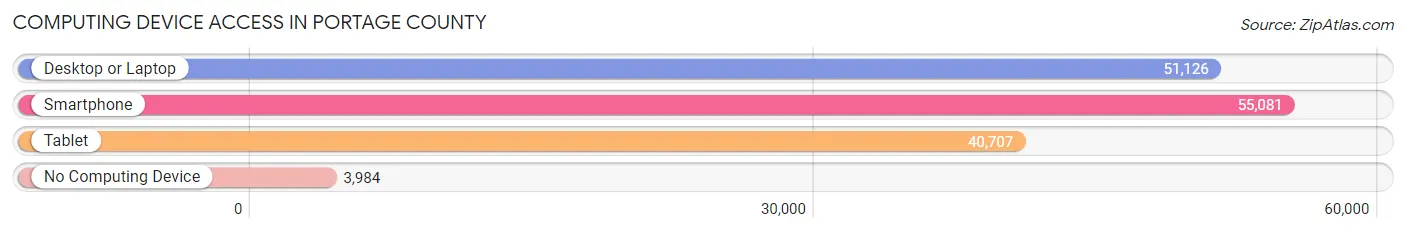
| Device Type | # Households | % Households |
| Desktop or Laptop | 51,126 | 80.4% |
| Smartphone | 55,081 | 86.6% |
| Tablet | 40,707 | 64.0% |
| No Computing Device | 3,984 | 6.3% |
| Total | 63,588 | 100.0% |
Internet Access in Portage County
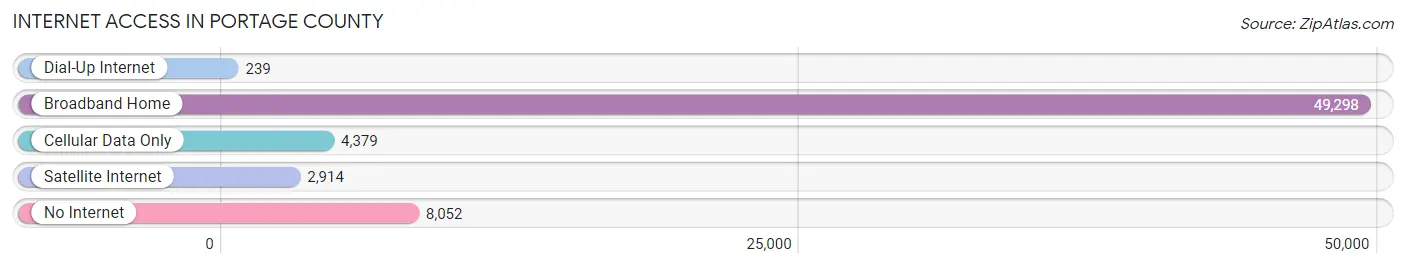
| Internet Type | # Households | % Households |
| Dial-Up Internet | 239 | 0.4% |
| Broadband Home | 49,298 | 77.5% |
| Cellular Data Only | 4,379 | 6.9% |
| Satellite Internet | 2,914 | 4.6% |
| No Internet | 8,052 | 12.7% |
| Total | 63,588 | 100.0% |
Portage County Summary
Portage County is located in the northeastern part of Ohio and is part of the Akron Metropolitan Statistical Area. It is bordered by Summit, Stark, and Cuyahoga counties to the north, Trumbull County to the east, Mahoning County to the south, and Medina and Lorain counties to the west. The county seat is Ravenna, and the largest city is Kent.
History
Portage County was established in 1808 and is named after the portage between the Cuyahoga and Tuscarawas rivers. The area was originally inhabited by the Mound Builders, and later by the Iroquois and Wyandot tribes. The first European settlers arrived in the late 1700s, and the county was organized in 1808.
The county was an important part of the Underground Railroad, with many stops in the area. During the Civil War, Portage County was a major supplier of troops and supplies for the Union Army.
Geography
Portage County covers an area of 545 square miles and is located in the northeastern part of Ohio. It is bordered by Summit, Stark, and Cuyahoga counties to the north, Trumbull County to the east, Mahoning County to the south, and Medina and Lorain counties to the west. The county is mostly flat, with some rolling hills in the northern and western parts. The highest point in the county is 1,092 feet above sea level.
The county is home to several rivers and streams, including the Cuyahoga, Tuscarawas, and Mahoning rivers. The county also contains several lakes, including Lake Rockwell, Lake Milton, and Lake Brady.
Economy
Portage County has a diverse economy, with a mix of manufacturing, agriculture, and services. The county is home to several large employers, including the Kent State University, the University of Akron, and the Cleveland Clinic.
The county is also home to several manufacturing companies, including the Kent Displays, the Kent Manufacturing Company, and the Kent Plastics Company. Agriculture is also an important part of the county’s economy, with corn, soybeans, and hay being the main crops.
Demographics
As of the 2010 census, Portage County had a population of 161,419. The population is mostly white (90.2%), with small percentages of African Americans (4.2%), Asians (2.2%), and Hispanics (2.2%). The median household income is $50,919, and the median age is 40.
Portage County is home to several colleges and universities, including Kent State University, the University of Akron, and Hiram College. The county is also home to several museums, including the Kent State University Museum, the Portage County Historical Society, and the Kent State University Art Gallery.
Conclusion
Portage County is a diverse and vibrant county located in the northeastern part of Ohio. It has a rich history, a diverse economy, and a population that is mostly white. The county is home to several colleges and universities, as well as several museums and historical sites. Portage County is an important part of the Akron Metropolitan Statistical Area and is an important part of Ohio’s economy.
Common Questions
What is the Total Population of Portage County?
Total Population of Portage County is 161,217.
What is the Total Male Population of Portage County?
Total Male Population of Portage County is 79,722.
What is the Total Female Population of Portage County?
Total Female Population of Portage County is 81,495.
What is the Ratio of Males per 100 Females in Portage County?
There are 97.82 Males per 100 Females in Portage County.
What is the Ratio of Females per 100 Males in Portage County?
There are 102.22 Females per 100 Males in Portage County.
What is the Median Population Age in Portage County?
Median Population Age in Portage County is 39.1 Years.
What is the Average Family Size in Portage County
Average Family Size in Portage County is 3.0 People.
What is the Average Household Size in Portage County
Average Household Size in Portage County is 2.4 People.
What is Per Capita Income in Portage County?
Per Capita income in Portage County is $37,771.
What is the Median Family Income in Portage County?
Median Family Income in Portage County is $93,013.
What is the Median Household income in Portage County?
Median Household Income in Portage County is $69,796.
What is Income or Wage Gap in Portage County?
Income or Wage Gap in Portage County is 34.5%.
Women in Portage County earn 65.5 cents for every dollar earned by a man.
What is Family Income Deficit in Portage County?
Family Income Deficit in Portage County is $9,759.
Families that are below poverty line in Portage County earn $9,759 less on average than the poverty threshold level.
What is Inequality or Gini Index in Portage County?
Inequality or Gini Index in Portage County is 0.45.
How Large is the Labor Force in Portage County?
There are 88,431 People in the Labor Forcein in Portage County.
What is the Percentage of People in the Labor Force in Portage County?
65.2% of People are in the Labor Force in Portage County.
What is the Unemployment Rate in Portage County?
Unemployment Rate in Portage County is 5.6%.