Ottawa County, OH
Ottawa County Map

Ottawa County Overview
40,367
TOTAL POPULATION
20,275
MALE POPULATION
20,092
FEMALE POPULATION
100.91
MALES / 100 FEMALES
99.10
FEMALES / 100 MALES
49.8
MEDIAN AGE
2.7
AVG FAMILY SIZE
2.2
AVG HOUSEHOLD SIZE
$44,479
PER CAPITA INCOME
$92,054
AVG FAMILY INCOME
$69,515
AVG HOUSEHOLD INCOME
42.1%
WAGE / INCOME GAP [ % ]
57.9¢/ $1
WAGE / INCOME GAP [ $ ]
$8,916
FAMILY INCOME DEFICIT
0.47
INEQUALITY / GINI INDEX
19,724
LABOR FORCE [ PEOPLE ]
57.7%
PERCENT IN LABOR FORCE
3.4%
UNEMPLOYMENT RATE
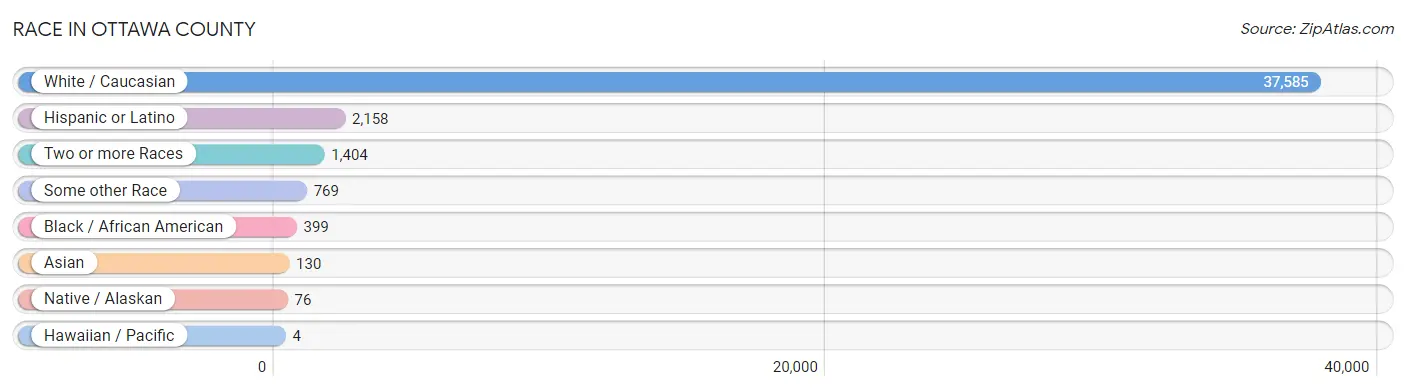
Race in Ottawa County
The most populous races in Ottawa County are White / Caucasian (37,585 | 93.1%), Hispanic or Latino (2,158 | 5.3%), and Two or more Races (1,404 | 3.5%).
| Race | # Population | % Population |
| Asian | 130 | 0.3% |
| Black / African American | 399 | 1.0% |
| Hawaiian / Pacific | 4 | 0.0% |
| Hispanic or Latino | 2,158 | 5.3% |
| Native / Alaskan | 76 | 0.2% |
| White / Caucasian | 37,585 | 93.1% |
| Two or more Races | 1,404 | 3.5% |
| Some other Race | 769 | 1.9% |
| Total | 40,367 | 100.0% |
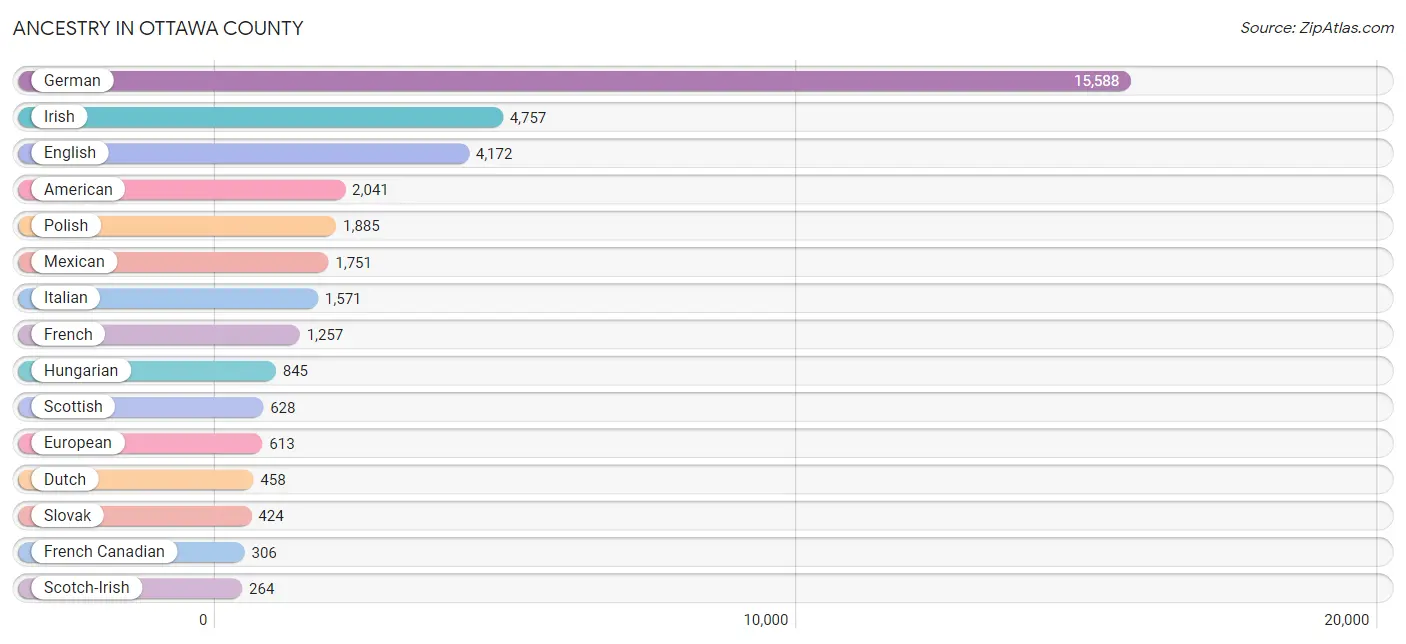
Ancestry in Ottawa County
The most populous ancestries reported in Ottawa County are German (15,588 | 38.6%), Irish (4,757 | 11.8%), English (4,172 | 10.3%), American (2,041 | 5.1%), and Polish (1,885 | 4.7%), together accounting for 70.5% of all Ottawa County residents.
| Ancestry | # Population | % Population |
| African | 8 | 0.0% |
| American | 2,041 | 5.1% |
| Arab | 216 | 0.5% |
| Armenian | 37 | 0.1% |
| Austrian | 80 | 0.2% |
| Belgian | 77 | 0.2% |
| Bhutanese | 23 | 0.1% |
| Blackfeet | 27 | 0.1% |
| Brazilian | 39 | 0.1% |
| British | 117 | 0.3% |
| Bulgarian | 7 | 0.0% |
| Burmese | 17 | 0.0% |
| Canadian | 29 | 0.1% |
| Central American | 32 | 0.1% |
| Central American Indian | 49 | 0.1% |
| Cherokee | 174 | 0.4% |
| Croatian | 44 | 0.1% |
| Cuban | 16 | 0.0% |
| Czech | 191 | 0.5% |
| Czechoslovakian | 147 | 0.4% |
| Danish | 127 | 0.3% |
| Dominican | 77 | 0.2% |
| Dutch | 458 | 1.1% |
| Eastern European | 54 | 0.1% |
| English | 4,172 | 10.3% |
| European | 613 | 1.5% |
| Finnish | 55 | 0.1% |
| French | 1,257 | 3.1% |
| French Canadian | 306 | 0.8% |
| German | 15,588 | 38.6% |
| Greek | 22 | 0.1% |
| Guatemalan | 10 | 0.0% |
| Honduran | 22 | 0.1% |
| Hungarian | 845 | 2.1% |
| Icelander | 7 | 0.0% |
| Indian (Asian) | 63 | 0.2% |
| Iranian | 22 | 0.1% |
| Irish | 4,757 | 11.8% |
| Italian | 1,571 | 3.9% |
| Korean | 26 | 0.1% |
| Latvian | 2 | 0.0% |
| Lebanese | 37 | 0.1% |
| Lithuanian | 42 | 0.1% |
| Luxembourger | 7 | 0.0% |
| Maltese | 5 | 0.0% |
| Mexican | 1,751 | 4.3% |
| Mexican American Indian | 26 | 0.1% |
| Native Hawaiian | 4 | 0.0% |
| Northern European | 11 | 0.0% |
| Norwegian | 251 | 0.6% |
| Pakistani | 11 | 0.0% |
| Pennsylvania German | 26 | 0.1% |
| Peruvian | 53 | 0.1% |
| Polish | 1,885 | 4.7% |
| Portuguese | 4 | 0.0% |
| Puerto Rican | 188 | 0.5% |
| Romanian | 88 | 0.2% |
| Russian | 52 | 0.1% |
| Scandinavian | 89 | 0.2% |
| Scotch-Irish | 264 | 0.6% |
| Scottish | 628 | 1.6% |
| Serbian | 14 | 0.0% |
| Slavic | 12 | 0.0% |
| Slovak | 424 | 1.1% |
| Slovene | 35 | 0.1% |
| South American | 57 | 0.1% |
| Spaniard | 28 | 0.1% |
| Spanish | 9 | 0.0% |
| Subsaharan African | 8 | 0.0% |
| Swedish | 188 | 0.5% |
| Swiss | 169 | 0.4% |
| Thai | 48 | 0.1% |
| Ukrainian | 140 | 0.4% |
| Venezuelan | 4 | 0.0% |
| Welsh | 213 | 0.5% |
| West Indian | 13 | 0.0% |
| Yugoslavian | 2 | 0.0% | View All 77 Rows |
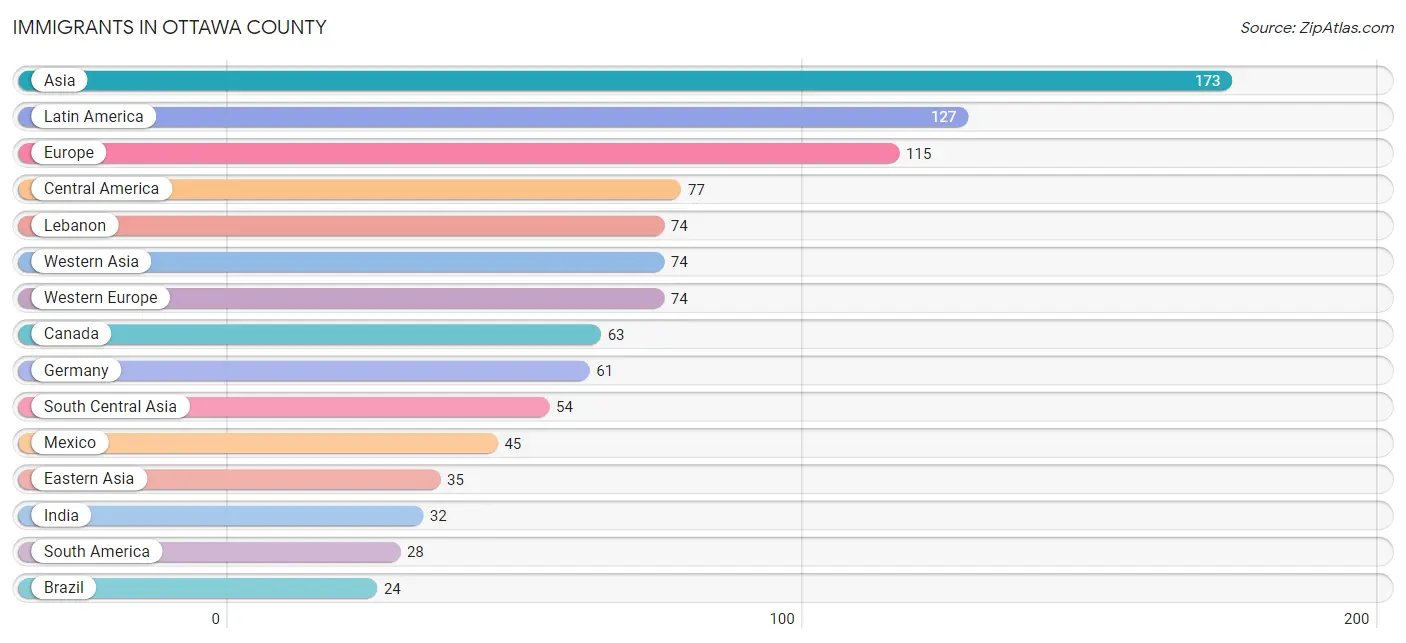
Immigrants in Ottawa County
The most numerous immigrant groups reported in Ottawa County came from Asia (173 | 0.4%), Latin America (127 | 0.3%), Europe (115 | 0.3%), Central America (77 | 0.2%), and Lebanon (74 | 0.2%), together accounting for 1.4% of all Ottawa County residents.
| Immigration Origin | # Population | % Population |
| Africa | 7 | 0.0% |
| Asia | 173 | 0.4% |
| Austria | 13 | 0.0% |
| Brazil | 24 | 0.1% |
| Canada | 63 | 0.2% |
| Caribbean | 22 | 0.1% |
| Central America | 77 | 0.2% |
| China | 18 | 0.0% |
| Congo | 5 | 0.0% |
| Dominican Republic | 22 | 0.1% |
| Eastern Asia | 35 | 0.1% |
| Eastern Europe | 20 | 0.1% |
| England | 3 | 0.0% |
| Europe | 115 | 0.3% |
| Germany | 61 | 0.2% |
| Guatemala | 10 | 0.0% |
| Honduras | 22 | 0.1% |
| Hungary | 5 | 0.0% |
| India | 32 | 0.1% |
| Iran | 22 | 0.1% |
| Korea | 17 | 0.0% |
| Latin America | 127 | 0.3% |
| Lebanon | 74 | 0.2% |
| Mexico | 45 | 0.1% |
| Middle Africa | 5 | 0.0% |
| Northern Europe | 11 | 0.0% |
| Philippines | 5 | 0.0% |
| Poland | 15 | 0.0% |
| South America | 28 | 0.1% |
| South Central Asia | 54 | 0.1% |
| South Eastern Asia | 10 | 0.0% |
| Southern Europe | 10 | 0.0% |
| Taiwan | 6 | 0.0% |
| Venezuela | 4 | 0.0% |
| Vietnam | 5 | 0.0% |
| Western Asia | 74 | 0.2% |
| Western Europe | 74 | 0.2% | View All 37 Rows |
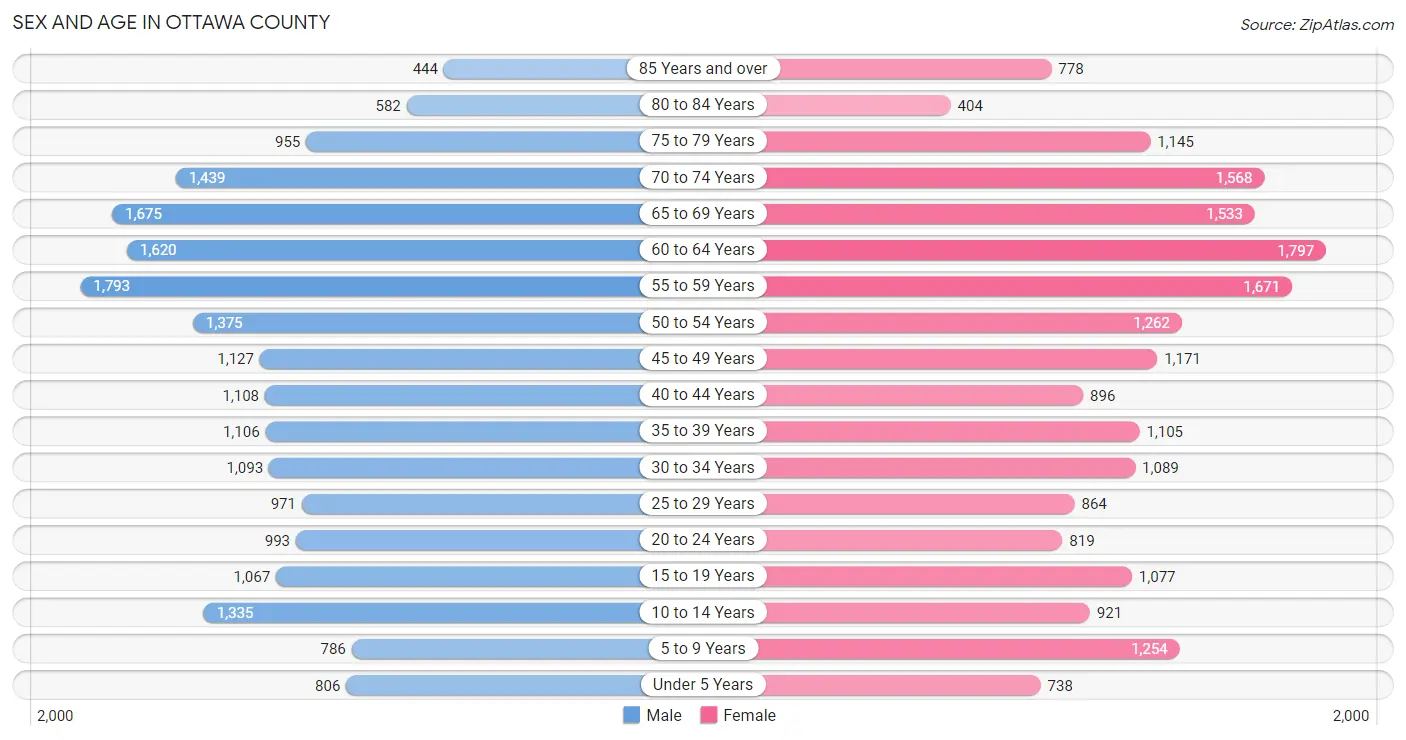
Sex and Age in Ottawa County
Sex and Age in Ottawa County
The most populous age groups in Ottawa County are 55 to 59 Years (1,793 | 8.8%) for men and 60 to 64 Years (1,797 | 8.9%) for women.
| Age Bracket | Male | Female |
| Under 5 Years | 806 (4.0%) | 738 (3.7%) |
| 5 to 9 Years | 786 (3.9%) | 1,254 (6.2%) |
| 10 to 14 Years | 1,335 (6.6%) | 921 (4.6%) |
| 15 to 19 Years | 1,067 (5.3%) | 1,077 (5.4%) |
| 20 to 24 Years | 993 (4.9%) | 819 (4.1%) |
| 25 to 29 Years | 971 (4.8%) | 864 (4.3%) |
| 30 to 34 Years | 1,093 (5.4%) | 1,089 (5.4%) |
| 35 to 39 Years | 1,106 (5.4%) | 1,105 (5.5%) |
| 40 to 44 Years | 1,108 (5.5%) | 896 (4.5%) |
| 45 to 49 Years | 1,127 (5.6%) | 1,171 (5.8%) |
| 50 to 54 Years | 1,375 (6.8%) | 1,262 (6.3%) |
| 55 to 59 Years | 1,793 (8.8%) | 1,671 (8.3%) |
| 60 to 64 Years | 1,620 (8.0%) | 1,797 (8.9%) |
| 65 to 69 Years | 1,675 (8.3%) | 1,533 (7.6%) |
| 70 to 74 Years | 1,439 (7.1%) | 1,568 (7.8%) |
| 75 to 79 Years | 955 (4.7%) | 1,145 (5.7%) |
| 80 to 84 Years | 582 (2.9%) | 404 (2.0%) |
| 85 Years and over | 444 (2.2%) | 778 (3.9%) |
| Total | 20,275 (100.0%) | 20,092 (100.0%) |
Families and Households in Ottawa County
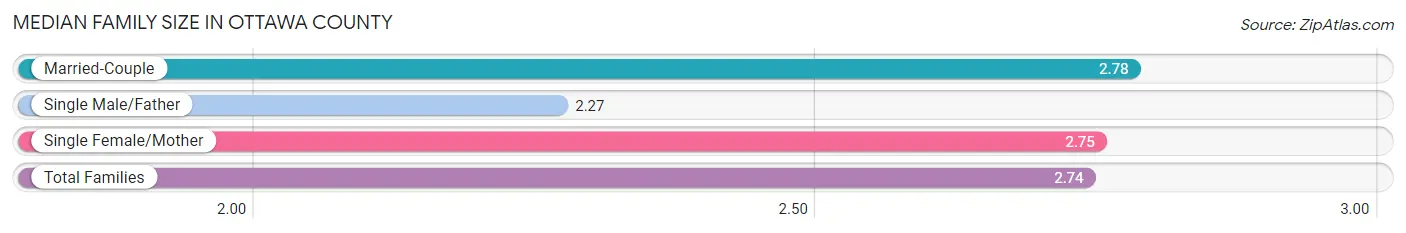
Median Family Size in Ottawa County
The median family size in Ottawa County is 2.74 persons per family, with married-couple families (9,011 | 79.0%) accounting for the largest median family size of 2.78 persons per family. On the other hand, single male/father families (822 | 7.2%) represent the smallest median family size with 2.27 persons per family.
| Family Type | # Families | Family Size |
| Married-Couple | 9,011 (79.0%) | 2.78 |
| Single Male/Father | 822 (7.2%) | 2.27 |
| Single Female/Mother | 1,571 (13.8%) | 2.75 |
| Total Families | 11,404 (100.0%) | 2.74 |
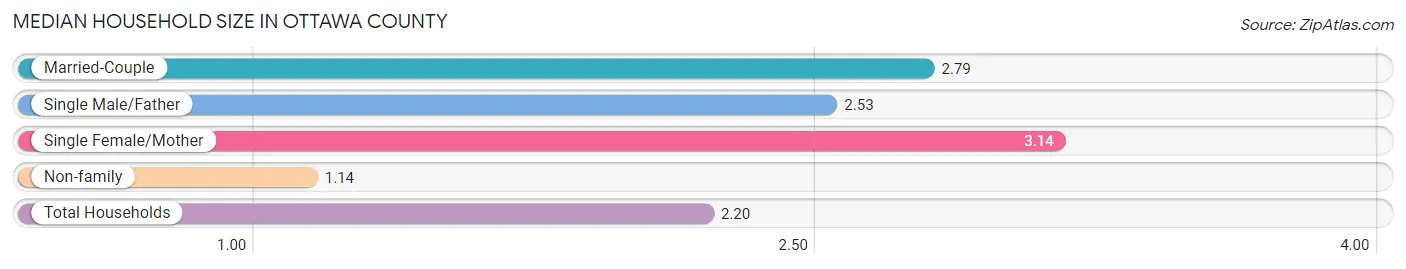
Median Household Size in Ottawa County
The median household size in Ottawa County is 2.20 persons per household, with single female/mother households (1,571 | 8.7%) accounting for the largest median household size of 3.14 persons per household. non-family households (6,591 | 36.6%) represent the smallest median household size with 1.14 persons per household.
| Household Type | # Households | Household Size |
| Married-Couple | 9,011 (50.1%) | 2.79 |
| Single Male/Father | 822 (4.6%) | 2.53 |
| Single Female/Mother | 1,571 (8.7%) | 3.14 |
| Non-family | 6,591 (36.6%) | 1.14 |
| Total Households | 17,995 (100.0%) | 2.20 |
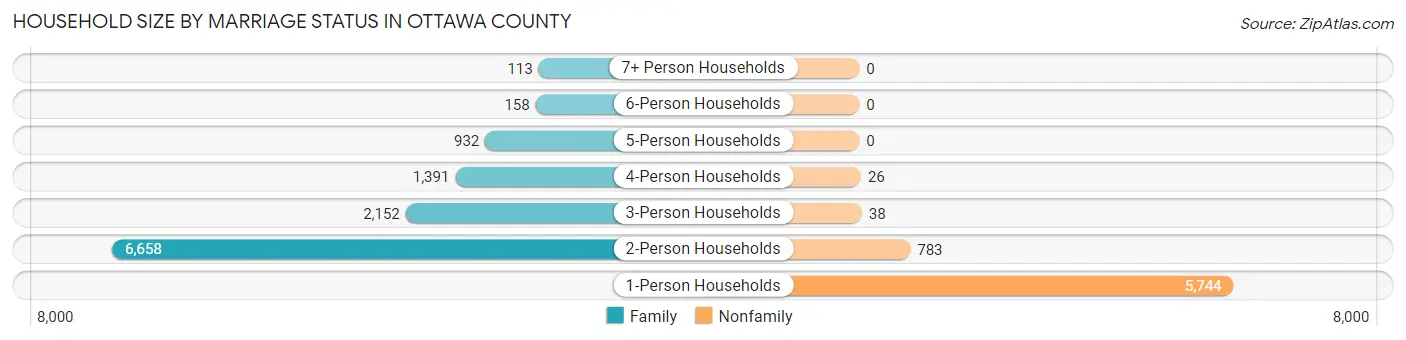
Household Size by Marriage Status in Ottawa County
Out of a total of 17,995 households in Ottawa County, 11,404 (63.4%) are family households, while 6,591 (36.6%) are nonfamily households. The most numerous type of family households are 2-person households, comprising 6,658, and the most common type of nonfamily households are 1-person households, comprising 5,744.
| Household Size | Family Households | Nonfamily Households |
| 1-Person Households | - | 5,744 (31.9%) |
| 2-Person Households | 6,658 (37.0%) | 783 (4.3%) |
| 3-Person Households | 2,152 (12.0%) | 38 (0.2%) |
| 4-Person Households | 1,391 (7.7%) | 26 (0.1%) |
| 5-Person Households | 932 (5.2%) | 0 (0.0%) |
| 6-Person Households | 158 (0.9%) | 0 (0.0%) |
| 7+ Person Households | 113 (0.6%) | 0 (0.0%) |
| Total | 11,404 (63.4%) | 6,591 (36.6%) |
Female Fertility in Ottawa County
Fertility by Age in Ottawa County
Average fertility rate in Ottawa County is 61.0 births per 1,000 women. Women in the age bracket of 20 to 34 years have the highest fertility rate with 133.0 births per 1,000 women. Women in the age bracket of 20 to 34 years acount for 84.5% of all women with births.

| Age Bracket | Women with Births | Births / 1,000 Women |
| 15 to 19 years | 0 (0.0%) | 0.0 |
| 20 to 34 years | 370 (84.5%) | 133.0 |
| 35 to 50 years | 68 (15.5%) | 20.0 |
| Total | 438 (100.0%) | 61.0 |
Fertility by Age by Marriage Status in Ottawa County
66.4% of women with births (438) in Ottawa County are married. The highest percentage of unmarried women with births falls into 20 to 34 years age bracket with 39.7% of them unmarried at the time of birth, while the lowest percentage of unmarried women with births belong to 35 to 50 years age bracket with 0.0% of them unmarried.

| Age Bracket | Married | Unmarried |
| 15 to 19 years | 0 (0.0%) | 0 (0.0%) |
| 20 to 34 years | 223 (60.3%) | 147 (39.7%) |
| 35 to 50 years | 68 (100.0%) | 0 (0.0%) |
| Total | 291 (66.4%) | 147 (33.6%) |
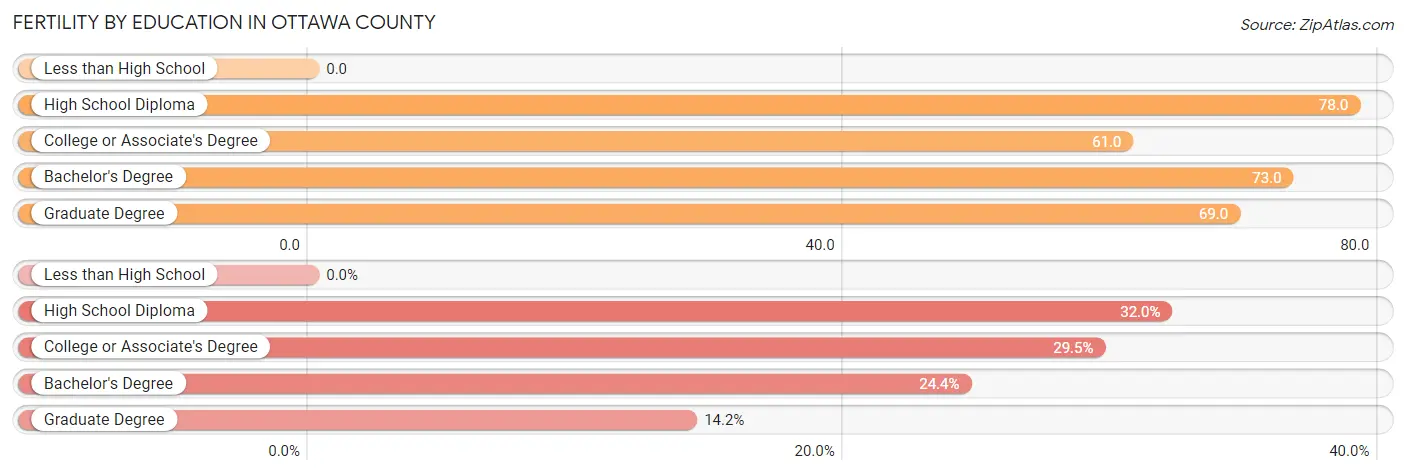
Fertility by Education in Ottawa County
| Educational Attainment | Women with Births | Births / 1,000 Women |
| Less than High School | 0 (0.0%) | 0.0 |
| High School Diploma | 140 (32.0%) | 78.0 |
| College or Associate's Degree | 129 (29.4%) | 61.0 |
| Bachelor's Degree | 107 (24.4%) | 73.0 |
| Graduate Degree | 62 (14.2%) | 69.0 |
| Total | 438 (100.0%) | 61.0 |
Fertility by Education by Marriage Status in Ottawa County
33.6% of women with births in Ottawa County are unmarried. Women with the educational attainment of bachelor's degree are most likely to be married with 100.0% of them married at childbirth, while women with the educational attainment of high school diploma are least likely to be married with 94.3% of them unmarried at childbirth.
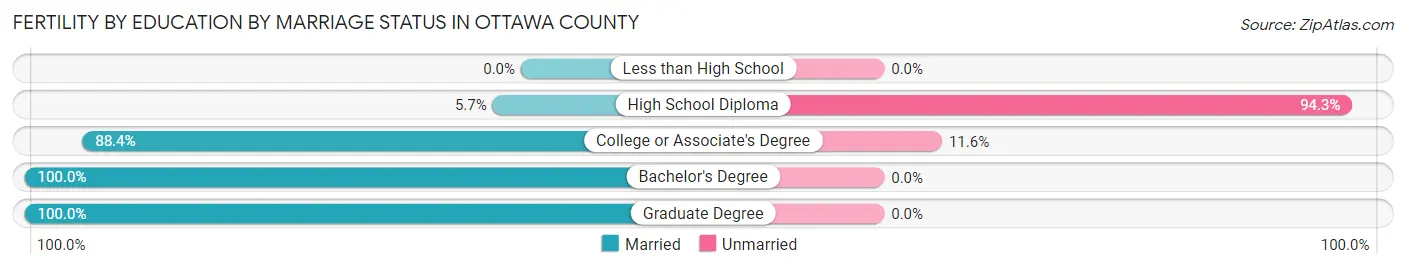
| Educational Attainment | Married | Unmarried |
| Less than High School | 0 (0.0%) | 0 (0.0%) |
| High School Diploma | 8 (5.7%) | 132 (94.3%) |
| College or Associate's Degree | 114 (88.4%) | 15 (11.6%) |
| Bachelor's Degree | 107 (100.0%) | 0 (0.0%) |
| Graduate Degree | 62 (100.0%) | 0 (0.0%) |
| Total | 291 (66.4%) | 147 (33.6%) |
Income in Ottawa County
Income Overview in Ottawa County
Per Capita Income in Ottawa County is $44,479, while median incomes of families and households are $92,054 and $69,515 respectively.
| Characteristic | Number | Measure |
| Per Capita Income | 40,367 | $44,479 |
| Median Family Income | 11,404 | $92,054 |
| Mean Family Income | 11,404 | $117,387 |
| Median Household Income | 17,995 | $69,515 |
| Mean Household Income | 17,995 | $97,910 |
| Income Deficit | 11,404 | $8,916 |
| Wage / Income Gap (%) | 40,367 | 42.06% |
| Wage / Income Gap ($) | 40,367 | 57.94¢ per $1 |
| Gini / Inequality Index | 40,367 | 0.47 |
Earnings by Sex in Ottawa County
Average Earnings in Ottawa County are $41,966, $51,169 for men and $29,649 for women, a difference of 42.1%.

| Sex | Number | Average Earnings |
| Male | 11,124 (52.9%) | $51,169 |
| Female | 9,906 (47.1%) | $29,649 |
| Total | 21,030 (100.0%) | $41,966 |
Earnings by Sex by Income Bracket in Ottawa County
The most common earnings brackets in Ottawa County are $100,000+ for men (1,892 | 17.0%) and $75,000 to $99,999 for women (852 | 8.6%).
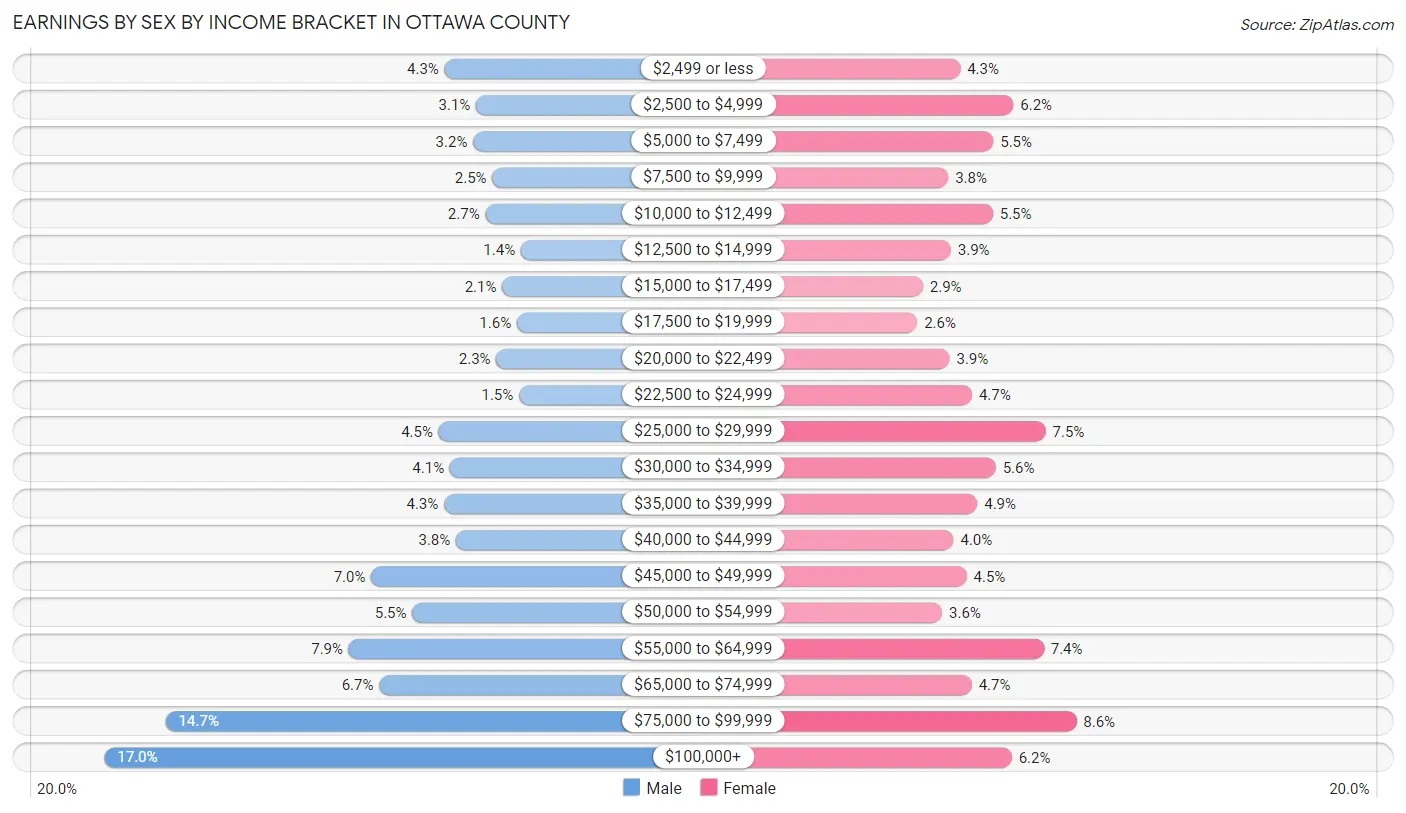
| Income | Male | Female |
| $2,499 or less | 474 (4.3%) | 421 (4.3%) |
| $2,500 to $4,999 | 343 (3.1%) | 618 (6.2%) |
| $5,000 to $7,499 | 355 (3.2%) | 544 (5.5%) |
| $7,500 to $9,999 | 275 (2.5%) | 376 (3.8%) |
| $10,000 to $12,499 | 304 (2.7%) | 542 (5.5%) |
| $12,500 to $14,999 | 156 (1.4%) | 386 (3.9%) |
| $15,000 to $17,499 | 234 (2.1%) | 282 (2.9%) |
| $17,500 to $19,999 | 172 (1.5%) | 262 (2.6%) |
| $20,000 to $22,499 | 258 (2.3%) | 381 (3.8%) |
| $22,500 to $24,999 | 164 (1.5%) | 465 (4.7%) |
| $25,000 to $29,999 | 498 (4.5%) | 738 (7.4%) |
| $30,000 to $34,999 | 452 (4.1%) | 553 (5.6%) |
| $35,000 to $39,999 | 476 (4.3%) | 484 (4.9%) |
| $40,000 to $44,999 | 426 (3.8%) | 396 (4.0%) |
| $45,000 to $49,999 | 780 (7.0%) | 445 (4.5%) |
| $50,000 to $54,999 | 608 (5.5%) | 354 (3.6%) |
| $55,000 to $64,999 | 873 (7.9%) | 731 (7.4%) |
| $65,000 to $74,999 | 746 (6.7%) | 464 (4.7%) |
| $75,000 to $99,999 | 1,638 (14.7%) | 852 (8.6%) |
| $100,000+ | 1,892 (17.0%) | 612 (6.2%) |
| Total | 11,124 (100.0%) | 9,906 (100.0%) |
Earnings by Sex by Educational Attainment in Ottawa County
Average earnings in Ottawa County are $57,172 for men and $35,122 for women, a difference of 38.6%. Men with an educational attainment of graduate degree enjoy the highest average annual earnings of $89,358, while those with high school diploma education earn the least with $48,333. Women with an educational attainment of graduate degree earn the most with the average annual earnings of $76,607, while those with less than high school education have the smallest earnings of $17,639.
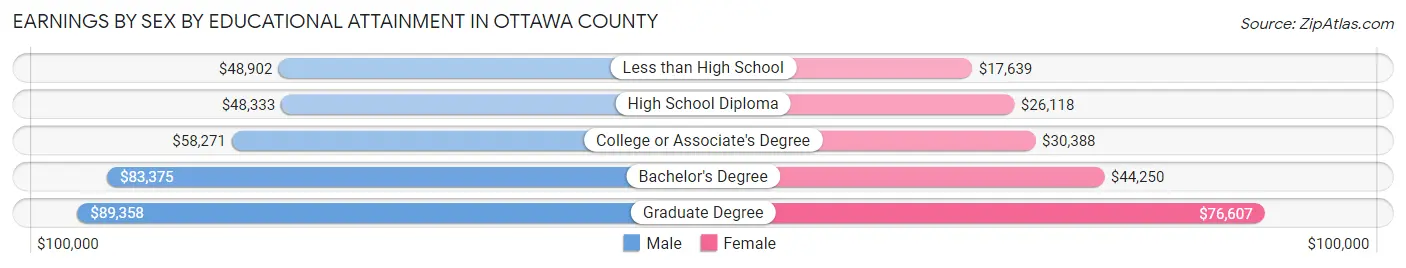
| Educational Attainment | Male Income | Female Income |
| Less than High School | $48,902 | $17,639 |
| High School Diploma | $48,333 | $26,118 |
| College or Associate's Degree | $58,271 | $30,388 |
| Bachelor's Degree | $83,375 | $44,250 |
| Graduate Degree | $89,358 | $76,607 |
| Total | $57,172 | $35,122 |
Family Income in Ottawa County
Family Income Brackets in Ottawa County
According to the Ottawa County family income data, there are 2,771 families falling into the $100,000 to $149,999 income range, which is the most common income bracket and makes up 24.3% of all families. Conversely, the $10,000 to $14,999 income bracket is the least frequent group with only 217 families (1.9%) belonging to this category.
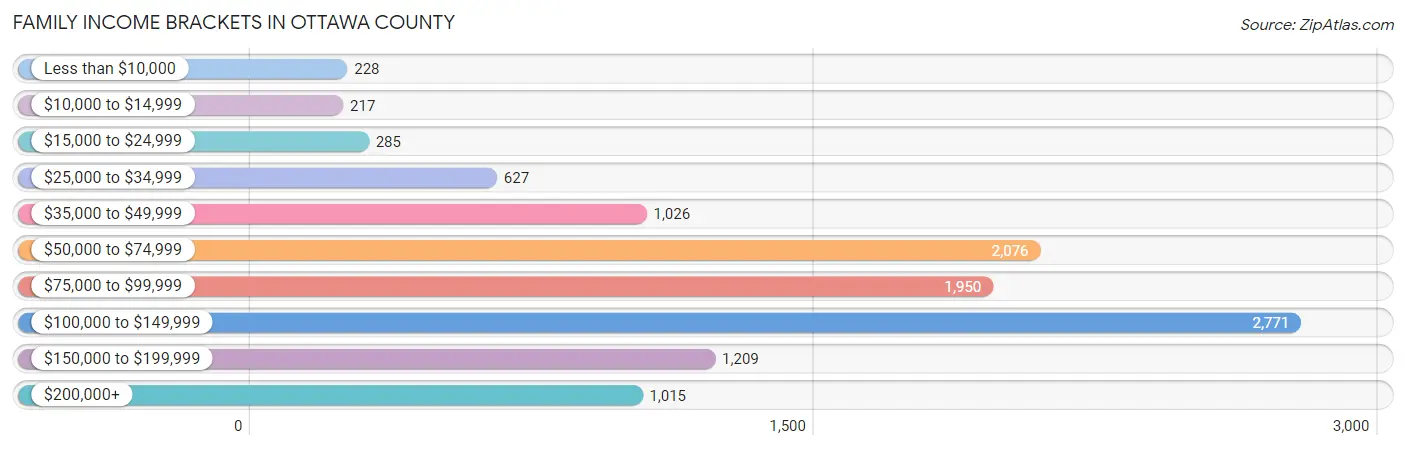
| Income Bracket | # Families | % Families |
| Less than $10,000 | 228 | 2.0% |
| $10,000 to $14,999 | 217 | 1.9% |
| $15,000 to $24,999 | 285 | 2.5% |
| $25,000 to $34,999 | 627 | 5.5% |
| $35,000 to $49,999 | 1,026 | 9.0% |
| $50,000 to $74,999 | 2,076 | 18.2% |
| $75,000 to $99,999 | 1,950 | 17.1% |
| $100,000 to $149,999 | 2,771 | 24.3% |
| $150,000 to $199,999 | 1,209 | 10.6% |
| $200,000+ | 1,015 | 8.9% |
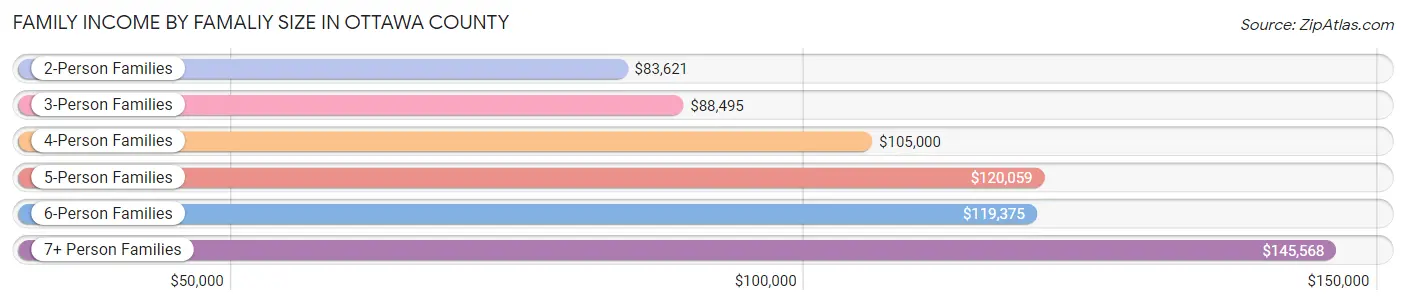
Family Income by Famaliy Size in Ottawa County
7+ person families (103 | 0.9%) account for the highest median family income in Ottawa County with $145,568 per family, while 2-person families (7,018 | 61.5%) have the highest median income of $41,810 per family member.
| Income Bracket | # Families | Median Income |
| 2-Person Families | 7,018 (61.5%) | $83,621 |
| 3-Person Families | 1,999 (17.5%) | $88,495 |
| 4-Person Families | 1,444 (12.7%) | $105,000 |
| 5-Person Families | 712 (6.2%) | $120,059 |
| 6-Person Families | 128 (1.1%) | $119,375 |
| 7+ Person Families | 103 (0.9%) | $145,568 |
| Total | 11,404 (100.0%) | $92,054 |
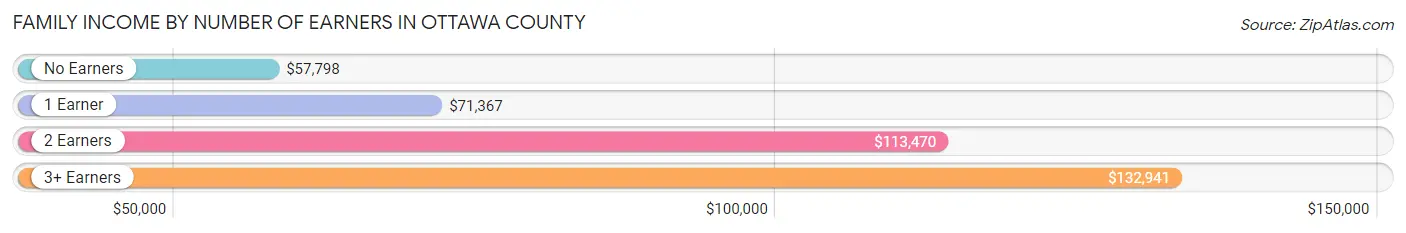
Family Income by Number of Earners in Ottawa County
The median family income in Ottawa County is $92,054, with families comprising 3+ earners (972) having the highest median family income of $132,941, while families with no earners (2,269) have the lowest median family income of $57,798, accounting for 8.5% and 19.9% of families, respectively.
| Number of Earners | # Families | Median Income |
| No Earners | 2,269 (19.9%) | $57,798 |
| 1 Earner | 3,780 (33.2%) | $71,367 |
| 2 Earners | 4,383 (38.4%) | $113,470 |
| 3+ Earners | 972 (8.5%) | $132,941 |
| Total | 11,404 (100.0%) | $92,054 |
Household Income in Ottawa County
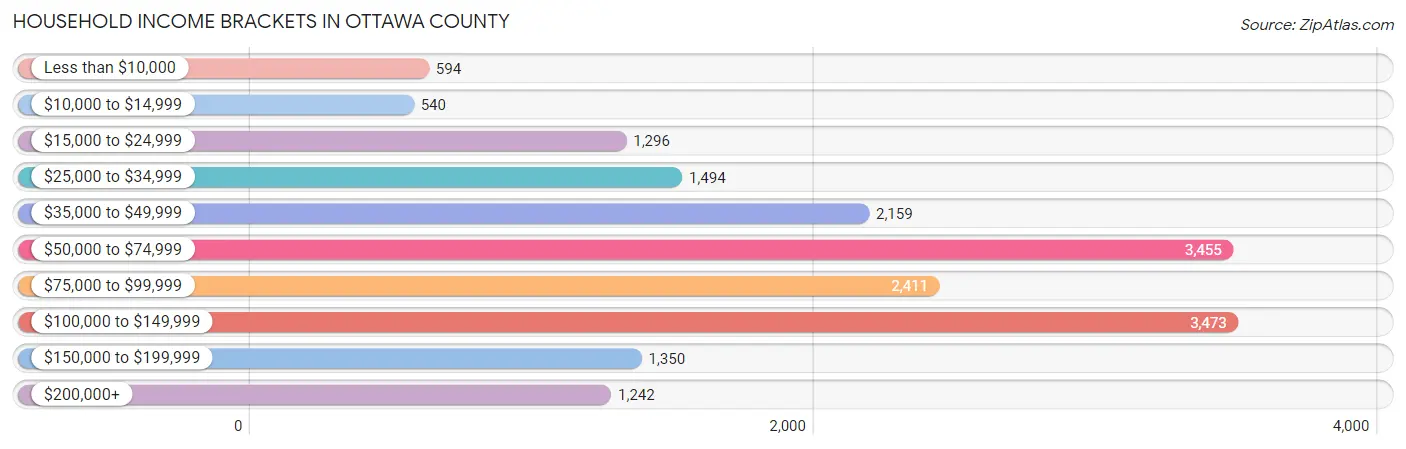
Household Income Brackets in Ottawa County
With 3,473 households falling in the category, the $100,000 to $149,999 income range is the most frequent in Ottawa County, accounting for 19.3% of all households. In contrast, only 540 households (3.0%) fall into the $10,000 to $14,999 income bracket, making it the least populous group.
| Income Bracket | # Households | % Households |
| Less than $10,000 | 594 | 3.3% |
| $10,000 to $14,999 | 540 | 3.0% |
| $15,000 to $24,999 | 1,296 | 7.2% |
| $25,000 to $34,999 | 1,494 | 8.3% |
| $35,000 to $49,999 | 2,159 | 12.0% |
| $50,000 to $74,999 | 3,455 | 19.2% |
| $75,000 to $99,999 | 2,411 | 13.4% |
| $100,000 to $149,999 | 3,473 | 19.3% |
| $150,000 to $199,999 | 1,350 | 7.5% |
| $200,000+ | 1,242 | 6.9% |
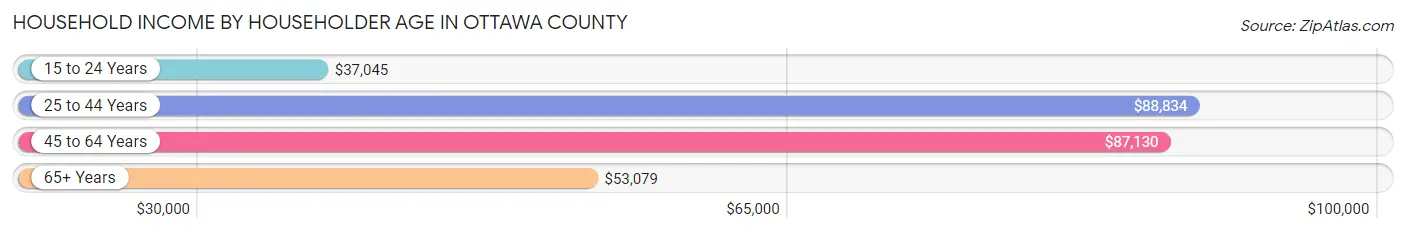
Household Income by Householder Age in Ottawa County
The median household income in Ottawa County is $69,515, with the highest median household income of $88,834 found in the 25 to 44 years age bracket for the primary householder. A total of 4,283 households (23.8%) fall into this category. Meanwhile, the 15 to 24 years age bracket for the primary householder has the lowest median household income of $37,045, with 346 households (1.9%) in this group.
| Income Bracket | # Households | Median Income |
| 15 to 24 Years | 346 (1.9%) | $37,045 |
| 25 to 44 Years | 4,283 (23.8%) | $88,834 |
| 45 to 64 Years | 6,790 (37.7%) | $87,130 |
| 65+ Years | 6,576 (36.5%) | $53,079 |
| Total | 17,995 (100.0%) | $69,515 |
Poverty in Ottawa County
Income Below Poverty by Sex and Age in Ottawa County
With 6.8% poverty level for males and 10.7% for females among the residents of Ottawa County, 5 year old males and 18 to 24 year old females are the most vulnerable to poverty, with 31 males (17.1%) and 239 females (20.7%) in their respective age groups living below the poverty level.

| Age Bracket | Male | Female |
| Under 5 Years | 109 (14.0%) | 102 (13.8%) |
| 5 Years | 31 (17.1%) | 49 (16.7%) |
| 6 to 11 Years | 128 (12.8%) | 223 (17.9%) |
| 12 to 14 Years | 101 (12.7%) | 28 (4.4%) |
| 15 Years | 0 (0.0%) | 14 (6.5%) |
| 16 and 17 Years | 80 (15.0%) | 47 (9.8%) |
| 18 to 24 Years | 52 (3.7%) | 239 (20.7%) |
| 25 to 34 Years | 93 (4.6%) | 231 (11.8%) |
| 35 to 44 Years | 138 (6.3%) | 188 (9.4%) |
| 45 to 54 Years | 124 (5.0%) | 223 (9.2%) |
| 55 to 64 Years | 186 (5.5%) | 224 (6.6%) |
| 65 to 74 Years | 222 (7.1%) | 370 (12.1%) |
| 75 Years and over | 93 (4.9%) | 186 (8.7%) |
| Total | 1,357 (6.8%) | 2,124 (10.7%) |
Income Above Poverty by Sex and Age in Ottawa County
According to the poverty statistics in Ottawa County, males aged 15 years and females aged 12 to 14 years are the age groups that are most secure financially, with 100.0% of males and 95.6% of females in these age groups living above the poverty line.
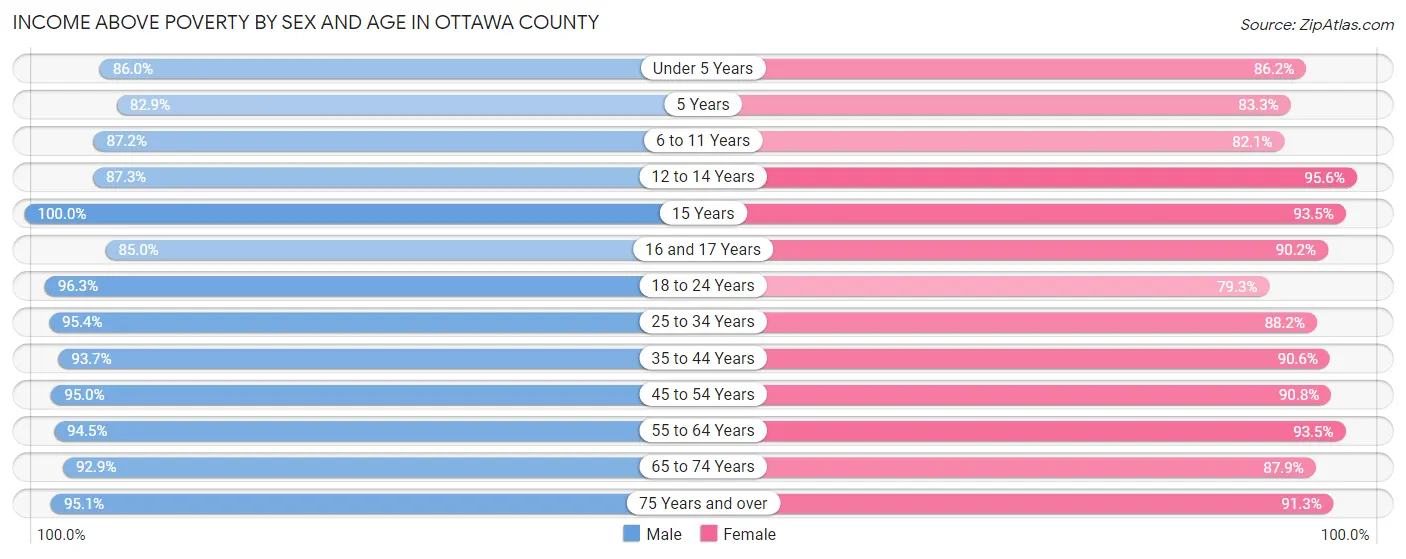
| Age Bracket | Male | Female |
| Under 5 Years | 671 (86.0%) | 636 (86.2%) |
| 5 Years | 150 (82.9%) | 244 (83.3%) |
| 6 to 11 Years | 872 (87.2%) | 1,025 (82.1%) |
| 12 to 14 Years | 695 (87.3%) | 603 (95.6%) |
| 15 Years | 128 (100.0%) | 201 (93.5%) |
| 16 and 17 Years | 453 (85.0%) | 433 (90.2%) |
| 18 to 24 Years | 1,336 (96.3%) | 917 (79.3%) |
| 25 to 34 Years | 1,948 (95.4%) | 1,718 (88.1%) |
| 35 to 44 Years | 2,067 (93.7%) | 1,808 (90.6%) |
| 45 to 54 Years | 2,376 (95.0%) | 2,210 (90.8%) |
| 55 to 64 Years | 3,211 (94.5%) | 3,196 (93.4%) |
| 65 to 74 Years | 2,892 (92.9%) | 2,695 (87.9%) |
| 75 Years and over | 1,804 (95.1%) | 1,942 (91.3%) |
| Total | 18,603 (93.2%) | 17,628 (89.2%) |
Income Below Poverty Among Married-Couple Families in Ottawa County
The poverty statistics for married-couple families in Ottawa County show that 2.1% or 194 of the total 9,011 families live below the poverty line. Families with no children have the highest poverty rate of 2.4%, comprising of 157 families. On the other hand, families with 5 or more children have the lowest poverty rate of 0.0%, which includes 0 families.
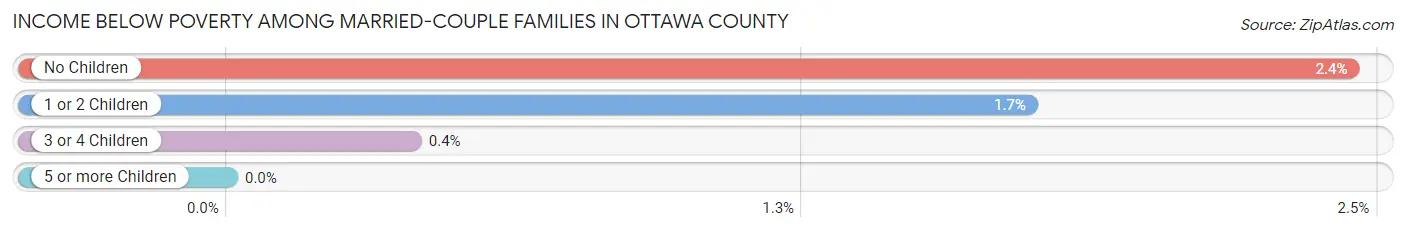
| Children | Above Poverty | Below Poverty |
| No Children | 6,288 (97.6%) | 157 (2.4%) |
| 1 or 2 Children | 1,972 (98.3%) | 35 (1.7%) |
| 3 or 4 Children | 501 (99.6%) | 2 (0.4%) |
| 5 or more Children | 56 (100.0%) | 0 (0.0%) |
| Total | 8,817 (97.9%) | 194 (2.1%) |
Income Below Poverty Among Single-Parent Households in Ottawa County
According to the poverty data in Ottawa County, 1.9% or 16 single-father households and 30.0% or 472 single-mother households are living below the poverty line. Among single-father households, those with no children have the highest poverty rate, with 10 households (2.2%) experiencing poverty. Likewise, among single-mother households, those with 3 or 4 children have the highest poverty rate, with 207 households (70.7%) falling below the poverty line.
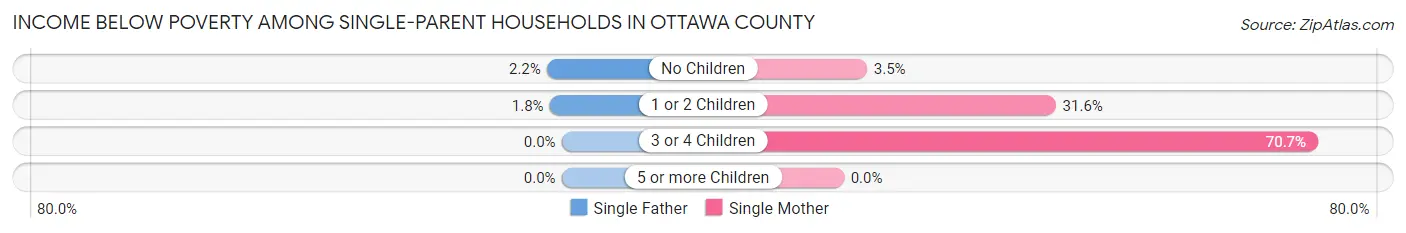
| Children | Single Father | Single Mother |
| No Children | 10 (2.2%) | 17 (3.5%) |
| 1 or 2 Children | 6 (1.8%) | 248 (31.6%) |
| 3 or 4 Children | 0 (0.0%) | 207 (70.7%) |
| 5 or more Children | 0 (0.0%) | 0 (0.0%) |
| Total | 16 (1.9%) | 472 (30.0%) |
Income Below Poverty Among Married-Couple vs Single-Parent Households in Ottawa County
The poverty data for Ottawa County shows that 194 of the married-couple family households (2.1%) and 488 of the single-parent households (20.4%) are living below the poverty level. Within the married-couple family households, those with no children have the highest poverty rate, with 157 households (2.4%) falling below the poverty line. Among the single-parent households, those with 3 or 4 children have the highest poverty rate, with 207 household (62.9%) living below poverty.
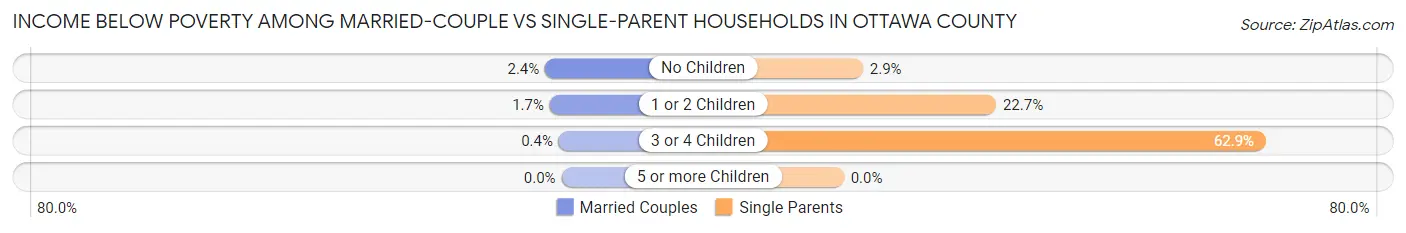
| Children | Married-Couple Families | Single-Parent Households |
| No Children | 157 (2.4%) | 27 (2.9%) |
| 1 or 2 Children | 35 (1.7%) | 254 (22.7%) |
| 3 or 4 Children | 2 (0.4%) | 207 (62.9%) |
| 5 or more Children | 0 (0.0%) | 0 (0.0%) |
| Total | 194 (2.1%) | 488 (20.4%) |
Employment Characteristics in Ottawa County
Employment by Class of Employer in Ottawa County
Among the 18,665 employed individuals in Ottawa County, private company employees (12,623 | 67.6%), not-for-profit organizations (1,854 | 9.9%), and local government employees (1,834 | 9.8%) make up the most common classes of employment.
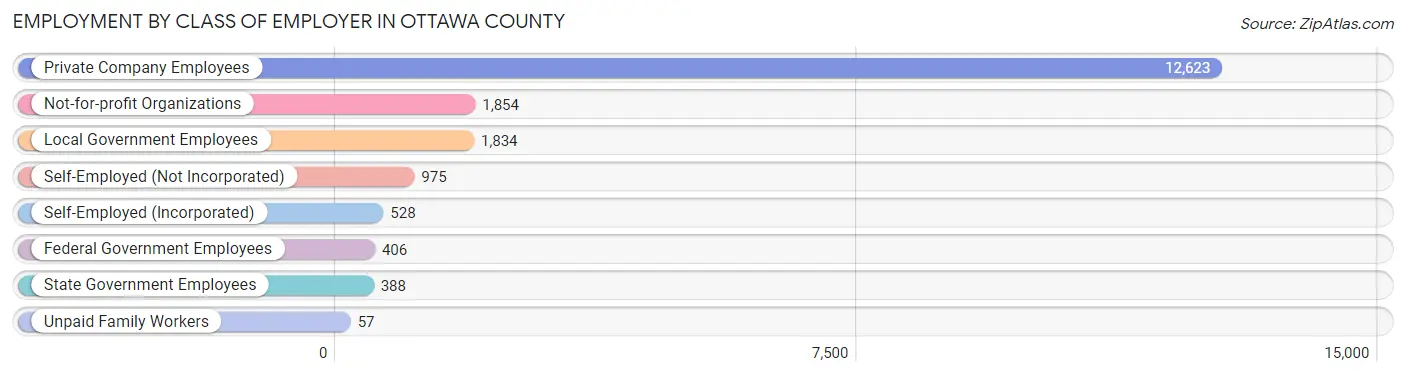
| Employer Class | # Employees | % Employees |
| Private Company Employees | 12,623 | 67.6% |
| Self-Employed (Incorporated) | 528 | 2.8% |
| Self-Employed (Not Incorporated) | 975 | 5.2% |
| Not-for-profit Organizations | 1,854 | 9.9% |
| Local Government Employees | 1,834 | 9.8% |
| State Government Employees | 388 | 2.1% |
| Federal Government Employees | 406 | 2.2% |
| Unpaid Family Workers | 57 | 0.3% |
| Total | 18,665 | 100.0% |
Employment Status by Age in Ottawa County
According to the labor force statistics for Ottawa County, out of the total population over 16 years of age (34,184), 57.7% or 19,724 individuals are in the labor force, with 3.4% or 671 of them unemployed. The age group with the highest labor force participation rate is 25 to 29 years, with 89.8% or 1,648 individuals in the labor force. Within the labor force, the 16 to 19 years age range has the highest percentage of unemployed individuals, with 7.8% or 67 of them being unemployed.

| Age Bracket | In Labor Force | Unemployed |
| 16 to 19 Years | 863 (47.9%) | 67 (7.8%) |
| 20 to 24 Years | 1,488 (82.1%) | 37 (2.5%) |
| 25 to 29 Years | 1,648 (89.8%) | 79 (4.8%) |
| 30 to 34 Years | 1,933 (88.6%) | 19 (1.0%) |
| 35 to 44 Years | 3,701 (87.8%) | 196 (5.3%) |
| 45 to 54 Years | 4,111 (83.3%) | 123 (3.0%) |
| 55 to 59 Years | 2,570 (74.2%) | 54 (2.1%) |
| 60 to 64 Years | 1,832 (53.6%) | 42 (2.3%) |
| 65 to 74 Years | 1,324 (21.3%) | 34 (2.6%) |
| 75 Years and over | 254 (5.9%) | 15 (5.9%) |
| Total | 19,724 (57.7%) | 671 (3.4%) |
Employment Status by Educational Attainment in Ottawa County
According to labor force statistics for Ottawa County, 78.8% of individuals (15,798) out of the total population between 25 and 64 years of age (20,048) are in the labor force, with 3.2% or 506 of them being unemployed. The group with the highest labor force participation rate are those with the educational attainment of bachelor's degree or higher, with 88.6% or 5,025 individuals in the labor force. Within the labor force, individuals with less than high school education have the highest percentage of unemployment, with 8.0% or 55 of them being unemployed.
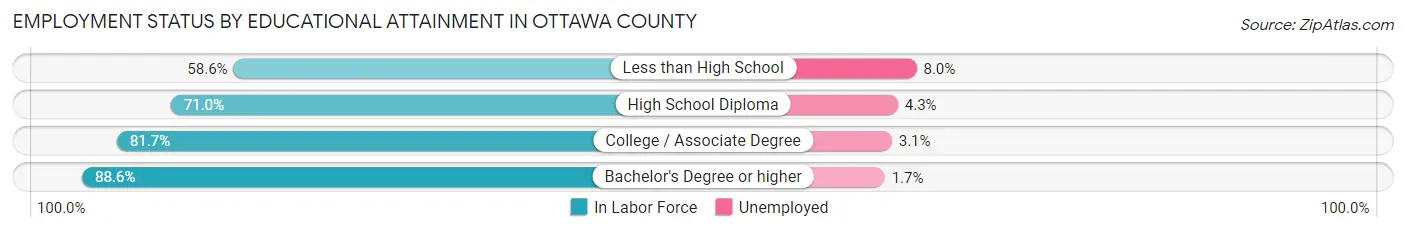
| Educational Attainment | In Labor Force | Unemployed |
| Less than High School | 686 (58.6%) | 94 (8.0%) |
| High School Diploma | 4,702 (71.0%) | 285 (4.3%) |
| College / Associate Degree | 5,379 (81.7%) | 204 (3.1%) |
| Bachelor's Degree or higher | 5,025 (88.6%) | 96 (1.7%) |
| Total | 15,798 (78.8%) | 642 (3.2%) |
Employment Occupations by Sex in Ottawa County
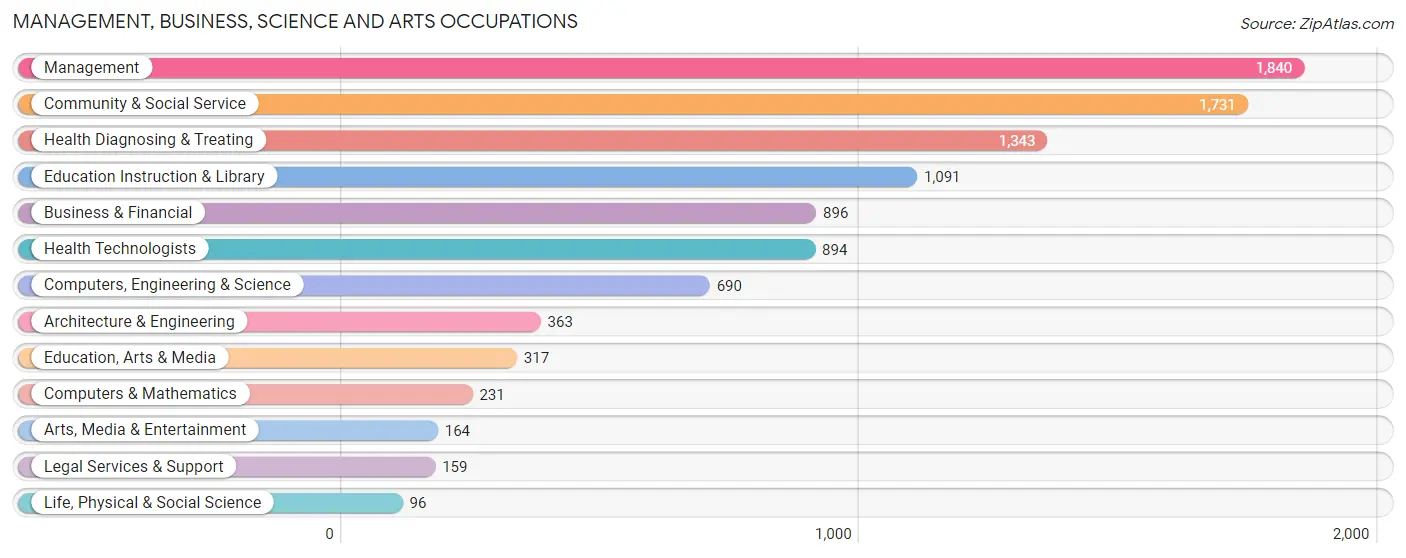
Management, Business, Science and Arts Occupations
The most common Management, Business, Science and Arts occupations in Ottawa County are Management (1,840 | 9.7%), Community & Social Service (1,731 | 9.1%), Health Diagnosing & Treating (1,343 | 7.0%), Education Instruction & Library (1,091 | 5.7%), and Business & Financial (896 | 4.7%).
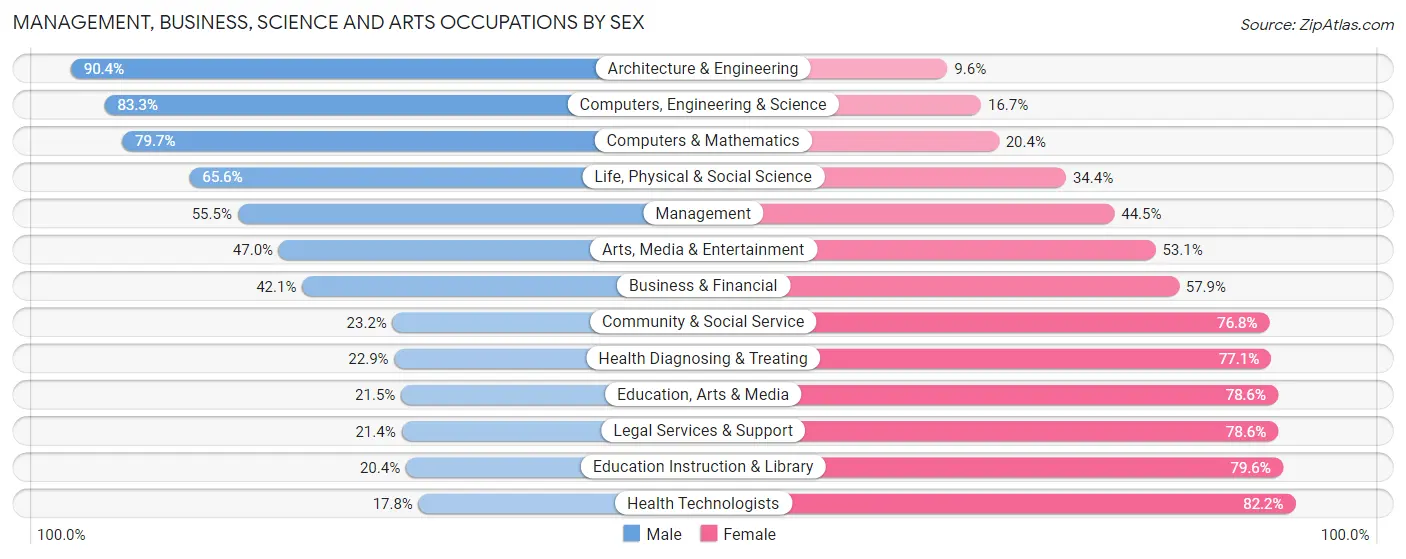
Management, Business, Science and Arts Occupations by Sex
Within the Management, Business, Science and Arts occupations in Ottawa County, the most male-oriented occupations are Architecture & Engineering (90.4%), Computers, Engineering & Science (83.3%), and Computers & Mathematics (79.6%), while the most female-oriented occupations are Health Technologists (82.2%), Education Instruction & Library (79.6%), and Legal Services & Support (78.6%).
| Occupation | Male | Female |
| Management | 1,022 (55.5%) | 818 (44.5%) |
| Business & Financial | 377 (42.1%) | 519 (57.9%) |
| Computers, Engineering & Science | 575 (83.3%) | 115 (16.7%) |
| Computers & Mathematics | 184 (79.6%) | 47 (20.3%) |
| Architecture & Engineering | 328 (90.4%) | 35 (9.6%) |
| Life, Physical & Social Science | 63 (65.6%) | 33 (34.4%) |
| Community & Social Service | 402 (23.2%) | 1,329 (76.8%) |
| Education, Arts & Media | 68 (21.4%) | 249 (78.5%) |
| Legal Services & Support | 34 (21.4%) | 125 (78.6%) |
| Education Instruction & Library | 223 (20.4%) | 868 (79.6%) |
| Arts, Media & Entertainment | 77 (46.9%) | 87 (53.0%) |
| Health Diagnosing & Treating | 307 (22.9%) | 1,036 (77.1%) |
| Health Technologists | 159 (17.8%) | 735 (82.2%) |
| Total (Category) | 2,683 (41.3%) | 3,817 (58.7%) |
| Total (Overall) | 10,050 (52.8%) | 8,993 (47.2%) |
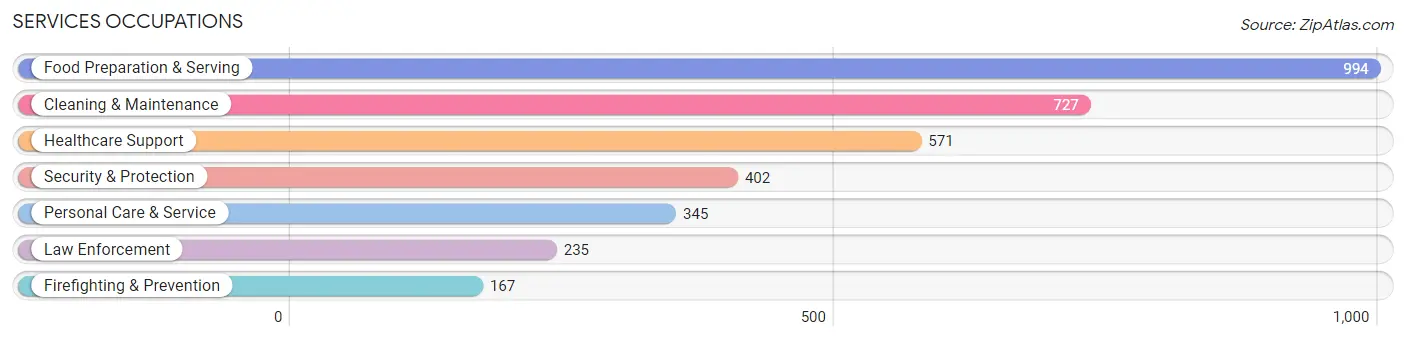
Services Occupations
The most common Services occupations in Ottawa County are Food Preparation & Serving (994 | 5.2%), Cleaning & Maintenance (727 | 3.8%), Healthcare Support (571 | 3.0%), Security & Protection (402 | 2.1%), and Personal Care & Service (345 | 1.8%).
Services Occupations by Sex
Within the Services occupations in Ottawa County, the most male-oriented occupations are Law Enforcement (98.7%), Security & Protection (84.3%), and Firefighting & Prevention (64.1%), while the most female-oriented occupations are Healthcare Support (90.4%), Personal Care & Service (79.7%), and Food Preparation & Serving (47.9%).

| Occupation | Male | Female |
| Healthcare Support | 55 (9.6%) | 516 (90.4%) |
| Security & Protection | 339 (84.3%) | 63 (15.7%) |
| Firefighting & Prevention | 107 (64.1%) | 60 (35.9%) |
| Law Enforcement | 232 (98.7%) | 3 (1.3%) |
| Food Preparation & Serving | 518 (52.1%) | 476 (47.9%) |
| Cleaning & Maintenance | 391 (53.8%) | 336 (46.2%) |
| Personal Care & Service | 70 (20.3%) | 275 (79.7%) |
| Total (Category) | 1,373 (45.2%) | 1,666 (54.8%) |
| Total (Overall) | 10,050 (52.8%) | 8,993 (47.2%) |
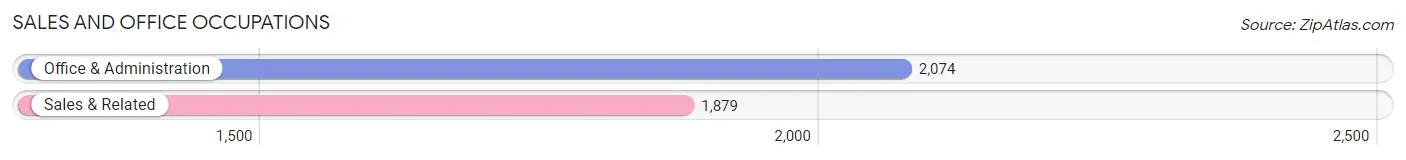
Sales and Office Occupations
The most common Sales and Office occupations in Ottawa County are Office & Administration (2,074 | 10.9%), and Sales & Related (1,879 | 9.9%).
Sales and Office Occupations by Sex
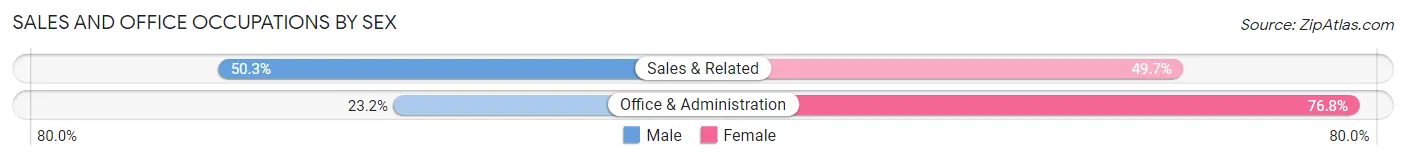
| Occupation | Male | Female |
| Sales & Related | 945 (50.3%) | 934 (49.7%) |
| Office & Administration | 481 (23.2%) | 1,593 (76.8%) |
| Total (Category) | 1,426 (36.1%) | 2,527 (63.9%) |
| Total (Overall) | 10,050 (52.8%) | 8,993 (47.2%) |
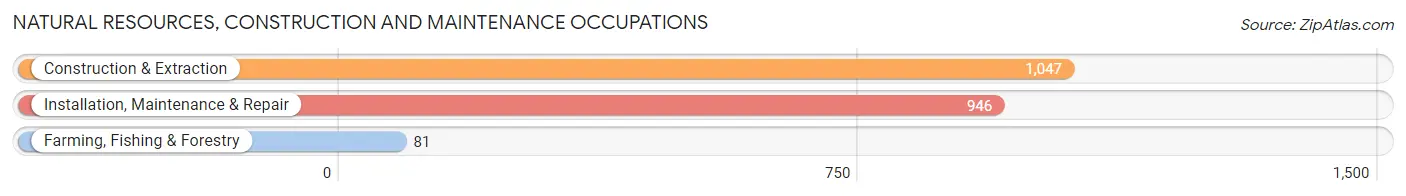
Natural Resources, Construction and Maintenance Occupations
The most common Natural Resources, Construction and Maintenance occupations in Ottawa County are Construction & Extraction (1,047 | 5.5%), Installation, Maintenance & Repair (946 | 5.0%), and Farming, Fishing & Forestry (81 | 0.4%).
Natural Resources, Construction and Maintenance Occupations by Sex
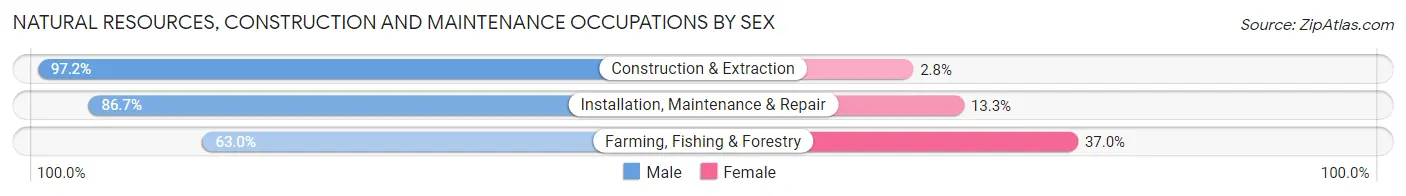
| Occupation | Male | Female |
| Farming, Fishing & Forestry | 51 (63.0%) | 30 (37.0%) |
| Construction & Extraction | 1,018 (97.2%) | 29 (2.8%) |
| Installation, Maintenance & Repair | 820 (86.7%) | 126 (13.3%) |
| Total (Category) | 1,889 (91.1%) | 185 (8.9%) |
| Total (Overall) | 10,050 (52.8%) | 8,993 (47.2%) |
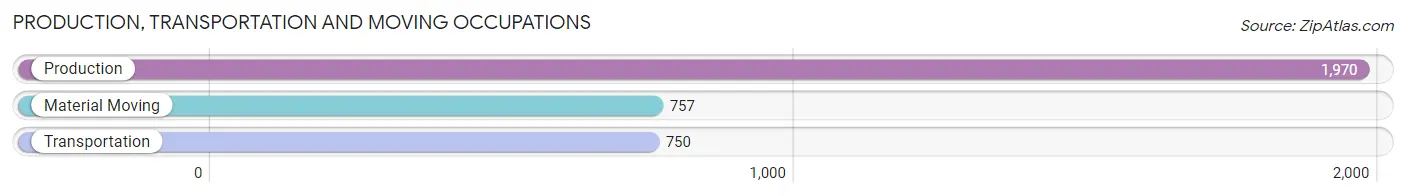
Production, Transportation and Moving Occupations
The most common Production, Transportation and Moving occupations in Ottawa County are Production (1,970 | 10.3%), Material Moving (757 | 4.0%), and Transportation (750 | 3.9%).
Production, Transportation and Moving Occupations by Sex
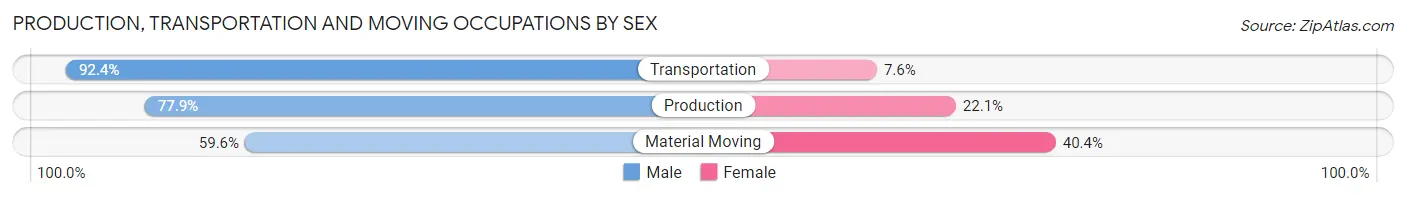
| Occupation | Male | Female |
| Production | 1,535 (77.9%) | 435 (22.1%) |
| Transportation | 693 (92.4%) | 57 (7.6%) |
| Material Moving | 451 (59.6%) | 306 (40.4%) |
| Total (Category) | 2,679 (77.0%) | 798 (23.0%) |
| Total (Overall) | 10,050 (52.8%) | 8,993 (47.2%) |
Employment Industries by Sex in Ottawa County
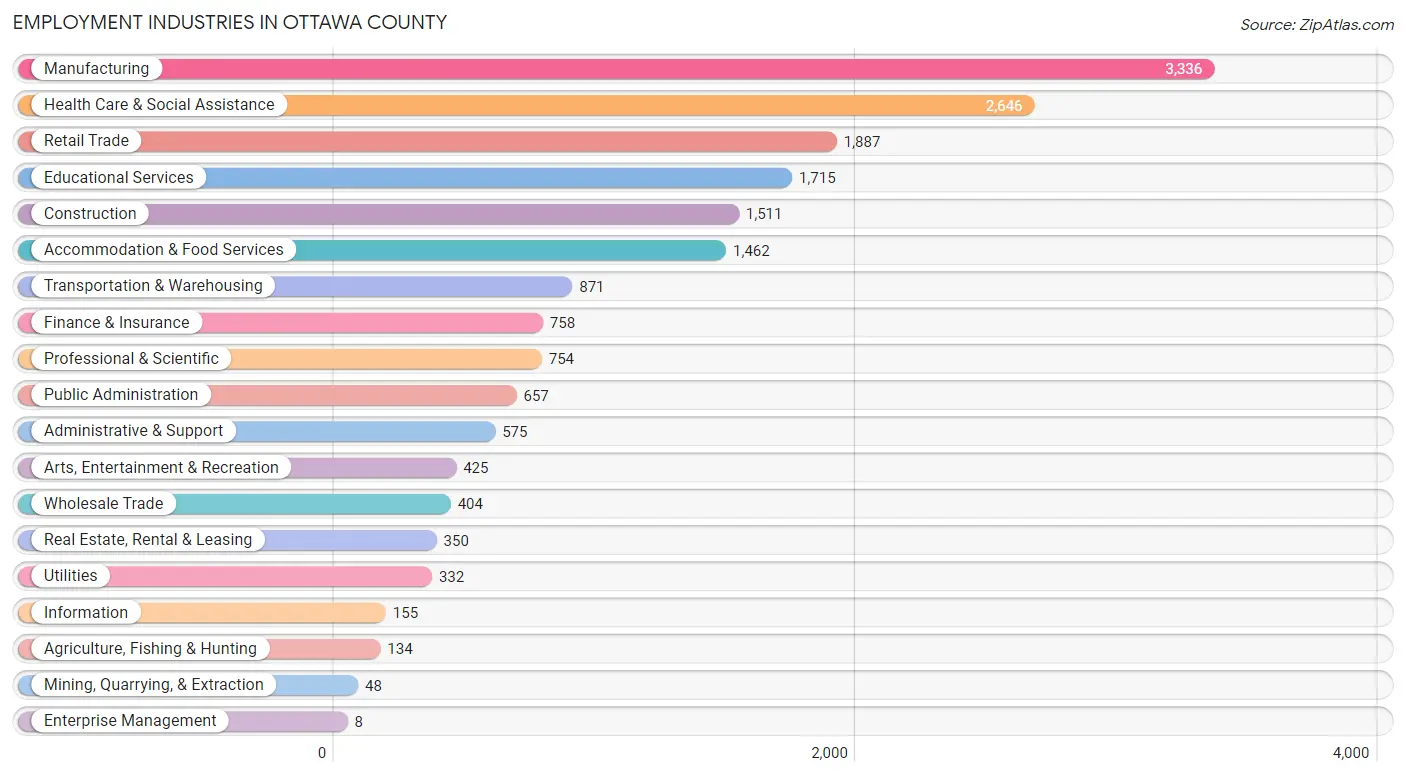
Employment Industries in Ottawa County
The major employment industries in Ottawa County include Manufacturing (3,336 | 17.5%), Health Care & Social Assistance (2,646 | 13.9%), Retail Trade (1,887 | 9.9%), Educational Services (1,715 | 9.0%), and Construction (1,511 | 7.9%).
Employment Industries by Sex in Ottawa County
The Ottawa County industries that see more men than women are Mining, Quarrying, & Extraction (100.0%), Transportation & Warehousing (84.3%), and Construction (80.7%), whereas the industries that tend to have a higher number of women are Enterprise Management (100.0%), Health Care & Social Assistance (78.8%), and Educational Services (75.9%).
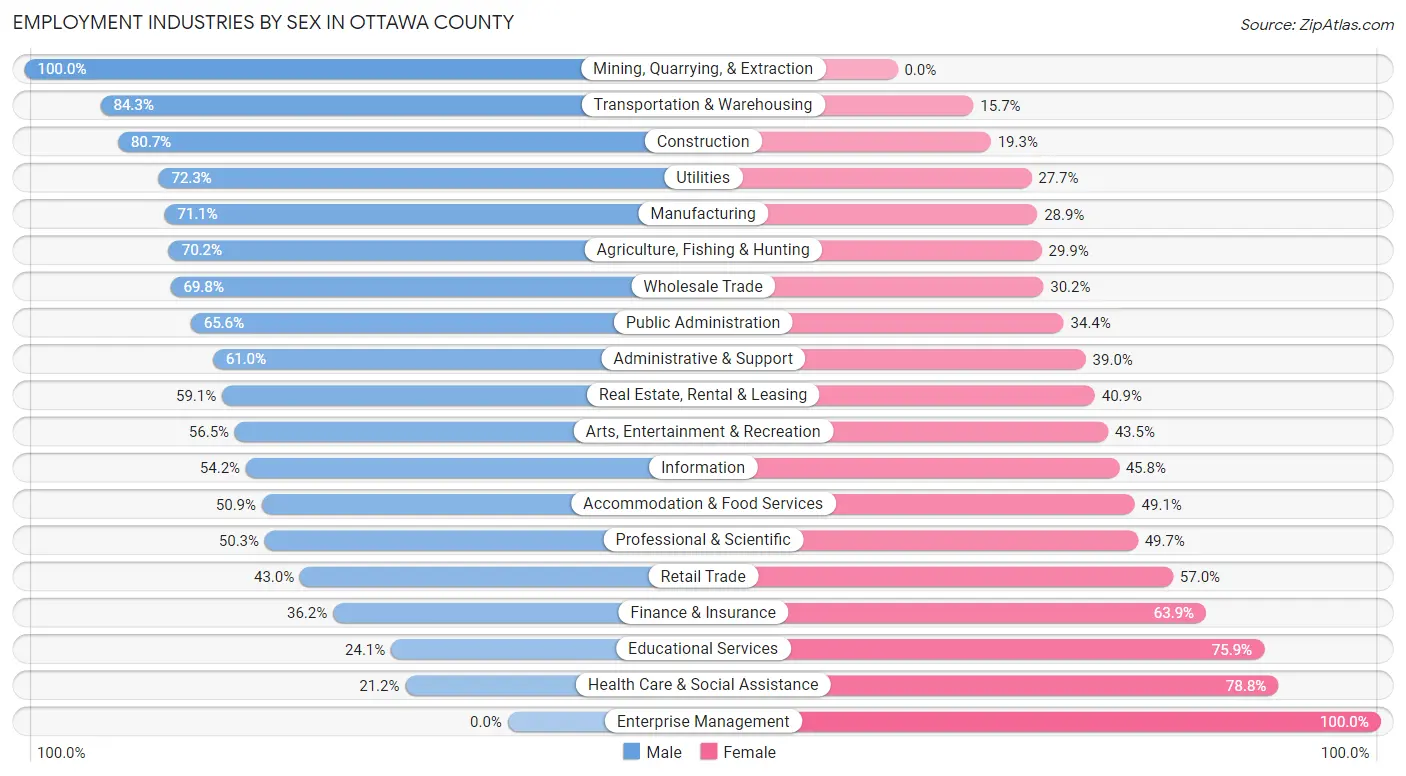
| Industry | Male | Female |
| Agriculture, Fishing & Hunting | 94 (70.2%) | 40 (29.8%) |
| Mining, Quarrying, & Extraction | 48 (100.0%) | 0 (0.0%) |
| Construction | 1,219 (80.7%) | 292 (19.3%) |
| Manufacturing | 2,371 (71.1%) | 965 (28.9%) |
| Wholesale Trade | 282 (69.8%) | 122 (30.2%) |
| Retail Trade | 811 (43.0%) | 1,076 (57.0%) |
| Transportation & Warehousing | 734 (84.3%) | 137 (15.7%) |
| Utilities | 240 (72.3%) | 92 (27.7%) |
| Information | 84 (54.2%) | 71 (45.8%) |
| Finance & Insurance | 274 (36.1%) | 484 (63.8%) |
| Real Estate, Rental & Leasing | 207 (59.1%) | 143 (40.9%) |
| Professional & Scientific | 379 (50.3%) | 375 (49.7%) |
| Enterprise Management | 0 (0.0%) | 8 (100.0%) |
| Administrative & Support | 351 (61.0%) | 224 (39.0%) |
| Educational Services | 414 (24.1%) | 1,301 (75.9%) |
| Health Care & Social Assistance | 561 (21.2%) | 2,085 (78.8%) |
| Arts, Entertainment & Recreation | 240 (56.5%) | 185 (43.5%) |
| Accommodation & Food Services | 744 (50.9%) | 718 (49.1%) |
| Public Administration | 431 (65.6%) | 226 (34.4%) |
| Total | 10,050 (52.8%) | 8,993 (47.2%) |
Education in Ottawa County
School Enrollment in Ottawa County
The most common levels of schooling among the 7,271 students in Ottawa County are high school (2,070 | 28.5%), middle school (1,569 | 21.6%), and elementary school (1,540 | 21.2%).
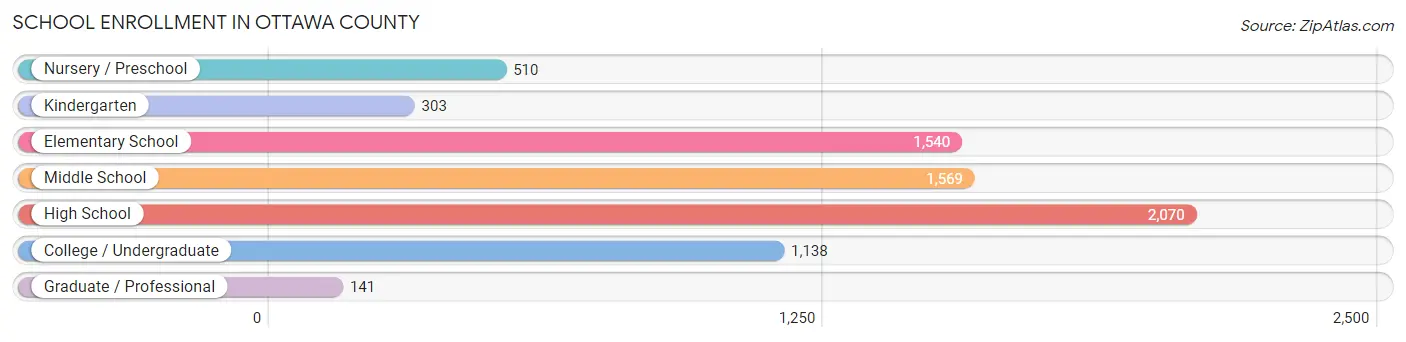
| School Level | # Students | % Students |
| Nursery / Preschool | 510 | 7.0% |
| Kindergarten | 303 | 4.2% |
| Elementary School | 1,540 | 21.2% |
| Middle School | 1,569 | 21.6% |
| High School | 2,070 | 28.5% |
| College / Undergraduate | 1,138 | 15.7% |
| Graduate / Professional | 141 | 1.9% |
| Total | 7,271 | 100.0% |
School Enrollment by Age by Funding Source in Ottawa County
Out of a total of 7,271 students who are enrolled in schools in Ottawa County, 931 (12.8%) attend a private institution, while the remaining 6,340 (87.2%) are enrolled in public schools. The age group of 35 years and over has the highest likelihood of being enrolled in private schools, with 140 (42.3% in the age bracket) enrolled. Conversely, the age group of 15 to 17 year olds has the lowest likelihood of being enrolled in a private school, with 1,228 (94.7% in the age bracket) attending a public institution.

| Age Bracket | Public School | Private School |
| 3 to 4 Year Olds | 213 (83.9%) | 41 (16.1%) |
| 5 to 9 Year Old | 1,674 (87.9%) | 230 (12.1%) |
| 10 to 14 Year Olds | 1,844 (89.2%) | 223 (10.8%) |
| 15 to 17 Year Olds | 1,228 (94.7%) | 69 (5.3%) |
| 18 to 19 Year Olds | 478 (90.7%) | 49 (9.3%) |
| 20 to 24 Year Olds | 531 (78.0%) | 150 (22.0%) |
| 25 to 34 Year Olds | 182 (86.7%) | 28 (13.3%) |
| 35 Years and over | 191 (57.7%) | 140 (42.3%) |
| Total | 6,340 (87.2%) | 931 (12.8%) |
Educational Attainment by Field of Study in Ottawa County
Education (1,806 | 20.9%), business (1,673 | 19.3%), science & technology (1,216 | 14.0%), engineering (757 | 8.7%), and bio, nature & agricultural (510 | 5.9%) are the most common fields of study among 8,658 individuals in Ottawa County who have obtained a bachelor's degree or higher.
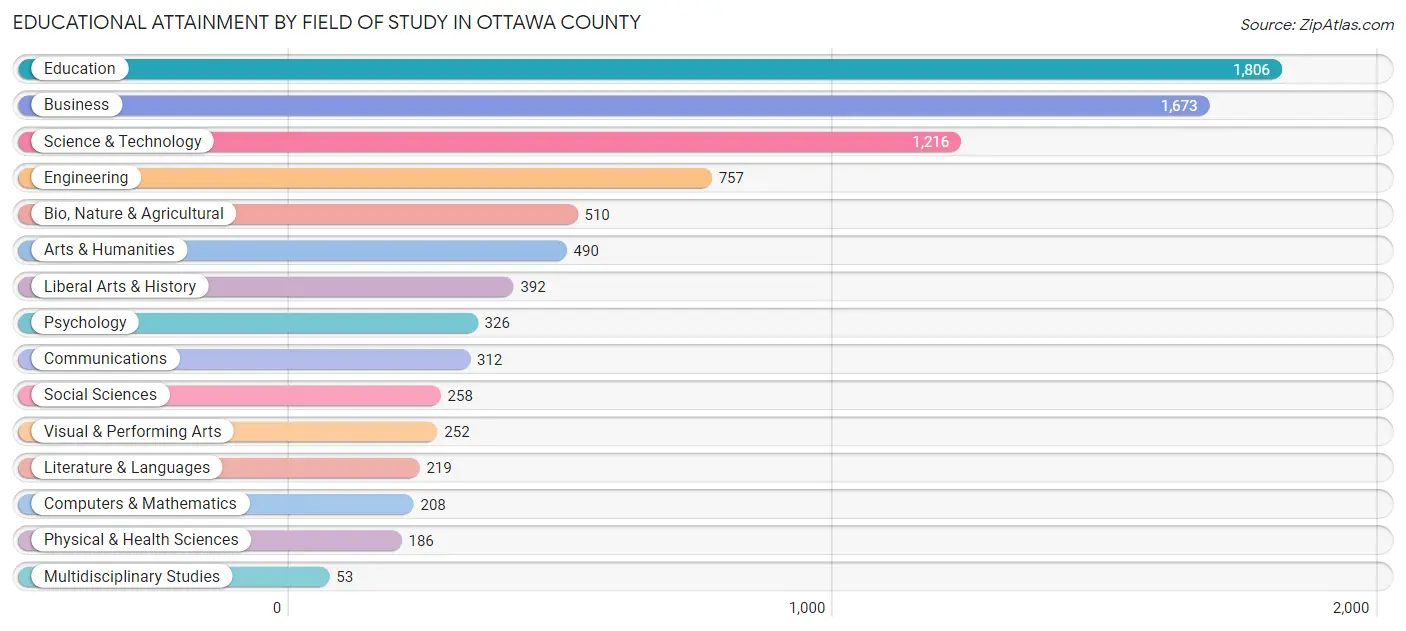
| Field of Study | # Graduates | % Graduates |
| Computers & Mathematics | 208 | 2.4% |
| Bio, Nature & Agricultural | 510 | 5.9% |
| Physical & Health Sciences | 186 | 2.1% |
| Psychology | 326 | 3.8% |
| Social Sciences | 258 | 3.0% |
| Engineering | 757 | 8.7% |
| Multidisciplinary Studies | 53 | 0.6% |
| Science & Technology | 1,216 | 14.0% |
| Business | 1,673 | 19.3% |
| Education | 1,806 | 20.9% |
| Literature & Languages | 219 | 2.5% |
| Liberal Arts & History | 392 | 4.5% |
| Visual & Performing Arts | 252 | 2.9% |
| Communications | 312 | 3.6% |
| Arts & Humanities | 490 | 5.7% |
| Total | 8,658 | 100.0% |
Transportation & Commute in Ottawa County
Vehicle Availability by Sex in Ottawa County
The most prevalent vehicle ownership categories in Ottawa County are males with 2 vehicles (3,908, accounting for 39.8%) and females with 2 vehicles (3,181, making up 44.4%).
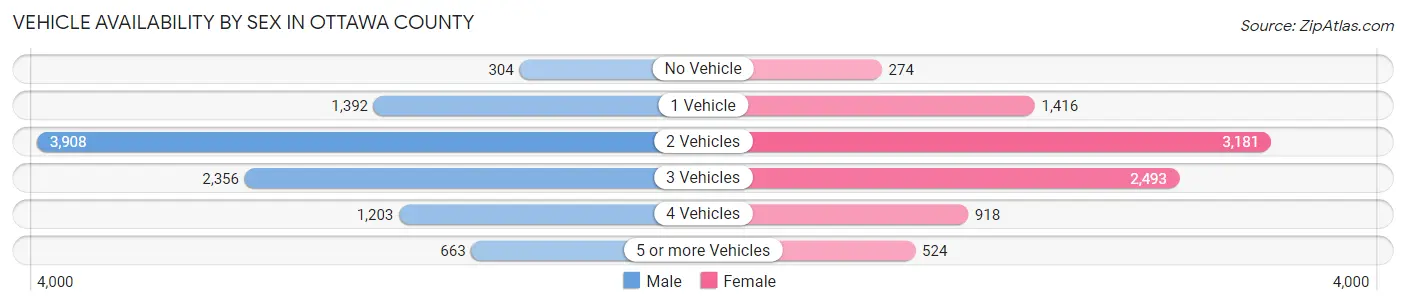
| Vehicles Available | Male | Female |
| No Vehicle | 304 (3.1%) | 274 (3.1%) |
| 1 Vehicle | 1,392 (14.2%) | 1,416 (16.1%) |
| 2 Vehicles | 3,908 (39.8%) | 3,181 (36.1%) |
| 3 Vehicles | 2,356 (24.0%) | 2,493 (28.3%) |
| 4 Vehicles | 1,203 (12.2%) | 918 (10.4%) |
| 5 or more Vehicles | 663 (6.8%) | 524 (5.9%) |
| Total | 9,826 (100.0%) | 8,806 (100.0%) |
Commute Time in Ottawa County
The most frequently occuring commute durations in Ottawa County are 15 to 19 minutes (2,844 commuters, 16.2%), 10 to 14 minutes (2,527 commuters, 14.4%), and 30 to 34 minutes (2,503 commuters, 14.2%).
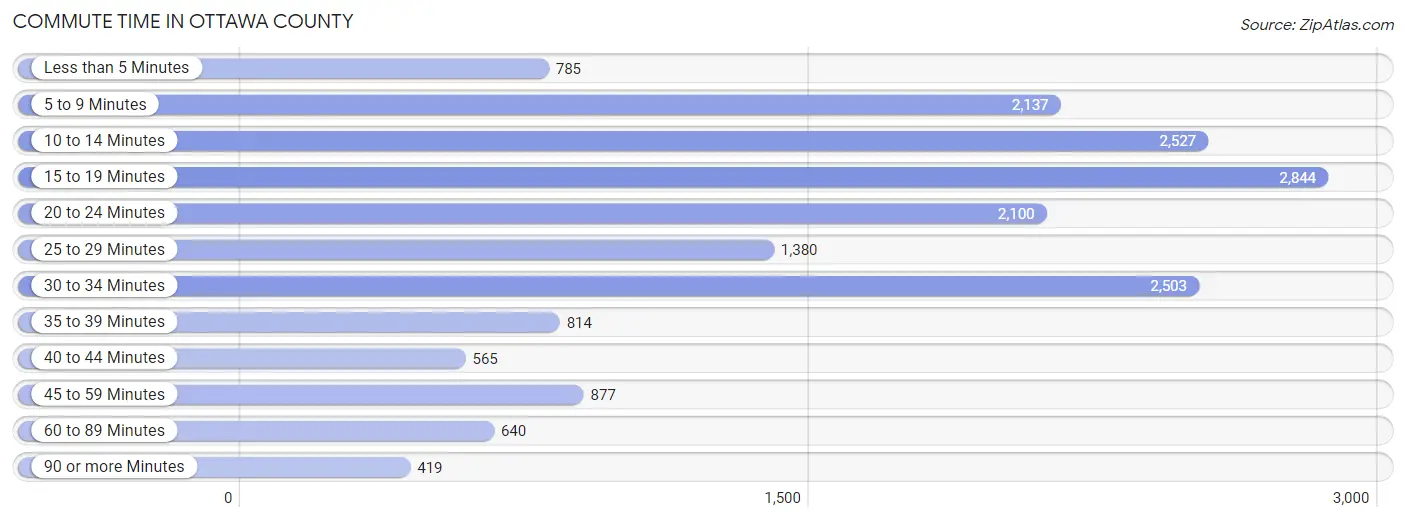
| Commute Time | # Commuters | % Commuters |
| Less than 5 Minutes | 785 | 4.5% |
| 5 to 9 Minutes | 2,137 | 12.1% |
| 10 to 14 Minutes | 2,527 | 14.4% |
| 15 to 19 Minutes | 2,844 | 16.2% |
| 20 to 24 Minutes | 2,100 | 11.9% |
| 25 to 29 Minutes | 1,380 | 7.8% |
| 30 to 34 Minutes | 2,503 | 14.2% |
| 35 to 39 Minutes | 814 | 4.6% |
| 40 to 44 Minutes | 565 | 3.2% |
| 45 to 59 Minutes | 877 | 5.0% |
| 60 to 89 Minutes | 640 | 3.6% |
| 90 or more Minutes | 419 | 2.4% |
Commute Time by Sex in Ottawa County
The most common commute times in Ottawa County are 15 to 19 minutes (1,622 commuters, 17.3%) for males and 15 to 19 minutes (1,222 commuters, 14.9%) for females.

| Commute Time | Male | Female |
| Less than 5 Minutes | 264 (2.8%) | 521 (6.4%) |
| 5 to 9 Minutes | 978 (10.4%) | 1,159 (14.1%) |
| 10 to 14 Minutes | 1,348 (14.4%) | 1,179 (14.4%) |
| 15 to 19 Minutes | 1,622 (17.3%) | 1,222 (14.9%) |
| 20 to 24 Minutes | 996 (10.6%) | 1,104 (13.5%) |
| 25 to 29 Minutes | 630 (6.7%) | 750 (9.1%) |
| 30 to 34 Minutes | 1,444 (15.4%) | 1,059 (12.9%) |
| 35 to 39 Minutes | 536 (5.7%) | 278 (3.4%) |
| 40 to 44 Minutes | 319 (3.4%) | 246 (3.0%) |
| 45 to 59 Minutes | 574 (6.1%) | 303 (3.7%) |
| 60 to 89 Minutes | 429 (4.6%) | 211 (2.6%) |
| 90 or more Minutes | 246 (2.6%) | 173 (2.1%) |
Time of Departure to Work by Sex in Ottawa County
The most frequent times of departure to work in Ottawa County are 7:00 AM to 7:29 AM (1,547, 16.5%) for males and 7:00 AM to 7:29 AM (1,660, 20.2%) for females.
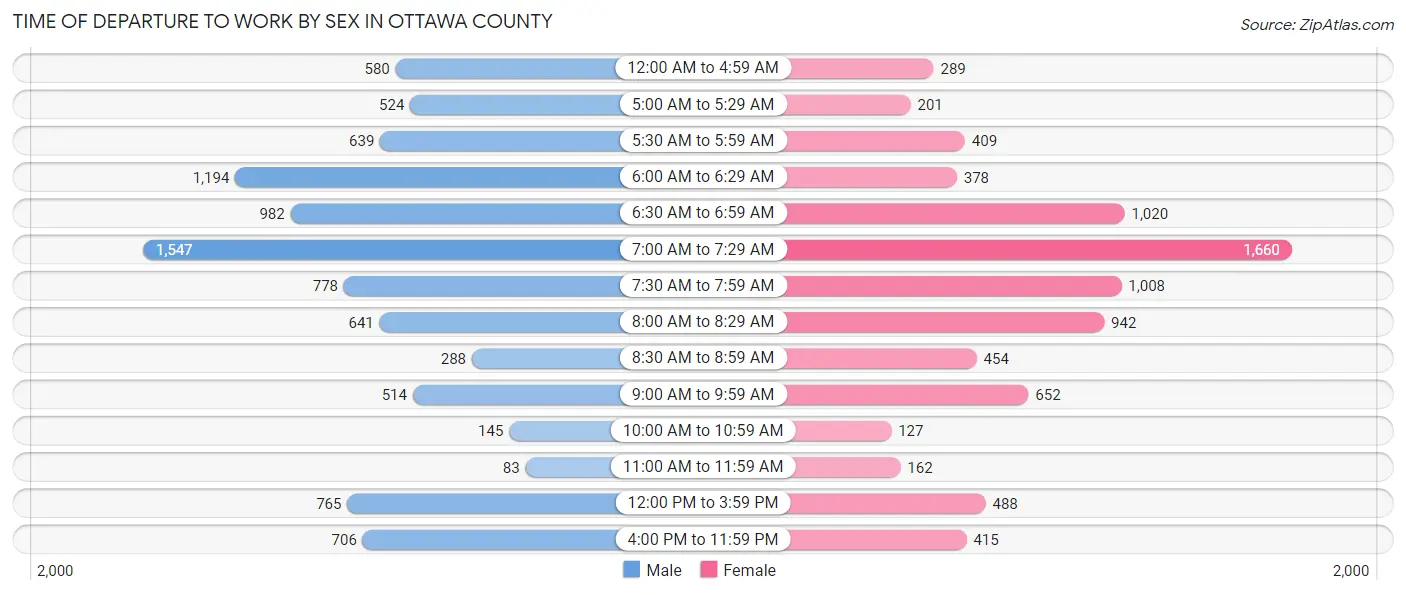
| Time of Departure | Male | Female |
| 12:00 AM to 4:59 AM | 580 (6.2%) | 289 (3.5%) |
| 5:00 AM to 5:29 AM | 524 (5.6%) | 201 (2.5%) |
| 5:30 AM to 5:59 AM | 639 (6.8%) | 409 (5.0%) |
| 6:00 AM to 6:29 AM | 1,194 (12.7%) | 378 (4.6%) |
| 6:30 AM to 6:59 AM | 982 (10.5%) | 1,020 (12.4%) |
| 7:00 AM to 7:29 AM | 1,547 (16.5%) | 1,660 (20.2%) |
| 7:30 AM to 7:59 AM | 778 (8.3%) | 1,008 (12.3%) |
| 8:00 AM to 8:29 AM | 641 (6.8%) | 942 (11.5%) |
| 8:30 AM to 8:59 AM | 288 (3.1%) | 454 (5.5%) |
| 9:00 AM to 9:59 AM | 514 (5.5%) | 652 (8.0%) |
| 10:00 AM to 10:59 AM | 145 (1.5%) | 127 (1.5%) |
| 11:00 AM to 11:59 AM | 83 (0.9%) | 162 (2.0%) |
| 12:00 PM to 3:59 PM | 765 (8.2%) | 488 (5.9%) |
| 4:00 PM to 11:59 PM | 706 (7.5%) | 415 (5.1%) |
| Total | 9,386 (100.0%) | 8,205 (100.0%) |
Housing Occupancy in Ottawa County
Occupancy by Ownership in Ottawa County
Of the total 17,995 dwellings in Ottawa County, owner-occupied units account for 14,824 (82.4%), while renter-occupied units make up 3,171 (17.6%).
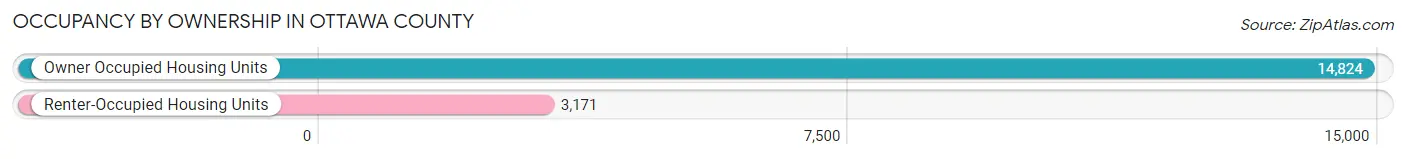
| Occupancy | # Housing Units | % Housing Units |
| Owner Occupied Housing Units | 14,824 | 82.4% |
| Renter-Occupied Housing Units | 3,171 | 17.6% |
| Total Occupied Housing Units | 17,995 | 100.0% |
Occupancy by Household Size in Ottawa County
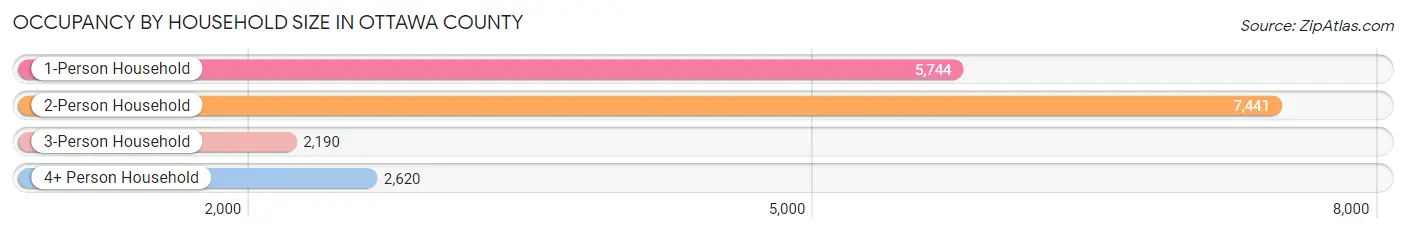
| Household Size | # Housing Units | % Housing Units |
| 1-Person Household | 5,744 | 31.9% |
| 2-Person Household | 7,441 | 41.3% |
| 3-Person Household | 2,190 | 12.2% |
| 4+ Person Household | 2,620 | 14.6% |
| Total Housing Units | 17,995 | 100.0% |
Occupancy by Ownership by Household Size in Ottawa County
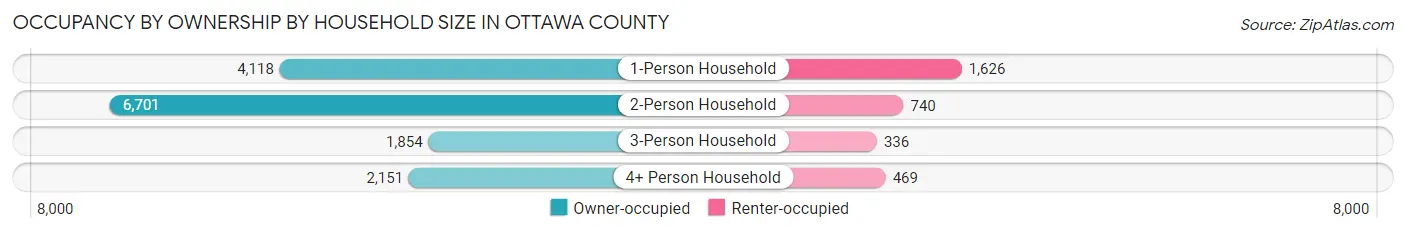
| Household Size | Owner-occupied | Renter-occupied |
| 1-Person Household | 4,118 (71.7%) | 1,626 (28.3%) |
| 2-Person Household | 6,701 (90.1%) | 740 (9.9%) |
| 3-Person Household | 1,854 (84.7%) | 336 (15.3%) |
| 4+ Person Household | 2,151 (82.1%) | 469 (17.9%) |
| Total Housing Units | 14,824 (82.4%) | 3,171 (17.6%) |
Occupancy by Educational Attainment in Ottawa County
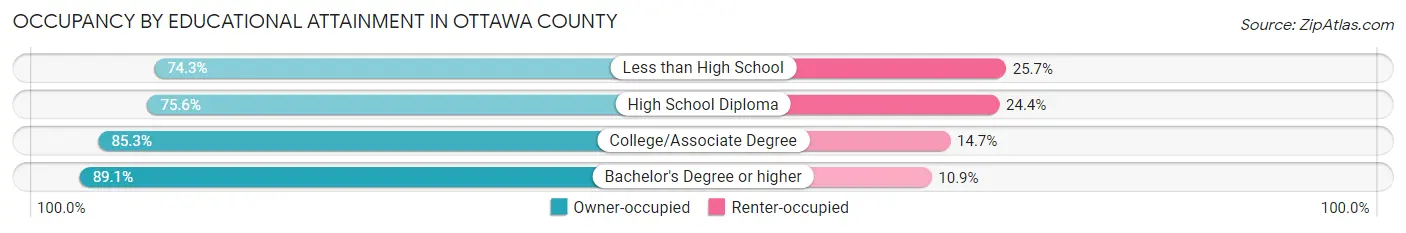
| Household Size | Owner-occupied | Renter-occupied |
| Less than High School | 766 (74.3%) | 265 (25.7%) |
| High School Diploma | 4,720 (75.6%) | 1,521 (24.4%) |
| College/Associate Degree | 4,862 (85.3%) | 835 (14.7%) |
| Bachelor's Degree or higher | 4,476 (89.1%) | 550 (10.9%) |
Occupancy by Age of Householder in Ottawa County
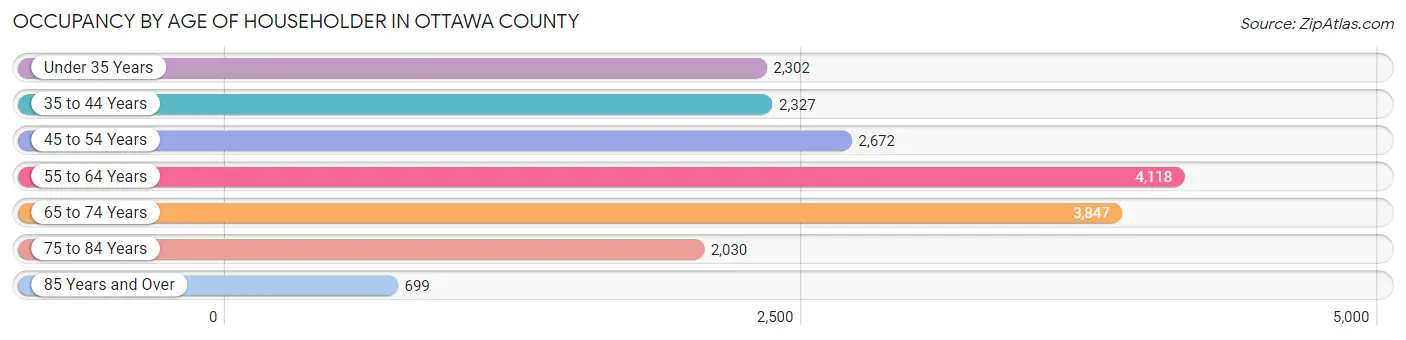
| Age Bracket | # Households | % Households |
| Under 35 Years | 2,302 | 12.8% |
| 35 to 44 Years | 2,327 | 12.9% |
| 45 to 54 Years | 2,672 | 14.8% |
| 55 to 64 Years | 4,118 | 22.9% |
| 65 to 74 Years | 3,847 | 21.4% |
| 75 to 84 Years | 2,030 | 11.3% |
| 85 Years and Over | 699 | 3.9% |
| Total | 17,995 | 100.0% |
Housing Finances in Ottawa County
Median Income by Occupancy in Ottawa County
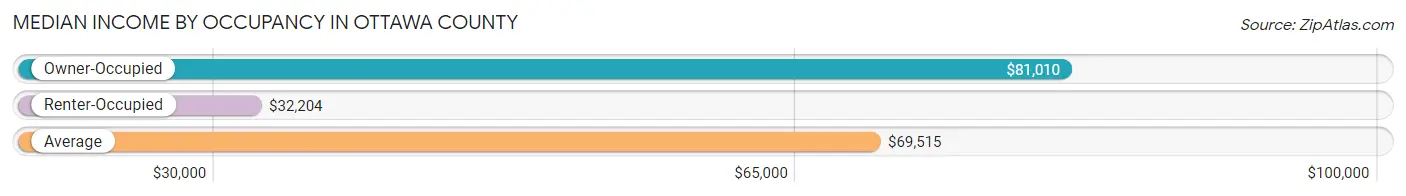
| Occupancy Type | # Households | Median Income |
| Owner-Occupied | 14,824 (82.4%) | $81,010 |
| Renter-Occupied | 3,171 (17.6%) | $32,204 |
| Average | 17,995 (100.0%) | $69,515 |
Occupancy by Householder Income Bracket in Ottawa County

| Income Bracket | Owner-occupied | Renter-occupied |
| Less than $5,000 | 171 (1.1%) | 118 (3.7%) |
| $5,000 to $9,999 | 219 (1.5%) | 87 (2.7%) |
| $10,000 to $14,999 | 162 (1.1%) | 370 (11.7%) |
| $15,000 to $19,999 | 343 (2.3%) | 216 (6.8%) |
| $20,000 to $24,999 | 348 (2.4%) | 382 (12.0%) |
| $25,000 to $34,999 | 1,034 (7.0%) | 458 (14.4%) |
| $35,000 to $49,999 | 1,624 (11.0%) | 535 (16.9%) |
| $50,000 to $74,999 | 2,985 (20.1%) | 479 (15.1%) |
| $75,000 to $99,999 | 2,156 (14.5%) | 251 (7.9%) |
| $100,000 to $149,999 | 3,316 (22.4%) | 159 (5.0%) |
| $150,000 or more | 2,466 (16.6%) | 116 (3.7%) |
| Total | 14,824 (100.0%) | 3,171 (100.0%) |
Monthly Housing Cost Tiers in Ottawa County
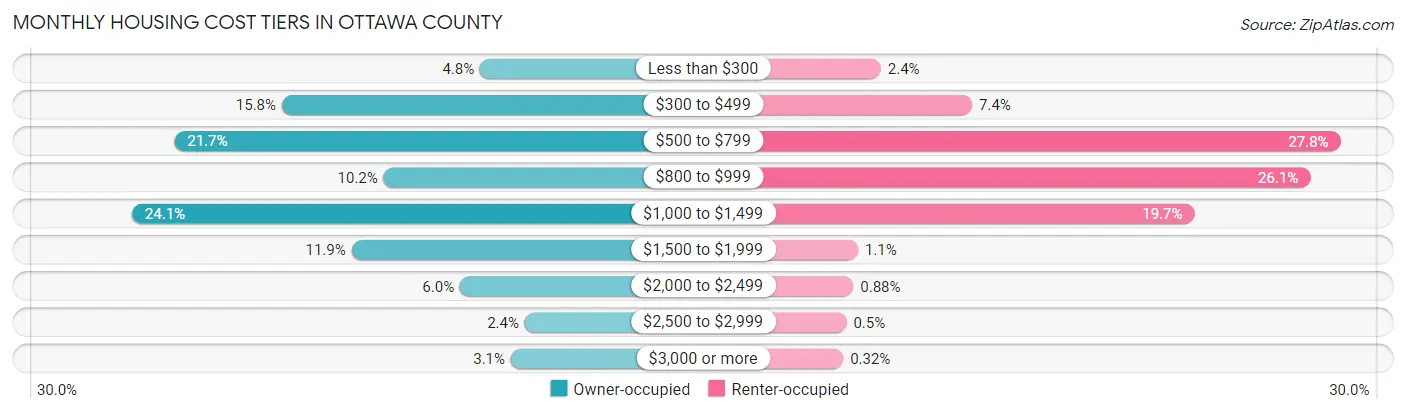
| Monthly Cost | Owner-occupied | Renter-occupied |
| Less than $300 | 718 (4.8%) | 76 (2.4%) |
| $300 to $499 | 2,341 (15.8%) | 236 (7.4%) |
| $500 to $799 | 3,221 (21.7%) | 881 (27.8%) |
| $800 to $999 | 1,507 (10.2%) | 828 (26.1%) |
| $1,000 to $1,499 | 3,568 (24.1%) | 625 (19.7%) |
| $1,500 to $1,999 | 1,770 (11.9%) | 36 (1.1%) |
| $2,000 to $2,499 | 882 (5.9%) | 28 (0.9%) |
| $2,500 to $2,999 | 352 (2.4%) | 16 (0.5%) |
| $3,000 or more | 465 (3.1%) | 10 (0.3%) |
| Total | 14,824 (100.0%) | 3,171 (100.0%) |
Physical Housing Characteristics in Ottawa County
Housing Structures in Ottawa County

| Structure Type | # Housing Units | % Housing Units |
| Single Unit, Detached | 14,541 | 80.8% |
| Single Unit, Attached | 543 | 3.0% |
| 2 Unit Apartments | 528 | 2.9% |
| 3 or 4 Unit Apartments | 314 | 1.7% |
| 5 to 9 Unit Apartments | 410 | 2.3% |
| 10 or more Apartments | 539 | 3.0% |
| Mobile Home / Other | 1,120 | 6.2% |
| Total | 17,995 | 100.0% |
Housing Structures by Occupancy in Ottawa County
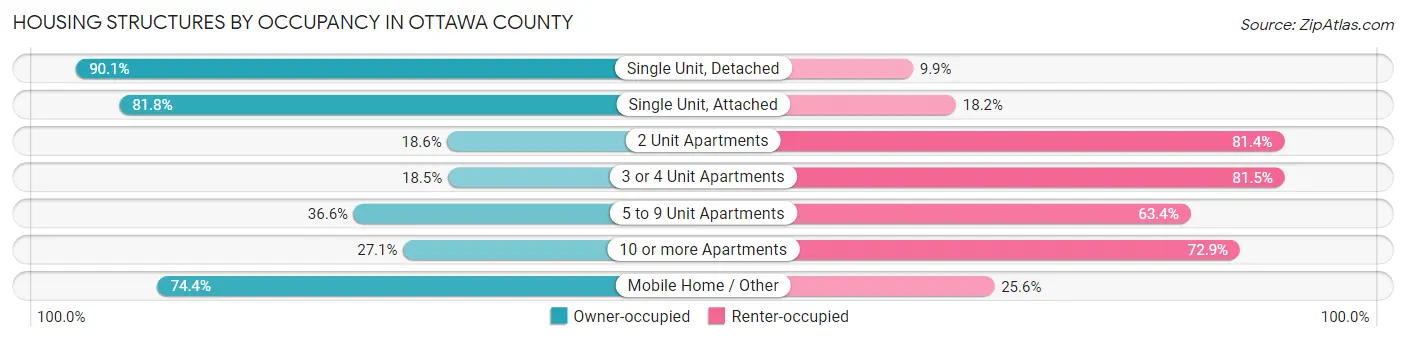
| Structure Type | Owner-occupied | Renter-occupied |
| Single Unit, Detached | 13,095 (90.1%) | 1,446 (9.9%) |
| Single Unit, Attached | 444 (81.8%) | 99 (18.2%) |
| 2 Unit Apartments | 98 (18.6%) | 430 (81.4%) |
| 3 or 4 Unit Apartments | 58 (18.5%) | 256 (81.5%) |
| 5 to 9 Unit Apartments | 150 (36.6%) | 260 (63.4%) |
| 10 or more Apartments | 146 (27.1%) | 393 (72.9%) |
| Mobile Home / Other | 833 (74.4%) | 287 (25.6%) |
| Total | 14,824 (82.4%) | 3,171 (17.6%) |
Housing Structures by Number of Rooms in Ottawa County
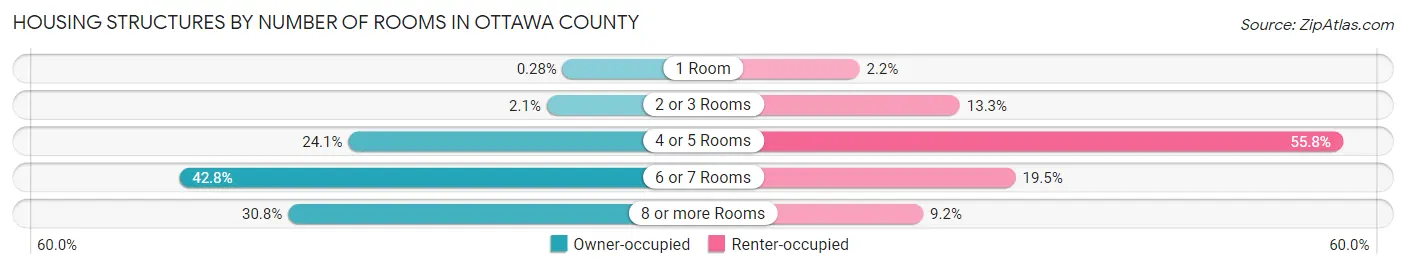
| Number of Rooms | Owner-occupied | Renter-occupied |
| 1 Room | 42 (0.3%) | 69 (2.2%) |
| 2 or 3 Rooms | 304 (2.1%) | 422 (13.3%) |
| 4 or 5 Rooms | 3,569 (24.1%) | 1,769 (55.8%) |
| 6 or 7 Rooms | 6,349 (42.8%) | 618 (19.5%) |
| 8 or more Rooms | 4,560 (30.8%) | 293 (9.2%) |
| Total | 14,824 (100.0%) | 3,171 (100.0%) |
Housing Structure by Heating Type in Ottawa County

| Heating Type | Owner-occupied | Renter-occupied |
| Utility Gas | 8,934 (60.3%) | 1,386 (43.7%) |
| Bottled, Tank, or LP Gas | 2,771 (18.7%) | 321 (10.1%) |
| Electricity | 2,165 (14.6%) | 1,273 (40.2%) |
| Fuel Oil or Kerosene | 281 (1.9%) | 2 (0.1%) |
| Coal or Coke | 0 (0.0%) | 0 (0.0%) |
| All other Fuels | 592 (4.0%) | 179 (5.6%) |
| No Fuel Used | 81 (0.5%) | 10 (0.3%) |
| Total | 14,824 (100.0%) | 3,171 (100.0%) |
Household Vehicle Usage in Ottawa County
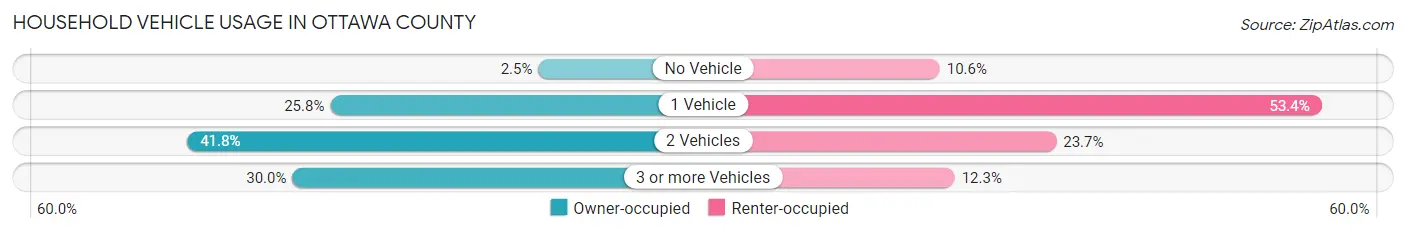
| Vehicles per Household | Owner-occupied | Renter-occupied |
| No Vehicle | 364 (2.5%) | 337 (10.6%) |
| 1 Vehicle | 3,819 (25.8%) | 1,693 (53.4%) |
| 2 Vehicles | 6,193 (41.8%) | 751 (23.7%) |
| 3 or more Vehicles | 4,448 (30.0%) | 390 (12.3%) |
| Total | 14,824 (100.0%) | 3,171 (100.0%) |
Real Estate & Mortgages in Ottawa County
Real Estate and Mortgage Overview in Ottawa County
| Characteristic | Without Mortgage | With Mortgage |
| Housing Units | 6,431 | 8,393 |
| Median Property Value | $172,800 | $182,700 |
| Median Household Income | $63,330 | $1,496 |
| Monthly Housing Costs | $520 | $465 |
| Real Estate Taxes | $1,880 | $184 |
Property Value by Mortgage Status in Ottawa County
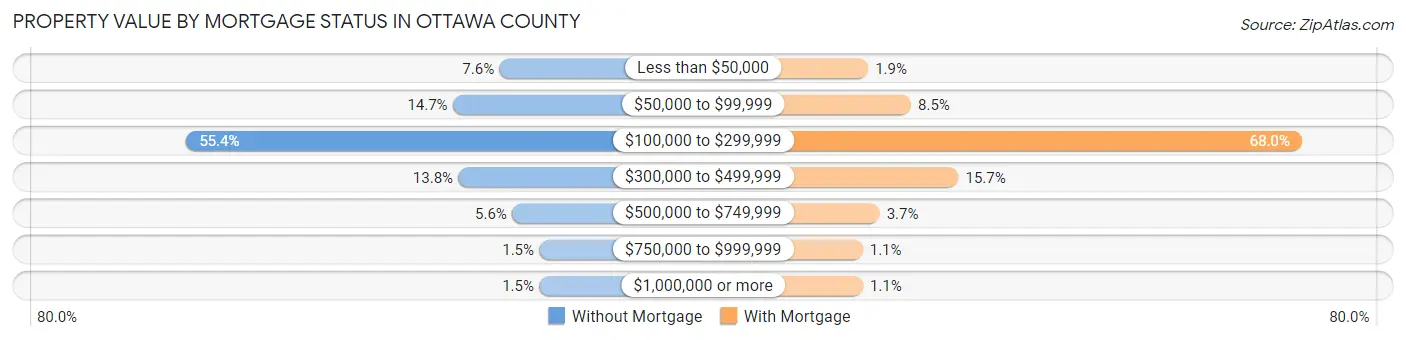
| Property Value | Without Mortgage | With Mortgage |
| Less than $50,000 | 486 (7.6%) | 162 (1.9%) |
| $50,000 to $99,999 | 942 (14.6%) | 710 (8.5%) |
| $100,000 to $299,999 | 3,561 (55.4%) | 5,707 (68.0%) |
| $300,000 to $499,999 | 889 (13.8%) | 1,318 (15.7%) |
| $500,000 to $749,999 | 362 (5.6%) | 309 (3.7%) |
| $750,000 to $999,999 | 95 (1.5%) | 92 (1.1%) |
| $1,000,000 or more | 96 (1.5%) | 95 (1.1%) |
| Total | 6,431 (100.0%) | 8,393 (100.0%) |
Household Income by Mortgage Status in Ottawa County
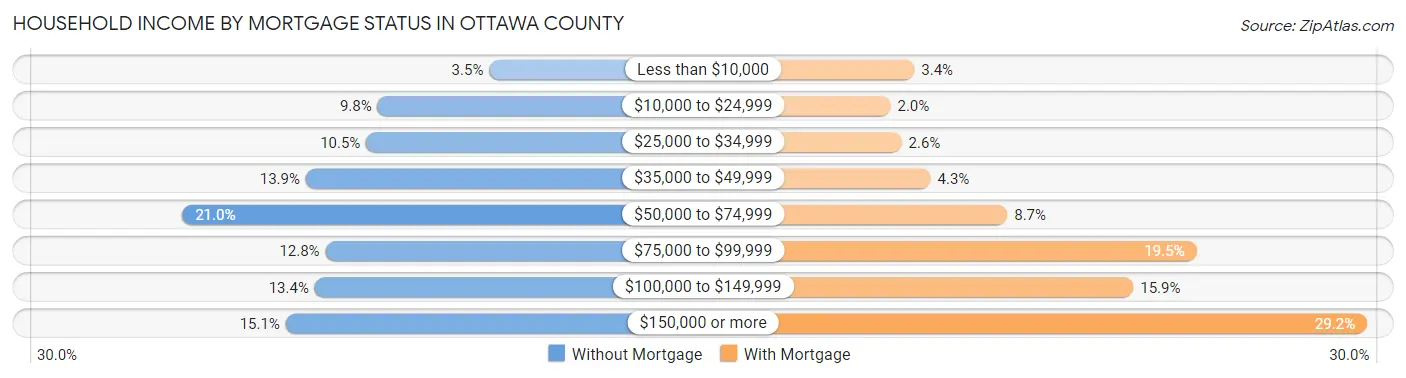
| Household Income | Without Mortgage | With Mortgage |
| Less than $10,000 | 222 (3.5%) | 282 (3.4%) |
| $10,000 to $24,999 | 632 (9.8%) | 168 (2.0%) |
| $25,000 to $34,999 | 674 (10.5%) | 221 (2.6%) |
| $35,000 to $49,999 | 896 (13.9%) | 360 (4.3%) |
| $50,000 to $74,999 | 1,350 (21.0%) | 728 (8.7%) |
| $75,000 to $99,999 | 824 (12.8%) | 1,635 (19.5%) |
| $100,000 to $149,999 | 863 (13.4%) | 1,332 (15.9%) |
| $150,000 or more | 970 (15.1%) | 2,453 (29.2%) |
| Total | 6,431 (100.0%) | 8,393 (100.0%) |
Property Value to Household Income Ratio in Ottawa County
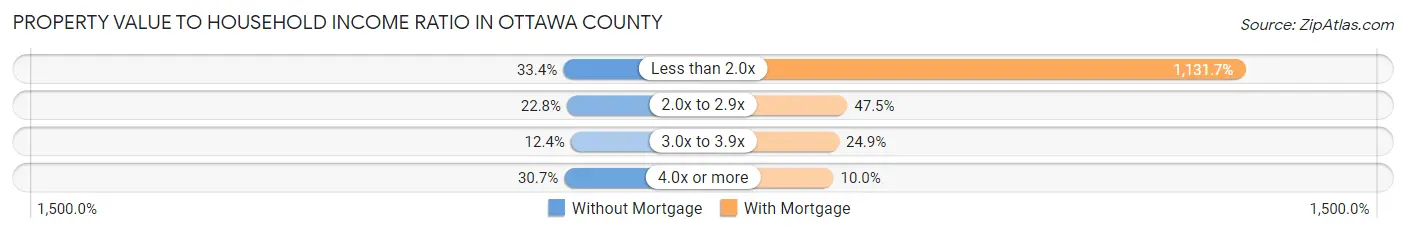
| Value-to-Income Ratio | Without Mortgage | With Mortgage |
| Less than 2.0x | 2,147 (33.4%) | 94,982 (1,131.7%) |
| 2.0x to 2.9x | 1,469 (22.8%) | 3,985 (47.5%) |
| 3.0x to 3.9x | 800 (12.4%) | 2,090 (24.9%) |
| 4.0x or more | 1,972 (30.7%) | 842 (10.0%) |
| Total | 6,431 (100.0%) | 8,393 (100.0%) |
Real Estate Taxes by Mortgage Status in Ottawa County

| Property Taxes | Without Mortgage | With Mortgage |
| Less than $800 | 942 (14.6%) | 12 (0.1%) |
| $800 to $1,499 | 1,362 (21.2%) | 500 (6.0%) |
| $800 to $1,499 | 3,962 (61.6%) | 2,091 (24.9%) |
| Total | 6,431 (100.0%) | 8,393 (100.0%) |
Health & Disability in Ottawa County
Health Insurance Coverage by Age in Ottawa County

| Age Bracket | With Coverage | Without Coverage |
| Under 6 Years | 1,941 (96.2%) | 77 (3.8%) |
| 6 to 18 Years | 5,506 (96.8%) | 180 (3.2%) |
| 19 to 25 Years | 2,146 (93.5%) | 150 (6.5%) |
| 26 to 34 Years | 3,437 (91.4%) | 325 (8.6%) |
| 35 to 44 Years | 3,960 (94.6%) | 225 (5.4%) |
| 45 to 54 Years | 4,564 (92.5%) | 369 (7.5%) |
| 55 to 64 Years | 6,379 (93.6%) | 438 (6.4%) |
| 65 to 74 Years | 6,154 (99.6%) | 25 (0.4%) |
| 75 Years and older | 4,025 (100.0%) | 0 (0.0%) |
| Total | 38,112 (95.5%) | 1,789 (4.5%) |
Health Insurance Coverage by Citizenship Status in Ottawa County
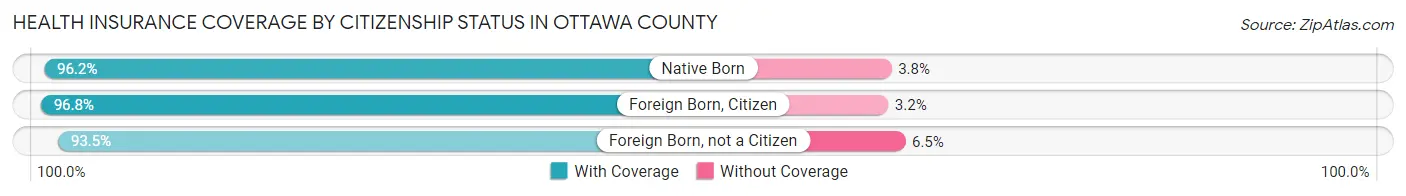
| Citizenship Status | With Coverage | Without Coverage |
| Native Born | 1,941 (96.2%) | 77 (3.8%) |
| Foreign Born, Citizen | 5,506 (96.8%) | 180 (3.2%) |
| Foreign Born, not a Citizen | 2,146 (93.5%) | 150 (6.5%) |
Health Insurance Coverage by Household Income in Ottawa County
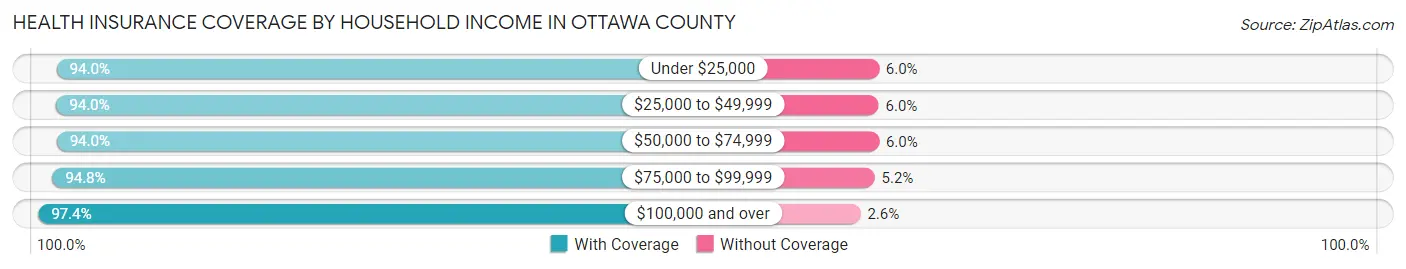
| Household Income | With Coverage | Without Coverage |
| Under $25,000 | 3,349 (94.0%) | 214 (6.0%) |
| $25,000 to $49,999 | 5,712 (94.0%) | 362 (6.0%) |
| $50,000 to $74,999 | 6,557 (94.0%) | 420 (6.0%) |
| $75,000 to $99,999 | 5,545 (94.8%) | 305 (5.2%) |
| $100,000 and over | 16,741 (97.4%) | 440 (2.6%) |
Public vs Private Health Insurance Coverage by Age in Ottawa County
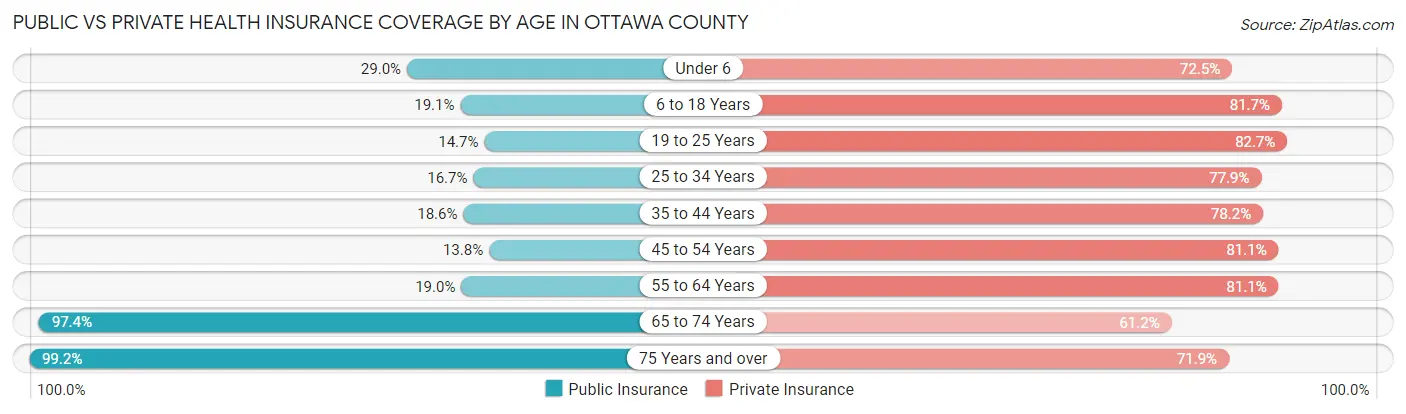
| Age Bracket | Public Insurance | Private Insurance |
| Under 6 | 586 (29.0%) | 1,462 (72.5%) |
| 6 to 18 Years | 1,087 (19.1%) | 4,644 (81.7%) |
| 19 to 25 Years | 337 (14.7%) | 1,898 (82.7%) |
| 25 to 34 Years | 629 (16.7%) | 2,929 (77.9%) |
| 35 to 44 Years | 777 (18.6%) | 3,272 (78.2%) |
| 45 to 54 Years | 681 (13.8%) | 3,998 (81.0%) |
| 55 to 64 Years | 1,292 (19.0%) | 5,527 (81.1%) |
| 65 to 74 Years | 6,015 (97.4%) | 3,781 (61.2%) |
| 75 Years and over | 3,992 (99.2%) | 2,892 (71.9%) |
| Total | 15,396 (38.6%) | 30,403 (76.2%) |
Disability Status by Sex by Age in Ottawa County
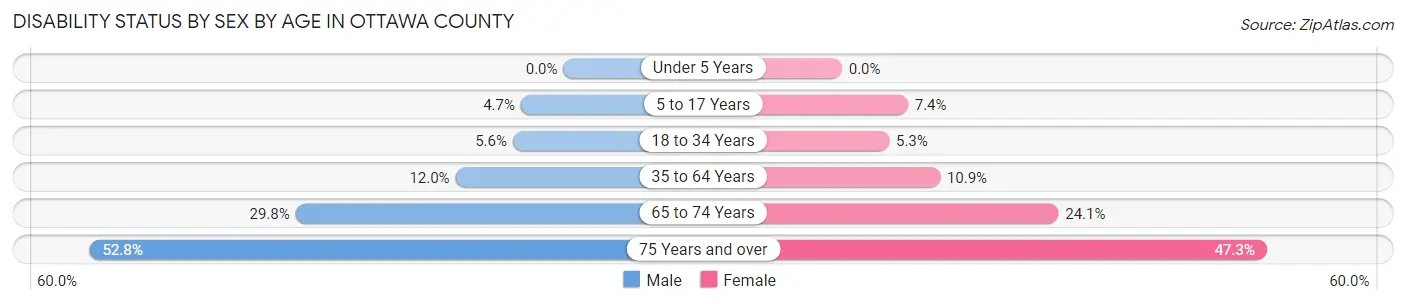
| Age Bracket | Male | Female |
| Under 5 Years | 0 (0.0%) | 0 (0.0%) |
| 5 to 17 Years | 132 (4.7%) | 211 (7.3%) |
| 18 to 34 Years | 193 (5.6%) | 165 (5.3%) |
| 35 to 64 Years | 972 (12.0%) | 858 (10.9%) |
| 65 to 74 Years | 929 (29.8%) | 739 (24.1%) |
| 75 Years and over | 1,001 (52.8%) | 1,007 (47.3%) |
Disability Class by Sex by Age in Ottawa County
Disability Class: Hearing Difficulty
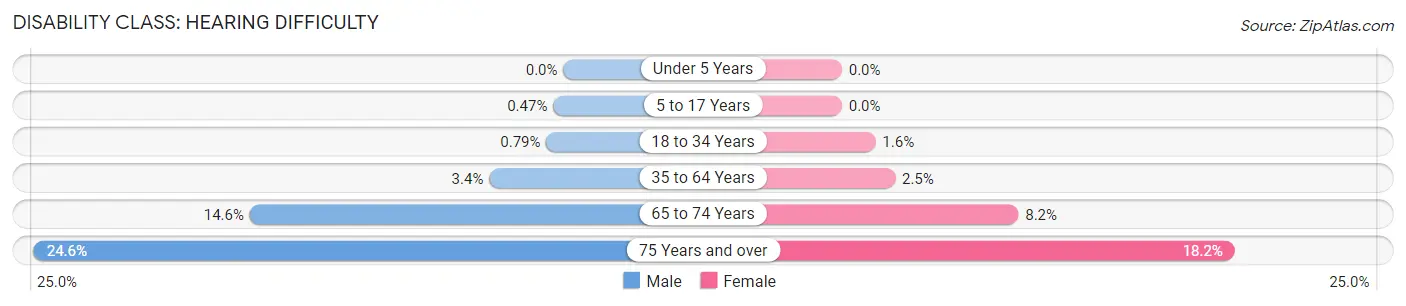
| Age Bracket | Male | Female |
| Under 5 Years | 0 (0.0%) | 0 (0.0%) |
| 5 to 17 Years | 13 (0.5%) | 0 (0.0%) |
| 18 to 34 Years | 27 (0.8%) | 49 (1.6%) |
| 35 to 64 Years | 278 (3.4%) | 194 (2.5%) |
| 65 to 74 Years | 453 (14.5%) | 251 (8.2%) |
| 75 Years and over | 466 (24.6%) | 388 (18.2%) |
Disability Class: Vision Difficulty
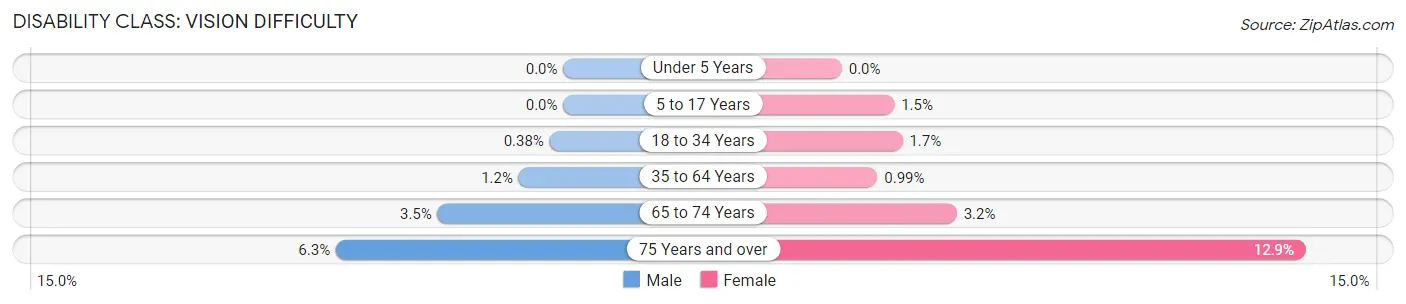
| Age Bracket | Male | Female |
| Under 5 Years | 0 (0.0%) | 0 (0.0%) |
| 5 to 17 Years | 0 (0.0%) | 42 (1.5%) |
| 18 to 34 Years | 13 (0.4%) | 53 (1.7%) |
| 35 to 64 Years | 100 (1.2%) | 78 (1.0%) |
| 65 to 74 Years | 109 (3.5%) | 98 (3.2%) |
| 75 Years and over | 120 (6.3%) | 275 (12.9%) |
Disability Class: Cognitive Difficulty
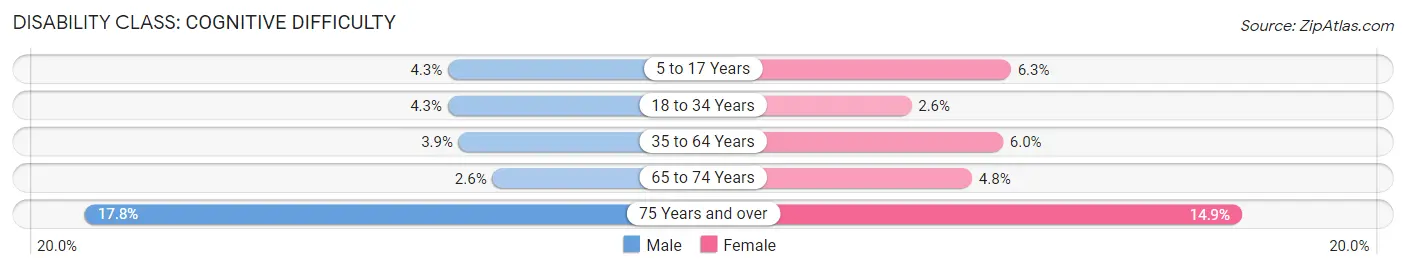
| Age Bracket | Male | Female |
| 5 to 17 Years | 119 (4.3%) | 180 (6.3%) |
| 18 to 34 Years | 147 (4.3%) | 81 (2.6%) |
| 35 to 64 Years | 314 (3.9%) | 469 (6.0%) |
| 65 to 74 Years | 82 (2.6%) | 148 (4.8%) |
| 75 Years and over | 337 (17.8%) | 316 (14.8%) |
Disability Class: Ambulatory Difficulty
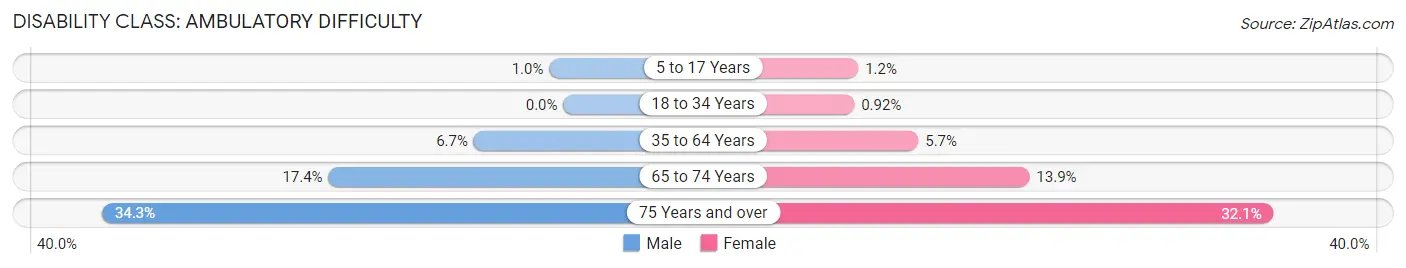
| Age Bracket | Male | Female |
| 5 to 17 Years | 29 (1.0%) | 35 (1.2%) |
| 18 to 34 Years | 0 (0.0%) | 29 (0.9%) |
| 35 to 64 Years | 538 (6.7%) | 446 (5.7%) |
| 65 to 74 Years | 543 (17.4%) | 427 (13.9%) |
| 75 Years and over | 650 (34.3%) | 682 (32.1%) |
Disability Class: Self-Care Difficulty

| Age Bracket | Male | Female |
| 5 to 17 Years | 63 (2.3%) | 83 (2.9%) |
| 18 to 34 Years | 0 (0.0%) | 14 (0.4%) |
| 35 to 64 Years | 148 (1.8%) | 171 (2.2%) |
| 65 to 74 Years | 144 (4.6%) | 127 (4.1%) |
| 75 Years and over | 330 (17.4%) | 390 (18.3%) |
Technology Access in Ottawa County
Computing Device Access in Ottawa County
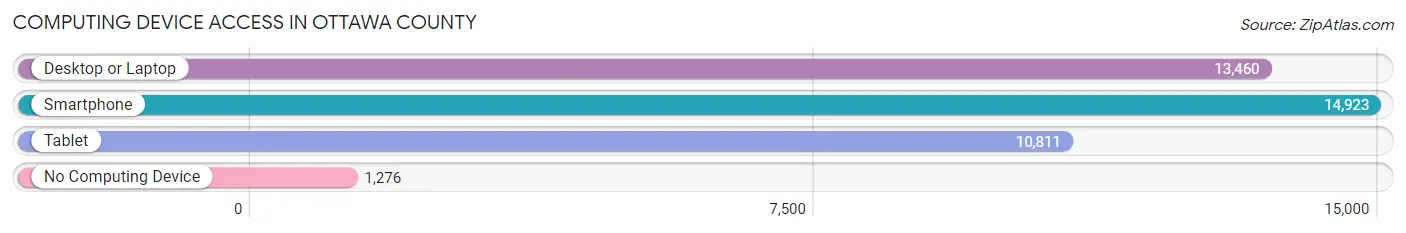
| Device Type | # Households | % Households |
| Desktop or Laptop | 13,460 | 74.8% |
| Smartphone | 14,923 | 82.9% |
| Tablet | 10,811 | 60.1% |
| No Computing Device | 1,276 | 7.1% |
| Total | 17,995 | 100.0% |
Internet Access in Ottawa County
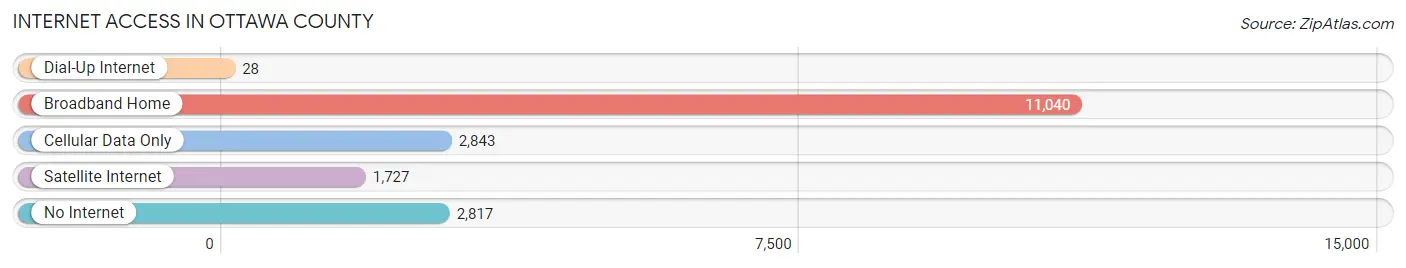
| Internet Type | # Households | % Households |
| Dial-Up Internet | 28 | 0.2% |
| Broadband Home | 11,040 | 61.4% |
| Cellular Data Only | 2,843 | 15.8% |
| Satellite Internet | 1,727 | 9.6% |
| No Internet | 2,817 | 15.7% |
| Total | 17,995 | 100.0% |
Ottawa County Summary
Ottawa County is located in the northwest corner of the state of Ohio, along the shores of Lake Erie. It is bordered by Lucas County to the east, Erie County to the north, and Sandusky County to the west. The county seat is Port Clinton, and the largest city is Oak Harbor. The county was established in 1840 and named after the Ottawa tribe of Native Americans who once inhabited the area.
Geography
Ottawa County covers an area of approximately 545 square miles and is home to a variety of landscapes. The northern part of the county is mostly flat, with some rolling hills and small lakes. The southern part of the county is more hilly and is home to the Ottawa National Wildlife Refuge. The county is also home to several state parks, including East Harbor State Park, Magee Marsh Wildlife Area, and Marblehead Lighthouse State Park.
The county is home to several rivers, including the Portage, Maumee, and Sandusky Rivers. The Portage River flows through the county from east to west, and is a popular destination for fishing and boating. The Maumee River flows through the county from north to south, and is a popular destination for kayaking and canoeing. The Sandusky River flows through the county from west to east, and is a popular destination for fishing and swimming.
Economy
The economy of Ottawa County is largely based on agriculture, manufacturing, and tourism. The county is home to several large agricultural operations, including dairy farms, vegetable farms, and fruit orchards. The county is also home to several manufacturing companies, including automotive parts manufacturers, food processing plants, and furniture makers.
Tourism is also an important part of the county’s economy. The county is home to several popular tourist attractions, including the Marblehead Lighthouse State Park, the Ottawa National Wildlife Refuge, and the Port Clinton Lighthouse. The county is also home to several popular festivals, including the Port Clinton Fish Festival and the Oak Harbor Apple Festival.
Demographics
As of the 2010 census, the population of Ottawa County was 41,428. The population is largely white (93.3%), with small percentages of African American (2.3%), Asian (1.2%), and Hispanic or Latino (1.2%) residents. The median household income in the county is $50,945, and the median home value is $133,400.
The county is home to several educational institutions, including the University of Toledo, Bowling Green State University, and Owens Community College. The county is also home to several public school districts, including the Port Clinton City School District, the Oak Harbor Local School District, and the Benton-Carroll-Salem Local School District.
Conclusion
Ottawa County is a diverse and vibrant county located in the northwest corner of Ohio. The county is home to a variety of landscapes, from flat farmland to rolling hills and small lakes. The economy of the county is largely based on agriculture, manufacturing, and tourism. The population of the county is largely white, with small percentages of African American, Asian, and Hispanic or Latino residents. The county is home to several educational institutions and public school districts, and is a popular destination for fishing, boating, kayaking, and canoeing.
Common Questions
What is the Total Population of Ottawa County?
Total Population of Ottawa County is 40,367.
What is the Total Male Population of Ottawa County?
Total Male Population of Ottawa County is 20,275.
What is the Total Female Population of Ottawa County?
Total Female Population of Ottawa County is 20,092.
What is the Ratio of Males per 100 Females in Ottawa County?
There are 100.91 Males per 100 Females in Ottawa County.
What is the Ratio of Females per 100 Males in Ottawa County?
There are 99.10 Females per 100 Males in Ottawa County.
What is the Median Population Age in Ottawa County?
Median Population Age in Ottawa County is 49.8 Years.
What is the Average Family Size in Ottawa County
Average Family Size in Ottawa County is 2.7 People.
What is the Average Household Size in Ottawa County
Average Household Size in Ottawa County is 2.2 People.
What is Per Capita Income in Ottawa County?
Per Capita income in Ottawa County is $44,479.
What is the Median Family Income in Ottawa County?
Median Family Income in Ottawa County is $92,054.
What is the Median Household income in Ottawa County?
Median Household Income in Ottawa County is $69,515.
What is Income or Wage Gap in Ottawa County?
Income or Wage Gap in Ottawa County is 42.1%.
Women in Ottawa County earn 57.9 cents for every dollar earned by a man.
What is Family Income Deficit in Ottawa County?
Family Income Deficit in Ottawa County is $8,916.
Families that are below poverty line in Ottawa County earn $8,916 less on average than the poverty threshold level.
What is Inequality or Gini Index in Ottawa County?
Inequality or Gini Index in Ottawa County is 0.47.
How Large is the Labor Force in Ottawa County?
There are 19,724 People in the Labor Forcein in Ottawa County.
What is the Percentage of People in the Labor Force in Ottawa County?
57.7% of People are in the Labor Force in Ottawa County.
What is the Unemployment Rate in Ottawa County?
Unemployment Rate in Ottawa County is 3.4%.