Muskingum County, OH
Muskingum County Map

Muskingum County Overview
86,393
TOTAL POPULATION
42,320
MALE POPULATION
44,073
FEMALE POPULATION
96.02
MALES / 100 FEMALES
104.14
FEMALES / 100 MALES
40.5
MEDIAN AGE
3.0
AVG FAMILY SIZE
2.4
AVG HOUSEHOLD SIZE
$31,436
PER CAPITA INCOME
$71,728
AVG FAMILY INCOME
$56,810
AVG HOUSEHOLD INCOME
28.9%
WAGE / INCOME GAP [ % ]
71.1¢/ $1
WAGE / INCOME GAP [ $ ]
$10,473
FAMILY INCOME DEFICIT
0.46
INEQUALITY / GINI INDEX
41,487
LABOR FORCE [ PEOPLE ]
60.2%
PERCENT IN LABOR FORCE
4.6%
UNEMPLOYMENT RATE
Muskingum County Area Codes
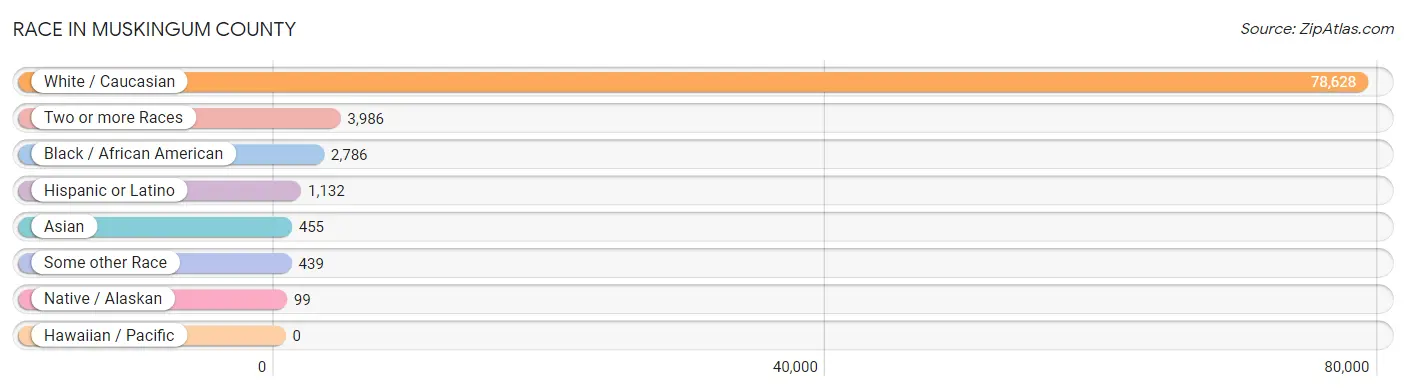
Race in Muskingum County
The most populous races in Muskingum County are White / Caucasian (78,628 | 91.0%), Two or more Races (3,986 | 4.6%), and Black / African American (2,786 | 3.2%).
| Race | # Population | % Population |
| Asian | 455 | 0.5% |
| Black / African American | 2,786 | 3.2% |
| Hawaiian / Pacific | 0 | 0.0% |
| Hispanic or Latino | 1,132 | 1.3% |
| Native / Alaskan | 99 | 0.1% |
| White / Caucasian | 78,628 | 91.0% |
| Two or more Races | 3,986 | 4.6% |
| Some other Race | 439 | 0.5% |
| Total | 86,393 | 100.0% |
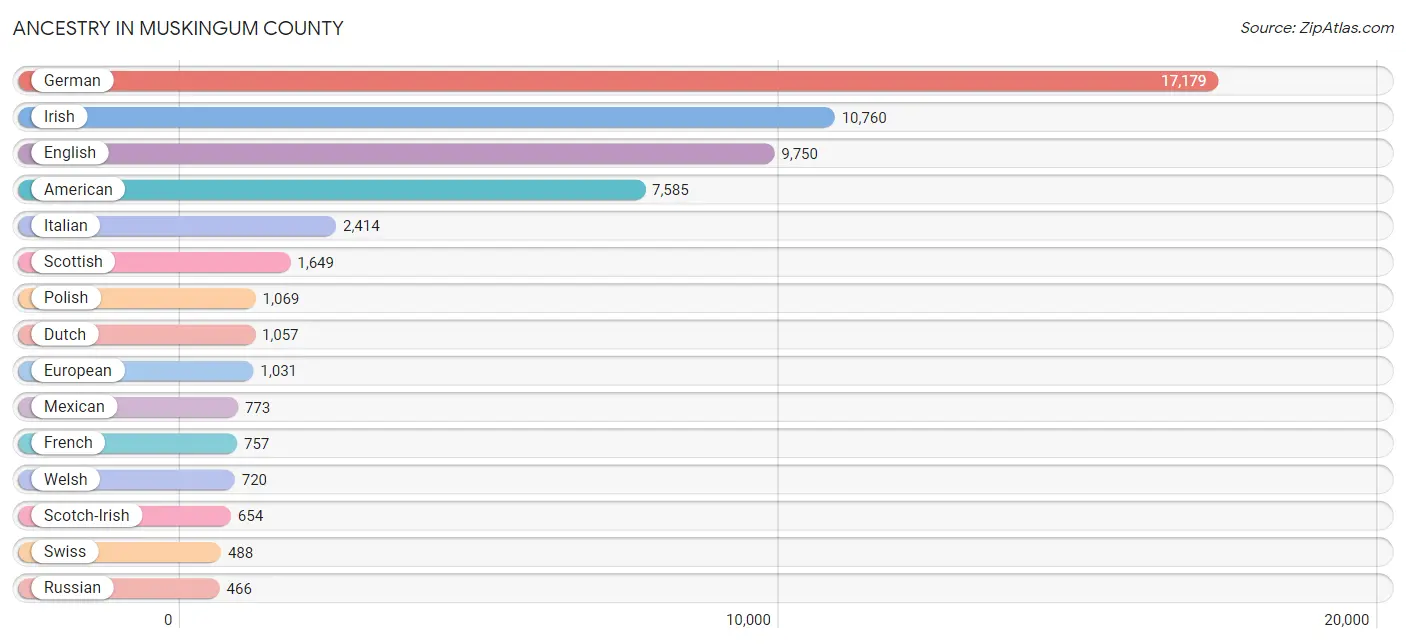
Ancestry in Muskingum County
The most populous ancestries reported in Muskingum County are German (17,179 | 19.9%), Irish (10,760 | 12.4%), English (9,750 | 11.3%), American (7,585 | 8.8%), and Italian (2,414 | 2.8%), together accounting for 55.2% of all Muskingum County residents.
| Ancestry | # Population | % Population |
| African | 50 | 0.1% |
| American | 7,585 | 8.8% |
| Apache | 13 | 0.0% |
| Arab | 450 | 0.5% |
| Austrian | 32 | 0.0% |
| Belgian | 22 | 0.0% |
| Bhutanese | 35 | 0.0% |
| Blackfeet | 199 | 0.2% |
| Brazilian | 13 | 0.0% |
| British | 383 | 0.4% |
| Burmese | 22 | 0.0% |
| Canadian | 20 | 0.0% |
| Celtic | 17 | 0.0% |
| Central American | 11 | 0.0% |
| Cherokee | 165 | 0.2% |
| Choctaw | 32 | 0.0% |
| Colombian | 27 | 0.0% |
| Croatian | 15 | 0.0% |
| Crow | 13 | 0.0% |
| Cuban | 23 | 0.0% |
| Czech | 140 | 0.2% |
| Czechoslovakian | 64 | 0.1% |
| Danish | 42 | 0.1% |
| Delaware | 23 | 0.0% |
| Dutch | 1,057 | 1.2% |
| Eastern European | 265 | 0.3% |
| English | 9,750 | 11.3% |
| European | 1,031 | 1.2% |
| Finnish | 2 | 0.0% |
| French | 757 | 0.9% |
| French Canadian | 79 | 0.1% |
| German | 17,179 | 19.9% |
| Greek | 240 | 0.3% |
| Guamanian / Chamorro | 42 | 0.1% |
| Haitian | 18 | 0.0% |
| Hungarian | 252 | 0.3% |
| Indian (Asian) | 307 | 0.4% |
| Iranian | 24 | 0.0% |
| Irish | 10,760 | 12.4% |
| Italian | 2,414 | 2.8% |
| Jamaican | 15 | 0.0% |
| Korean | 206 | 0.2% |
| Latvian | 5 | 0.0% |
| Lebanese | 418 | 0.5% |
| Lithuanian | 291 | 0.3% |
| Lumbee | 4 | 0.0% |
| Malaysian | 112 | 0.1% |
| Mexican | 773 | 0.9% |
| Moroccan | 24 | 0.0% |
| Native Hawaiian | 57 | 0.1% |
| Nicaraguan | 4 | 0.0% |
| Nigerian | 7 | 0.0% |
| Northern European | 66 | 0.1% |
| Norwegian | 218 | 0.3% |
| Panamanian | 7 | 0.0% |
| Pennsylvania German | 11 | 0.0% |
| Peruvian | 102 | 0.1% |
| Polish | 1,069 | 1.2% |
| Portuguese | 46 | 0.1% |
| Puerto Rican | 179 | 0.2% |
| Romanian | 31 | 0.0% |
| Russian | 466 | 0.5% |
| Scandinavian | 193 | 0.2% |
| Scotch-Irish | 654 | 0.8% |
| Scottish | 1,649 | 1.9% |
| Sioux | 2 | 0.0% |
| Slavic | 5 | 0.0% |
| Slovak | 265 | 0.3% |
| Slovene | 16 | 0.0% |
| South American | 129 | 0.2% |
| Spanish | 10 | 0.0% |
| Sri Lankan | 1 | 0.0% |
| Subsaharan African | 57 | 0.1% |
| Swedish | 248 | 0.3% |
| Swiss | 488 | 0.6% |
| Syrian | 8 | 0.0% |
| Thai | 52 | 0.1% |
| Turkish | 11 | 0.0% |
| Ukrainian | 86 | 0.1% |
| Welsh | 720 | 0.8% | View All 80 Rows |
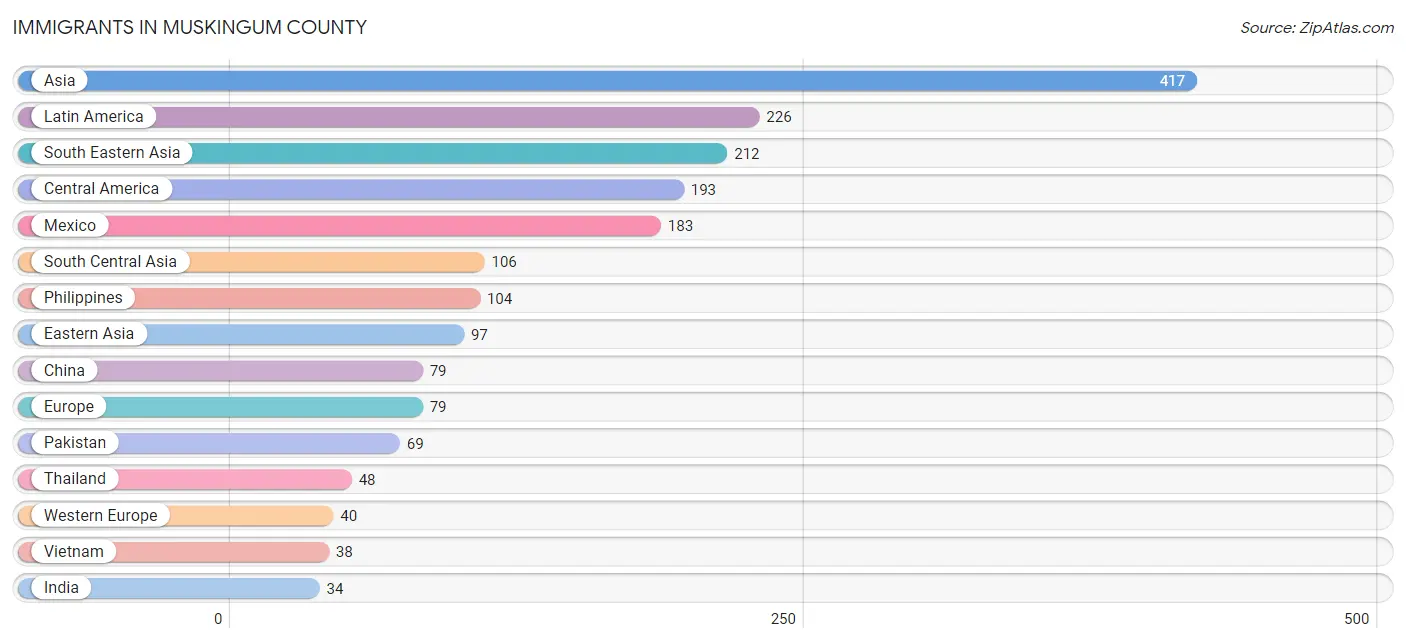
Immigrants in Muskingum County
The most numerous immigrant groups reported in Muskingum County came from Asia (417 | 0.5%), Latin America (226 | 0.3%), South Eastern Asia (212 | 0.3%), Central America (193 | 0.2%), and Mexico (183 | 0.2%), together accounting for 1.4% of all Muskingum County residents.
| Immigration Origin | # Population | % Population |
| Africa | 11 | 0.0% |
| Asia | 417 | 0.5% |
| Brazil | 33 | 0.0% |
| Canada | 23 | 0.0% |
| Central America | 193 | 0.2% |
| China | 79 | 0.1% |
| Eastern Asia | 97 | 0.1% |
| Eastern Europe | 9 | 0.0% |
| Europe | 79 | 0.1% |
| France | 12 | 0.0% |
| Germany | 9 | 0.0% |
| Greece | 4 | 0.0% |
| Honduras | 10 | 0.0% |
| Hungary | 9 | 0.0% |
| India | 34 | 0.0% |
| Japan | 18 | 0.0% |
| Laos | 22 | 0.0% |
| Latin America | 226 | 0.3% |
| Mexico | 183 | 0.2% |
| Morocco | 9 | 0.0% |
| Netherlands | 19 | 0.0% |
| Northern Africa | 9 | 0.0% |
| Northern Europe | 26 | 0.0% |
| Pakistan | 69 | 0.1% |
| Philippines | 104 | 0.1% |
| South Africa | 2 | 0.0% |
| South America | 33 | 0.0% |
| South Central Asia | 106 | 0.1% |
| South Eastern Asia | 212 | 0.3% |
| Southern Europe | 4 | 0.0% |
| Sri Lanka | 3 | 0.0% |
| Sweden | 26 | 0.0% |
| Taiwan | 3 | 0.0% |
| Thailand | 48 | 0.1% |
| Vietnam | 38 | 0.0% |
| Western Asia | 2 | 0.0% |
| Western Europe | 40 | 0.1% | View All 37 Rows |
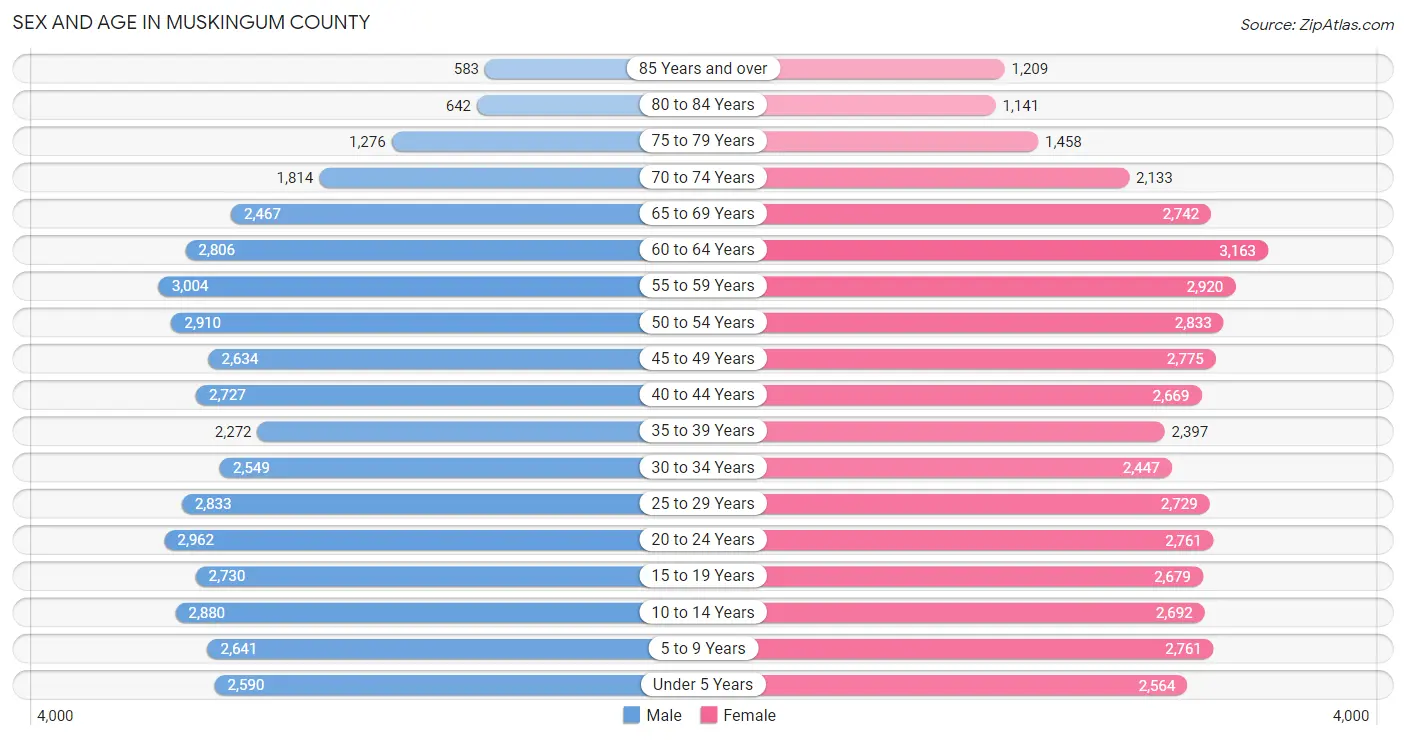
Sex and Age in Muskingum County
Sex and Age in Muskingum County
The most populous age groups in Muskingum County are 55 to 59 Years (3,004 | 7.1%) for men and 60 to 64 Years (3,163 | 7.2%) for women.
| Age Bracket | Male | Female |
| Under 5 Years | 2,590 (6.1%) | 2,564 (5.8%) |
| 5 to 9 Years | 2,641 (6.2%) | 2,761 (6.3%) |
| 10 to 14 Years | 2,880 (6.8%) | 2,692 (6.1%) |
| 15 to 19 Years | 2,730 (6.5%) | 2,679 (6.1%) |
| 20 to 24 Years | 2,962 (7.0%) | 2,761 (6.3%) |
| 25 to 29 Years | 2,833 (6.7%) | 2,729 (6.2%) |
| 30 to 34 Years | 2,549 (6.0%) | 2,447 (5.6%) |
| 35 to 39 Years | 2,272 (5.4%) | 2,397 (5.4%) |
| 40 to 44 Years | 2,727 (6.4%) | 2,669 (6.1%) |
| 45 to 49 Years | 2,634 (6.2%) | 2,775 (6.3%) |
| 50 to 54 Years | 2,910 (6.9%) | 2,833 (6.4%) |
| 55 to 59 Years | 3,004 (7.1%) | 2,920 (6.6%) |
| 60 to 64 Years | 2,806 (6.6%) | 3,163 (7.2%) |
| 65 to 69 Years | 2,467 (5.8%) | 2,742 (6.2%) |
| 70 to 74 Years | 1,814 (4.3%) | 2,133 (4.8%) |
| 75 to 79 Years | 1,276 (3.0%) | 1,458 (3.3%) |
| 80 to 84 Years | 642 (1.5%) | 1,141 (2.6%) |
| 85 Years and over | 583 (1.4%) | 1,209 (2.7%) |
| Total | 42,320 (100.0%) | 44,073 (100.0%) |
Families and Households in Muskingum County
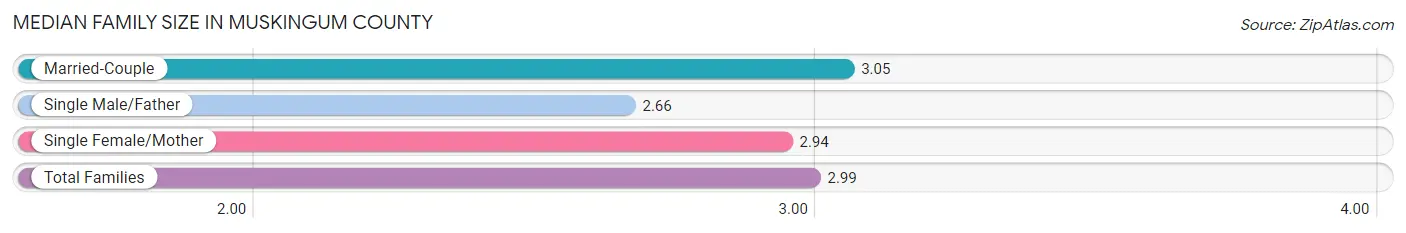
Median Family Size in Muskingum County
The median family size in Muskingum County is 2.99 persons per family, with married-couple families (15,215 | 68.6%) accounting for the largest median family size of 3.05 persons per family. On the other hand, single male/father families (2,167 | 9.8%) represent the smallest median family size with 2.66 persons per family.
| Family Type | # Families | Family Size |
| Married-Couple | 15,215 (68.6%) | 3.05 |
| Single Male/Father | 2,167 (9.8%) | 2.66 |
| Single Female/Mother | 4,807 (21.7%) | 2.94 |
| Total Families | 22,189 (100.0%) | 2.99 |
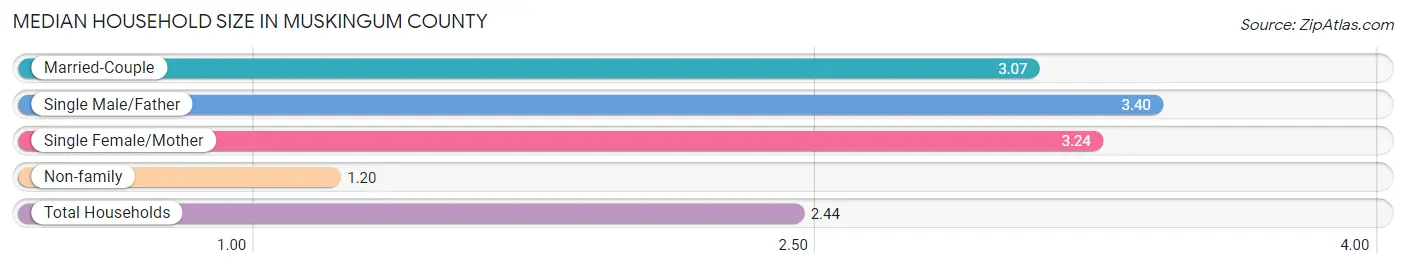
Median Household Size in Muskingum County
The median household size in Muskingum County is 2.44 persons per household, with single male/father households (2,167 | 6.3%) accounting for the largest median household size of 3.4 persons per household. non-family households (12,410 | 35.9%) represent the smallest median household size with 1.20 persons per household.
| Household Type | # Households | Household Size |
| Married-Couple | 15,215 (44.0%) | 3.07 |
| Single Male/Father | 2,167 (6.3%) | 3.40 |
| Single Female/Mother | 4,807 (13.9%) | 3.24 |
| Non-family | 12,410 (35.9%) | 1.20 |
| Total Households | 34,599 (100.0%) | 2.44 |
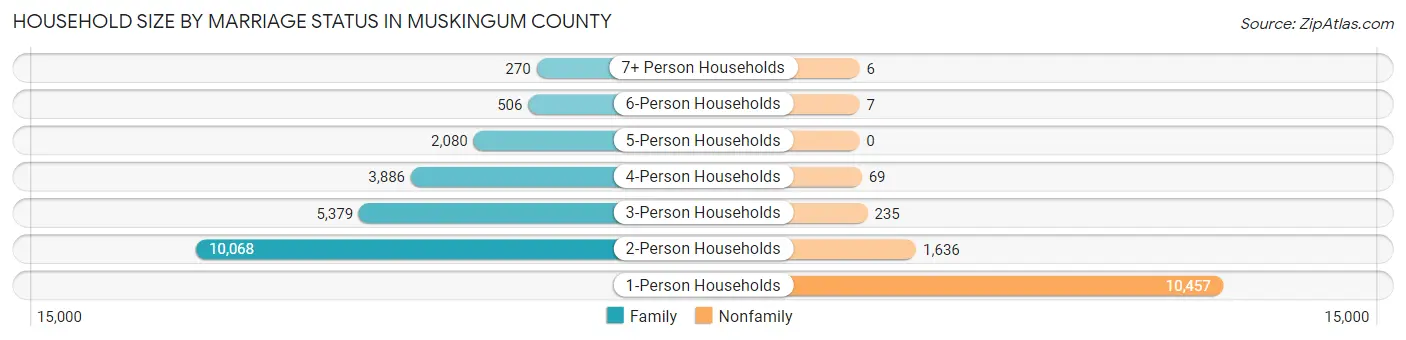
Household Size by Marriage Status in Muskingum County
Out of a total of 34,599 households in Muskingum County, 22,189 (64.1%) are family households, while 12,410 (35.9%) are nonfamily households. The most numerous type of family households are 2-person households, comprising 10,068, and the most common type of nonfamily households are 1-person households, comprising 10,457.
| Household Size | Family Households | Nonfamily Households |
| 1-Person Households | - | 10,457 (30.2%) |
| 2-Person Households | 10,068 (29.1%) | 1,636 (4.7%) |
| 3-Person Households | 5,379 (15.5%) | 235 (0.7%) |
| 4-Person Households | 3,886 (11.2%) | 69 (0.2%) |
| 5-Person Households | 2,080 (6.0%) | 0 (0.0%) |
| 6-Person Households | 506 (1.5%) | 7 (0.0%) |
| 7+ Person Households | 270 (0.8%) | 6 (0.0%) |
| Total | 22,189 (64.1%) | 12,410 (35.9%) |
Female Fertility in Muskingum County
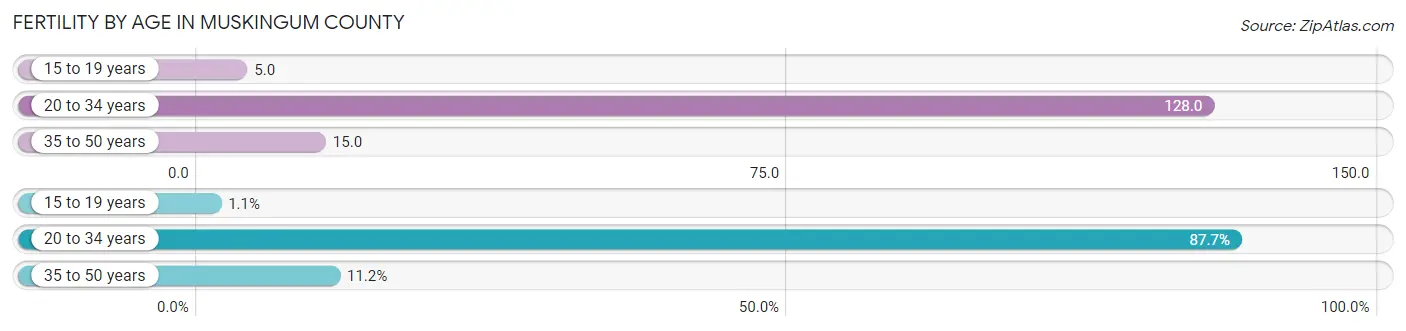
Fertility by Age in Muskingum County
Average fertility rate in Muskingum County is 61.0 births per 1,000 women. Women in the age bracket of 20 to 34 years have the highest fertility rate with 128.0 births per 1,000 women. Women in the age bracket of 20 to 34 years acount for 87.7% of all women with births.
| Age Bracket | Women with Births | Births / 1,000 Women |
| 15 to 19 years | 13 (1.1%) | 5.0 |
| 20 to 34 years | 1,018 (87.7%) | 128.0 |
| 35 to 50 years | 130 (11.2%) | 15.0 |
| Total | 1,161 (100.0%) | 61.0 |
Fertility by Age by Marriage Status in Muskingum County
49.0% of women with births (1,161) in Muskingum County are married. The highest percentage of unmarried women with births falls into 15 to 19 years age bracket with 100.0% of them unmarried at the time of birth, while the lowest percentage of unmarried women with births belong to 35 to 50 years age bracket with 28.5% of them unmarried.

| Age Bracket | Married | Unmarried |
| 15 to 19 years | 0 (0.0%) | 13 (100.0%) |
| 20 to 34 years | 476 (46.8%) | 542 (53.2%) |
| 35 to 50 years | 93 (71.5%) | 37 (28.5%) |
| Total | 569 (49.0%) | 592 (51.0%) |
Fertility by Education in Muskingum County
Average fertility rate in Muskingum County is 61.0 births per 1,000 women. Women with the education attainment of high school diploma have the highest fertility rate of 101.0 births per 1,000 women, while women with the education attainment of graduate degree have the lowest fertility at 4.0 births per 1,000 women. Women with the education attainment of high school diploma represent 50.6% of all women with births.
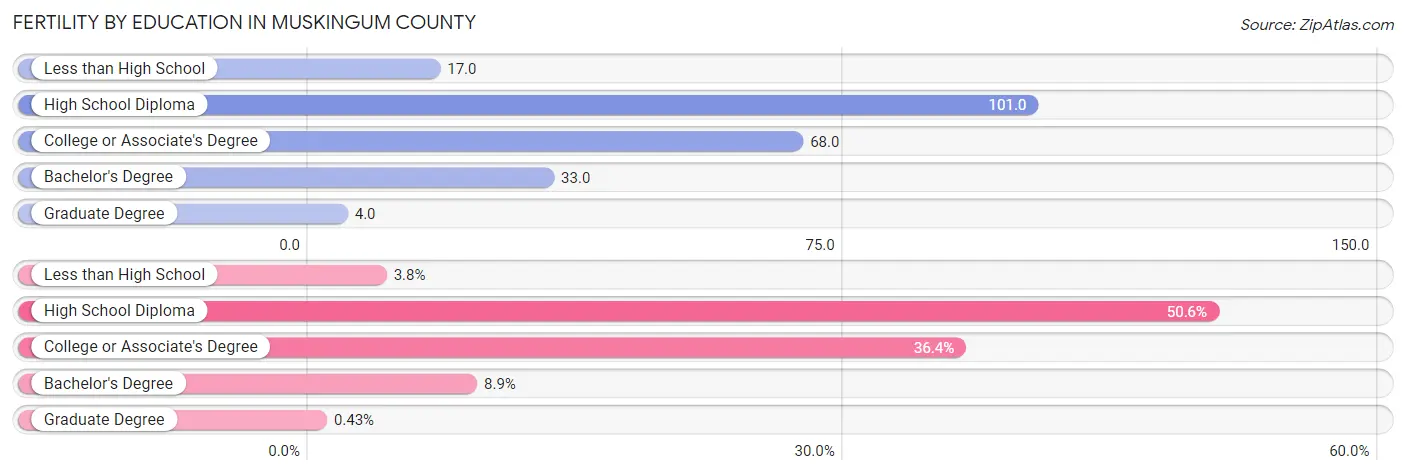
| Educational Attainment | Women with Births | Births / 1,000 Women |
| Less than High School | 44 (3.8%) | 17.0 |
| High School Diploma | 587 (50.6%) | 101.0 |
| College or Associate's Degree | 422 (36.3%) | 68.0 |
| Bachelor's Degree | 103 (8.9%) | 33.0 |
| Graduate Degree | 5 (0.4%) | 4.0 |
| Total | 1,161 (100.0%) | 61.0 |
Fertility by Education by Marriage Status in Muskingum County
51.0% of women with births in Muskingum County are unmarried. Women with the educational attainment of bachelor's degree are most likely to be married with 100.0% of them married at childbirth, while women with the educational attainment of college or associate's degree are least likely to be married with 66.3% of them unmarried at childbirth.
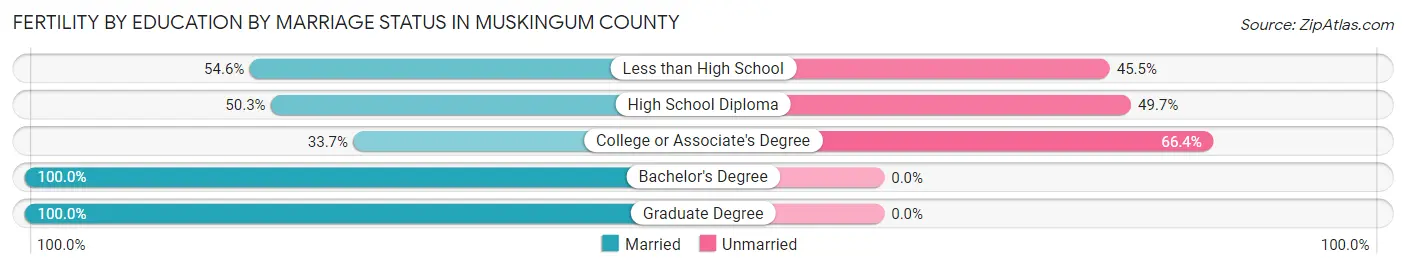
| Educational Attainment | Married | Unmarried |
| Less than High School | 24 (54.5%) | 20 (45.5%) |
| High School Diploma | 295 (50.3%) | 292 (49.7%) |
| College or Associate's Degree | 142 (33.7%) | 280 (66.3%) |
| Bachelor's Degree | 103 (100.0%) | 0 (0.0%) |
| Graduate Degree | 5 (100.0%) | 0 (0.0%) |
| Total | 569 (49.0%) | 592 (51.0%) |
Income in Muskingum County
Income Overview in Muskingum County
Per Capita Income in Muskingum County is $31,436, while median incomes of families and households are $71,728 and $56,810 respectively.
| Characteristic | Number | Measure |
| Per Capita Income | 86,393 | $31,436 |
| Median Family Income | 22,189 | $71,728 |
| Mean Family Income | 22,189 | $90,057 |
| Median Household Income | 34,599 | $56,810 |
| Mean Household Income | 34,599 | $76,335 |
| Income Deficit | 22,189 | $10,473 |
| Wage / Income Gap (%) | 86,393 | 28.95% |
| Wage / Income Gap ($) | 86,393 | 71.05¢ per $1 |
| Gini / Inequality Index | 86,393 | 0.46 |
Earnings by Sex in Muskingum County
Average Earnings in Muskingum County are $36,022, $42,950 for men and $30,517 for women, a difference of 28.9%.
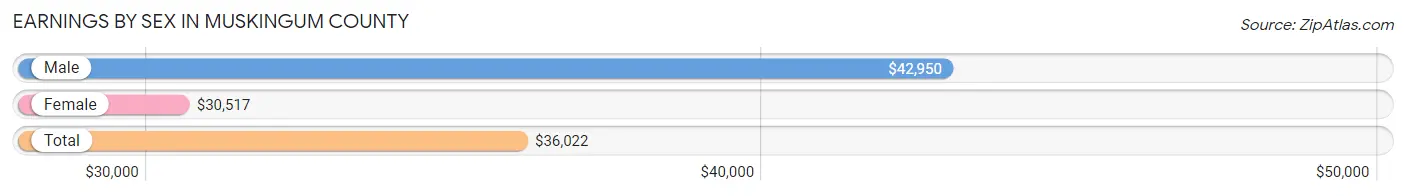
| Sex | Number | Average Earnings |
| Male | 23,234 (52.5%) | $42,950 |
| Female | 20,989 (47.5%) | $30,517 |
| Total | 44,223 (100.0%) | $36,022 |
Earnings by Sex by Income Bracket in Muskingum County
The most common earnings brackets in Muskingum County are $75,000 to $99,999 for men (2,612 | 11.2%) and $25,000 to $29,999 for women (1,747 | 8.3%).
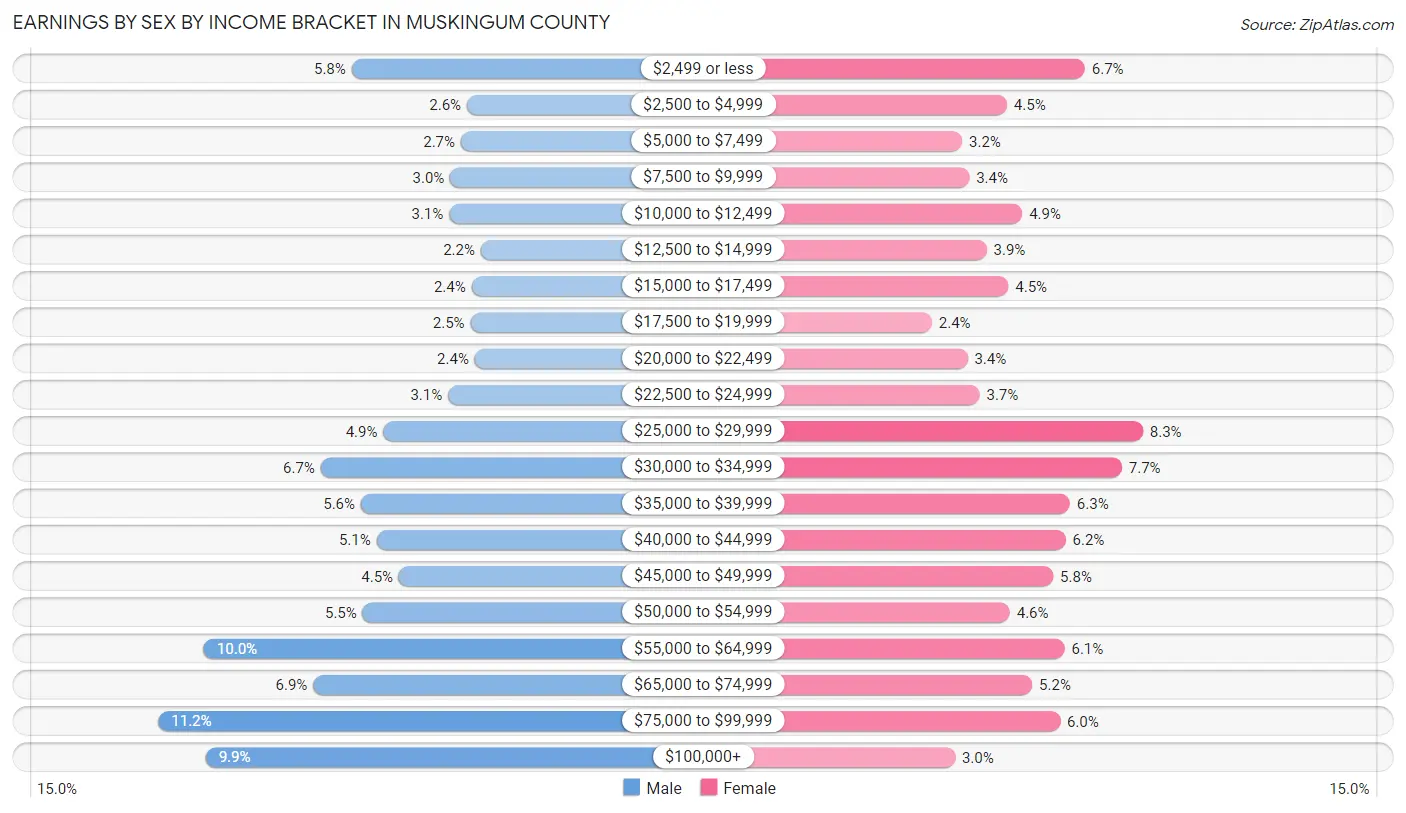
| Income | Male | Female |
| $2,499 or less | 1,351 (5.8%) | 1,404 (6.7%) |
| $2,500 to $4,999 | 596 (2.6%) | 944 (4.5%) |
| $5,000 to $7,499 | 637 (2.7%) | 680 (3.2%) |
| $7,500 to $9,999 | 707 (3.0%) | 722 (3.4%) |
| $10,000 to $12,499 | 713 (3.1%) | 1,035 (4.9%) |
| $12,500 to $14,999 | 506 (2.2%) | 825 (3.9%) |
| $15,000 to $17,499 | 566 (2.4%) | 953 (4.5%) |
| $17,500 to $19,999 | 573 (2.5%) | 501 (2.4%) |
| $20,000 to $22,499 | 546 (2.4%) | 712 (3.4%) |
| $22,500 to $24,999 | 720 (3.1%) | 782 (3.7%) |
| $25,000 to $29,999 | 1,142 (4.9%) | 1,747 (8.3%) |
| $30,000 to $34,999 | 1,552 (6.7%) | 1,622 (7.7%) |
| $35,000 to $39,999 | 1,289 (5.6%) | 1,317 (6.3%) |
| $40,000 to $44,999 | 1,188 (5.1%) | 1,291 (6.1%) |
| $45,000 to $49,999 | 1,041 (4.5%) | 1,218 (5.8%) |
| $50,000 to $54,999 | 1,278 (5.5%) | 962 (4.6%) |
| $55,000 to $64,999 | 2,313 (10.0%) | 1,284 (6.1%) |
| $65,000 to $74,999 | 1,601 (6.9%) | 1,094 (5.2%) |
| $75,000 to $99,999 | 2,612 (11.2%) | 1,257 (6.0%) |
| $100,000+ | 2,303 (9.9%) | 639 (3.0%) |
| Total | 23,234 (100.0%) | 20,989 (100.0%) |
Earnings by Sex by Educational Attainment in Muskingum County
Average earnings in Muskingum County are $50,399 for men and $35,287 for women, a difference of 30.0%. Men with an educational attainment of graduate degree enjoy the highest average annual earnings of $79,353, while those with less than high school education earn the least with $29,673. Women with an educational attainment of graduate degree earn the most with the average annual earnings of $63,750, while those with less than high school education have the smallest earnings of $17,447.
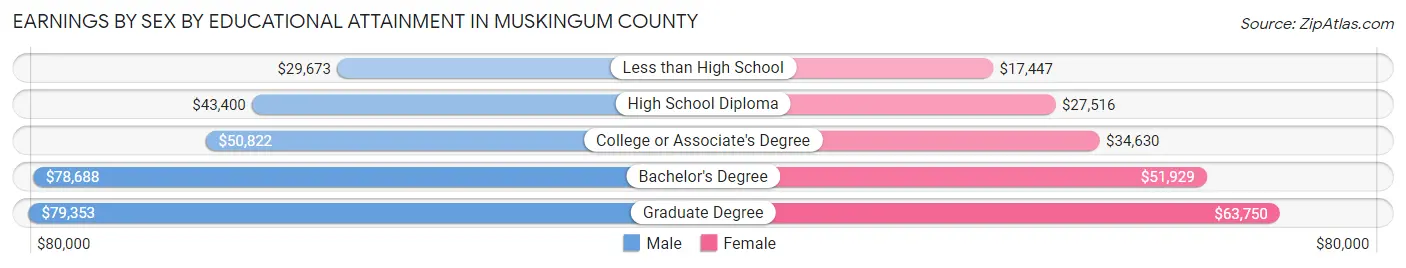
| Educational Attainment | Male Income | Female Income |
| Less than High School | $29,673 | $17,447 |
| High School Diploma | $43,400 | $27,516 |
| College or Associate's Degree | $50,822 | $34,630 |
| Bachelor's Degree | $78,688 | $51,929 |
| Graduate Degree | $79,353 | $63,750 |
| Total | $50,399 | $35,287 |
Family Income in Muskingum County
Family Income Brackets in Muskingum County
According to the Muskingum County family income data, there are 4,260 families falling into the $100,000 to $149,999 income range, which is the most common income bracket and makes up 19.2% of all families. Conversely, the less than $10,000 income bracket is the least frequent group with only 732 families (3.3%) belonging to this category.
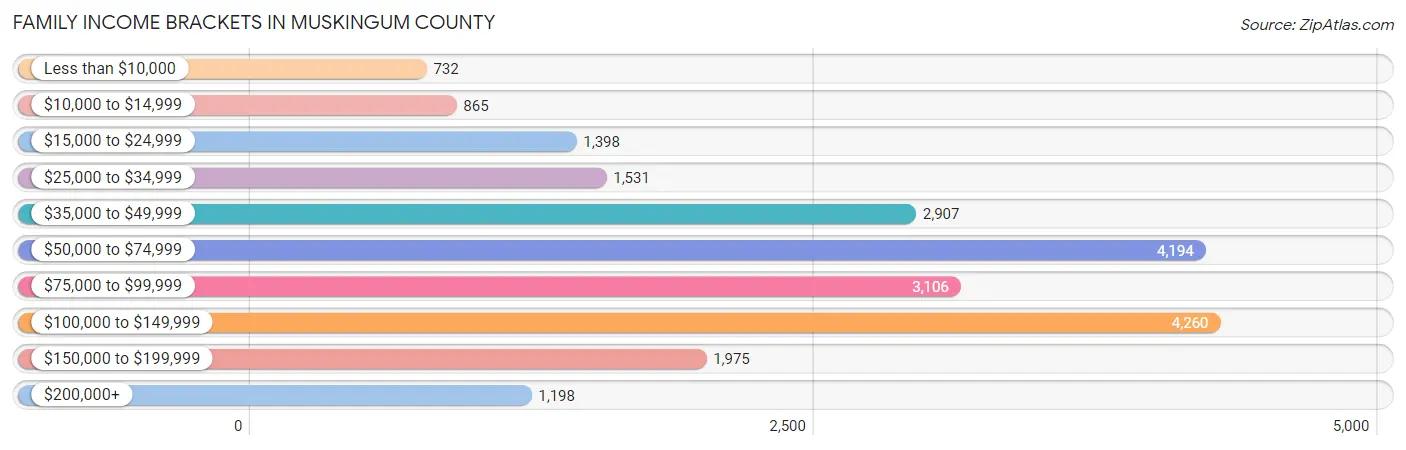
| Income Bracket | # Families | % Families |
| Less than $10,000 | 732 | 3.3% |
| $10,000 to $14,999 | 865 | 3.9% |
| $15,000 to $24,999 | 1,398 | 6.3% |
| $25,000 to $34,999 | 1,531 | 6.9% |
| $35,000 to $49,999 | 2,907 | 13.1% |
| $50,000 to $74,999 | 4,194 | 18.9% |
| $75,000 to $99,999 | 3,106 | 14.0% |
| $100,000 to $149,999 | 4,260 | 19.2% |
| $150,000 to $199,999 | 1,975 | 8.9% |
| $200,000+ | 1,198 | 5.4% |
Family Income by Famaliy Size in Muskingum County
5-person families (1,503 | 6.8%) account for the highest median family income in Muskingum County with $110,702 per family, while 2-person families (11,402 | 51.4%) have the highest median income of $30,033 per family member.
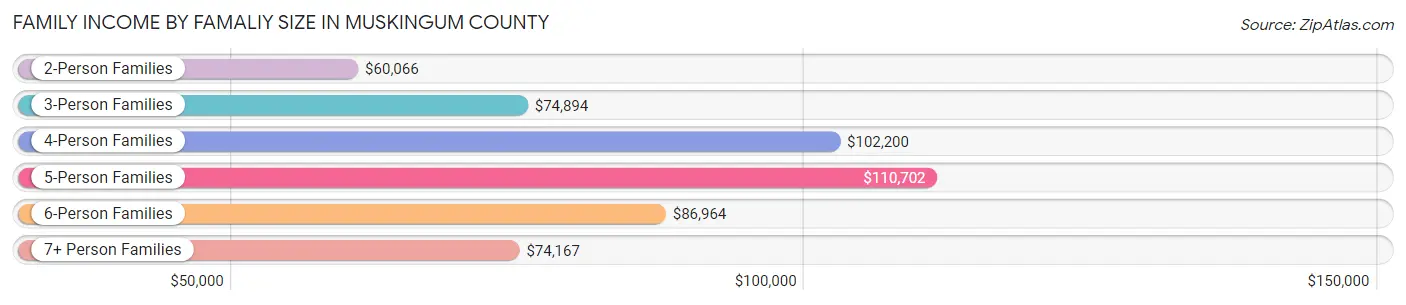
| Income Bracket | # Families | Median Income |
| 2-Person Families | 11,402 (51.4%) | $60,066 |
| 3-Person Families | 4,903 (22.1%) | $74,894 |
| 4-Person Families | 3,778 (17.0%) | $102,200 |
| 5-Person Families | 1,503 (6.8%) | $110,702 |
| 6-Person Families | 365 (1.6%) | $86,964 |
| 7+ Person Families | 238 (1.1%) | $74,167 |
| Total | 22,189 (100.0%) | $71,728 |
Family Income by Number of Earners in Muskingum County
The median family income in Muskingum County is $71,728, with families comprising 3+ earners (2,303) having the highest median family income of $128,614, while families with no earners (4,138) have the lowest median family income of $38,858, accounting for 10.4% and 18.6% of families, respectively.

| Number of Earners | # Families | Median Income |
| No Earners | 4,138 (18.6%) | $38,858 |
| 1 Earner | 7,529 (33.9%) | $49,836 |
| 2 Earners | 8,219 (37.0%) | $101,064 |
| 3+ Earners | 2,303 (10.4%) | $128,614 |
| Total | 22,189 (100.0%) | $71,728 |
Household Income in Muskingum County
Household Income Brackets in Muskingum County
With 6,020 households falling in the category, the $50,000 to $74,999 income range is the most frequent in Muskingum County, accounting for 17.4% of all households. In contrast, only 1,419 households (4.1%) fall into the $200,000+ income bracket, making it the least populous group.
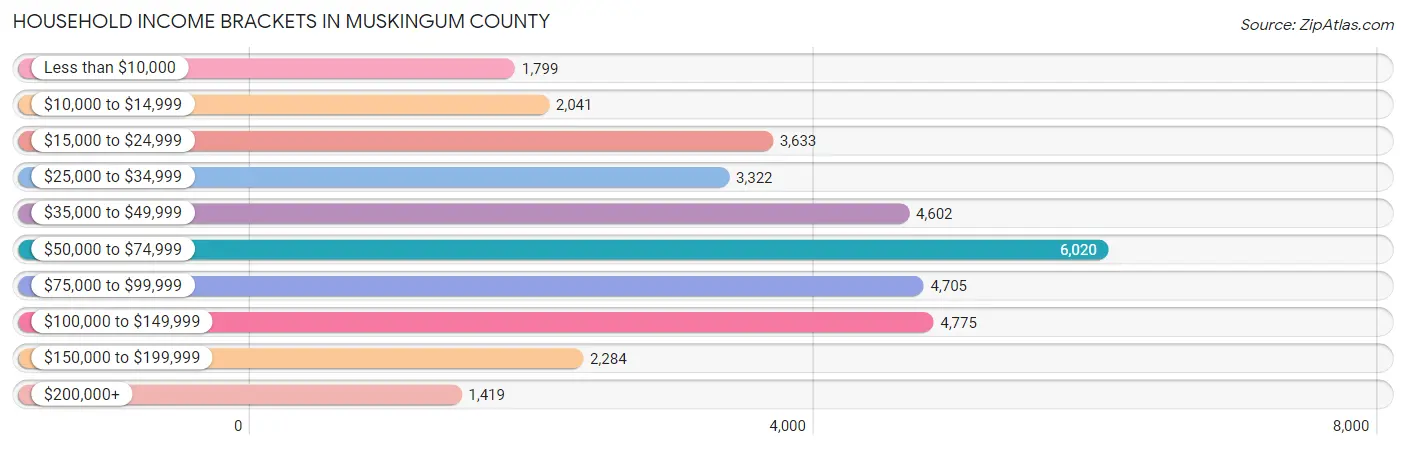
| Income Bracket | # Households | % Households |
| Less than $10,000 | 1,799 | 5.2% |
| $10,000 to $14,999 | 2,041 | 5.9% |
| $15,000 to $24,999 | 3,633 | 10.5% |
| $25,000 to $34,999 | 3,322 | 9.6% |
| $35,000 to $49,999 | 4,602 | 13.3% |
| $50,000 to $74,999 | 6,020 | 17.4% |
| $75,000 to $99,999 | 4,705 | 13.6% |
| $100,000 to $149,999 | 4,775 | 13.8% |
| $150,000 to $199,999 | 2,284 | 6.6% |
| $200,000+ | 1,419 | 4.1% |
Household Income by Householder Age in Muskingum County
The median household income in Muskingum County is $56,810, with the highest median household income of $70,536 found in the 45 to 64 years age bracket for the primary householder. A total of 13,576 households (39.2%) fall into this category. Meanwhile, the 65+ years age bracket for the primary householder has the lowest median household income of $42,242, with 9,903 households (28.6%) in this group.
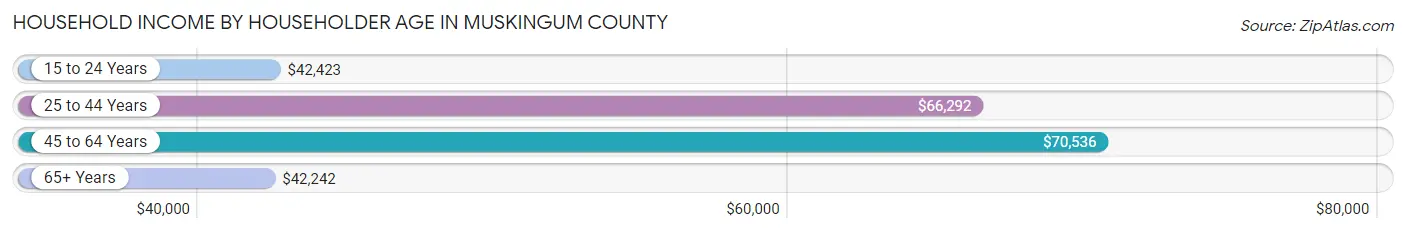
| Income Bracket | # Households | Median Income |
| 15 to 24 Years | 1,515 (4.4%) | $42,423 |
| 25 to 44 Years | 9,605 (27.8%) | $66,292 |
| 45 to 64 Years | 13,576 (39.2%) | $70,536 |
| 65+ Years | 9,903 (28.6%) | $42,242 |
| Total | 34,599 (100.0%) | $56,810 |
Poverty in Muskingum County
Income Below Poverty by Sex and Age in Muskingum County
With 14.1% poverty level for males and 17.0% for females among the residents of Muskingum County, 12 to 14 year old males and 5 year old females are the most vulnerable to poverty, with 394 males (23.3%) and 192 females (28.9%) in their respective age groups living below the poverty level.
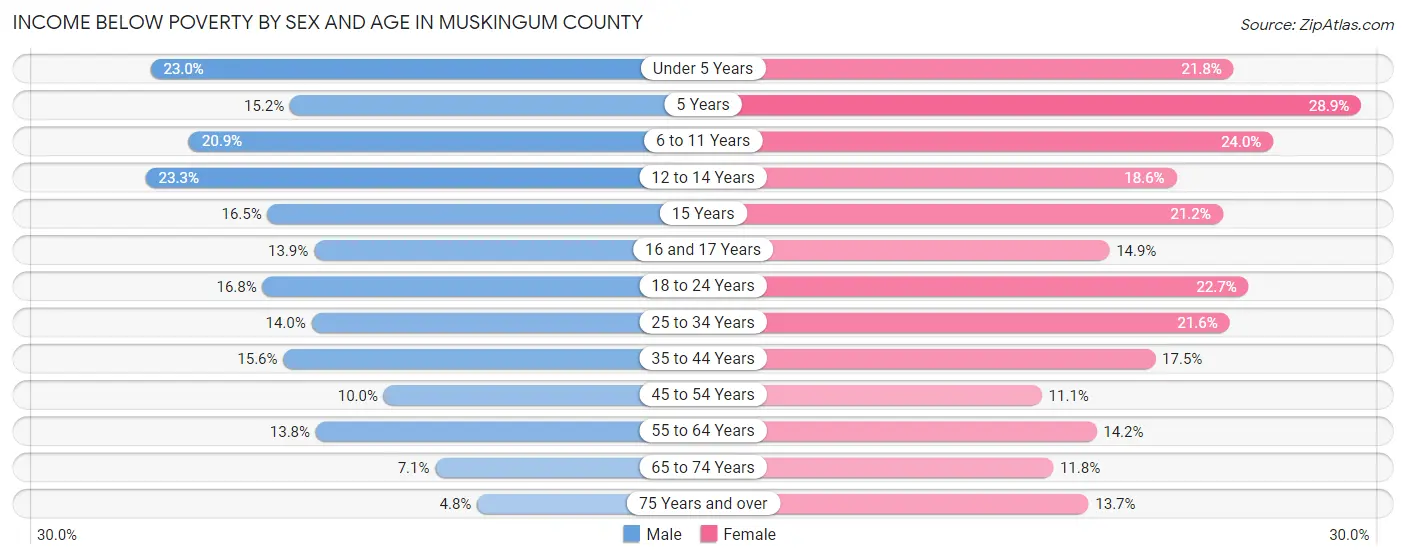
| Age Bracket | Male | Female |
| Under 5 Years | 580 (23.0%) | 549 (21.8%) |
| 5 Years | 51 (15.2%) | 192 (28.9%) |
| 6 to 11 Years | 687 (20.8%) | 709 (24.0%) |
| 12 to 14 Years | 394 (23.3%) | 286 (18.6%) |
| 15 Years | 123 (16.5%) | 127 (21.2%) |
| 16 and 17 Years | 126 (13.9%) | 154 (14.9%) |
| 18 to 24 Years | 588 (16.8%) | 765 (22.7%) |
| 25 to 34 Years | 745 (14.0%) | 1,111 (21.6%) |
| 35 to 44 Years | 770 (15.6%) | 881 (17.4%) |
| 45 to 54 Years | 550 (10.0%) | 623 (11.1%) |
| 55 to 64 Years | 790 (13.8%) | 859 (14.2%) |
| 65 to 74 Years | 304 (7.1%) | 568 (11.8%) |
| 75 Years and over | 117 (4.8%) | 484 (13.7%) |
| Total | 5,825 (14.1%) | 7,308 (17.0%) |
Income Above Poverty by Sex and Age in Muskingum County
According to the poverty statistics in Muskingum County, males aged 75 years and over and females aged 45 to 54 years are the age groups that are most secure financially, with 95.2% of males and 88.9% of females in these age groups living above the poverty line.
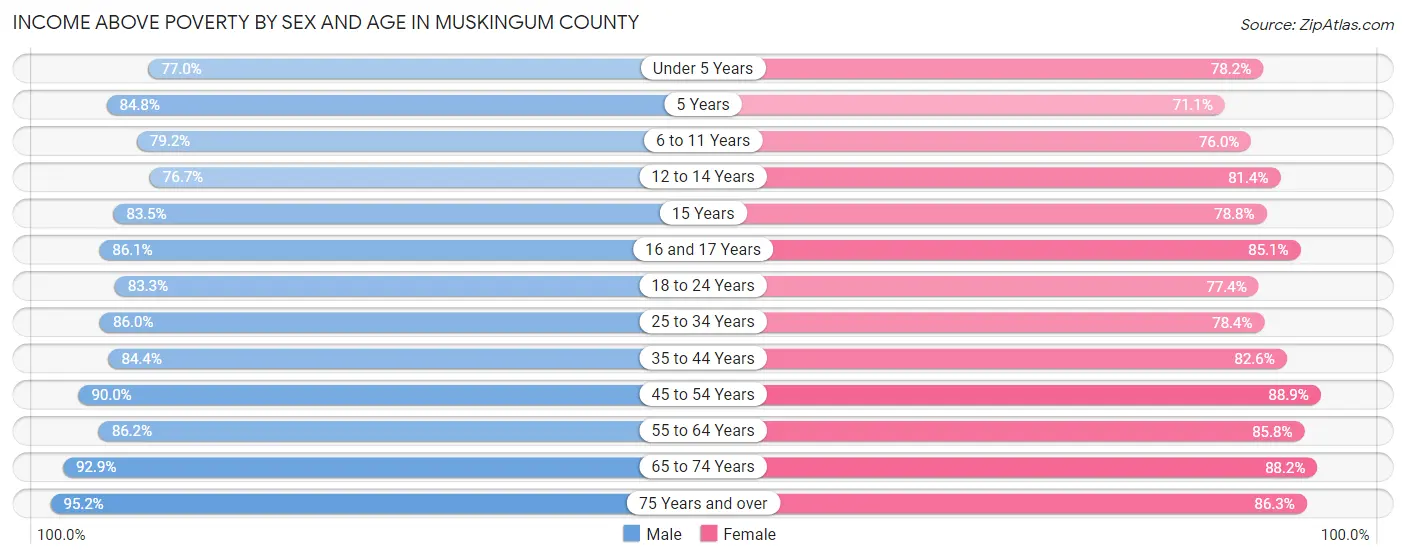
| Age Bracket | Male | Female |
| Under 5 Years | 1,943 (77.0%) | 1,967 (78.2%) |
| 5 Years | 284 (84.8%) | 472 (71.1%) |
| 6 to 11 Years | 2,608 (79.1%) | 2,243 (76.0%) |
| 12 to 14 Years | 1,300 (76.7%) | 1,249 (81.4%) |
| 15 Years | 624 (83.5%) | 472 (78.8%) |
| 16 and 17 Years | 782 (86.1%) | 880 (85.1%) |
| 18 to 24 Years | 2,922 (83.3%) | 2,612 (77.3%) |
| 25 to 34 Years | 4,569 (86.0%) | 4,034 (78.4%) |
| 35 to 44 Years | 4,168 (84.4%) | 4,168 (82.6%) |
| 45 to 54 Years | 4,952 (90.0%) | 4,974 (88.9%) |
| 55 to 64 Years | 4,943 (86.2%) | 5,204 (85.8%) |
| 65 to 74 Years | 3,957 (92.9%) | 4,260 (88.2%) |
| 75 Years and over | 2,319 (95.2%) | 3,041 (86.3%) |
| Total | 35,371 (85.9%) | 35,576 (83.0%) |
Income Below Poverty Among Married-Couple Families in Muskingum County
The poverty statistics for married-couple families in Muskingum County show that 5.0% or 758 of the total 15,215 families live below the poverty line. Families with 5 or more children have the highest poverty rate of 38.9%, comprising of 61 families. On the other hand, families with no children have the lowest poverty rate of 3.8%, which includes 370 families.
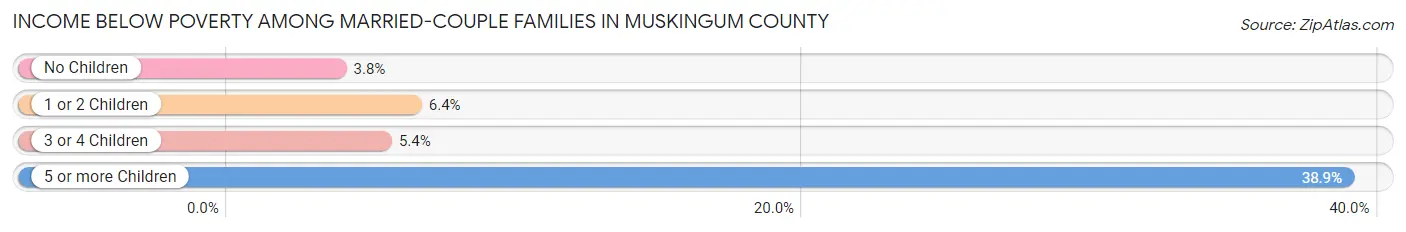
| Children | Above Poverty | Below Poverty |
| No Children | 9,427 (96.2%) | 370 (3.8%) |
| 1 or 2 Children | 4,034 (93.6%) | 276 (6.4%) |
| 3 or 4 Children | 900 (94.6%) | 51 (5.4%) |
| 5 or more Children | 96 (61.2%) | 61 (38.9%) |
| Total | 14,457 (95.0%) | 758 (5.0%) |
Income Below Poverty Among Single-Parent Households in Muskingum County
According to the poverty data in Muskingum County, 17.0% or 369 single-father households and 31.1% or 1,496 single-mother households are living below the poverty line. Among single-father households, those with 1 or 2 children have the highest poverty rate, with 244 households (25.7%) experiencing poverty. Likewise, among single-mother households, those with 5 or more children have the highest poverty rate, with 57 households (83.8%) falling below the poverty line.
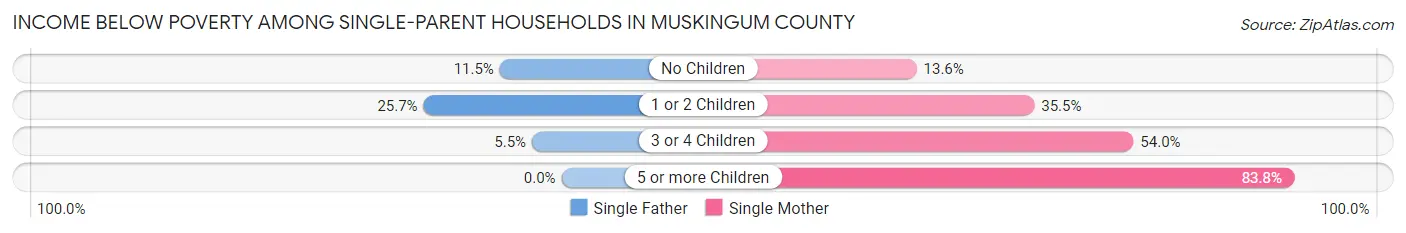
| Children | Single Father | Single Mother |
| No Children | 111 (11.5%) | 216 (13.6%) |
| 1 or 2 Children | 244 (25.7%) | 917 (35.5%) |
| 3 or 4 Children | 14 (5.5%) | 306 (54.0%) |
| 5 or more Children | 0 (0.0%) | 57 (83.8%) |
| Total | 369 (17.0%) | 1,496 (31.1%) |
Income Below Poverty Among Married-Couple vs Single-Parent Households in Muskingum County
The poverty data for Muskingum County shows that 758 of the married-couple family households (5.0%) and 1,865 of the single-parent households (26.7%) are living below the poverty level. Within the married-couple family households, those with 5 or more children have the highest poverty rate, with 61 households (38.9%) falling below the poverty line. Among the single-parent households, those with 5 or more children have the highest poverty rate, with 57 household (83.8%) living below poverty.
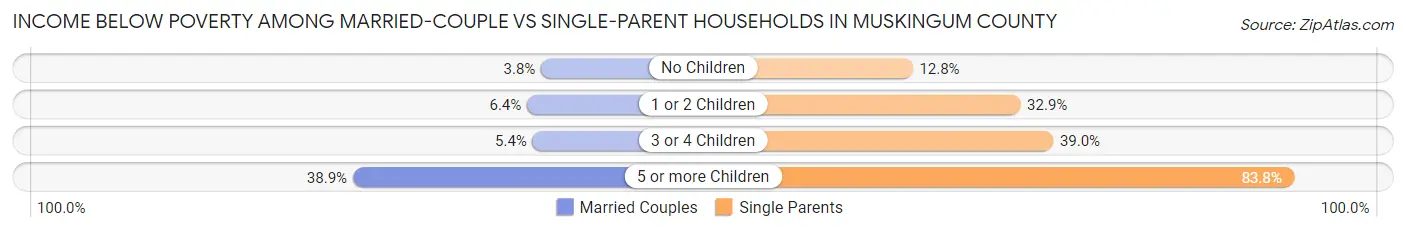
| Children | Married-Couple Families | Single-Parent Households |
| No Children | 370 (3.8%) | 327 (12.8%) |
| 1 or 2 Children | 276 (6.4%) | 1,161 (32.9%) |
| 3 or 4 Children | 51 (5.4%) | 320 (39.0%) |
| 5 or more Children | 61 (38.9%) | 57 (83.8%) |
| Total | 758 (5.0%) | 1,865 (26.7%) |
Employment Characteristics in Muskingum County
Employment by Class of Employer in Muskingum County
Among the 38,989 employed individuals in Muskingum County, private company employees (26,903 | 69.0%), not-for-profit organizations (3,908 | 10.0%), and local government employees (3,820 | 9.8%) make up the most common classes of employment.
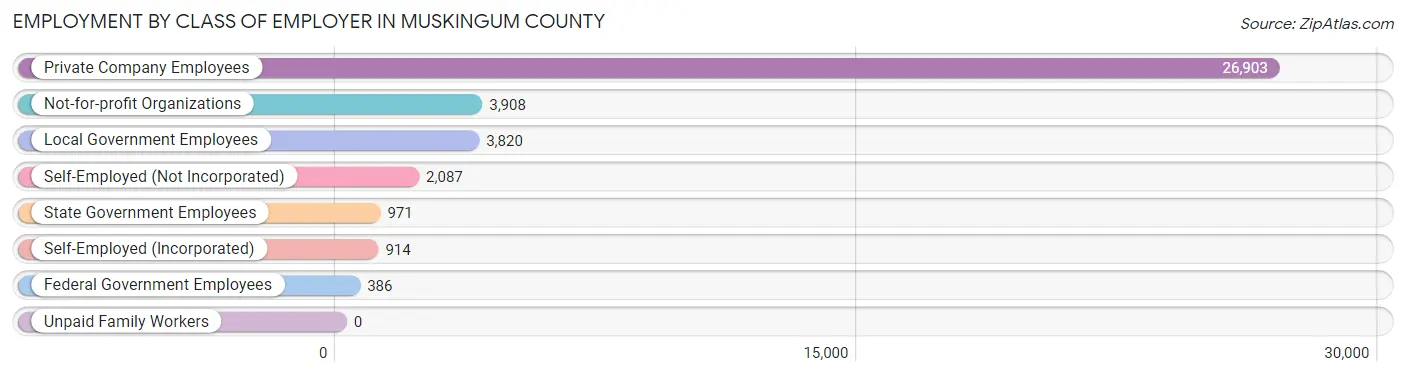
| Employer Class | # Employees | % Employees |
| Private Company Employees | 26,903 | 69.0% |
| Self-Employed (Incorporated) | 914 | 2.3% |
| Self-Employed (Not Incorporated) | 2,087 | 5.3% |
| Not-for-profit Organizations | 3,908 | 10.0% |
| Local Government Employees | 3,820 | 9.8% |
| State Government Employees | 971 | 2.5% |
| Federal Government Employees | 386 | 1.0% |
| Unpaid Family Workers | 0 | 0.0% |
| Total | 38,989 | 100.0% |
Employment Status by Age in Muskingum County
According to the labor force statistics for Muskingum County, out of the total population over 16 years of age (68,916), 60.2% or 41,487 individuals are in the labor force, with 4.6% or 1,908 of them unemployed. The age group with the highest labor force participation rate is 25 to 29 years, with 82.5% or 4,589 individuals in the labor force. Within the labor force, the 16 to 19 years age range has the highest percentage of unemployed individuals, with 9.9% or 173 of them being unemployed.
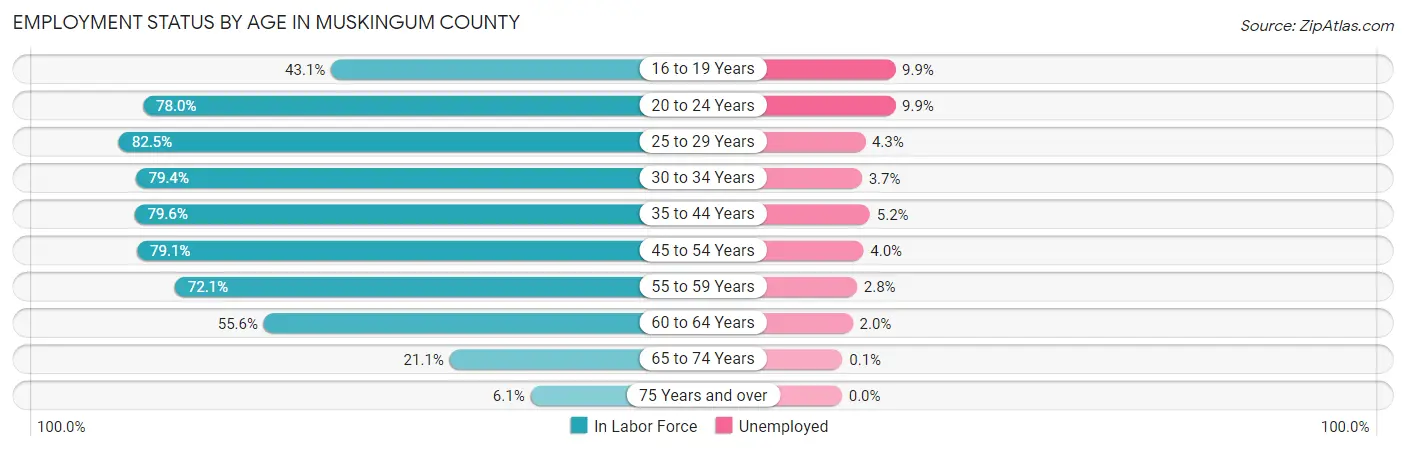
| Age Bracket | In Labor Force | Unemployed |
| 16 to 19 Years | 1,750 (43.1%) | 173 (9.9%) |
| 20 to 24 Years | 4,464 (78.0%) | 442 (9.9%) |
| 25 to 29 Years | 4,589 (82.5%) | 197 (4.3%) |
| 30 to 34 Years | 3,967 (79.4%) | 147 (3.7%) |
| 35 to 44 Years | 8,012 (79.6%) | 417 (5.2%) |
| 45 to 54 Years | 8,821 (79.1%) | 353 (4.0%) |
| 55 to 59 Years | 4,271 (72.1%) | 120 (2.8%) |
| 60 to 64 Years | 3,319 (55.6%) | 66 (2.0%) |
| 65 to 74 Years | 1,932 (21.1%) | 2 (0.1%) |
| 75 Years and over | 385 (6.1%) | 0 (0.0%) |
| Total | 41,487 (60.2%) | 1,908 (4.6%) |
Employment Status by Educational Attainment in Muskingum County
According to labor force statistics for Muskingum County, 75.5% of individuals (32,969) out of the total population between 25 and 64 years of age (43,668) are in the labor force, with 3.9% or 1,286 of them being unemployed. The group with the highest labor force participation rate are those with the educational attainment of bachelor's degree or higher, with 87.7% or 7,982 individuals in the labor force. Within the labor force, individuals with less than high school education have the highest percentage of unemployment, with 8.7% or 152 of them being unemployed.
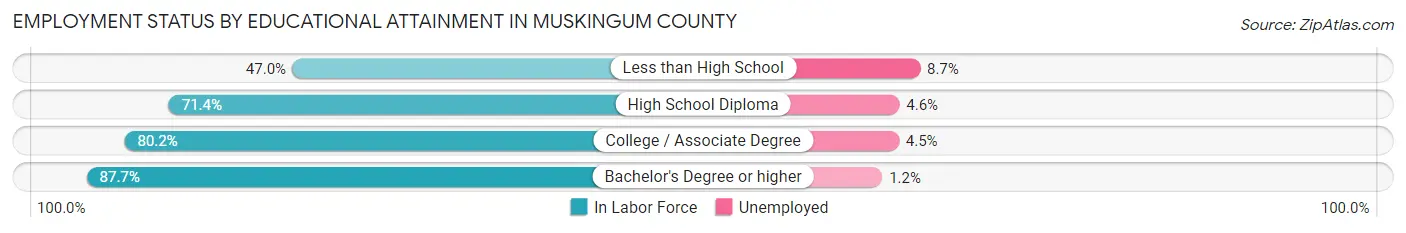
| Educational Attainment | In Labor Force | Unemployed |
| Less than High School | 1,751 (47.0%) | 324 (8.7%) |
| High School Diploma | 12,129 (71.4%) | 781 (4.6%) |
| College / Associate Degree | 11,110 (80.2%) | 623 (4.5%) |
| Bachelor's Degree or higher | 7,982 (87.7%) | 109 (1.2%) |
| Total | 32,969 (75.5%) | 1,703 (3.9%) |
Employment Occupations by Sex in Muskingum County
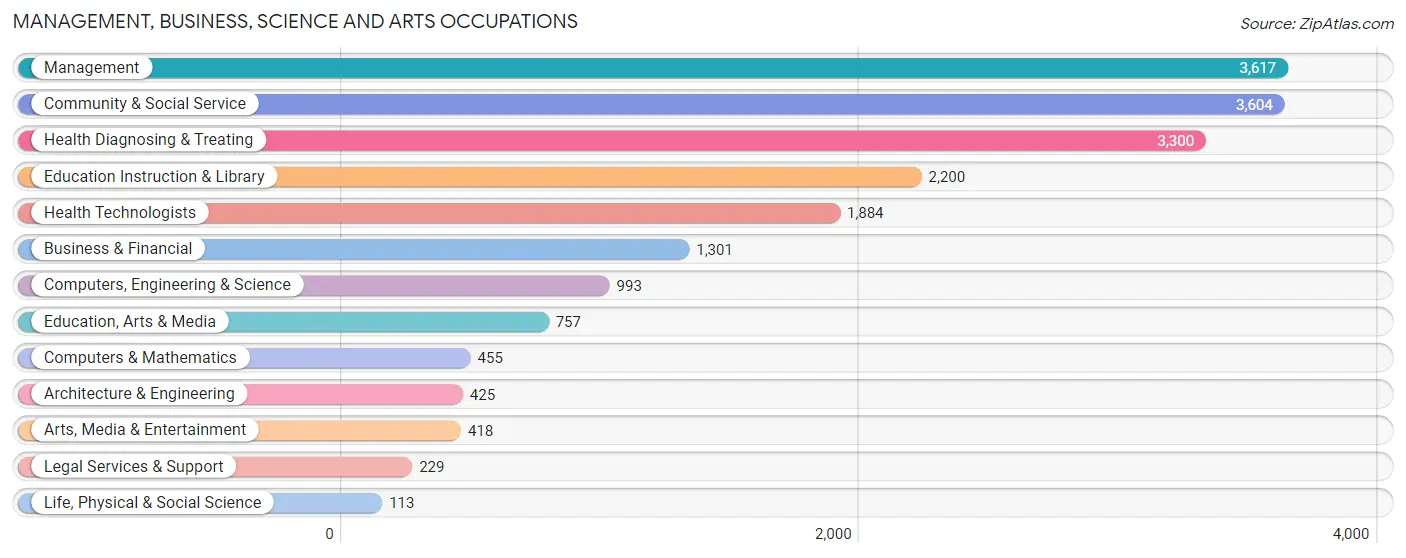
Management, Business, Science and Arts Occupations
The most common Management, Business, Science and Arts occupations in Muskingum County are Management (3,617 | 9.1%), Community & Social Service (3,604 | 9.1%), Health Diagnosing & Treating (3,300 | 8.4%), Education Instruction & Library (2,200 | 5.6%), and Health Technologists (1,884 | 4.8%).
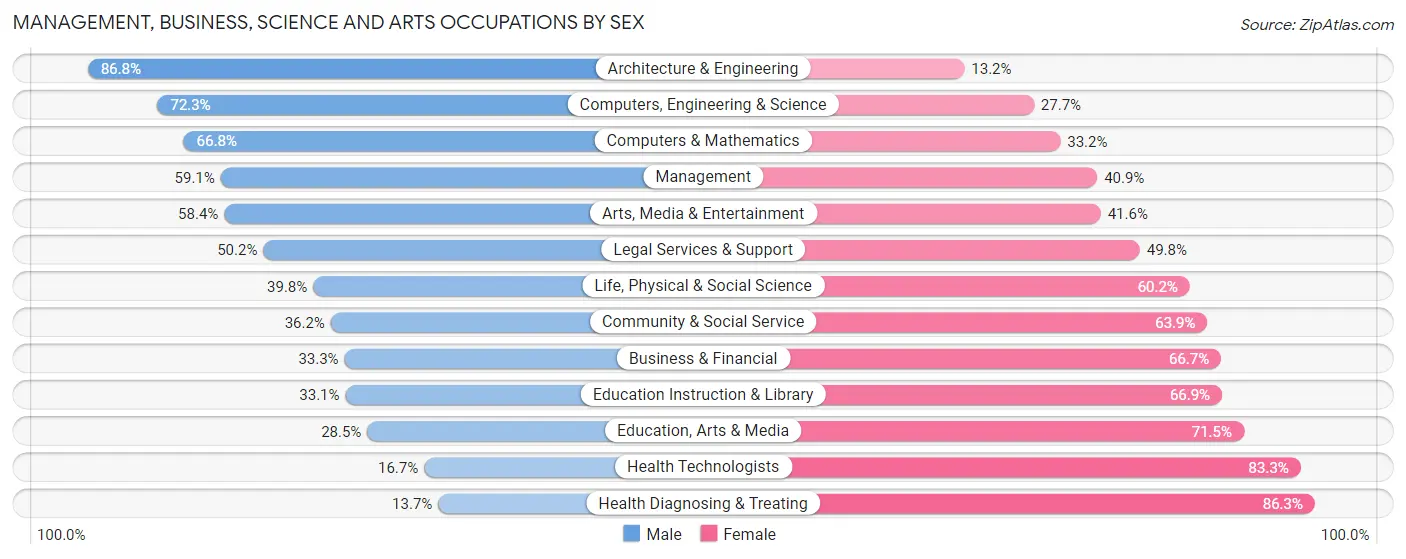
Management, Business, Science and Arts Occupations by Sex
Within the Management, Business, Science and Arts occupations in Muskingum County, the most male-oriented occupations are Architecture & Engineering (86.8%), Computers, Engineering & Science (72.3%), and Computers & Mathematics (66.8%), while the most female-oriented occupations are Health Diagnosing & Treating (86.3%), Health Technologists (83.3%), and Education, Arts & Media (71.5%).
| Occupation | Male | Female |
| Management | 2,138 (59.1%) | 1,479 (40.9%) |
| Business & Financial | 433 (33.3%) | 868 (66.7%) |
| Computers, Engineering & Science | 718 (72.3%) | 275 (27.7%) |
| Computers & Mathematics | 304 (66.8%) | 151 (33.2%) |
| Architecture & Engineering | 369 (86.8%) | 56 (13.2%) |
| Life, Physical & Social Science | 45 (39.8%) | 68 (60.2%) |
| Community & Social Service | 1,303 (36.1%) | 2,301 (63.8%) |
| Education, Arts & Media | 216 (28.5%) | 541 (71.5%) |
| Legal Services & Support | 115 (50.2%) | 114 (49.8%) |
| Education Instruction & Library | 728 (33.1%) | 1,472 (66.9%) |
| Arts, Media & Entertainment | 244 (58.4%) | 174 (41.6%) |
| Health Diagnosing & Treating | 453 (13.7%) | 2,847 (86.3%) |
| Health Technologists | 314 (16.7%) | 1,570 (83.3%) |
| Total (Category) | 5,045 (39.4%) | 7,770 (60.6%) |
| Total (Overall) | 20,865 (52.8%) | 18,669 (47.2%) |
Services Occupations
The most common Services occupations in Muskingum County are Food Preparation & Serving (2,148 | 5.4%), Cleaning & Maintenance (1,494 | 3.8%), Healthcare Support (1,262 | 3.2%), Personal Care & Service (1,067 | 2.7%), and Security & Protection (723 | 1.8%).

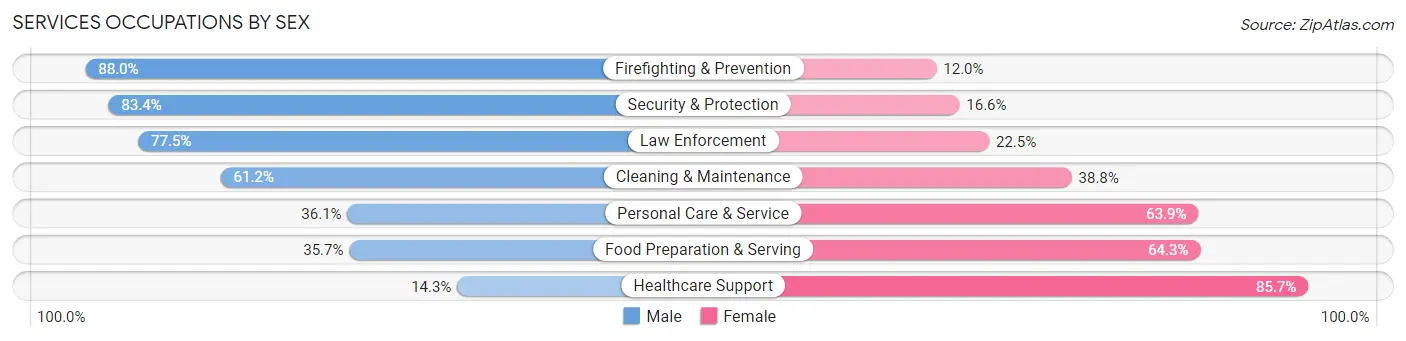
Services Occupations by Sex
Within the Services occupations in Muskingum County, the most male-oriented occupations are Firefighting & Prevention (88.0%), Security & Protection (83.4%), and Law Enforcement (77.5%), while the most female-oriented occupations are Healthcare Support (85.7%), Food Preparation & Serving (64.3%), and Personal Care & Service (63.9%).
| Occupation | Male | Female |
| Healthcare Support | 181 (14.3%) | 1,081 (85.7%) |
| Security & Protection | 603 (83.4%) | 120 (16.6%) |
| Firefighting & Prevention | 358 (88.0%) | 49 (12.0%) |
| Law Enforcement | 245 (77.5%) | 71 (22.5%) |
| Food Preparation & Serving | 767 (35.7%) | 1,381 (64.3%) |
| Cleaning & Maintenance | 914 (61.2%) | 580 (38.8%) |
| Personal Care & Service | 385 (36.1%) | 682 (63.9%) |
| Total (Category) | 2,850 (42.6%) | 3,844 (57.4%) |
| Total (Overall) | 20,865 (52.8%) | 18,669 (47.2%) |
Sales and Office Occupations
The most common Sales and Office occupations in Muskingum County are Office & Administration (3,930 | 9.9%), and Sales & Related (3,449 | 8.7%).
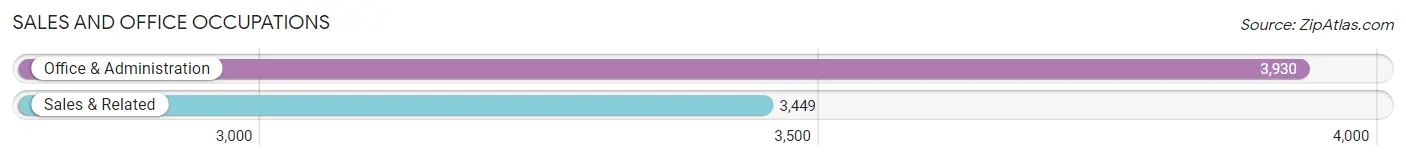
Sales and Office Occupations by Sex

| Occupation | Male | Female |
| Sales & Related | 1,639 (47.5%) | 1,810 (52.5%) |
| Office & Administration | 653 (16.6%) | 3,277 (83.4%) |
| Total (Category) | 2,292 (31.1%) | 5,087 (68.9%) |
| Total (Overall) | 20,865 (52.8%) | 18,669 (47.2%) |
Natural Resources, Construction and Maintenance Occupations
The most common Natural Resources, Construction and Maintenance occupations in Muskingum County are Construction & Extraction (2,656 | 6.7%), Installation, Maintenance & Repair (1,763 | 4.5%), and Farming, Fishing & Forestry (40 | 0.1%).
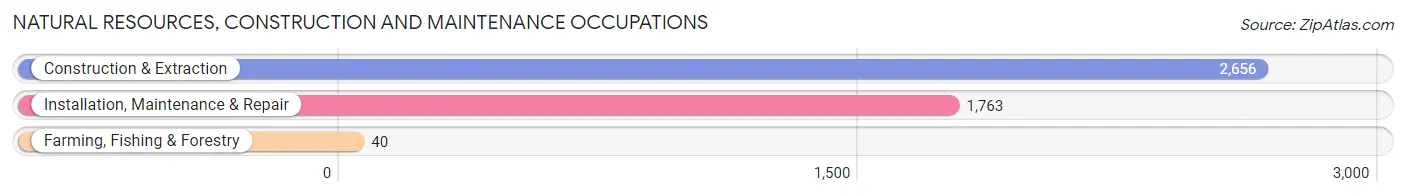
Natural Resources, Construction and Maintenance Occupations by Sex
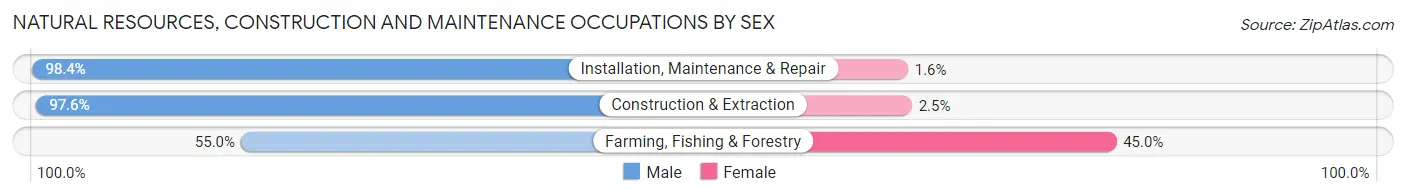
| Occupation | Male | Female |
| Farming, Fishing & Forestry | 22 (55.0%) | 18 (45.0%) |
| Construction & Extraction | 2,591 (97.6%) | 65 (2.5%) |
| Installation, Maintenance & Repair | 1,734 (98.4%) | 29 (1.6%) |
| Total (Category) | 4,347 (97.5%) | 112 (2.5%) |
| Total (Overall) | 20,865 (52.8%) | 18,669 (47.2%) |
Production, Transportation and Moving Occupations
The most common Production, Transportation and Moving occupations in Muskingum County are Production (3,097 | 7.8%), Material Moving (2,884 | 7.3%), and Transportation (2,206 | 5.6%).

Production, Transportation and Moving Occupations by Sex
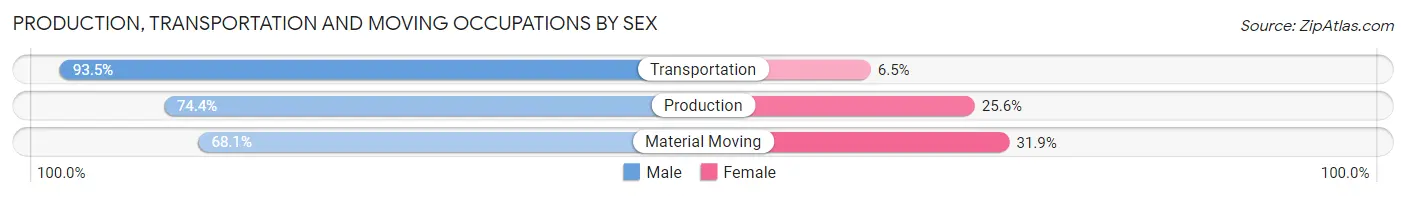
| Occupation | Male | Female |
| Production | 2,305 (74.4%) | 792 (25.6%) |
| Transportation | 2,063 (93.5%) | 143 (6.5%) |
| Material Moving | 1,963 (68.1%) | 921 (31.9%) |
| Total (Category) | 6,331 (77.3%) | 1,856 (22.7%) |
| Total (Overall) | 20,865 (52.8%) | 18,669 (47.2%) |
Employment Industries by Sex in Muskingum County
Employment Industries in Muskingum County
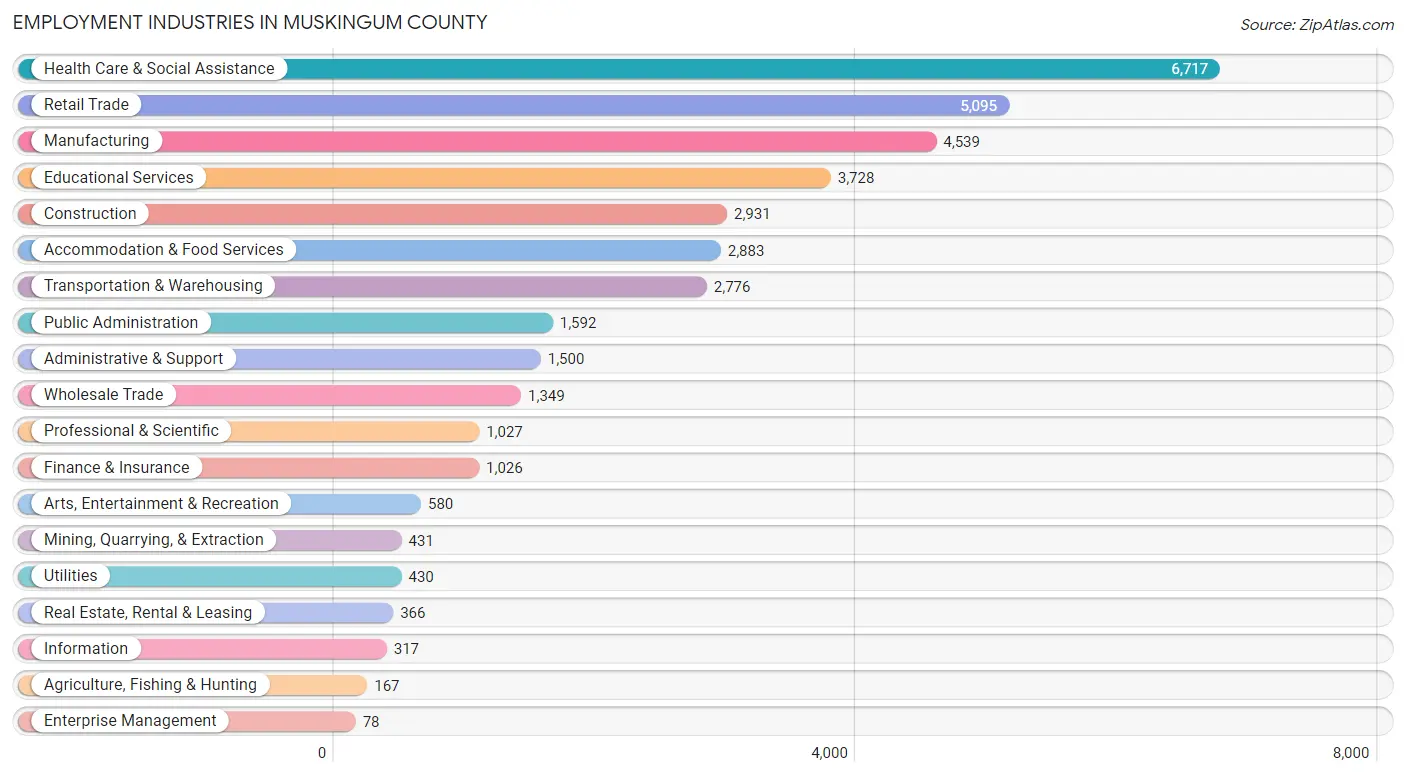
The major employment industries in Muskingum County include Health Care & Social Assistance (6,717 | 17.0%), Retail Trade (5,095 | 12.9%), Manufacturing (4,539 | 11.5%), Educational Services (3,728 | 9.4%), and Construction (2,931 | 7.4%).
Employment Industries by Sex in Muskingum County
The Muskingum County industries that see more men than women are Mining, Quarrying, & Extraction (99.1%), Construction (95.1%), and Agriculture, Fishing & Hunting (85.0%), whereas the industries that tend to have a higher number of women are Enterprise Management (100.0%), Finance & Insurance (81.5%), and Health Care & Social Assistance (81.2%).
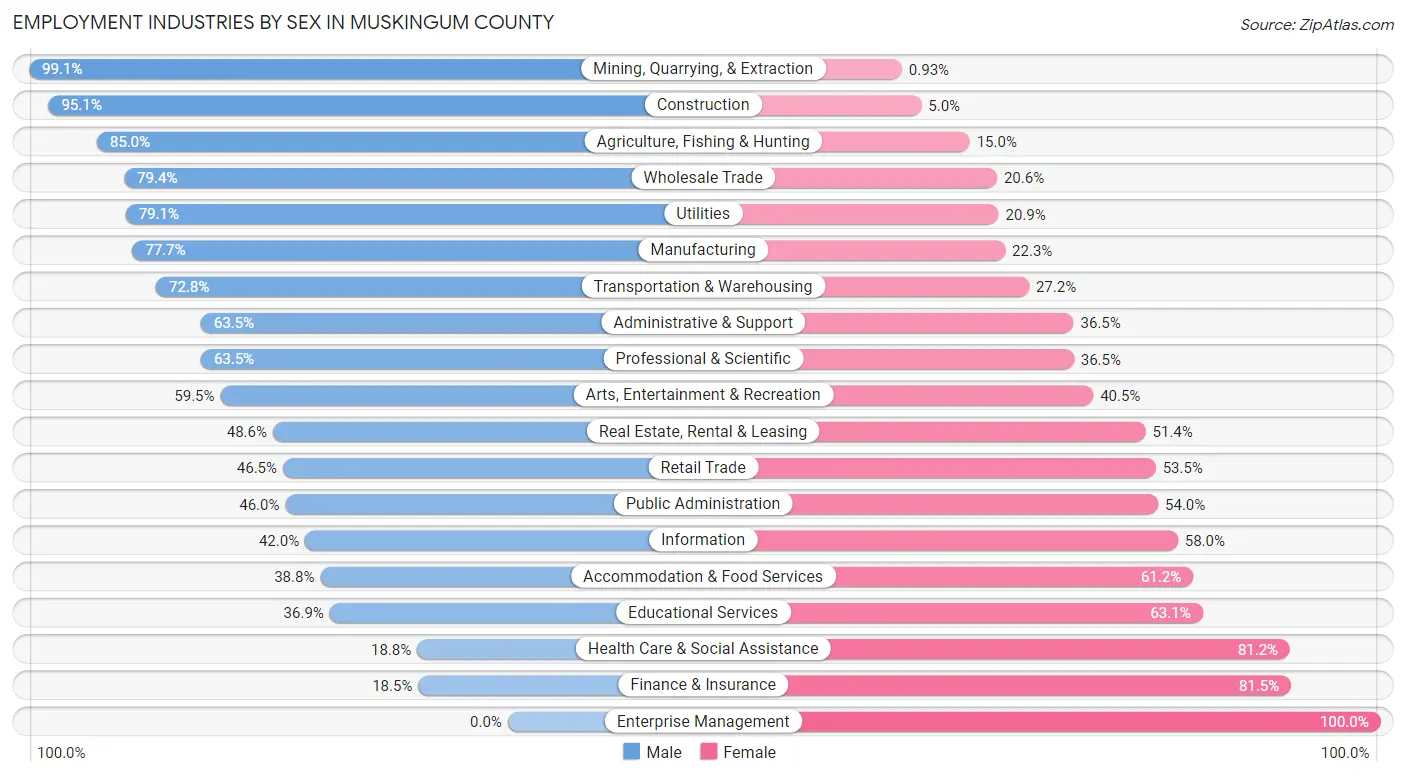
| Industry | Male | Female |
| Agriculture, Fishing & Hunting | 142 (85.0%) | 25 (15.0%) |
| Mining, Quarrying, & Extraction | 427 (99.1%) | 4 (0.9%) |
| Construction | 2,786 (95.1%) | 145 (5.0%) |
| Manufacturing | 3,527 (77.7%) | 1,012 (22.3%) |
| Wholesale Trade | 1,071 (79.4%) | 278 (20.6%) |
| Retail Trade | 2,371 (46.5%) | 2,724 (53.5%) |
| Transportation & Warehousing | 2,020 (72.8%) | 756 (27.2%) |
| Utilities | 340 (79.1%) | 90 (20.9%) |
| Information | 133 (42.0%) | 184 (58.0%) |
| Finance & Insurance | 190 (18.5%) | 836 (81.5%) |
| Real Estate, Rental & Leasing | 178 (48.6%) | 188 (51.4%) |
| Professional & Scientific | 652 (63.5%) | 375 (36.5%) |
| Enterprise Management | 0 (0.0%) | 78 (100.0%) |
| Administrative & Support | 953 (63.5%) | 547 (36.5%) |
| Educational Services | 1,374 (36.9%) | 2,354 (63.1%) |
| Health Care & Social Assistance | 1,260 (18.8%) | 5,457 (81.2%) |
| Arts, Entertainment & Recreation | 345 (59.5%) | 235 (40.5%) |
| Accommodation & Food Services | 1,119 (38.8%) | 1,764 (61.2%) |
| Public Administration | 733 (46.0%) | 859 (54.0%) |
| Total | 20,865 (52.8%) | 18,669 (47.2%) |
Education in Muskingum County
School Enrollment in Muskingum County
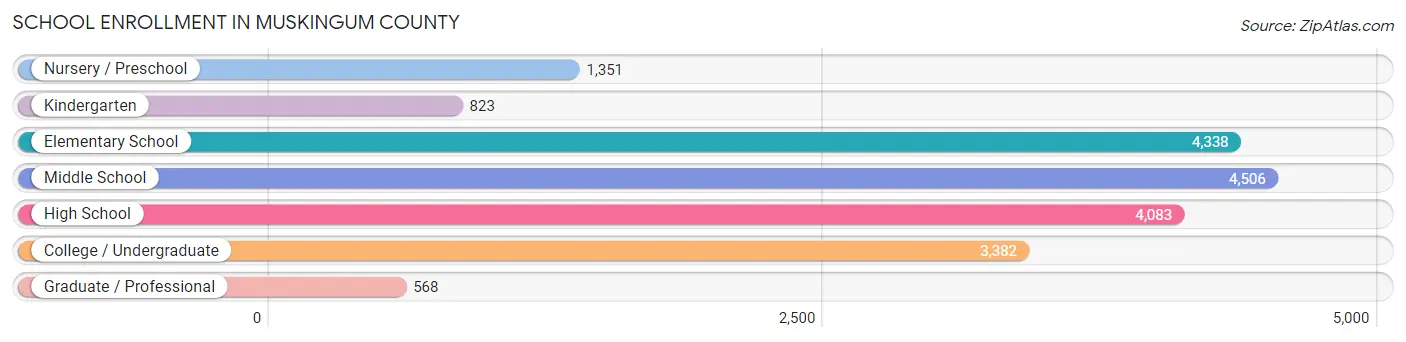
The most common levels of schooling among the 19,051 students in Muskingum County are middle school (4,506 | 23.6%), elementary school (4,338 | 22.8%), and high school (4,083 | 21.4%).
| School Level | # Students | % Students |
| Nursery / Preschool | 1,351 | 7.1% |
| Kindergarten | 823 | 4.3% |
| Elementary School | 4,338 | 22.8% |
| Middle School | 4,506 | 23.6% |
| High School | 4,083 | 21.4% |
| College / Undergraduate | 3,382 | 17.7% |
| Graduate / Professional | 568 | 3.0% |
| Total | 19,051 | 100.0% |
School Enrollment by Age by Funding Source in Muskingum County
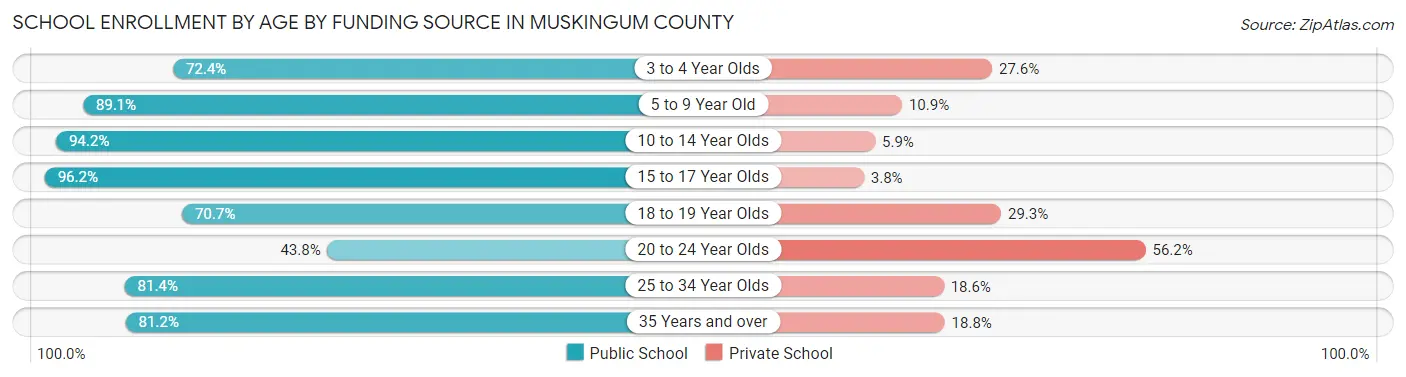
Out of a total of 19,051 students who are enrolled in schools in Muskingum County, 2,877 (15.1%) attend a private institution, while the remaining 16,174 (84.9%) are enrolled in public schools. The age group of 20 to 24 year olds has the highest likelihood of being enrolled in private schools, with 993 (56.2% in the age bracket) enrolled. Conversely, the age group of 15 to 17 year olds has the lowest likelihood of being enrolled in a private school, with 3,124 (96.2% in the age bracket) attending a public institution.
| Age Bracket | Public School | Private School |
| 3 to 4 Year Olds | 691 (72.4%) | 264 (27.6%) |
| 5 to 9 Year Old | 4,555 (89.1%) | 555 (10.9%) |
| 10 to 14 Year Olds | 5,024 (94.2%) | 312 (5.9%) |
| 15 to 17 Year Olds | 3,124 (96.2%) | 122 (3.8%) |
| 18 to 19 Year Olds | 928 (70.7%) | 385 (29.3%) |
| 20 to 24 Year Olds | 773 (43.8%) | 993 (56.2%) |
| 25 to 34 Year Olds | 546 (81.4%) | 125 (18.6%) |
| 35 Years and over | 531 (81.2%) | 123 (18.8%) |
| Total | 16,174 (84.9%) | 2,877 (15.1%) |
Educational Attainment by Field of Study in Muskingum County
Education (2,816 | 22.4%), business (2,594 | 20.7%), science & technology (2,082 | 16.6%), bio, nature & agricultural (685 | 5.5%), and engineering (624 | 5.0%) are the most common fields of study among 12,550 individuals in Muskingum County who have obtained a bachelor's degree or higher.
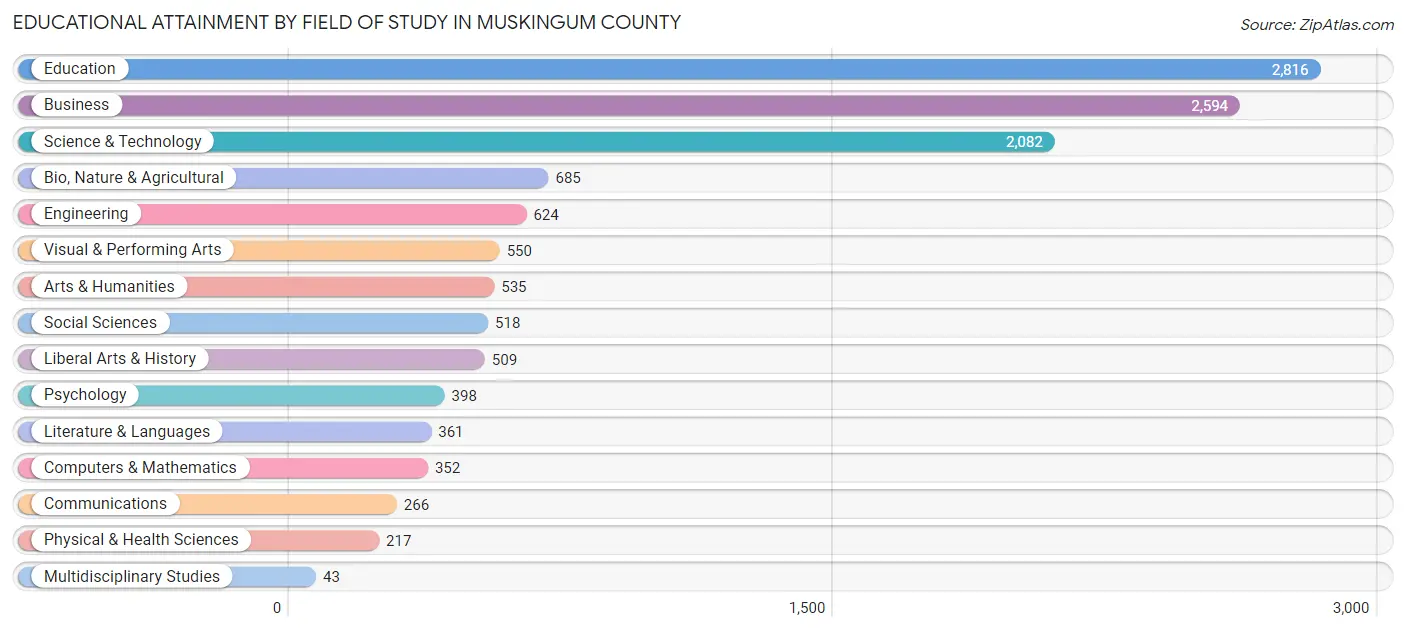
| Field of Study | # Graduates | % Graduates |
| Computers & Mathematics | 352 | 2.8% |
| Bio, Nature & Agricultural | 685 | 5.5% |
| Physical & Health Sciences | 217 | 1.7% |
| Psychology | 398 | 3.2% |
| Social Sciences | 518 | 4.1% |
| Engineering | 624 | 5.0% |
| Multidisciplinary Studies | 43 | 0.3% |
| Science & Technology | 2,082 | 16.6% |
| Business | 2,594 | 20.7% |
| Education | 2,816 | 22.4% |
| Literature & Languages | 361 | 2.9% |
| Liberal Arts & History | 509 | 4.1% |
| Visual & Performing Arts | 550 | 4.4% |
| Communications | 266 | 2.1% |
| Arts & Humanities | 535 | 4.3% |
| Total | 12,550 | 100.0% |
Transportation & Commute in Muskingum County
Vehicle Availability by Sex in Muskingum County
The most prevalent vehicle ownership categories in Muskingum County are males with 2 vehicles (7,997, accounting for 39.1%) and females with 2 vehicles (7,281, making up 44.0%).

| Vehicles Available | Male | Female |
| No Vehicle | 467 (2.3%) | 294 (1.6%) |
| 1 Vehicle | 2,713 (13.3%) | 3,260 (17.9%) |
| 2 Vehicles | 7,997 (39.1%) | 7,281 (40.1%) |
| 3 Vehicles | 5,459 (26.7%) | 4,331 (23.8%) |
| 4 Vehicles | 1,720 (8.4%) | 1,428 (7.9%) |
| 5 or more Vehicles | 2,080 (10.2%) | 1,579 (8.7%) |
| Total | 20,436 (100.0%) | 18,173 (100.0%) |
Commute Time in Muskingum County
The most frequently occuring commute durations in Muskingum County are 10 to 14 minutes (7,000 commuters, 18.8%), 15 to 19 minutes (6,149 commuters, 16.5%), and 20 to 24 minutes (4,585 commuters, 12.3%).

| Commute Time | # Commuters | % Commuters |
| Less than 5 Minutes | 1,603 | 4.3% |
| 5 to 9 Minutes | 3,822 | 10.2% |
| 10 to 14 Minutes | 7,000 | 18.8% |
| 15 to 19 Minutes | 6,149 | 16.5% |
| 20 to 24 Minutes | 4,585 | 12.3% |
| 25 to 29 Minutes | 2,643 | 7.1% |
| 30 to 34 Minutes | 2,993 | 8.0% |
| 35 to 39 Minutes | 914 | 2.5% |
| 40 to 44 Minutes | 1,150 | 3.1% |
| 45 to 59 Minutes | 2,894 | 7.7% |
| 60 to 89 Minutes | 2,750 | 7.4% |
| 90 or more Minutes | 820 | 2.2% |
Commute Time by Sex in Muskingum County
The most common commute times in Muskingum County are 10 to 14 minutes (3,463 commuters, 17.4%) for males and 10 to 14 minutes (3,537 commuters, 20.3%) for females.

| Commute Time | Male | Female |
| Less than 5 Minutes | 967 (4.9%) | 636 (3.6%) |
| 5 to 9 Minutes | 2,027 (10.2%) | 1,795 (10.3%) |
| 10 to 14 Minutes | 3,463 (17.4%) | 3,537 (20.3%) |
| 15 to 19 Minutes | 2,692 (13.5%) | 3,457 (19.8%) |
| 20 to 24 Minutes | 2,157 (10.8%) | 2,428 (13.9%) |
| 25 to 29 Minutes | 1,418 (7.1%) | 1,225 (7.0%) |
| 30 to 34 Minutes | 1,800 (9.0%) | 1,193 (6.9%) |
| 35 to 39 Minutes | 513 (2.6%) | 401 (2.3%) |
| 40 to 44 Minutes | 443 (2.2%) | 707 (4.1%) |
| 45 to 59 Minutes | 1,889 (9.5%) | 1,005 (5.8%) |
| 60 to 89 Minutes | 1,951 (9.8%) | 799 (4.6%) |
| 90 or more Minutes | 578 (2.9%) | 242 (1.4%) |
Time of Departure to Work by Sex in Muskingum County
The most frequent times of departure to work in Muskingum County are 6:30 AM to 6:59 AM (2,392, 12.0%) for males and 7:00 AM to 7:29 AM (2,318, 13.3%) for females.
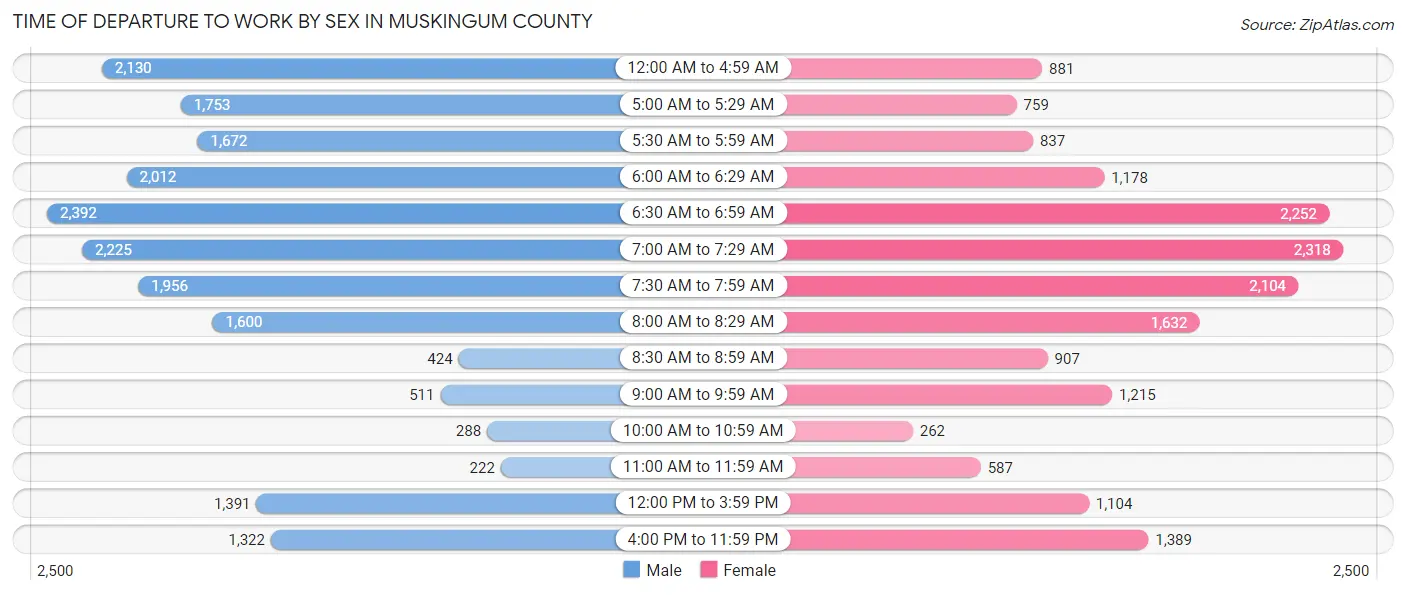
| Time of Departure | Male | Female |
| 12:00 AM to 4:59 AM | 2,130 (10.7%) | 881 (5.1%) |
| 5:00 AM to 5:29 AM | 1,753 (8.8%) | 759 (4.4%) |
| 5:30 AM to 5:59 AM | 1,672 (8.4%) | 837 (4.8%) |
| 6:00 AM to 6:29 AM | 2,012 (10.1%) | 1,178 (6.8%) |
| 6:30 AM to 6:59 AM | 2,392 (12.0%) | 2,252 (12.9%) |
| 7:00 AM to 7:29 AM | 2,225 (11.2%) | 2,318 (13.3%) |
| 7:30 AM to 7:59 AM | 1,956 (9.8%) | 2,104 (12.1%) |
| 8:00 AM to 8:29 AM | 1,600 (8.0%) | 1,632 (9.4%) |
| 8:30 AM to 8:59 AM | 424 (2.1%) | 907 (5.2%) |
| 9:00 AM to 9:59 AM | 511 (2.6%) | 1,215 (7.0%) |
| 10:00 AM to 10:59 AM | 288 (1.5%) | 262 (1.5%) |
| 11:00 AM to 11:59 AM | 222 (1.1%) | 587 (3.4%) |
| 12:00 PM to 3:59 PM | 1,391 (7.0%) | 1,104 (6.3%) |
| 4:00 PM to 11:59 PM | 1,322 (6.6%) | 1,389 (8.0%) |
| Total | 19,898 (100.0%) | 17,425 (100.0%) |
Housing Occupancy in Muskingum County
Occupancy by Ownership in Muskingum County
Of the total 34,599 dwellings in Muskingum County, owner-occupied units account for 23,828 (68.9%), while renter-occupied units make up 10,771 (31.1%).
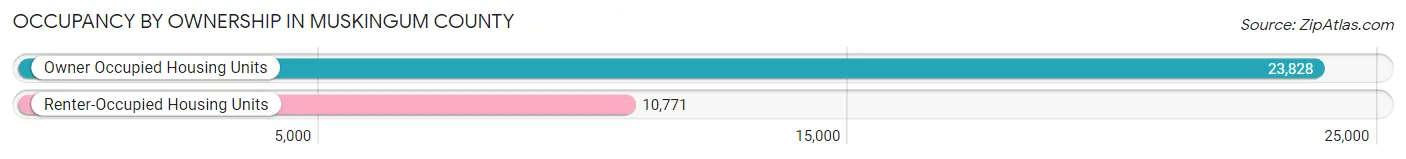
| Occupancy | # Housing Units | % Housing Units |
| Owner Occupied Housing Units | 23,828 | 68.9% |
| Renter-Occupied Housing Units | 10,771 | 31.1% |
| Total Occupied Housing Units | 34,599 | 100.0% |
Occupancy by Household Size in Muskingum County
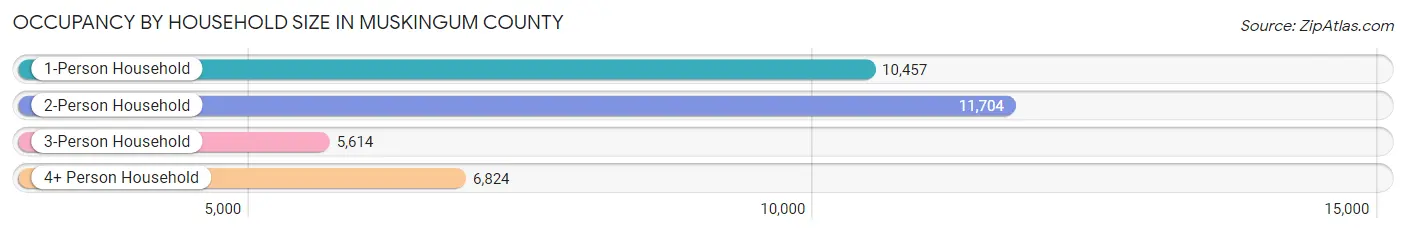
| Household Size | # Housing Units | % Housing Units |
| 1-Person Household | 10,457 | 30.2% |
| 2-Person Household | 11,704 | 33.8% |
| 3-Person Household | 5,614 | 16.2% |
| 4+ Person Household | 6,824 | 19.7% |
| Total Housing Units | 34,599 | 100.0% |
Occupancy by Ownership by Household Size in Muskingum County

| Household Size | Owner-occupied | Renter-occupied |
| 1-Person Household | 6,120 (58.5%) | 4,337 (41.5%) |
| 2-Person Household | 8,846 (75.6%) | 2,858 (24.4%) |
| 3-Person Household | 3,768 (67.1%) | 1,846 (32.9%) |
| 4+ Person Household | 5,094 (74.7%) | 1,730 (25.4%) |
| Total Housing Units | 23,828 (68.9%) | 10,771 (31.1%) |
Occupancy by Educational Attainment in Muskingum County
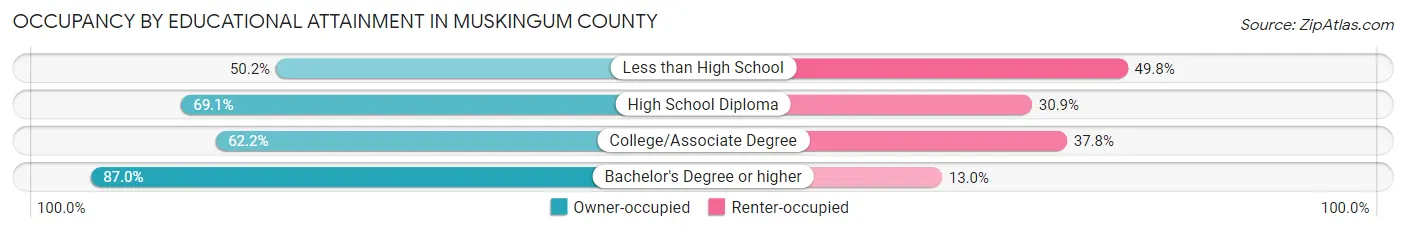
| Household Size | Owner-occupied | Renter-occupied |
| Less than High School | 1,517 (50.2%) | 1,507 (49.8%) |
| High School Diploma | 9,942 (69.1%) | 4,439 (30.9%) |
| College/Associate Degree | 6,496 (62.2%) | 3,947 (37.8%) |
| Bachelor's Degree or higher | 5,873 (87.0%) | 878 (13.0%) |
Occupancy by Age of Householder in Muskingum County

| Age Bracket | # Households | % Households |
| Under 35 Years | 5,944 | 17.2% |
| 35 to 44 Years | 5,176 | 15.0% |
| 45 to 54 Years | 6,267 | 18.1% |
| 55 to 64 Years | 7,309 | 21.1% |
| 65 to 74 Years | 5,610 | 16.2% |
| 75 to 84 Years | 2,973 | 8.6% |
| 85 Years and Over | 1,320 | 3.8% |
| Total | 34,599 | 100.0% |
Housing Finances in Muskingum County
Median Income by Occupancy in Muskingum County

| Occupancy Type | # Households | Median Income |
| Owner-Occupied | 23,828 (68.9%) | $71,599 |
| Renter-Occupied | 10,771 (31.1%) | $32,266 |
| Average | 34,599 (100.0%) | $56,810 |
Occupancy by Householder Income Bracket in Muskingum County
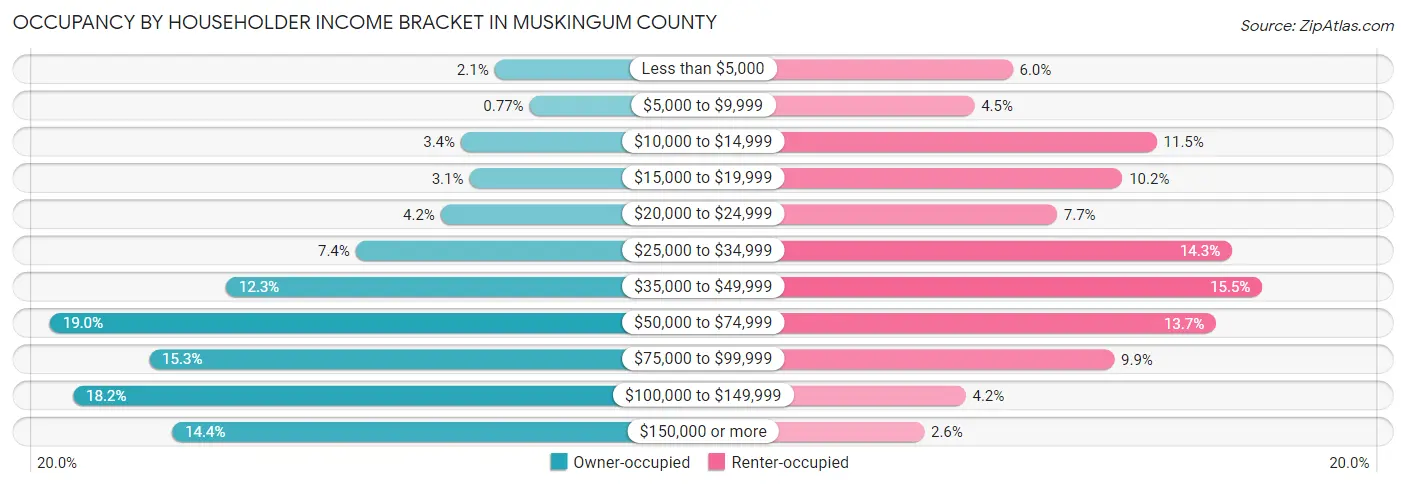
| Income Bracket | Owner-occupied | Renter-occupied |
| Less than $5,000 | 501 (2.1%) | 644 (6.0%) |
| $5,000 to $9,999 | 183 (0.8%) | 487 (4.5%) |
| $10,000 to $14,999 | 805 (3.4%) | 1,235 (11.5%) |
| $15,000 to $19,999 | 729 (3.1%) | 1,094 (10.2%) |
| $20,000 to $24,999 | 988 (4.2%) | 826 (7.7%) |
| $25,000 to $34,999 | 1,762 (7.4%) | 1,545 (14.3%) |
| $35,000 to $49,999 | 2,938 (12.3%) | 1,668 (15.5%) |
| $50,000 to $74,999 | 4,536 (19.0%) | 1,479 (13.7%) |
| $75,000 to $99,999 | 3,635 (15.3%) | 1,061 (9.9%) |
| $100,000 to $149,999 | 4,324 (18.1%) | 451 (4.2%) |
| $150,000 or more | 3,427 (14.4%) | 281 (2.6%) |
| Total | 23,828 (100.0%) | 10,771 (100.0%) |
Monthly Housing Cost Tiers in Muskingum County

| Monthly Cost | Owner-occupied | Renter-occupied |
| Less than $300 | 1,877 (7.9%) | 719 (6.7%) |
| $300 to $499 | 4,029 (16.9%) | 702 (6.5%) |
| $500 to $799 | 4,878 (20.5%) | 4,071 (37.8%) |
| $800 to $999 | 2,636 (11.1%) | 1,771 (16.4%) |
| $1,000 to $1,499 | 5,624 (23.6%) | 2,442 (22.7%) |
| $1,500 to $1,999 | 2,841 (11.9%) | 205 (1.9%) |
| $2,000 to $2,499 | 1,168 (4.9%) | 135 (1.3%) |
| $2,500 to $2,999 | 273 (1.1%) | 0 (0.0%) |
| $3,000 or more | 502 (2.1%) | 178 (1.7%) |
| Total | 23,828 (100.0%) | 10,771 (100.0%) |
Physical Housing Characteristics in Muskingum County
Housing Structures in Muskingum County
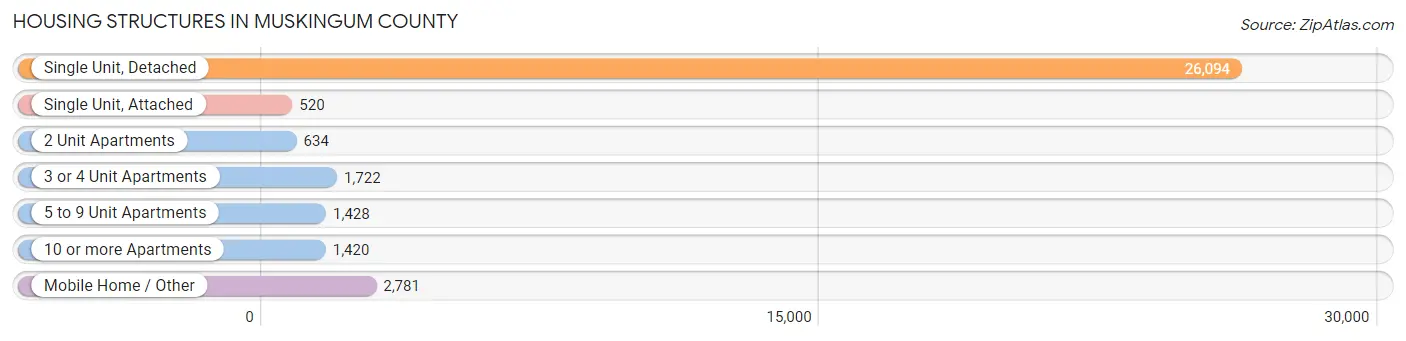
| Structure Type | # Housing Units | % Housing Units |
| Single Unit, Detached | 26,094 | 75.4% |
| Single Unit, Attached | 520 | 1.5% |
| 2 Unit Apartments | 634 | 1.8% |
| 3 or 4 Unit Apartments | 1,722 | 5.0% |
| 5 to 9 Unit Apartments | 1,428 | 4.1% |
| 10 or more Apartments | 1,420 | 4.1% |
| Mobile Home / Other | 2,781 | 8.0% |
| Total | 34,599 | 100.0% |
Housing Structures by Occupancy in Muskingum County
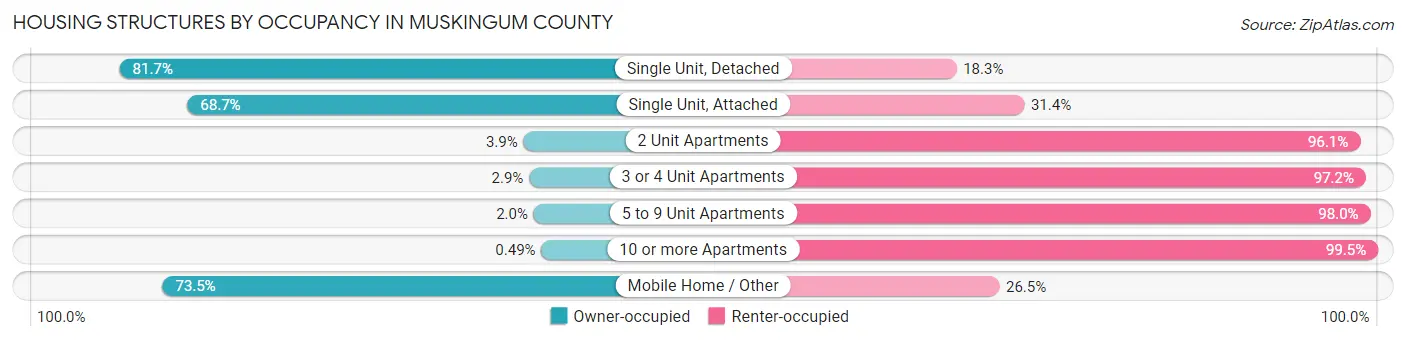
| Structure Type | Owner-occupied | Renter-occupied |
| Single Unit, Detached | 21,319 (81.7%) | 4,775 (18.3%) |
| Single Unit, Attached | 357 (68.6%) | 163 (31.4%) |
| 2 Unit Apartments | 25 (3.9%) | 609 (96.1%) |
| 3 or 4 Unit Apartments | 49 (2.9%) | 1,673 (97.2%) |
| 5 to 9 Unit Apartments | 28 (2.0%) | 1,400 (98.0%) |
| 10 or more Apartments | 7 (0.5%) | 1,413 (99.5%) |
| Mobile Home / Other | 2,043 (73.5%) | 738 (26.5%) |
| Total | 23,828 (68.9%) | 10,771 (31.1%) |
Housing Structures by Number of Rooms in Muskingum County
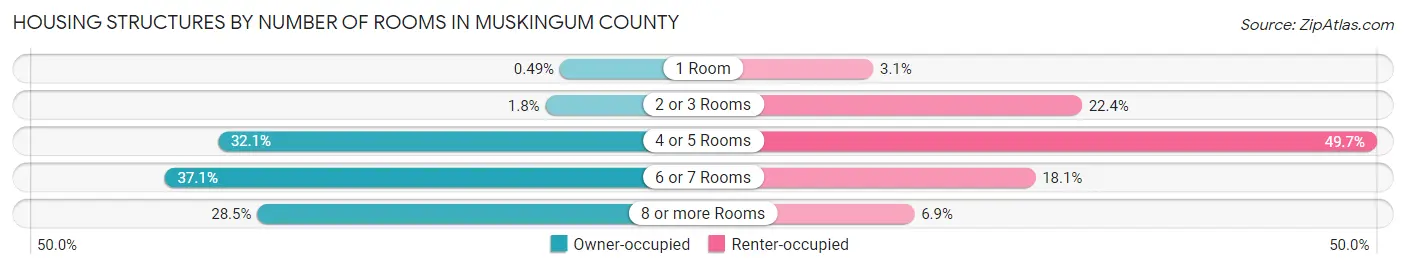
| Number of Rooms | Owner-occupied | Renter-occupied |
| 1 Room | 117 (0.5%) | 330 (3.1%) |
| 2 or 3 Rooms | 436 (1.8%) | 2,408 (22.4%) |
| 4 or 5 Rooms | 7,659 (32.1%) | 5,348 (49.6%) |
| 6 or 7 Rooms | 8,830 (37.1%) | 1,945 (18.1%) |
| 8 or more Rooms | 6,786 (28.5%) | 740 (6.9%) |
| Total | 23,828 (100.0%) | 10,771 (100.0%) |
Housing Structure by Heating Type in Muskingum County

| Heating Type | Owner-occupied | Renter-occupied |
| Utility Gas | 14,470 (60.7%) | 4,629 (43.0%) |
| Bottled, Tank, or LP Gas | 2,128 (8.9%) | 243 (2.3%) |
| Electricity | 4,603 (19.3%) | 5,473 (50.8%) |
| Fuel Oil or Kerosene | 1,115 (4.7%) | 222 (2.1%) |
| Coal or Coke | 3 (0.0%) | 0 (0.0%) |
| All other Fuels | 1,402 (5.9%) | 169 (1.6%) |
| No Fuel Used | 107 (0.4%) | 35 (0.3%) |
| Total | 23,828 (100.0%) | 10,771 (100.0%) |
Household Vehicle Usage in Muskingum County
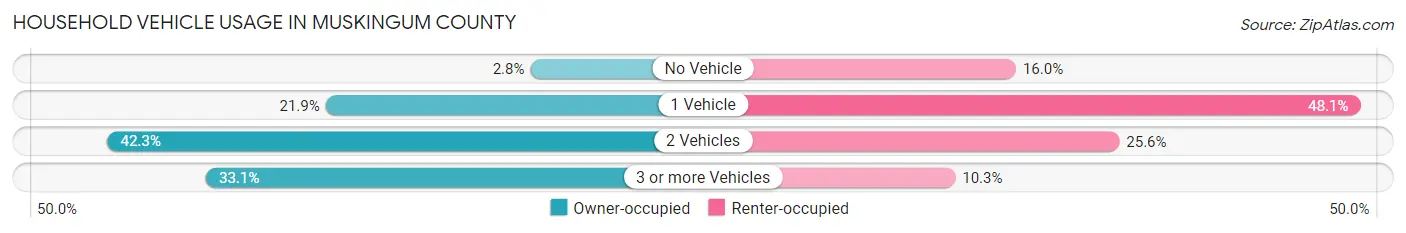
| Vehicles per Household | Owner-occupied | Renter-occupied |
| No Vehicle | 664 (2.8%) | 1,720 (16.0%) |
| 1 Vehicle | 5,220 (21.9%) | 5,182 (48.1%) |
| 2 Vehicles | 10,067 (42.2%) | 2,760 (25.6%) |
| 3 or more Vehicles | 7,877 (33.1%) | 1,109 (10.3%) |
| Total | 23,828 (100.0%) | 10,771 (100.0%) |
Real Estate & Mortgages in Muskingum County
Real Estate and Mortgage Overview in Muskingum County
| Characteristic | Without Mortgage | With Mortgage |
| Housing Units | 9,455 | 14,373 |
| Median Property Value | $133,900 | $167,000 |
| Median Household Income | $51,093 | $2,675 |
| Monthly Housing Costs | $453 | $491 |
| Real Estate Taxes | $1,306 | $232 |
Property Value by Mortgage Status in Muskingum County
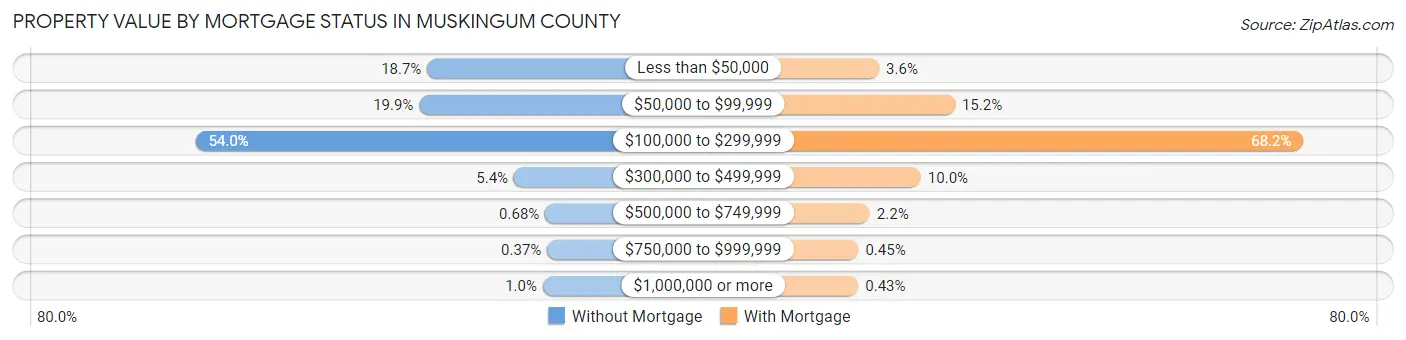
| Property Value | Without Mortgage | With Mortgage |
| Less than $50,000 | 1,763 (18.6%) | 517 (3.6%) |
| $50,000 to $99,999 | 1,879 (19.9%) | 2,178 (15.1%) |
| $100,000 to $299,999 | 5,102 (54.0%) | 9,806 (68.2%) |
| $300,000 to $499,999 | 514 (5.4%) | 1,431 (10.0%) |
| $500,000 to $749,999 | 64 (0.7%) | 315 (2.2%) |
| $750,000 to $999,999 | 35 (0.4%) | 64 (0.4%) |
| $1,000,000 or more | 98 (1.0%) | 62 (0.4%) |
| Total | 9,455 (100.0%) | 14,373 (100.0%) |
Household Income by Mortgage Status in Muskingum County

| Household Income | Without Mortgage | With Mortgage |
| Less than $10,000 | 403 (4.3%) | 497 (3.5%) |
| $10,000 to $24,999 | 1,570 (16.6%) | 281 (2.0%) |
| $25,000 to $34,999 | 967 (10.2%) | 952 (6.6%) |
| $35,000 to $49,999 | 1,673 (17.7%) | 795 (5.5%) |
| $50,000 to $74,999 | 1,893 (20.0%) | 1,265 (8.8%) |
| $75,000 to $99,999 | 1,127 (11.9%) | 2,643 (18.4%) |
| $100,000 to $149,999 | 1,070 (11.3%) | 2,508 (17.4%) |
| $150,000 or more | 752 (8.0%) | 3,254 (22.6%) |
| Total | 9,455 (100.0%) | 14,373 (100.0%) |
Property Value to Household Income Ratio in Muskingum County
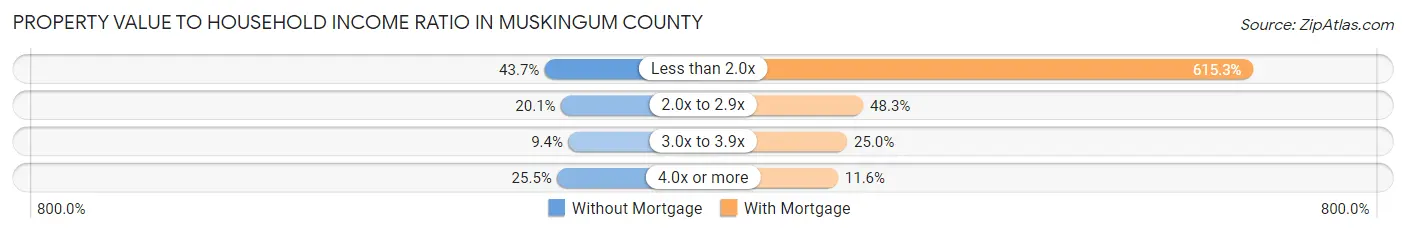
| Value-to-Income Ratio | Without Mortgage | With Mortgage |
| Less than 2.0x | 4,132 (43.7%) | 88,436 (615.3%) |
| 2.0x to 2.9x | 1,898 (20.1%) | 6,943 (48.3%) |
| 3.0x to 3.9x | 888 (9.4%) | 3,590 (25.0%) |
| 4.0x or more | 2,410 (25.5%) | 1,663 (11.6%) |
| Total | 9,455 (100.0%) | 14,373 (100.0%) |
Real Estate Taxes by Mortgage Status in Muskingum County
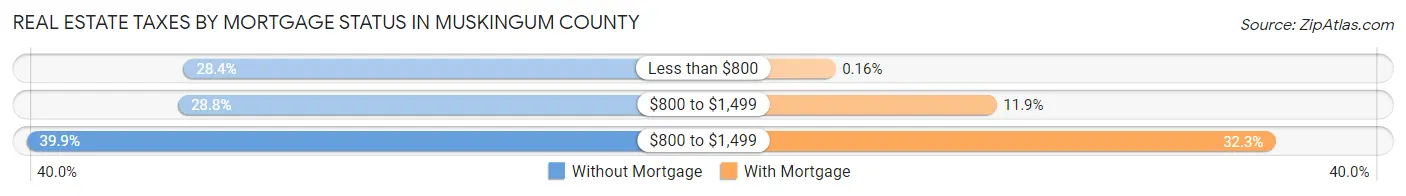
| Property Taxes | Without Mortgage | With Mortgage |
| Less than $800 | 2,685 (28.4%) | 23 (0.2%) |
| $800 to $1,499 | 2,722 (28.8%) | 1,714 (11.9%) |
| $800 to $1,499 | 3,768 (39.9%) | 4,642 (32.3%) |
| Total | 9,455 (100.0%) | 14,373 (100.0%) |
Health & Disability in Muskingum County
Health Insurance Coverage by Age in Muskingum County

| Age Bracket | With Coverage | Without Coverage |
| Under 6 Years | 5,969 (96.7%) | 204 (3.3%) |
| 6 to 18 Years | 13,608 (95.4%) | 655 (4.6%) |
| 19 to 25 Years | 7,085 (90.4%) | 749 (9.6%) |
| 26 to 34 Years | 8,355 (88.9%) | 1,040 (11.1%) |
| 35 to 44 Years | 9,061 (90.8%) | 913 (9.1%) |
| 45 to 54 Years | 10,115 (91.4%) | 955 (8.6%) |
| 55 to 64 Years | 11,123 (94.3%) | 673 (5.7%) |
| 65 to 74 Years | 9,069 (99.8%) | 20 (0.2%) |
| 75 Years and older | 5,938 (99.6%) | 23 (0.4%) |
| Total | 80,323 (93.9%) | 5,232 (6.1%) |
Health Insurance Coverage by Citizenship Status in Muskingum County

| Citizenship Status | With Coverage | Without Coverage |
| Native Born | 5,969 (96.7%) | 204 (3.3%) |
| Foreign Born, Citizen | 13,608 (95.4%) | 655 (4.6%) |
| Foreign Born, not a Citizen | 7,085 (90.4%) | 749 (9.6%) |
Health Insurance Coverage by Household Income in Muskingum County

| Household Income | With Coverage | Without Coverage |
| Under $25,000 | 11,743 (91.7%) | 1,062 (8.3%) |
| $25,000 to $49,999 | 15,080 (92.6%) | 1,197 (7.3%) |
| $50,000 to $74,999 | 13,411 (95.0%) | 708 (5.0%) |
| $75,000 to $99,999 | 11,762 (92.4%) | 965 (7.6%) |
| $100,000 and over | 27,310 (95.7%) | 1,221 (4.3%) |
Public vs Private Health Insurance Coverage by Age in Muskingum County
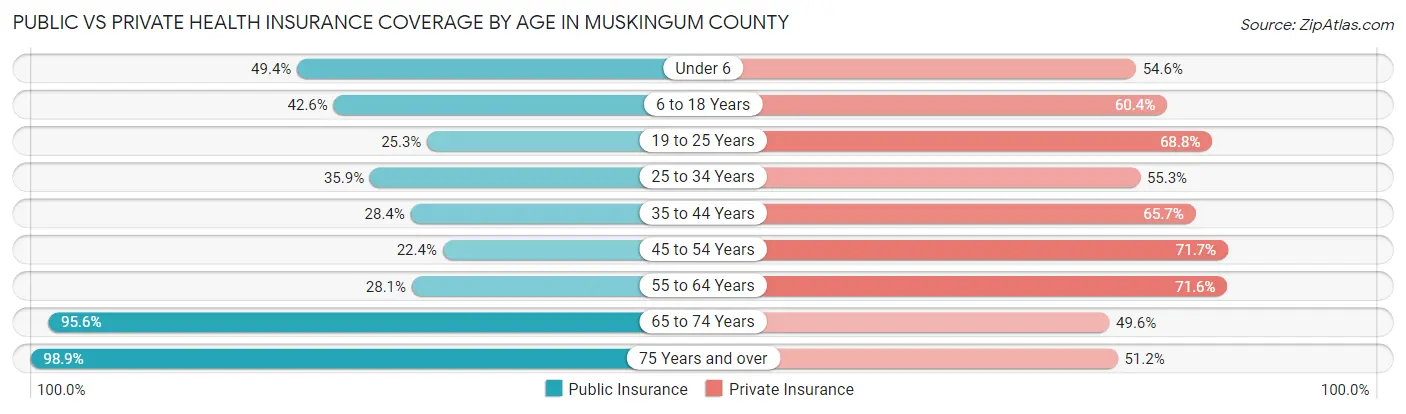
| Age Bracket | Public Insurance | Private Insurance |
| Under 6 | 3,050 (49.4%) | 3,368 (54.6%) |
| 6 to 18 Years | 6,082 (42.6%) | 8,609 (60.4%) |
| 19 to 25 Years | 1,980 (25.3%) | 5,386 (68.8%) |
| 25 to 34 Years | 3,372 (35.9%) | 5,199 (55.3%) |
| 35 to 44 Years | 2,828 (28.3%) | 6,550 (65.7%) |
| 45 to 54 Years | 2,479 (22.4%) | 7,932 (71.7%) |
| 55 to 64 Years | 3,317 (28.1%) | 8,441 (71.6%) |
| 65 to 74 Years | 8,693 (95.6%) | 4,510 (49.6%) |
| 75 Years and over | 5,897 (98.9%) | 3,050 (51.2%) |
| Total | 37,698 (44.1%) | 53,045 (62.0%) |
Disability Status by Sex by Age in Muskingum County
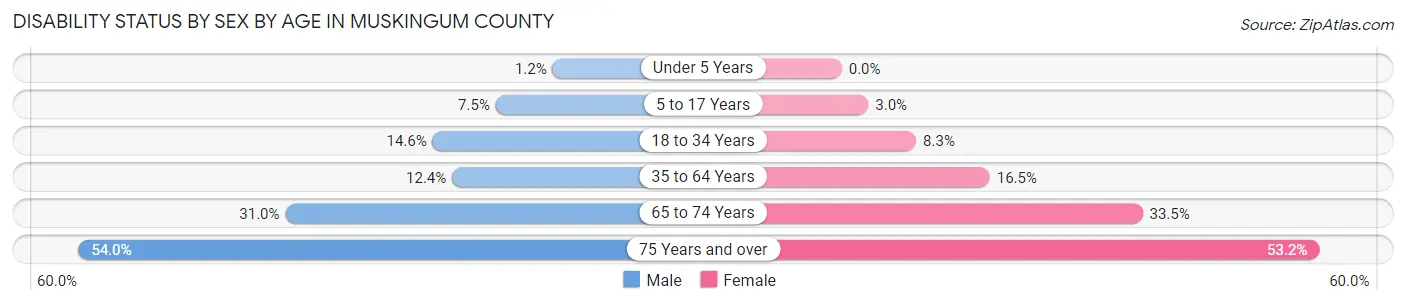
| Age Bracket | Male | Female |
| Under 5 Years | 31 (1.2%) | 0 (0.0%) |
| 5 to 17 Years | 540 (7.5%) | 210 (3.0%) |
| 18 to 34 Years | 1,355 (14.6%) | 740 (8.3%) |
| 35 to 64 Years | 1,998 (12.4%) | 2,753 (16.5%) |
| 65 to 74 Years | 1,319 (31.0%) | 1,617 (33.5%) |
| 75 Years and over | 1,316 (54.0%) | 1,874 (53.2%) |
Disability Class by Sex by Age in Muskingum County
Disability Class: Hearing Difficulty

| Age Bracket | Male | Female |
| Under 5 Years | 31 (1.2%) | 0 (0.0%) |
| 5 to 17 Years | 28 (0.4%) | 22 (0.3%) |
| 18 to 34 Years | 316 (3.4%) | 118 (1.3%) |
| 35 to 64 Years | 598 (3.7%) | 604 (3.6%) |
| 65 to 74 Years | 758 (17.8%) | 444 (9.2%) |
| 75 Years and over | 880 (36.1%) | 776 (22.0%) |
Disability Class: Vision Difficulty
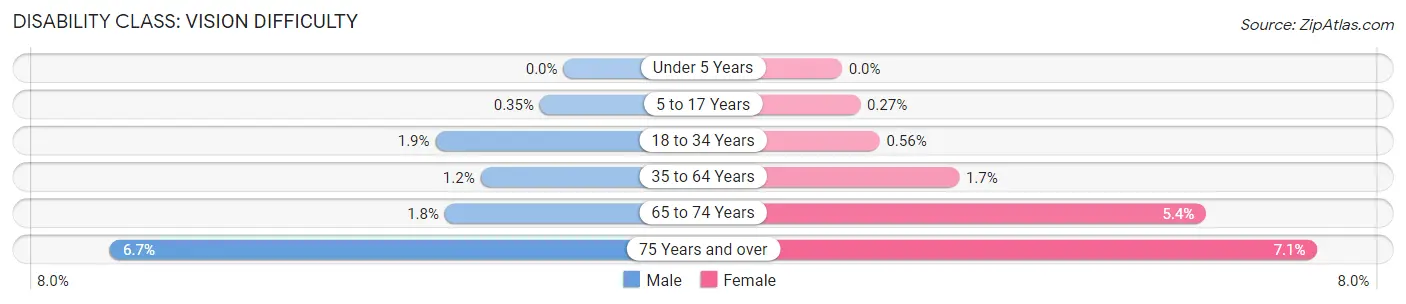
| Age Bracket | Male | Female |
| Under 5 Years | 0 (0.0%) | 0 (0.0%) |
| 5 to 17 Years | 25 (0.4%) | 19 (0.3%) |
| 18 to 34 Years | 177 (1.9%) | 50 (0.6%) |
| 35 to 64 Years | 199 (1.2%) | 291 (1.7%) |
| 65 to 74 Years | 75 (1.8%) | 261 (5.4%) |
| 75 Years and over | 164 (6.7%) | 249 (7.1%) |
Disability Class: Cognitive Difficulty

| Age Bracket | Male | Female |
| 5 to 17 Years | 495 (6.9%) | 169 (2.4%) |
| 18 to 34 Years | 807 (8.7%) | 498 (5.6%) |
| 35 to 64 Years | 681 (4.2%) | 989 (5.9%) |
| 65 to 74 Years | 171 (4.0%) | 451 (9.3%) |
| 75 Years and over | 89 (3.6%) | 488 (13.8%) |
Disability Class: Ambulatory Difficulty
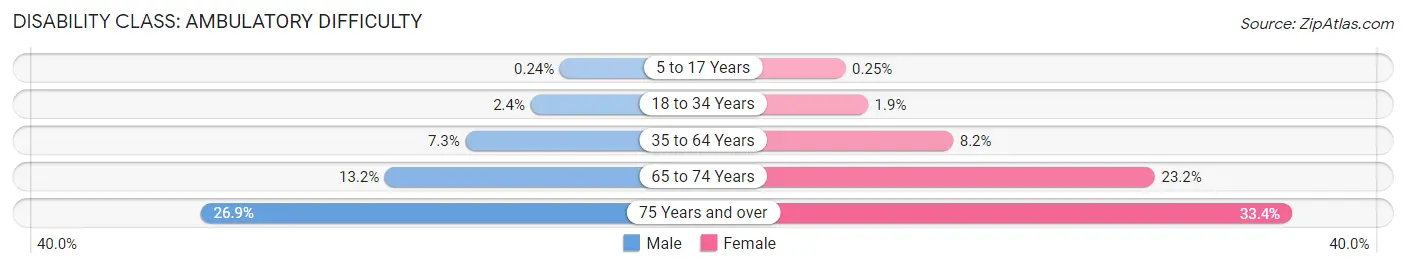
| Age Bracket | Male | Female |
| 5 to 17 Years | 17 (0.2%) | 18 (0.3%) |
| 18 to 34 Years | 225 (2.4%) | 172 (1.9%) |
| 35 to 64 Years | 1,171 (7.3%) | 1,376 (8.2%) |
| 65 to 74 Years | 564 (13.2%) | 1,121 (23.2%) |
| 75 Years and over | 656 (26.9%) | 1,178 (33.4%) |
Disability Class: Self-Care Difficulty
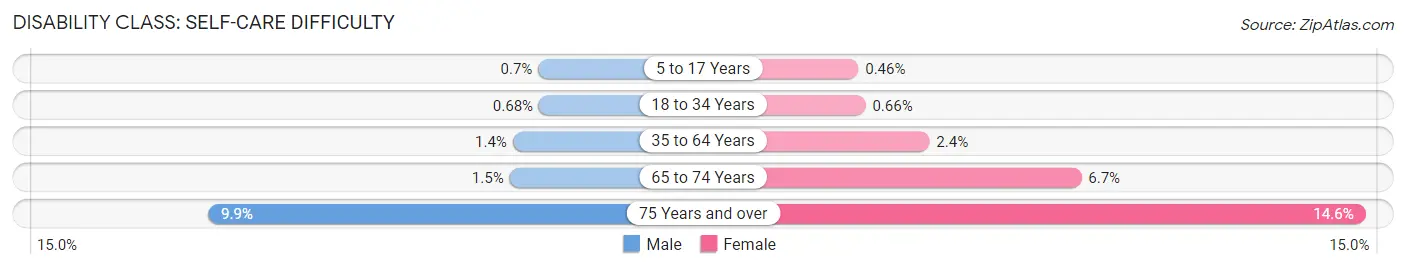
| Age Bracket | Male | Female |
| 5 to 17 Years | 50 (0.7%) | 33 (0.5%) |
| 18 to 34 Years | 63 (0.7%) | 59 (0.7%) |
| 35 to 64 Years | 228 (1.4%) | 407 (2.4%) |
| 65 to 74 Years | 64 (1.5%) | 322 (6.7%) |
| 75 Years and over | 241 (9.9%) | 514 (14.6%) |
Technology Access in Muskingum County
Computing Device Access in Muskingum County
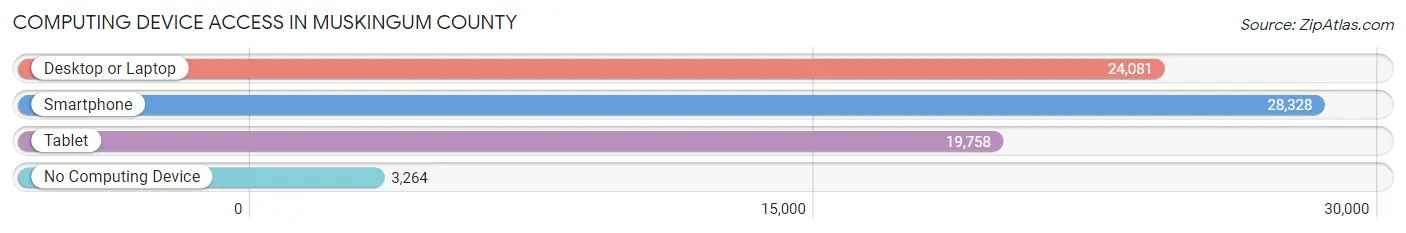
| Device Type | # Households | % Households |
| Desktop or Laptop | 24,081 | 69.6% |
| Smartphone | 28,328 | 81.9% |
| Tablet | 19,758 | 57.1% |
| No Computing Device | 3,264 | 9.4% |
| Total | 34,599 | 100.0% |
Internet Access in Muskingum County
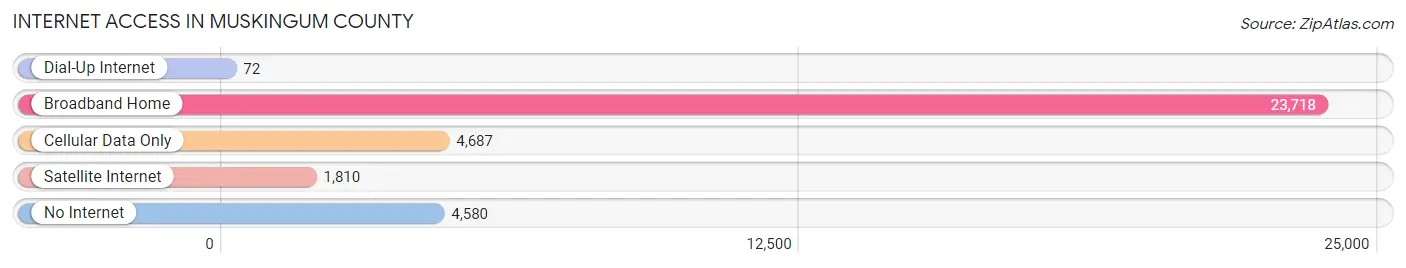
| Internet Type | # Households | % Households |
| Dial-Up Internet | 72 | 0.2% |
| Broadband Home | 23,718 | 68.5% |
| Cellular Data Only | 4,687 | 13.6% |
| Satellite Internet | 1,810 | 5.2% |
| No Internet | 4,580 | 13.2% |
| Total | 34,599 | 100.0% |
Muskingum County Summary
Muskingum County is located in the east-central region of Ohio, and is part of the Appalachian Plateau. It is bordered by Coshocton County to the north, Perry County to the east, Morgan County to the south, and Licking County to the west. The county seat is Zanesville, which is also the largest city in the county. The county was established in 1804 and is named after the Muskingum River, which runs through the county.
Geography
Muskingum County covers an area of 602 square miles, making it the 25th largest county in Ohio. The county is located in the Appalachian Plateau region of Ohio, and is characterized by rolling hills and valleys. The highest point in the county is located at the intersection of Muskingum and Coshocton counties, at an elevation of 1,092 feet. The county is drained by the Muskingum River, which flows through the county from north to south. Other major waterways in the county include the Licking River, the Walhonding River, and the Tuscarawas River.
The county is home to several state parks, including Dillon State Park, Blue Rock State Park, and Wolf Run State Park. The county also contains several wildlife areas, including the Muskingum River Wildlife Area, the Blue Rock Wildlife Area, and the Wolf Run Wildlife Area.
Demographics
As of the 2010 census, Muskingum County had a population of 86,074. The racial makeup of the county was 94.2% White, 3.3% African American, 0.3% Native American, 0.5% Asian, 0.2% Pacific Islander, 0.5% from other races, and 1.0% from two or more races. Hispanic or Latino of any race were 1.3% of the population.
The median household income in the county was $41,945, and the median family income was $51,945. The per capita income was $20,945. About 11.2% of the population was below the poverty line.
Economy
Muskingum County’s economy is largely based on manufacturing and agriculture. The county is home to several large manufacturing companies, including the Zanesville-based American Electric Power, which is the largest employer in the county. Other major employers in the county include the Zanesville-based Longaberger Company, the Zanesville-based Muskingum Iron and Steel Company, and the Zanesville-based Muskingum Valley Health System.
Agriculture is also an important part of the county’s economy. The county is home to several large farms, including the Zanesville-based Muskingum Valley Farm, which is the largest farm in the county. Other major agricultural products in the county include corn, soybeans, wheat, hay, and livestock.
History
Muskingum County was established in 1804 and was named after the Muskingum River, which runs through the county. The county was originally part of the Northwest Territory, and was later part of the Ohio Territory. The county was home to several Native American tribes, including the Delaware, Shawnee, and Wyandot.
The county was an important part of the Underground Railroad, and was home to several prominent abolitionists, including John Rankin and Levi Coffin. The county was also home to several Civil War battles, including the Battle of Zanesville in 1863.
The county was home to several prominent figures in American history, including President William McKinley, who was born in Niles, Ohio, in 1843. The county was also home to several prominent industrialists, including John and William Longaberger, who founded the Longaberger Company in Zanesville in 1923.
Today, Muskingum County is a vibrant and diverse community, with a strong economy and a rich history. The county is home to several museums, including the National Road/Zane Grey Museum, the John and Annie Glenn Historic Site, and the Zanesville Museum of Art. The county is also home to several festivals and events, including the Muskingum County Fair, the Zanesville Art Fair, and the Muskingum County Music Festival.
Common Questions
What is the Total Population of Muskingum County?
Total Population of Muskingum County is 86,393.
What is the Total Male Population of Muskingum County?
Total Male Population of Muskingum County is 42,320.
What is the Total Female Population of Muskingum County?
Total Female Population of Muskingum County is 44,073.
What is the Ratio of Males per 100 Females in Muskingum County?
There are 96.02 Males per 100 Females in Muskingum County.
What is the Ratio of Females per 100 Males in Muskingum County?
There are 104.14 Females per 100 Males in Muskingum County.
What is the Median Population Age in Muskingum County?
Median Population Age in Muskingum County is 40.5 Years.
What is the Average Family Size in Muskingum County
Average Family Size in Muskingum County is 3.0 People.
What is the Average Household Size in Muskingum County
Average Household Size in Muskingum County is 2.4 People.
What is Per Capita Income in Muskingum County?
Per Capita income in Muskingum County is $31,436.
What is the Median Family Income in Muskingum County?
Median Family Income in Muskingum County is $71,728.
What is the Median Household income in Muskingum County?
Median Household Income in Muskingum County is $56,810.
What is Income or Wage Gap in Muskingum County?
Income or Wage Gap in Muskingum County is 28.9%.
Women in Muskingum County earn 71.1 cents for every dollar earned by a man.
What is Family Income Deficit in Muskingum County?
Family Income Deficit in Muskingum County is $10,473.
Families that are below poverty line in Muskingum County earn $10,473 less on average than the poverty threshold level.
What is Inequality or Gini Index in Muskingum County?
Inequality or Gini Index in Muskingum County is 0.46.
How Large is the Labor Force in Muskingum County?
There are 41,487 People in the Labor Forcein in Muskingum County.
What is the Percentage of People in the Labor Force in Muskingum County?
60.2% of People are in the Labor Force in Muskingum County.
What is the Unemployment Rate in Muskingum County?
Unemployment Rate in Muskingum County is 4.6%.