Morrow County, OH
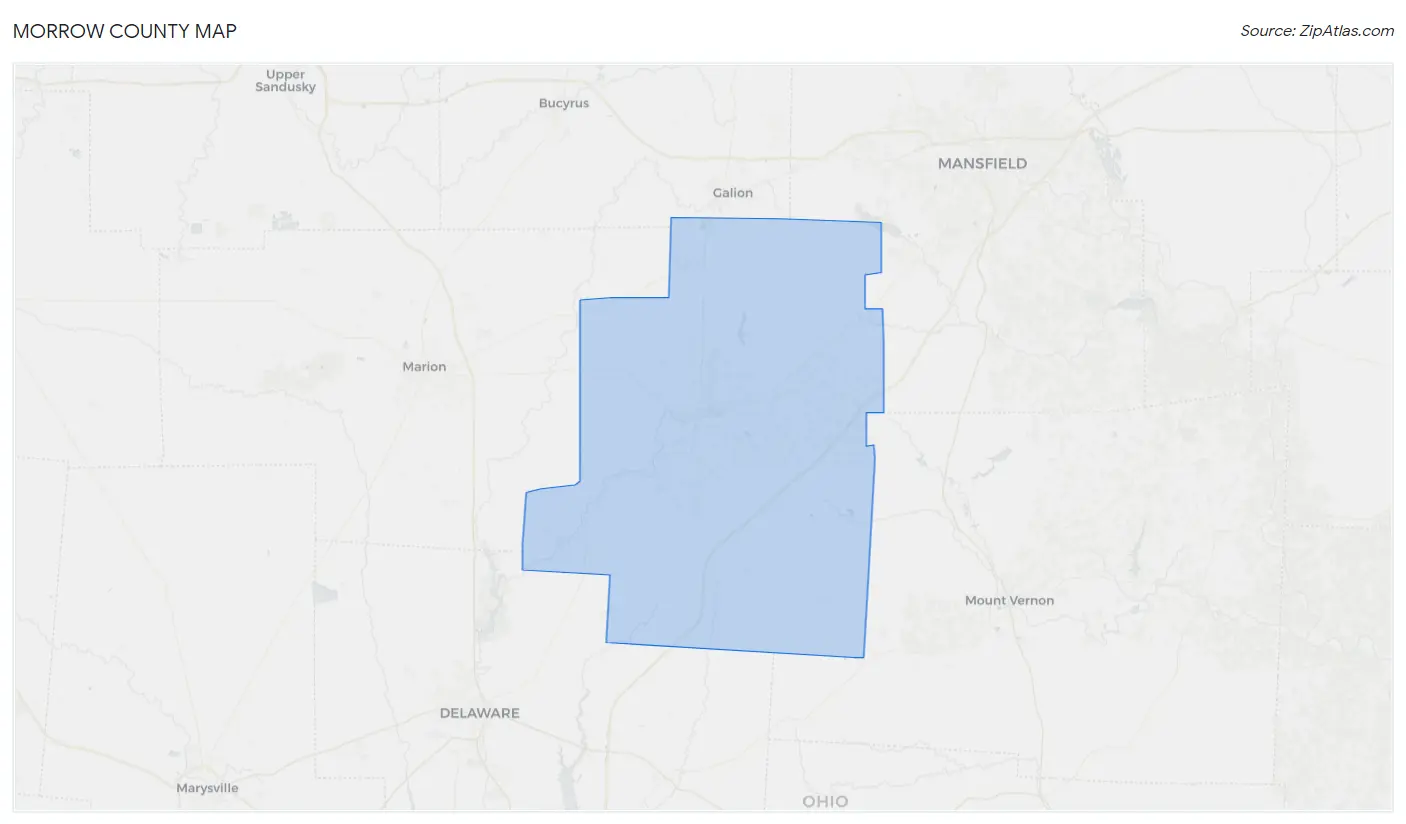
Morrow County Map
Morrow County Overview
35,049
TOTAL POPULATION
17,821
MALE POPULATION
17,228
FEMALE POPULATION
103.44
MALES / 100 FEMALES
96.67
FEMALES / 100 MALES
42.7
MEDIAN AGE
3.0
AVG FAMILY SIZE
2.6
AVG HOUSEHOLD SIZE
$32,987
PER CAPITA INCOME
$77,618
AVG FAMILY INCOME
$70,412
AVG HOUSEHOLD INCOME
24.3%
WAGE / INCOME GAP [ % ]
75.7¢/ $1
WAGE / INCOME GAP [ $ ]
$8,754
FAMILY INCOME DEFICIT
0.37
INEQUALITY / GINI INDEX
17,795
LABOR FORCE [ PEOPLE ]
62.9%
PERCENT IN LABOR FORCE
2.6%
UNEMPLOYMENT RATE
Race in Morrow County
The most populous races in Morrow County are White / Caucasian (33,434 | 95.4%), Two or more Races (875 | 2.5%), and Hispanic or Latino (605 | 1.7%).

| Race | # Population | % Population |
| Asian | 154 | 0.4% |
| Black / African American | 240 | 0.7% |
| Hawaiian / Pacific | 0 | 0.0% |
| Hispanic or Latino | 605 | 1.7% |
| Native / Alaskan | 41 | 0.1% |
| White / Caucasian | 33,434 | 95.4% |
| Two or more Races | 875 | 2.5% |
| Some other Race | 305 | 0.9% |
| Total | 35,049 | 100.0% |
Ancestry in Morrow County
The most populous ancestries reported in Morrow County are German (8,973 | 25.6%), Irish (3,881 | 11.1%), American (3,716 | 10.6%), English (3,409 | 9.7%), and Italian (1,356 | 3.9%), together accounting for 60.9% of all Morrow County residents.

| Ancestry | # Population | % Population |
| Afghan | 12 | 0.0% |
| African | 7 | 0.0% |
| American | 3,716 | 10.6% |
| Arab | 21 | 0.1% |
| Argentinean | 13 | 0.0% |
| Belgian | 80 | 0.2% |
| Belizean | 20 | 0.1% |
| Blackfeet | 47 | 0.1% |
| British | 101 | 0.3% |
| Burmese | 32 | 0.1% |
| Canadian | 45 | 0.1% |
| Central American | 3 | 0.0% |
| Cherokee | 85 | 0.2% |
| Choctaw | 6 | 0.0% |
| Colombian | 2 | 0.0% |
| Croatian | 31 | 0.1% |
| Cuban | 30 | 0.1% |
| Czech | 49 | 0.1% |
| Czechoslovakian | 24 | 0.1% |
| Danish | 65 | 0.2% |
| Dutch | 367 | 1.1% |
| Eastern European | 75 | 0.2% |
| English | 3,409 | 9.7% |
| European | 237 | 0.7% |
| Finnish | 25 | 0.1% |
| French | 294 | 0.8% |
| French Canadian | 13 | 0.0% |
| German | 8,973 | 25.6% |
| Greek | 20 | 0.1% |
| Honduran | 3 | 0.0% |
| Hopi | 2 | 0.0% |
| Hungarian | 107 | 0.3% |
| Irish | 3,881 | 11.1% |
| Italian | 1,356 | 3.9% |
| Kiowa | 1 | 0.0% |
| Korean | 126 | 0.4% |
| Lebanese | 9 | 0.0% |
| Lithuanian | 7 | 0.0% |
| Mexican | 232 | 0.7% |
| Navajo | 6 | 0.0% |
| Northern European | 10 | 0.0% |
| Norwegian | 80 | 0.2% |
| Pennsylvania German | 239 | 0.7% |
| Polish | 643 | 1.8% |
| Puerto Rican | 153 | 0.4% |
| Romanian | 15 | 0.0% |
| Russian | 7 | 0.0% |
| Scandinavian | 198 | 0.6% |
| Scotch-Irish | 291 | 0.8% |
| Scottish | 861 | 2.5% |
| Serbian | 139 | 0.4% |
| Sioux | 13 | 0.0% |
| South American | 15 | 0.0% |
| Spaniard | 15 | 0.0% |
| Subsaharan African | 7 | 0.0% |
| Swedish | 27 | 0.1% |
| Swiss | 87 | 0.3% |
| Ukrainian | 12 | 0.0% |
| Welsh | 502 | 1.4% |
| Yugoslavian | 17 | 0.1% | View All 60 Rows |
Immigrants in Morrow County
The most numerous immigrant groups reported in Morrow County came from Asia (156 | 0.4%), South Eastern Asia (126 | 0.4%), Philippines (124 | 0.4%), Europe (113 | 0.3%), and Germany (69 | 0.2%), together accounting for 1.7% of all Morrow County residents.

| Immigration Origin | # Population | % Population |
| Africa | 15 | 0.0% |
| Asia | 156 | 0.4% |
| Canada | 21 | 0.1% |
| Central America | 23 | 0.1% |
| Colombia | 2 | 0.0% |
| Denmark | 44 | 0.1% |
| Eastern Asia | 30 | 0.1% |
| Europe | 113 | 0.3% |
| Germany | 69 | 0.2% |
| Honduras | 3 | 0.0% |
| Korea | 30 | 0.1% |
| Latin America | 25 | 0.1% |
| Mexico | 20 | 0.1% |
| Morocco | 15 | 0.0% |
| Northern Africa | 15 | 0.0% |
| Northern Europe | 44 | 0.1% |
| Philippines | 124 | 0.4% |
| South America | 2 | 0.0% |
| South Eastern Asia | 126 | 0.4% |
| Thailand | 2 | 0.0% |
| Western Europe | 69 | 0.2% | View All 21 Rows |
Sex and Age in Morrow County
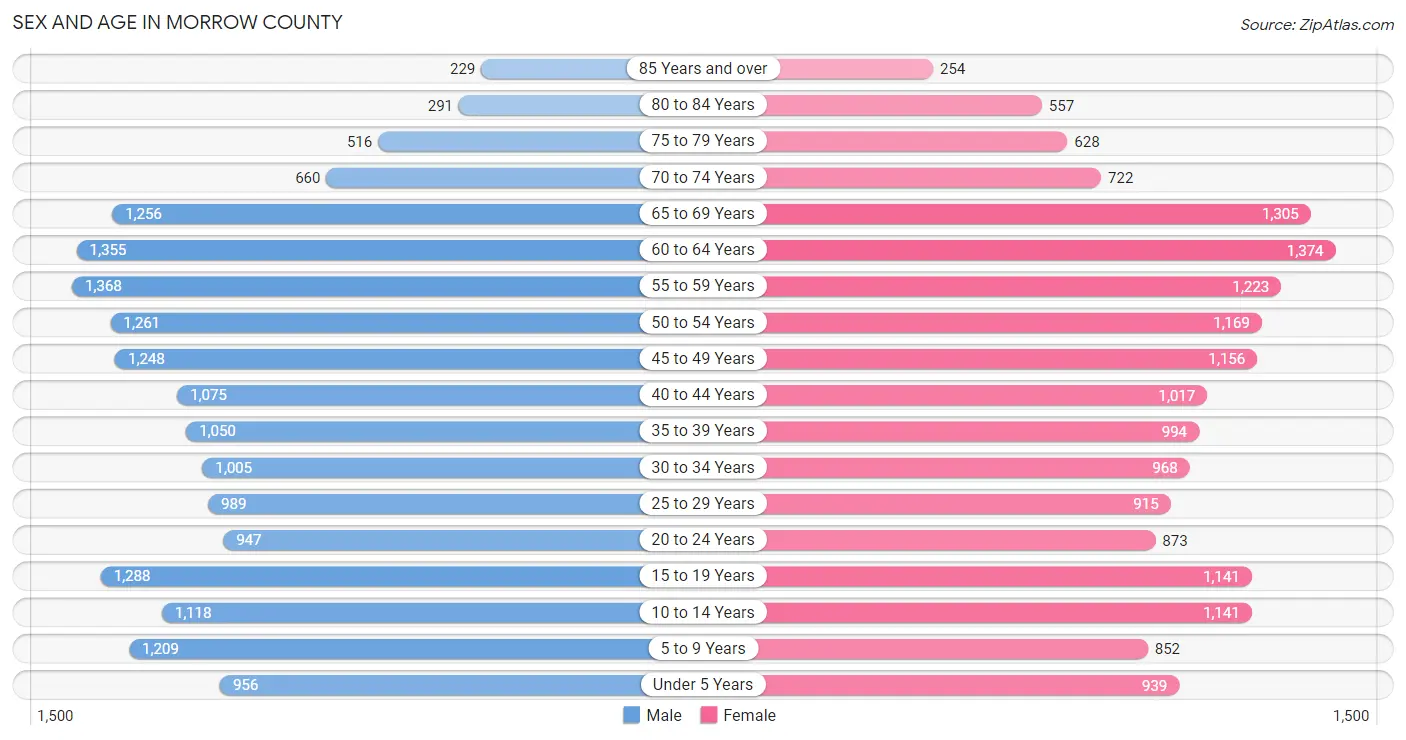
Sex and Age in Morrow County
The most populous age groups in Morrow County are 55 to 59 Years (1,368 | 7.7%) for men and 60 to 64 Years (1,374 | 8.0%) for women.
| Age Bracket | Male | Female |
| Under 5 Years | 956 (5.4%) | 939 (5.4%) |
| 5 to 9 Years | 1,209 (6.8%) | 852 (5.0%) |
| 10 to 14 Years | 1,118 (6.3%) | 1,141 (6.6%) |
| 15 to 19 Years | 1,288 (7.2%) | 1,141 (6.6%) |
| 20 to 24 Years | 947 (5.3%) | 873 (5.1%) |
| 25 to 29 Years | 989 (5.6%) | 915 (5.3%) |
| 30 to 34 Years | 1,005 (5.6%) | 968 (5.6%) |
| 35 to 39 Years | 1,050 (5.9%) | 994 (5.8%) |
| 40 to 44 Years | 1,075 (6.0%) | 1,017 (5.9%) |
| 45 to 49 Years | 1,248 (7.0%) | 1,156 (6.7%) |
| 50 to 54 Years | 1,261 (7.1%) | 1,169 (6.8%) |
| 55 to 59 Years | 1,368 (7.7%) | 1,223 (7.1%) |
| 60 to 64 Years | 1,355 (7.6%) | 1,374 (8.0%) |
| 65 to 69 Years | 1,256 (7.0%) | 1,305 (7.6%) |
| 70 to 74 Years | 660 (3.7%) | 722 (4.2%) |
| 75 to 79 Years | 516 (2.9%) | 628 (3.6%) |
| 80 to 84 Years | 291 (1.6%) | 557 (3.2%) |
| 85 Years and over | 229 (1.3%) | 254 (1.5%) |
| Total | 17,821 (100.0%) | 17,228 (100.0%) |
Families and Households in Morrow County
Median Family Size in Morrow County
The median family size in Morrow County is 3.02 persons per family, with married-couple families (7,348 | 77.1%) accounting for the largest median family size of 3.08 persons per family. On the other hand, single male/father families (876 | 9.2%) represent the smallest median family size with 2.70 persons per family.

| Family Type | # Families | Family Size |
| Married-Couple | 7,348 (77.1%) | 3.08 |
| Single Male/Father | 876 (9.2%) | 2.70 |
| Single Female/Mother | 1,312 (13.8%) | 2.92 |
| Total Families | 9,536 (100.0%) | 3.02 |
Median Household Size in Morrow County
The median household size in Morrow County is 2.63 persons per household, with single female/mother households (1,312 | 9.9%) accounting for the largest median household size of 3.32 persons per household. non-family households (3,686 | 27.9%) represent the smallest median household size with 1.32 persons per household.

| Household Type | # Households | Household Size |
| Married-Couple | 7,348 (55.6%) | 3.11 |
| Single Male/Father | 876 (6.6%) | 3.09 |
| Single Female/Mother | 1,312 (9.9%) | 3.32 |
| Non-family | 3,686 (27.9%) | 1.32 |
| Total Households | 13,222 (100.0%) | 2.63 |
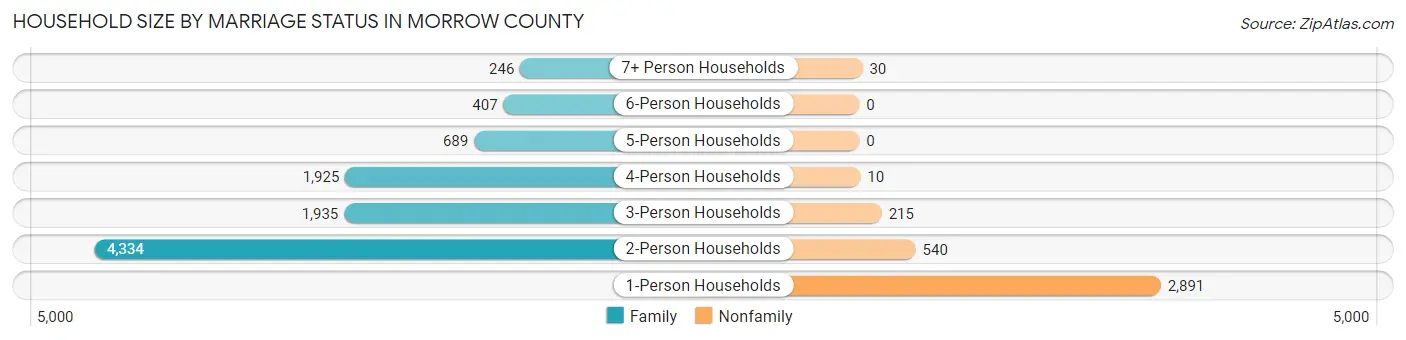
Household Size by Marriage Status in Morrow County
Out of a total of 13,222 households in Morrow County, 9,536 (72.1%) are family households, while 3,686 (27.9%) are nonfamily households. The most numerous type of family households are 2-person households, comprising 4,334, and the most common type of nonfamily households are 1-person households, comprising 2,891.
| Household Size | Family Households | Nonfamily Households |
| 1-Person Households | - | 2,891 (21.9%) |
| 2-Person Households | 4,334 (32.8%) | 540 (4.1%) |
| 3-Person Households | 1,935 (14.6%) | 215 (1.6%) |
| 4-Person Households | 1,925 (14.6%) | 10 (0.1%) |
| 5-Person Households | 689 (5.2%) | 0 (0.0%) |
| 6-Person Households | 407 (3.1%) | 0 (0.0%) |
| 7+ Person Households | 246 (1.9%) | 30 (0.2%) |
| Total | 9,536 (72.1%) | 3,686 (27.9%) |
Female Fertility in Morrow County
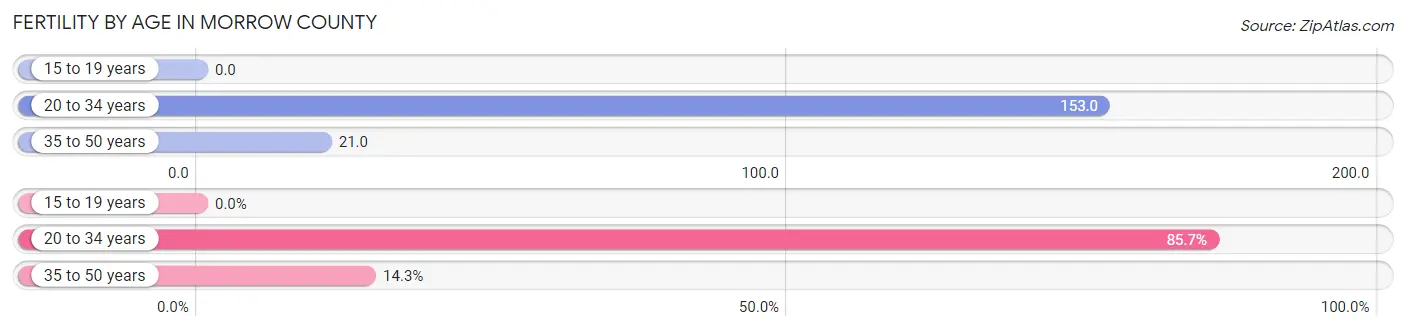
Fertility by Age in Morrow County
Average fertility rate in Morrow County is 68.0 births per 1,000 women. Women in the age bracket of 20 to 34 years have the highest fertility rate with 153.0 births per 1,000 women. Women in the age bracket of 20 to 34 years acount for 85.7% of all women with births.
| Age Bracket | Women with Births | Births / 1,000 Women |
| 15 to 19 years | 0 (0.0%) | 0.0 |
| 20 to 34 years | 421 (85.7%) | 153.0 |
| 35 to 50 years | 70 (14.3%) | 21.0 |
| Total | 491 (100.0%) | 68.0 |
Fertility by Age by Marriage Status in Morrow County
59.7% of women with births (491) in Morrow County are married. The highest percentage of unmarried women with births falls into 20 to 34 years age bracket with 47.0% of them unmarried at the time of birth, while the lowest percentage of unmarried women with births belong to 35 to 50 years age bracket with 0.0% of them unmarried.

| Age Bracket | Married | Unmarried |
| 15 to 19 years | 0 (0.0%) | 0 (0.0%) |
| 20 to 34 years | 223 (53.0%) | 198 (47.0%) |
| 35 to 50 years | 70 (100.0%) | 0 (0.0%) |
| Total | 293 (59.7%) | 198 (40.3%) |
Fertility by Education in Morrow County
Average fertility rate in Morrow County is 68.0 births per 1,000 women. Women with the education attainment of high school diploma have the highest fertility rate of 122.0 births per 1,000 women, while women with the education attainment of less than high school have the lowest fertility at 31.0 births per 1,000 women. Women with the education attainment of high school diploma represent 57.4% of all women with births.
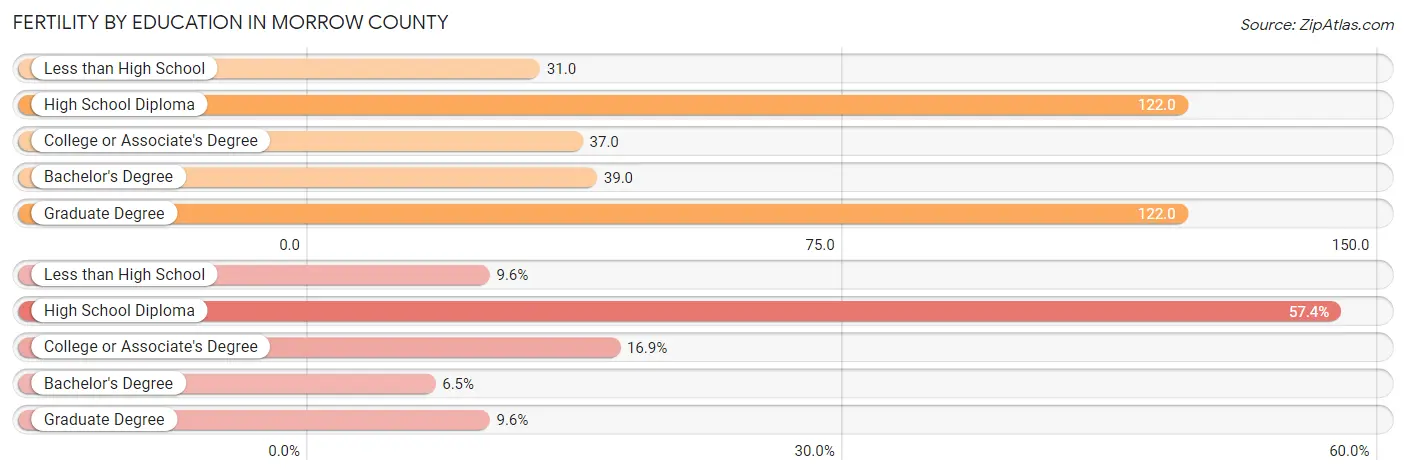
| Educational Attainment | Women with Births | Births / 1,000 Women |
| Less than High School | 47 (9.6%) | 31.0 |
| High School Diploma | 282 (57.4%) | 122.0 |
| College or Associate's Degree | 83 (16.9%) | 37.0 |
| Bachelor's Degree | 32 (6.5%) | 39.0 |
| Graduate Degree | 47 (9.6%) | 122.0 |
| Total | 491 (100.0%) | 68.0 |
Fertility by Education by Marriage Status in Morrow County
40.3% of women with births in Morrow County are unmarried. Women with the educational attainment of bachelor's degree are most likely to be married with 100.0% of them married at childbirth, while women with the educational attainment of college or associate's degree are least likely to be married with 68.7% of them unmarried at childbirth.
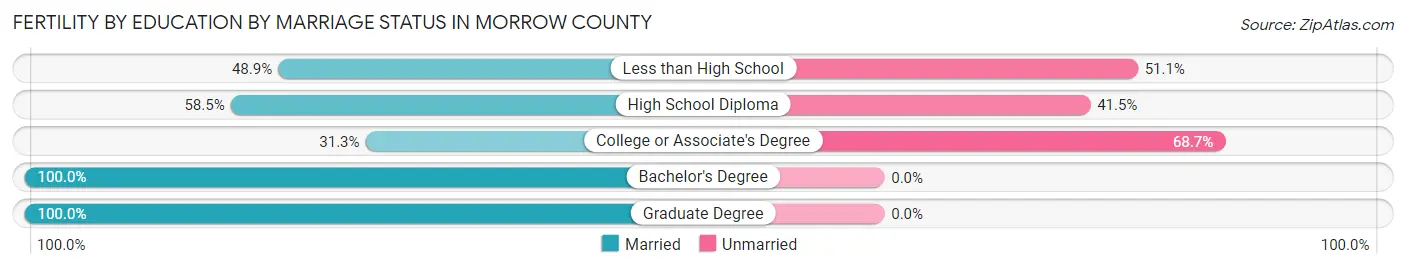
| Educational Attainment | Married | Unmarried |
| Less than High School | 23 (48.9%) | 24 (51.1%) |
| High School Diploma | 165 (58.5%) | 117 (41.5%) |
| College or Associate's Degree | 26 (31.3%) | 57 (68.7%) |
| Bachelor's Degree | 32 (100.0%) | 0 (0.0%) |
| Graduate Degree | 47 (100.0%) | 0 (0.0%) |
| Total | 293 (59.7%) | 198 (40.3%) |
Income in Morrow County
Income Overview in Morrow County
Per Capita Income in Morrow County is $32,987, while median incomes of families and households are $77,618 and $70,412 respectively.
| Characteristic | Number | Measure |
| Per Capita Income | 35,049 | $32,987 |
| Median Family Income | 9,536 | $77,618 |
| Mean Family Income | 9,536 | $93,727 |
| Median Household Income | 13,222 | $70,412 |
| Mean Household Income | 13,222 | $84,706 |
| Income Deficit | 9,536 | $8,754 |
| Wage / Income Gap (%) | 35,049 | 24.31% |
| Wage / Income Gap ($) | 35,049 | 75.69¢ per $1 |
| Gini / Inequality Index | 35,049 | 0.37 |
Earnings by Sex in Morrow County
Average Earnings in Morrow County are $39,393, $46,586 for men and $35,259 for women, a difference of 24.3%.
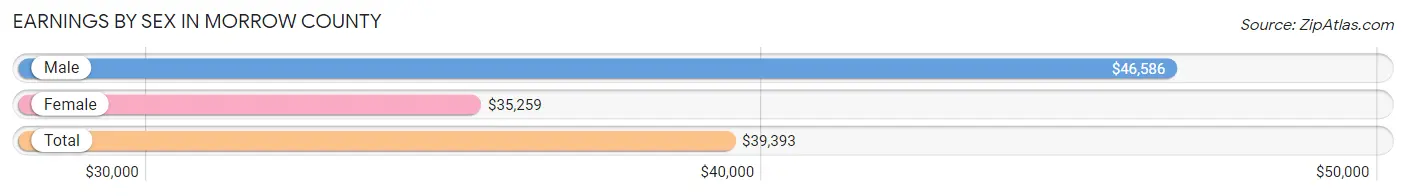
| Sex | Number | Average Earnings |
| Male | 10,300 (54.5%) | $46,586 |
| Female | 8,593 (45.5%) | $35,259 |
| Total | 18,893 (100.0%) | $39,393 |
Earnings by Sex by Income Bracket in Morrow County
The most common earnings brackets in Morrow County are $75,000 to $99,999 for men (1,213 | 11.8%) and $35,000 to $39,999 for women (939 | 10.9%).

| Income | Male | Female |
| $2,499 or less | 417 (4.1%) | 545 (6.3%) |
| $2,500 to $4,999 | 524 (5.1%) | 394 (4.6%) |
| $5,000 to $7,499 | 295 (2.9%) | 349 (4.1%) |
| $7,500 to $9,999 | 156 (1.5%) | 294 (3.4%) |
| $10,000 to $12,499 | 307 (3.0%) | 416 (4.8%) |
| $12,500 to $14,999 | 218 (2.1%) | 238 (2.8%) |
| $15,000 to $17,499 | 151 (1.5%) | 204 (2.4%) |
| $17,500 to $19,999 | 96 (0.9%) | 206 (2.4%) |
| $20,000 to $22,499 | 100 (1.0%) | 271 (3.2%) |
| $22,500 to $24,999 | 343 (3.3%) | 183 (2.1%) |
| $25,000 to $29,999 | 439 (4.3%) | 589 (6.9%) |
| $30,000 to $34,999 | 627 (6.1%) | 554 (6.5%) |
| $35,000 to $39,999 | 781 (7.6%) | 939 (10.9%) |
| $40,000 to $44,999 | 415 (4.0%) | 365 (4.3%) |
| $45,000 to $49,999 | 658 (6.4%) | 627 (7.3%) |
| $50,000 to $54,999 | 560 (5.4%) | 352 (4.1%) |
| $55,000 to $64,999 | 1,165 (11.3%) | 558 (6.5%) |
| $65,000 to $74,999 | 822 (8.0%) | 440 (5.1%) |
| $75,000 to $99,999 | 1,213 (11.8%) | 631 (7.3%) |
| $100,000+ | 1,013 (9.8%) | 438 (5.1%) |
| Total | 10,300 (100.0%) | 8,593 (100.0%) |
Earnings by Sex by Educational Attainment in Morrow County
Average earnings in Morrow County are $51,255 for men and $38,245 for women, a difference of 25.4%. Men with an educational attainment of graduate degree enjoy the highest average annual earnings of $92,689, while those with less than high school education earn the least with $32,759. Women with an educational attainment of graduate degree earn the most with the average annual earnings of $65,213, while those with high school diploma education have the smallest earnings of $29,968.
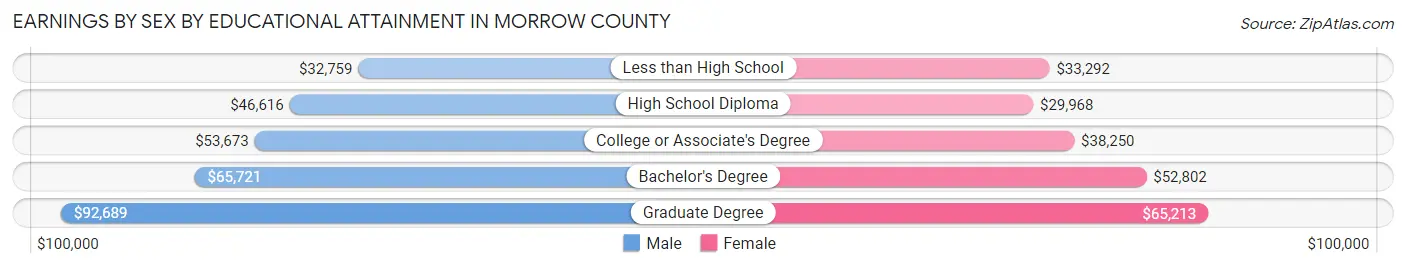
| Educational Attainment | Male Income | Female Income |
| Less than High School | $32,759 | $33,292 |
| High School Diploma | $46,616 | $29,968 |
| College or Associate's Degree | $53,673 | $38,250 |
| Bachelor's Degree | $65,721 | $52,802 |
| Graduate Degree | $92,689 | $65,213 |
| Total | $51,255 | $38,245 |
Family Income in Morrow County
Family Income Brackets in Morrow County
According to the Morrow County family income data, there are 2,212 families falling into the $50,000 to $74,999 income range, which is the most common income bracket and makes up 23.2% of all families. Conversely, the less than $10,000 income bracket is the least frequent group with only 134 families (1.4%) belonging to this category.
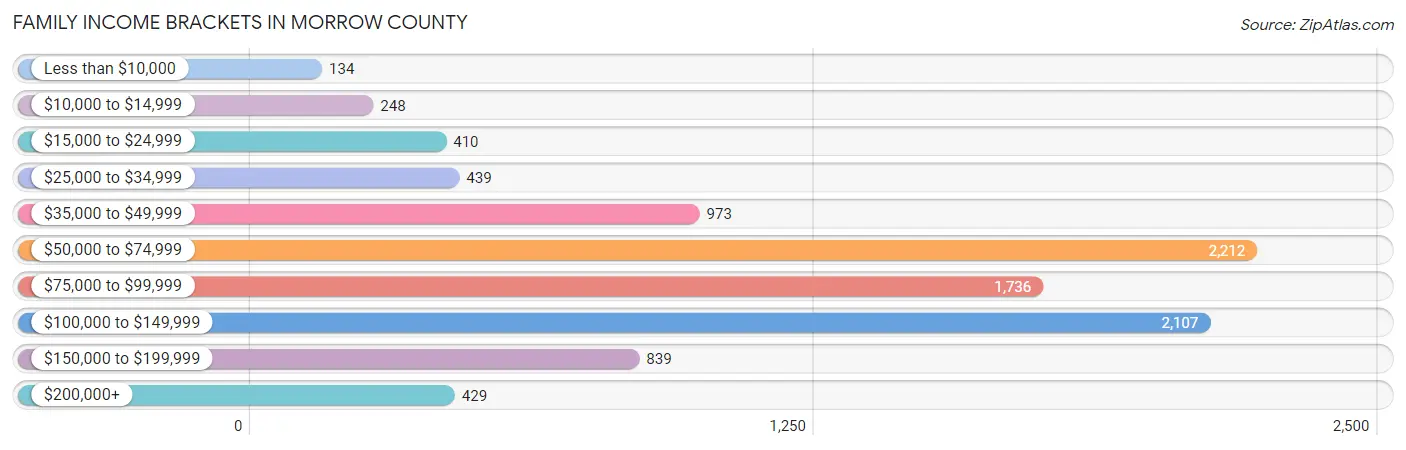
| Income Bracket | # Families | % Families |
| Less than $10,000 | 134 | 1.4% |
| $10,000 to $14,999 | 248 | 2.6% |
| $15,000 to $24,999 | 410 | 4.3% |
| $25,000 to $34,999 | 439 | 4.6% |
| $35,000 to $49,999 | 973 | 10.2% |
| $50,000 to $74,999 | 2,212 | 23.2% |
| $75,000 to $99,999 | 1,736 | 18.2% |
| $100,000 to $149,999 | 2,107 | 22.1% |
| $150,000 to $199,999 | 839 | 8.8% |
| $200,000+ | 429 | 4.5% |
Family Income by Famaliy Size in Morrow County
6-person families (340 | 3.6%) account for the highest median family income in Morrow County with $165,269 per family, while 2-person families (4,733 | 49.6%) have the highest median income of $33,001 per family member.
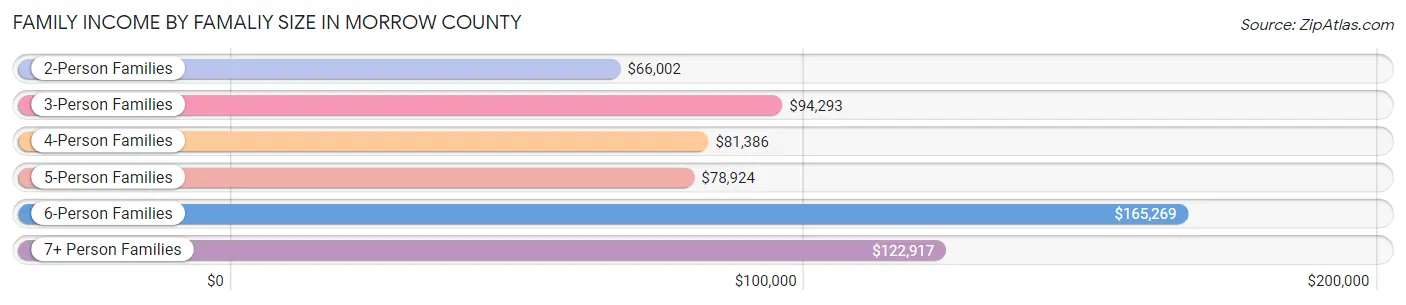
| Income Bracket | # Families | Median Income |
| 2-Person Families | 4,733 (49.6%) | $66,002 |
| 3-Person Families | 1,895 (19.9%) | $94,293 |
| 4-Person Families | 1,713 (18.0%) | $81,386 |
| 5-Person Families | 609 (6.4%) | $78,924 |
| 6-Person Families | 340 (3.6%) | $165,269 |
| 7+ Person Families | 246 (2.6%) | $122,917 |
| Total | 9,536 (100.0%) | $77,618 |
Family Income by Number of Earners in Morrow County
The median family income in Morrow County is $77,618, with families comprising 3+ earners (1,089) having the highest median family income of $118,668, while families with no earners (1,648) have the lowest median family income of $53,986, accounting for 11.4% and 17.3% of families, respectively.

| Number of Earners | # Families | Median Income |
| No Earners | 1,648 (17.3%) | $53,986 |
| 1 Earner | 2,734 (28.7%) | $65,262 |
| 2 Earners | 4,065 (42.6%) | $101,046 |
| 3+ Earners | 1,089 (11.4%) | $118,668 |
| Total | 9,536 (100.0%) | $77,618 |
Household Income in Morrow County
Household Income Brackets in Morrow County
With 3,200 households falling in the category, the $50,000 to $74,999 income range is the most frequent in Morrow County, accounting for 24.2% of all households. In contrast, only 370 households (2.8%) fall into the less than $10,000 income bracket, making it the least populous group.
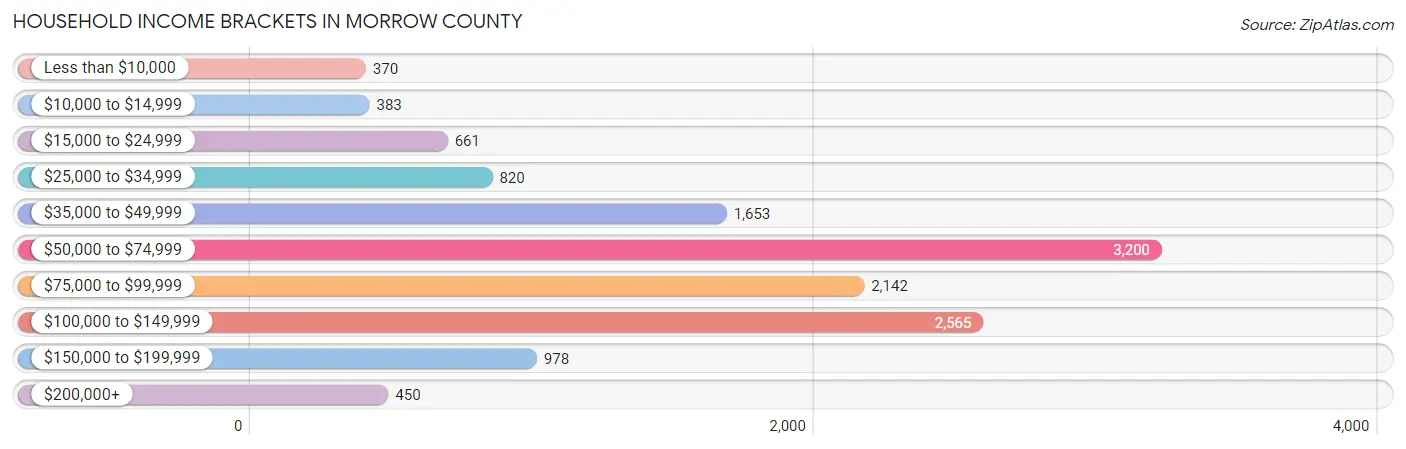
| Income Bracket | # Households | % Households |
| Less than $10,000 | 370 | 2.8% |
| $10,000 to $14,999 | 383 | 2.9% |
| $15,000 to $24,999 | 661 | 5.0% |
| $25,000 to $34,999 | 820 | 6.2% |
| $35,000 to $49,999 | 1,653 | 12.5% |
| $50,000 to $74,999 | 3,200 | 24.2% |
| $75,000 to $99,999 | 2,142 | 16.2% |
| $100,000 to $149,999 | 2,565 | 19.4% |
| $150,000 to $199,999 | 978 | 7.4% |
| $200,000+ | 450 | 3.4% |
Household Income by Householder Age in Morrow County
The median household income in Morrow County is $70,412, with the highest median household income of $80,260 found in the 25 to 44 years age bracket for the primary householder. A total of 3,554 households (26.9%) fall into this category. Meanwhile, the 65+ years age bracket for the primary householder has the lowest median household income of $52,035, with 3,564 households (27.0%) in this group.
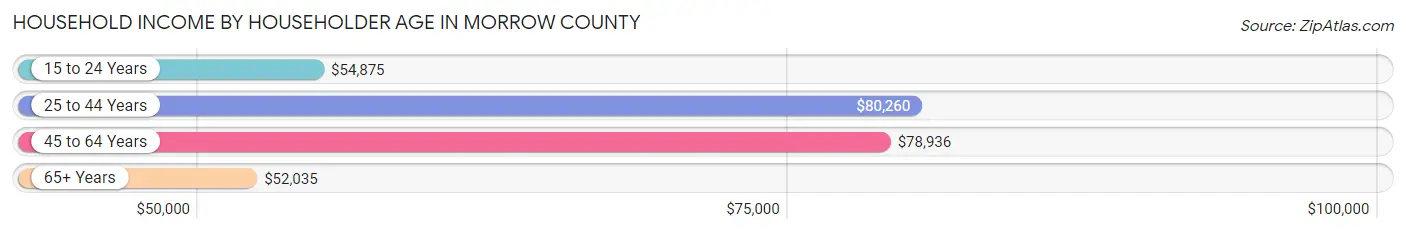
| Income Bracket | # Households | Median Income |
| 15 to 24 Years | 322 (2.4%) | $54,875 |
| 25 to 44 Years | 3,554 (26.9%) | $80,260 |
| 45 to 64 Years | 5,782 (43.7%) | $78,936 |
| 65+ Years | 3,564 (27.0%) | $52,035 |
| Total | 13,222 (100.0%) | $70,412 |
Poverty in Morrow County
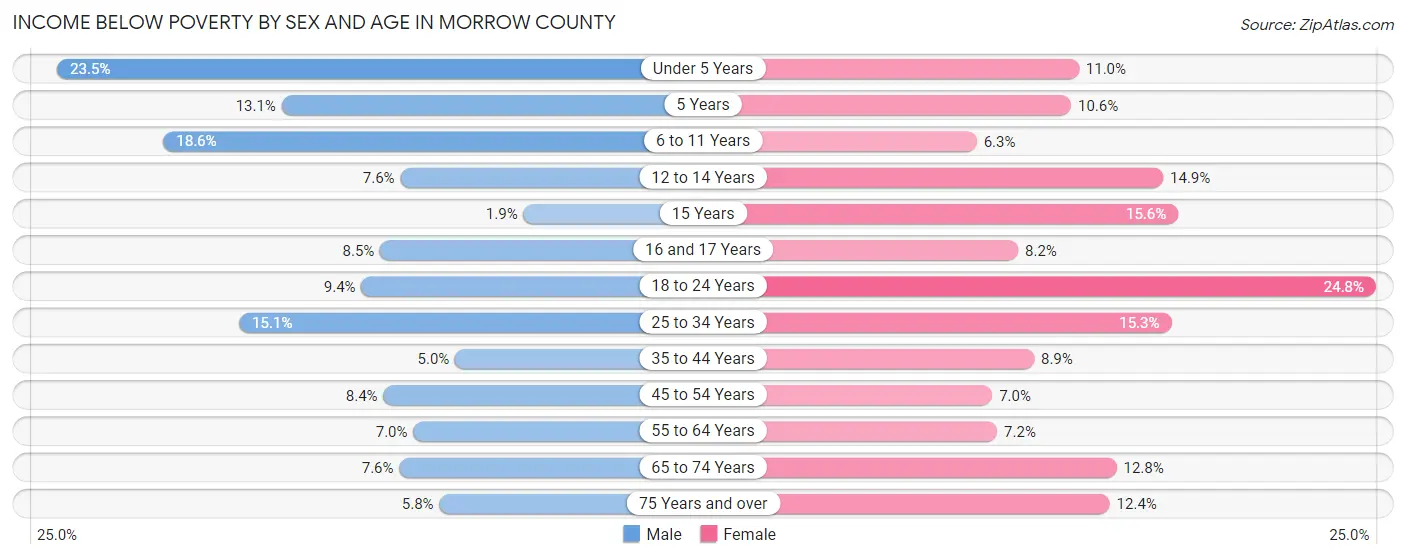
Income Below Poverty by Sex and Age in Morrow County
With 9.9% poverty level for males and 11.3% for females among the residents of Morrow County, under 5 year old males and 18 to 24 year old females are the most vulnerable to poverty, with 222 males (23.5%) and 312 females (24.8%) in their respective age groups living below the poverty level.
| Age Bracket | Male | Female |
| Under 5 Years | 222 (23.5%) | 98 (11.0%) |
| 5 Years | 23 (13.1%) | 15 (10.6%) |
| 6 to 11 Years | 250 (18.6%) | 71 (6.3%) |
| 12 to 14 Years | 54 (7.6%) | 99 (14.9%) |
| 15 Years | 4 (1.8%) | 51 (15.6%) |
| 16 and 17 Years | 51 (8.5%) | 35 (8.2%) |
| 18 to 24 Years | 130 (9.4%) | 312 (24.8%) |
| 25 to 34 Years | 298 (15.0%) | 288 (15.3%) |
| 35 to 44 Years | 106 (5.0%) | 179 (8.9%) |
| 45 to 54 Years | 209 (8.4%) | 162 (7.0%) |
| 55 to 64 Years | 189 (7.0%) | 187 (7.2%) |
| 65 to 74 Years | 141 (7.6%) | 257 (12.8%) |
| 75 Years and over | 59 (5.8%) | 169 (12.4%) |
| Total | 1,736 (9.9%) | 1,923 (11.3%) |
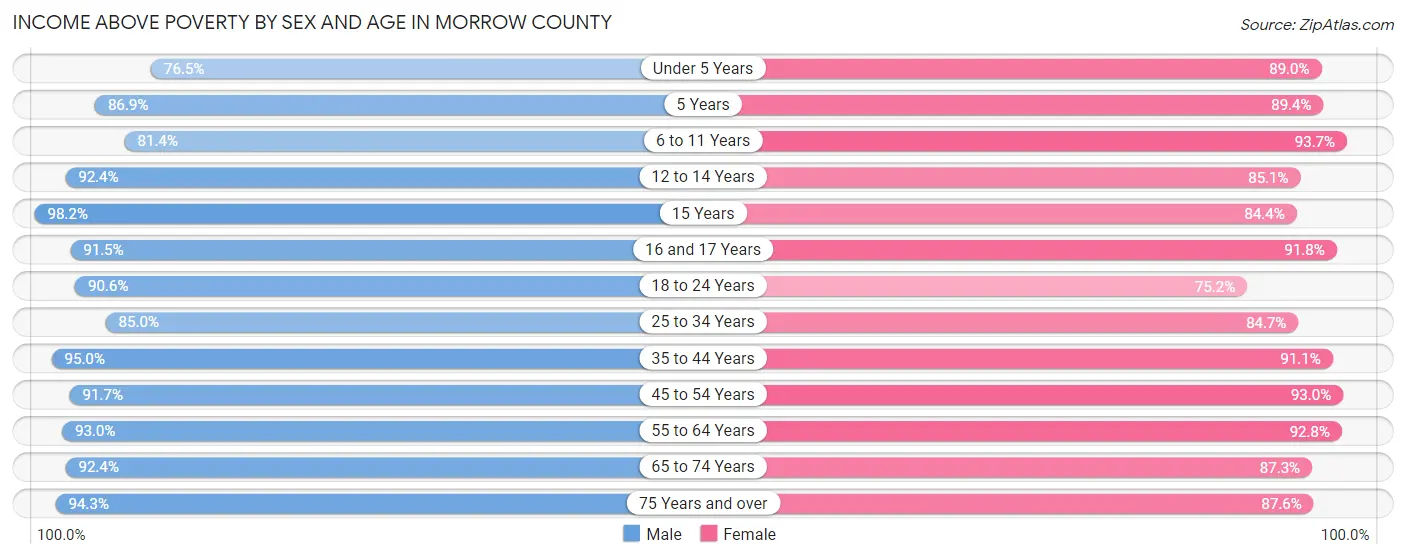
Income Above Poverty by Sex and Age in Morrow County
According to the poverty statistics in Morrow County, males aged 15 years and females aged 6 to 11 years are the age groups that are most secure financially, with 98.2% of males and 93.7% of females in these age groups living above the poverty line.
| Age Bracket | Male | Female |
| Under 5 Years | 723 (76.5%) | 793 (89.0%) |
| 5 Years | 153 (86.9%) | 126 (89.4%) |
| 6 to 11 Years | 1,097 (81.4%) | 1,063 (93.7%) |
| 12 to 14 Years | 660 (92.4%) | 565 (85.1%) |
| 15 Years | 212 (98.2%) | 276 (84.4%) |
| 16 and 17 Years | 549 (91.5%) | 393 (91.8%) |
| 18 to 24 Years | 1,258 (90.6%) | 947 (75.2%) |
| 25 to 34 Years | 1,682 (85.0%) | 1,595 (84.7%) |
| 35 to 44 Years | 2,004 (95.0%) | 1,828 (91.1%) |
| 45 to 54 Years | 2,294 (91.6%) | 2,158 (93.0%) |
| 55 to 64 Years | 2,528 (93.0%) | 2,405 (92.8%) |
| 65 to 74 Years | 1,713 (92.4%) | 1,759 (87.3%) |
| 75 Years and over | 967 (94.3%) | 1,191 (87.6%) |
| Total | 15,840 (90.1%) | 15,099 (88.7%) |
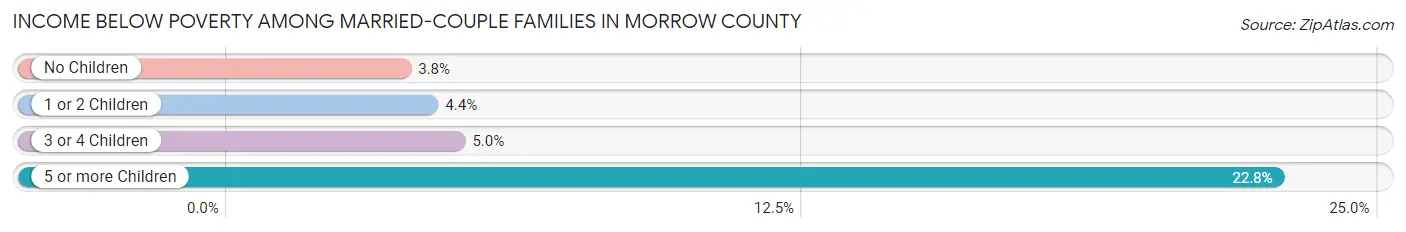
Income Below Poverty Among Married-Couple Families in Morrow County
The poverty statistics for married-couple families in Morrow County show that 4.3% or 317 of the total 7,348 families live below the poverty line. Families with 5 or more children have the highest poverty rate of 22.8%, comprising of 23 families. On the other hand, families with no children have the lowest poverty rate of 3.8%, which includes 165 families.
| Children | Above Poverty | Below Poverty |
| No Children | 4,213 (96.2%) | 165 (3.8%) |
| 1 or 2 Children | 2,106 (95.6%) | 96 (4.4%) |
| 3 or 4 Children | 634 (95.1%) | 33 (5.0%) |
| 5 or more Children | 78 (77.2%) | 23 (22.8%) |
| Total | 7,031 (95.7%) | 317 (4.3%) |
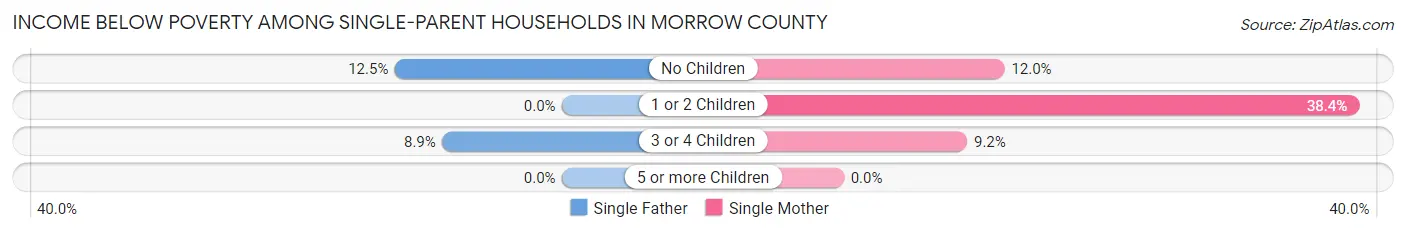
Income Below Poverty Among Single-Parent Households in Morrow County
According to the poverty data in Morrow County, 8.7% or 76 single-father households and 25.6% or 336 single-mother households are living below the poverty line. Among single-father households, those with no children have the highest poverty rate, with 71 households (12.5%) experiencing poverty. Likewise, among single-mother households, those with 1 or 2 children have the highest poverty rate, with 271 households (38.4%) falling below the poverty line.
| Children | Single Father | Single Mother |
| No Children | 71 (12.5%) | 40 (12.0%) |
| 1 or 2 Children | 0 (0.0%) | 271 (38.4%) |
| 3 or 4 Children | 5 (8.9%) | 25 (9.2%) |
| 5 or more Children | 0 (0.0%) | 0 (0.0%) |
| Total | 76 (8.7%) | 336 (25.6%) |
Income Below Poverty Among Married-Couple vs Single-Parent Households in Morrow County
The poverty data for Morrow County shows that 317 of the married-couple family households (4.3%) and 412 of the single-parent households (18.8%) are living below the poverty level. Within the married-couple family households, those with 5 or more children have the highest poverty rate, with 23 households (22.8%) falling below the poverty line. Among the single-parent households, those with 1 or 2 children have the highest poverty rate, with 271 household (28.3%) living below poverty.

| Children | Married-Couple Families | Single-Parent Households |
| No Children | 165 (3.8%) | 111 (12.3%) |
| 1 or 2 Children | 96 (4.4%) | 271 (28.3%) |
| 3 or 4 Children | 33 (5.0%) | 30 (9.1%) |
| 5 or more Children | 23 (22.8%) | 0 (0.0%) |
| Total | 317 (4.3%) | 412 (18.8%) |
Employment Characteristics in Morrow County
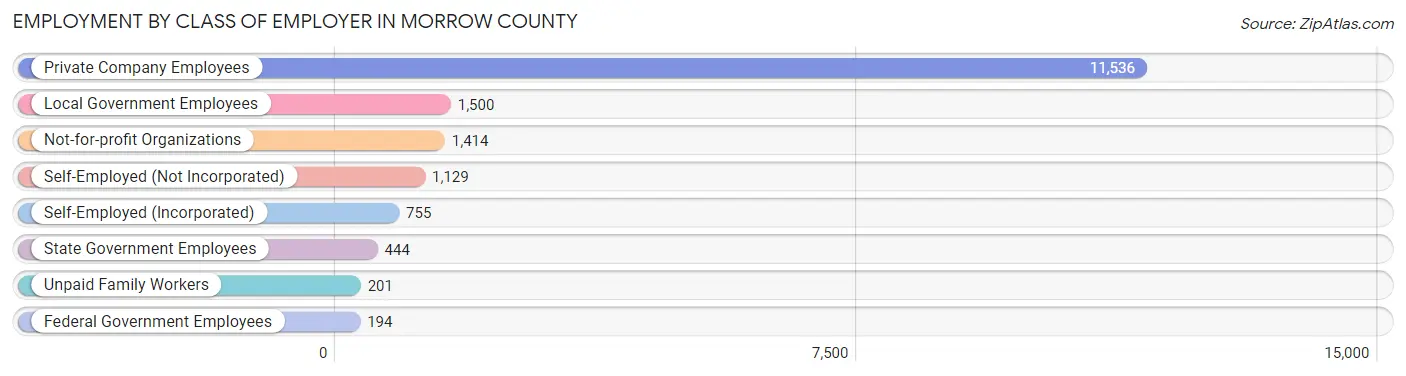
Employment by Class of Employer in Morrow County
Among the 17,173 employed individuals in Morrow County, private company employees (11,536 | 67.2%), local government employees (1,500 | 8.7%), and not-for-profit organizations (1,414 | 8.2%) make up the most common classes of employment.
| Employer Class | # Employees | % Employees |
| Private Company Employees | 11,536 | 67.2% |
| Self-Employed (Incorporated) | 755 | 4.4% |
| Self-Employed (Not Incorporated) | 1,129 | 6.6% |
| Not-for-profit Organizations | 1,414 | 8.2% |
| Local Government Employees | 1,500 | 8.7% |
| State Government Employees | 444 | 2.6% |
| Federal Government Employees | 194 | 1.1% |
| Unpaid Family Workers | 201 | 1.2% |
| Total | 17,173 | 100.0% |
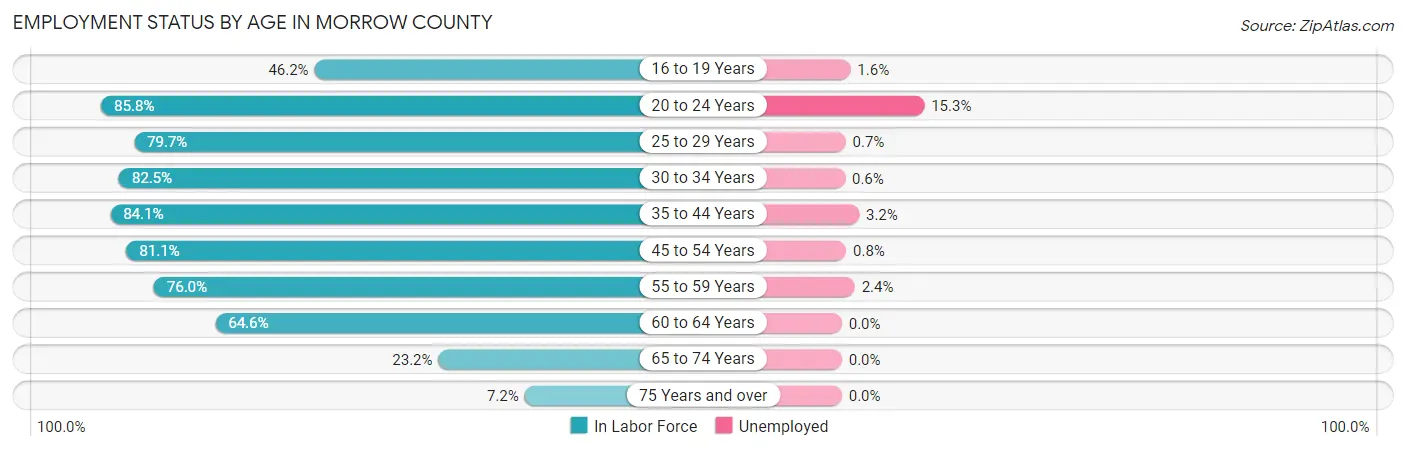
Employment Status by Age in Morrow County
According to the labor force statistics for Morrow County, out of the total population over 16 years of age (28,291), 62.9% or 17,795 individuals are in the labor force, with 2.6% or 463 of them unemployed. The age group with the highest labor force participation rate is 20 to 24 years, with 85.8% or 1,562 individuals in the labor force. Within the labor force, the 20 to 24 years age range has the highest percentage of unemployed individuals, with 15.3% or 239 of them being unemployed.
| Age Bracket | In Labor Force | Unemployed |
| 16 to 19 Years | 871 (46.2%) | 14 (1.6%) |
| 20 to 24 Years | 1,562 (85.8%) | 239 (15.3%) |
| 25 to 29 Years | 1,517 (79.7%) | 11 (0.7%) |
| 30 to 34 Years | 1,628 (82.5%) | 10 (0.6%) |
| 35 to 44 Years | 3,478 (84.1%) | 111 (3.2%) |
| 45 to 54 Years | 3,920 (81.1%) | 31 (0.8%) |
| 55 to 59 Years | 1,969 (76.0%) | 47 (2.4%) |
| 60 to 64 Years | 1,763 (64.6%) | 0 (0.0%) |
| 65 to 74 Years | 915 (23.2%) | 0 (0.0%) |
| 75 Years and over | 178 (7.2%) | 0 (0.0%) |
| Total | 17,795 (62.9%) | 463 (2.6%) |
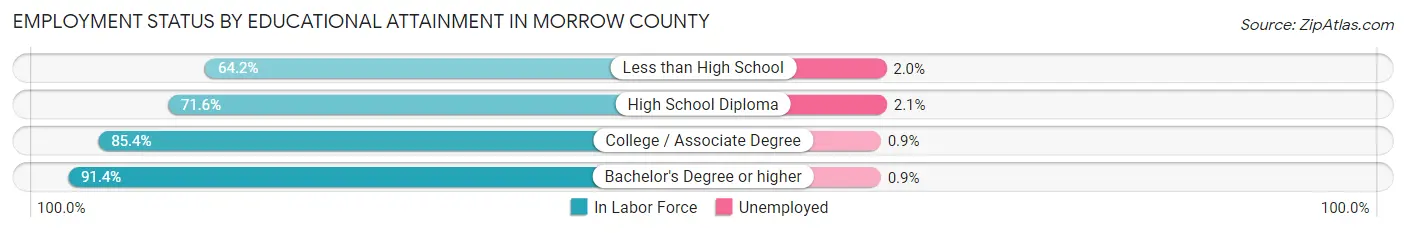
Employment Status by Educational Attainment in Morrow County
According to labor force statistics for Morrow County, 78.6% of individuals (14,279) out of the total population between 25 and 64 years of age (18,167) are in the labor force, with 1.4% or 200 of them being unemployed. The group with the highest labor force participation rate are those with the educational attainment of bachelor's degree or higher, with 91.4% or 2,992 individuals in the labor force. Within the labor force, individuals with high school diploma education have the highest percentage of unemployment, with 2.1% or 118 of them being unemployed.
| Educational Attainment | In Labor Force | Unemployed |
| Less than High School | 1,055 (64.2%) | 33 (2.0%) |
| High School Diploma | 5,611 (71.6%) | 165 (2.1%) |
| College / Associate Degree | 4,624 (85.4%) | 49 (0.9%) |
| Bachelor's Degree or higher | 2,992 (91.4%) | 29 (0.9%) |
| Total | 14,279 (78.6%) | 254 (1.4%) |
Employment Occupations by Sex in Morrow County
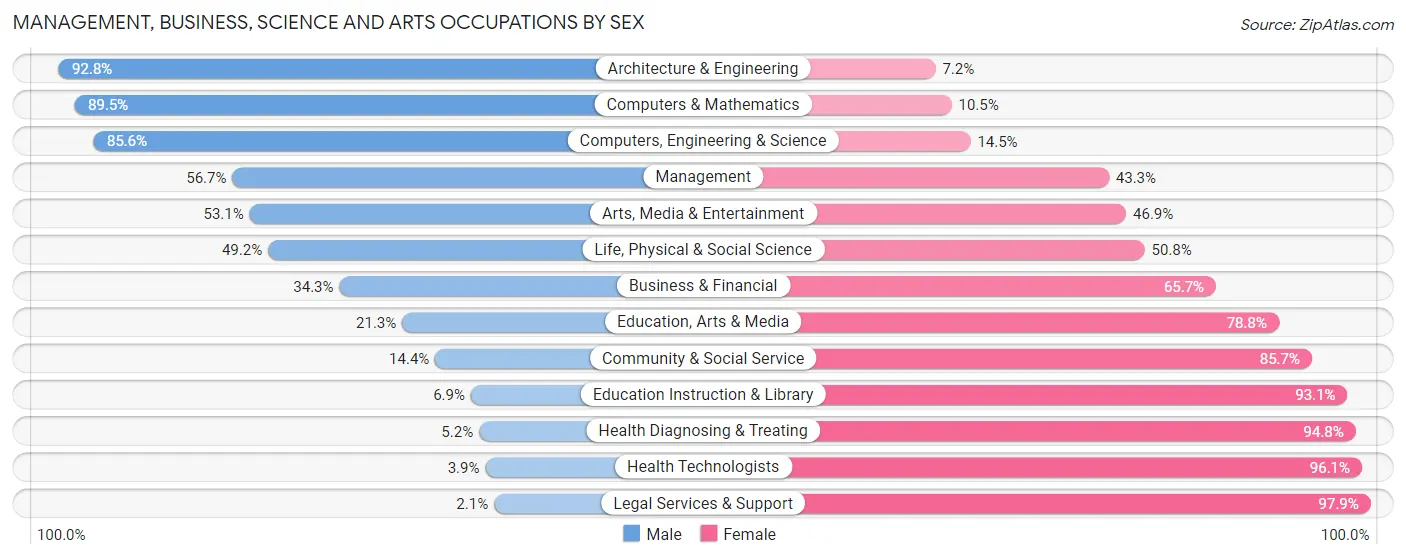
Management, Business, Science and Arts Occupations
The most common Management, Business, Science and Arts occupations in Morrow County are Management (1,632 | 9.4%), Community & Social Service (1,394 | 8.1%), Computers, Engineering & Science (1,031 | 6.0%), Education Instruction & Library (896 | 5.2%), and Health Diagnosing & Treating (844 | 4.9%).

Management, Business, Science and Arts Occupations by Sex
Within the Management, Business, Science and Arts occupations in Morrow County, the most male-oriented occupations are Architecture & Engineering (92.8%), Computers & Mathematics (89.5%), and Computers, Engineering & Science (85.6%), while the most female-oriented occupations are Legal Services & Support (97.9%), Health Technologists (96.1%), and Health Diagnosing & Treating (94.8%).
| Occupation | Male | Female |
| Management | 925 (56.7%) | 707 (43.3%) |
| Business & Financial | 193 (34.3%) | 369 (65.7%) |
| Computers, Engineering & Science | 882 (85.6%) | 149 (14.4%) |
| Computers & Mathematics | 494 (89.5%) | 58 (10.5%) |
| Architecture & Engineering | 324 (92.8%) | 25 (7.2%) |
| Life, Physical & Social Science | 64 (49.2%) | 66 (50.8%) |
| Community & Social Service | 200 (14.3%) | 1,194 (85.7%) |
| Education, Arts & Media | 68 (21.2%) | 252 (78.7%) |
| Legal Services & Support | 1 (2.1%) | 47 (97.9%) |
| Education Instruction & Library | 62 (6.9%) | 834 (93.1%) |
| Arts, Media & Entertainment | 69 (53.1%) | 61 (46.9%) |
| Health Diagnosing & Treating | 44 (5.2%) | 800 (94.8%) |
| Health Technologists | 20 (3.9%) | 493 (96.1%) |
| Total (Category) | 2,244 (41.1%) | 3,219 (58.9%) |
| Total (Overall) | 9,455 (54.7%) | 7,832 (45.3%) |
Services Occupations
The most common Services occupations in Morrow County are Healthcare Support (796 | 4.6%), Cleaning & Maintenance (698 | 4.0%), Food Preparation & Serving (527 | 3.0%), Security & Protection (330 | 1.9%), and Personal Care & Service (312 | 1.8%).

Services Occupations by Sex
Within the Services occupations in Morrow County, the most male-oriented occupations are Law Enforcement (91.9%), Security & Protection (90.3%), and Firefighting & Prevention (88.8%), while the most female-oriented occupations are Healthcare Support (85.4%), Food Preparation & Serving (78.6%), and Personal Care & Service (65.4%).
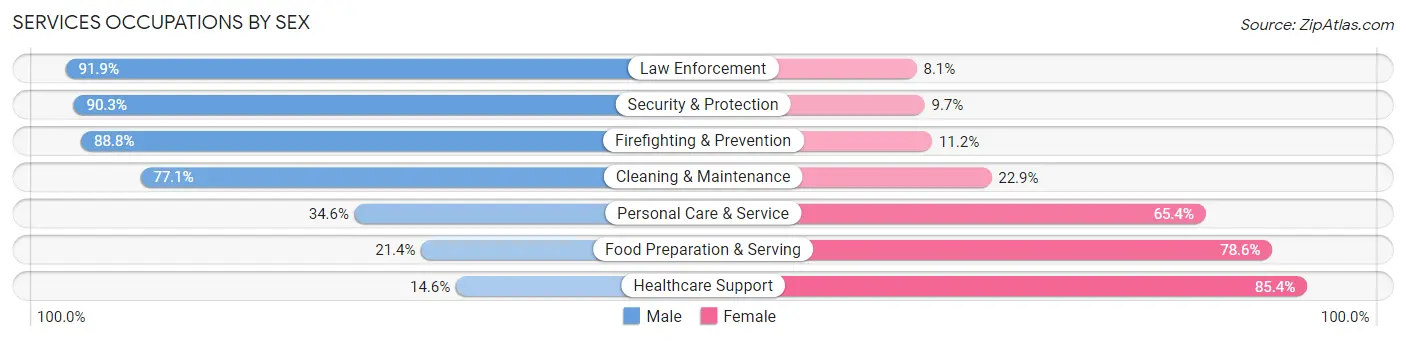
| Occupation | Male | Female |
| Healthcare Support | 116 (14.6%) | 680 (85.4%) |
| Security & Protection | 298 (90.3%) | 32 (9.7%) |
| Firefighting & Prevention | 151 (88.8%) | 19 (11.2%) |
| Law Enforcement | 147 (91.9%) | 13 (8.1%) |
| Food Preparation & Serving | 113 (21.4%) | 414 (78.6%) |
| Cleaning & Maintenance | 538 (77.1%) | 160 (22.9%) |
| Personal Care & Service | 108 (34.6%) | 204 (65.4%) |
| Total (Category) | 1,173 (44.1%) | 1,490 (55.9%) |
| Total (Overall) | 9,455 (54.7%) | 7,832 (45.3%) |
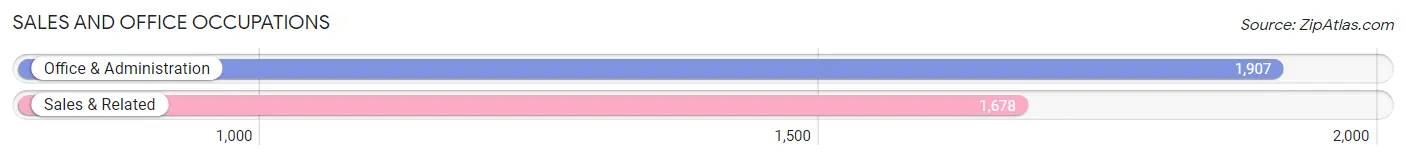
Sales and Office Occupations
The most common Sales and Office occupations in Morrow County are Office & Administration (1,907 | 11.0%), and Sales & Related (1,678 | 9.7%).
Sales and Office Occupations by Sex
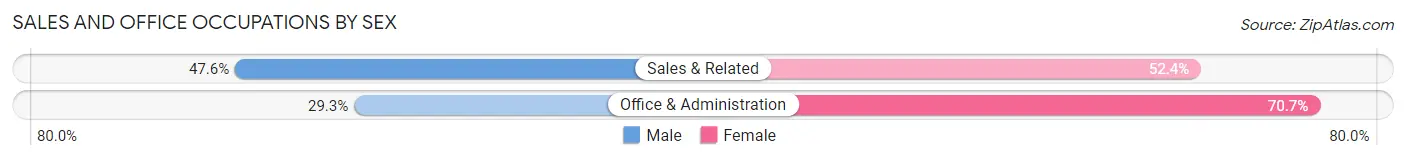
| Occupation | Male | Female |
| Sales & Related | 799 (47.6%) | 879 (52.4%) |
| Office & Administration | 559 (29.3%) | 1,348 (70.7%) |
| Total (Category) | 1,358 (37.9%) | 2,227 (62.1%) |
| Total (Overall) | 9,455 (54.7%) | 7,832 (45.3%) |
Natural Resources, Construction and Maintenance Occupations
The most common Natural Resources, Construction and Maintenance occupations in Morrow County are Construction & Extraction (1,322 | 7.6%), Installation, Maintenance & Repair (792 | 4.6%), and Farming, Fishing & Forestry (83 | 0.5%).
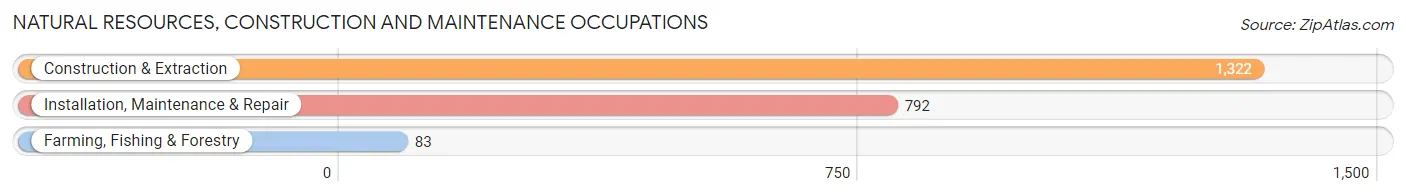
Natural Resources, Construction and Maintenance Occupations by Sex

| Occupation | Male | Female |
| Farming, Fishing & Forestry | 26 (31.3%) | 57 (68.7%) |
| Construction & Extraction | 1,297 (98.1%) | 25 (1.9%) |
| Installation, Maintenance & Repair | 773 (97.6%) | 19 (2.4%) |
| Total (Category) | 2,096 (95.4%) | 101 (4.6%) |
| Total (Overall) | 9,455 (54.7%) | 7,832 (45.3%) |
Production, Transportation and Moving Occupations
The most common Production, Transportation and Moving occupations in Morrow County are Production (1,827 | 10.6%), Material Moving (946 | 5.5%), and Transportation (606 | 3.5%).

Production, Transportation and Moving Occupations by Sex
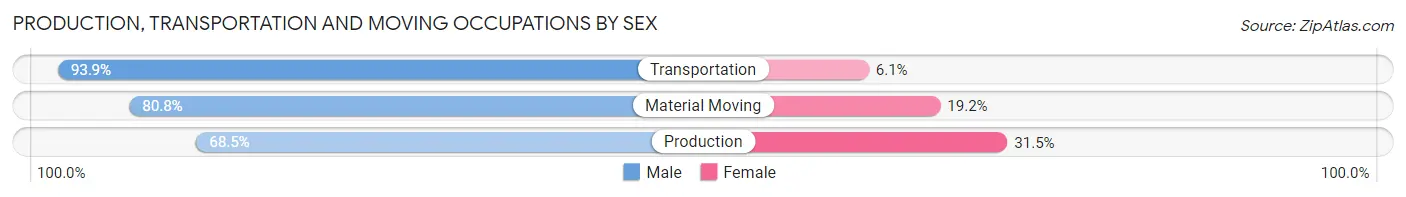
| Occupation | Male | Female |
| Production | 1,251 (68.5%) | 576 (31.5%) |
| Transportation | 569 (93.9%) | 37 (6.1%) |
| Material Moving | 764 (80.8%) | 182 (19.2%) |
| Total (Category) | 2,584 (76.5%) | 795 (23.5%) |
| Total (Overall) | 9,455 (54.7%) | 7,832 (45.3%) |
Employment Industries by Sex in Morrow County
Employment Industries in Morrow County
The major employment industries in Morrow County include Manufacturing (2,825 | 16.3%), Health Care & Social Assistance (2,526 | 14.6%), Retail Trade (2,092 | 12.1%), Construction (1,818 | 10.5%), and Educational Services (1,247 | 7.2%).

Employment Industries by Sex in Morrow County
The Morrow County industries that see more men than women are Mining, Quarrying, & Extraction (100.0%), Utilities (90.7%), and Public Administration (89.8%), whereas the industries that tend to have a higher number of women are Health Care & Social Assistance (89.9%), Educational Services (78.7%), and Finance & Insurance (76.1%).
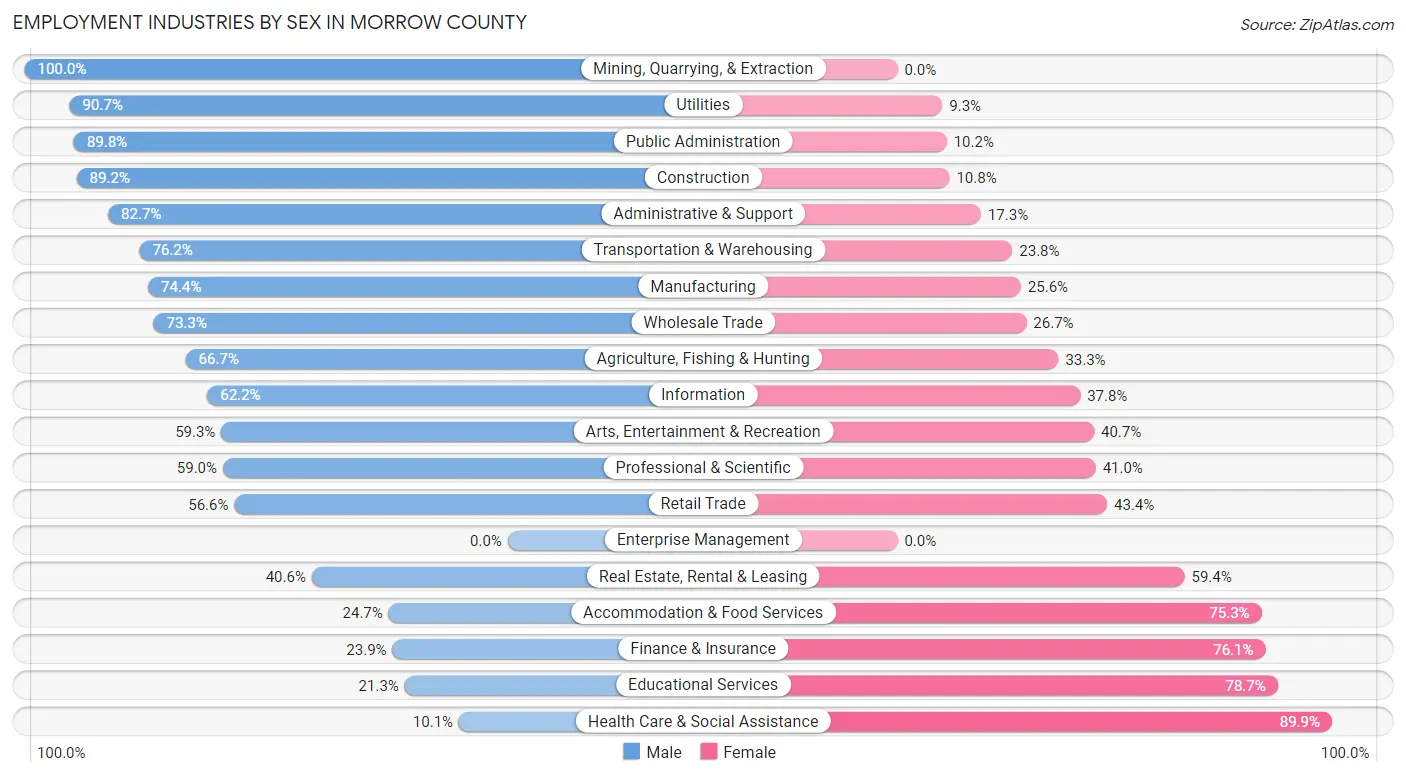
| Industry | Male | Female |
| Agriculture, Fishing & Hunting | 226 (66.7%) | 113 (33.3%) |
| Mining, Quarrying, & Extraction | 66 (100.0%) | 0 (0.0%) |
| Construction | 1,622 (89.2%) | 196 (10.8%) |
| Manufacturing | 2,103 (74.4%) | 722 (25.6%) |
| Wholesale Trade | 398 (73.3%) | 145 (26.7%) |
| Retail Trade | 1,184 (56.6%) | 908 (43.4%) |
| Transportation & Warehousing | 756 (76.2%) | 236 (23.8%) |
| Utilities | 156 (90.7%) | 16 (9.3%) |
| Information | 143 (62.2%) | 87 (37.8%) |
| Finance & Insurance | 158 (23.9%) | 504 (76.1%) |
| Real Estate, Rental & Leasing | 71 (40.6%) | 104 (59.4%) |
| Professional & Scientific | 408 (59.0%) | 284 (41.0%) |
| Enterprise Management | 0 (0.0%) | 0 (0.0%) |
| Administrative & Support | 454 (82.7%) | 95 (17.3%) |
| Educational Services | 266 (21.3%) | 981 (78.7%) |
| Health Care & Social Assistance | 255 (10.1%) | 2,271 (89.9%) |
| Arts, Entertainment & Recreation | 86 (59.3%) | 59 (40.7%) |
| Accommodation & Food Services | 199 (24.7%) | 608 (75.3%) |
| Public Administration | 466 (89.8%) | 53 (10.2%) |
| Total | 9,455 (54.7%) | 7,832 (45.3%) |
Education in Morrow County
School Enrollment in Morrow County
The most common levels of schooling among the 6,659 students in Morrow County are middle school (1,871 | 28.1%), high school (1,702 | 25.6%), and elementary school (1,528 | 23.0%).
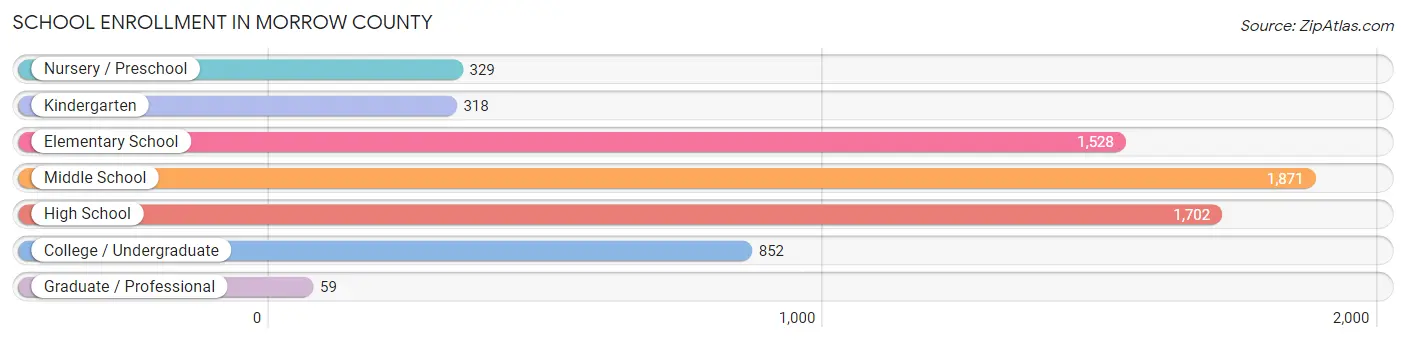
| School Level | # Students | % Students |
| Nursery / Preschool | 329 | 4.9% |
| Kindergarten | 318 | 4.8% |
| Elementary School | 1,528 | 23.0% |
| Middle School | 1,871 | 28.1% |
| High School | 1,702 | 25.6% |
| College / Undergraduate | 852 | 12.8% |
| Graduate / Professional | 59 | 0.9% |
| Total | 6,659 | 100.0% |
School Enrollment by Age by Funding Source in Morrow County
Out of a total of 6,659 students who are enrolled in schools in Morrow County, 599 (9.0%) attend a private institution, while the remaining 6,060 (91.0%) are enrolled in public schools. The age group of 35 years and over has the highest likelihood of being enrolled in private schools, with 77 (20.7% in the age bracket) enrolled. Conversely, the age group of 15 to 17 year olds has the lowest likelihood of being enrolled in a private school, with 1,412 (96.7% in the age bracket) attending a public institution.

| Age Bracket | Public School | Private School |
| 3 to 4 Year Olds | 218 (95.6%) | 10 (4.4%) |
| 5 to 9 Year Old | 1,507 (88.1%) | 203 (11.9%) |
| 10 to 14 Year Olds | 1,975 (94.0%) | 126 (6.0%) |
| 15 to 17 Year Olds | 1,412 (96.7%) | 48 (3.3%) |
| 18 to 19 Year Olds | 309 (80.7%) | 74 (19.3%) |
| 20 to 24 Year Olds | 215 (79.9%) | 54 (20.1%) |
| 25 to 34 Year Olds | 127 (93.4%) | 9 (6.6%) |
| 35 Years and over | 295 (79.3%) | 77 (20.7%) |
| Total | 6,060 (91.0%) | 599 (9.0%) |
Educational Attainment by Field of Study in Morrow County
Business (1,112 | 25.7%), education (850 | 19.6%), science & technology (491 | 11.3%), arts & humanities (299 | 6.9%), and social sciences (268 | 6.2%) are the most common fields of study among 4,333 individuals in Morrow County who have obtained a bachelor's degree or higher.
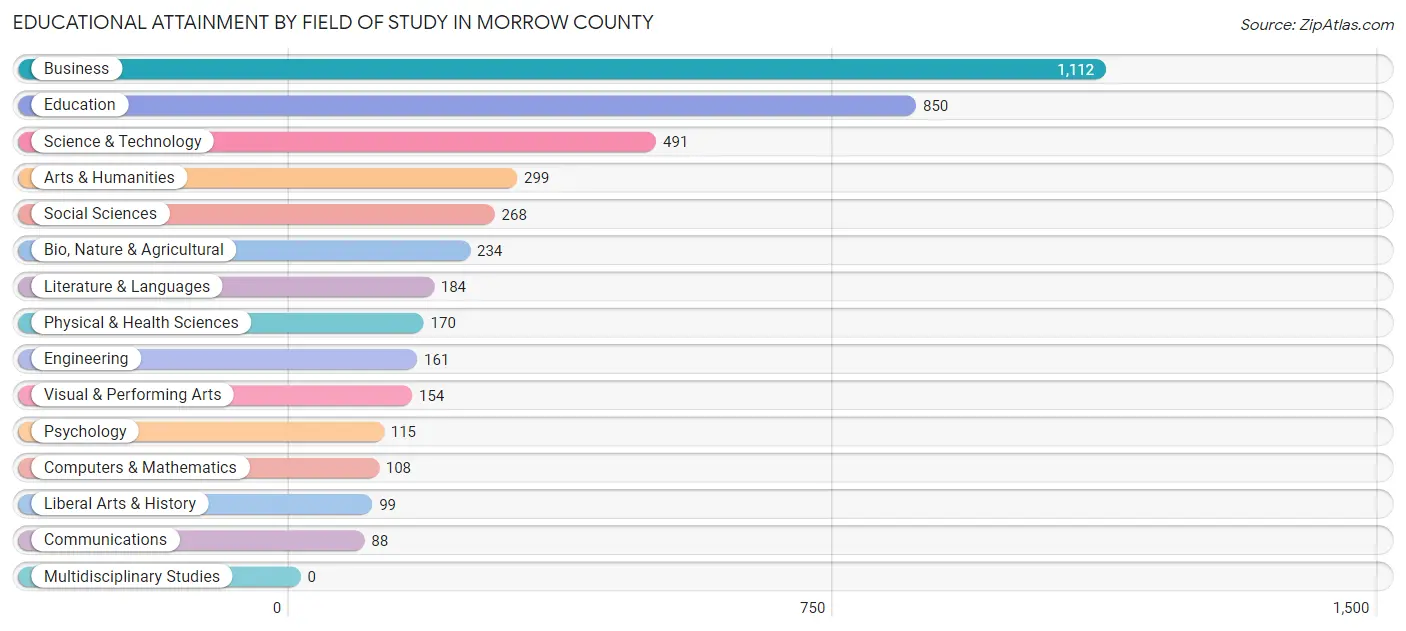
| Field of Study | # Graduates | % Graduates |
| Computers & Mathematics | 108 | 2.5% |
| Bio, Nature & Agricultural | 234 | 5.4% |
| Physical & Health Sciences | 170 | 3.9% |
| Psychology | 115 | 2.6% |
| Social Sciences | 268 | 6.2% |
| Engineering | 161 | 3.7% |
| Multidisciplinary Studies | 0 | 0.0% |
| Science & Technology | 491 | 11.3% |
| Business | 1,112 | 25.7% |
| Education | 850 | 19.6% |
| Literature & Languages | 184 | 4.3% |
| Liberal Arts & History | 99 | 2.3% |
| Visual & Performing Arts | 154 | 3.5% |
| Communications | 88 | 2.0% |
| Arts & Humanities | 299 | 6.9% |
| Total | 4,333 | 100.0% |
Transportation & Commute in Morrow County
Vehicle Availability by Sex in Morrow County
The most prevalent vehicle ownership categories in Morrow County are males with 2 vehicles (3,178, accounting for 33.5%) and females with 2 vehicles (2,672, making up 41.4%).
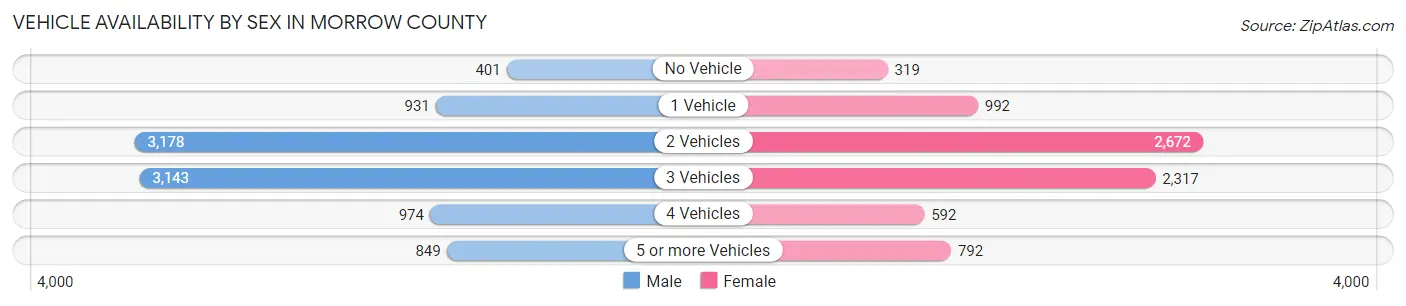
| Vehicles Available | Male | Female |
| No Vehicle | 401 (4.2%) | 319 (4.2%) |
| 1 Vehicle | 931 (9.8%) | 992 (12.9%) |
| 2 Vehicles | 3,178 (33.5%) | 2,672 (34.8%) |
| 3 Vehicles | 3,143 (33.2%) | 2,317 (30.1%) |
| 4 Vehicles | 974 (10.3%) | 592 (7.7%) |
| 5 or more Vehicles | 849 (9.0%) | 792 (10.3%) |
| Total | 9,476 (100.0%) | 7,684 (100.0%) |
Commute Time in Morrow County
The most frequently occuring commute durations in Morrow County are 45 to 59 minutes (2,228 commuters, 14.4%), 30 to 34 minutes (2,125 commuters, 13.8%), and 20 to 24 minutes (2,062 commuters, 13.4%).
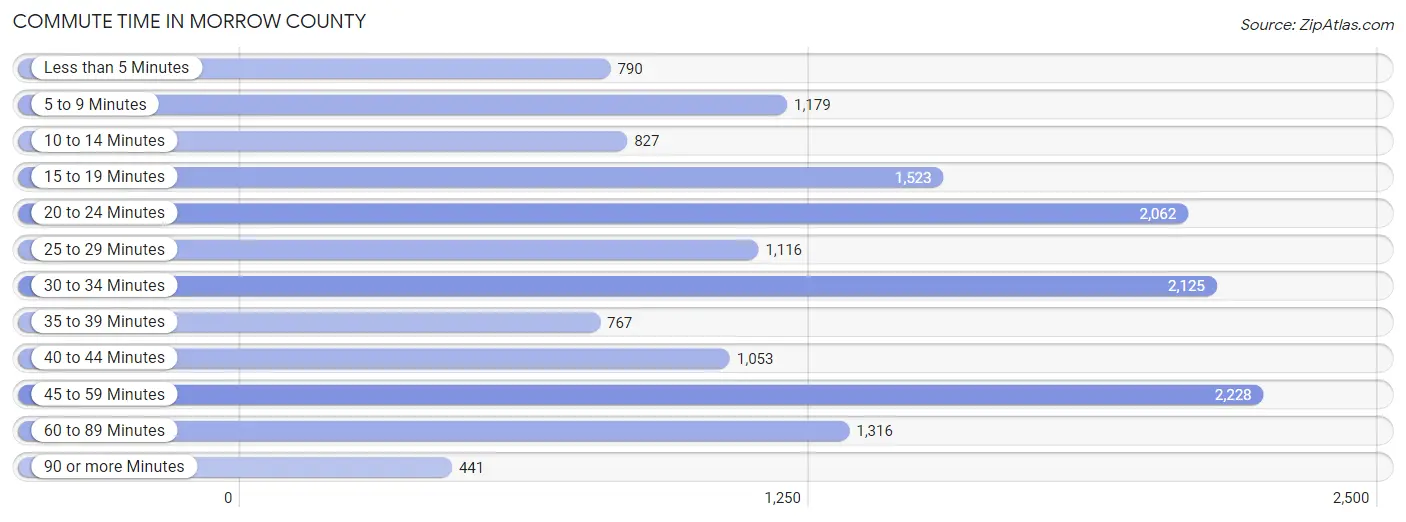
| Commute Time | # Commuters | % Commuters |
| Less than 5 Minutes | 790 | 5.1% |
| 5 to 9 Minutes | 1,179 | 7.6% |
| 10 to 14 Minutes | 827 | 5.4% |
| 15 to 19 Minutes | 1,523 | 9.9% |
| 20 to 24 Minutes | 2,062 | 13.4% |
| 25 to 29 Minutes | 1,116 | 7.2% |
| 30 to 34 Minutes | 2,125 | 13.8% |
| 35 to 39 Minutes | 767 | 5.0% |
| 40 to 44 Minutes | 1,053 | 6.8% |
| 45 to 59 Minutes | 2,228 | 14.4% |
| 60 to 89 Minutes | 1,316 | 8.5% |
| 90 or more Minutes | 441 | 2.9% |
Commute Time by Sex in Morrow County
The most common commute times in Morrow County are 45 to 59 minutes (1,485 commuters, 17.1%) for males and 30 to 34 minutes (883 commuters, 13.1%) for females.
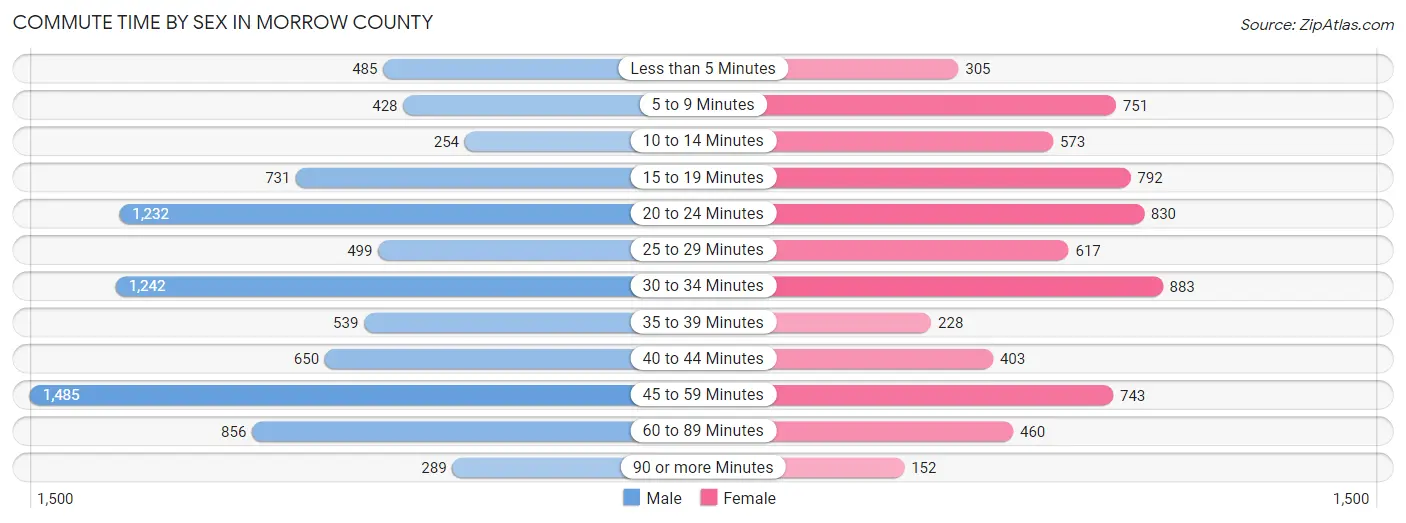
| Commute Time | Male | Female |
| Less than 5 Minutes | 485 (5.6%) | 305 (4.5%) |
| 5 to 9 Minutes | 428 (4.9%) | 751 (11.2%) |
| 10 to 14 Minutes | 254 (2.9%) | 573 (8.5%) |
| 15 to 19 Minutes | 731 (8.4%) | 792 (11.8%) |
| 20 to 24 Minutes | 1,232 (14.2%) | 830 (12.3%) |
| 25 to 29 Minutes | 499 (5.7%) | 617 (9.2%) |
| 30 to 34 Minutes | 1,242 (14.3%) | 883 (13.1%) |
| 35 to 39 Minutes | 539 (6.2%) | 228 (3.4%) |
| 40 to 44 Minutes | 650 (7.5%) | 403 (6.0%) |
| 45 to 59 Minutes | 1,485 (17.1%) | 743 (11.0%) |
| 60 to 89 Minutes | 856 (9.9%) | 460 (6.8%) |
| 90 or more Minutes | 289 (3.3%) | 152 (2.3%) |
Time of Departure to Work by Sex in Morrow County
The most frequent times of departure to work in Morrow County are 6:00 AM to 6:29 AM (1,357, 15.6%) for males and 7:00 AM to 7:29 AM (1,110, 16.5%) for females.
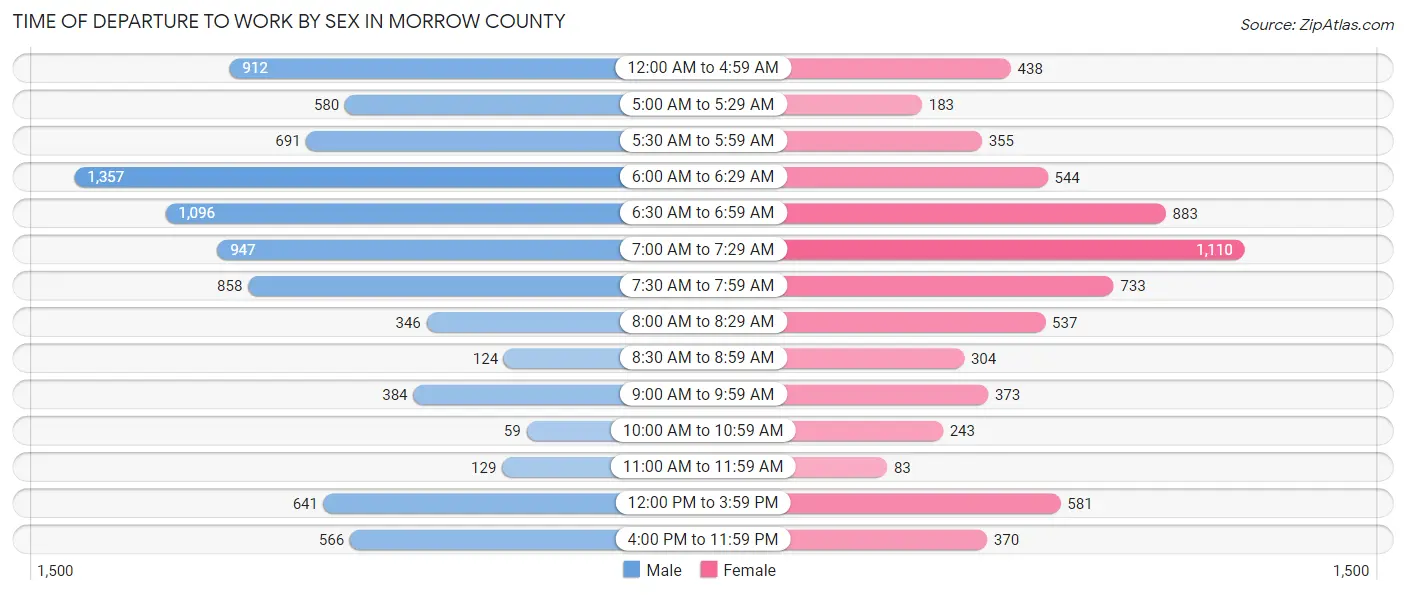
| Time of Departure | Male | Female |
| 12:00 AM to 4:59 AM | 912 (10.5%) | 438 (6.5%) |
| 5:00 AM to 5:29 AM | 580 (6.7%) | 183 (2.7%) |
| 5:30 AM to 5:59 AM | 691 (8.0%) | 355 (5.3%) |
| 6:00 AM to 6:29 AM | 1,357 (15.6%) | 544 (8.1%) |
| 6:30 AM to 6:59 AM | 1,096 (12.6%) | 883 (13.1%) |
| 7:00 AM to 7:29 AM | 947 (10.9%) | 1,110 (16.5%) |
| 7:30 AM to 7:59 AM | 858 (9.9%) | 733 (10.9%) |
| 8:00 AM to 8:29 AM | 346 (4.0%) | 537 (8.0%) |
| 8:30 AM to 8:59 AM | 124 (1.4%) | 304 (4.5%) |
| 9:00 AM to 9:59 AM | 384 (4.4%) | 373 (5.5%) |
| 10:00 AM to 10:59 AM | 59 (0.7%) | 243 (3.6%) |
| 11:00 AM to 11:59 AM | 129 (1.5%) | 83 (1.2%) |
| 12:00 PM to 3:59 PM | 641 (7.4%) | 581 (8.6%) |
| 4:00 PM to 11:59 PM | 566 (6.5%) | 370 (5.5%) |
| Total | 8,690 (100.0%) | 6,737 (100.0%) |
Housing Occupancy in Morrow County
Occupancy by Ownership in Morrow County
Of the total 13,222 dwellings in Morrow County, owner-occupied units account for 10,804 (81.7%), while renter-occupied units make up 2,418 (18.3%).
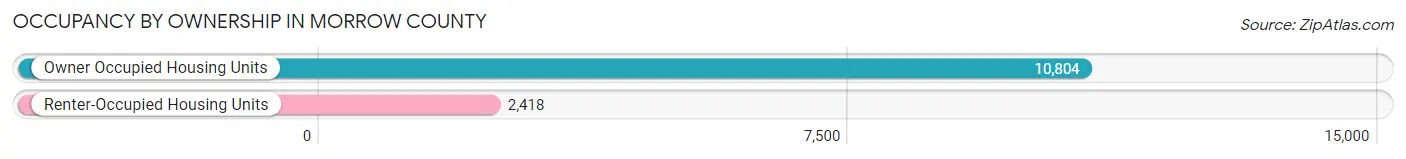
| Occupancy | # Housing Units | % Housing Units |
| Owner Occupied Housing Units | 10,804 | 81.7% |
| Renter-Occupied Housing Units | 2,418 | 18.3% |
| Total Occupied Housing Units | 13,222 | 100.0% |
Occupancy by Household Size in Morrow County
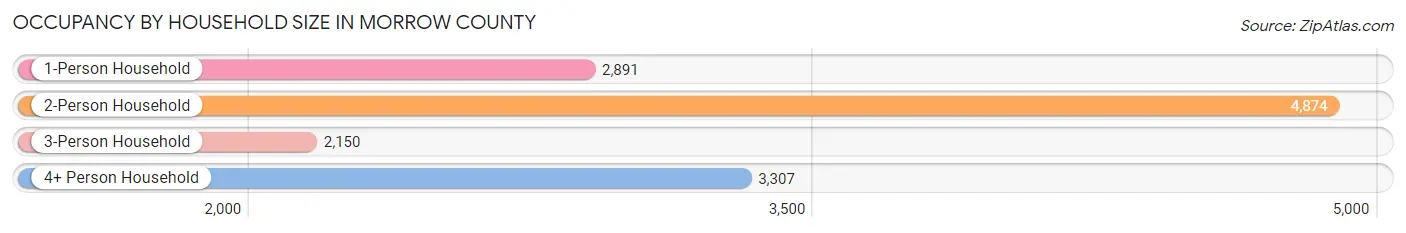
| Household Size | # Housing Units | % Housing Units |
| 1-Person Household | 2,891 | 21.9% |
| 2-Person Household | 4,874 | 36.9% |
| 3-Person Household | 2,150 | 16.3% |
| 4+ Person Household | 3,307 | 25.0% |
| Total Housing Units | 13,222 | 100.0% |
Occupancy by Ownership by Household Size in Morrow County

| Household Size | Owner-occupied | Renter-occupied |
| 1-Person Household | 2,111 (73.0%) | 780 (27.0%) |
| 2-Person Household | 4,246 (87.1%) | 628 (12.9%) |
| 3-Person Household | 1,693 (78.7%) | 457 (21.3%) |
| 4+ Person Household | 2,754 (83.3%) | 553 (16.7%) |
| Total Housing Units | 10,804 (81.7%) | 2,418 (18.3%) |
Occupancy by Educational Attainment in Morrow County
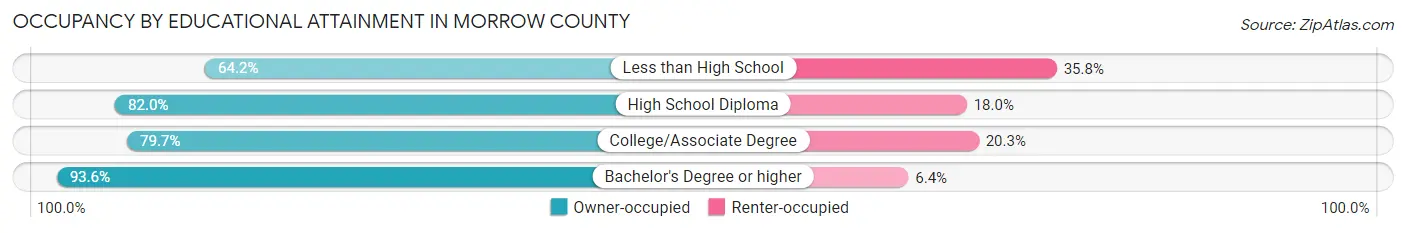
| Household Size | Owner-occupied | Renter-occupied |
| Less than High School | 789 (64.2%) | 440 (35.8%) |
| High School Diploma | 4,491 (82.0%) | 983 (18.0%) |
| College/Associate Degree | 3,307 (79.7%) | 844 (20.3%) |
| Bachelor's Degree or higher | 2,217 (93.6%) | 151 (6.4%) |
Occupancy by Age of Householder in Morrow County
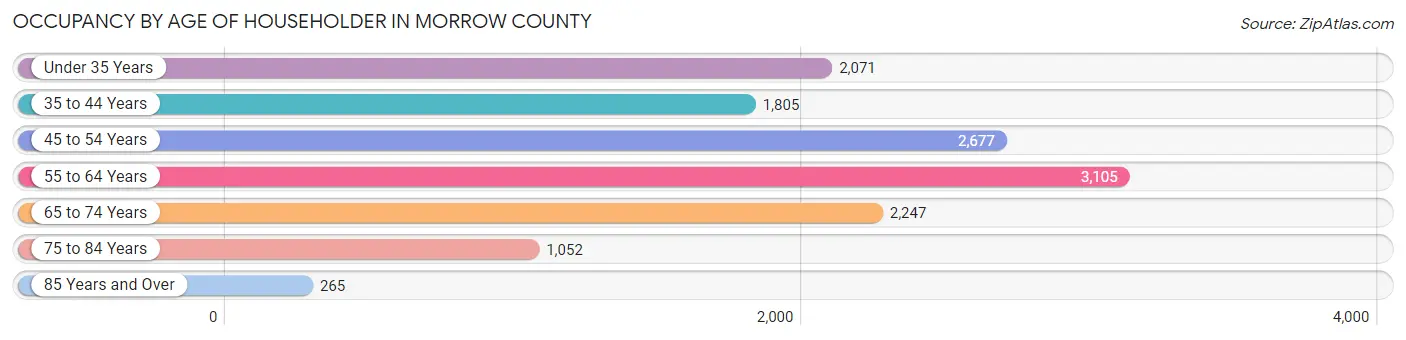
| Age Bracket | # Households | % Households |
| Under 35 Years | 2,071 | 15.7% |
| 35 to 44 Years | 1,805 | 13.7% |
| 45 to 54 Years | 2,677 | 20.3% |
| 55 to 64 Years | 3,105 | 23.5% |
| 65 to 74 Years | 2,247 | 17.0% |
| 75 to 84 Years | 1,052 | 8.0% |
| 85 Years and Over | 265 | 2.0% |
| Total | 13,222 | 100.0% |
Housing Finances in Morrow County
Median Income by Occupancy in Morrow County
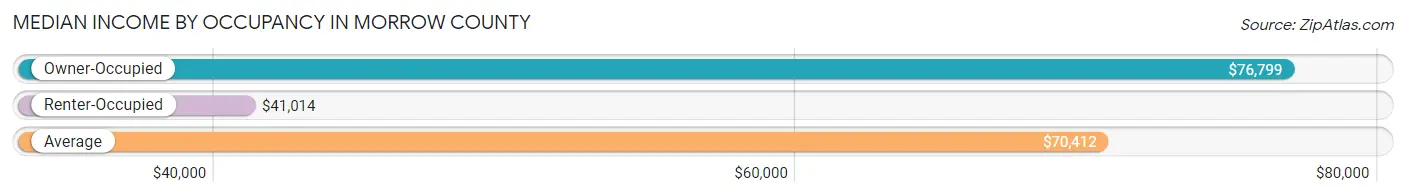
| Occupancy Type | # Households | Median Income |
| Owner-Occupied | 10,804 (81.7%) | $76,799 |
| Renter-Occupied | 2,418 (18.3%) | $41,014 |
| Average | 13,222 (100.0%) | $70,412 |
Occupancy by Householder Income Bracket in Morrow County

| Income Bracket | Owner-occupied | Renter-occupied |
| Less than $5,000 | 110 (1.0%) | 130 (5.4%) |
| $5,000 to $9,999 | 75 (0.7%) | 60 (2.5%) |
| $10,000 to $14,999 | 164 (1.5%) | 216 (8.9%) |
| $15,000 to $19,999 | 238 (2.2%) | 95 (3.9%) |
| $20,000 to $24,999 | 164 (1.5%) | 170 (7.0%) |
| $25,000 to $34,999 | 550 (5.1%) | 273 (11.3%) |
| $35,000 to $49,999 | 1,218 (11.3%) | 429 (17.7%) |
| $50,000 to $74,999 | 2,634 (24.4%) | 560 (23.2%) |
| $75,000 to $99,999 | 1,845 (17.1%) | 295 (12.2%) |
| $100,000 to $149,999 | 2,395 (22.2%) | 172 (7.1%) |
| $150,000 or more | 1,411 (13.1%) | 18 (0.7%) |
| Total | 10,804 (100.0%) | 2,418 (100.0%) |
Monthly Housing Cost Tiers in Morrow County
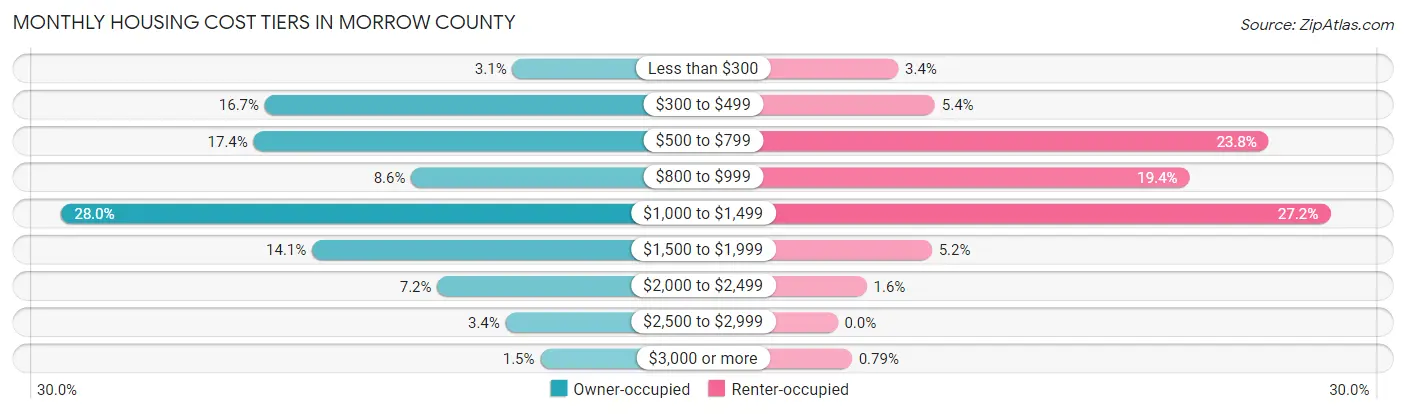
| Monthly Cost | Owner-occupied | Renter-occupied |
| Less than $300 | 329 (3.0%) | 81 (3.4%) |
| $300 to $499 | 1,807 (16.7%) | 130 (5.4%) |
| $500 to $799 | 1,874 (17.3%) | 576 (23.8%) |
| $800 to $999 | 934 (8.6%) | 470 (19.4%) |
| $1,000 to $1,499 | 3,022 (28.0%) | 658 (27.2%) |
| $1,500 to $1,999 | 1,526 (14.1%) | 126 (5.2%) |
| $2,000 to $2,499 | 778 (7.2%) | 39 (1.6%) |
| $2,500 to $2,999 | 371 (3.4%) | 0 (0.0%) |
| $3,000 or more | 163 (1.5%) | 19 (0.8%) |
| Total | 10,804 (100.0%) | 2,418 (100.0%) |
Physical Housing Characteristics in Morrow County
Housing Structures in Morrow County
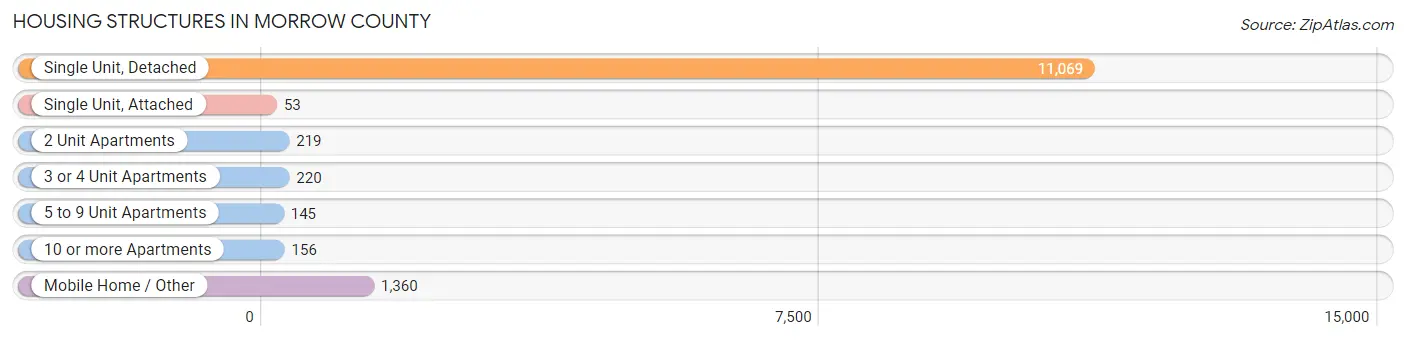
| Structure Type | # Housing Units | % Housing Units |
| Single Unit, Detached | 11,069 | 83.7% |
| Single Unit, Attached | 53 | 0.4% |
| 2 Unit Apartments | 219 | 1.7% |
| 3 or 4 Unit Apartments | 220 | 1.7% |
| 5 to 9 Unit Apartments | 145 | 1.1% |
| 10 or more Apartments | 156 | 1.2% |
| Mobile Home / Other | 1,360 | 10.3% |
| Total | 13,222 | 100.0% |
Housing Structures by Occupancy in Morrow County
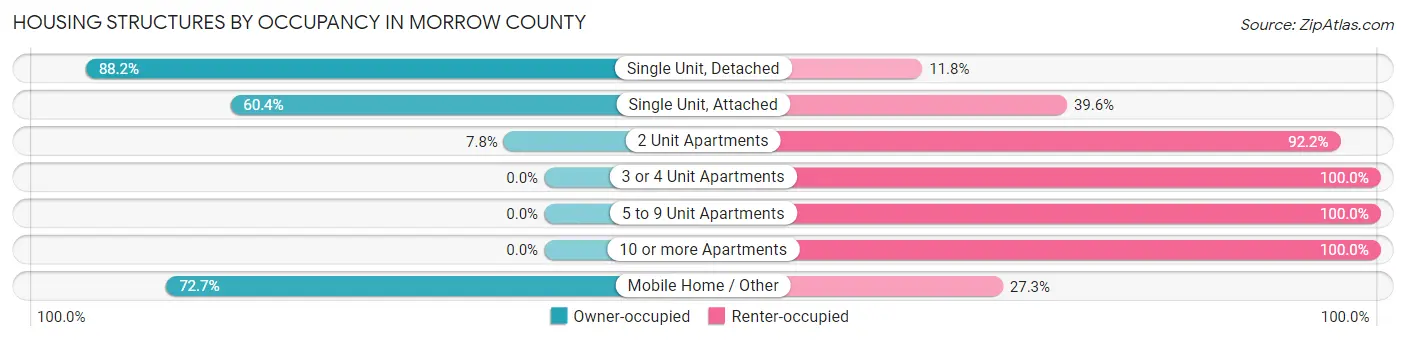
| Structure Type | Owner-occupied | Renter-occupied |
| Single Unit, Detached | 9,766 (88.2%) | 1,303 (11.8%) |
| Single Unit, Attached | 32 (60.4%) | 21 (39.6%) |
| 2 Unit Apartments | 17 (7.8%) | 202 (92.2%) |
| 3 or 4 Unit Apartments | 0 (0.0%) | 220 (100.0%) |
| 5 to 9 Unit Apartments | 0 (0.0%) | 145 (100.0%) |
| 10 or more Apartments | 0 (0.0%) | 156 (100.0%) |
| Mobile Home / Other | 989 (72.7%) | 371 (27.3%) |
| Total | 10,804 (81.7%) | 2,418 (18.3%) |
Housing Structures by Number of Rooms in Morrow County
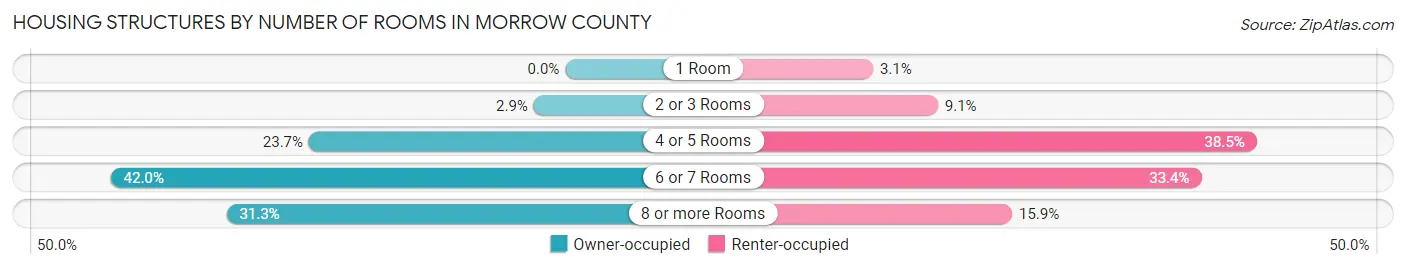
| Number of Rooms | Owner-occupied | Renter-occupied |
| 1 Room | 0 (0.0%) | 74 (3.1%) |
| 2 or 3 Rooms | 315 (2.9%) | 219 (9.1%) |
| 4 or 5 Rooms | 2,562 (23.7%) | 932 (38.5%) |
| 6 or 7 Rooms | 4,542 (42.0%) | 808 (33.4%) |
| 8 or more Rooms | 3,385 (31.3%) | 385 (15.9%) |
| Total | 10,804 (100.0%) | 2,418 (100.0%) |
Housing Structure by Heating Type in Morrow County
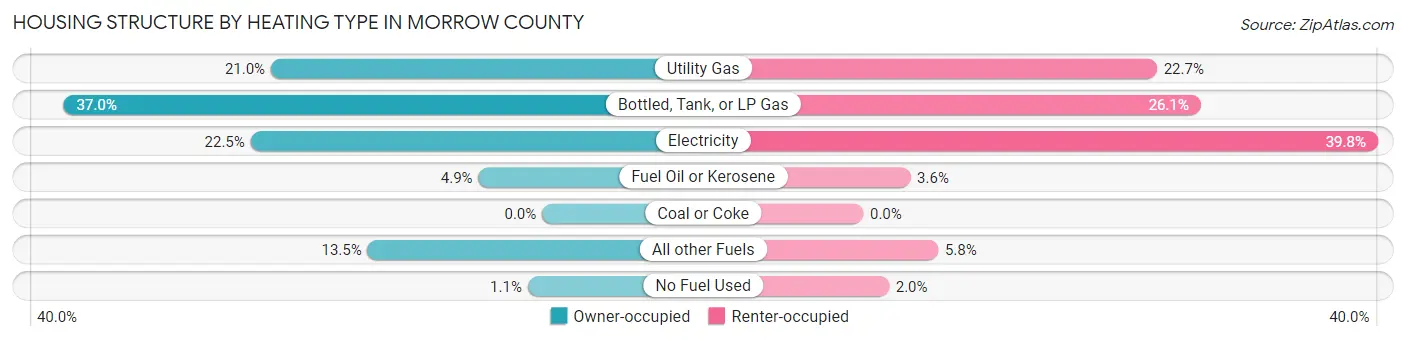
| Heating Type | Owner-occupied | Renter-occupied |
| Utility Gas | 2,265 (21.0%) | 549 (22.7%) |
| Bottled, Tank, or LP Gas | 3,996 (37.0%) | 631 (26.1%) |
| Electricity | 2,434 (22.5%) | 962 (39.8%) |
| Fuel Oil or Kerosene | 532 (4.9%) | 88 (3.6%) |
| Coal or Coke | 0 (0.0%) | 0 (0.0%) |
| All other Fuels | 1,457 (13.5%) | 140 (5.8%) |
| No Fuel Used | 120 (1.1%) | 48 (2.0%) |
| Total | 10,804 (100.0%) | 2,418 (100.0%) |
Household Vehicle Usage in Morrow County

| Vehicles per Household | Owner-occupied | Renter-occupied |
| No Vehicle | 363 (3.4%) | 228 (9.4%) |
| 1 Vehicle | 1,643 (15.2%) | 1,022 (42.3%) |
| 2 Vehicles | 4,036 (37.4%) | 803 (33.2%) |
| 3 or more Vehicles | 4,762 (44.1%) | 365 (15.1%) |
| Total | 10,804 (100.0%) | 2,418 (100.0%) |
Real Estate & Mortgages in Morrow County
Real Estate and Mortgage Overview in Morrow County
| Characteristic | Without Mortgage | With Mortgage |
| Housing Units | 4,077 | 6,727 |
| Median Property Value | $171,600 | $193,800 |
| Median Household Income | $60,669 | $1,110 |
| Monthly Housing Costs | $495 | $162 |
| Real Estate Taxes | $2,078 | $56 |
Property Value by Mortgage Status in Morrow County
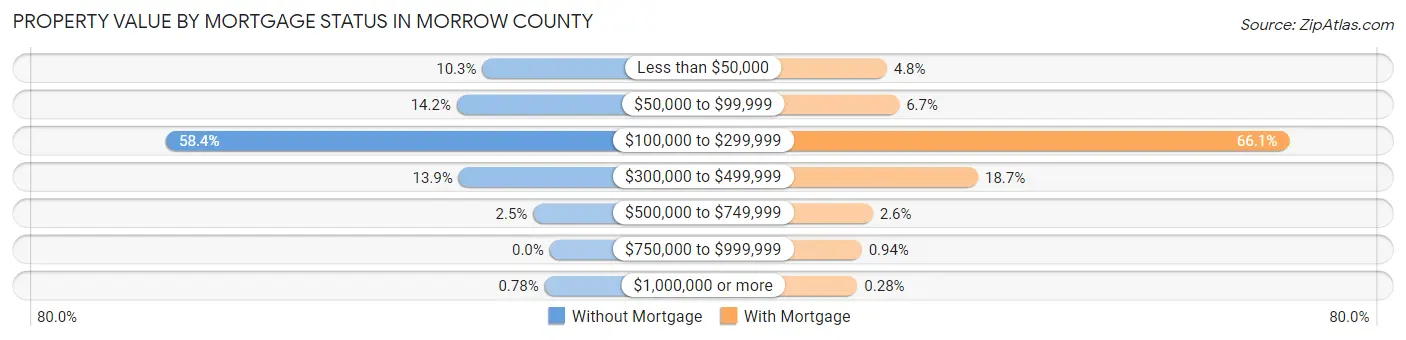
| Property Value | Without Mortgage | With Mortgage |
| Less than $50,000 | 418 (10.2%) | 320 (4.8%) |
| $50,000 to $99,999 | 577 (14.1%) | 448 (6.7%) |
| $100,000 to $299,999 | 2,382 (58.4%) | 4,444 (66.1%) |
| $300,000 to $499,999 | 566 (13.9%) | 1,256 (18.7%) |
| $500,000 to $749,999 | 102 (2.5%) | 177 (2.6%) |
| $750,000 to $999,999 | 0 (0.0%) | 63 (0.9%) |
| $1,000,000 or more | 32 (0.8%) | 19 (0.3%) |
| Total | 4,077 (100.0%) | 6,727 (100.0%) |
Household Income by Mortgage Status in Morrow County
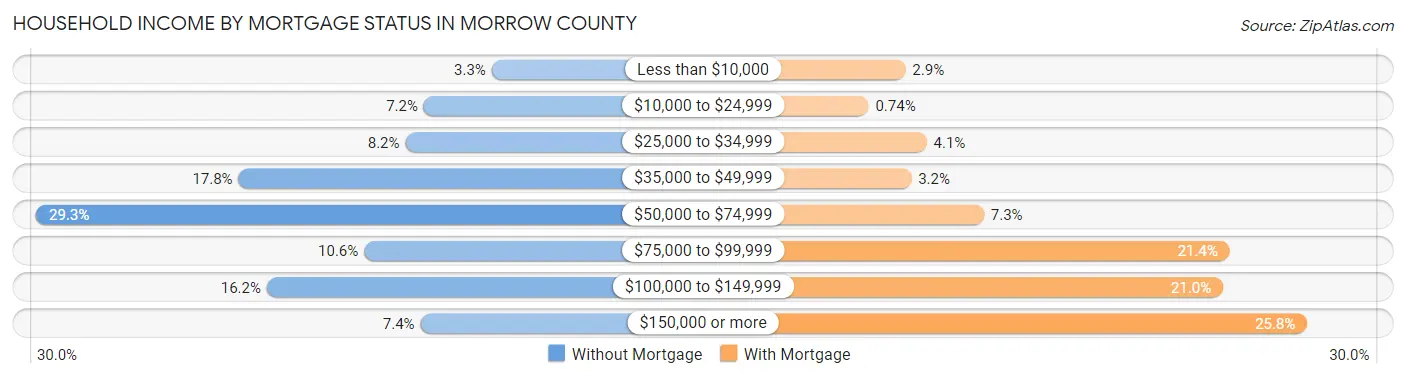
| Household Income | Without Mortgage | With Mortgage |
| Less than $10,000 | 135 (3.3%) | 192 (2.9%) |
| $10,000 to $24,999 | 293 (7.2%) | 50 (0.7%) |
| $25,000 to $34,999 | 336 (8.2%) | 273 (4.1%) |
| $35,000 to $49,999 | 725 (17.8%) | 214 (3.2%) |
| $50,000 to $74,999 | 1,196 (29.3%) | 493 (7.3%) |
| $75,000 to $99,999 | 432 (10.6%) | 1,438 (21.4%) |
| $100,000 to $149,999 | 659 (16.2%) | 1,413 (21.0%) |
| $150,000 or more | 301 (7.4%) | 1,736 (25.8%) |
| Total | 4,077 (100.0%) | 6,727 (100.0%) |
Property Value to Household Income Ratio in Morrow County

| Value-to-Income Ratio | Without Mortgage | With Mortgage |
| Less than 2.0x | 1,591 (39.0%) | 88,172 (1,310.7%) |
| 2.0x to 2.9x | 706 (17.3%) | 3,014 (44.8%) |
| 3.0x to 3.9x | 650 (15.9%) | 1,596 (23.7%) |
| 4.0x or more | 1,099 (27.0%) | 816 (12.1%) |
| Total | 4,077 (100.0%) | 6,727 (100.0%) |
Real Estate Taxes by Mortgage Status in Morrow County
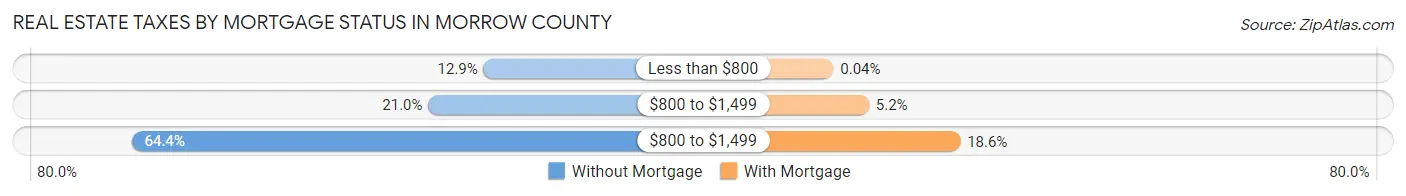
| Property Taxes | Without Mortgage | With Mortgage |
| Less than $800 | 527 (12.9%) | 3 (0.0%) |
| $800 to $1,499 | 856 (21.0%) | 352 (5.2%) |
| $800 to $1,499 | 2,624 (64.4%) | 1,250 (18.6%) |
| Total | 4,077 (100.0%) | 6,727 (100.0%) |
Health & Disability in Morrow County
Health Insurance Coverage by Age in Morrow County
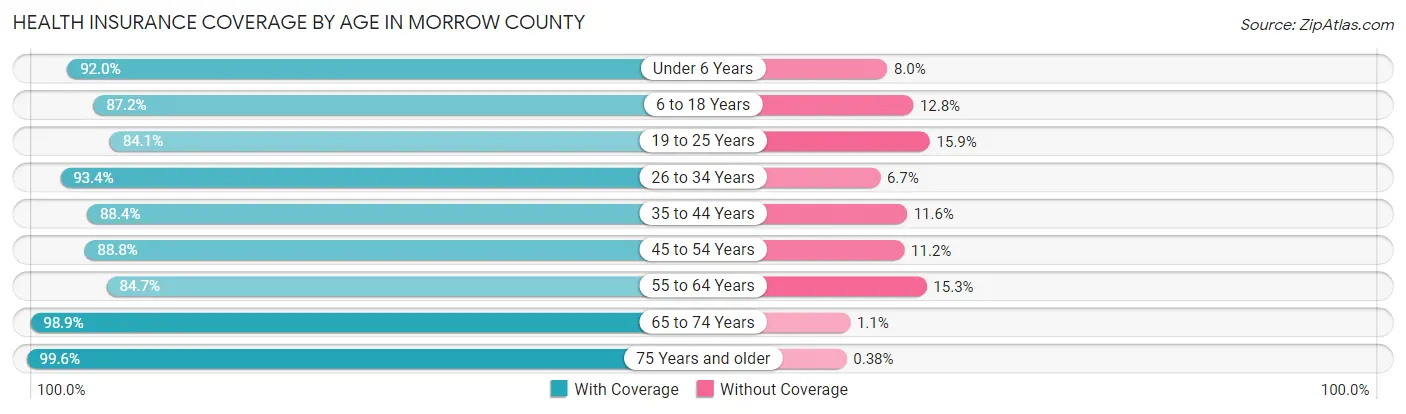
| Age Bracket | With Coverage | Without Coverage |
| Under 6 Years | 2,036 (92.0%) | 176 (8.0%) |
| 6 to 18 Years | 5,150 (87.2%) | 756 (12.8%) |
| 19 to 25 Years | 2,221 (84.1%) | 420 (15.9%) |
| 26 to 34 Years | 3,298 (93.3%) | 235 (6.7%) |
| 35 to 44 Years | 3,589 (88.4%) | 473 (11.6%) |
| 45 to 54 Years | 4,284 (88.8%) | 538 (11.2%) |
| 55 to 64 Years | 4,496 (84.7%) | 813 (15.3%) |
| 65 to 74 Years | 3,829 (98.9%) | 41 (1.1%) |
| 75 Years and older | 2,377 (99.6%) | 9 (0.4%) |
| Total | 31,280 (90.0%) | 3,461 (10.0%) |
Health Insurance Coverage by Citizenship Status in Morrow County
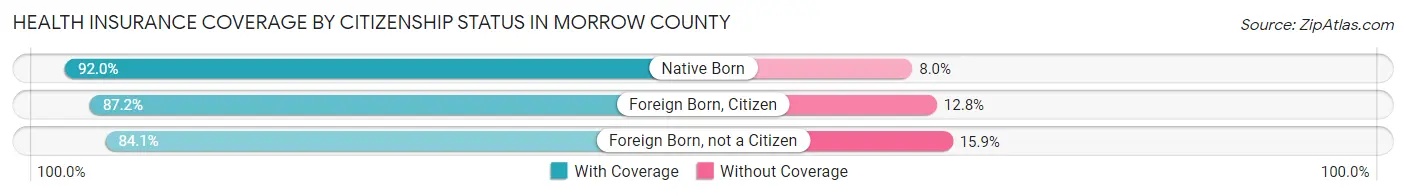
| Citizenship Status | With Coverage | Without Coverage |
| Native Born | 2,036 (92.0%) | 176 (8.0%) |
| Foreign Born, Citizen | 5,150 (87.2%) | 756 (12.8%) |
| Foreign Born, not a Citizen | 2,221 (84.1%) | 420 (15.9%) |
Health Insurance Coverage by Household Income in Morrow County
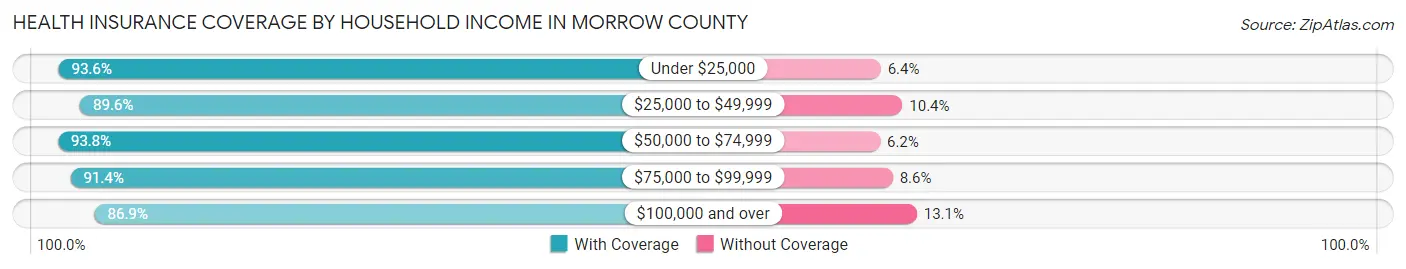
| Household Income | With Coverage | Without Coverage |
| Under $25,000 | 2,415 (93.6%) | 164 (6.4%) |
| $25,000 to $49,999 | 4,735 (89.6%) | 550 (10.4%) |
| $50,000 to $74,999 | 6,770 (93.8%) | 450 (6.2%) |
| $75,000 to $99,999 | 5,719 (91.4%) | 538 (8.6%) |
| $100,000 and over | 11,595 (86.9%) | 1,751 (13.1%) |
Public vs Private Health Insurance Coverage by Age in Morrow County
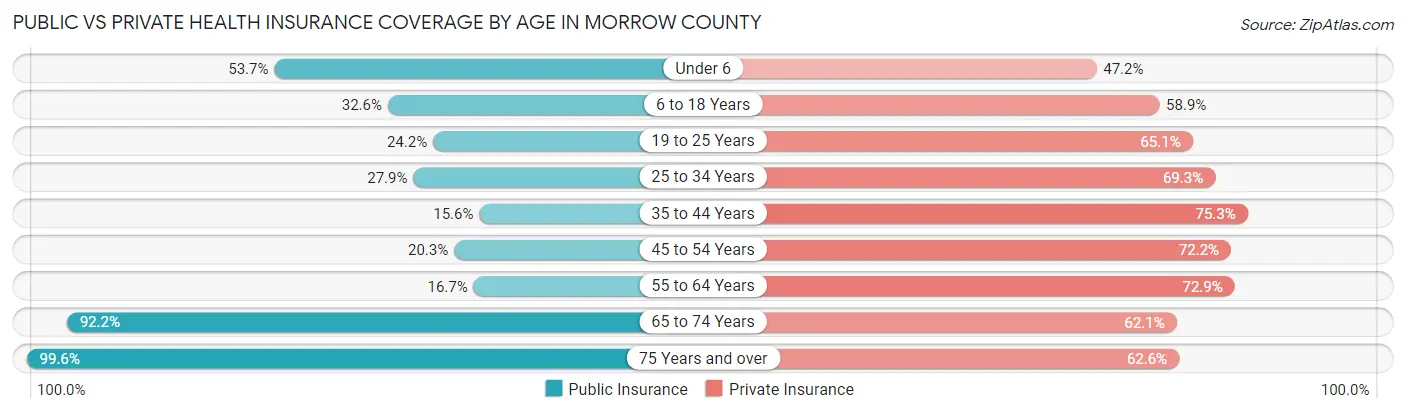
| Age Bracket | Public Insurance | Private Insurance |
| Under 6 | 1,187 (53.7%) | 1,045 (47.2%) |
| 6 to 18 Years | 1,924 (32.6%) | 3,479 (58.9%) |
| 19 to 25 Years | 639 (24.2%) | 1,719 (65.1%) |
| 25 to 34 Years | 984 (27.9%) | 2,447 (69.3%) |
| 35 to 44 Years | 634 (15.6%) | 3,059 (75.3%) |
| 45 to 54 Years | 978 (20.3%) | 3,483 (72.2%) |
| 55 to 64 Years | 885 (16.7%) | 3,870 (72.9%) |
| 65 to 74 Years | 3,567 (92.2%) | 2,404 (62.1%) |
| 75 Years and over | 2,377 (99.6%) | 1,493 (62.6%) |
| Total | 13,175 (37.9%) | 22,999 (66.2%) |
Disability Status by Sex by Age in Morrow County
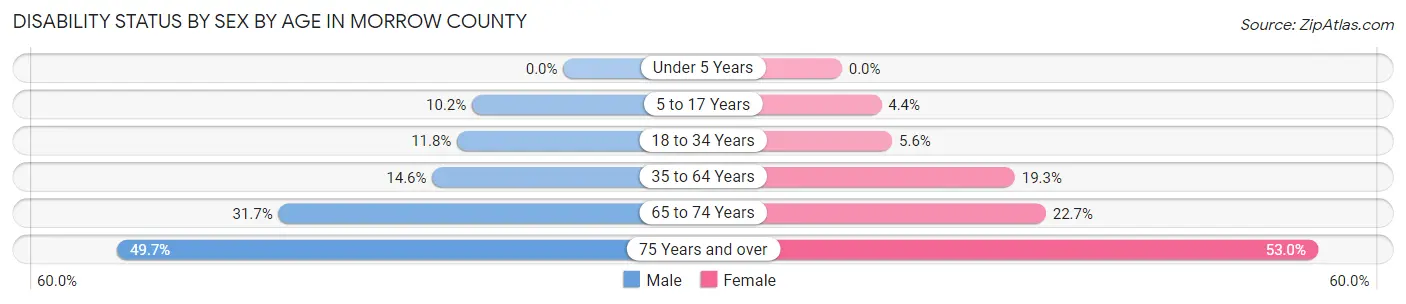
| Age Bracket | Male | Female |
| Under 5 Years | 0 (0.0%) | 0 (0.0%) |
| 5 to 17 Years | 319 (10.2%) | 121 (4.4%) |
| 18 to 34 Years | 398 (11.8%) | 176 (5.6%) |
| 35 to 64 Years | 1,061 (14.6%) | 1,333 (19.3%) |
| 65 to 74 Years | 588 (31.7%) | 458 (22.7%) |
| 75 Years and over | 510 (49.7%) | 721 (53.0%) |
Disability Class by Sex by Age in Morrow County
Disability Class: Hearing Difficulty
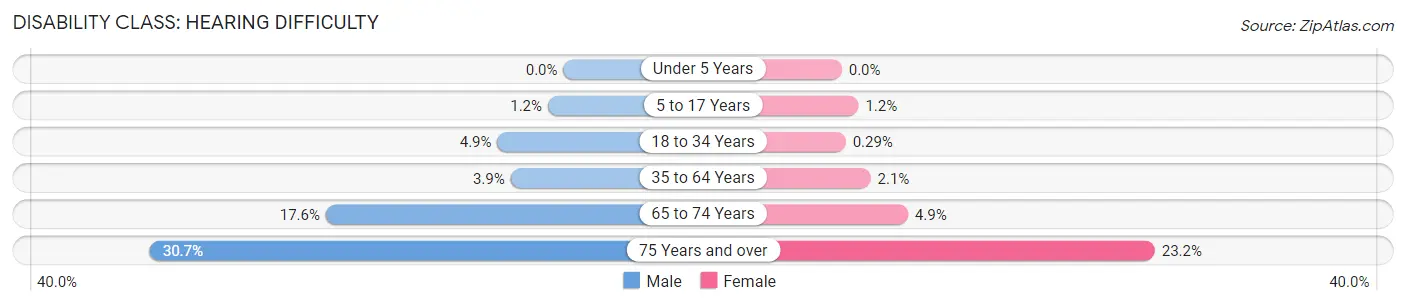
| Age Bracket | Male | Female |
| Under 5 Years | 0 (0.0%) | 0 (0.0%) |
| 5 to 17 Years | 36 (1.1%) | 34 (1.2%) |
| 18 to 34 Years | 165 (4.9%) | 9 (0.3%) |
| 35 to 64 Years | 285 (3.9%) | 148 (2.1%) |
| 65 to 74 Years | 327 (17.6%) | 99 (4.9%) |
| 75 Years and over | 315 (30.7%) | 316 (23.2%) |
Disability Class: Vision Difficulty
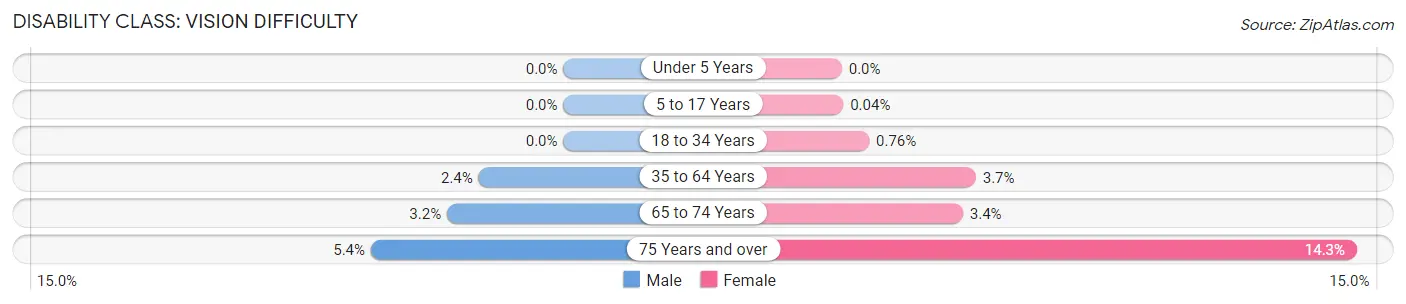
| Age Bracket | Male | Female |
| Under 5 Years | 0 (0.0%) | 0 (0.0%) |
| 5 to 17 Years | 0 (0.0%) | 1 (0.0%) |
| 18 to 34 Years | 0 (0.0%) | 24 (0.8%) |
| 35 to 64 Years | 172 (2.4%) | 258 (3.7%) |
| 65 to 74 Years | 60 (3.2%) | 68 (3.4%) |
| 75 Years and over | 55 (5.4%) | 195 (14.3%) |
Disability Class: Cognitive Difficulty
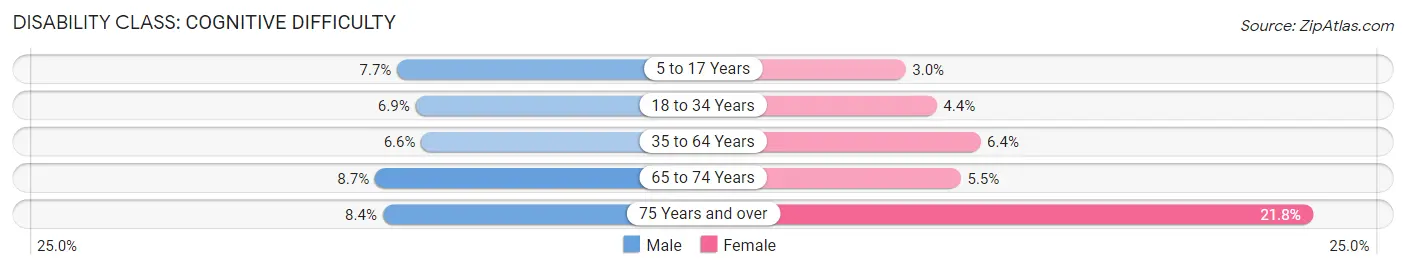
| Age Bracket | Male | Female |
| 5 to 17 Years | 242 (7.7%) | 81 (2.9%) |
| 18 to 34 Years | 231 (6.9%) | 138 (4.4%) |
| 35 to 64 Years | 479 (6.6%) | 444 (6.4%) |
| 65 to 74 Years | 162 (8.7%) | 111 (5.5%) |
| 75 Years and over | 86 (8.4%) | 297 (21.8%) |
Disability Class: Ambulatory Difficulty
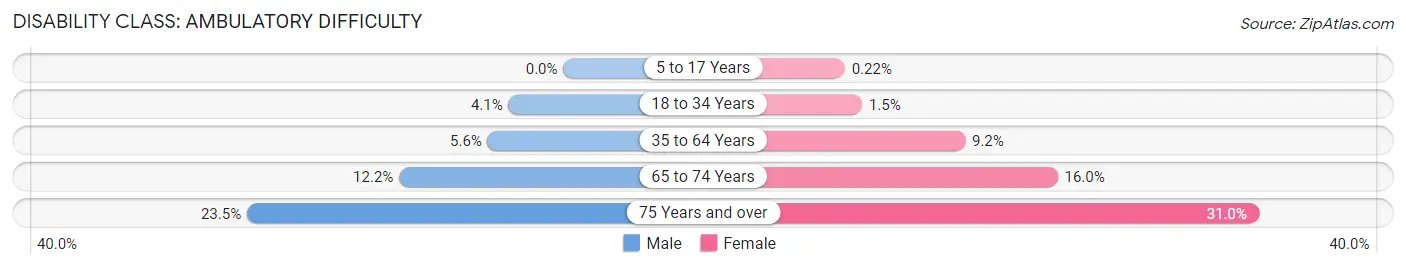
| Age Bracket | Male | Female |
| 5 to 17 Years | 0 (0.0%) | 6 (0.2%) |
| 18 to 34 Years | 137 (4.1%) | 47 (1.5%) |
| 35 to 64 Years | 409 (5.6%) | 633 (9.1%) |
| 65 to 74 Years | 226 (12.2%) | 323 (16.0%) |
| 75 Years and over | 241 (23.5%) | 421 (31.0%) |
Disability Class: Self-Care Difficulty
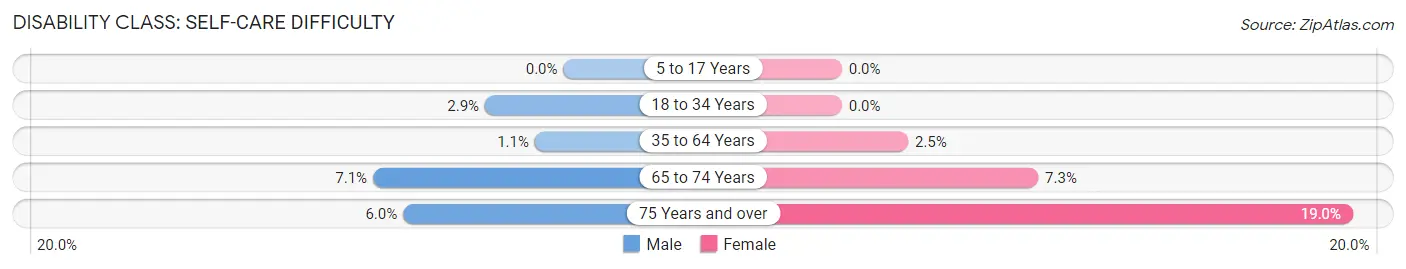
| Age Bracket | Male | Female |
| 5 to 17 Years | 0 (0.0%) | 0 (0.0%) |
| 18 to 34 Years | 98 (2.9%) | 0 (0.0%) |
| 35 to 64 Years | 77 (1.1%) | 170 (2.5%) |
| 65 to 74 Years | 131 (7.1%) | 147 (7.3%) |
| 75 Years and over | 61 (5.9%) | 258 (19.0%) |
Technology Access in Morrow County
Computing Device Access in Morrow County
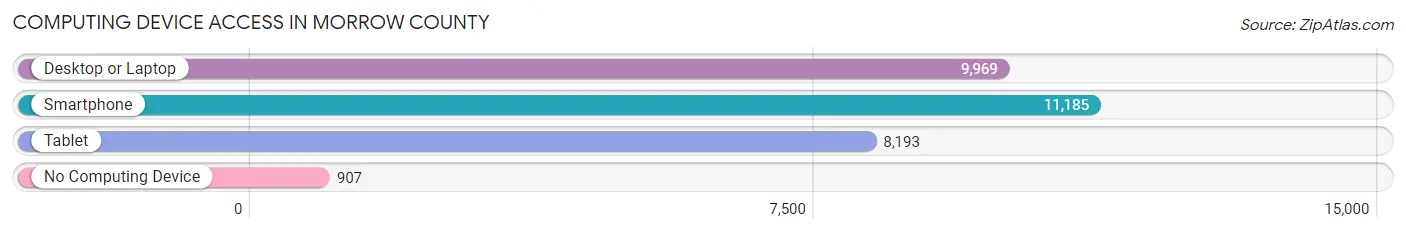
| Device Type | # Households | % Households |
| Desktop or Laptop | 9,969 | 75.4% |
| Smartphone | 11,185 | 84.6% |
| Tablet | 8,193 | 62.0% |
| No Computing Device | 907 | 6.9% |
| Total | 13,222 | 100.0% |
Internet Access in Morrow County
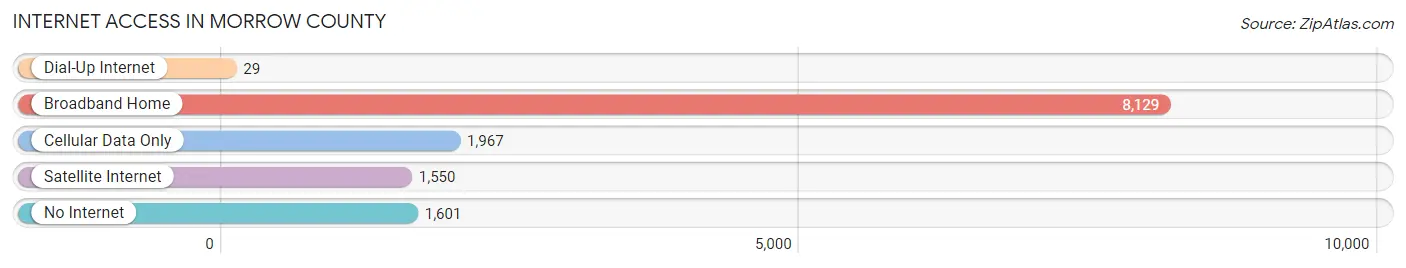
| Internet Type | # Households | % Households |
| Dial-Up Internet | 29 | 0.2% |
| Broadband Home | 8,129 | 61.5% |
| Cellular Data Only | 1,967 | 14.9% |
| Satellite Internet | 1,550 | 11.7% |
| No Internet | 1,601 | 12.1% |
| Total | 13,222 | 100.0% |
Morrow County Summary
Morrow County, Ohio is located in the central part of the state, and is part of the Columbus, Ohio metropolitan area. It is bordered by Delaware, Knox, Marion, Richland, and Union counties. The county seat is Mount Gilead. The county was established in 1848 and named after Jeremiah Morrow, the tenth governor of Ohio.
Geography
Morrow County covers an area of 437 square miles, of which 434 square miles is land and 3 square miles is water. The county is located in the Appalachian Plateau region of Ohio, and is characterized by rolling hills and valleys. The highest point in the county is located in the northern part of the county, at an elevation of 1,093 feet. The county is drained by the Scioto River, which flows through the northern part of the county.
The county is home to several state parks, including the Charles Mill Lake State Park, the Clear Fork State Park, and the Mohican State Park. The county also contains several wildlife areas, including the Cardington Wildlife Area, the Clear Fork Wildlife Area, and the Killdeer Plains Wildlife Area.
Demographics
As of the 2010 census, there were 34,828 people, 13,717 households, and 9,845 families living in the county. The population density was 80 people per square mile. The racial makeup of the county was 95.3% White, 1.3% African American, 0.3% Native American, 0.4% Asian, 0.1% Pacific Islander, 1.2% from other races, and 1.4% from two or more races. Hispanic or Latino of any race were 2.7% of the population.
The median income for a household in the county was $45,845, and the median income for a family was $54,845. The per capita income for the county was $21,845. About 8.7% of families and 11.3% of the population were below the poverty line, including 15.2% of those under age 18 and 8.2% of those age 65 or over.
Economy
Morrow County is home to several major employers, including the Honda of America Manufacturing plant in Marysville, the Whirlpool Corporation in Marion, and the Ohio State University at Marion. The county is also home to several smaller businesses, including manufacturing, retail, and service industries.
Agriculture is an important part of the county's economy, with corn, soybeans, and wheat being the primary crops. Livestock production is also important, with beef cattle, dairy cattle, and hogs being the primary livestock raised in the county.
The county is also home to several tourist attractions, including the Ohio State Reformatory in Mansfield, the Malabar Farm State Park in Lucas, and the Kingwood Center Gardens in Mansfield.
Conclusion
Morrow County, Ohio is a rural county located in the central part of the state. It is home to several major employers, including Honda of America Manufacturing, Whirlpool Corporation, and Ohio State University at Marion. Agriculture is an important part of the county's economy, with corn, soybeans, and wheat being the primary crops. The county is also home to several tourist attractions, including the Ohio State Reformatory, the Malabar Farm State Park, and the Kingwood Center Gardens.
Common Questions
What is the Total Population of Morrow County?
Total Population of Morrow County is 35,049.
What is the Total Male Population of Morrow County?
Total Male Population of Morrow County is 17,821.
What is the Total Female Population of Morrow County?
Total Female Population of Morrow County is 17,228.
What is the Ratio of Males per 100 Females in Morrow County?
There are 103.44 Males per 100 Females in Morrow County.
What is the Ratio of Females per 100 Males in Morrow County?
There are 96.67 Females per 100 Males in Morrow County.
What is the Median Population Age in Morrow County?
Median Population Age in Morrow County is 42.7 Years.
What is the Average Family Size in Morrow County
Average Family Size in Morrow County is 3.0 People.
What is the Average Household Size in Morrow County
Average Household Size in Morrow County is 2.6 People.
What is Per Capita Income in Morrow County?
Per Capita income in Morrow County is $32,987.
What is the Median Family Income in Morrow County?
Median Family Income in Morrow County is $77,618.
What is the Median Household income in Morrow County?
Median Household Income in Morrow County is $70,412.
What is Income or Wage Gap in Morrow County?
Income or Wage Gap in Morrow County is 24.3%.
Women in Morrow County earn 75.7 cents for every dollar earned by a man.
What is Family Income Deficit in Morrow County?
Family Income Deficit in Morrow County is $8,754.
Families that are below poverty line in Morrow County earn $8,754 less on average than the poverty threshold level.
What is Inequality or Gini Index in Morrow County?
Inequality or Gini Index in Morrow County is 0.37.
How Large is the Labor Force in Morrow County?
There are 17,795 People in the Labor Forcein in Morrow County.
What is the Percentage of People in the Labor Force in Morrow County?
62.9% of People are in the Labor Force in Morrow County.
What is the Unemployment Rate in Morrow County?
Unemployment Rate in Morrow County is 2.6%.