Miami County, OH
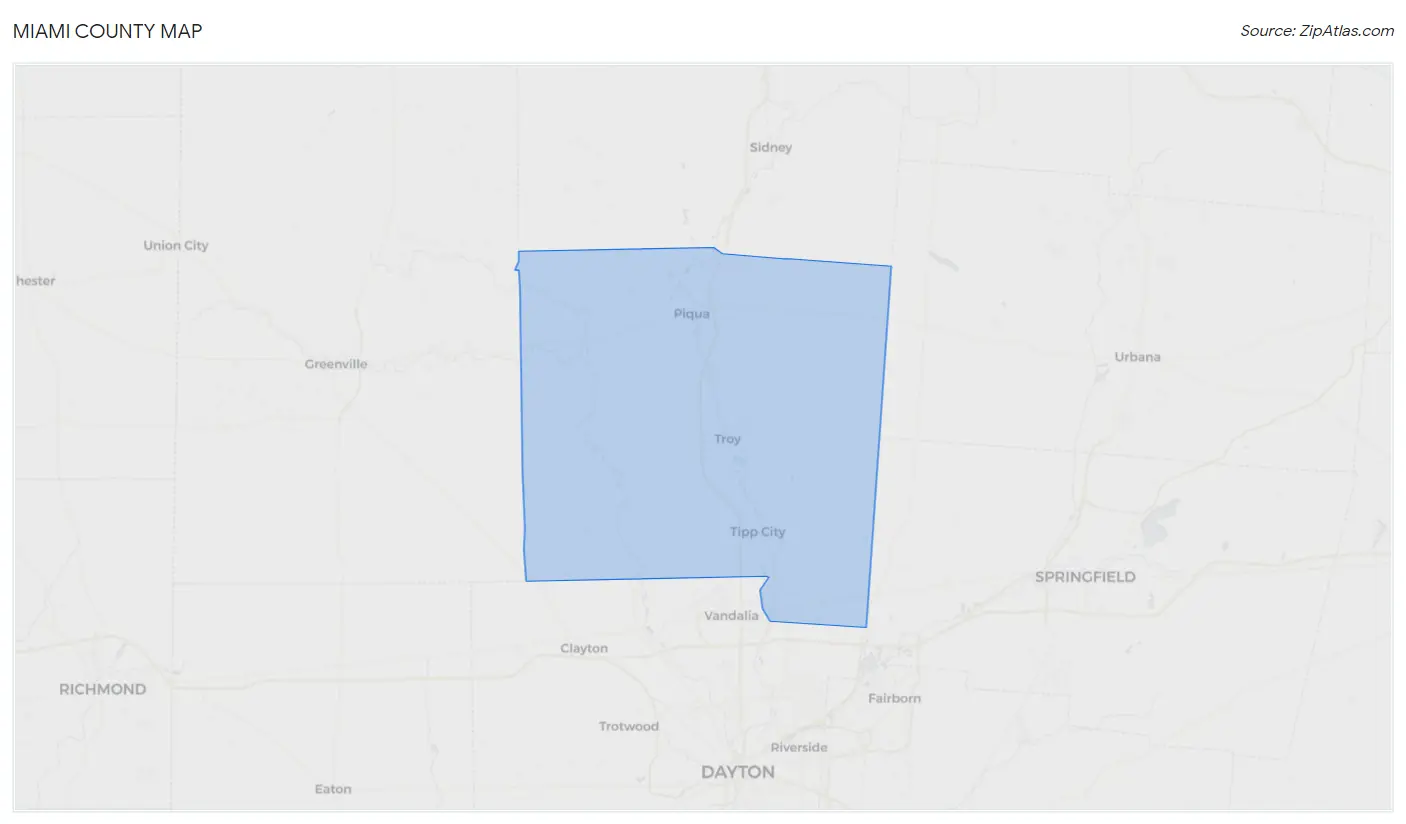
Miami County Map
Miami County Overview
108,818
TOTAL POPULATION
54,232
MALE POPULATION
54,586
FEMALE POPULATION
99.35
MALES / 100 FEMALES
100.65
FEMALES / 100 MALES
41.1
MEDIAN AGE
3.0
AVG FAMILY SIZE
2.4
AVG HOUSEHOLD SIZE
$37,701
PER CAPITA INCOME
$92,126
AVG FAMILY INCOME
$71,440
AVG HOUSEHOLD INCOME
35.5%
WAGE / INCOME GAP [ % ]
64.5¢/ $1
WAGE / INCOME GAP [ $ ]
$13,025
FAMILY INCOME DEFICIT
0.42
INEQUALITY / GINI INDEX
56,634
LABOR FORCE [ PEOPLE ]
65.0%
PERCENT IN LABOR FORCE
3.4%
UNEMPLOYMENT RATE
Miami County Area Codes
Race in Miami County
The most populous races in Miami County are White / Caucasian (99,955 | 91.9%), Two or more Races (4,264 | 3.9%), and Black / African American (2,198 | 2.0%).
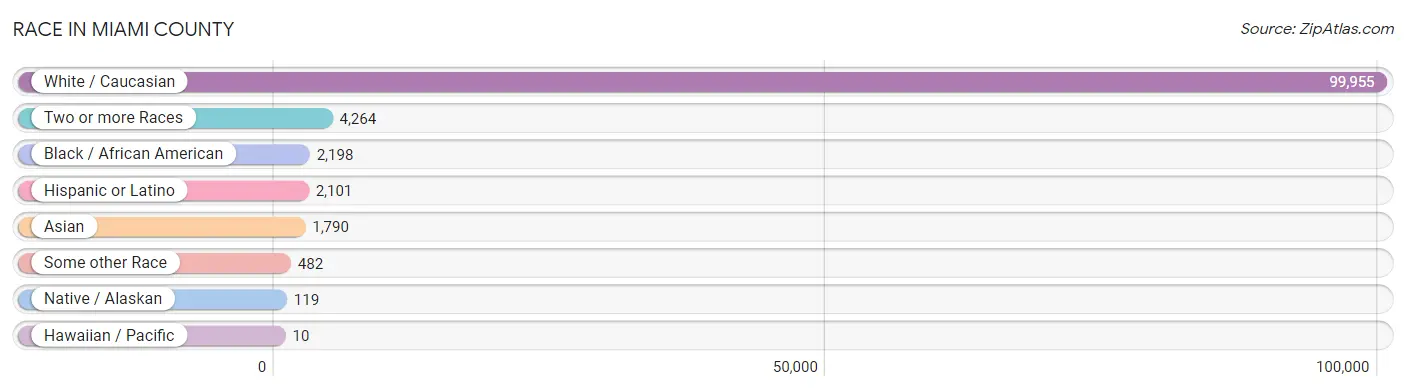
| Race | # Population | % Population |
| Asian | 1,790 | 1.6% |
| Black / African American | 2,198 | 2.0% |
| Hawaiian / Pacific | 10 | 0.0% |
| Hispanic or Latino | 2,101 | 1.9% |
| Native / Alaskan | 119 | 0.1% |
| White / Caucasian | 99,955 | 91.9% |
| Two or more Races | 4,264 | 3.9% |
| Some other Race | 482 | 0.4% |
| Total | 108,818 | 100.0% |
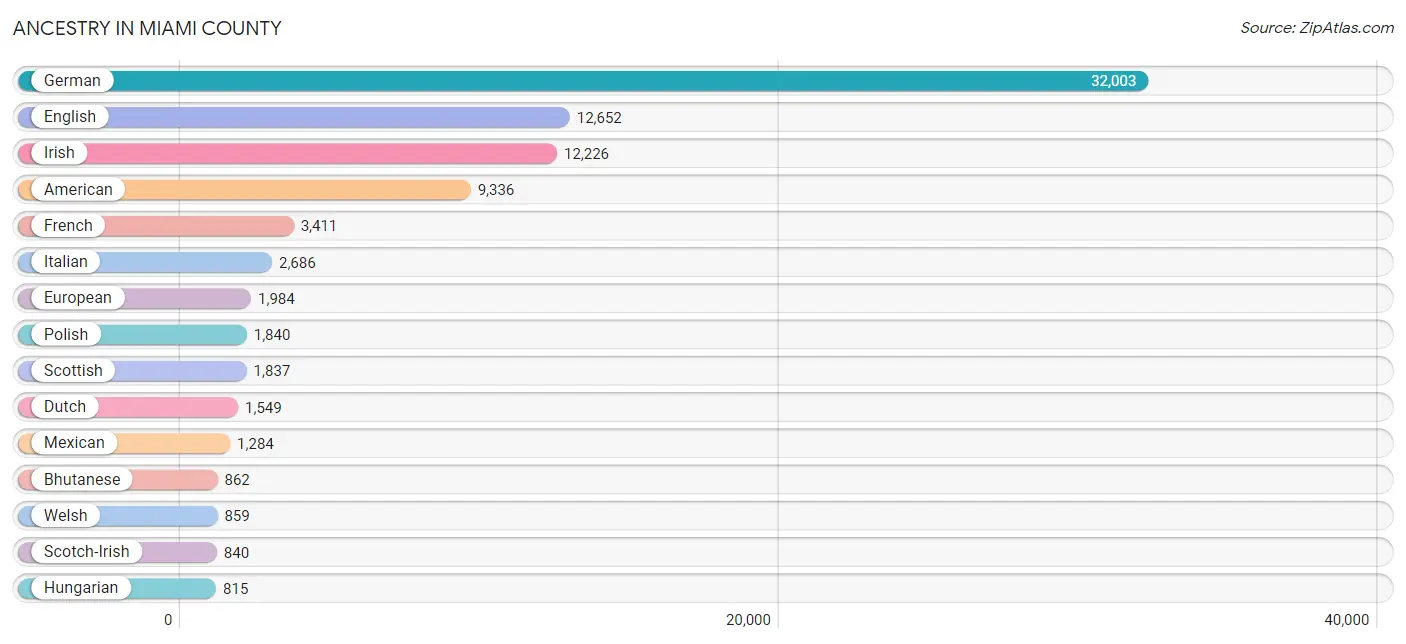
Ancestry in Miami County
The most populous ancestries reported in Miami County are German (32,003 | 29.4%), English (12,652 | 11.6%), Irish (12,226 | 11.2%), American (9,336 | 8.6%), and French (3,411 | 3.1%), together accounting for 64.0% of all Miami County residents.
| Ancestry | # Population | % Population |
| African | 318 | 0.3% |
| Albanian | 23 | 0.0% |
| American | 9,336 | 8.6% |
| Apache | 29 | 0.0% |
| Arab | 149 | 0.1% |
| Argentinean | 14 | 0.0% |
| Australian | 10 | 0.0% |
| Austrian | 73 | 0.1% |
| Belgian | 21 | 0.0% |
| Bhutanese | 862 | 0.8% |
| Blackfeet | 81 | 0.1% |
| Brazilian | 67 | 0.1% |
| British | 487 | 0.4% |
| Burmese | 80 | 0.1% |
| Canadian | 48 | 0.0% |
| Celtic | 12 | 0.0% |
| Central American | 146 | 0.1% |
| Central American Indian | 4 | 0.0% |
| Cherokee | 228 | 0.2% |
| Cheyenne | 2 | 0.0% |
| Chippewa | 1 | 0.0% |
| Choctaw | 8 | 0.0% |
| Colombian | 42 | 0.0% |
| Cree | 10 | 0.0% |
| Croatian | 58 | 0.1% |
| Cuban | 55 | 0.1% |
| Czech | 167 | 0.2% |
| Czechoslovakian | 49 | 0.1% |
| Danish | 52 | 0.1% |
| Dominican | 154 | 0.1% |
| Dutch | 1,549 | 1.4% |
| Eastern European | 101 | 0.1% |
| Ecuadorian | 100 | 0.1% |
| English | 12,652 | 11.6% |
| Ethiopian | 36 | 0.0% |
| European | 1,984 | 1.8% |
| Fijian | 47 | 0.0% |
| Finnish | 70 | 0.1% |
| French | 3,411 | 3.1% |
| French Canadian | 211 | 0.2% |
| German | 32,003 | 29.4% |
| Greek | 134 | 0.1% |
| Guamanian / Chamorro | 30 | 0.0% |
| Guatemalan | 2 | 0.0% |
| Hmong | 2 | 0.0% |
| Honduran | 97 | 0.1% |
| Houma | 3 | 0.0% |
| Hungarian | 815 | 0.7% |
| Indian (Asian) | 157 | 0.1% |
| Iranian | 33 | 0.0% |
| Irish | 12,226 | 11.2% |
| Italian | 2,686 | 2.5% |
| Jamaican | 35 | 0.0% |
| Japanese | 3 | 0.0% |
| Korean | 649 | 0.6% |
| Lebanese | 108 | 0.1% |
| Lithuanian | 220 | 0.2% |
| Lumbee | 7 | 0.0% |
| Macedonian | 40 | 0.0% |
| Malaysian | 14 | 0.0% |
| Mexican | 1,284 | 1.2% |
| Mexican American Indian | 4 | 0.0% |
| Native Hawaiian | 36 | 0.0% |
| Nigerian | 75 | 0.1% |
| Northern European | 96 | 0.1% |
| Norwegian | 295 | 0.3% |
| Ottawa | 21 | 0.0% |
| Pakistani | 70 | 0.1% |
| Palestinian | 24 | 0.0% |
| Pennsylvania German | 82 | 0.1% |
| Peruvian | 13 | 0.0% |
| Polish | 1,840 | 1.7% |
| Portuguese | 265 | 0.2% |
| Puerto Rican | 242 | 0.2% |
| Romanian | 25 | 0.0% |
| Russian | 471 | 0.4% |
| Salvadoran | 47 | 0.0% |
| Scandinavian | 390 | 0.4% |
| Scotch-Irish | 840 | 0.8% |
| Scottish | 1,837 | 1.7% |
| Serbian | 14 | 0.0% |
| Slavic | 5 | 0.0% |
| Slovak | 149 | 0.1% |
| Slovene | 12 | 0.0% |
| South American | 174 | 0.2% |
| Spaniard | 22 | 0.0% |
| Subsaharan African | 550 | 0.5% |
| Swedish | 312 | 0.3% |
| Swiss | 645 | 0.6% |
| Syrian | 17 | 0.0% |
| Thai | 510 | 0.5% |
| Turkish | 262 | 0.2% |
| Ukrainian | 117 | 0.1% |
| Venezuelan | 5 | 0.0% |
| Welsh | 859 | 0.8% |
| Yugoslavian | 24 | 0.0% | View All 96 Rows |
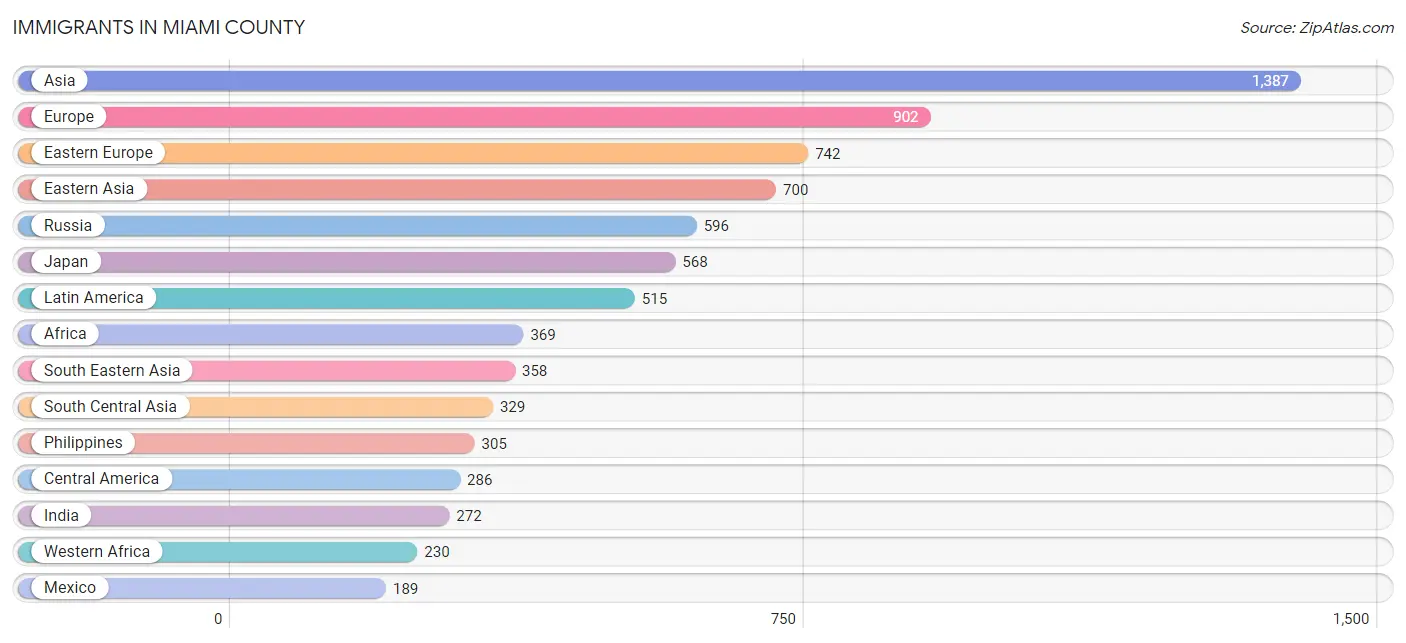
Immigrants in Miami County
The most numerous immigrant groups reported in Miami County came from Asia (1,387 | 1.3%), Europe (902 | 0.8%), Eastern Europe (742 | 0.7%), Eastern Asia (700 | 0.6%), and Russia (596 | 0.5%), together accounting for 4.0% of all Miami County residents.
| Immigration Origin | # Population | % Population |
| Africa | 369 | 0.3% |
| Asia | 1,387 | 1.3% |
| Brazil | 24 | 0.0% |
| Cameroon | 7 | 0.0% |
| Canada | 90 | 0.1% |
| Caribbean | 82 | 0.1% |
| Central America | 286 | 0.3% |
| China | 95 | 0.1% |
| Colombia | 101 | 0.1% |
| Dominican Republic | 37 | 0.0% |
| Eastern Africa | 115 | 0.1% |
| Eastern Asia | 700 | 0.6% |
| Eastern Europe | 742 | 0.7% |
| England | 23 | 0.0% |
| Ethiopia | 36 | 0.0% |
| Europe | 902 | 0.8% |
| France | 5 | 0.0% |
| Germany | 24 | 0.0% |
| Honduras | 97 | 0.1% |
| Hong Kong | 30 | 0.0% |
| India | 272 | 0.3% |
| Jamaica | 45 | 0.0% |
| Japan | 568 | 0.5% |
| Kenya | 24 | 0.0% |
| Korea | 37 | 0.0% |
| Laos | 14 | 0.0% |
| Latin America | 515 | 0.5% |
| Latvia | 76 | 0.1% |
| Mexico | 189 | 0.2% |
| Middle Africa | 7 | 0.0% |
| Nigeria | 146 | 0.1% |
| North Macedonia | 13 | 0.0% |
| Northern Europe | 79 | 0.1% |
| Oceania | 21 | 0.0% |
| Peru | 17 | 0.0% |
| Philippines | 305 | 0.3% |
| Poland | 33 | 0.0% |
| Portugal | 52 | 0.1% |
| Russia | 596 | 0.5% |
| Serbia | 24 | 0.0% |
| South Africa | 17 | 0.0% |
| South America | 147 | 0.1% |
| South Central Asia | 329 | 0.3% |
| South Eastern Asia | 358 | 0.3% |
| Southern Europe | 52 | 0.1% |
| Thailand | 39 | 0.0% |
| Uzbekistan | 57 | 0.1% |
| Venezuela | 5 | 0.0% |
| Western Africa | 230 | 0.2% |
| Western Europe | 29 | 0.0% | View All 50 Rows |
Sex and Age in Miami County
Sex and Age in Miami County
The most populous age groups in Miami County are 55 to 59 Years (3,972 | 7.3%) for men and 10 to 14 Years (4,008 | 7.3%) for women.
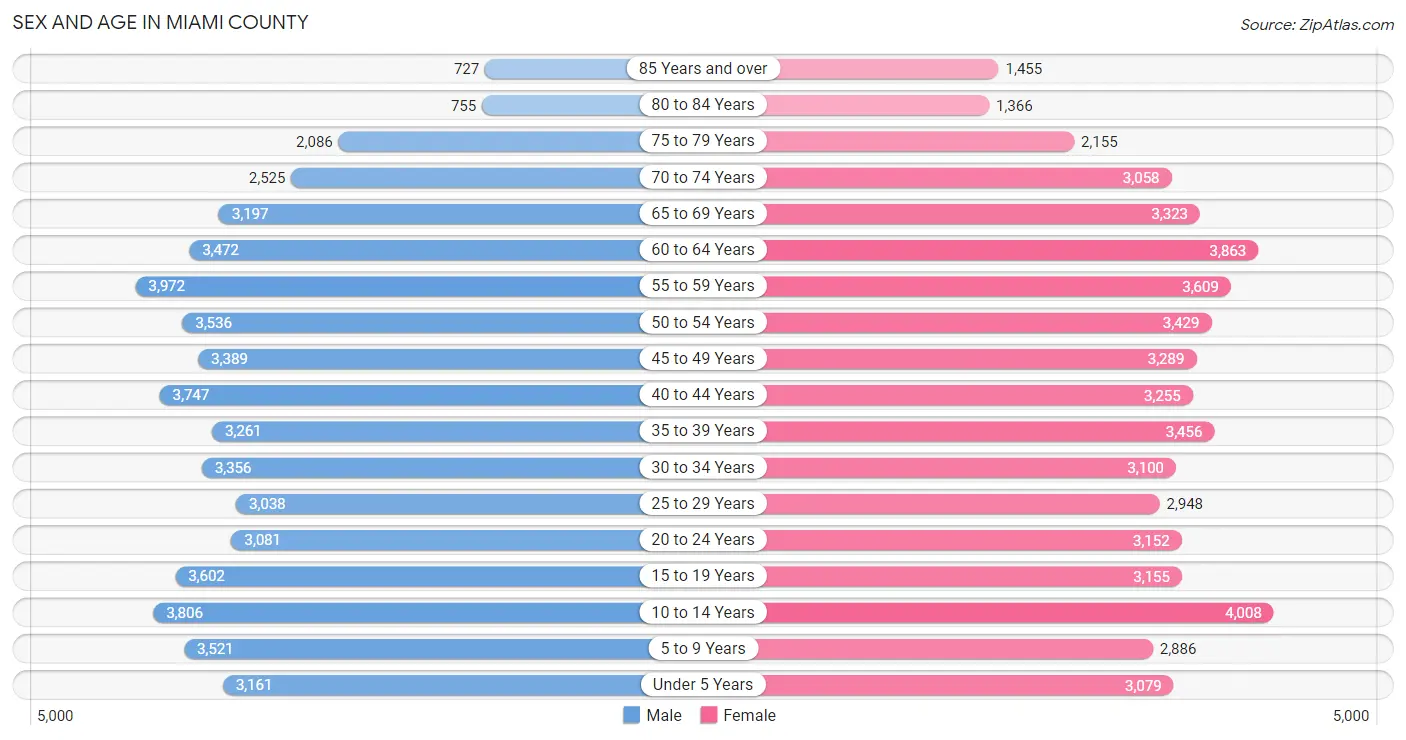
| Age Bracket | Male | Female |
| Under 5 Years | 3,161 (5.8%) | 3,079 (5.6%) |
| 5 to 9 Years | 3,521 (6.5%) | 2,886 (5.3%) |
| 10 to 14 Years | 3,806 (7.0%) | 4,008 (7.3%) |
| 15 to 19 Years | 3,602 (6.6%) | 3,155 (5.8%) |
| 20 to 24 Years | 3,081 (5.7%) | 3,152 (5.8%) |
| 25 to 29 Years | 3,038 (5.6%) | 2,948 (5.4%) |
| 30 to 34 Years | 3,356 (6.2%) | 3,100 (5.7%) |
| 35 to 39 Years | 3,261 (6.0%) | 3,456 (6.3%) |
| 40 to 44 Years | 3,747 (6.9%) | 3,255 (6.0%) |
| 45 to 49 Years | 3,389 (6.2%) | 3,289 (6.0%) |
| 50 to 54 Years | 3,536 (6.5%) | 3,429 (6.3%) |
| 55 to 59 Years | 3,972 (7.3%) | 3,609 (6.6%) |
| 60 to 64 Years | 3,472 (6.4%) | 3,863 (7.1%) |
| 65 to 69 Years | 3,197 (5.9%) | 3,323 (6.1%) |
| 70 to 74 Years | 2,525 (4.7%) | 3,058 (5.6%) |
| 75 to 79 Years | 2,086 (3.8%) | 2,155 (4.0%) |
| 80 to 84 Years | 755 (1.4%) | 1,366 (2.5%) |
| 85 Years and over | 727 (1.3%) | 1,455 (2.7%) |
| Total | 54,232 (100.0%) | 54,586 (100.0%) |
Families and Households in Miami County
Median Family Size in Miami County
The median family size in Miami County is 3.00 persons per family, with married-couple families (23,702 | 80.1%) accounting for the largest median family size of 3.06 persons per family. On the other hand, single male/father families (1,799 | 6.1%) represent the smallest median family size with 2.57 persons per family.
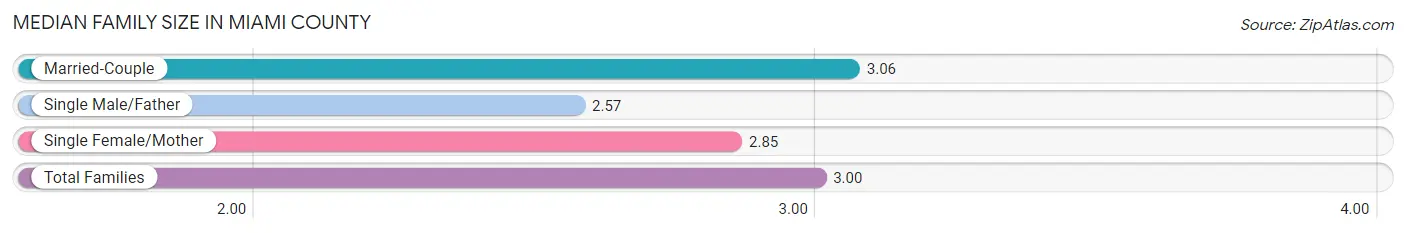
| Family Type | # Families | Family Size |
| Married-Couple | 23,702 (80.1%) | 3.06 |
| Single Male/Father | 1,799 (6.1%) | 2.57 |
| Single Female/Mother | 4,088 (13.8%) | 2.85 |
| Total Families | 29,589 (100.0%) | 3.00 |
Median Household Size in Miami County
The median household size in Miami County is 2.44 persons per household, with single female/mother households (4,088 | 9.3%) accounting for the largest median household size of 3.13 persons per household. non-family households (14,563 | 33.0%) represent the smallest median household size with 1.17 persons per household.
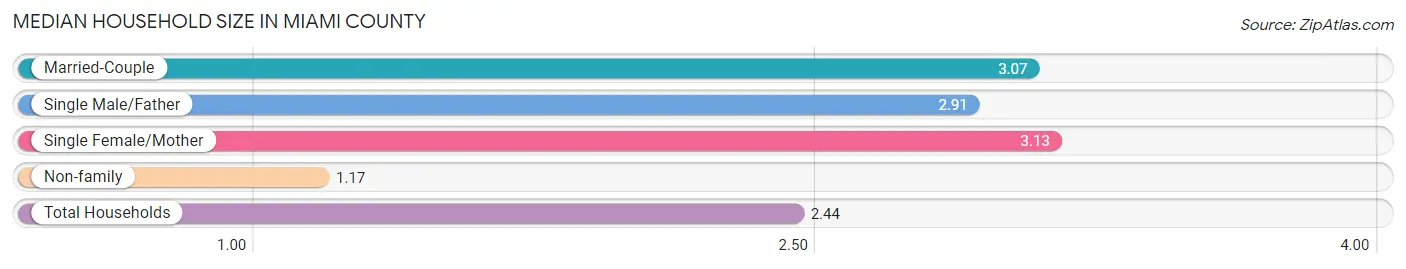
| Household Type | # Households | Household Size |
| Married-Couple | 23,702 (53.7%) | 3.07 |
| Single Male/Father | 1,799 (4.1%) | 2.91 |
| Single Female/Mother | 4,088 (9.3%) | 3.13 |
| Non-family | 14,563 (33.0%) | 1.17 |
| Total Households | 44,152 (100.0%) | 2.44 |
Household Size by Marriage Status in Miami County
Out of a total of 44,152 households in Miami County, 29,589 (67.0%) are family households, while 14,563 (33.0%) are nonfamily households. The most numerous type of family households are 2-person households, comprising 14,414, and the most common type of nonfamily households are 1-person households, comprising 12,403.
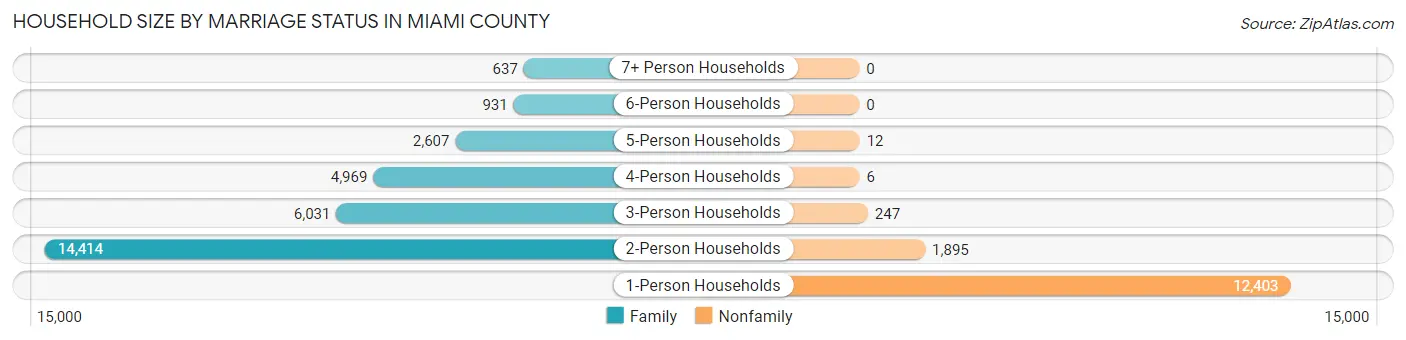
| Household Size | Family Households | Nonfamily Households |
| 1-Person Households | - | 12,403 (28.1%) |
| 2-Person Households | 14,414 (32.7%) | 1,895 (4.3%) |
| 3-Person Households | 6,031 (13.7%) | 247 (0.6%) |
| 4-Person Households | 4,969 (11.3%) | 6 (0.0%) |
| 5-Person Households | 2,607 (5.9%) | 12 (0.0%) |
| 6-Person Households | 931 (2.1%) | 0 (0.0%) |
| 7+ Person Households | 637 (1.4%) | 0 (0.0%) |
| Total | 29,589 (67.0%) | 14,563 (33.0%) |
Female Fertility in Miami County
Fertility by Age in Miami County
Average fertility rate in Miami County is 67.0 births per 1,000 women. Women in the age bracket of 20 to 34 years have the highest fertility rate with 124.0 births per 1,000 women. Women in the age bracket of 20 to 34 years acount for 72.7% of all women with births.
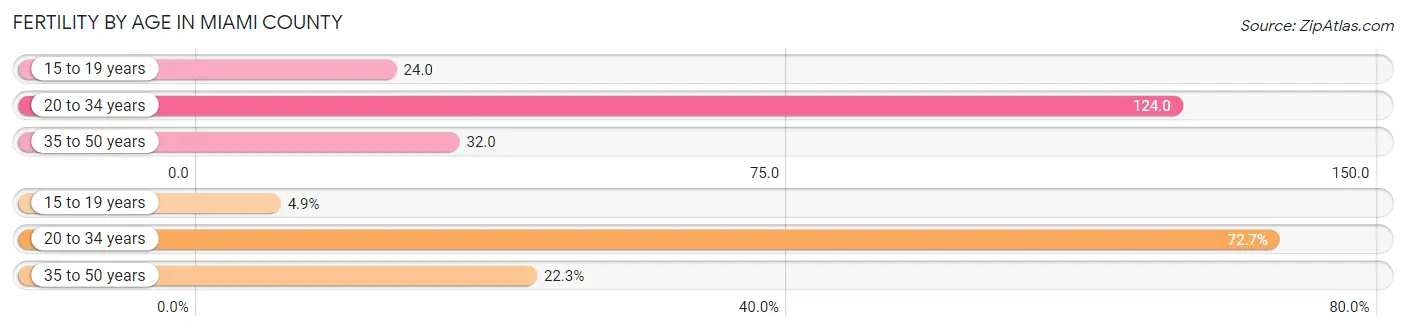
| Age Bracket | Women with Births | Births / 1,000 Women |
| 15 to 19 years | 77 (4.9%) | 24.0 |
| 20 to 34 years | 1,137 (72.7%) | 124.0 |
| 35 to 50 years | 349 (22.3%) | 32.0 |
| Total | 1,563 (100.0%) | 67.0 |
Fertility by Age by Marriage Status in Miami County
67.1% of women with births (1,563) in Miami County are married. The highest percentage of unmarried women with births falls into 15 to 19 years age bracket with 100.0% of them unmarried at the time of birth, while the lowest percentage of unmarried women with births belong to 35 to 50 years age bracket with 17.8% of them unmarried.
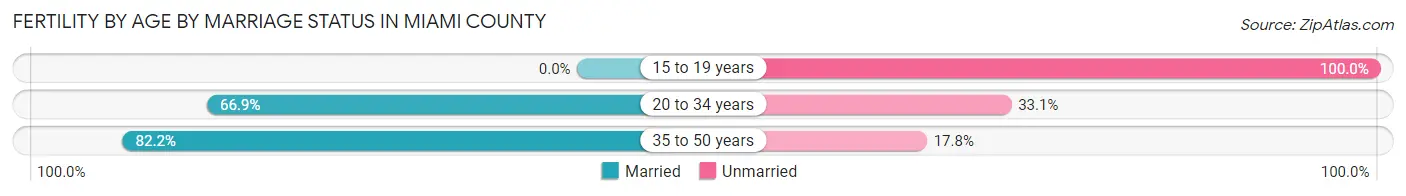
| Age Bracket | Married | Unmarried |
| 15 to 19 years | 0 (0.0%) | 77 (100.0%) |
| 20 to 34 years | 761 (66.9%) | 376 (33.1%) |
| 35 to 50 years | 287 (82.2%) | 62 (17.8%) |
| Total | 1,049 (67.1%) | 514 (32.9%) |
Fertility by Education in Miami County
Average fertility rate in Miami County is 67.0 births per 1,000 women. Women with the education attainment of high school diploma have the highest fertility rate of 96.0 births per 1,000 women, while women with the education attainment of less than high school have the lowest fertility at 41.0 births per 1,000 women. Women with the education attainment of high school diploma represent 35.3% of all women with births.
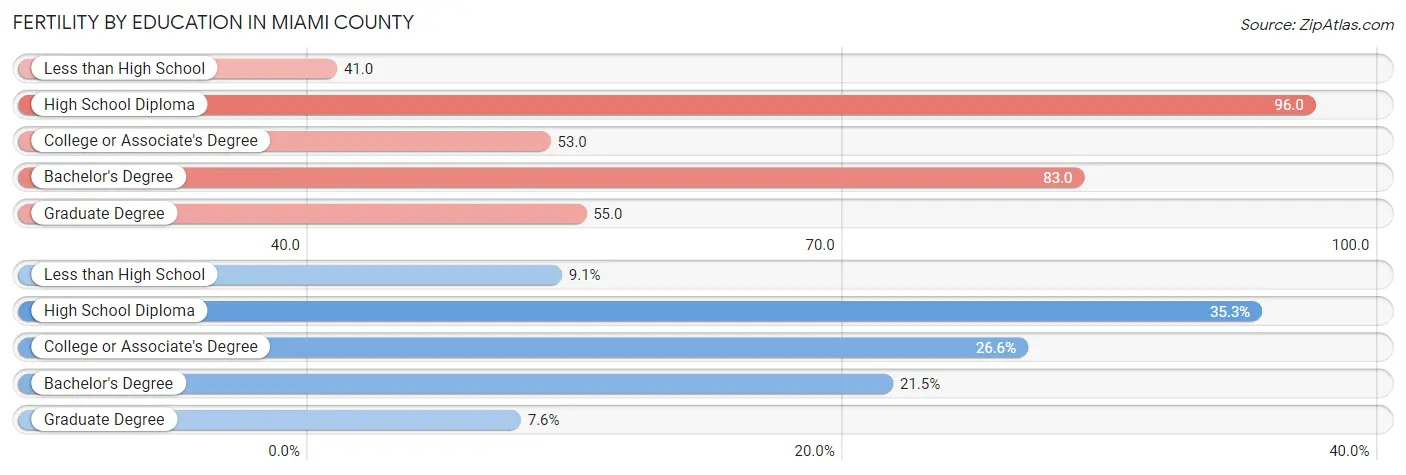
| Educational Attainment | Women with Births | Births / 1,000 Women |
| Less than High School | 142 (9.1%) | 41.0 |
| High School Diploma | 552 (35.3%) | 96.0 |
| College or Associate's Degree | 415 (26.6%) | 53.0 |
| Bachelor's Degree | 336 (21.5%) | 83.0 |
| Graduate Degree | 118 (7.5%) | 55.0 |
| Total | 1,563 (100.0%) | 67.0 |
Fertility by Education by Marriage Status in Miami County
32.9% of women with births in Miami County are unmarried. Women with the educational attainment of graduate degree are most likely to be married with 89.0% of them married at childbirth, while women with the educational attainment of less than high school are least likely to be married with 61.3% of them unmarried at childbirth.
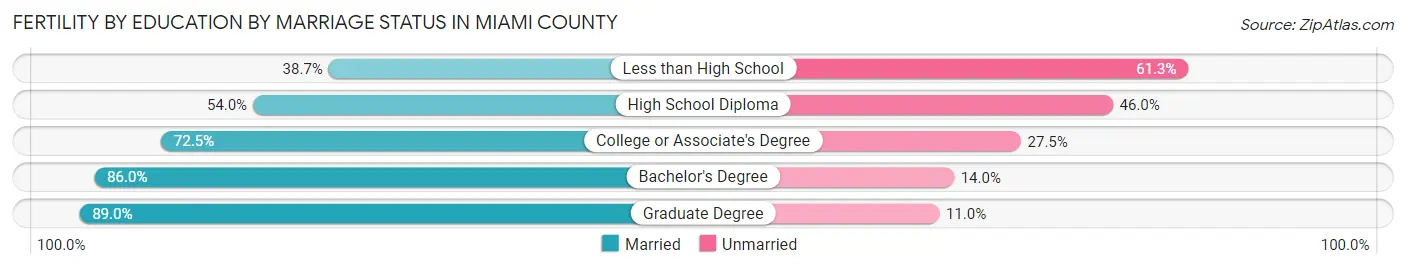
| Educational Attainment | Married | Unmarried |
| Less than High School | 55 (38.7%) | 87 (61.3%) |
| High School Diploma | 298 (54.0%) | 254 (46.0%) |
| College or Associate's Degree | 301 (72.5%) | 114 (27.5%) |
| Bachelor's Degree | 289 (86.0%) | 47 (14.0%) |
| Graduate Degree | 105 (89.0%) | 13 (11.0%) |
| Total | 1,049 (67.1%) | 514 (32.9%) |
Income in Miami County
Income Overview in Miami County
Per Capita Income in Miami County is $37,701, while median incomes of families and households are $92,126 and $71,440 respectively.
| Characteristic | Number | Measure |
| Per Capita Income | 108,818 | $37,701 |
| Median Family Income | 29,589 | $92,126 |
| Mean Family Income | 29,589 | $108,449 |
| Median Household Income | 44,152 | $71,440 |
| Mean Household Income | 44,152 | $91,306 |
| Income Deficit | 29,589 | $13,025 |
| Wage / Income Gap (%) | 108,818 | 35.48% |
| Wage / Income Gap ($) | 108,818 | 64.52¢ per $1 |
| Gini / Inequality Index | 108,818 | 0.42 |
Earnings by Sex in Miami County
Average Earnings in Miami County are $42,327, $52,057 for men and $33,586 for women, a difference of 35.5%.
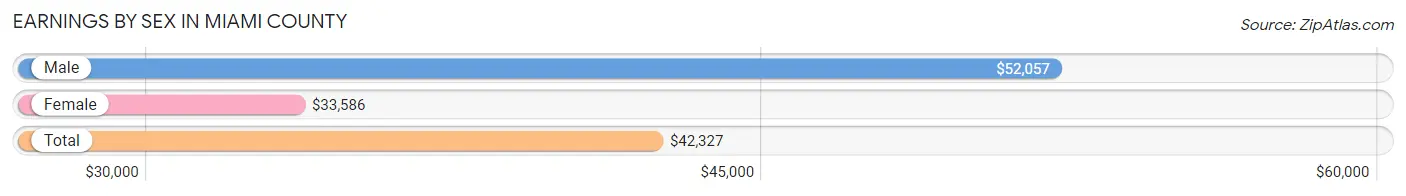
| Sex | Number | Average Earnings |
| Male | 31,974 (54.0%) | $52,057 |
| Female | 27,266 (46.0%) | $33,586 |
| Total | 59,240 (100.0%) | $42,327 |
Earnings by Sex by Income Bracket in Miami County
The most common earnings brackets in Miami County are $100,000+ for men (5,346 | 16.7%) and $75,000 to $99,999 for women (2,459 | 9.0%).
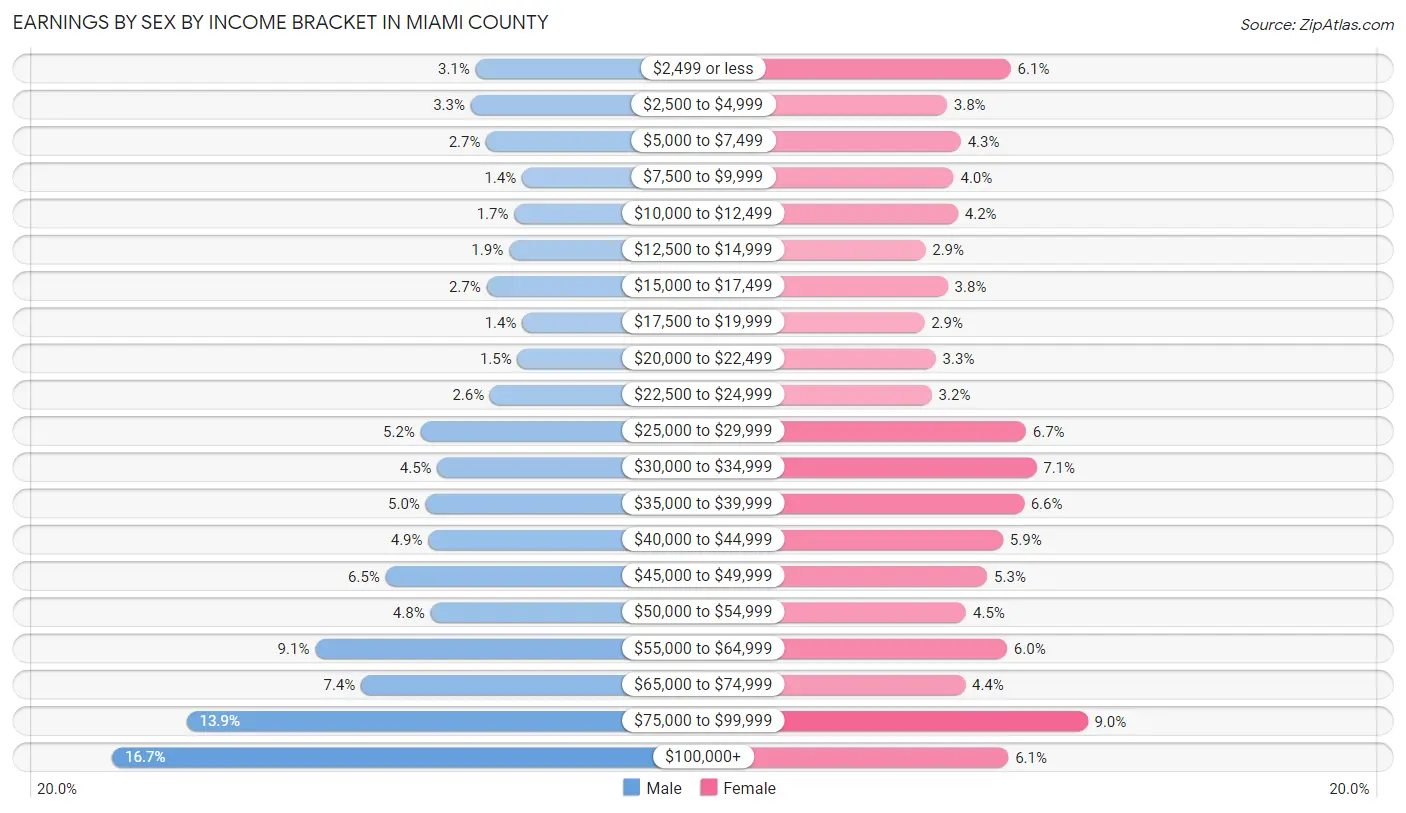
| Income | Male | Female |
| $2,499 or less | 991 (3.1%) | 1,675 (6.1%) |
| $2,500 to $4,999 | 1,049 (3.3%) | 1,023 (3.7%) |
| $5,000 to $7,499 | 862 (2.7%) | 1,165 (4.3%) |
| $7,500 to $9,999 | 435 (1.4%) | 1,092 (4.0%) |
| $10,000 to $12,499 | 526 (1.7%) | 1,134 (4.2%) |
| $12,500 to $14,999 | 591 (1.8%) | 802 (2.9%) |
| $15,000 to $17,499 | 861 (2.7%) | 1,031 (3.8%) |
| $17,500 to $19,999 | 431 (1.3%) | 791 (2.9%) |
| $20,000 to $22,499 | 488 (1.5%) | 909 (3.3%) |
| $22,500 to $24,999 | 819 (2.6%) | 868 (3.2%) |
| $25,000 to $29,999 | 1,649 (5.2%) | 1,829 (6.7%) |
| $30,000 to $34,999 | 1,448 (4.5%) | 1,936 (7.1%) |
| $35,000 to $39,999 | 1,589 (5.0%) | 1,808 (6.6%) |
| $40,000 to $44,999 | 1,557 (4.9%) | 1,596 (5.9%) |
| $45,000 to $49,999 | 2,069 (6.5%) | 1,435 (5.3%) |
| $50,000 to $54,999 | 1,532 (4.8%) | 1,220 (4.5%) |
| $55,000 to $64,999 | 2,913 (9.1%) | 1,635 (6.0%) |
| $65,000 to $74,999 | 2,363 (7.4%) | 1,209 (4.4%) |
| $75,000 to $99,999 | 4,455 (13.9%) | 2,459 (9.0%) |
| $100,000+ | 5,346 (16.7%) | 1,649 (6.0%) |
| Total | 31,974 (100.0%) | 27,266 (100.0%) |
Earnings by Sex by Educational Attainment in Miami County
Average earnings in Miami County are $58,211 for men and $38,194 for women, a difference of 34.4%. Men with an educational attainment of graduate degree enjoy the highest average annual earnings of $100,069, while those with high school diploma education earn the least with $45,346. Women with an educational attainment of graduate degree earn the most with the average annual earnings of $68,285, while those with less than high school education have the smallest earnings of $15,984.
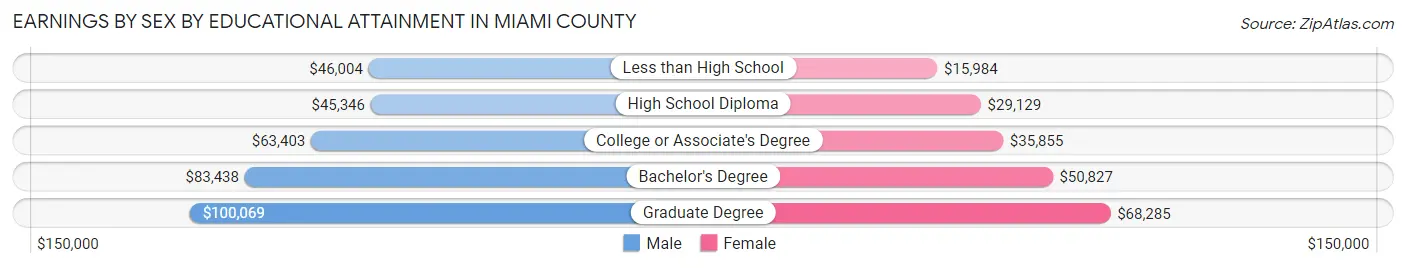
| Educational Attainment | Male Income | Female Income |
| Less than High School | $46,004 | $15,984 |
| High School Diploma | $45,346 | $29,129 |
| College or Associate's Degree | $63,403 | $35,855 |
| Bachelor's Degree | $83,438 | $50,827 |
| Graduate Degree | $100,069 | $68,285 |
| Total | $58,211 | $38,194 |
Family Income in Miami County
Family Income Brackets in Miami County
According to the Miami County family income data, there are 7,427 families falling into the $100,000 to $149,999 income range, which is the most common income bracket and makes up 25.1% of all families. Conversely, the $10,000 to $14,999 income bracket is the least frequent group with only 325 families (1.1%) belonging to this category.
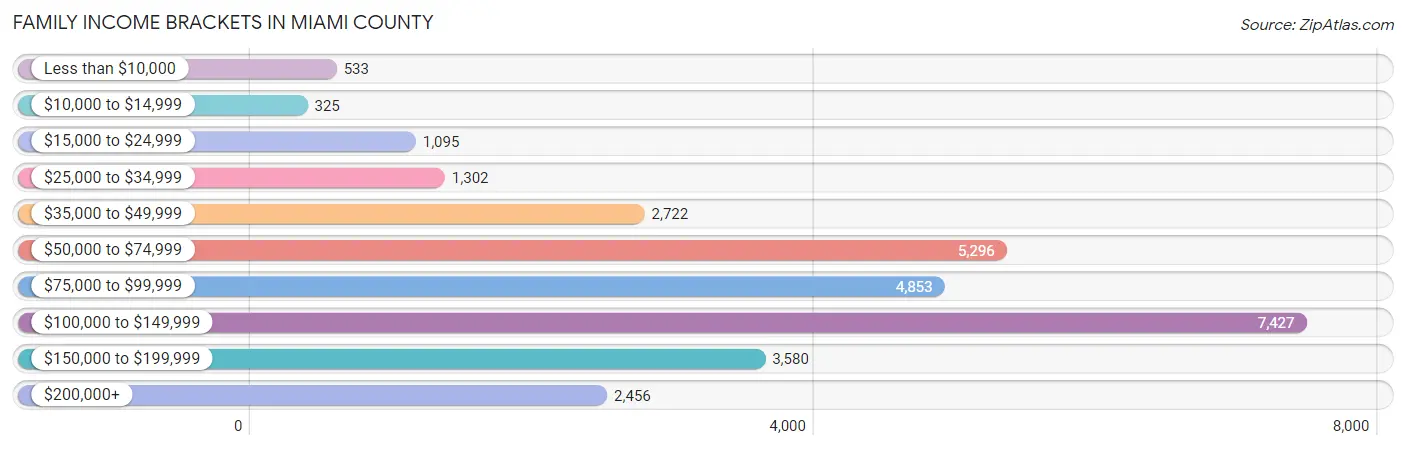
| Income Bracket | # Families | % Families |
| Less than $10,000 | 533 | 1.8% |
| $10,000 to $14,999 | 325 | 1.1% |
| $15,000 to $24,999 | 1,095 | 3.7% |
| $25,000 to $34,999 | 1,302 | 4.4% |
| $35,000 to $49,999 | 2,722 | 9.2% |
| $50,000 to $74,999 | 5,296 | 17.9% |
| $75,000 to $99,999 | 4,853 | 16.4% |
| $100,000 to $149,999 | 7,427 | 25.1% |
| $150,000 to $199,999 | 3,580 | 12.1% |
| $200,000+ | 2,456 | 8.3% |
Family Income by Famaliy Size in Miami County
4-person families (4,881 | 16.5%) account for the highest median family income in Miami County with $116,816 per family, while 2-person families (15,184 | 51.3%) have the highest median income of $39,823 per family member.
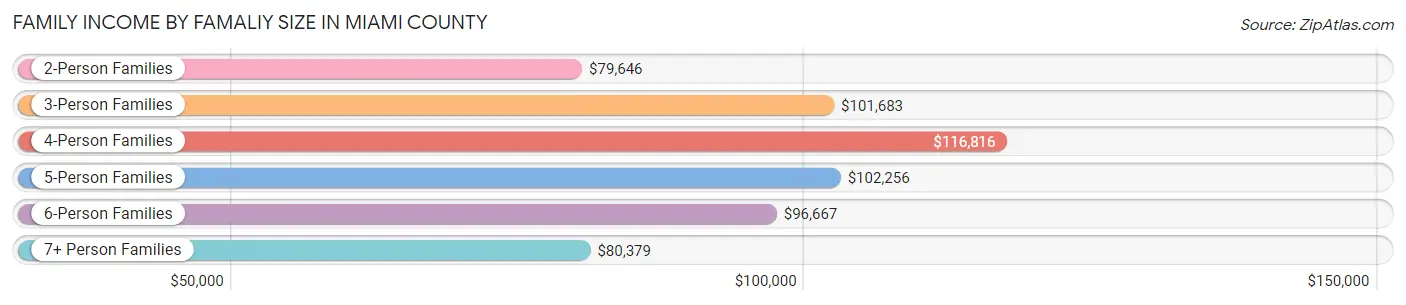
| Income Bracket | # Families | Median Income |
| 2-Person Families | 15,184 (51.3%) | $79,646 |
| 3-Person Families | 5,713 (19.3%) | $101,683 |
| 4-Person Families | 4,881 (16.5%) | $116,816 |
| 5-Person Families | 2,394 (8.1%) | $102,256 |
| 6-Person Families | 880 (3.0%) | $96,667 |
| 7+ Person Families | 537 (1.8%) | $80,379 |
| Total | 29,589 (100.0%) | $92,126 |
Family Income by Number of Earners in Miami County
The median family income in Miami County is $92,126, with families comprising 3+ earners (3,310) having the highest median family income of $143,546, while families with no earners (4,545) have the lowest median family income of $53,892, accounting for 11.2% and 15.4% of families, respectively.
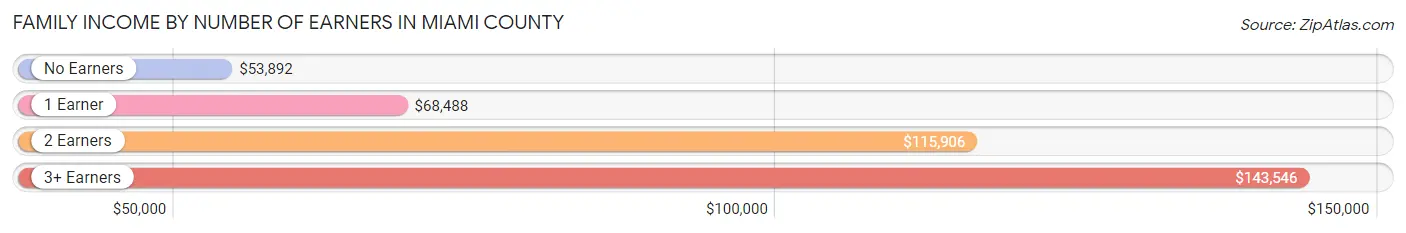
| Number of Earners | # Families | Median Income |
| No Earners | 4,545 (15.4%) | $53,892 |
| 1 Earner | 8,631 (29.2%) | $68,488 |
| 2 Earners | 13,103 (44.3%) | $115,906 |
| 3+ Earners | 3,310 (11.2%) | $143,546 |
| Total | 29,589 (100.0%) | $92,126 |
Household Income in Miami County
Household Income Brackets in Miami County
With 8,565 households falling in the category, the $100,000 to $149,999 income range is the most frequent in Miami County, accounting for 19.4% of all households. In contrast, only 1,369 households (3.1%) fall into the less than $10,000 income bracket, making it the least populous group.
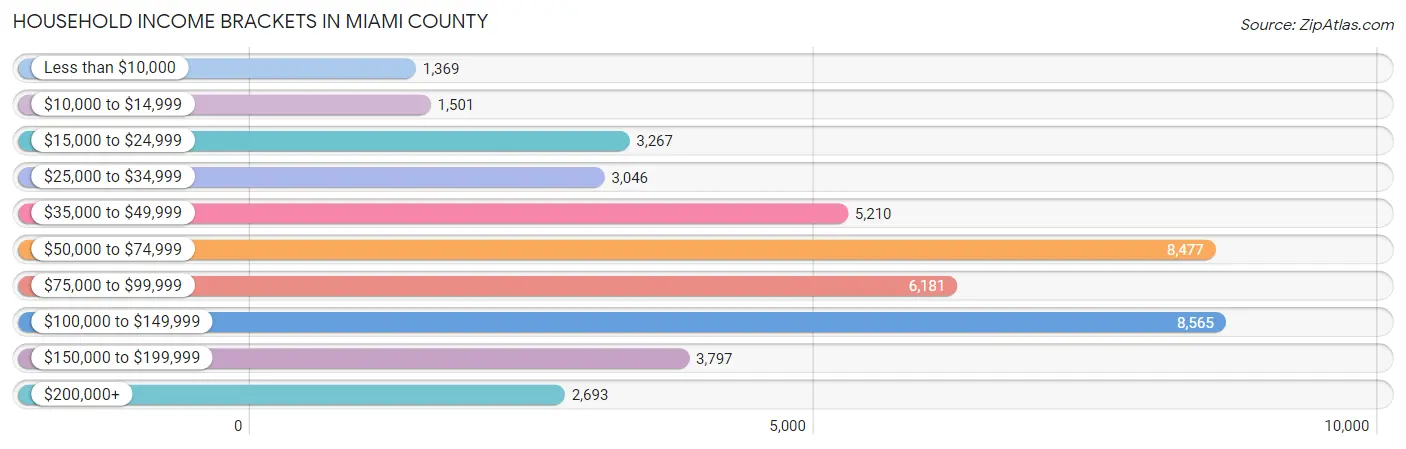
| Income Bracket | # Households | % Households |
| Less than $10,000 | 1,369 | 3.1% |
| $10,000 to $14,999 | 1,501 | 3.4% |
| $15,000 to $24,999 | 3,267 | 7.4% |
| $25,000 to $34,999 | 3,046 | 6.9% |
| $35,000 to $49,999 | 5,210 | 11.8% |
| $50,000 to $74,999 | 8,477 | 19.2% |
| $75,000 to $99,999 | 6,181 | 14.0% |
| $100,000 to $149,999 | 8,565 | 19.4% |
| $150,000 to $199,999 | 3,797 | 8.6% |
| $200,000+ | 2,693 | 6.1% |
Household Income by Householder Age in Miami County
The median household income in Miami County is $71,440, with the highest median household income of $86,975 found in the 25 to 44 years age bracket for the primary householder. A total of 13,002 households (29.4%) fall into this category. Meanwhile, the 15 to 24 years age bracket for the primary householder has the lowest median household income of $41,922, with 1,751 households (4.0%) in this group.
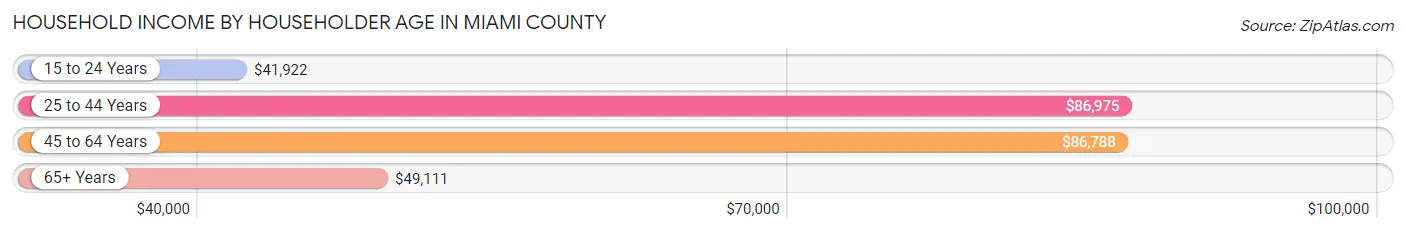
| Income Bracket | # Households | Median Income |
| 15 to 24 Years | 1,751 (4.0%) | $41,922 |
| 25 to 44 Years | 13,002 (29.4%) | $86,975 |
| 45 to 64 Years | 16,556 (37.5%) | $86,788 |
| 65+ Years | 12,843 (29.1%) | $49,111 |
| Total | 44,152 (100.0%) | $71,440 |
Poverty in Miami County
Income Below Poverty by Sex and Age in Miami County
With 7.5% poverty level for males and 9.4% for females among the residents of Miami County, 6 to 11 year old males and 5 year old females are the most vulnerable to poverty, with 638 males (15.8%) and 117 females (28.2%) in their respective age groups living below the poverty level.
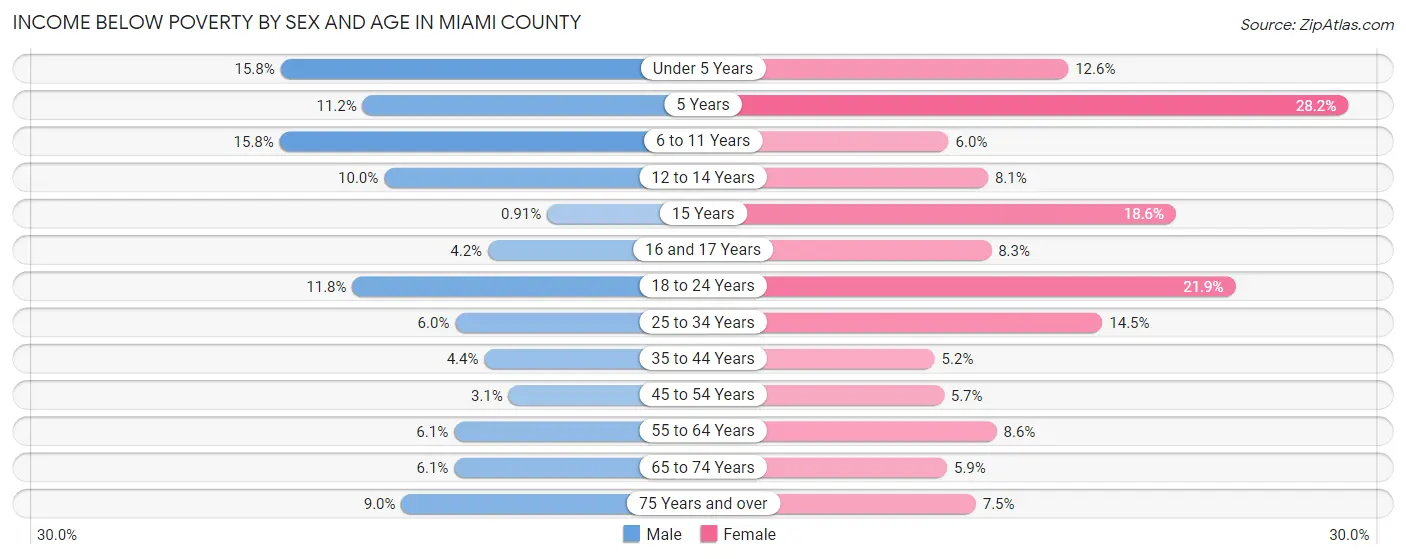
| Age Bracket | Male | Female |
| Under 5 Years | 484 (15.8%) | 381 (12.6%) |
| 5 Years | 97 (11.2%) | 117 (28.2%) |
| 6 to 11 Years | 638 (15.8%) | 227 (5.9%) |
| 12 to 14 Years | 232 (10.0%) | 209 (8.1%) |
| 15 Years | 5 (0.9%) | 125 (18.6%) |
| 16 and 17 Years | 76 (4.2%) | 118 (8.3%) |
| 18 to 24 Years | 504 (11.7%) | 924 (21.9%) |
| 25 to 34 Years | 382 (6.0%) | 874 (14.5%) |
| 35 to 44 Years | 307 (4.4%) | 347 (5.2%) |
| 45 to 54 Years | 210 (3.0%) | 380 (5.7%) |
| 55 to 64 Years | 450 (6.1%) | 640 (8.6%) |
| 65 to 74 Years | 344 (6.1%) | 366 (5.9%) |
| 75 Years and over | 310 (9.0%) | 355 (7.5%) |
| Total | 4,039 (7.5%) | 5,063 (9.4%) |
Income Above Poverty by Sex and Age in Miami County
According to the poverty statistics in Miami County, males aged 15 years and females aged 35 to 44 years are the age groups that are most secure financially, with 99.1% of males and 94.8% of females in these age groups living above the poverty line.
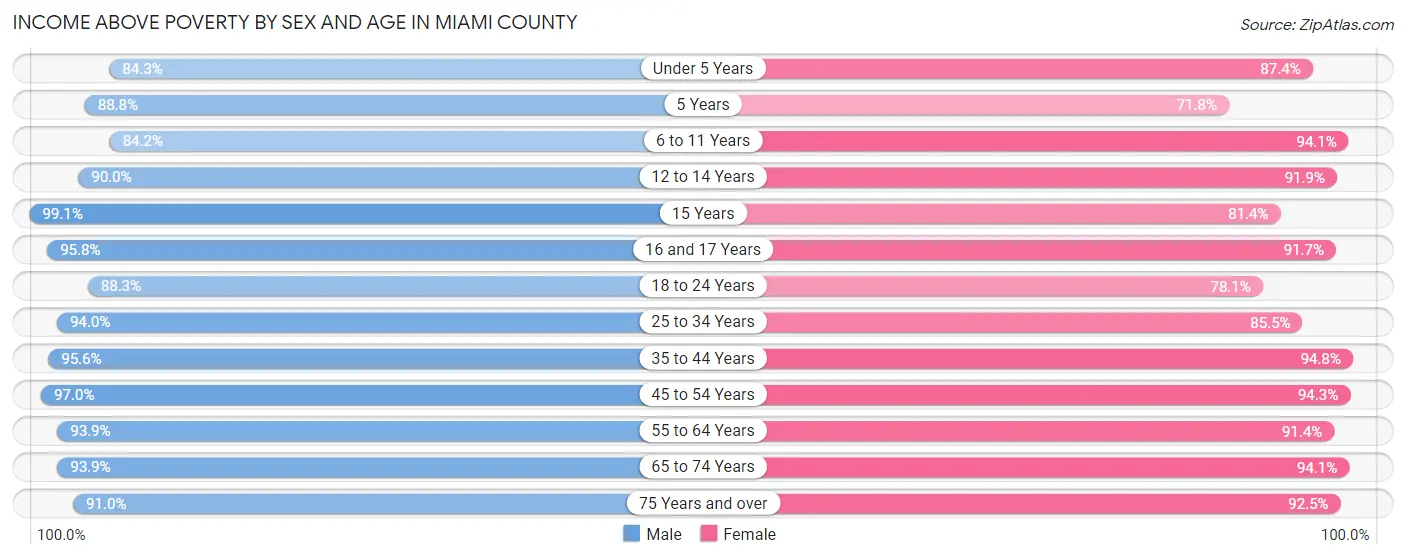
| Age Bracket | Male | Female |
| Under 5 Years | 2,589 (84.3%) | 2,641 (87.4%) |
| 5 Years | 771 (88.8%) | 298 (71.8%) |
| 6 to 11 Years | 3,399 (84.2%) | 3,586 (94.1%) |
| 12 to 14 Years | 2,093 (90.0%) | 2,357 (91.9%) |
| 15 Years | 546 (99.1%) | 547 (81.4%) |
| 16 and 17 Years | 1,734 (95.8%) | 1,300 (91.7%) |
| 18 to 24 Years | 3,785 (88.2%) | 3,293 (78.1%) |
| 25 to 34 Years | 5,965 (94.0%) | 5,150 (85.5%) |
| 35 to 44 Years | 6,670 (95.6%) | 6,362 (94.8%) |
| 45 to 54 Years | 6,682 (97.0%) | 6,306 (94.3%) |
| 55 to 64 Years | 6,934 (93.9%) | 6,786 (91.4%) |
| 65 to 74 Years | 5,318 (93.9%) | 5,882 (94.1%) |
| 75 Years and over | 3,128 (91.0%) | 4,401 (92.5%) |
| Total | 49,614 (92.5%) | 48,909 (90.6%) |
Income Below Poverty Among Married-Couple Families in Miami County
The poverty statistics for married-couple families in Miami County show that 1.5% or 366 of the total 23,702 families live below the poverty line. Families with 5 or more children have the highest poverty rate of 29.4%, comprising of 63 families. On the other hand, families with 1 or 2 children have the lowest poverty rate of 0.5%, which includes 36 families.
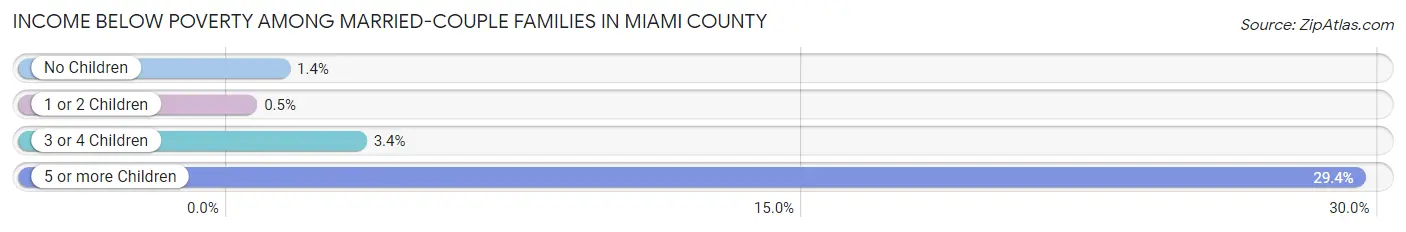
| Children | Above Poverty | Below Poverty |
| No Children | 13,814 (98.6%) | 191 (1.4%) |
| 1 or 2 Children | 7,184 (99.5%) | 36 (0.5%) |
| 3 or 4 Children | 2,187 (96.6%) | 76 (3.4%) |
| 5 or more Children | 151 (70.6%) | 63 (29.4%) |
| Total | 23,336 (98.5%) | 366 (1.5%) |
Income Below Poverty Among Single-Parent Households in Miami County
According to the poverty data in Miami County, 4.9% or 88 single-father households and 29.6% or 1,211 single-mother households are living below the poverty line. Among single-father households, those with no children have the highest poverty rate, with 78 households (9.3%) experiencing poverty. Likewise, among single-mother households, those with 5 or more children have the highest poverty rate, with 91 households (83.5%) falling below the poverty line.

| Children | Single Father | Single Mother |
| No Children | 78 (9.3%) | 21 (1.6%) |
| 1 or 2 Children | 0 (0.0%) | 893 (38.6%) |
| 3 or 4 Children | 10 (9.1%) | 206 (55.1%) |
| 5 or more Children | 0 (0.0%) | 91 (83.5%) |
| Total | 88 (4.9%) | 1,211 (29.6%) |
Income Below Poverty Among Married-Couple vs Single-Parent Households in Miami County
The poverty data for Miami County shows that 366 of the married-couple family households (1.5%) and 1,299 of the single-parent households (22.1%) are living below the poverty level. Within the married-couple family households, those with 5 or more children have the highest poverty rate, with 63 households (29.4%) falling below the poverty line. Among the single-parent households, those with 5 or more children have the highest poverty rate, with 91 household (83.5%) living below poverty.
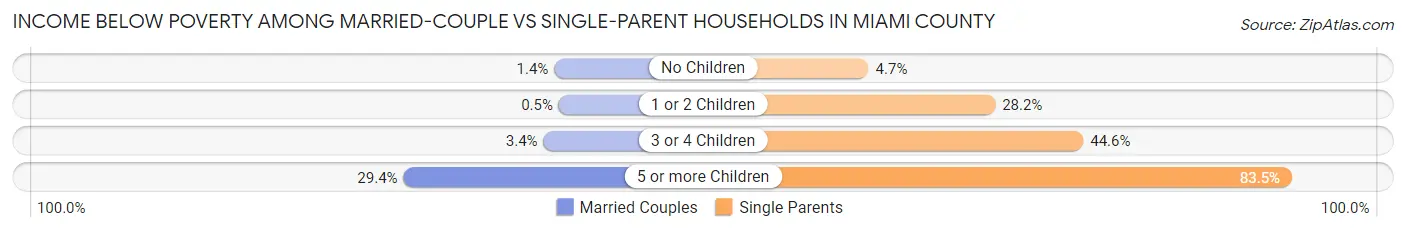
| Children | Married-Couple Families | Single-Parent Households |
| No Children | 191 (1.4%) | 99 (4.6%) |
| 1 or 2 Children | 36 (0.5%) | 893 (28.2%) |
| 3 or 4 Children | 76 (3.4%) | 216 (44.6%) |
| 5 or more Children | 63 (29.4%) | 91 (83.5%) |
| Total | 366 (1.5%) | 1,299 (22.1%) |
Employment Characteristics in Miami County
Employment by Class of Employer in Miami County
Among the 53,983 employed individuals in Miami County, private company employees (38,786 | 71.9%), local government employees (4,607 | 8.5%), and not-for-profit organizations (4,058 | 7.5%) make up the most common classes of employment.
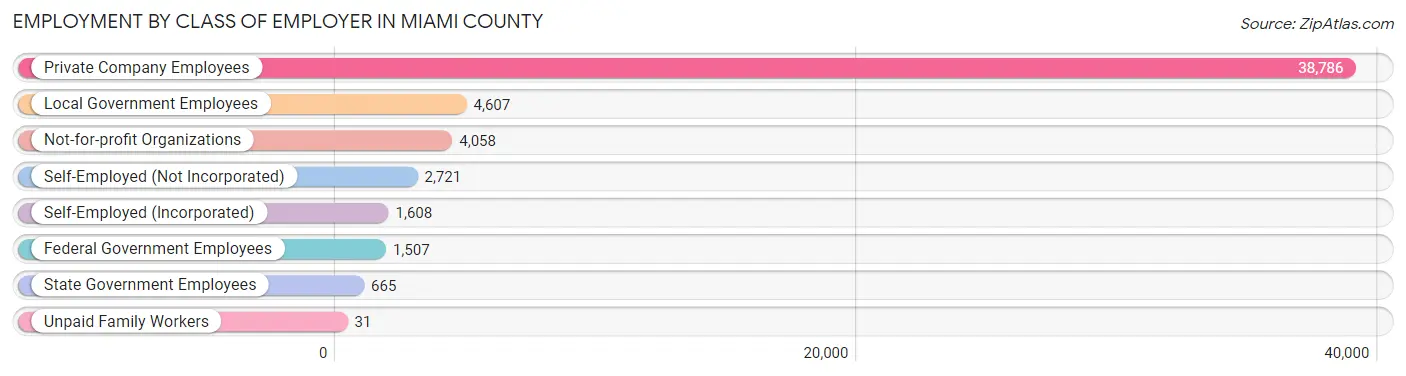
| Employer Class | # Employees | % Employees |
| Private Company Employees | 38,786 | 71.9% |
| Self-Employed (Incorporated) | 1,608 | 3.0% |
| Self-Employed (Not Incorporated) | 2,721 | 5.0% |
| Not-for-profit Organizations | 4,058 | 7.5% |
| Local Government Employees | 4,607 | 8.5% |
| State Government Employees | 665 | 1.2% |
| Federal Government Employees | 1,507 | 2.8% |
| Unpaid Family Workers | 31 | 0.1% |
| Total | 53,983 | 100.0% |
Employment Status by Age in Miami County
According to the labor force statistics for Miami County, out of the total population over 16 years of age (87,130), 65.0% or 56,634 individuals are in the labor force, with 3.4% or 1,926 of them unemployed. The age group with the highest labor force participation rate is 30 to 34 years, with 86.8% or 5,604 individuals in the labor force. Within the labor force, the 20 to 24 years age range has the highest percentage of unemployed individuals, with 7.6% or 401 of them being unemployed.
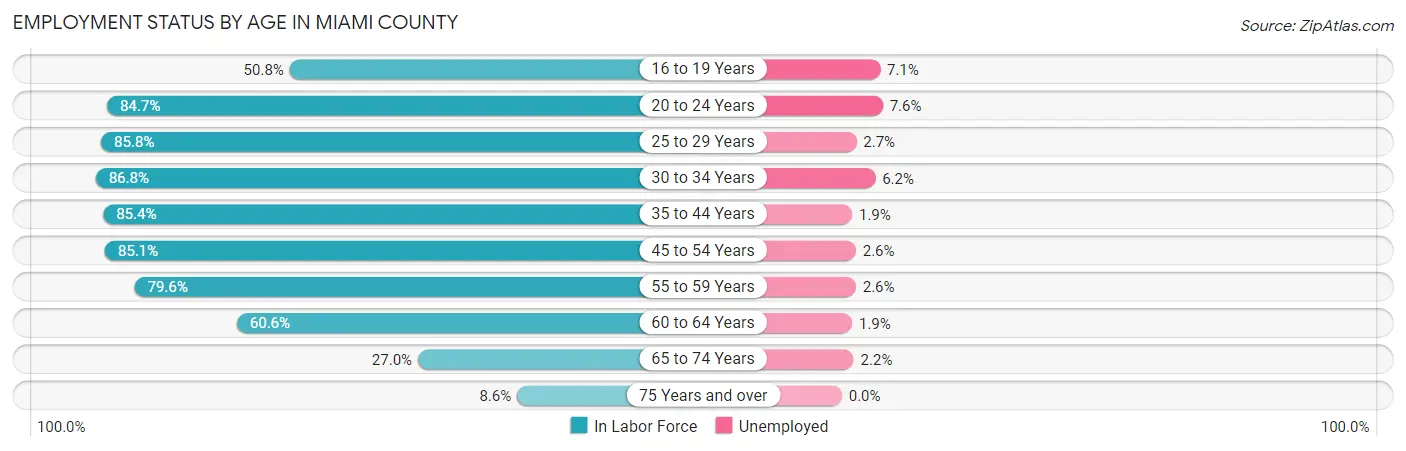
| Age Bracket | In Labor Force | Unemployed |
| 16 to 19 Years | 2,809 (50.8%) | 199 (7.1%) |
| 20 to 24 Years | 5,279 (84.7%) | 401 (7.6%) |
| 25 to 29 Years | 5,136 (85.8%) | 139 (2.7%) |
| 30 to 34 Years | 5,604 (86.8%) | 347 (6.2%) |
| 35 to 44 Years | 11,716 (85.4%) | 223 (1.9%) |
| 45 to 54 Years | 11,610 (85.1%) | 302 (2.6%) |
| 55 to 59 Years | 6,034 (79.6%) | 157 (2.6%) |
| 60 to 64 Years | 4,445 (60.6%) | 84 (1.9%) |
| 65 to 74 Years | 3,268 (27.0%) | 72 (2.2%) |
| 75 Years and over | 735 (8.6%) | 0 (0.0%) |
| Total | 56,634 (65.0%) | 1,926 (3.4%) |
Employment Status by Educational Attainment in Miami County
According to labor force statistics for Miami County, 81.4% of individuals (44,542) out of the total population between 25 and 64 years of age (54,720) are in the labor force, with 2.8% or 1,247 of them being unemployed. The group with the highest labor force participation rate are those with the educational attainment of bachelor's degree or higher, with 88.6% or 12,804 individuals in the labor force. Within the labor force, individuals with high school diploma education have the highest percentage of unemployment, with 4.6% or 644 of them being unemployed.
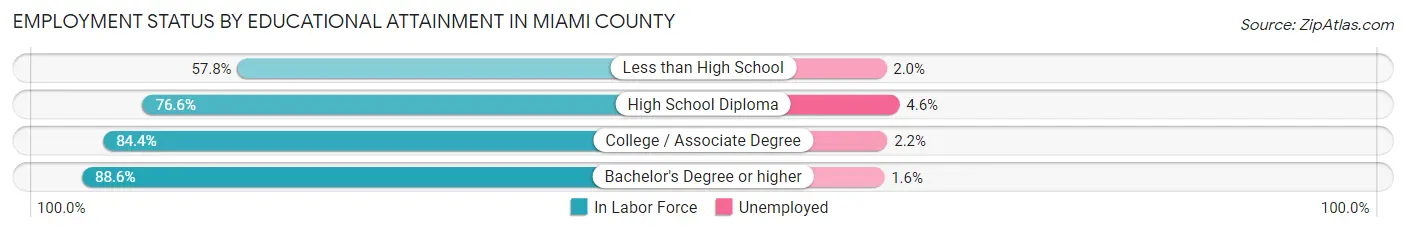
| Educational Attainment | In Labor Force | Unemployed |
| Less than High School | 1,780 (57.8%) | 62 (2.0%) |
| High School Diploma | 13,992 (76.6%) | 840 (4.6%) |
| College / Associate Degree | 15,971 (84.4%) | 416 (2.2%) |
| Bachelor's Degree or higher | 12,804 (88.6%) | 231 (1.6%) |
| Total | 44,542 (81.4%) | 1,532 (2.8%) |
Employment Occupations by Sex in Miami County
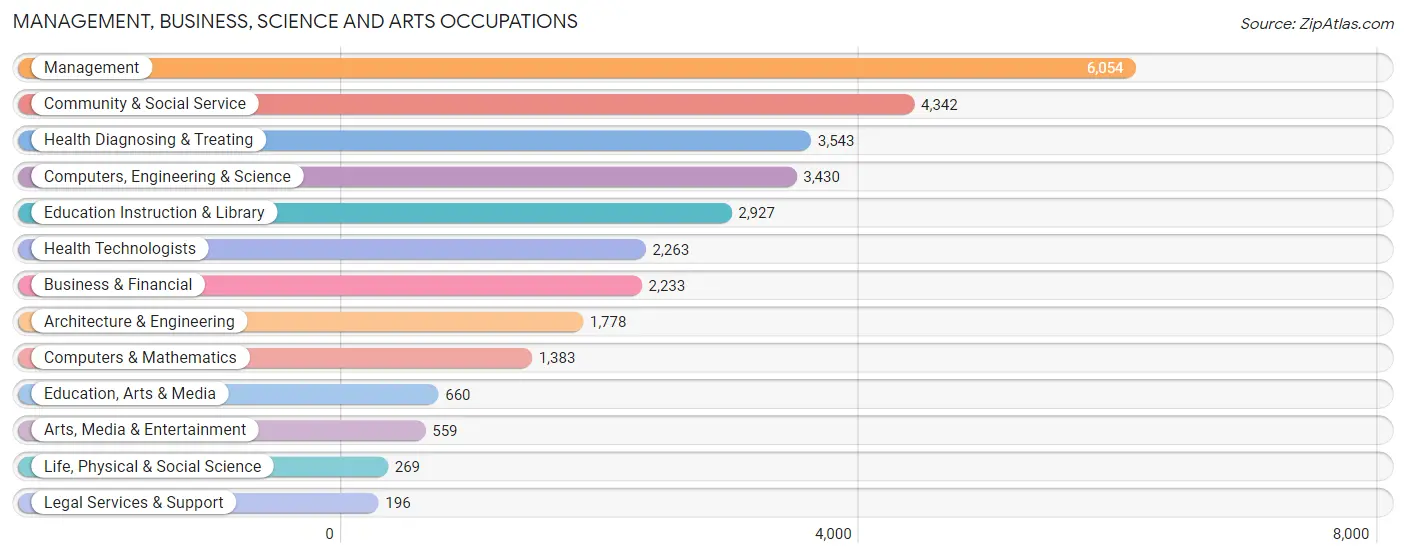
Management, Business, Science and Arts Occupations
The most common Management, Business, Science and Arts occupations in Miami County are Management (6,054 | 11.1%), Community & Social Service (4,342 | 8.0%), Health Diagnosing & Treating (3,543 | 6.5%), Computers, Engineering & Science (3,430 | 6.3%), and Education Instruction & Library (2,927 | 5.4%).
Management, Business, Science and Arts Occupations by Sex
Within the Management, Business, Science and Arts occupations in Miami County, the most male-oriented occupations are Architecture & Engineering (87.5%), Computers, Engineering & Science (80.9%), and Computers & Mathematics (77.7%), while the most female-oriented occupations are Health Diagnosing & Treating (77.4%), Health Technologists (76.9%), and Education Instruction & Library (70.4%).
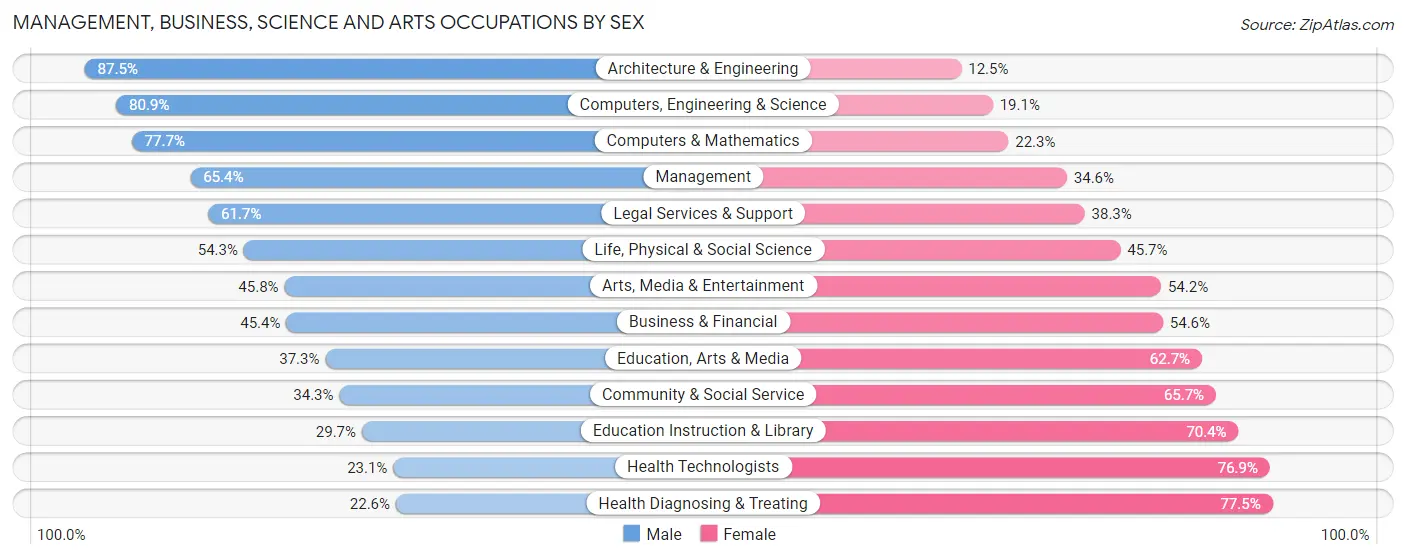
| Occupation | Male | Female |
| Management | 3,962 (65.4%) | 2,092 (34.6%) |
| Business & Financial | 1,014 (45.4%) | 1,219 (54.6%) |
| Computers, Engineering & Science | 2,775 (80.9%) | 655 (19.1%) |
| Computers & Mathematics | 1,074 (77.7%) | 309 (22.3%) |
| Architecture & Engineering | 1,555 (87.5%) | 223 (12.5%) |
| Life, Physical & Social Science | 146 (54.3%) | 123 (45.7%) |
| Community & Social Service | 1,491 (34.3%) | 2,851 (65.7%) |
| Education, Arts & Media | 246 (37.3%) | 414 (62.7%) |
| Legal Services & Support | 121 (61.7%) | 75 (38.3%) |
| Education Instruction & Library | 868 (29.6%) | 2,059 (70.4%) |
| Arts, Media & Entertainment | 256 (45.8%) | 303 (54.2%) |
| Health Diagnosing & Treating | 799 (22.6%) | 2,744 (77.4%) |
| Health Technologists | 523 (23.1%) | 1,740 (76.9%) |
| Total (Category) | 10,041 (51.2%) | 9,561 (48.8%) |
| Total (Overall) | 29,860 (54.8%) | 24,624 (45.2%) |
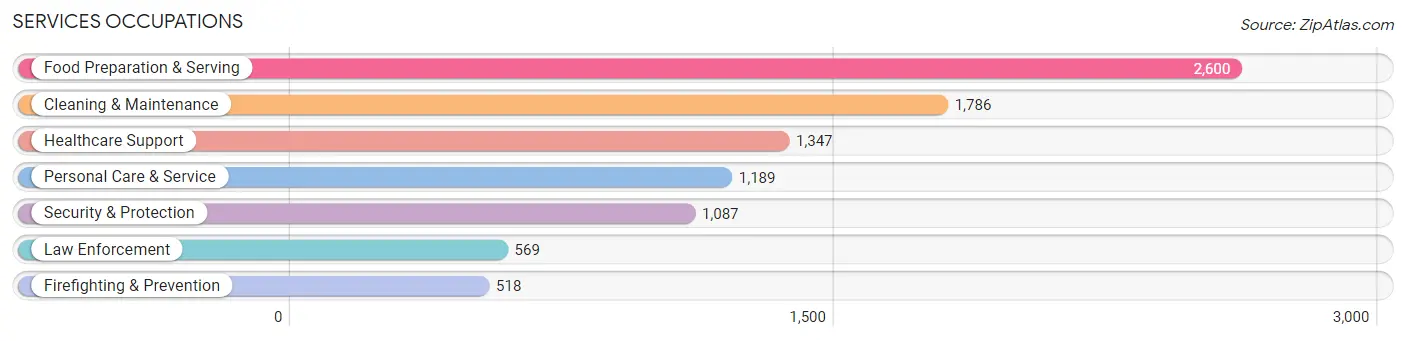
Services Occupations
The most common Services occupations in Miami County are Food Preparation & Serving (2,600 | 4.8%), Cleaning & Maintenance (1,786 | 3.3%), Healthcare Support (1,347 | 2.5%), Personal Care & Service (1,189 | 2.2%), and Security & Protection (1,087 | 2.0%).
Services Occupations by Sex
Within the Services occupations in Miami County, the most male-oriented occupations are Law Enforcement (86.1%), Cleaning & Maintenance (79.5%), and Security & Protection (72.4%), while the most female-oriented occupations are Healthcare Support (99.3%), Personal Care & Service (92.7%), and Food Preparation & Serving (54.3%).
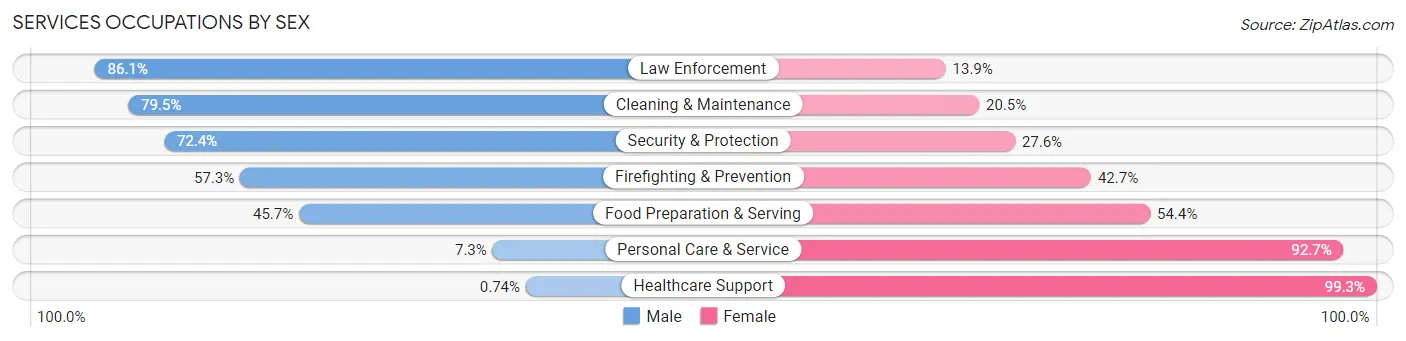
| Occupation | Male | Female |
| Healthcare Support | 10 (0.7%) | 1,337 (99.3%) |
| Security & Protection | 787 (72.4%) | 300 (27.6%) |
| Firefighting & Prevention | 297 (57.3%) | 221 (42.7%) |
| Law Enforcement | 490 (86.1%) | 79 (13.9%) |
| Food Preparation & Serving | 1,187 (45.7%) | 1,413 (54.3%) |
| Cleaning & Maintenance | 1,420 (79.5%) | 366 (20.5%) |
| Personal Care & Service | 87 (7.3%) | 1,102 (92.7%) |
| Total (Category) | 3,491 (43.6%) | 4,518 (56.4%) |
| Total (Overall) | 29,860 (54.8%) | 24,624 (45.2%) |
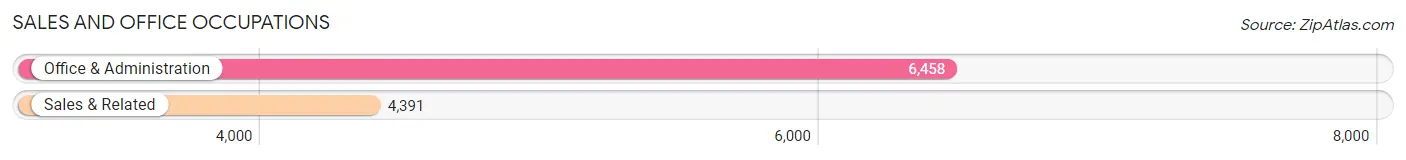
Sales and Office Occupations
The most common Sales and Office occupations in Miami County are Office & Administration (6,458 | 11.8%), and Sales & Related (4,391 | 8.1%).
Sales and Office Occupations by Sex
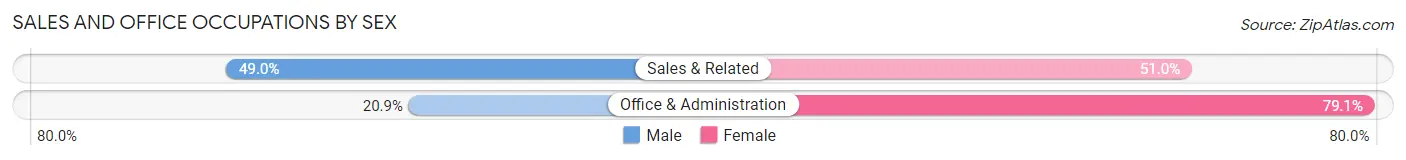
| Occupation | Male | Female |
| Sales & Related | 2,152 (49.0%) | 2,239 (51.0%) |
| Office & Administration | 1,349 (20.9%) | 5,109 (79.1%) |
| Total (Category) | 3,501 (32.3%) | 7,348 (67.7%) |
| Total (Overall) | 29,860 (54.8%) | 24,624 (45.2%) |
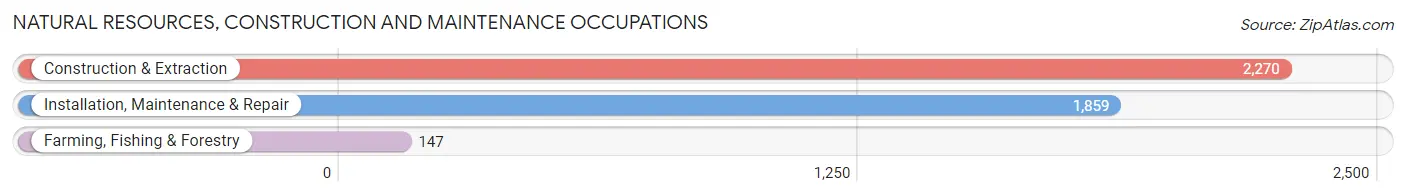
Natural Resources, Construction and Maintenance Occupations
The most common Natural Resources, Construction and Maintenance occupations in Miami County are Construction & Extraction (2,270 | 4.2%), Installation, Maintenance & Repair (1,859 | 3.4%), and Farming, Fishing & Forestry (147 | 0.3%).
Natural Resources, Construction and Maintenance Occupations by Sex
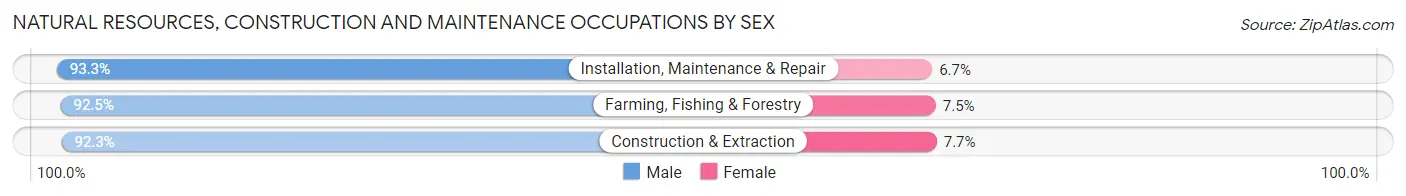
| Occupation | Male | Female |
| Farming, Fishing & Forestry | 136 (92.5%) | 11 (7.5%) |
| Construction & Extraction | 2,096 (92.3%) | 174 (7.7%) |
| Installation, Maintenance & Repair | 1,734 (93.3%) | 125 (6.7%) |
| Total (Category) | 3,966 (92.7%) | 310 (7.2%) |
| Total (Overall) | 29,860 (54.8%) | 24,624 (45.2%) |
Production, Transportation and Moving Occupations
The most common Production, Transportation and Moving occupations in Miami County are Production (6,448 | 11.8%), Material Moving (3,239 | 5.9%), and Transportation (2,061 | 3.8%).
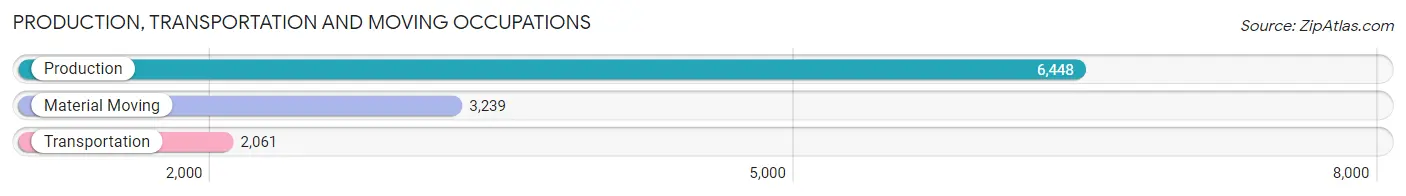
Production, Transportation and Moving Occupations by Sex
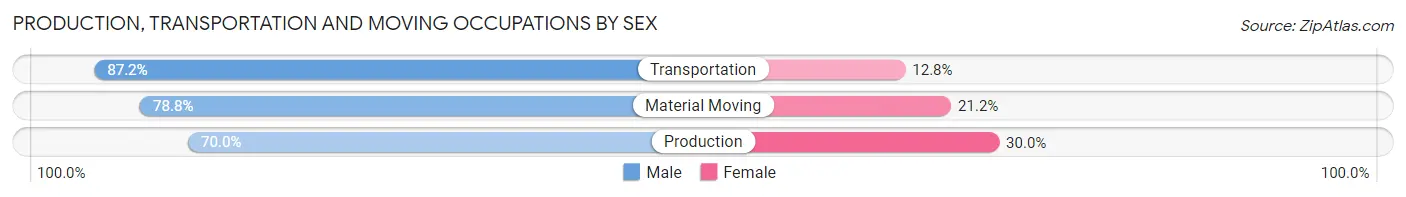
| Occupation | Male | Female |
| Production | 4,512 (70.0%) | 1,936 (30.0%) |
| Transportation | 1,797 (87.2%) | 264 (12.8%) |
| Material Moving | 2,552 (78.8%) | 687 (21.2%) |
| Total (Category) | 8,861 (75.4%) | 2,887 (24.6%) |
| Total (Overall) | 29,860 (54.8%) | 24,624 (45.2%) |
Employment Industries by Sex in Miami County
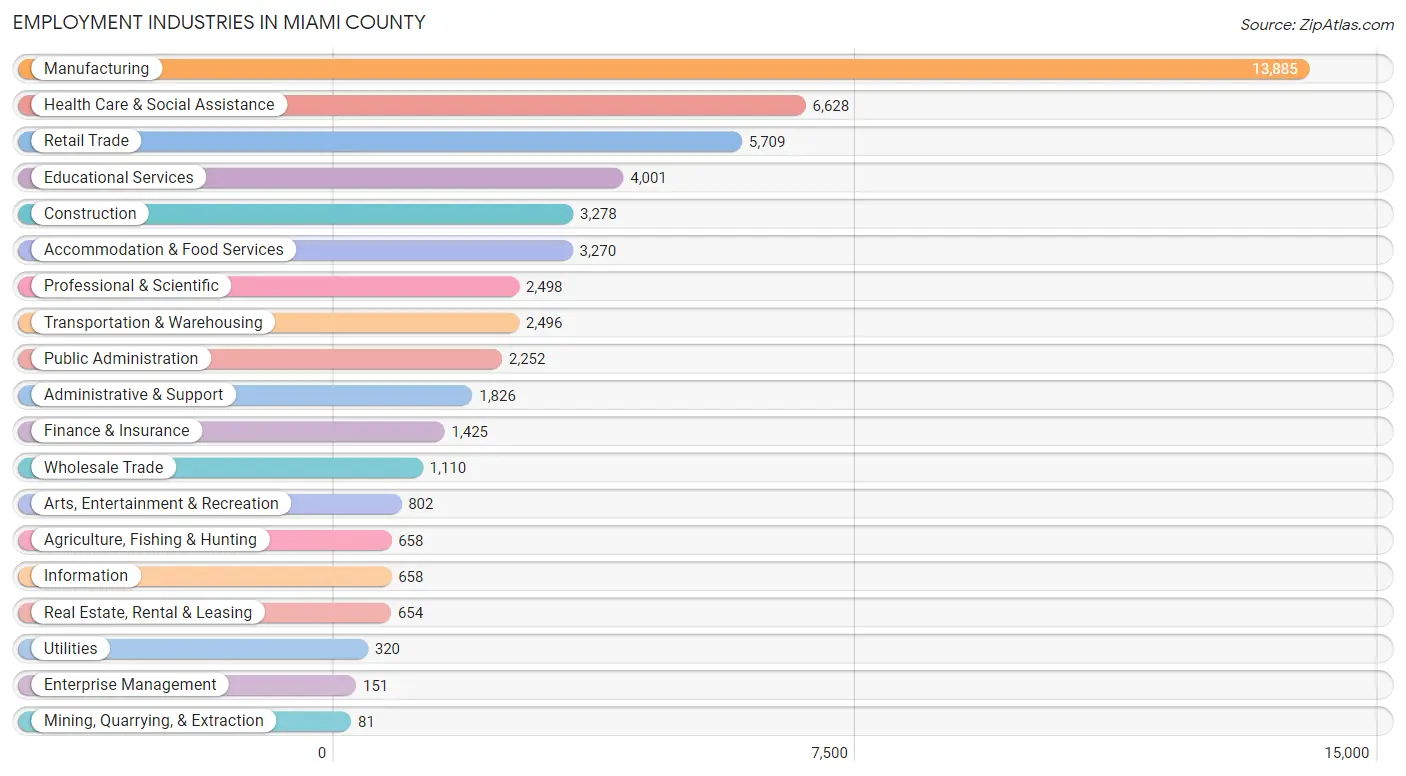
Employment Industries in Miami County
The major employment industries in Miami County include Manufacturing (13,885 | 25.5%), Health Care & Social Assistance (6,628 | 12.2%), Retail Trade (5,709 | 10.5%), Educational Services (4,001 | 7.3%), and Construction (3,278 | 6.0%).
Employment Industries by Sex in Miami County
The Miami County industries that see more men than women are Utilities (85.9%), Construction (80.6%), and Agriculture, Fishing & Hunting (79.3%), whereas the industries that tend to have a higher number of women are Health Care & Social Assistance (87.3%), Finance & Insurance (65.5%), and Mining, Quarrying, & Extraction (65.4%).
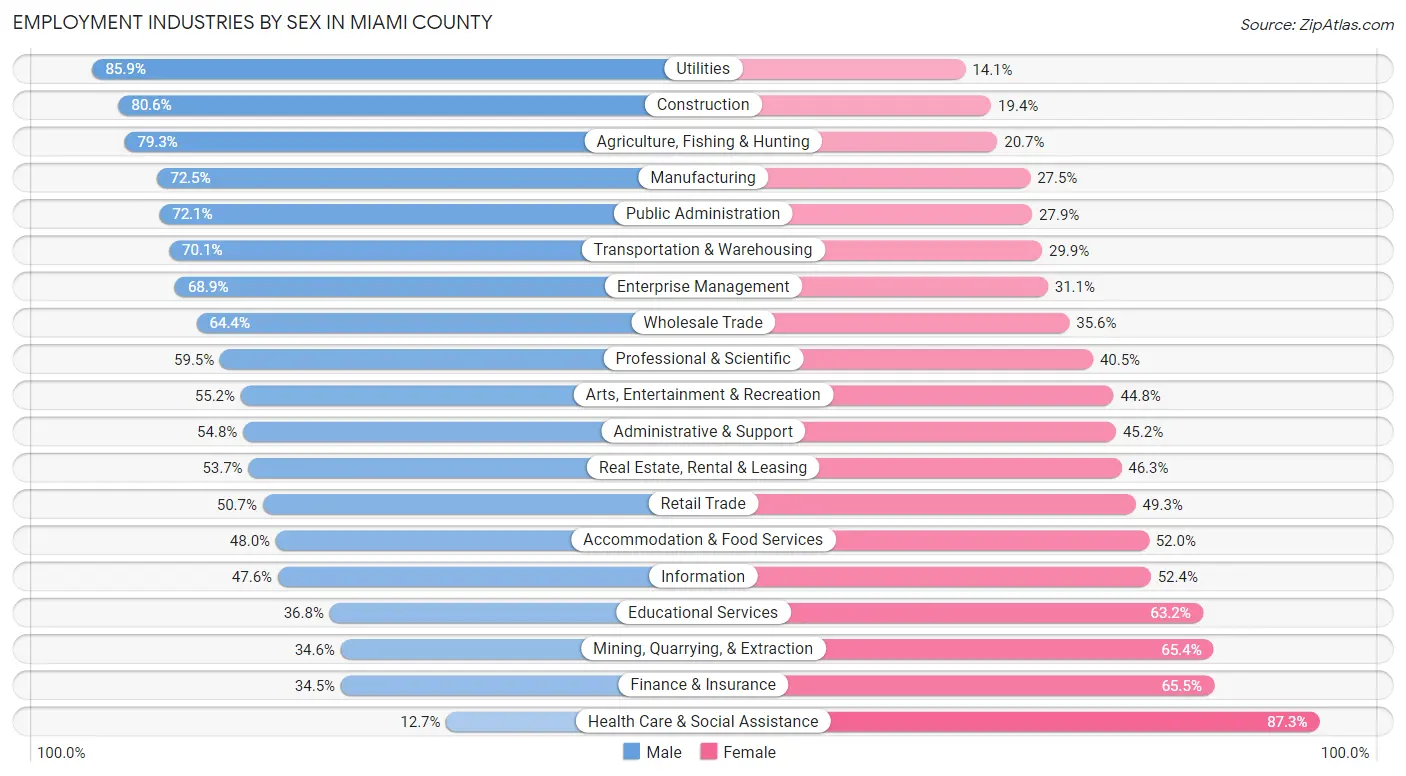
| Industry | Male | Female |
| Agriculture, Fishing & Hunting | 522 (79.3%) | 136 (20.7%) |
| Mining, Quarrying, & Extraction | 28 (34.6%) | 53 (65.4%) |
| Construction | 2,642 (80.6%) | 636 (19.4%) |
| Manufacturing | 10,069 (72.5%) | 3,816 (27.5%) |
| Wholesale Trade | 715 (64.4%) | 395 (35.6%) |
| Retail Trade | 2,894 (50.7%) | 2,815 (49.3%) |
| Transportation & Warehousing | 1,749 (70.1%) | 747 (29.9%) |
| Utilities | 275 (85.9%) | 45 (14.1%) |
| Information | 313 (47.6%) | 345 (52.4%) |
| Finance & Insurance | 492 (34.5%) | 933 (65.5%) |
| Real Estate, Rental & Leasing | 351 (53.7%) | 303 (46.3%) |
| Professional & Scientific | 1,487 (59.5%) | 1,011 (40.5%) |
| Enterprise Management | 104 (68.9%) | 47 (31.1%) |
| Administrative & Support | 1,000 (54.8%) | 826 (45.2%) |
| Educational Services | 1,474 (36.8%) | 2,527 (63.2%) |
| Health Care & Social Assistance | 842 (12.7%) | 5,786 (87.3%) |
| Arts, Entertainment & Recreation | 443 (55.2%) | 359 (44.8%) |
| Accommodation & Food Services | 1,569 (48.0%) | 1,701 (52.0%) |
| Public Administration | 1,624 (72.1%) | 628 (27.9%) |
| Total | 29,860 (54.8%) | 24,624 (45.2%) |
Education in Miami County
School Enrollment in Miami County
The most common levels of schooling among the 24,947 students in Miami County are middle school (6,014 | 24.1%), high school (5,977 | 24.0%), and elementary school (5,277 | 21.1%).
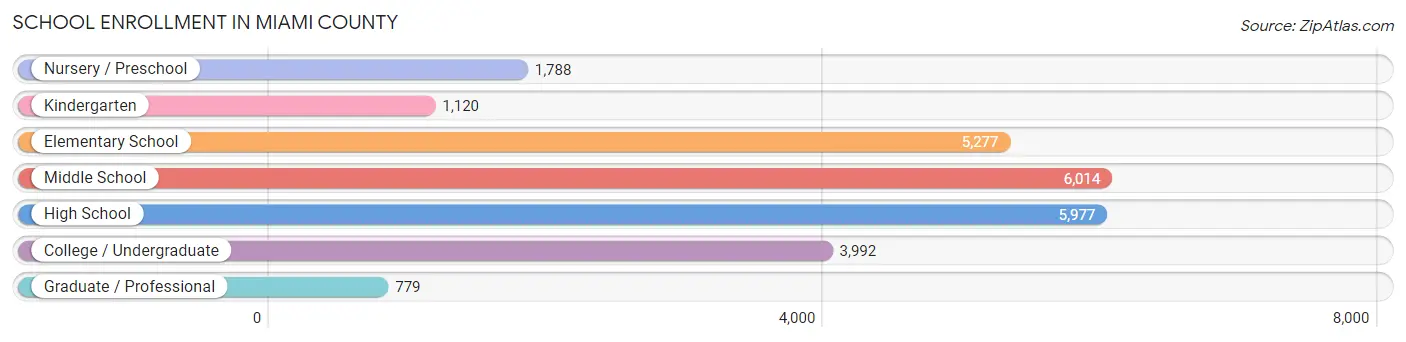
| School Level | # Students | % Students |
| Nursery / Preschool | 1,788 | 7.2% |
| Kindergarten | 1,120 | 4.5% |
| Elementary School | 5,277 | 21.1% |
| Middle School | 6,014 | 24.1% |
| High School | 5,977 | 24.0% |
| College / Undergraduate | 3,992 | 16.0% |
| Graduate / Professional | 779 | 3.1% |
| Total | 24,947 | 100.0% |
School Enrollment by Age by Funding Source in Miami County
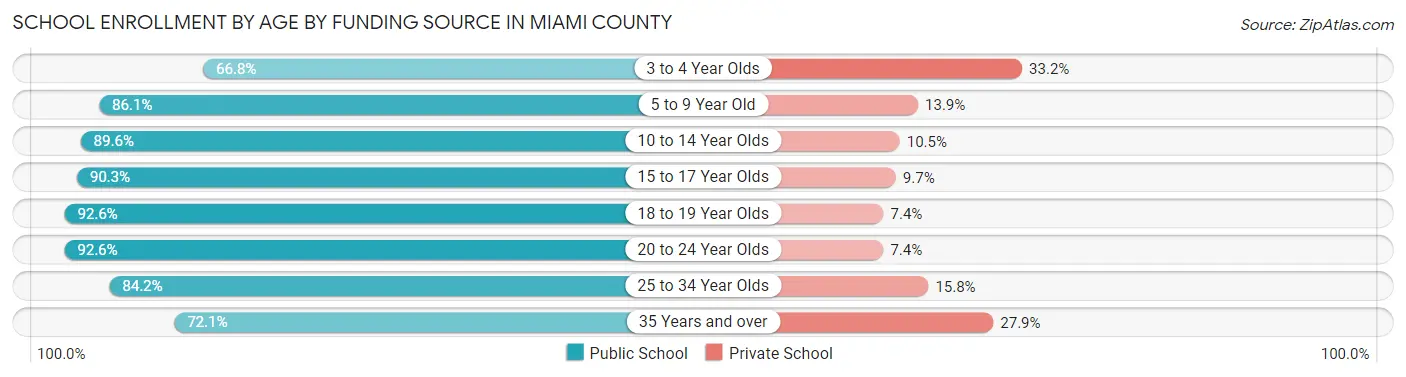
Out of a total of 24,947 students who are enrolled in schools in Miami County, 3,193 (12.8%) attend a private institution, while the remaining 21,754 (87.2%) are enrolled in public schools. The age group of 3 to 4 year olds has the highest likelihood of being enrolled in private schools, with 340 (33.2% in the age bracket) enrolled. Conversely, the age group of 20 to 24 year olds has the lowest likelihood of being enrolled in a private school, with 1,699 (92.6% in the age bracket) attending a public institution.
| Age Bracket | Public School | Private School |
| 3 to 4 Year Olds | 683 (66.8%) | 340 (33.2%) |
| 5 to 9 Year Old | 5,241 (86.1%) | 844 (13.9%) |
| 10 to 14 Year Olds | 6,909 (89.5%) | 806 (10.4%) |
| 15 to 17 Year Olds | 3,895 (90.3%) | 420 (9.7%) |
| 18 to 19 Year Olds | 1,494 (92.6%) | 120 (7.4%) |
| 20 to 24 Year Olds | 1,699 (92.6%) | 136 (7.4%) |
| 25 to 34 Year Olds | 885 (84.2%) | 166 (15.8%) |
| 35 Years and over | 944 (72.1%) | 365 (27.9%) |
| Total | 21,754 (87.2%) | 3,193 (12.8%) |
Educational Attainment by Field of Study in Miami County
Business (4,516 | 22.9%), education (3,728 | 18.9%), science & technology (2,170 | 11.0%), engineering (1,930 | 9.8%), and arts & humanities (1,403 | 7.1%) are the most common fields of study among 19,731 individuals in Miami County who have obtained a bachelor's degree or higher.
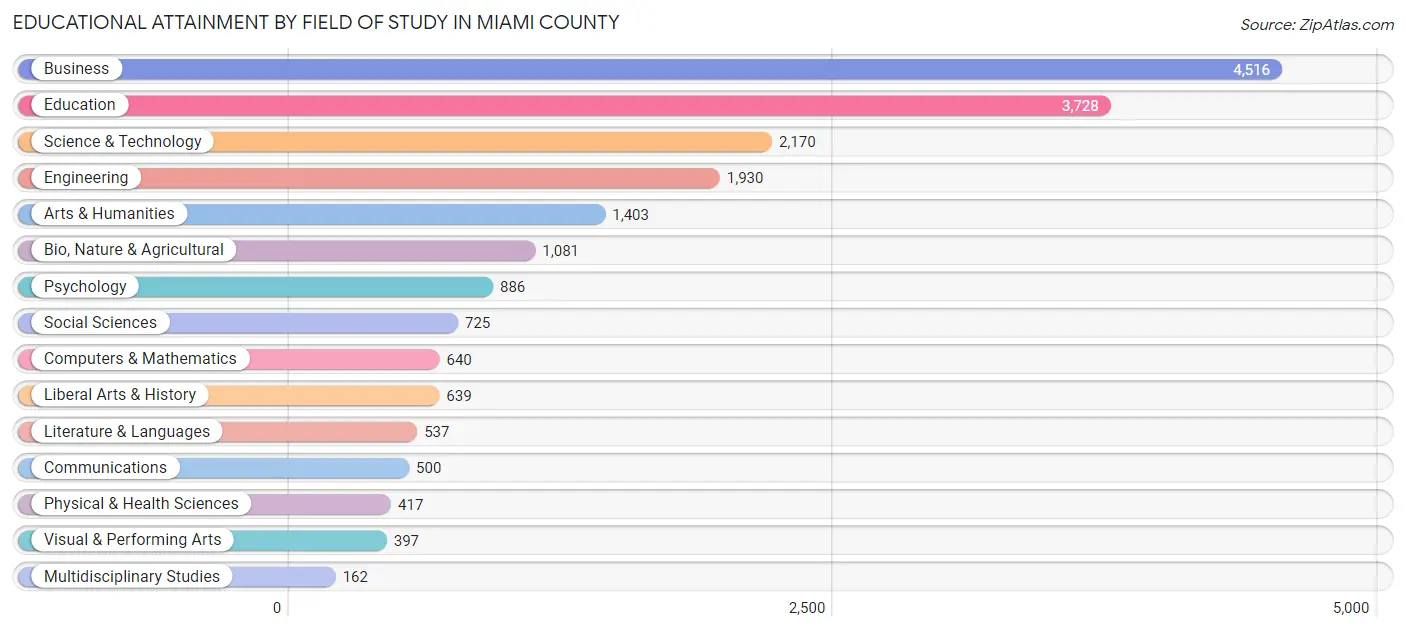
| Field of Study | # Graduates | % Graduates |
| Computers & Mathematics | 640 | 3.2% |
| Bio, Nature & Agricultural | 1,081 | 5.5% |
| Physical & Health Sciences | 417 | 2.1% |
| Psychology | 886 | 4.5% |
| Social Sciences | 725 | 3.7% |
| Engineering | 1,930 | 9.8% |
| Multidisciplinary Studies | 162 | 0.8% |
| Science & Technology | 2,170 | 11.0% |
| Business | 4,516 | 22.9% |
| Education | 3,728 | 18.9% |
| Literature & Languages | 537 | 2.7% |
| Liberal Arts & History | 639 | 3.2% |
| Visual & Performing Arts | 397 | 2.0% |
| Communications | 500 | 2.5% |
| Arts & Humanities | 1,403 | 7.1% |
| Total | 19,731 | 100.0% |
Transportation & Commute in Miami County
Vehicle Availability by Sex in Miami County
The most prevalent vehicle ownership categories in Miami County are males with 2 vehicles (12,803, accounting for 43.0%) and females with 2 vehicles (10,040, making up 52.9%).
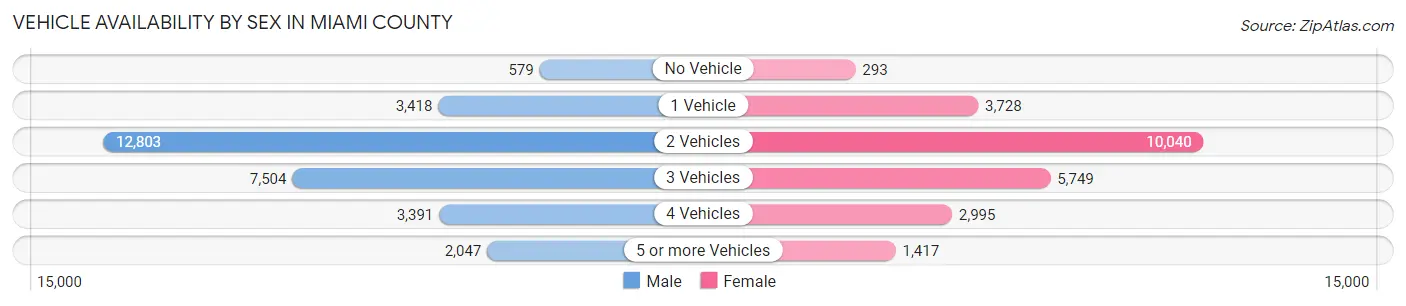
| Vehicles Available | Male | Female |
| No Vehicle | 579 (1.9%) | 293 (1.2%) |
| 1 Vehicle | 3,418 (11.5%) | 3,728 (15.4%) |
| 2 Vehicles | 12,803 (43.0%) | 10,040 (41.4%) |
| 3 Vehicles | 7,504 (25.2%) | 5,749 (23.7%) |
| 4 Vehicles | 3,391 (11.4%) | 2,995 (12.4%) |
| 5 or more Vehicles | 2,047 (6.9%) | 1,417 (5.9%) |
| Total | 29,742 (100.0%) | 24,222 (100.0%) |
Commute Time in Miami County
The most frequently occuring commute durations in Miami County are 10 to 14 minutes (8,354 commuters, 16.7%), 15 to 19 minutes (8,216 commuters, 16.5%), and 20 to 24 minutes (7,113 commuters, 14.2%).
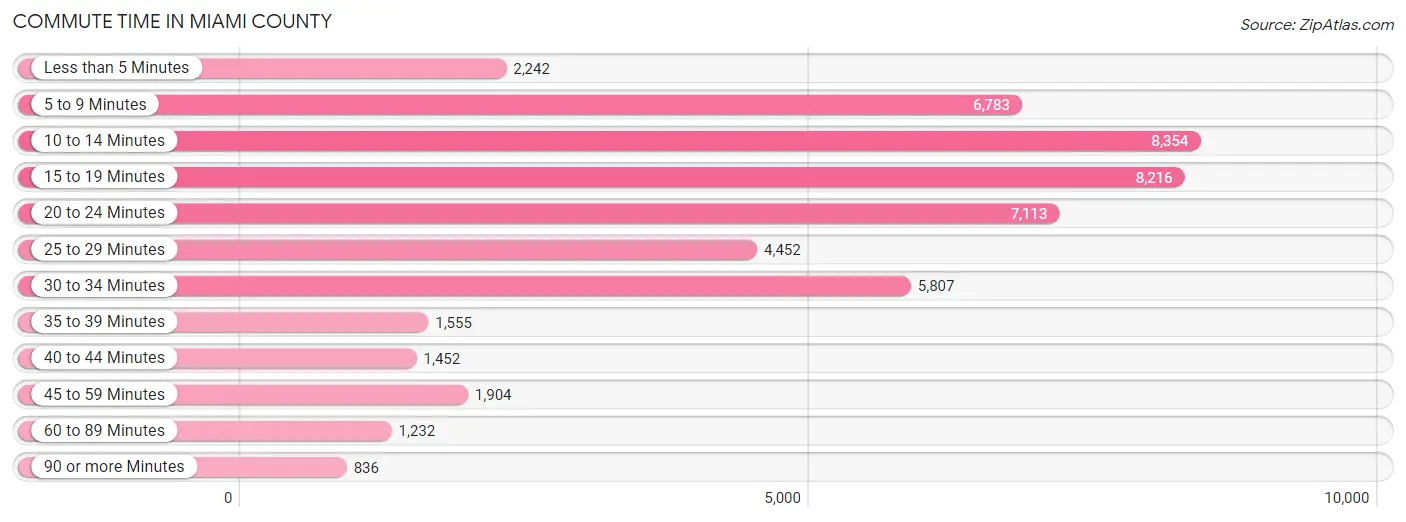
| Commute Time | # Commuters | % Commuters |
| Less than 5 Minutes | 2,242 | 4.5% |
| 5 to 9 Minutes | 6,783 | 13.6% |
| 10 to 14 Minutes | 8,354 | 16.7% |
| 15 to 19 Minutes | 8,216 | 16.5% |
| 20 to 24 Minutes | 7,113 | 14.2% |
| 25 to 29 Minutes | 4,452 | 8.9% |
| 30 to 34 Minutes | 5,807 | 11.6% |
| 35 to 39 Minutes | 1,555 | 3.1% |
| 40 to 44 Minutes | 1,452 | 2.9% |
| 45 to 59 Minutes | 1,904 | 3.8% |
| 60 to 89 Minutes | 1,232 | 2.5% |
| 90 or more Minutes | 836 | 1.7% |
Commute Time by Sex in Miami County
The most common commute times in Miami County are 15 to 19 minutes (4,635 commuters, 16.7%) for males and 10 to 14 minutes (3,983 commuters, 18.0%) for females.
| Commute Time | Male | Female |
| Less than 5 Minutes | 1,303 (4.7%) | 939 (4.2%) |
| 5 to 9 Minutes | 3,618 (13.0%) | 3,165 (14.3%) |
| 10 to 14 Minutes | 4,371 (15.7%) | 3,983 (18.0%) |
| 15 to 19 Minutes | 4,635 (16.7%) | 3,581 (16.2%) |
| 20 to 24 Minutes | 3,691 (13.3%) | 3,422 (15.4%) |
| 25 to 29 Minutes | 2,288 (8.2%) | 2,164 (9.8%) |
| 30 to 34 Minutes | 3,622 (13.0%) | 2,185 (9.9%) |
| 35 to 39 Minutes | 944 (3.4%) | 611 (2.8%) |
| 40 to 44 Minutes | 705 (2.5%) | 747 (3.4%) |
| 45 to 59 Minutes | 1,147 (4.1%) | 757 (3.4%) |
| 60 to 89 Minutes | 841 (3.0%) | 391 (1.8%) |
| 90 or more Minutes | 606 (2.2%) | 230 (1.0%) |
Time of Departure to Work by Sex in Miami County
The most frequent times of departure to work in Miami County are 6:30 AM to 6:59 AM (4,198, 15.1%) for males and 7:00 AM to 7:29 AM (3,081, 13.9%) for females.
| Time of Departure | Male | Female |
| 12:00 AM to 4:59 AM | 1,751 (6.3%) | 1,368 (6.2%) |
| 5:00 AM to 5:29 AM | 1,100 (4.0%) | 354 (1.6%) |
| 5:30 AM to 5:59 AM | 2,247 (8.1%) | 1,154 (5.2%) |
| 6:00 AM to 6:29 AM | 2,745 (9.9%) | 1,386 (6.2%) |
| 6:30 AM to 6:59 AM | 4,198 (15.1%) | 2,800 (12.6%) |
| 7:00 AM to 7:29 AM | 2,978 (10.7%) | 3,081 (13.9%) |
| 7:30 AM to 7:59 AM | 3,223 (11.6%) | 3,009 (13.6%) |
| 8:00 AM to 8:29 AM | 1,950 (7.0%) | 1,862 (8.4%) |
| 8:30 AM to 8:59 AM | 924 (3.3%) | 1,531 (6.9%) |
| 9:00 AM to 9:59 AM | 1,096 (4.0%) | 1,321 (6.0%) |
| 10:00 AM to 10:59 AM | 531 (1.9%) | 887 (4.0%) |
| 11:00 AM to 11:59 AM | 294 (1.1%) | 346 (1.6%) |
| 12:00 PM to 3:59 PM | 2,385 (8.6%) | 1,224 (5.5%) |
| 4:00 PM to 11:59 PM | 2,349 (8.5%) | 1,852 (8.4%) |
| Total | 27,771 (100.0%) | 22,175 (100.0%) |
Housing Occupancy in Miami County
Occupancy by Ownership in Miami County
Of the total 44,152 dwellings in Miami County, owner-occupied units account for 32,423 (73.4%), while renter-occupied units make up 11,729 (26.6%).
| Occupancy | # Housing Units | % Housing Units |
| Owner Occupied Housing Units | 32,423 | 73.4% |
| Renter-Occupied Housing Units | 11,729 | 26.6% |
| Total Occupied Housing Units | 44,152 | 100.0% |
Occupancy by Household Size in Miami County
| Household Size | # Housing Units | % Housing Units |
| 1-Person Household | 12,403 | 28.1% |
| 2-Person Household | 16,309 | 36.9% |
| 3-Person Household | 6,278 | 14.2% |
| 4+ Person Household | 9,162 | 20.7% |
| Total Housing Units | 44,152 | 100.0% |
Occupancy by Ownership by Household Size in Miami County
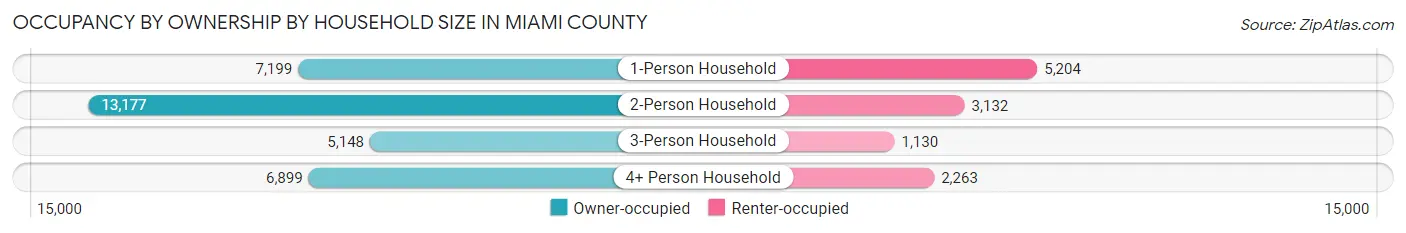
| Household Size | Owner-occupied | Renter-occupied |
| 1-Person Household | 7,199 (58.0%) | 5,204 (42.0%) |
| 2-Person Household | 13,177 (80.8%) | 3,132 (19.2%) |
| 3-Person Household | 5,148 (82.0%) | 1,130 (18.0%) |
| 4+ Person Household | 6,899 (75.3%) | 2,263 (24.7%) |
| Total Housing Units | 32,423 (73.4%) | 11,729 (26.6%) |
Occupancy by Educational Attainment in Miami County
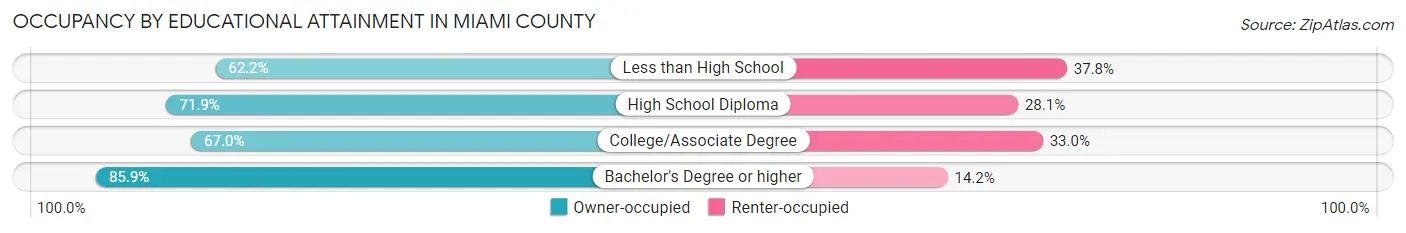
| Household Size | Owner-occupied | Renter-occupied |
| Less than High School | 1,689 (62.2%) | 1,027 (37.8%) |
| High School Diploma | 10,539 (71.9%) | 4,122 (28.1%) |
| College/Associate Degree | 9,907 (67.0%) | 4,885 (33.0%) |
| Bachelor's Degree or higher | 10,288 (85.9%) | 1,695 (14.1%) |
Occupancy by Age of Householder in Miami County
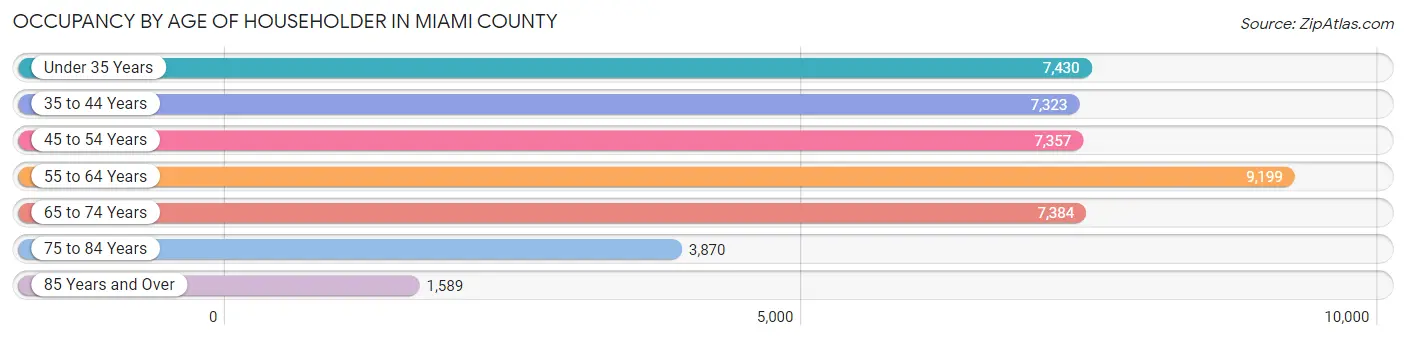
| Age Bracket | # Households | % Households |
| Under 35 Years | 7,430 | 16.8% |
| 35 to 44 Years | 7,323 | 16.6% |
| 45 to 54 Years | 7,357 | 16.7% |
| 55 to 64 Years | 9,199 | 20.8% |
| 65 to 74 Years | 7,384 | 16.7% |
| 75 to 84 Years | 3,870 | 8.8% |
| 85 Years and Over | 1,589 | 3.6% |
| Total | 44,152 | 100.0% |
Housing Finances in Miami County
Median Income by Occupancy in Miami County
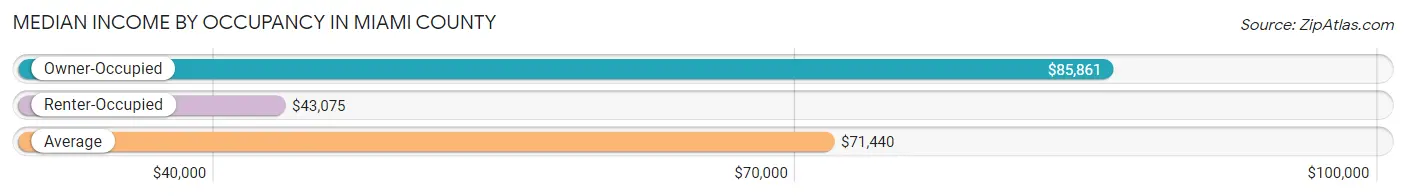
| Occupancy Type | # Households | Median Income |
| Owner-Occupied | 32,423 (73.4%) | $85,861 |
| Renter-Occupied | 11,729 (26.6%) | $43,075 |
| Average | 44,152 (100.0%) | $71,440 |
Occupancy by Householder Income Bracket in Miami County
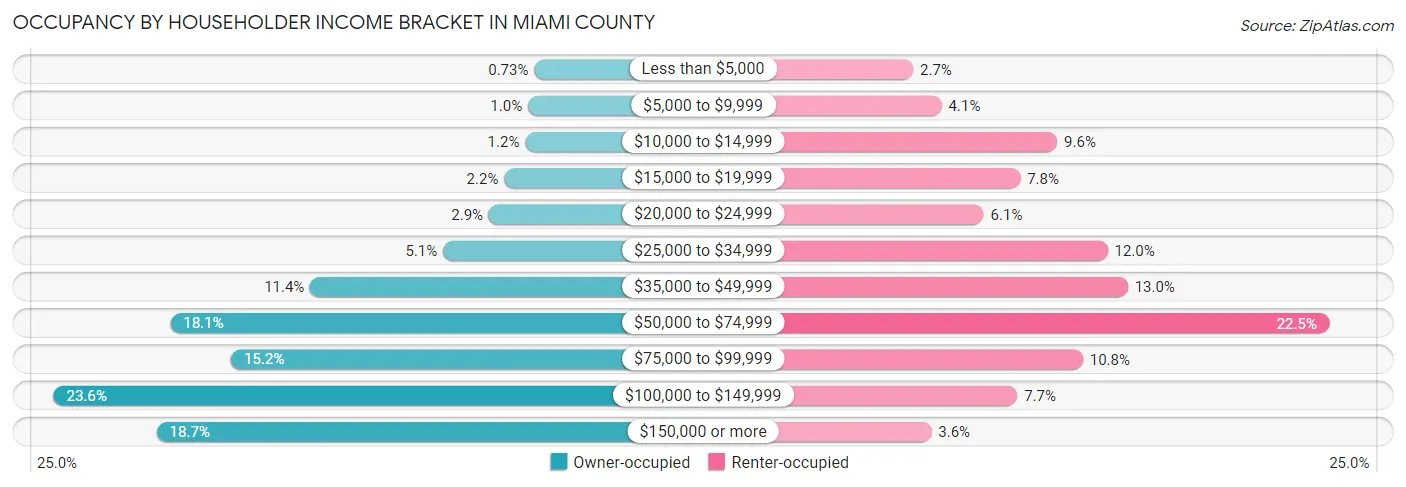
| Income Bracket | Owner-occupied | Renter-occupied |
| Less than $5,000 | 238 (0.7%) | 321 (2.7%) |
| $5,000 to $9,999 | 334 (1.0%) | 481 (4.1%) |
| $10,000 to $14,999 | 375 (1.2%) | 1,126 (9.6%) |
| $15,000 to $19,999 | 700 (2.2%) | 920 (7.8%) |
| $20,000 to $24,999 | 938 (2.9%) | 716 (6.1%) |
| $25,000 to $34,999 | 1,643 (5.1%) | 1,408 (12.0%) |
| $35,000 to $49,999 | 3,697 (11.4%) | 1,520 (13.0%) |
| $50,000 to $74,999 | 5,856 (18.1%) | 2,642 (22.5%) |
| $75,000 to $99,999 | 4,917 (15.2%) | 1,269 (10.8%) |
| $100,000 to $149,999 | 7,659 (23.6%) | 903 (7.7%) |
| $150,000 or more | 6,066 (18.7%) | 423 (3.6%) |
| Total | 32,423 (100.0%) | 11,729 (100.0%) |
Monthly Housing Cost Tiers in Miami County
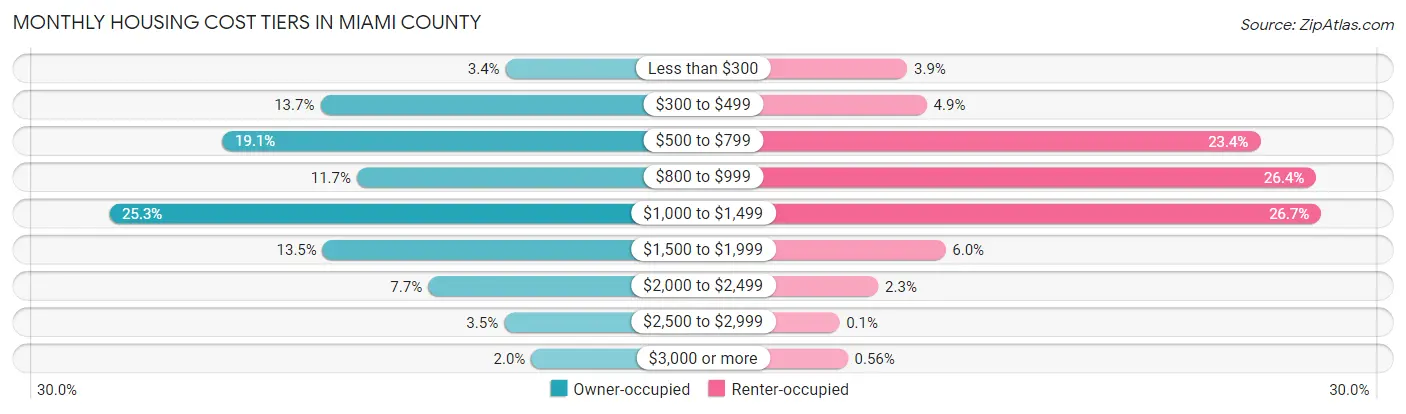
| Monthly Cost | Owner-occupied | Renter-occupied |
| Less than $300 | 1,116 (3.4%) | 451 (3.8%) |
| $300 to $499 | 4,431 (13.7%) | 578 (4.9%) |
| $500 to $799 | 6,194 (19.1%) | 2,739 (23.4%) |
| $800 to $999 | 3,777 (11.7%) | 3,101 (26.4%) |
| $1,000 to $1,499 | 8,217 (25.3%) | 3,134 (26.7%) |
| $1,500 to $1,999 | 4,391 (13.5%) | 699 (6.0%) |
| $2,000 to $2,499 | 2,502 (7.7%) | 264 (2.2%) |
| $2,500 to $2,999 | 1,140 (3.5%) | 12 (0.1%) |
| $3,000 or more | 655 (2.0%) | 66 (0.6%) |
| Total | 32,423 (100.0%) | 11,729 (100.0%) |
Physical Housing Characteristics in Miami County
Housing Structures in Miami County
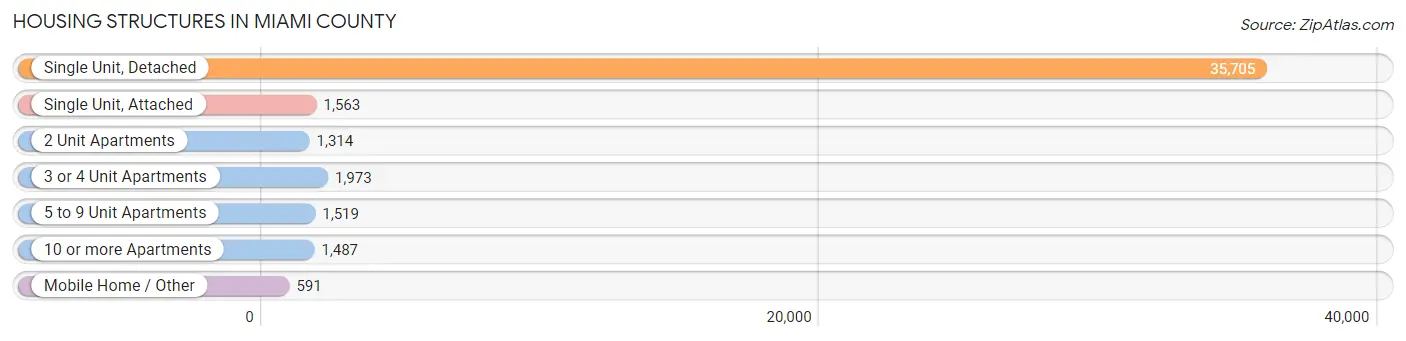
| Structure Type | # Housing Units | % Housing Units |
| Single Unit, Detached | 35,705 | 80.9% |
| Single Unit, Attached | 1,563 | 3.5% |
| 2 Unit Apartments | 1,314 | 3.0% |
| 3 or 4 Unit Apartments | 1,973 | 4.5% |
| 5 to 9 Unit Apartments | 1,519 | 3.4% |
| 10 or more Apartments | 1,487 | 3.4% |
| Mobile Home / Other | 591 | 1.3% |
| Total | 44,152 | 100.0% |
Housing Structures by Occupancy in Miami County
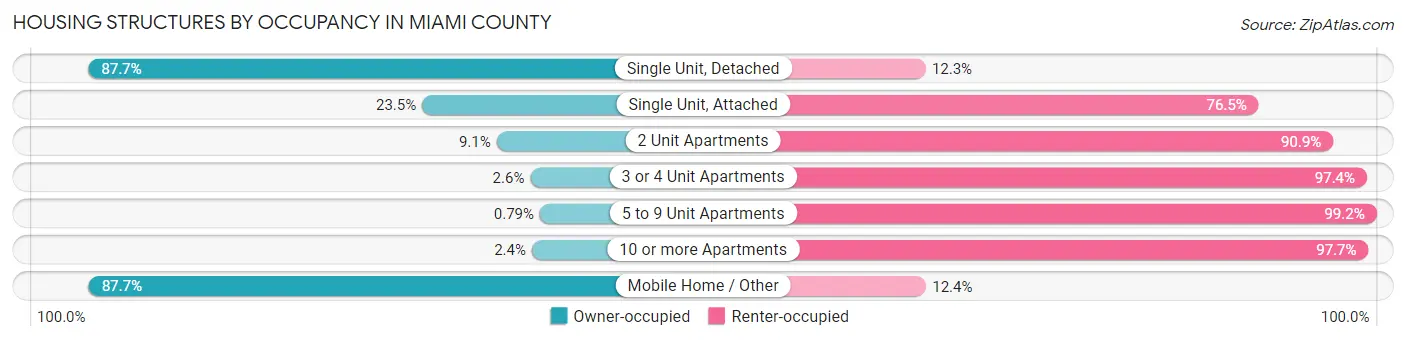
| Structure Type | Owner-occupied | Renter-occupied |
| Single Unit, Detached | 31,319 (87.7%) | 4,386 (12.3%) |
| Single Unit, Attached | 367 (23.5%) | 1,196 (76.5%) |
| 2 Unit Apartments | 120 (9.1%) | 1,194 (90.9%) |
| 3 or 4 Unit Apartments | 52 (2.6%) | 1,921 (97.4%) |
| 5 to 9 Unit Apartments | 12 (0.8%) | 1,507 (99.2%) |
| 10 or more Apartments | 35 (2.4%) | 1,452 (97.7%) |
| Mobile Home / Other | 518 (87.6%) | 73 (12.3%) |
| Total | 32,423 (73.4%) | 11,729 (26.6%) |
Housing Structures by Number of Rooms in Miami County
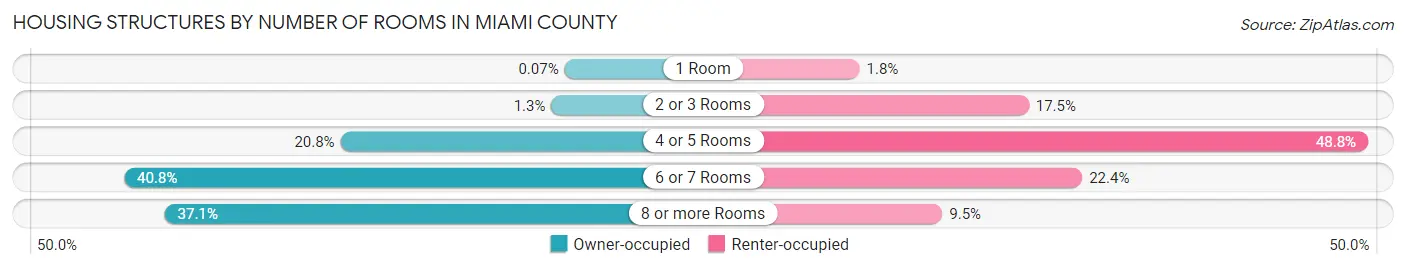
| Number of Rooms | Owner-occupied | Renter-occupied |
| 1 Room | 23 (0.1%) | 213 (1.8%) |
| 2 or 3 Rooms | 419 (1.3%) | 2,049 (17.5%) |
| 4 or 5 Rooms | 6,740 (20.8%) | 5,727 (48.8%) |
| 6 or 7 Rooms | 13,227 (40.8%) | 2,629 (22.4%) |
| 8 or more Rooms | 12,014 (37.0%) | 1,111 (9.5%) |
| Total | 32,423 (100.0%) | 11,729 (100.0%) |
Housing Structure by Heating Type in Miami County
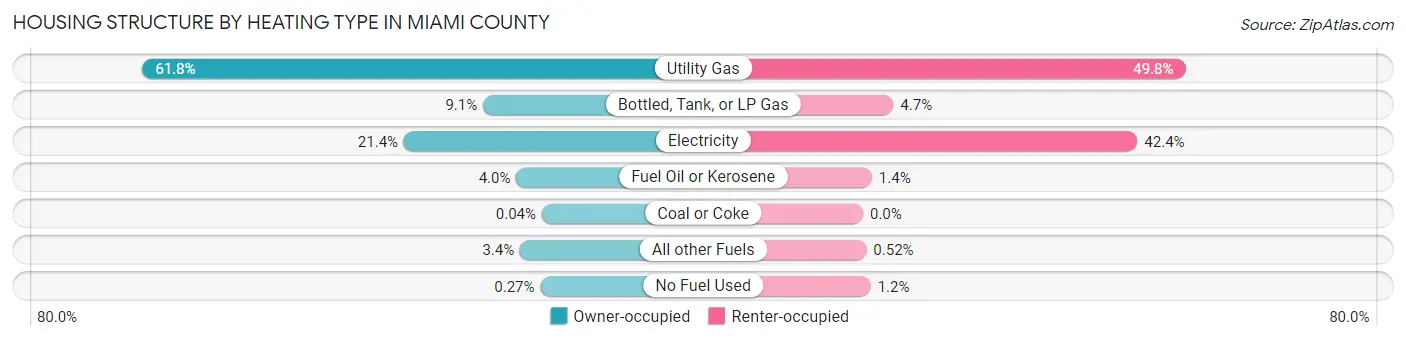
| Heating Type | Owner-occupied | Renter-occupied |
| Utility Gas | 20,039 (61.8%) | 5,843 (49.8%) |
| Bottled, Tank, or LP Gas | 2,960 (9.1%) | 550 (4.7%) |
| Electricity | 6,924 (21.4%) | 4,974 (42.4%) |
| Fuel Oil or Kerosene | 1,293 (4.0%) | 161 (1.4%) |
| Coal or Coke | 12 (0.0%) | 0 (0.0%) |
| All other Fuels | 1,107 (3.4%) | 61 (0.5%) |
| No Fuel Used | 88 (0.3%) | 140 (1.2%) |
| Total | 32,423 (100.0%) | 11,729 (100.0%) |
Household Vehicle Usage in Miami County
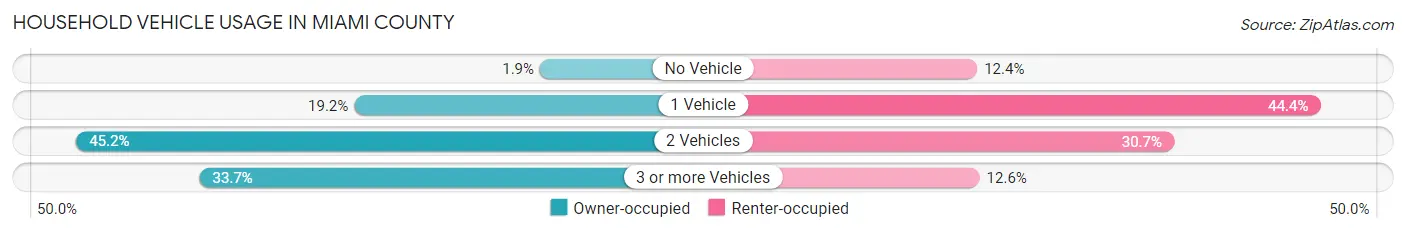
| Vehicles per Household | Owner-occupied | Renter-occupied |
| No Vehicle | 616 (1.9%) | 1,449 (12.3%) |
| 1 Vehicle | 6,237 (19.2%) | 5,204 (44.4%) |
| 2 Vehicles | 14,650 (45.2%) | 3,601 (30.7%) |
| 3 or more Vehicles | 10,920 (33.7%) | 1,475 (12.6%) |
| Total | 32,423 (100.0%) | 11,729 (100.0%) |
Real Estate & Mortgages in Miami County
Real Estate and Mortgage Overview in Miami County
| Characteristic | Without Mortgage | With Mortgage |
| Housing Units | 11,093 | 21,330 |
| Median Property Value | $179,600 | $198,000 |
| Median Household Income | $62,819 | $4,727 |
| Monthly Housing Costs | $513 | $655 |
| Real Estate Taxes | $1,966 | $163 |
Property Value by Mortgage Status in Miami County
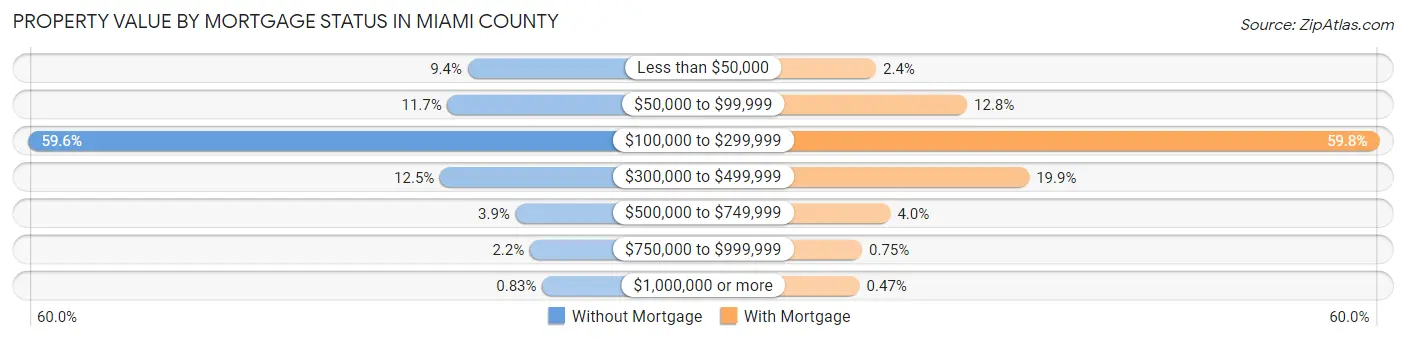
| Property Value | Without Mortgage | With Mortgage |
| Less than $50,000 | 1,037 (9.3%) | 501 (2.4%) |
| $50,000 to $99,999 | 1,293 (11.7%) | 2,720 (12.8%) |
| $100,000 to $299,999 | 6,606 (59.6%) | 12,763 (59.8%) |
| $300,000 to $499,999 | 1,388 (12.5%) | 4,234 (19.9%) |
| $500,000 to $749,999 | 430 (3.9%) | 852 (4.0%) |
| $750,000 to $999,999 | 247 (2.2%) | 160 (0.7%) |
| $1,000,000 or more | 92 (0.8%) | 100 (0.5%) |
| Total | 11,093 (100.0%) | 21,330 (100.0%) |
Household Income by Mortgage Status in Miami County
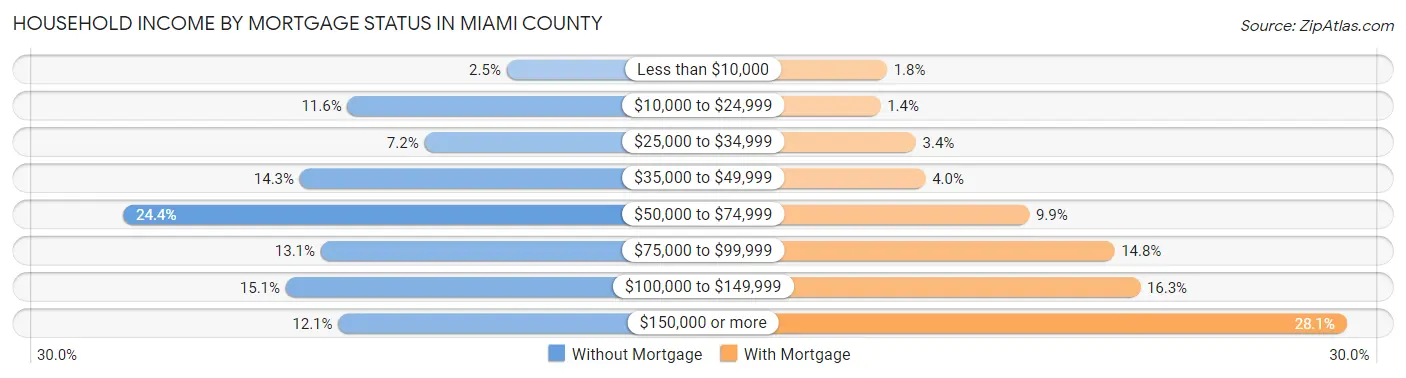
| Household Income | Without Mortgage | With Mortgage |
| Less than $10,000 | 272 (2.5%) | 380 (1.8%) |
| $10,000 to $24,999 | 1,281 (11.6%) | 300 (1.4%) |
| $25,000 to $34,999 | 793 (7.1%) | 732 (3.4%) |
| $35,000 to $49,999 | 1,583 (14.3%) | 850 (4.0%) |
| $50,000 to $74,999 | 2,703 (24.4%) | 2,114 (9.9%) |
| $75,000 to $99,999 | 1,450 (13.1%) | 3,153 (14.8%) |
| $100,000 to $149,999 | 1,672 (15.1%) | 3,467 (16.3%) |
| $150,000 or more | 1,339 (12.1%) | 5,987 (28.1%) |
| Total | 11,093 (100.0%) | 21,330 (100.0%) |
Property Value to Household Income Ratio in Miami County
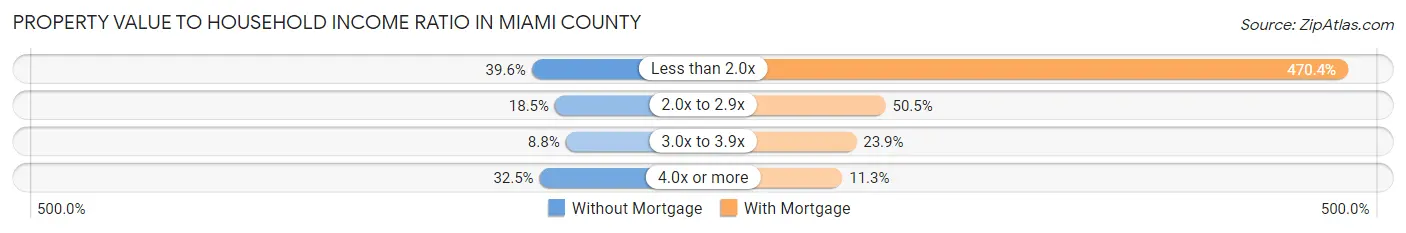
| Value-to-Income Ratio | Without Mortgage | With Mortgage |
| Less than 2.0x | 4,388 (39.6%) | 100,328 (470.4%) |
| 2.0x to 2.9x | 2,051 (18.5%) | 10,778 (50.5%) |
| 3.0x to 3.9x | 979 (8.8%) | 5,106 (23.9%) |
| 4.0x or more | 3,605 (32.5%) | 2,400 (11.3%) |
| Total | 11,093 (100.0%) | 21,330 (100.0%) |
Real Estate Taxes by Mortgage Status in Miami County
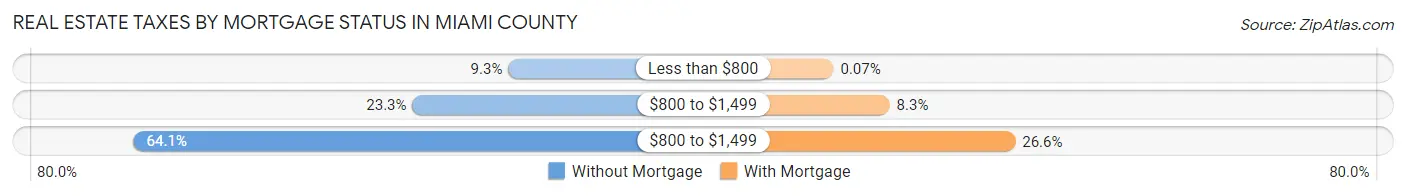
| Property Taxes | Without Mortgage | With Mortgage |
| Less than $800 | 1,035 (9.3%) | 15 (0.1%) |
| $800 to $1,499 | 2,589 (23.3%) | 1,763 (8.3%) |
| $800 to $1,499 | 7,106 (64.1%) | 5,680 (26.6%) |
| Total | 11,093 (100.0%) | 21,330 (100.0%) |
Health & Disability in Miami County
Health Insurance Coverage by Age in Miami County
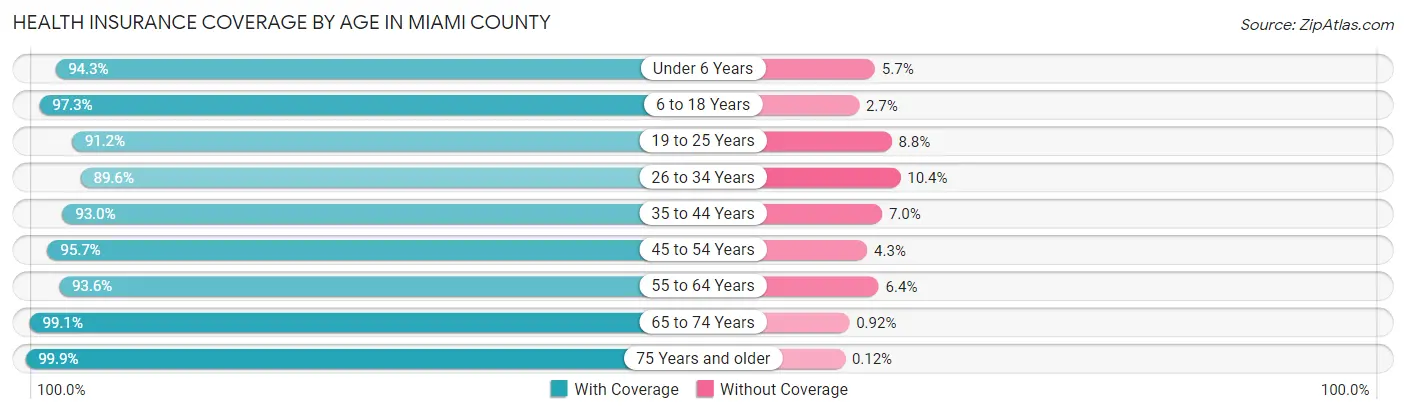
| Age Bracket | With Coverage | Without Coverage |
| Under 6 Years | 7,149 (94.3%) | 433 (5.7%) |
| 6 to 18 Years | 18,260 (97.3%) | 514 (2.7%) |
| 19 to 25 Years | 7,603 (91.2%) | 734 (8.8%) |
| 26 to 34 Years | 9,852 (89.6%) | 1,149 (10.4%) |
| 35 to 44 Years | 12,625 (93.0%) | 954 (7.0%) |
| 45 to 54 Years | 12,965 (95.7%) | 577 (4.3%) |
| 55 to 64 Years | 13,861 (93.6%) | 949 (6.4%) |
| 65 to 74 Years | 11,801 (99.1%) | 109 (0.9%) |
| 75 Years and older | 8,184 (99.9%) | 10 (0.1%) |
| Total | 102,300 (95.0%) | 5,429 (5.0%) |
Health Insurance Coverage by Citizenship Status in Miami County
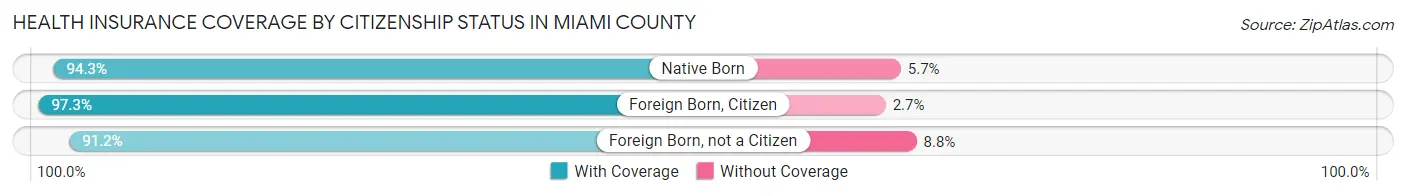
| Citizenship Status | With Coverage | Without Coverage |
| Native Born | 7,149 (94.3%) | 433 (5.7%) |
| Foreign Born, Citizen | 18,260 (97.3%) | 514 (2.7%) |
| Foreign Born, not a Citizen | 7,603 (91.2%) | 734 (8.8%) |
Health Insurance Coverage by Household Income in Miami County
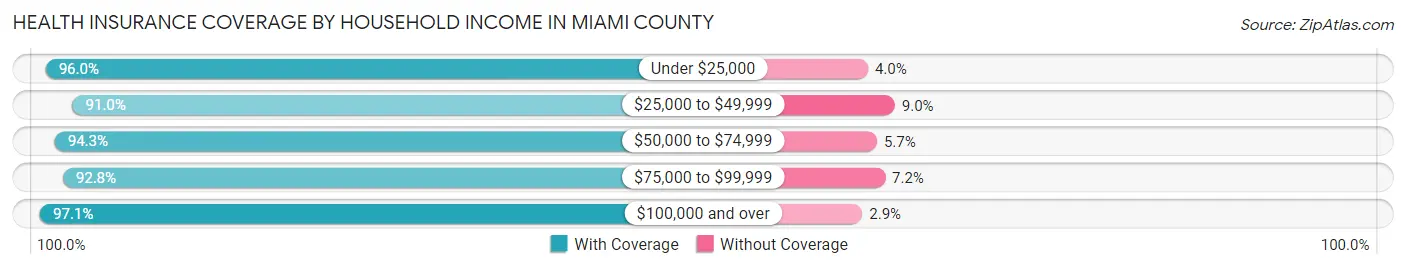
| Household Income | With Coverage | Without Coverage |
| Under $25,000 | 8,741 (96.0%) | 360 (4.0%) |
| $25,000 to $49,999 | 13,987 (91.0%) | 1,384 (9.0%) |
| $50,000 to $74,999 | 18,736 (94.3%) | 1,124 (5.7%) |
| $75,000 to $99,999 | 15,583 (92.8%) | 1,203 (7.2%) |
| $100,000 and over | 45,133 (97.1%) | 1,355 (2.9%) |
Public vs Private Health Insurance Coverage by Age in Miami County
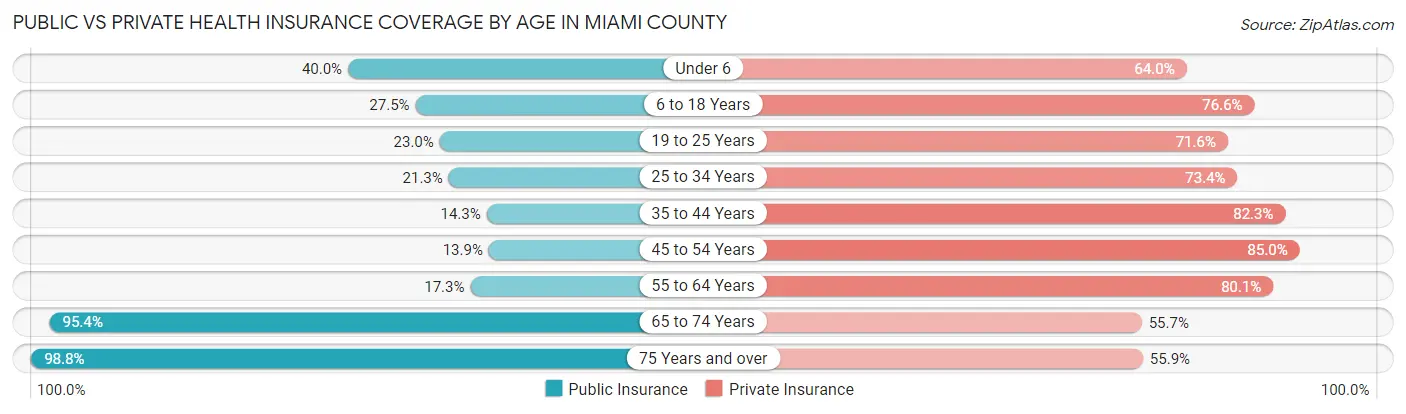
| Age Bracket | Public Insurance | Private Insurance |
| Under 6 | 3,031 (40.0%) | 4,851 (64.0%) |
| 6 to 18 Years | 5,156 (27.5%) | 14,378 (76.6%) |
| 19 to 25 Years | 1,915 (23.0%) | 5,972 (71.6%) |
| 25 to 34 Years | 2,343 (21.3%) | 8,077 (73.4%) |
| 35 to 44 Years | 1,935 (14.2%) | 11,177 (82.3%) |
| 45 to 54 Years | 1,875 (13.9%) | 11,506 (85.0%) |
| 55 to 64 Years | 2,558 (17.3%) | 11,859 (80.1%) |
| 65 to 74 Years | 11,358 (95.4%) | 6,630 (55.7%) |
| 75 Years and over | 8,093 (98.8%) | 4,580 (55.9%) |
| Total | 38,264 (35.5%) | 79,030 (73.4%) |
Disability Status by Sex by Age in Miami County
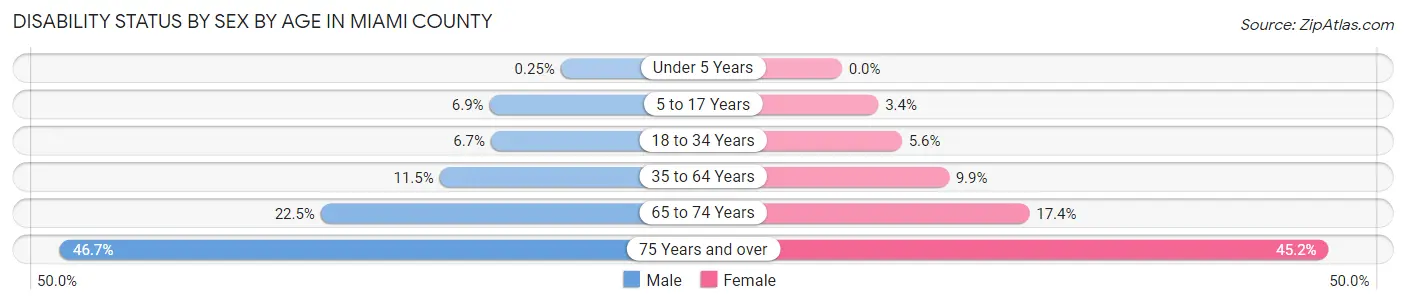
| Age Bracket | Male | Female |
| Under 5 Years | 8 (0.3%) | 0 (0.0%) |
| 5 to 17 Years | 665 (6.9%) | 304 (3.4%) |
| 18 to 34 Years | 714 (6.7%) | 566 (5.6%) |
| 35 to 64 Years | 2,426 (11.5%) | 2,065 (9.9%) |
| 65 to 74 Years | 1,275 (22.5%) | 1,087 (17.4%) |
| 75 Years and over | 1,606 (46.7%) | 2,148 (45.2%) |
Disability Class by Sex by Age in Miami County
Disability Class: Hearing Difficulty
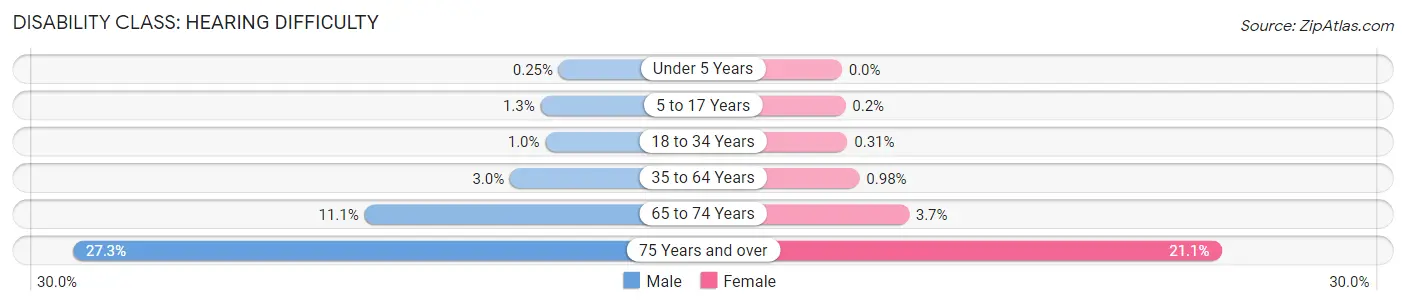
| Age Bracket | Male | Female |
| Under 5 Years | 8 (0.3%) | 0 (0.0%) |
| 5 to 17 Years | 123 (1.3%) | 18 (0.2%) |
| 18 to 34 Years | 106 (1.0%) | 32 (0.3%) |
| 35 to 64 Years | 626 (3.0%) | 205 (1.0%) |
| 65 to 74 Years | 627 (11.1%) | 233 (3.7%) |
| 75 Years and over | 939 (27.3%) | 1,005 (21.1%) |
Disability Class: Vision Difficulty
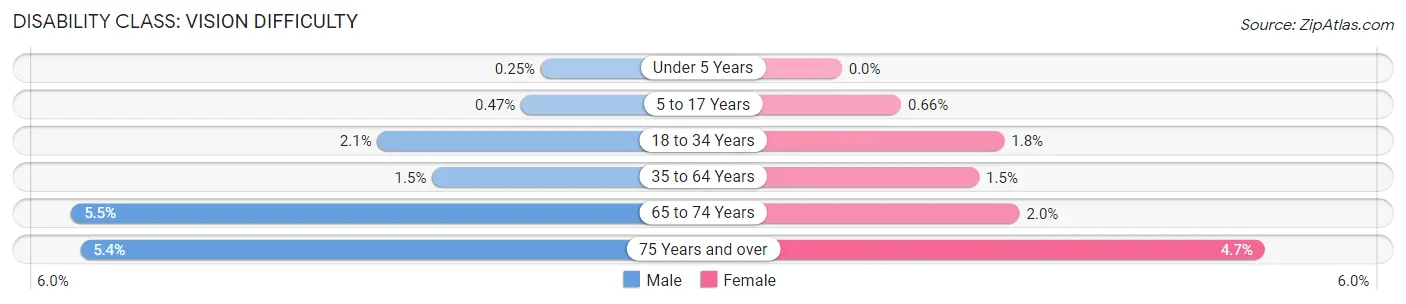
| Age Bracket | Male | Female |
| Under 5 Years | 8 (0.3%) | 0 (0.0%) |
| 5 to 17 Years | 46 (0.5%) | 59 (0.7%) |
| 18 to 34 Years | 220 (2.1%) | 184 (1.8%) |
| 35 to 64 Years | 309 (1.5%) | 319 (1.5%) |
| 65 to 74 Years | 310 (5.5%) | 124 (2.0%) |
| 75 Years and over | 185 (5.4%) | 224 (4.7%) |
Disability Class: Cognitive Difficulty
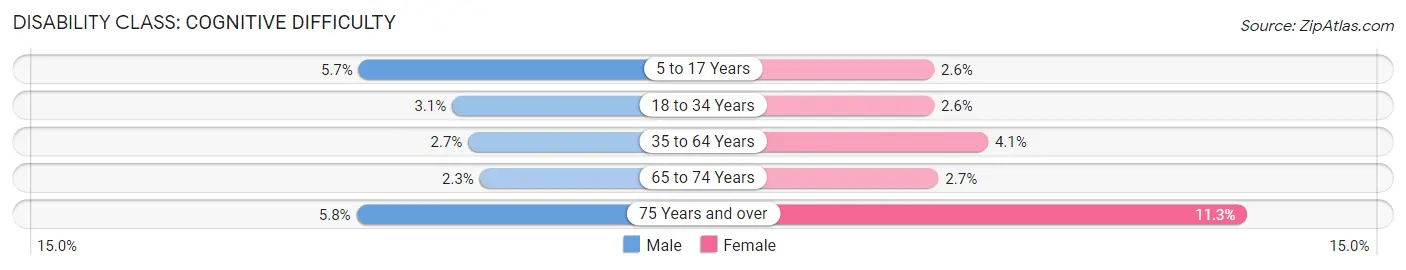
| Age Bracket | Male | Female |
| 5 to 17 Years | 552 (5.7%) | 231 (2.6%) |
| 18 to 34 Years | 329 (3.1%) | 262 (2.6%) |
| 35 to 64 Years | 559 (2.6%) | 847 (4.1%) |
| 65 to 74 Years | 132 (2.3%) | 168 (2.7%) |
| 75 Years and over | 198 (5.8%) | 537 (11.3%) |
Disability Class: Ambulatory Difficulty
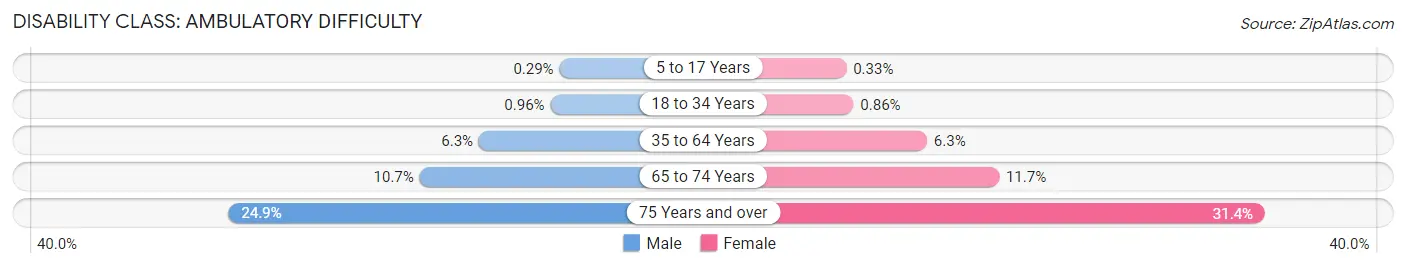
| Age Bracket | Male | Female |
| 5 to 17 Years | 28 (0.3%) | 30 (0.3%) |
| 18 to 34 Years | 102 (1.0%) | 88 (0.9%) |
| 35 to 64 Years | 1,323 (6.3%) | 1,316 (6.3%) |
| 65 to 74 Years | 604 (10.7%) | 729 (11.7%) |
| 75 Years and over | 855 (24.9%) | 1,494 (31.4%) |
Disability Class: Self-Care Difficulty
| Age Bracket | Male | Female |
| 5 to 17 Years | 85 (0.9%) | 54 (0.6%) |
| 18 to 34 Years | 68 (0.6%) | 51 (0.5%) |
| 35 to 64 Years | 356 (1.7%) | 323 (1.5%) |
| 65 to 74 Years | 109 (1.9%) | 278 (4.4%) |
| 75 Years and over | 236 (6.9%) | 448 (9.4%) |
Technology Access in Miami County
Computing Device Access in Miami County
| Device Type | # Households | % Households |
| Desktop or Laptop | 35,130 | 79.6% |
| Smartphone | 37,724 | 85.4% |
| Tablet | 27,871 | 63.1% |
| No Computing Device | 2,808 | 6.4% |
| Total | 44,152 | 100.0% |
Internet Access in Miami County
| Internet Type | # Households | % Households |
| Dial-Up Internet | 141 | 0.3% |
| Broadband Home | 33,295 | 75.4% |
| Cellular Data Only | 4,440 | 10.1% |
| Satellite Internet | 2,346 | 5.3% |
| No Internet | 4,610 | 10.4% |
| Total | 44,152 | 100.0% |
Miami County Summary
History
Miami County, Ohio is located in the western part of the state and is part of the Dayton metropolitan area. The county was established in 1807 and named after the Miami Indians, who were the original inhabitants of the area. The county seat is Troy, which was founded in 1807 and is the largest city in the county.
The first settlers in the area were Quakers from North Carolina, who arrived in the early 1800s. They were followed by German immigrants in the mid-1800s, who established many of the towns and villages in the county. The county was an important agricultural center in the 19th century, with many of the towns and villages being built around the production of wheat, corn, and other crops.
The county was also an important center of industry in the late 19th and early 20th centuries. The Miami and Erie Canal, which ran through the county, was an important transportation route for goods and people. The county was also home to several factories, including the Troy Manufacturing Company, which produced agricultural equipment, and the Troy Iron Works, which produced iron products.
The county was also an important center of education in the 19th and early 20th centuries. The Troy Female Seminary, founded in 1837, was the first college for women in the state of Ohio. The county also had several other colleges and universities, including the Miami University of Ohio, which was founded in 1809.
Geography
Miami County is located in the western part of the state of Ohio, and is part of the Dayton metropolitan area. The county is bordered by Montgomery County to the north, Darke County to the east, Shelby County to the south, and Preble County to the west. The county covers an area of 437 square miles, and is home to a population of over 101,000 people.
The county is mostly flat, with some rolling hills in the northern and eastern parts of the county. The Great Miami River runs through the county, and is a major source of recreation for the area. The county is also home to several state parks, including the John Bryan State Park, the Miami Whitewater Forest, and the Hueston Woods State Park.
Economy
Miami County is an important center of industry and commerce in the Dayton metropolitan area. The county is home to several large companies, including the Honda of America Manufacturing plant in Troy, which produces automobiles and other products. The county is also home to several other manufacturing companies, including the Troy Manufacturing Company, which produces agricultural equipment, and the Troy Iron Works, which produces iron products.
The county is also home to several large retail stores, including the Miami Valley Mall in Troy, which is the largest shopping center in the county. The county is also home to several other retail stores, including the Miami Valley Shopping Center in Piqua, and the Miami Valley Marketplace in Tipp City.
The county is also home to several educational institutions, including the Miami University of Ohio, which is the largest university in the county. The county is also home to several other colleges and universities, including the Troy Female Seminary, which was the first college for women in the state of Ohio.
Demographics
As of the 2010 census, the population of Miami County was 101,497, making it the fourth most populous county in the state of Ohio. The population is spread out over an area of 437 square miles, giving the county a population density of 231 people per square mile.
The racial makeup of the county is 90.3% White, 4.2% African American, 0.5% Native American, 1.3% Asian, 0.1% Pacific Islander, 1.7% from other races, and 1.9% from two or more races. The median household income in the county is $50,945, and the median family income is $60,945. The per capita income in the county is $25,845.
Common Questions
What is the Total Population of Miami County?
Total Population of Miami County is 108,818.
What is the Total Male Population of Miami County?
Total Male Population of Miami County is 54,232.
What is the Total Female Population of Miami County?
Total Female Population of Miami County is 54,586.
What is the Ratio of Males per 100 Females in Miami County?
There are 99.35 Males per 100 Females in Miami County.
What is the Ratio of Females per 100 Males in Miami County?
There are 100.65 Females per 100 Males in Miami County.
What is the Median Population Age in Miami County?
Median Population Age in Miami County is 41.1 Years.
What is the Average Family Size in Miami County
Average Family Size in Miami County is 3.0 People.
What is the Average Household Size in Miami County
Average Household Size in Miami County is 2.4 People.
What is Per Capita Income in Miami County?
Per Capita income in Miami County is $37,701.
What is the Median Family Income in Miami County?
Median Family Income in Miami County is $92,126.
What is the Median Household income in Miami County?
Median Household Income in Miami County is $71,440.
What is Income or Wage Gap in Miami County?
Income or Wage Gap in Miami County is 35.5%.
Women in Miami County earn 64.5 cents for every dollar earned by a man.
What is Family Income Deficit in Miami County?
Family Income Deficit in Miami County is $13,025.
Families that are below poverty line in Miami County earn $13,025 less on average than the poverty threshold level.
What is Inequality or Gini Index in Miami County?
Inequality or Gini Index in Miami County is 0.42.
How Large is the Labor Force in Miami County?
There are 56,634 People in the Labor Forcein in Miami County.
What is the Percentage of People in the Labor Force in Miami County?
65.0% of People are in the Labor Force in Miami County.
What is the Unemployment Rate in Miami County?
Unemployment Rate in Miami County is 3.4%.