Medina County, OH
Medina County Overview
182,347
TOTAL POPULATION
90,831
MALE POPULATION
91,516
FEMALE POPULATION
99.25
MALES / 100 FEMALES
100.75
FEMALES / 100 MALES
42.7
MEDIAN AGE
3.0
AVG FAMILY SIZE
2.5
AVG HOUSEHOLD SIZE
$45,038
PER CAPITA INCOME
$108,701
AVG FAMILY INCOME
$89,968
AVG HOUSEHOLD INCOME
37.6%
WAGE / INCOME GAP [ % ]
62.4¢/ $1
WAGE / INCOME GAP [ $ ]
$11,323
FAMILY INCOME DEFICIT
0.42
INEQUALITY / GINI INDEX
99,362
LABOR FORCE [ PEOPLE ]
67.2%
PERCENT IN LABOR FORCE
3.0%
UNEMPLOYMENT RATE
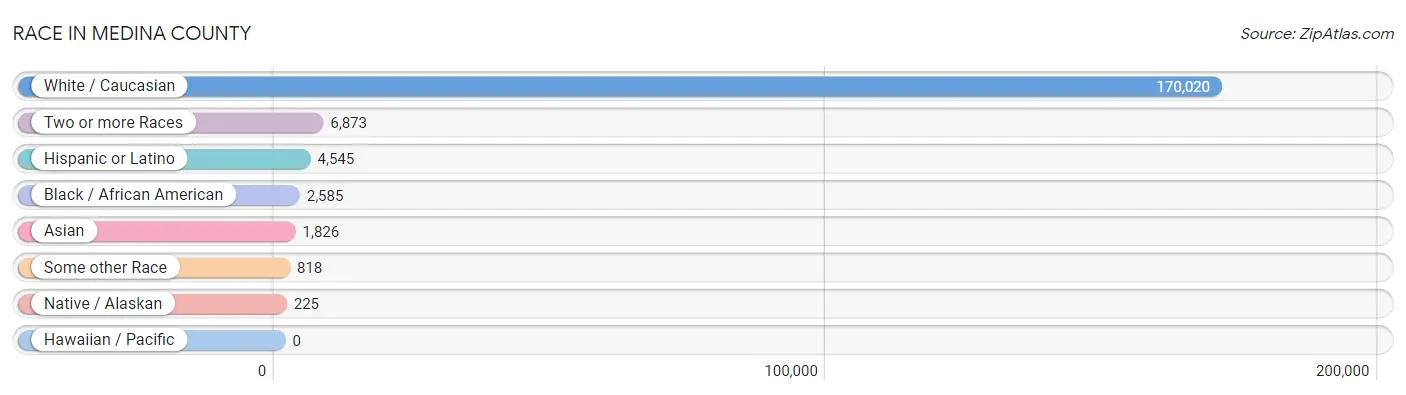
Race in Medina County
The most populous races in Medina County are White / Caucasian (170,020 | 93.2%), Two or more Races (6,873 | 3.8%), and Hispanic or Latino (4,545 | 2.5%).
| Race | # Population | % Population |
| Asian | 1,826 | 1.0% |
| Black / African American | 2,585 | 1.4% |
| Hawaiian / Pacific | 0 | 0.0% |
| Hispanic or Latino | 4,545 | 2.5% |
| Native / Alaskan | 225 | 0.1% |
| White / Caucasian | 170,020 | 93.2% |
| Two or more Races | 6,873 | 3.8% |
| Some other Race | 818 | 0.4% |
| Total | 182,347 | 100.0% |
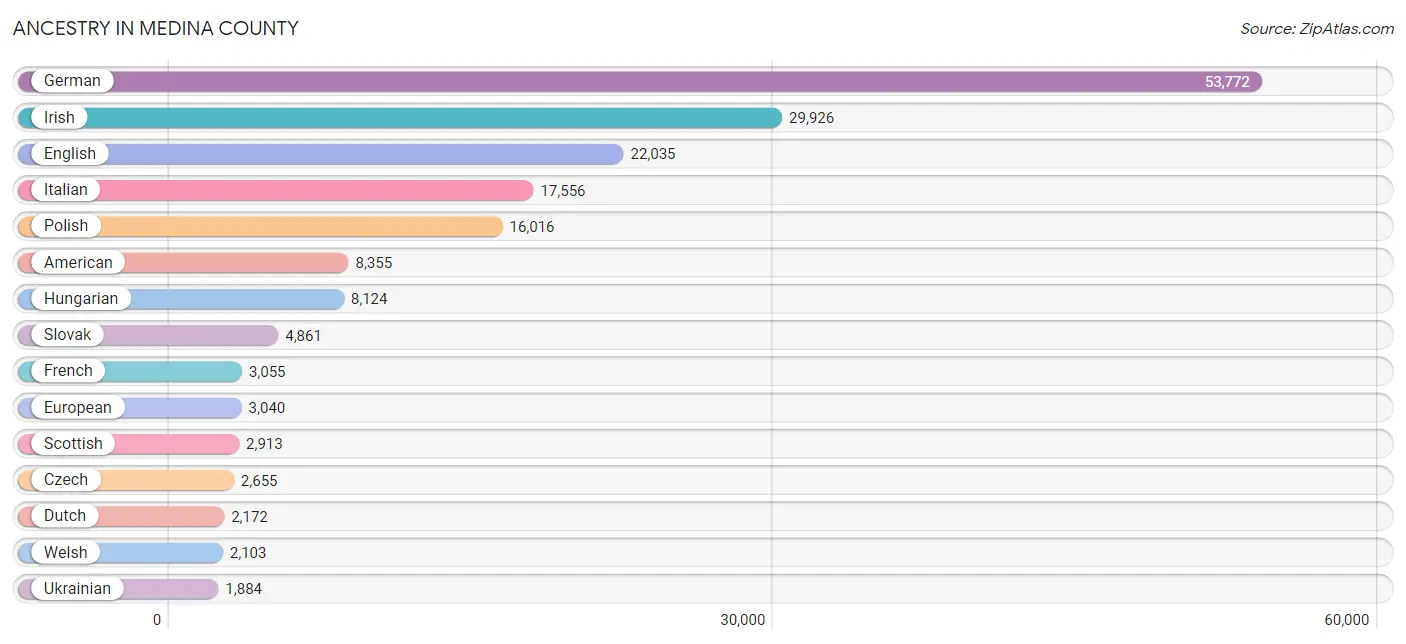
Ancestry in Medina County
The most populous ancestries reported in Medina County are German (53,772 | 29.5%), Irish (29,926 | 16.4%), English (22,035 | 12.1%), Italian (17,556 | 9.6%), and Polish (16,016 | 8.8%), together accounting for 76.4% of all Medina County residents.
| Ancestry | # Population | % Population |
| African | 414 | 0.2% |
| Albanian | 51 | 0.0% |
| American | 8,355 | 4.6% |
| Apache | 9 | 0.0% |
| Arab | 1,723 | 0.9% |
| Argentinean | 89 | 0.1% |
| Armenian | 189 | 0.1% |
| Australian | 41 | 0.0% |
| Austrian | 471 | 0.3% |
| Belgian | 113 | 0.1% |
| Bhutanese | 412 | 0.2% |
| Blackfeet | 79 | 0.0% |
| Brazilian | 65 | 0.0% |
| British | 724 | 0.4% |
| Bulgarian | 175 | 0.1% |
| Burmese | 99 | 0.1% |
| Canadian | 373 | 0.2% |
| Carpatho Rusyn | 13 | 0.0% |
| Celtic | 41 | 0.0% |
| Central American | 368 | 0.2% |
| Central American Indian | 38 | 0.0% |
| Cherokee | 337 | 0.2% |
| Chippewa | 58 | 0.0% |
| Choctaw | 3 | 0.0% |
| Colombian | 118 | 0.1% |
| Costa Rican | 25 | 0.0% |
| Cree | 5 | 0.0% |
| Croatian | 775 | 0.4% |
| Cuban | 124 | 0.1% |
| Czech | 2,655 | 1.5% |
| Czechoslovakian | 524 | 0.3% |
| Danish | 327 | 0.2% |
| Dominican | 98 | 0.1% |
| Dutch | 2,172 | 1.2% |
| Eastern European | 1,307 | 0.7% |
| Ecuadorian | 14 | 0.0% |
| Egyptian | 38 | 0.0% |
| English | 22,035 | 12.1% |
| Estonian | 15 | 0.0% |
| Ethiopian | 4 | 0.0% |
| European | 3,040 | 1.7% |
| Finnish | 306 | 0.2% |
| French | 3,055 | 1.7% |
| French Canadian | 273 | 0.2% |
| German | 53,772 | 29.5% |
| Greek | 1,333 | 0.7% |
| Guatemalan | 48 | 0.0% |
| Guyanese | 12 | 0.0% |
| Honduran | 36 | 0.0% |
| Hungarian | 8,124 | 4.5% |
| Icelander | 35 | 0.0% |
| Indian (Asian) | 381 | 0.2% |
| Indonesian | 8 | 0.0% |
| Irish | 29,926 | 16.4% |
| Italian | 17,556 | 9.6% |
| Jamaican | 32 | 0.0% |
| Japanese | 17 | 0.0% |
| Korean | 1,284 | 0.7% |
| Laotian | 12 | 0.0% |
| Latvian | 148 | 0.1% |
| Lebanese | 1,142 | 0.6% |
| Liberian | 11 | 0.0% |
| Lithuanian | 411 | 0.2% |
| Luxembourger | 9 | 0.0% |
| Macedonian | 25 | 0.0% |
| Malaysian | 18 | 0.0% |
| Mexican | 1,590 | 0.9% |
| Mongolian | 4 | 0.0% |
| Native Hawaiian | 58 | 0.0% |
| Navajo | 1 | 0.0% |
| New Zealander | 7 | 0.0% |
| Nicaraguan | 88 | 0.1% |
| Nigerian | 168 | 0.1% |
| Northern European | 205 | 0.1% |
| Norwegian | 971 | 0.5% |
| Pakistani | 26 | 0.0% |
| Palestinian | 455 | 0.3% |
| Panamanian | 28 | 0.0% |
| Pennsylvania German | 509 | 0.3% |
| Peruvian | 77 | 0.0% |
| Polish | 16,016 | 8.8% |
| Portuguese | 146 | 0.1% |
| Puerto Rican | 1,493 | 0.8% |
| Romanian | 457 | 0.3% |
| Russian | 1,367 | 0.7% |
| Salvadoran | 143 | 0.1% |
| Scandinavian | 190 | 0.1% |
| Scotch-Irish | 1,614 | 0.9% |
| Scottish | 2,913 | 1.6% |
| Serbian | 1,005 | 0.5% |
| Sioux | 17 | 0.0% |
| Slavic | 201 | 0.1% |
| Slovak | 4,861 | 2.7% |
| Slovene | 1,559 | 0.9% |
| South American | 352 | 0.2% |
| Spaniard | 222 | 0.1% |
| Spanish | 158 | 0.1% |
| Sri Lankan | 157 | 0.1% |
| Subsaharan African | 681 | 0.4% |
| Swedish | 1,083 | 0.6% |
| Swiss | 1,529 | 0.8% |
| Syrian | 41 | 0.0% |
| Thai | 1,013 | 0.6% |
| Tongan | 6 | 0.0% |
| Ukrainian | 1,884 | 1.0% |
| Venezuelan | 54 | 0.0% |
| Welsh | 2,103 | 1.1% |
| West Indian | 13 | 0.0% |
| Yugoslavian | 301 | 0.2% | View All 109 Rows |
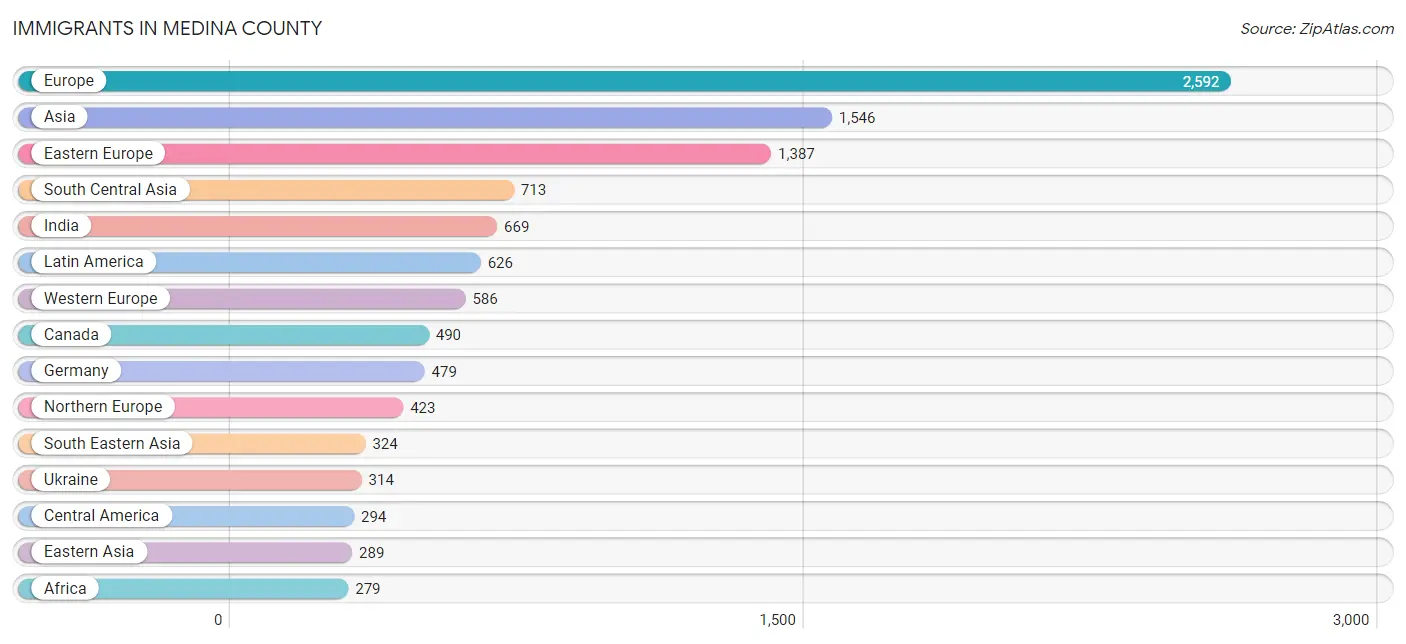
Immigrants in Medina County
The most numerous immigrant groups reported in Medina County came from Europe (2,592 | 1.4%), Asia (1,546 | 0.9%), Eastern Europe (1,387 | 0.8%), South Central Asia (713 | 0.4%), and India (669 | 0.4%), together accounting for 3.8% of all Medina County residents.
| Immigration Origin | # Population | % Population |
| Africa | 279 | 0.2% |
| Albania | 11 | 0.0% |
| Argentina | 89 | 0.1% |
| Asia | 1,546 | 0.9% |
| Australia | 6 | 0.0% |
| Austria | 64 | 0.0% |
| Belarus | 24 | 0.0% |
| Bosnia and Herzegovina | 17 | 0.0% |
| Brazil | 24 | 0.0% |
| Bulgaria | 16 | 0.0% |
| Cambodia | 10 | 0.0% |
| Cameroon | 145 | 0.1% |
| Canada | 490 | 0.3% |
| Caribbean | 84 | 0.1% |
| Central America | 294 | 0.2% |
| China | 182 | 0.1% |
| Colombia | 23 | 0.0% |
| Croatia | 63 | 0.0% |
| Cuba | 18 | 0.0% |
| Czechoslovakia | 49 | 0.0% |
| Dominican Republic | 27 | 0.0% |
| Eastern Africa | 31 | 0.0% |
| Eastern Asia | 289 | 0.2% |
| Eastern Europe | 1,387 | 0.8% |
| Ecuador | 14 | 0.0% |
| Egypt | 56 | 0.0% |
| El Salvador | 66 | 0.0% |
| England | 247 | 0.1% |
| Ethiopia | 4 | 0.0% |
| Europe | 2,592 | 1.4% |
| France | 11 | 0.0% |
| Germany | 479 | 0.3% |
| Greece | 18 | 0.0% |
| Guatemala | 38 | 0.0% |
| Guyana | 30 | 0.0% |
| Haiti | 39 | 0.0% |
| Honduras | 16 | 0.0% |
| Hong Kong | 9 | 0.0% |
| Hungary | 36 | 0.0% |
| India | 669 | 0.4% |
| Indonesia | 12 | 0.0% |
| Ireland | 82 | 0.0% |
| Israel | 17 | 0.0% |
| Italy | 167 | 0.1% |
| Japan | 15 | 0.0% |
| Kazakhstan | 30 | 0.0% |
| Korea | 92 | 0.1% |
| Laos | 11 | 0.0% |
| Latin America | 626 | 0.3% |
| Latvia | 25 | 0.0% |
| Lebanon | 22 | 0.0% |
| Lithuania | 7 | 0.0% |
| Malaysia | 4 | 0.0% |
| Mexico | 125 | 0.1% |
| Middle Africa | 145 | 0.1% |
| Morocco | 10 | 0.0% |
| Netherlands | 32 | 0.0% |
| Nicaragua | 30 | 0.0% |
| North Macedonia | 74 | 0.0% |
| Northern Africa | 66 | 0.0% |
| Northern Europe | 423 | 0.2% |
| Oceania | 6 | 0.0% |
| Pakistan | 14 | 0.0% |
| Panama | 19 | 0.0% |
| Peru | 26 | 0.0% |
| Philippines | 212 | 0.1% |
| Poland | 157 | 0.1% |
| Romania | 171 | 0.1% |
| Russia | 199 | 0.1% |
| Scotland | 10 | 0.0% |
| Serbia | 58 | 0.0% |
| South America | 248 | 0.1% |
| South Central Asia | 713 | 0.4% |
| South Eastern Asia | 324 | 0.2% |
| Southern Europe | 196 | 0.1% |
| Spain | 11 | 0.0% |
| Syria | 14 | 0.0% |
| Thailand | 8 | 0.0% |
| Ukraine | 314 | 0.2% |
| Venezuela | 42 | 0.0% |
| Vietnam | 52 | 0.0% |
| Western Africa | 37 | 0.0% |
| Western Asia | 67 | 0.0% |
| Western Europe | 586 | 0.3% | View All 84 Rows |
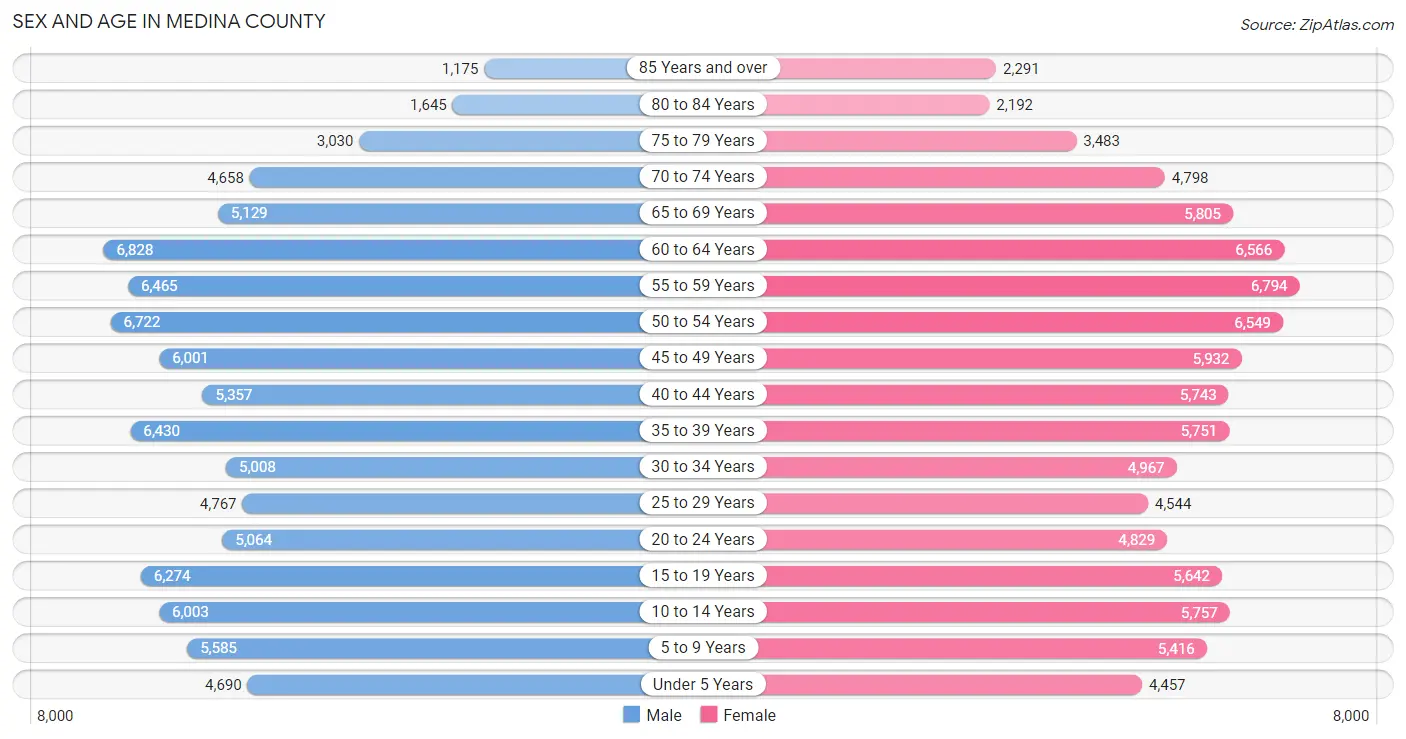
Sex and Age in Medina County
Sex and Age in Medina County
The most populous age groups in Medina County are 60 to 64 Years (6,828 | 7.5%) for men and 55 to 59 Years (6,794 | 7.4%) for women.
| Age Bracket | Male | Female |
| Under 5 Years | 4,690 (5.2%) | 4,457 (4.9%) |
| 5 to 9 Years | 5,585 (6.1%) | 5,416 (5.9%) |
| 10 to 14 Years | 6,003 (6.6%) | 5,757 (6.3%) |
| 15 to 19 Years | 6,274 (6.9%) | 5,642 (6.2%) |
| 20 to 24 Years | 5,064 (5.6%) | 4,829 (5.3%) |
| 25 to 29 Years | 4,767 (5.2%) | 4,544 (5.0%) |
| 30 to 34 Years | 5,008 (5.5%) | 4,967 (5.4%) |
| 35 to 39 Years | 6,430 (7.1%) | 5,751 (6.3%) |
| 40 to 44 Years | 5,357 (5.9%) | 5,743 (6.3%) |
| 45 to 49 Years | 6,001 (6.6%) | 5,932 (6.5%) |
| 50 to 54 Years | 6,722 (7.4%) | 6,549 (7.2%) |
| 55 to 59 Years | 6,465 (7.1%) | 6,794 (7.4%) |
| 60 to 64 Years | 6,828 (7.5%) | 6,566 (7.2%) |
| 65 to 69 Years | 5,129 (5.7%) | 5,805 (6.3%) |
| 70 to 74 Years | 4,658 (5.1%) | 4,798 (5.2%) |
| 75 to 79 Years | 3,030 (3.3%) | 3,483 (3.8%) |
| 80 to 84 Years | 1,645 (1.8%) | 2,192 (2.4%) |
| 85 Years and over | 1,175 (1.3%) | 2,291 (2.5%) |
| Total | 90,831 (100.0%) | 91,516 (100.0%) |
Families and Households in Medina County
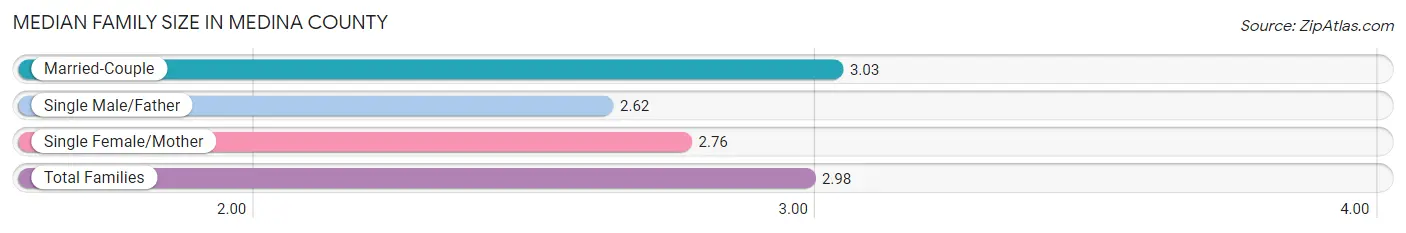
Median Family Size in Medina County
The median family size in Medina County is 2.98 persons per family, with married-couple families (42,613 | 82.7%) accounting for the largest median family size of 3.03 persons per family. On the other hand, single male/father families (3,378 | 6.6%) represent the smallest median family size with 2.62 persons per family.
| Family Type | # Families | Family Size |
| Married-Couple | 42,613 (82.7%) | 3.03 |
| Single Male/Father | 3,378 (6.6%) | 2.62 |
| Single Female/Mother | 5,540 (10.7%) | 2.76 |
| Total Families | 51,531 (100.0%) | 2.98 |
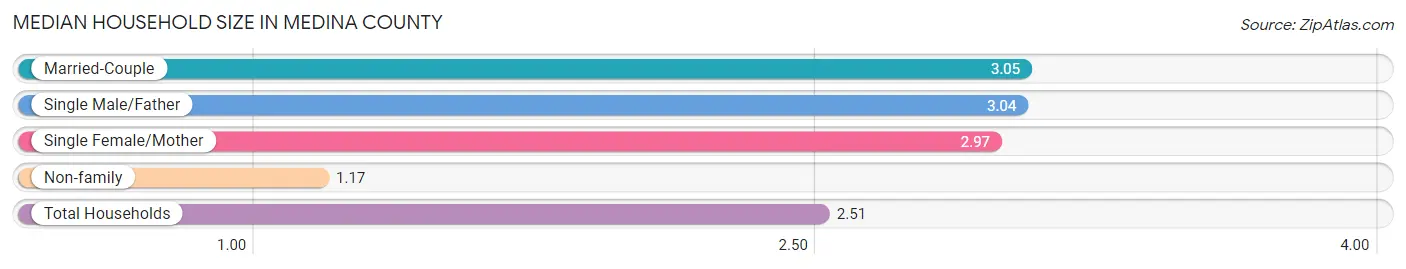
Median Household Size in Medina County
The median household size in Medina County is 2.51 persons per household, with married-couple households (42,613 | 59.1%) accounting for the largest median household size of 3.05 persons per household. non-family households (20,566 | 28.5%) represent the smallest median household size with 1.17 persons per household.
| Household Type | # Households | Household Size |
| Married-Couple | 42,613 (59.1%) | 3.05 |
| Single Male/Father | 3,378 (4.7%) | 3.04 |
| Single Female/Mother | 5,540 (7.7%) | 2.97 |
| Non-family | 20,566 (28.5%) | 1.17 |
| Total Households | 72,097 (100.0%) | 2.51 |
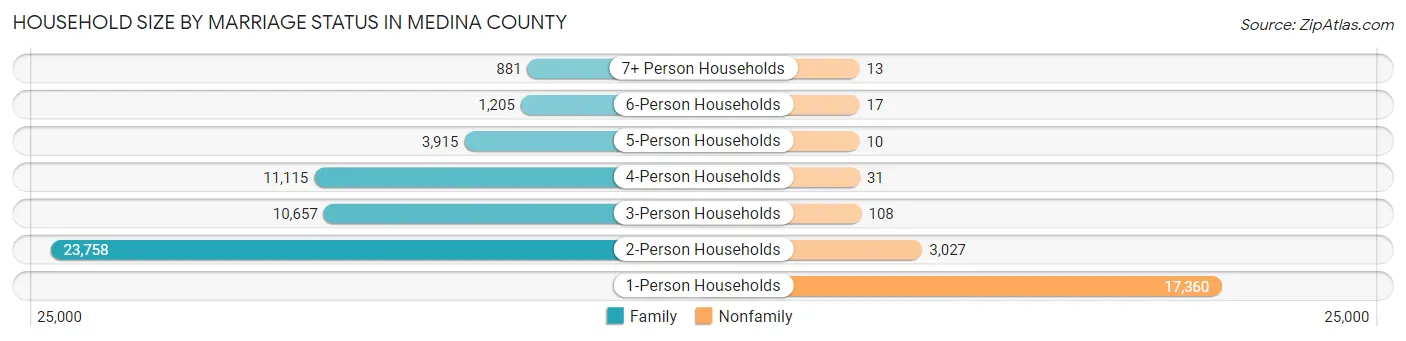
Household Size by Marriage Status in Medina County
Out of a total of 72,097 households in Medina County, 51,531 (71.5%) are family households, while 20,566 (28.5%) are nonfamily households. The most numerous type of family households are 2-person households, comprising 23,758, and the most common type of nonfamily households are 1-person households, comprising 17,360.
| Household Size | Family Households | Nonfamily Households |
| 1-Person Households | - | 17,360 (24.1%) |
| 2-Person Households | 23,758 (33.0%) | 3,027 (4.2%) |
| 3-Person Households | 10,657 (14.8%) | 108 (0.2%) |
| 4-Person Households | 11,115 (15.4%) | 31 (0.0%) |
| 5-Person Households | 3,915 (5.4%) | 10 (0.0%) |
| 6-Person Households | 1,205 (1.7%) | 17 (0.0%) |
| 7+ Person Households | 881 (1.2%) | 13 (0.0%) |
| Total | 51,531 (71.5%) | 20,566 (28.5%) |
Female Fertility in Medina County
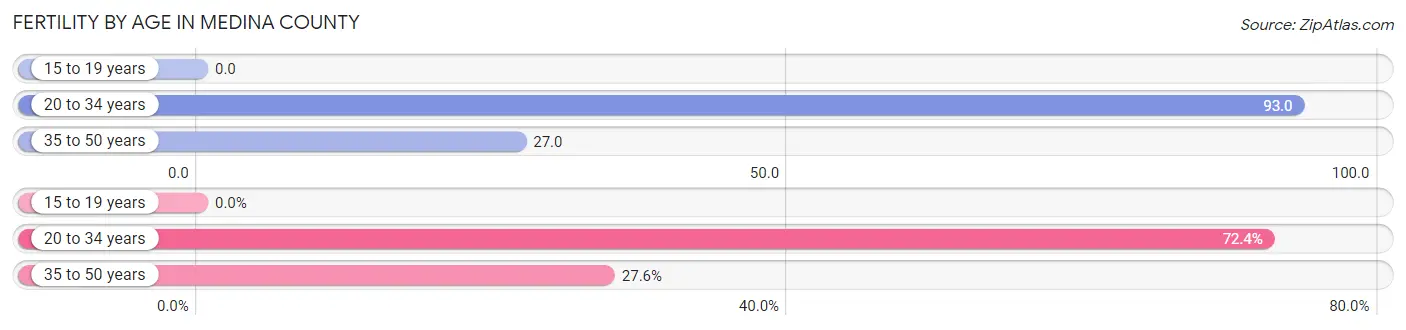
Fertility by Age in Medina County
Average fertility rate in Medina County is 48.0 births per 1,000 women. Women in the age bracket of 20 to 34 years have the highest fertility rate with 93.0 births per 1,000 women. Women in the age bracket of 20 to 34 years acount for 72.4% of all women with births.
| Age Bracket | Women with Births | Births / 1,000 Women |
| 15 to 19 years | 0 (0.0%) | 0.0 |
| 20 to 34 years | 1,340 (72.4%) | 93.0 |
| 35 to 50 years | 511 (27.6%) | 27.0 |
| Total | 1,851 (100.0%) | 48.0 |
Fertility by Age by Marriage Status in Medina County
88.9% of women with births (1,851) in Medina County are married. The highest percentage of unmarried women with births falls into 20 to 34 years age bracket with 12.2% of them unmarried at the time of birth, while the lowest percentage of unmarried women with births belong to 35 to 50 years age bracket with 8.2% of them unmarried.
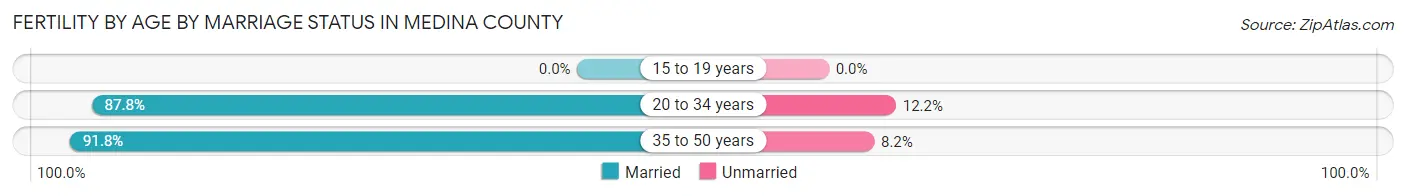
| Age Bracket | Married | Unmarried |
| 15 to 19 years | 0 (0.0%) | 0 (0.0%) |
| 20 to 34 years | 1,177 (87.8%) | 163 (12.2%) |
| 35 to 50 years | 469 (91.8%) | 42 (8.2%) |
| Total | 1,646 (88.9%) | 205 (11.1%) |
Fertility by Education in Medina County
Average fertility rate in Medina County is 48.0 births per 1,000 women. Women with the education attainment of graduate degree have the highest fertility rate of 71.0 births per 1,000 women, while women with the education attainment of less than high school have the lowest fertility at 4.0 births per 1,000 women. Women with the education attainment of college or associate's degree represent 33.7% of all women with births.
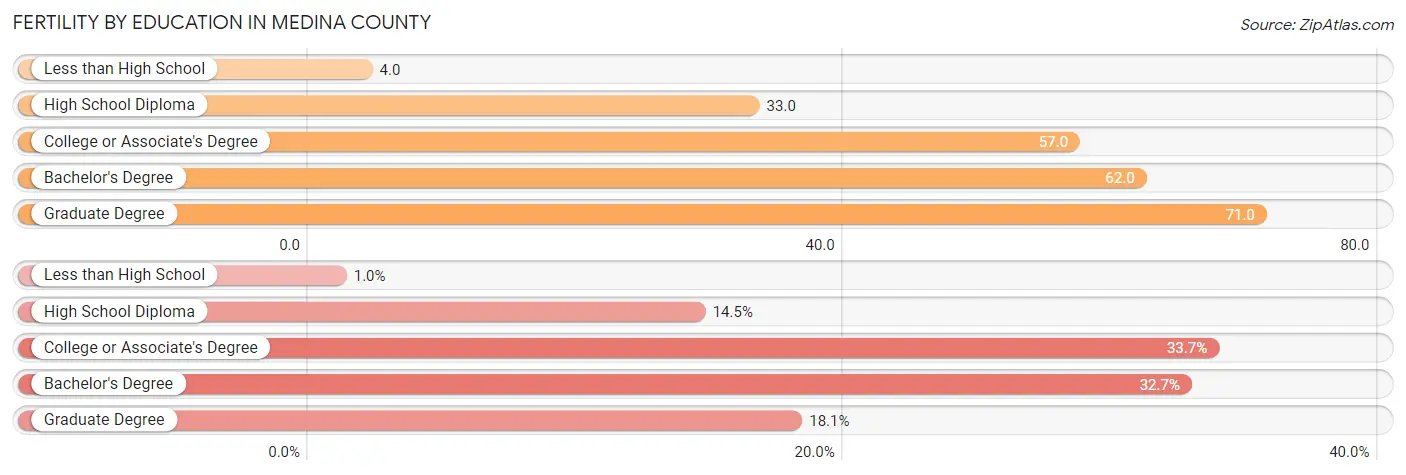
| Educational Attainment | Women with Births | Births / 1,000 Women |
| Less than High School | 19 (1.0%) | 4.0 |
| High School Diploma | 268 (14.5%) | 33.0 |
| College or Associate's Degree | 624 (33.7%) | 57.0 |
| Bachelor's Degree | 605 (32.7%) | 62.0 |
| Graduate Degree | 335 (18.1%) | 71.0 |
| Total | 1,851 (100.0%) | 48.0 |
Fertility by Education by Marriage Status in Medina County
11.1% of women with births in Medina County are unmarried. Women with the educational attainment of less than high school are most likely to be married with 100.0% of them married at childbirth, while women with the educational attainment of high school diploma are least likely to be married with 36.2% of them unmarried at childbirth.
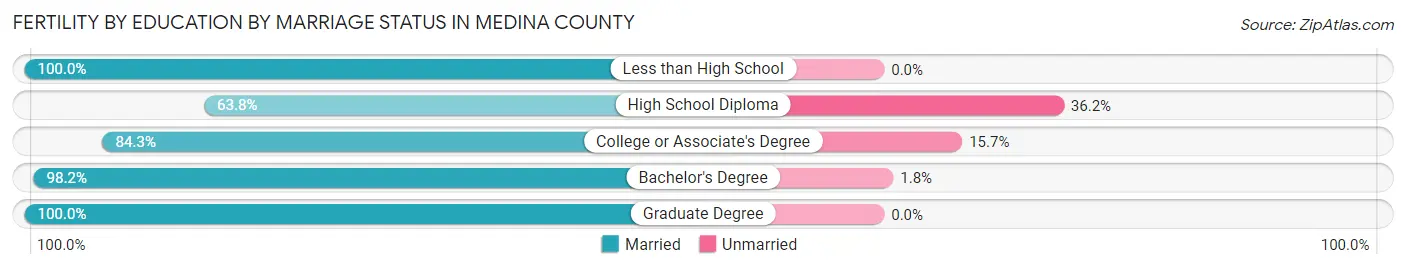
| Educational Attainment | Married | Unmarried |
| Less than High School | 19 (100.0%) | 0 (0.0%) |
| High School Diploma | 171 (63.8%) | 97 (36.2%) |
| College or Associate's Degree | 526 (84.3%) | 98 (15.7%) |
| Bachelor's Degree | 594 (98.2%) | 11 (1.8%) |
| Graduate Degree | 335 (100.0%) | 0 (0.0%) |
| Total | 1,646 (88.9%) | 205 (11.1%) |
Income in Medina County
Income Overview in Medina County
Per Capita Income in Medina County is $45,038, while median incomes of families and households are $108,701 and $89,968 respectively.
| Characteristic | Number | Measure |
| Per Capita Income | 182,347 | $45,038 |
| Median Family Income | 51,531 | $108,701 |
| Mean Family Income | 51,531 | $131,311 |
| Median Household Income | 72,097 | $89,968 |
| Mean Household Income | 72,097 | $112,612 |
| Income Deficit | 51,531 | $11,323 |
| Wage / Income Gap (%) | 182,347 | 37.56% |
| Wage / Income Gap ($) | 182,347 | 62.44¢ per $1 |
| Gini / Inequality Index | 182,347 | 0.42 |
Earnings by Sex in Medina County
Average Earnings in Medina County are $47,891, $59,336 for men and $37,049 for women, a difference of 37.6%.
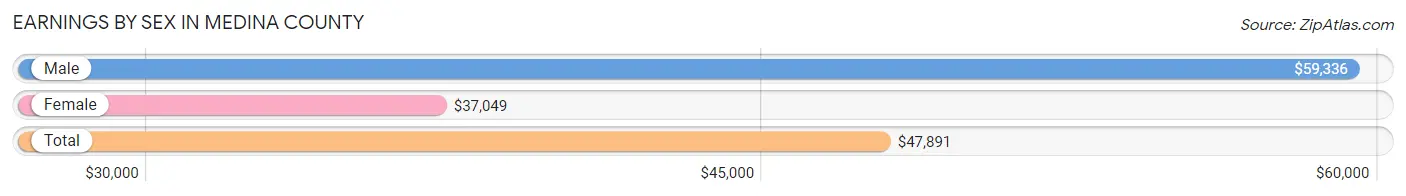
| Sex | Number | Average Earnings |
| Male | 55,197 (53.3%) | $59,336 |
| Female | 48,381 (46.7%) | $37,049 |
| Total | 103,578 (100.0%) | $47,891 |
Earnings by Sex by Income Bracket in Medina County
The most common earnings brackets in Medina County are $100,000+ for men (12,562 | 22.8%) and $100,000+ for women (4,866 | 10.1%).
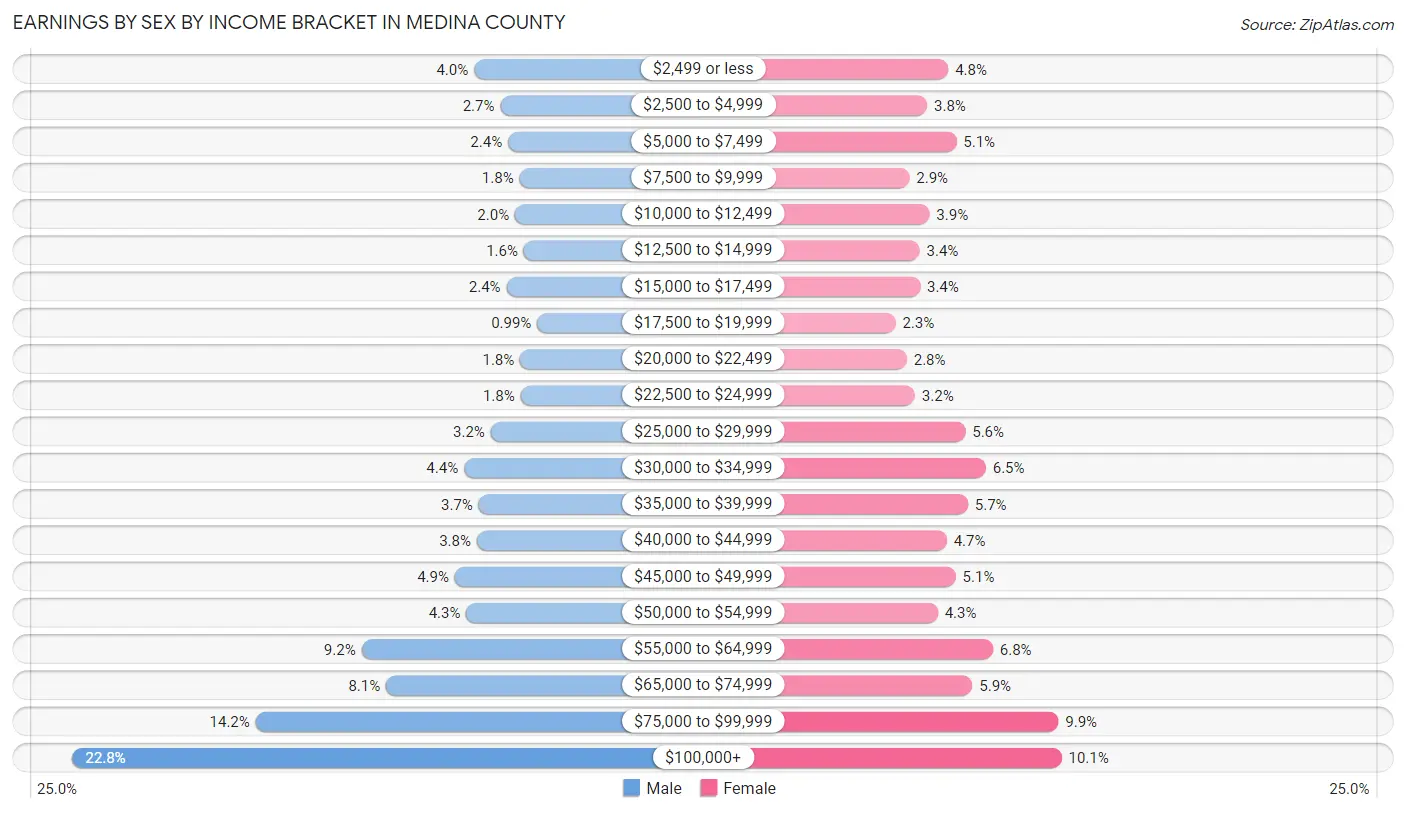
| Income | Male | Female |
| $2,499 or less | 2,182 (4.0%) | 2,299 (4.8%) |
| $2,500 to $4,999 | 1,500 (2.7%) | 1,818 (3.8%) |
| $5,000 to $7,499 | 1,300 (2.4%) | 2,481 (5.1%) |
| $7,500 to $9,999 | 1,002 (1.8%) | 1,416 (2.9%) |
| $10,000 to $12,499 | 1,120 (2.0%) | 1,870 (3.9%) |
| $12,500 to $14,999 | 894 (1.6%) | 1,648 (3.4%) |
| $15,000 to $17,499 | 1,340 (2.4%) | 1,658 (3.4%) |
| $17,500 to $19,999 | 546 (1.0%) | 1,103 (2.3%) |
| $20,000 to $22,499 | 988 (1.8%) | 1,359 (2.8%) |
| $22,500 to $24,999 | 978 (1.8%) | 1,543 (3.2%) |
| $25,000 to $29,999 | 1,747 (3.2%) | 2,686 (5.6%) |
| $30,000 to $34,999 | 2,440 (4.4%) | 3,149 (6.5%) |
| $35,000 to $39,999 | 2,057 (3.7%) | 2,744 (5.7%) |
| $40,000 to $44,999 | 2,111 (3.8%) | 2,266 (4.7%) |
| $45,000 to $49,999 | 2,679 (4.9%) | 2,468 (5.1%) |
| $50,000 to $54,999 | 2,377 (4.3%) | 2,062 (4.3%) |
| $55,000 to $64,999 | 5,091 (9.2%) | 3,308 (6.8%) |
| $65,000 to $74,999 | 4,456 (8.1%) | 2,843 (5.9%) |
| $75,000 to $99,999 | 7,827 (14.2%) | 4,794 (9.9%) |
| $100,000+ | 12,562 (22.8%) | 4,866 (10.1%) |
| Total | 55,197 (100.0%) | 48,381 (100.0%) |
Earnings by Sex by Educational Attainment in Medina County
Average earnings in Medina County are $67,286 for men and $42,421 for women, a difference of 36.9%. Men with an educational attainment of graduate degree enjoy the highest average annual earnings of $104,127, while those with less than high school education earn the least with $41,061. Women with an educational attainment of graduate degree earn the most with the average annual earnings of $86,104, while those with less than high school education have the smallest earnings of $22,650.
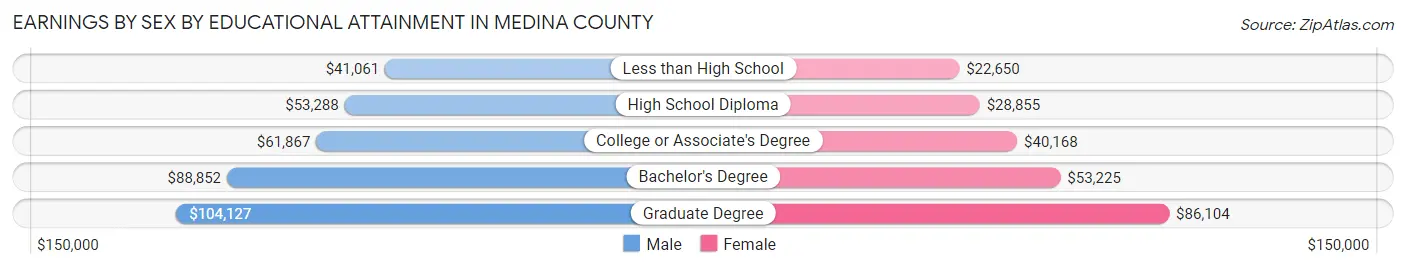
| Educational Attainment | Male Income | Female Income |
| Less than High School | $41,061 | $22,650 |
| High School Diploma | $53,288 | $28,855 |
| College or Associate's Degree | $61,867 | $40,168 |
| Bachelor's Degree | $88,852 | $53,225 |
| Graduate Degree | $104,127 | $86,104 |
| Total | $67,286 | $42,421 |
Family Income in Medina County
Family Income Brackets in Medina County
According to the Medina County family income data, there are 12,728 families falling into the $100,000 to $149,999 income range, which is the most common income bracket and makes up 24.7% of all families. Conversely, the $10,000 to $14,999 income bracket is the least frequent group with only 464 families (0.9%) belonging to this category.
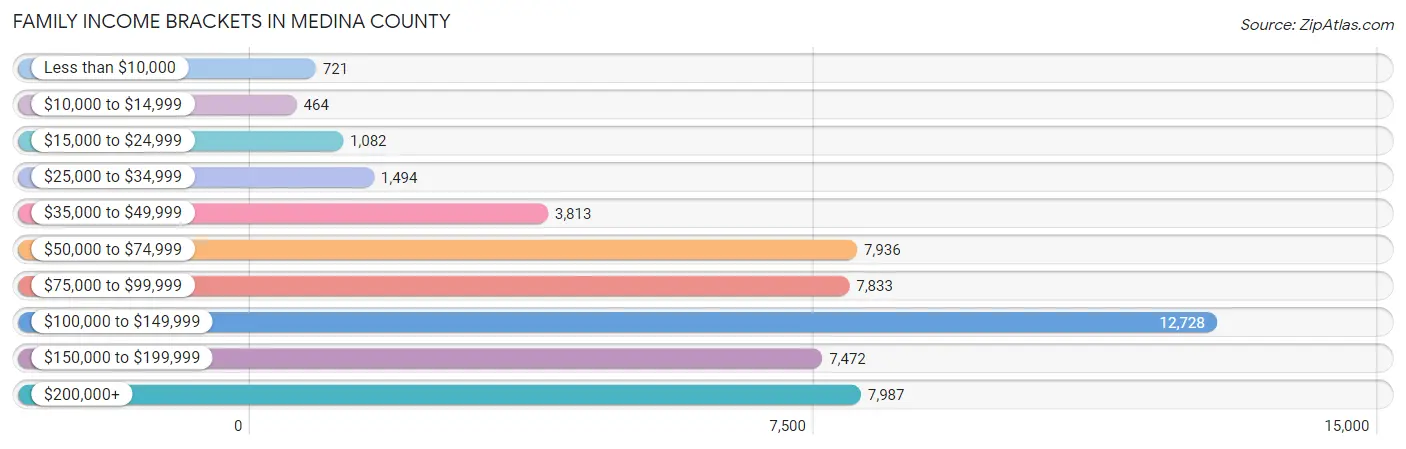
| Income Bracket | # Families | % Families |
| Less than $10,000 | 721 | 1.4% |
| $10,000 to $14,999 | 464 | 0.9% |
| $15,000 to $24,999 | 1,082 | 2.1% |
| $25,000 to $34,999 | 1,494 | 2.9% |
| $35,000 to $49,999 | 3,813 | 7.4% |
| $50,000 to $74,999 | 7,936 | 15.4% |
| $75,000 to $99,999 | 7,833 | 15.2% |
| $100,000 to $149,999 | 12,728 | 24.7% |
| $150,000 to $199,999 | 7,472 | 14.5% |
| $200,000+ | 7,987 | 15.5% |
Family Income by Famaliy Size in Medina County
6-person families (1,075 | 2.1%) account for the highest median family income in Medina County with $143,350 per family, while 2-person families (24,980 | 48.5%) have the highest median income of $46,544 per family member.
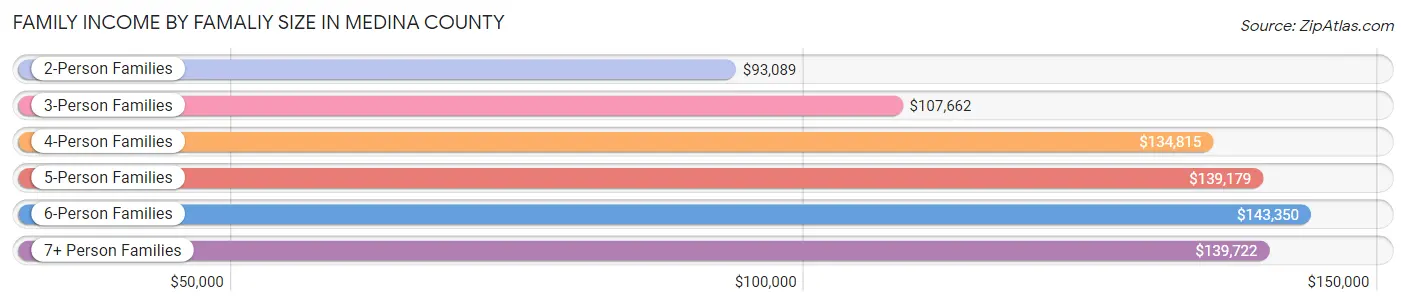
| Income Bracket | # Families | Median Income |
| 2-Person Families | 24,980 (48.5%) | $93,089 |
| 3-Person Families | 10,592 (20.5%) | $107,662 |
| 4-Person Families | 10,455 (20.3%) | $134,815 |
| 5-Person Families | 3,657 (7.1%) | $139,179 |
| 6-Person Families | 1,075 (2.1%) | $143,350 |
| 7+ Person Families | 772 (1.5%) | $139,722 |
| Total | 51,531 (100.0%) | $108,701 |
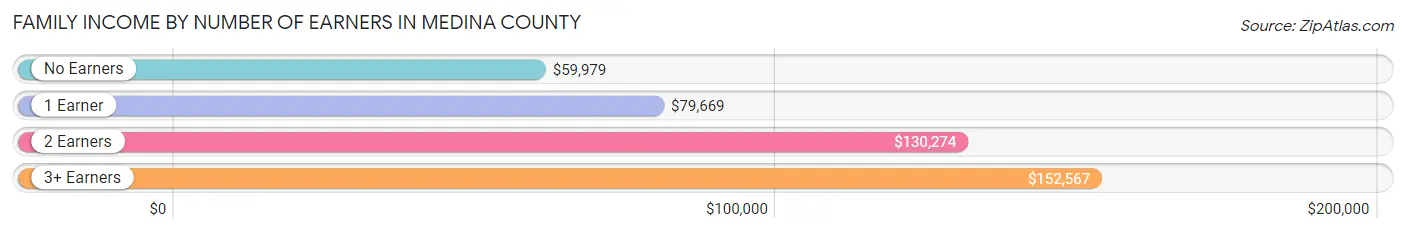
Family Income by Number of Earners in Medina County
The median family income in Medina County is $108,701, with families comprising 3+ earners (7,056) having the highest median family income of $152,567, while families with no earners (7,261) have the lowest median family income of $59,979, accounting for 13.7% and 14.1% of families, respectively.
| Number of Earners | # Families | Median Income |
| No Earners | 7,261 (14.1%) | $59,979 |
| 1 Earner | 13,753 (26.7%) | $79,669 |
| 2 Earners | 23,461 (45.5%) | $130,274 |
| 3+ Earners | 7,056 (13.7%) | $152,567 |
| Total | 51,531 (100.0%) | $108,701 |
Household Income in Medina County
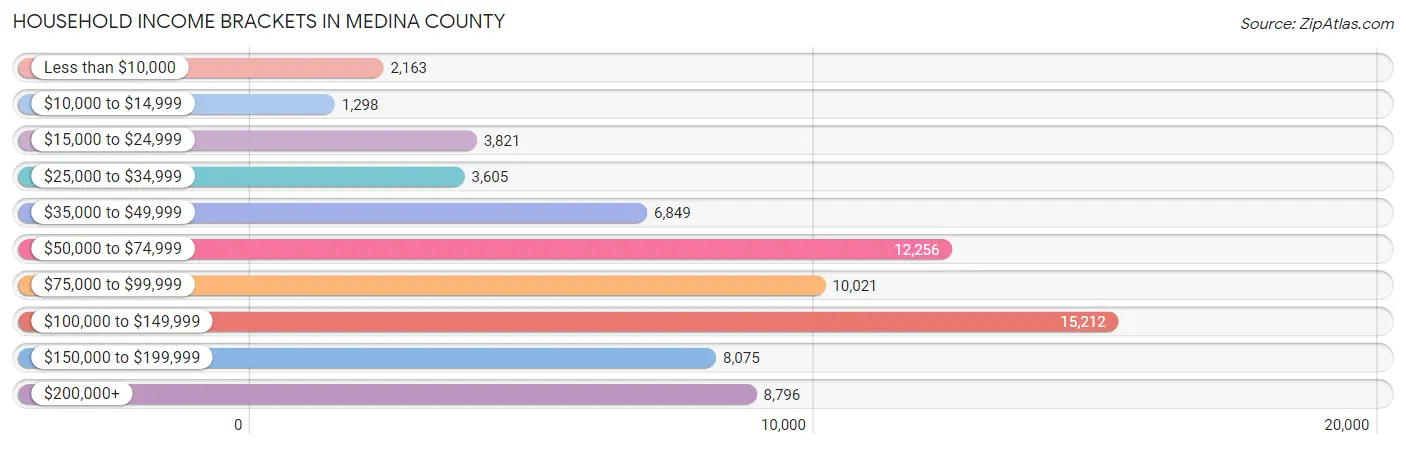
Household Income Brackets in Medina County
With 15,212 households falling in the category, the $100,000 to $149,999 income range is the most frequent in Medina County, accounting for 21.1% of all households. In contrast, only 1,298 households (1.8%) fall into the $10,000 to $14,999 income bracket, making it the least populous group.
| Income Bracket | # Households | % Households |
| Less than $10,000 | 2,163 | 3.0% |
| $10,000 to $14,999 | 1,298 | 1.8% |
| $15,000 to $24,999 | 3,821 | 5.3% |
| $25,000 to $34,999 | 3,605 | 5.0% |
| $35,000 to $49,999 | 6,849 | 9.5% |
| $50,000 to $74,999 | 12,256 | 17.0% |
| $75,000 to $99,999 | 10,021 | 13.9% |
| $100,000 to $149,999 | 15,212 | 21.1% |
| $150,000 to $199,999 | 8,075 | 11.2% |
| $200,000+ | 8,796 | 12.2% |
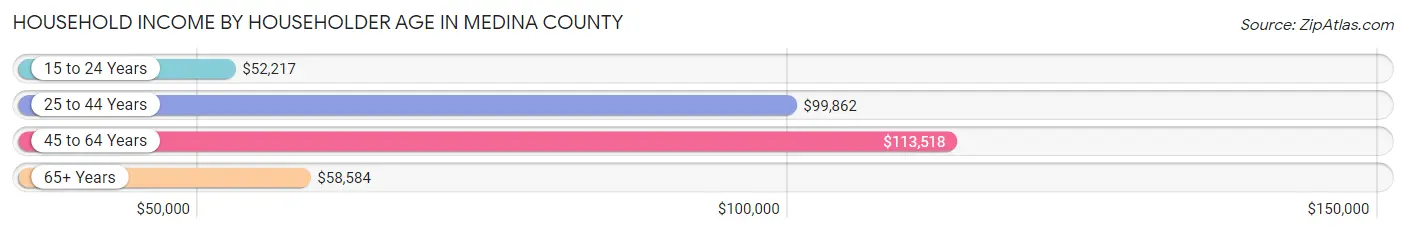
Household Income by Householder Age in Medina County
The median household income in Medina County is $89,968, with the highest median household income of $113,518 found in the 45 to 64 years age bracket for the primary householder. A total of 28,768 households (39.9%) fall into this category. Meanwhile, the 15 to 24 years age bracket for the primary householder has the lowest median household income of $52,217, with 1,550 households (2.1%) in this group.
| Income Bracket | # Households | Median Income |
| 15 to 24 Years | 1,550 (2.1%) | $52,217 |
| 25 to 44 Years | 20,948 (29.1%) | $99,862 |
| 45 to 64 Years | 28,768 (39.9%) | $113,518 |
| 65+ Years | 20,831 (28.9%) | $58,584 |
| Total | 72,097 (100.0%) | $89,968 |
Poverty in Medina County
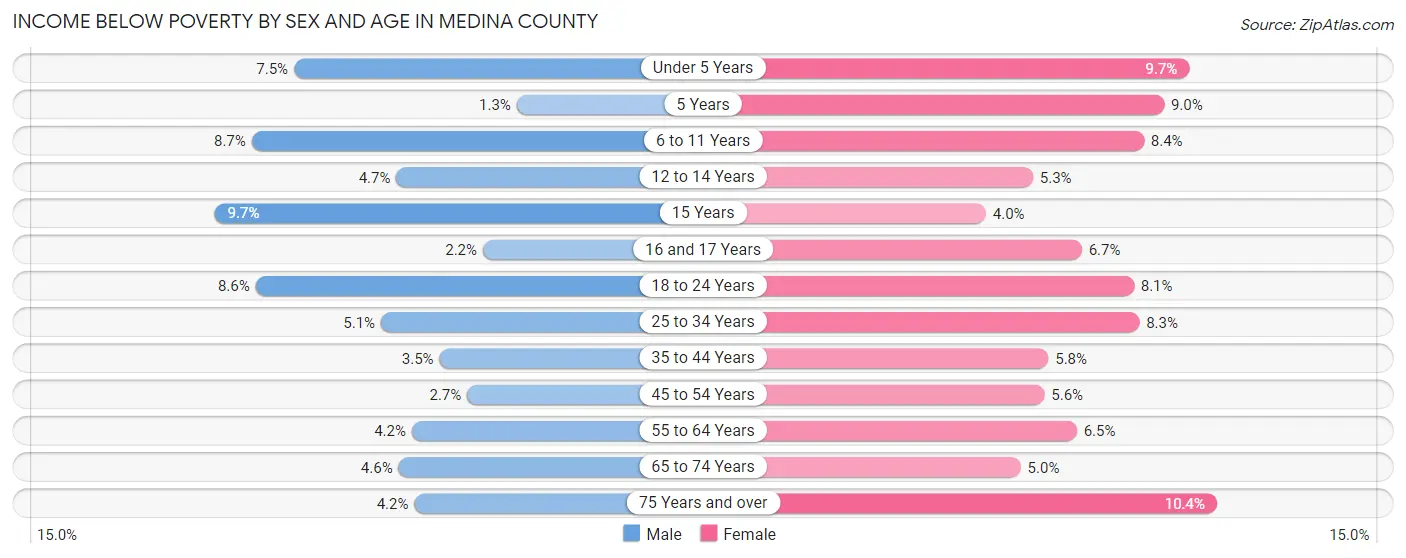
Income Below Poverty by Sex and Age in Medina County
With 4.9% poverty level for males and 7.0% for females among the residents of Medina County, 15 year old males and 75 year old and over females are the most vulnerable to poverty, with 124 males (9.7%) and 768 females (10.4%) in their respective age groups living below the poverty level.
| Age Bracket | Male | Female |
| Under 5 Years | 351 (7.5%) | 425 (9.7%) |
| 5 Years | 11 (1.3%) | 91 (9.0%) |
| 6 to 11 Years | 629 (8.7%) | 537 (8.4%) |
| 12 to 14 Years | 155 (4.6%) | 194 (5.3%) |
| 15 Years | 124 (9.7%) | 52 (4.0%) |
| 16 and 17 Years | 61 (2.2%) | 161 (6.7%) |
| 18 to 24 Years | 624 (8.6%) | 550 (8.1%) |
| 25 to 34 Years | 495 (5.1%) | 785 (8.3%) |
| 35 to 44 Years | 406 (3.5%) | 660 (5.8%) |
| 45 to 54 Years | 340 (2.7%) | 703 (5.6%) |
| 55 to 64 Years | 560 (4.2%) | 869 (6.5%) |
| 65 to 74 Years | 447 (4.6%) | 524 (5.0%) |
| 75 Years and over | 236 (4.2%) | 768 (10.4%) |
| Total | 4,439 (4.9%) | 6,319 (7.0%) |
Income Above Poverty by Sex and Age in Medina County
According to the poverty statistics in Medina County, males aged 5 years and females aged 15 years are the age groups that are most secure financially, with 98.7% of males and 96.0% of females in these age groups living above the poverty line.
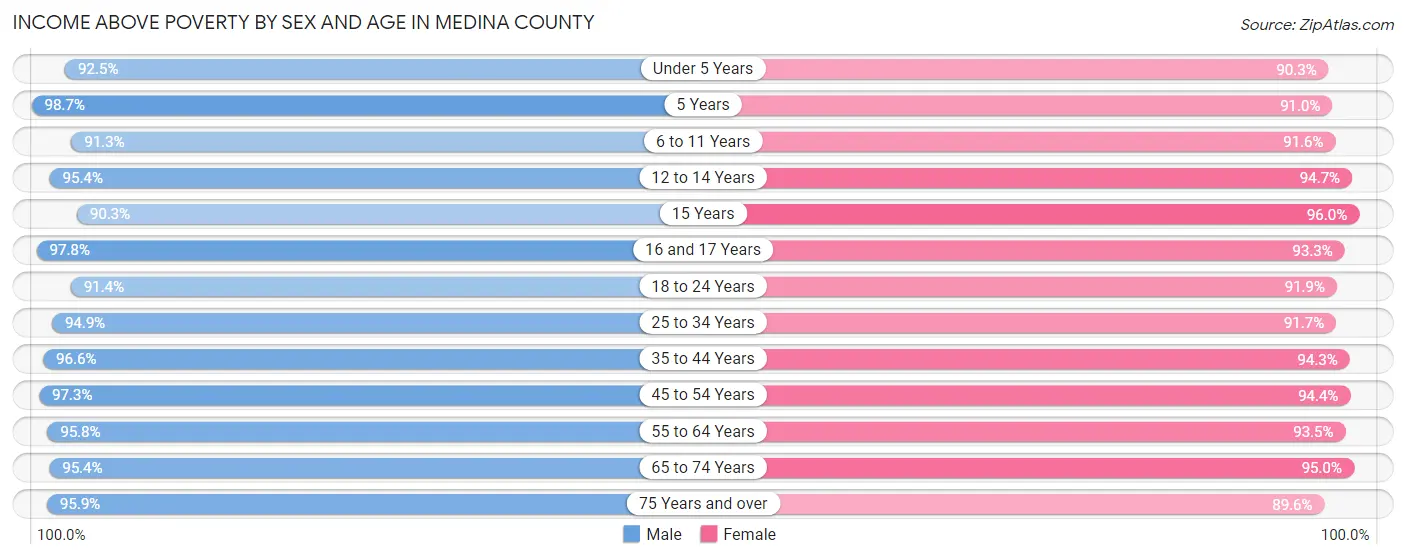
| Age Bracket | Male | Female |
| Under 5 Years | 4,328 (92.5%) | 3,968 (90.3%) |
| 5 Years | 832 (98.7%) | 924 (91.0%) |
| 6 to 11 Years | 6,620 (91.3%) | 5,846 (91.6%) |
| 12 to 14 Years | 3,176 (95.4%) | 3,456 (94.7%) |
| 15 Years | 1,153 (90.3%) | 1,244 (96.0%) |
| 16 and 17 Years | 2,657 (97.8%) | 2,250 (93.3%) |
| 18 to 24 Years | 6,654 (91.4%) | 6,211 (91.9%) |
| 25 to 34 Years | 9,242 (94.9%) | 8,697 (91.7%) |
| 35 to 44 Years | 11,350 (96.6%) | 10,818 (94.3%) |
| 45 to 54 Years | 12,367 (97.3%) | 11,764 (94.4%) |
| 55 to 64 Years | 12,697 (95.8%) | 12,422 (93.5%) |
| 65 to 74 Years | 9,296 (95.4%) | 9,992 (95.0%) |
| 75 Years and over | 5,448 (95.9%) | 6,586 (89.6%) |
| Total | 85,820 (95.1%) | 84,178 (93.0%) |
Income Below Poverty Among Married-Couple Families in Medina County
The poverty statistics for married-couple families in Medina County show that 1.8% or 744 of the total 42,613 families live below the poverty line. Families with 5 or more children have the highest poverty rate of 10.8%, comprising of 34 families. On the other hand, families with 1 or 2 children have the lowest poverty rate of 1.3%, which includes 169 families.
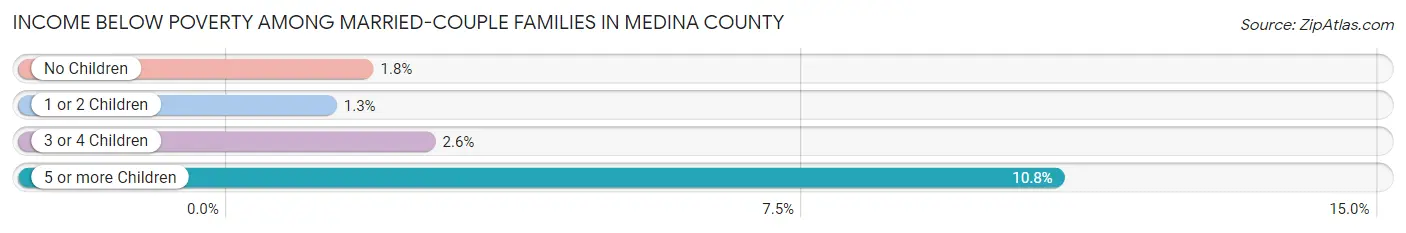
| Children | Above Poverty | Below Poverty |
| No Children | 25,481 (98.2%) | 458 (1.8%) |
| 1 or 2 Children | 12,975 (98.7%) | 169 (1.3%) |
| 3 or 4 Children | 3,132 (97.4%) | 83 (2.6%) |
| 5 or more Children | 281 (89.2%) | 34 (10.8%) |
| Total | 41,869 (98.3%) | 744 (1.8%) |
Income Below Poverty Among Single-Parent Households in Medina County
According to the poverty data in Medina County, 5.6% or 190 single-father households and 19.7% or 1,092 single-mother households are living below the poverty line. Among single-father households, those with 3 or 4 children have the highest poverty rate, with 75 households (20.5%) experiencing poverty. Likewise, among single-mother households, those with 5 or more children have the highest poverty rate, with 17 households (100.0%) falling below the poverty line.
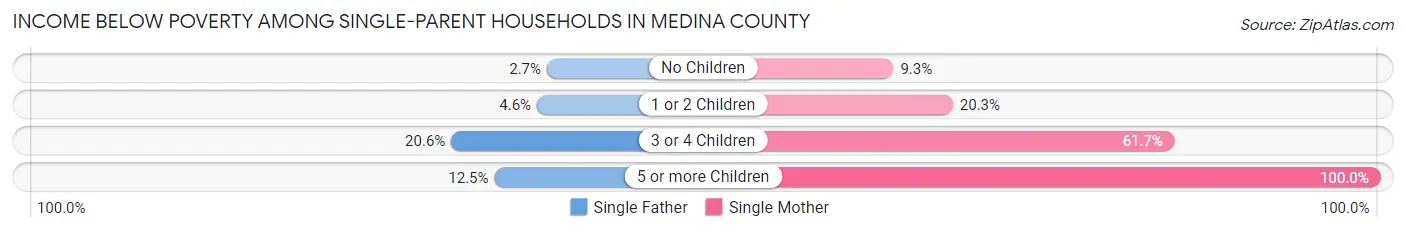
| Children | Single Father | Single Mother |
| No Children | 37 (2.7%) | 188 (9.3%) |
| 1 or 2 Children | 74 (4.6%) | 625 (20.3%) |
| 3 or 4 Children | 75 (20.5%) | 262 (61.7%) |
| 5 or more Children | 4 (12.5%) | 17 (100.0%) |
| Total | 190 (5.6%) | 1,092 (19.7%) |
Income Below Poverty Among Married-Couple vs Single-Parent Households in Medina County
The poverty data for Medina County shows that 744 of the married-couple family households (1.8%) and 1,282 of the single-parent households (14.4%) are living below the poverty level. Within the married-couple family households, those with 5 or more children have the highest poverty rate, with 34 households (10.8%) falling below the poverty line. Among the single-parent households, those with 5 or more children have the highest poverty rate, with 21 household (42.9%) living below poverty.
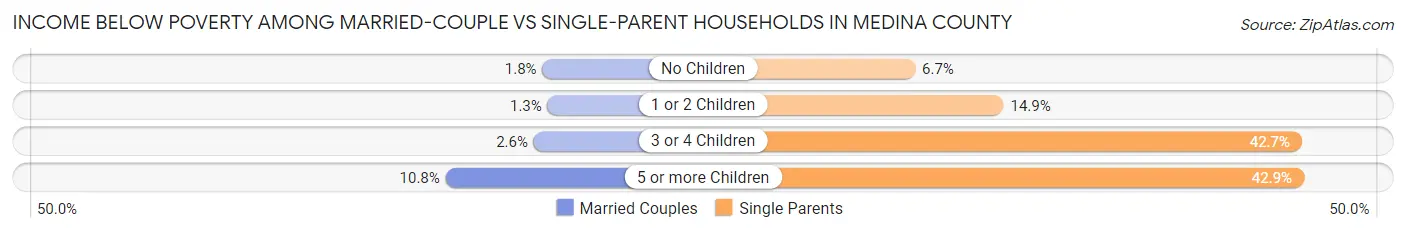
| Children | Married-Couple Families | Single-Parent Households |
| No Children | 458 (1.8%) | 225 (6.7%) |
| 1 or 2 Children | 169 (1.3%) | 699 (14.9%) |
| 3 or 4 Children | 83 (2.6%) | 337 (42.7%) |
| 5 or more Children | 34 (10.8%) | 21 (42.9%) |
| Total | 744 (1.8%) | 1,282 (14.4%) |
Employment Characteristics in Medina County
Employment by Class of Employer in Medina County
Among the 94,868 employed individuals in Medina County, private company employees (67,225 | 70.9%), not-for-profit organizations (8,596 | 9.1%), and local government employees (7,887 | 8.3%) make up the most common classes of employment.
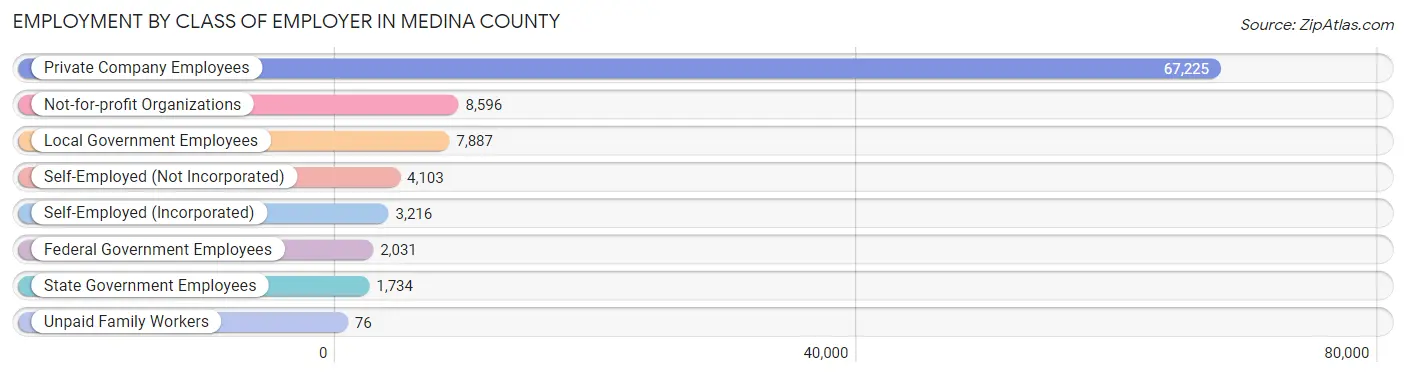
| Employer Class | # Employees | % Employees |
| Private Company Employees | 67,225 | 70.9% |
| Self-Employed (Incorporated) | 3,216 | 3.4% |
| Self-Employed (Not Incorporated) | 4,103 | 4.3% |
| Not-for-profit Organizations | 8,596 | 9.1% |
| Local Government Employees | 7,887 | 8.3% |
| State Government Employees | 1,734 | 1.8% |
| Federal Government Employees | 2,031 | 2.1% |
| Unpaid Family Workers | 76 | 0.1% |
| Total | 94,868 | 100.0% |
Employment Status by Age in Medina County
According to the labor force statistics for Medina County, out of the total population over 16 years of age (147,860), 67.2% or 99,362 individuals are in the labor force, with 3.0% or 2,981 of them unemployed. The age group with the highest labor force participation rate is 30 to 34 years, with 89.1% or 8,888 individuals in the labor force. Within the labor force, the 16 to 19 years age range has the highest percentage of unemployed individuals, with 7.1% or 354 of them being unemployed.
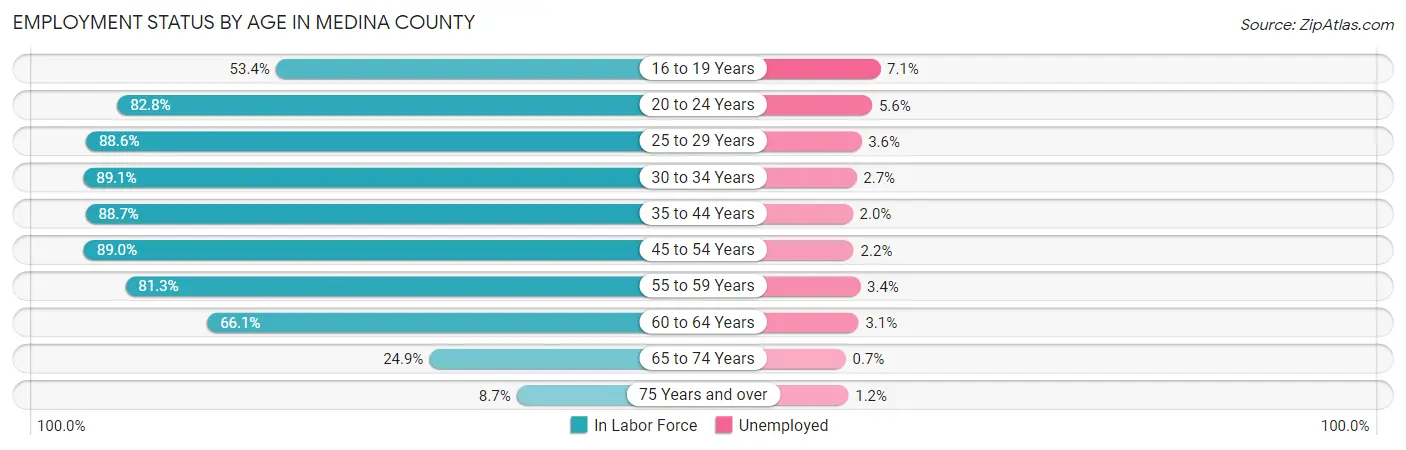
| Age Bracket | In Labor Force | Unemployed |
| 16 to 19 Years | 4,986 (53.4%) | 354 (7.1%) |
| 20 to 24 Years | 8,191 (82.8%) | 459 (5.6%) |
| 25 to 29 Years | 8,250 (88.6%) | 297 (3.6%) |
| 30 to 34 Years | 8,888 (89.1%) | 240 (2.7%) |
| 35 to 44 Years | 20,650 (88.7%) | 413 (2.0%) |
| 45 to 54 Years | 22,432 (89.0%) | 494 (2.2%) |
| 55 to 59 Years | 10,780 (81.3%) | 367 (3.4%) |
| 60 to 64 Years | 8,853 (66.1%) | 274 (3.1%) |
| 65 to 74 Years | 5,077 (24.9%) | 36 (0.7%) |
| 75 Years and over | 1,202 (8.7%) | 14 (1.2%) |
| Total | 99,362 (67.2%) | 2,981 (3.0%) |
Employment Status by Educational Attainment in Medina County
According to labor force statistics for Medina County, 84.6% of individuals (79,883) out of the total population between 25 and 64 years of age (94,424) are in the labor force, with 2.6% or 2,077 of them being unemployed. The group with the highest labor force participation rate are those with the educational attainment of bachelor's degree or higher, with 89.5% or 33,308 individuals in the labor force. Within the labor force, individuals with less than high school education have the highest percentage of unemployment, with 5.9% or 132 of them being unemployed.
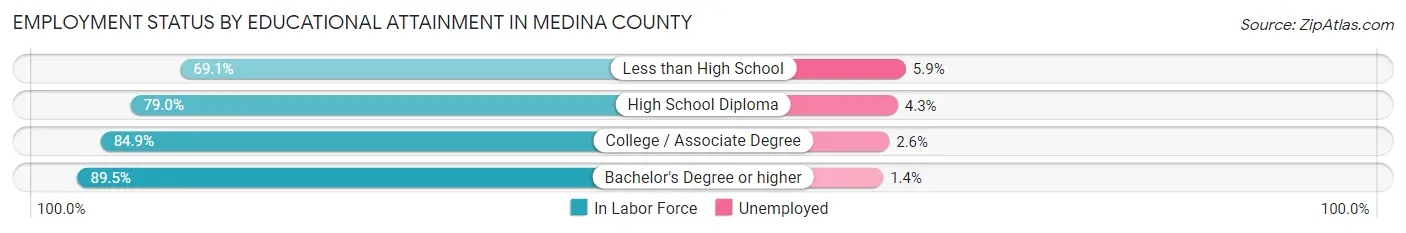
| Educational Attainment | In Labor Force | Unemployed |
| Less than High School | 2,231 (69.1%) | 191 (5.9%) |
| High School Diploma | 20,183 (79.0%) | 1,099 (4.3%) |
| College / Associate Degree | 24,138 (84.9%) | 739 (2.6%) |
| Bachelor's Degree or higher | 33,308 (89.5%) | 521 (1.4%) |
| Total | 79,883 (84.6%) | 2,455 (2.6%) |
Employment Occupations by Sex in Medina County
Management, Business, Science and Arts Occupations
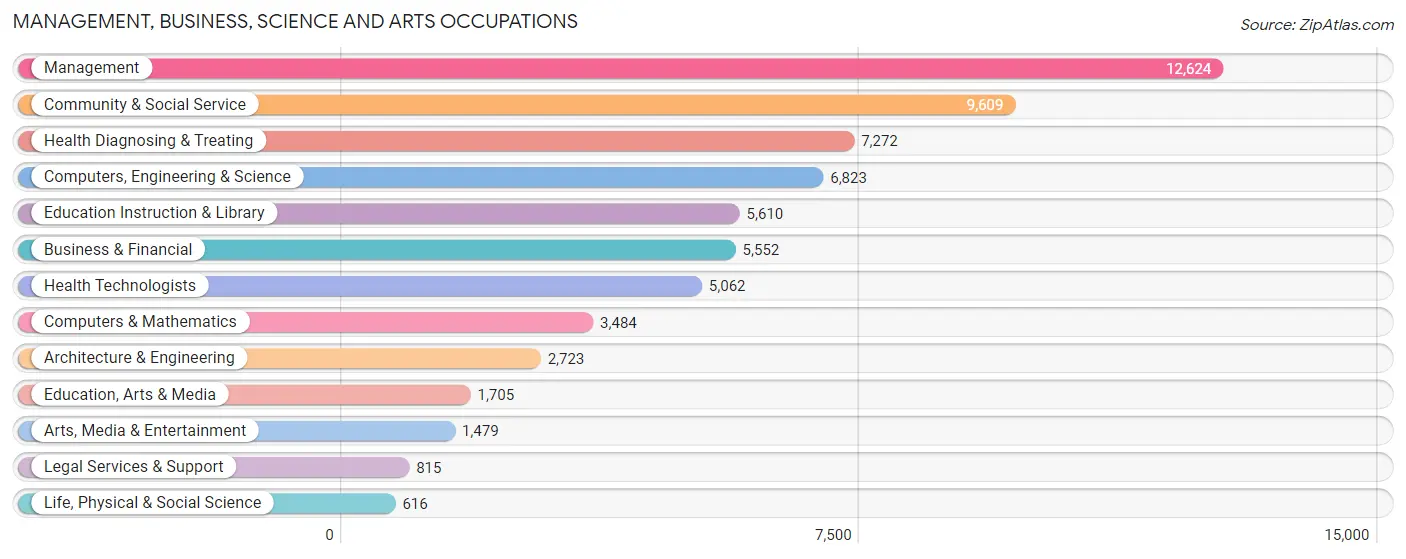
The most common Management, Business, Science and Arts occupations in Medina County are Management (12,624 | 13.1%), Community & Social Service (9,609 | 10.0%), Health Diagnosing & Treating (7,272 | 7.5%), Computers, Engineering & Science (6,823 | 7.1%), and Education Instruction & Library (5,610 | 5.8%).
Management, Business, Science and Arts Occupations by Sex
Within the Management, Business, Science and Arts occupations in Medina County, the most male-oriented occupations are Architecture & Engineering (85.4%), Computers, Engineering & Science (79.3%), and Life, Physical & Social Science (77.8%), while the most female-oriented occupations are Health Diagnosing & Treating (79.9%), Health Technologists (77.9%), and Education Instruction & Library (75.4%).
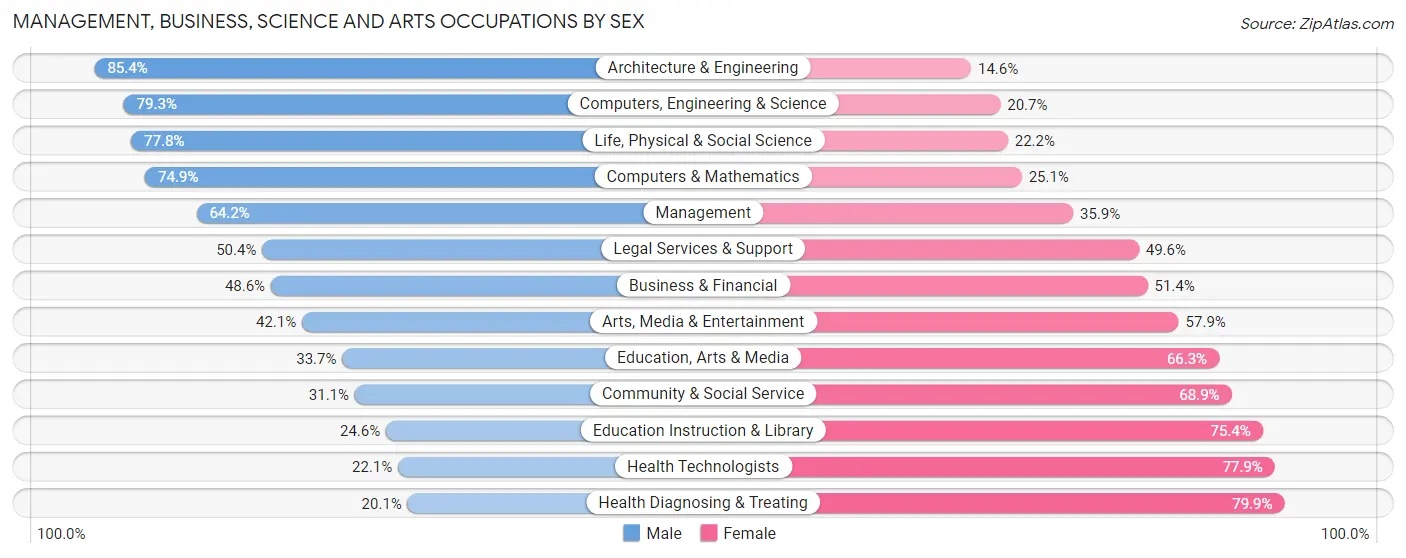
| Occupation | Male | Female |
| Management | 8,098 (64.1%) | 4,526 (35.8%) |
| Business & Financial | 2,699 (48.6%) | 2,853 (51.4%) |
| Computers, Engineering & Science | 5,413 (79.3%) | 1,410 (20.7%) |
| Computers & Mathematics | 2,608 (74.9%) | 876 (25.1%) |
| Architecture & Engineering | 2,326 (85.4%) | 397 (14.6%) |
| Life, Physical & Social Science | 479 (77.8%) | 137 (22.2%) |
| Community & Social Service | 2,989 (31.1%) | 6,620 (68.9%) |
| Education, Arts & Media | 575 (33.7%) | 1,130 (66.3%) |
| Legal Services & Support | 411 (50.4%) | 404 (49.6%) |
| Education Instruction & Library | 1,380 (24.6%) | 4,230 (75.4%) |
| Arts, Media & Entertainment | 623 (42.1%) | 856 (57.9%) |
| Health Diagnosing & Treating | 1,461 (20.1%) | 5,811 (79.9%) |
| Health Technologists | 1,118 (22.1%) | 3,944 (77.9%) |
| Total (Category) | 20,660 (49.3%) | 21,220 (50.7%) |
| Total (Overall) | 51,396 (53.4%) | 44,915 (46.6%) |
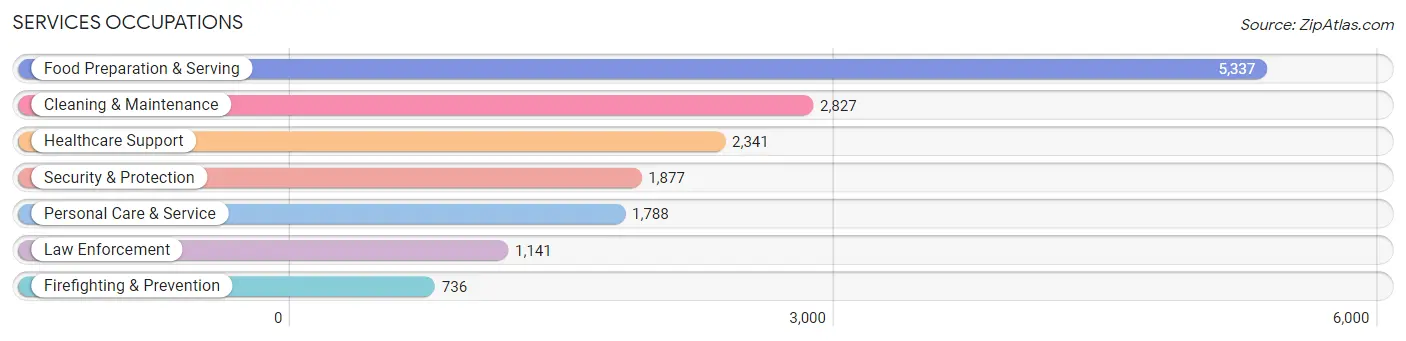
Services Occupations
The most common Services occupations in Medina County are Food Preparation & Serving (5,337 | 5.5%), Cleaning & Maintenance (2,827 | 2.9%), Healthcare Support (2,341 | 2.4%), Security & Protection (1,877 | 1.9%), and Personal Care & Service (1,788 | 1.9%).
Services Occupations by Sex
Within the Services occupations in Medina County, the most male-oriented occupations are Law Enforcement (92.8%), Security & Protection (86.8%), and Firefighting & Prevention (77.4%), while the most female-oriented occupations are Healthcare Support (90.9%), Personal Care & Service (86.2%), and Food Preparation & Serving (64.9%).
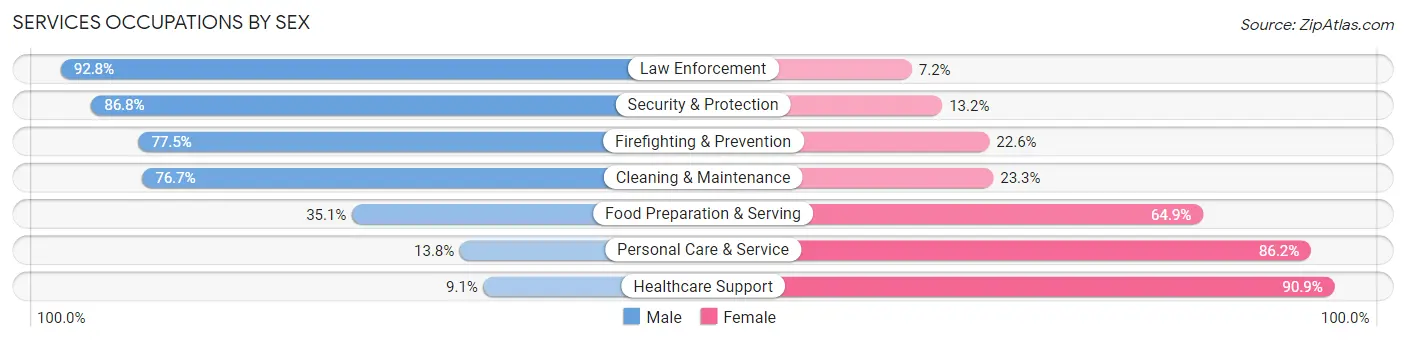
| Occupation | Male | Female |
| Healthcare Support | 213 (9.1%) | 2,128 (90.9%) |
| Security & Protection | 1,629 (86.8%) | 248 (13.2%) |
| Firefighting & Prevention | 570 (77.4%) | 166 (22.6%) |
| Law Enforcement | 1,059 (92.8%) | 82 (7.2%) |
| Food Preparation & Serving | 1,875 (35.1%) | 3,462 (64.9%) |
| Cleaning & Maintenance | 2,168 (76.7%) | 659 (23.3%) |
| Personal Care & Service | 246 (13.8%) | 1,542 (86.2%) |
| Total (Category) | 6,131 (43.3%) | 8,039 (56.7%) |
| Total (Overall) | 51,396 (53.4%) | 44,915 (46.6%) |
Sales and Office Occupations
The most common Sales and Office occupations in Medina County are Office & Administration (10,479 | 10.9%), and Sales & Related (9,820 | 10.2%).

Sales and Office Occupations by Sex

| Occupation | Male | Female |
| Sales & Related | 5,266 (53.6%) | 4,554 (46.4%) |
| Office & Administration | 2,407 (23.0%) | 8,072 (77.0%) |
| Total (Category) | 7,673 (37.8%) | 12,626 (62.2%) |
| Total (Overall) | 51,396 (53.4%) | 44,915 (46.6%) |
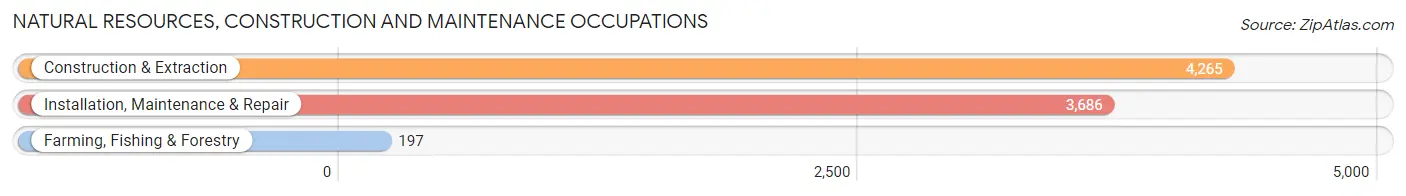
Natural Resources, Construction and Maintenance Occupations
The most common Natural Resources, Construction and Maintenance occupations in Medina County are Construction & Extraction (4,265 | 4.4%), Installation, Maintenance & Repair (3,686 | 3.8%), and Farming, Fishing & Forestry (197 | 0.2%).
Natural Resources, Construction and Maintenance Occupations by Sex
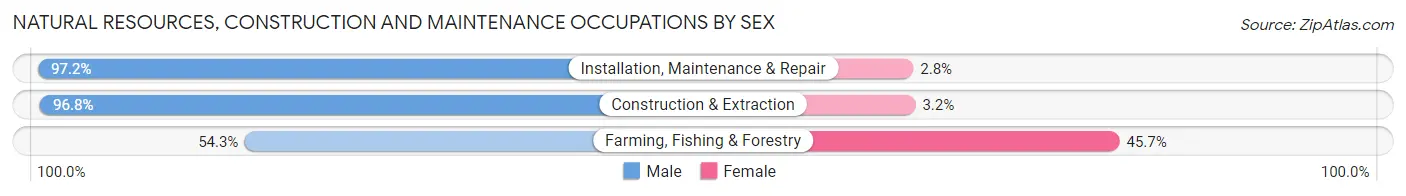
| Occupation | Male | Female |
| Farming, Fishing & Forestry | 107 (54.3%) | 90 (45.7%) |
| Construction & Extraction | 4,127 (96.8%) | 138 (3.2%) |
| Installation, Maintenance & Repair | 3,583 (97.2%) | 103 (2.8%) |
| Total (Category) | 7,817 (95.9%) | 331 (4.1%) |
| Total (Overall) | 51,396 (53.4%) | 44,915 (46.6%) |
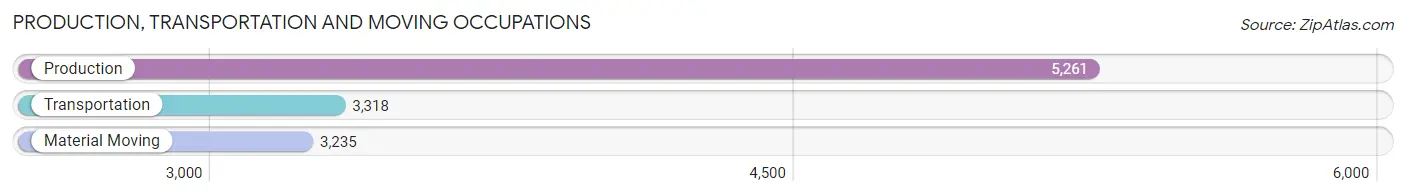
Production, Transportation and Moving Occupations
The most common Production, Transportation and Moving occupations in Medina County are Production (5,261 | 5.5%), Transportation (3,318 | 3.5%), and Material Moving (3,235 | 3.4%).
Production, Transportation and Moving Occupations by Sex
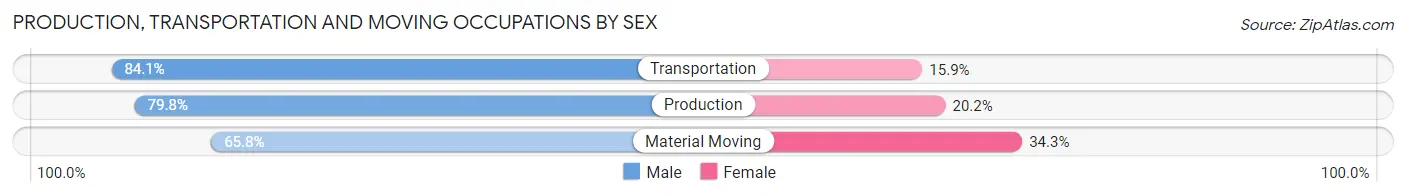
| Occupation | Male | Female |
| Production | 4,199 (79.8%) | 1,062 (20.2%) |
| Transportation | 2,789 (84.1%) | 529 (15.9%) |
| Material Moving | 2,127 (65.7%) | 1,108 (34.3%) |
| Total (Category) | 9,115 (77.1%) | 2,699 (22.9%) |
| Total (Overall) | 51,396 (53.4%) | 44,915 (46.6%) |
Employment Industries by Sex in Medina County
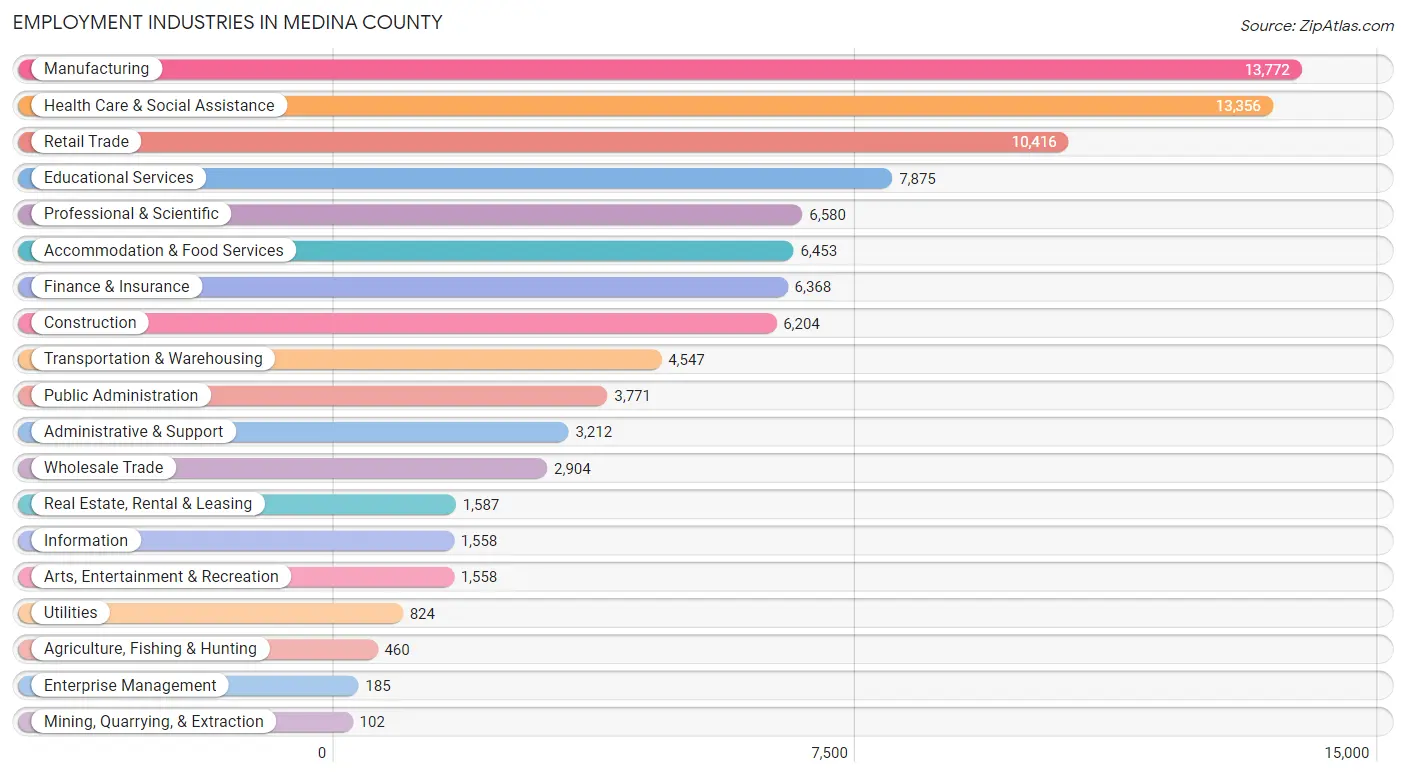
Employment Industries in Medina County
The major employment industries in Medina County include Manufacturing (13,772 | 14.3%), Health Care & Social Assistance (13,356 | 13.9%), Retail Trade (10,416 | 10.8%), Educational Services (7,875 | 8.2%), and Professional & Scientific (6,580 | 6.8%).
Employment Industries by Sex in Medina County
The Medina County industries that see more men than women are Mining, Quarrying, & Extraction (100.0%), Construction (90.6%), and Utilities (78.6%), whereas the industries that tend to have a higher number of women are Health Care & Social Assistance (79.4%), Educational Services (69.9%), and Enterprise Management (68.6%).
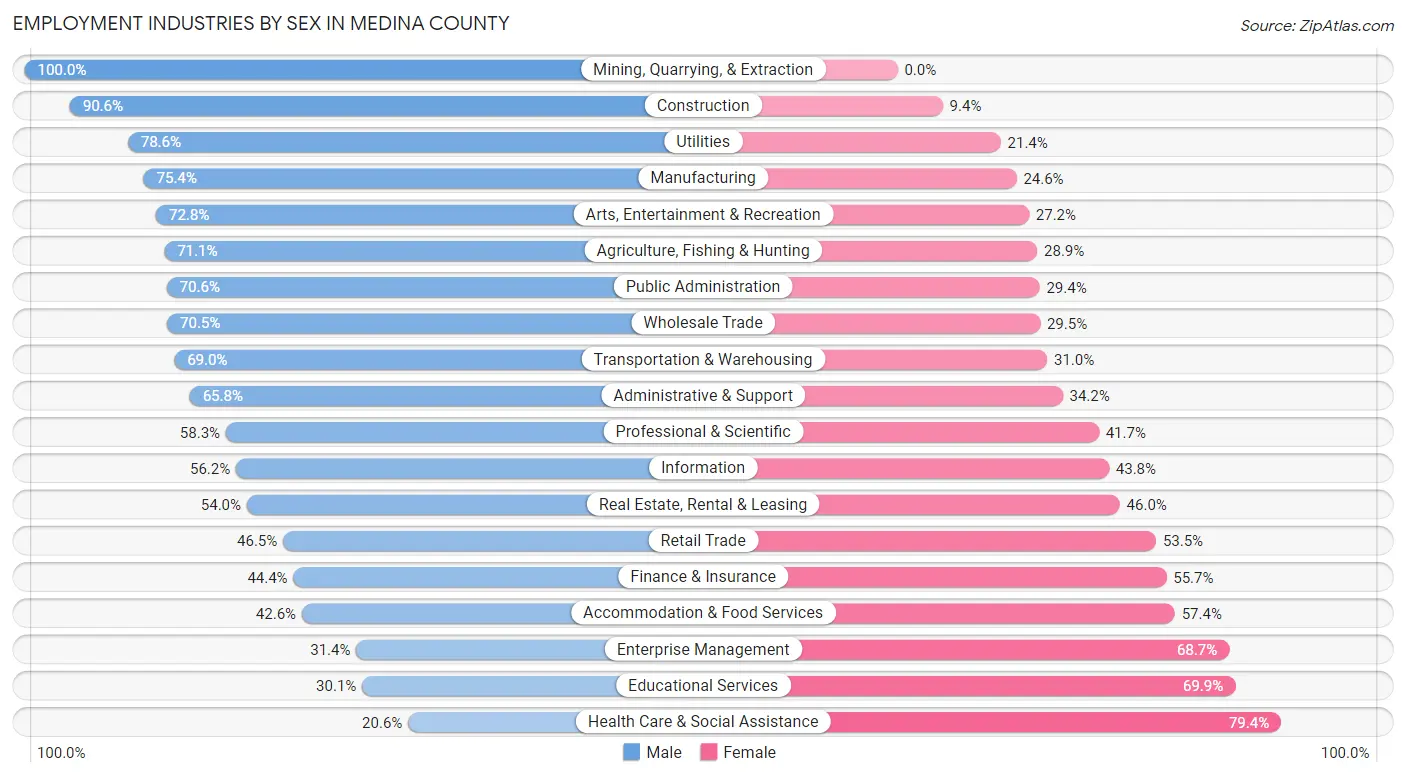
| Industry | Male | Female |
| Agriculture, Fishing & Hunting | 327 (71.1%) | 133 (28.9%) |
| Mining, Quarrying, & Extraction | 102 (100.0%) | 0 (0.0%) |
| Construction | 5,623 (90.6%) | 581 (9.4%) |
| Manufacturing | 10,378 (75.4%) | 3,394 (24.6%) |
| Wholesale Trade | 2,047 (70.5%) | 857 (29.5%) |
| Retail Trade | 4,842 (46.5%) | 5,574 (53.5%) |
| Transportation & Warehousing | 3,139 (69.0%) | 1,408 (31.0%) |
| Utilities | 648 (78.6%) | 176 (21.4%) |
| Information | 876 (56.2%) | 682 (43.8%) |
| Finance & Insurance | 2,824 (44.4%) | 3,544 (55.6%) |
| Real Estate, Rental & Leasing | 857 (54.0%) | 730 (46.0%) |
| Professional & Scientific | 3,838 (58.3%) | 2,742 (41.7%) |
| Enterprise Management | 58 (31.4%) | 127 (68.6%) |
| Administrative & Support | 2,114 (65.8%) | 1,098 (34.2%) |
| Educational Services | 2,373 (30.1%) | 5,502 (69.9%) |
| Health Care & Social Assistance | 2,753 (20.6%) | 10,603 (79.4%) |
| Arts, Entertainment & Recreation | 1,134 (72.8%) | 424 (27.2%) |
| Accommodation & Food Services | 2,749 (42.6%) | 3,704 (57.4%) |
| Public Administration | 2,662 (70.6%) | 1,109 (29.4%) |
| Total | 51,396 (53.4%) | 44,915 (46.6%) |
Education in Medina County
School Enrollment in Medina County
The most common levels of schooling among the 40,930 students in Medina County are high school (10,301 | 25.2%), middle school (9,078 | 22.2%), and elementary school (8,746 | 21.4%).
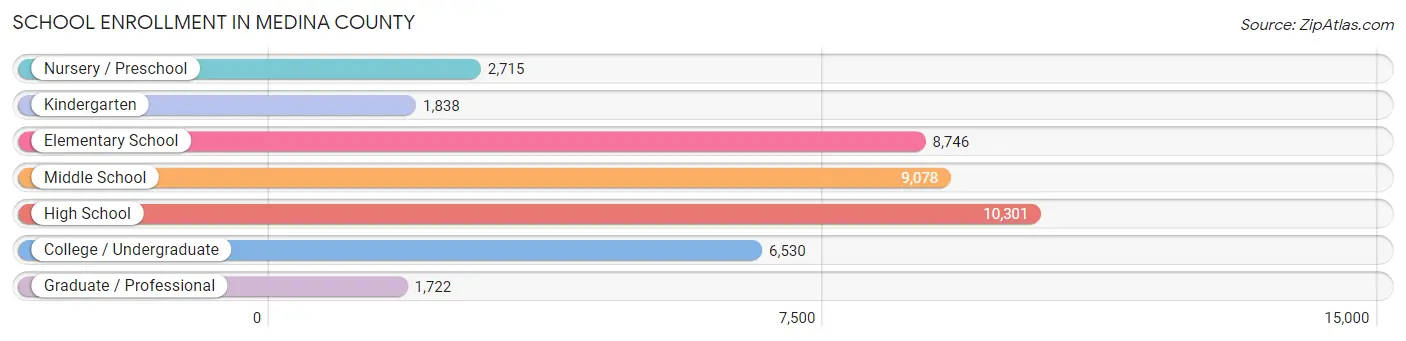
| School Level | # Students | % Students |
| Nursery / Preschool | 2,715 | 6.6% |
| Kindergarten | 1,838 | 4.5% |
| Elementary School | 8,746 | 21.4% |
| Middle School | 9,078 | 22.2% |
| High School | 10,301 | 25.2% |
| College / Undergraduate | 6,530 | 16.0% |
| Graduate / Professional | 1,722 | 4.2% |
| Total | 40,930 | 100.0% |
School Enrollment by Age by Funding Source in Medina County
Out of a total of 40,930 students who are enrolled in schools in Medina County, 7,531 (18.4%) attend a private institution, while the remaining 33,399 (81.6%) are enrolled in public schools. The age group of 3 to 4 year olds has the highest likelihood of being enrolled in private schools, with 1,001 (50.3% in the age bracket) enrolled. Conversely, the age group of 15 to 17 year olds has the lowest likelihood of being enrolled in a private school, with 6,671 (91.0% in the age bracket) attending a public institution.
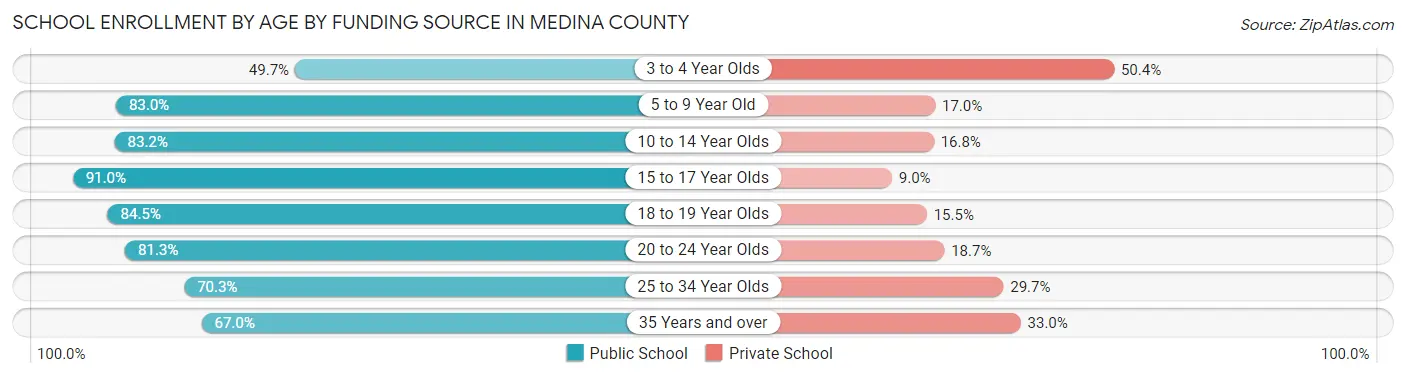
| Age Bracket | Public School | Private School |
| 3 to 4 Year Olds | 987 (49.6%) | 1,001 (50.3%) |
| 5 to 9 Year Old | 8,302 (83.0%) | 1,703 (17.0%) |
| 10 to 14 Year Olds | 9,430 (83.2%) | 1,900 (16.8%) |
| 15 to 17 Year Olds | 6,671 (91.0%) | 657 (9.0%) |
| 18 to 19 Year Olds | 2,645 (84.5%) | 484 (15.5%) |
| 20 to 24 Year Olds | 2,946 (81.3%) | 679 (18.7%) |
| 25 to 34 Year Olds | 1,087 (70.3%) | 460 (29.7%) |
| 35 Years and over | 1,326 (67.0%) | 652 (33.0%) |
| Total | 33,399 (81.6%) | 7,531 (18.4%) |
Educational Attainment by Field of Study in Medina County
Business (11,911 | 24.3%), education (8,316 | 17.0%), science & technology (6,364 | 13.0%), engineering (3,660 | 7.5%), and arts & humanities (2,823 | 5.8%) are the most common fields of study among 48,988 individuals in Medina County who have obtained a bachelor's degree or higher.
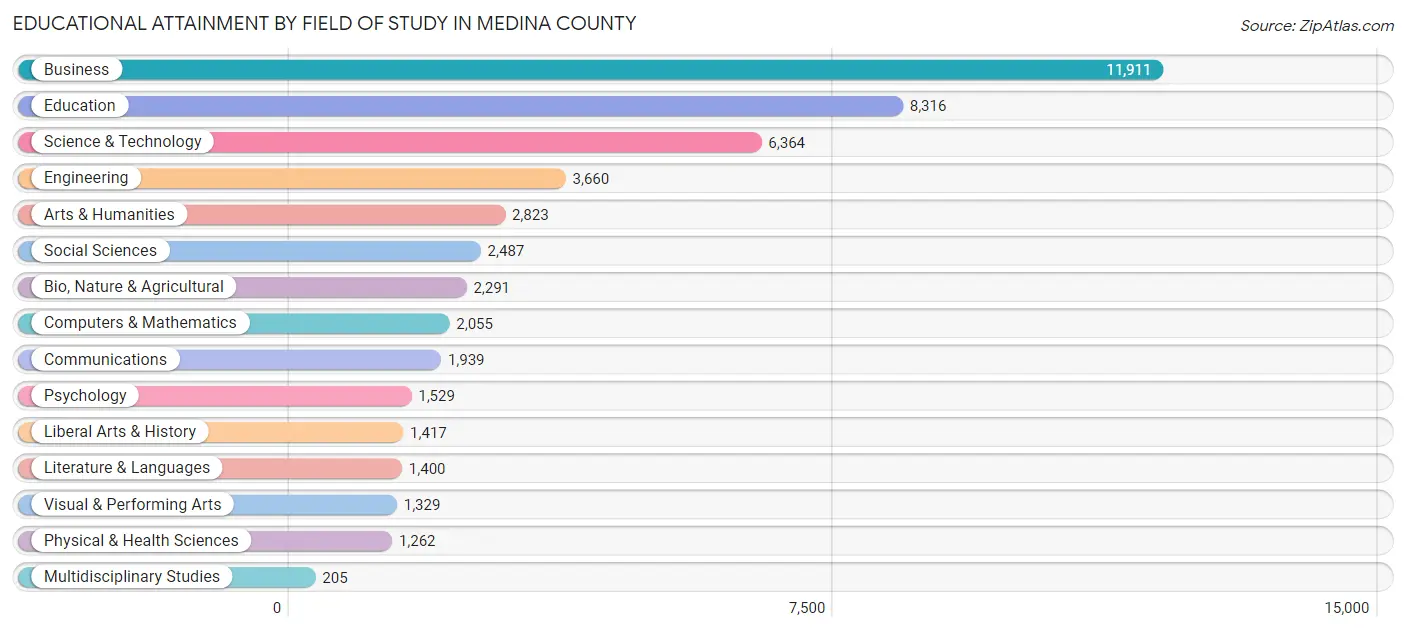
| Field of Study | # Graduates | % Graduates |
| Computers & Mathematics | 2,055 | 4.2% |
| Bio, Nature & Agricultural | 2,291 | 4.7% |
| Physical & Health Sciences | 1,262 | 2.6% |
| Psychology | 1,529 | 3.1% |
| Social Sciences | 2,487 | 5.1% |
| Engineering | 3,660 | 7.5% |
| Multidisciplinary Studies | 205 | 0.4% |
| Science & Technology | 6,364 | 13.0% |
| Business | 11,911 | 24.3% |
| Education | 8,316 | 17.0% |
| Literature & Languages | 1,400 | 2.9% |
| Liberal Arts & History | 1,417 | 2.9% |
| Visual & Performing Arts | 1,329 | 2.7% |
| Communications | 1,939 | 4.0% |
| Arts & Humanities | 2,823 | 5.8% |
| Total | 48,988 | 100.0% |
Transportation & Commute in Medina County
Vehicle Availability by Sex in Medina County
The most prevalent vehicle ownership categories in Medina County are males with 2 vehicles (22,617, accounting for 44.6%) and females with 2 vehicles (18,679, making up 51.3%).
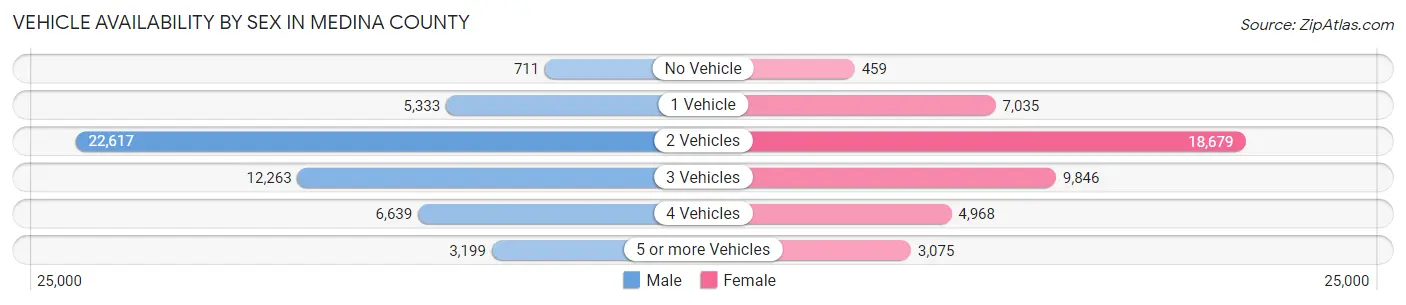
| Vehicles Available | Male | Female |
| No Vehicle | 711 (1.4%) | 459 (1.0%) |
| 1 Vehicle | 5,333 (10.5%) | 7,035 (16.0%) |
| 2 Vehicles | 22,617 (44.6%) | 18,679 (42.4%) |
| 3 Vehicles | 12,263 (24.2%) | 9,846 (22.4%) |
| 4 Vehicles | 6,639 (13.1%) | 4,968 (11.3%) |
| 5 or more Vehicles | 3,199 (6.3%) | 3,075 (7.0%) |
| Total | 50,762 (100.0%) | 44,062 (100.0%) |
Commute Time in Medina County
The most frequently occuring commute durations in Medina County are 30 to 34 minutes (12,603 commuters, 15.0%), 20 to 24 minutes (11,288 commuters, 13.5%), and 15 to 19 minutes (10,319 commuters, 12.3%).
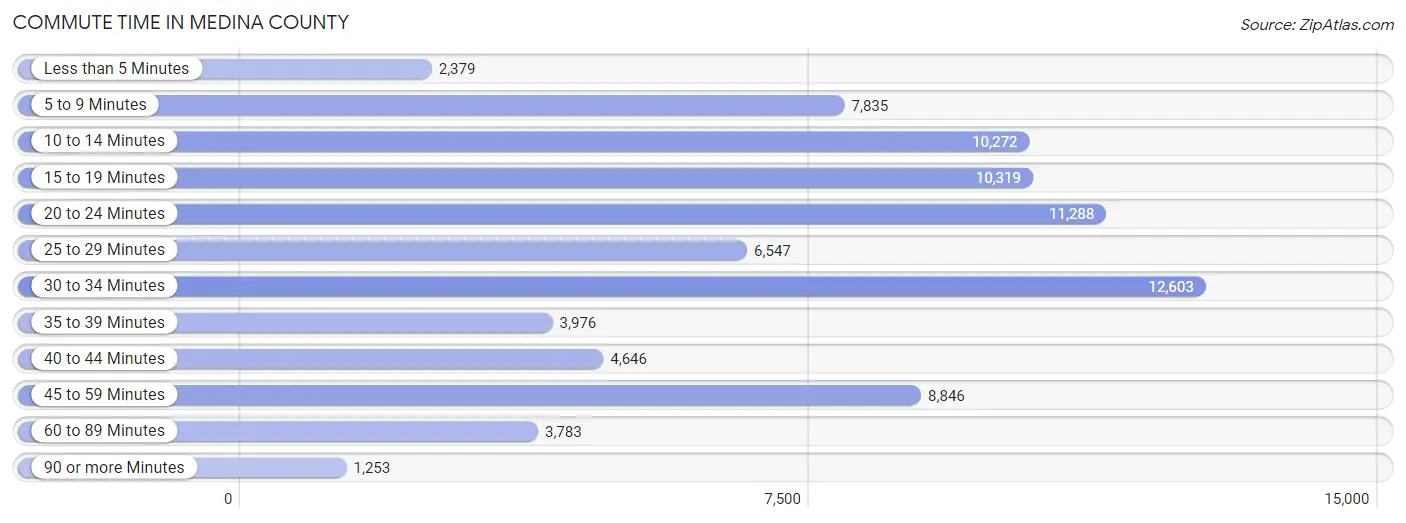
| Commute Time | # Commuters | % Commuters |
| Less than 5 Minutes | 2,379 | 2.8% |
| 5 to 9 Minutes | 7,835 | 9.4% |
| 10 to 14 Minutes | 10,272 | 12.3% |
| 15 to 19 Minutes | 10,319 | 12.3% |
| 20 to 24 Minutes | 11,288 | 13.5% |
| 25 to 29 Minutes | 6,547 | 7.8% |
| 30 to 34 Minutes | 12,603 | 15.0% |
| 35 to 39 Minutes | 3,976 | 4.8% |
| 40 to 44 Minutes | 4,646 | 5.6% |
| 45 to 59 Minutes | 8,846 | 10.6% |
| 60 to 89 Minutes | 3,783 | 4.5% |
| 90 or more Minutes | 1,253 | 1.5% |
Commute Time by Sex in Medina County
The most common commute times in Medina County are 30 to 34 minutes (7,469 commuters, 16.6%) for males and 15 to 19 minutes (5,622 commuters, 14.5%) for females.
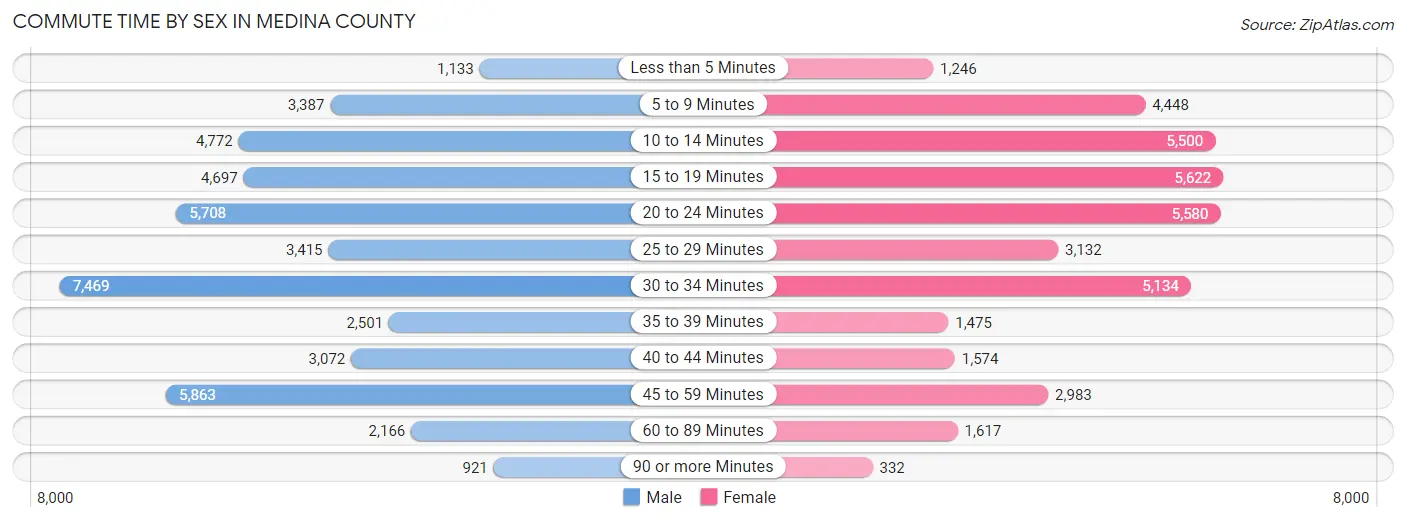
| Commute Time | Male | Female |
| Less than 5 Minutes | 1,133 (2.5%) | 1,246 (3.2%) |
| 5 to 9 Minutes | 3,387 (7.5%) | 4,448 (11.5%) |
| 10 to 14 Minutes | 4,772 (10.6%) | 5,500 (14.2%) |
| 15 to 19 Minutes | 4,697 (10.4%) | 5,622 (14.5%) |
| 20 to 24 Minutes | 5,708 (12.7%) | 5,580 (14.4%) |
| 25 to 29 Minutes | 3,415 (7.6%) | 3,132 (8.1%) |
| 30 to 34 Minutes | 7,469 (16.6%) | 5,134 (13.3%) |
| 35 to 39 Minutes | 2,501 (5.5%) | 1,475 (3.8%) |
| 40 to 44 Minutes | 3,072 (6.8%) | 1,574 (4.1%) |
| 45 to 59 Minutes | 5,863 (13.0%) | 2,983 (7.7%) |
| 60 to 89 Minutes | 2,166 (4.8%) | 1,617 (4.2%) |
| 90 or more Minutes | 921 (2.0%) | 332 (0.9%) |
Time of Departure to Work by Sex in Medina County
The most frequent times of departure to work in Medina County are 7:00 AM to 7:29 AM (7,226, 16.0%) for males and 7:00 AM to 7:29 AM (6,125, 15.9%) for females.
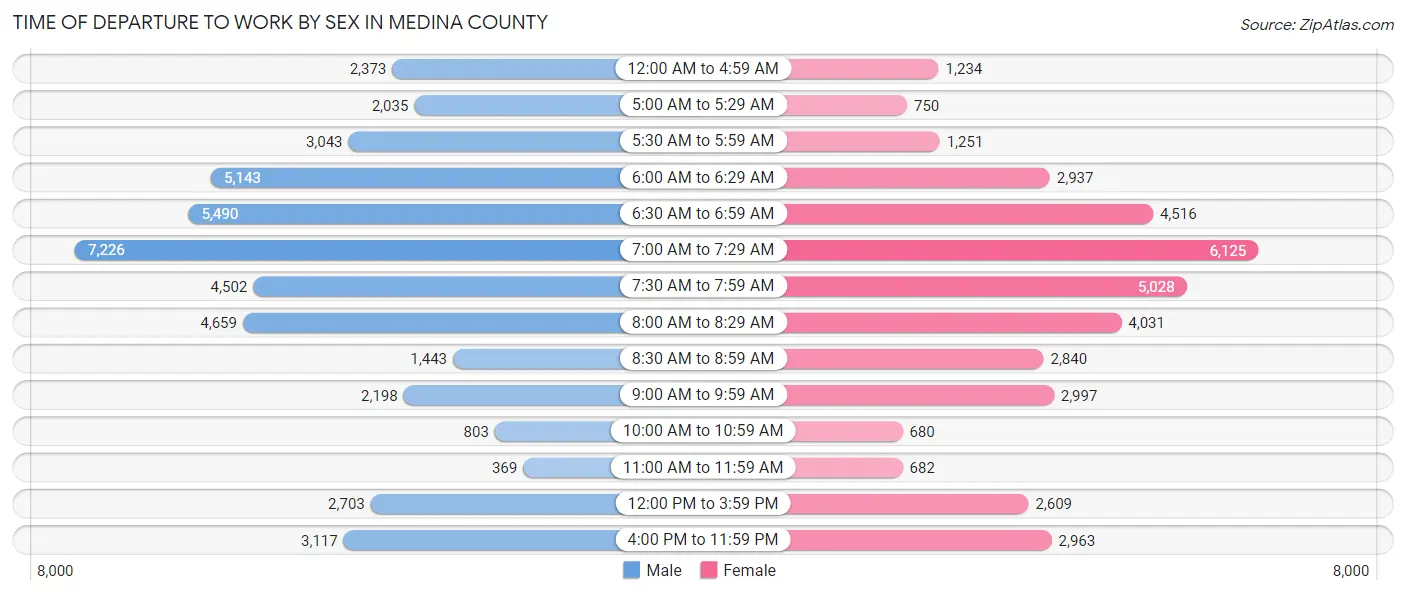
| Time of Departure | Male | Female |
| 12:00 AM to 4:59 AM | 2,373 (5.3%) | 1,234 (3.2%) |
| 5:00 AM to 5:29 AM | 2,035 (4.5%) | 750 (1.9%) |
| 5:30 AM to 5:59 AM | 3,043 (6.8%) | 1,251 (3.2%) |
| 6:00 AM to 6:29 AM | 5,143 (11.4%) | 2,937 (7.6%) |
| 6:30 AM to 6:59 AM | 5,490 (12.2%) | 4,516 (11.7%) |
| 7:00 AM to 7:29 AM | 7,226 (16.0%) | 6,125 (15.9%) |
| 7:30 AM to 7:59 AM | 4,502 (10.0%) | 5,028 (13.0%) |
| 8:00 AM to 8:29 AM | 4,659 (10.3%) | 4,031 (10.4%) |
| 8:30 AM to 8:59 AM | 1,443 (3.2%) | 2,840 (7.3%) |
| 9:00 AM to 9:59 AM | 2,198 (4.9%) | 2,997 (7.8%) |
| 10:00 AM to 10:59 AM | 803 (1.8%) | 680 (1.8%) |
| 11:00 AM to 11:59 AM | 369 (0.8%) | 682 (1.8%) |
| 12:00 PM to 3:59 PM | 2,703 (6.0%) | 2,609 (6.8%) |
| 4:00 PM to 11:59 PM | 3,117 (6.9%) | 2,963 (7.7%) |
| Total | 45,104 (100.0%) | 38,643 (100.0%) |
Housing Occupancy in Medina County
Occupancy by Ownership in Medina County
Of the total 72,097 dwellings in Medina County, owner-occupied units account for 57,548 (79.8%), while renter-occupied units make up 14,549 (20.2%).
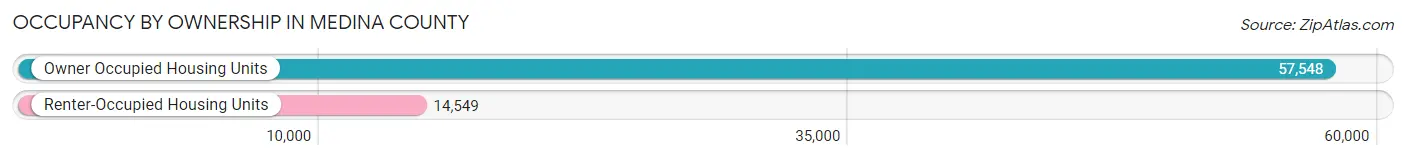
| Occupancy | # Housing Units | % Housing Units |
| Owner Occupied Housing Units | 57,548 | 79.8% |
| Renter-Occupied Housing Units | 14,549 | 20.2% |
| Total Occupied Housing Units | 72,097 | 100.0% |
Occupancy by Household Size in Medina County
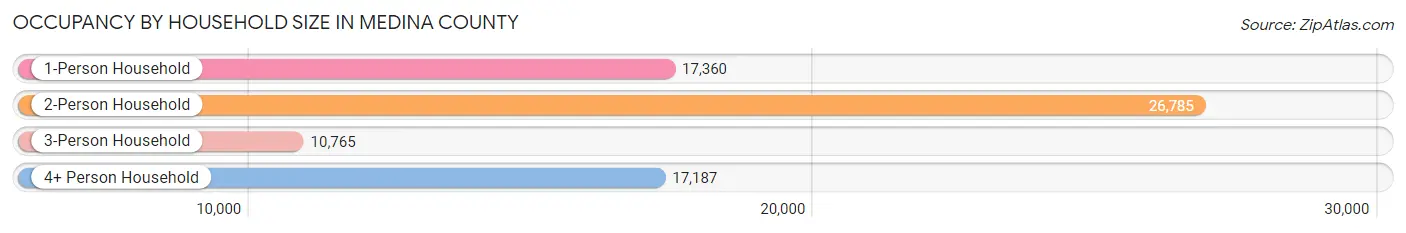
| Household Size | # Housing Units | % Housing Units |
| 1-Person Household | 17,360 | 24.1% |
| 2-Person Household | 26,785 | 37.1% |
| 3-Person Household | 10,765 | 14.9% |
| 4+ Person Household | 17,187 | 23.8% |
| Total Housing Units | 72,097 | 100.0% |
Occupancy by Ownership by Household Size in Medina County
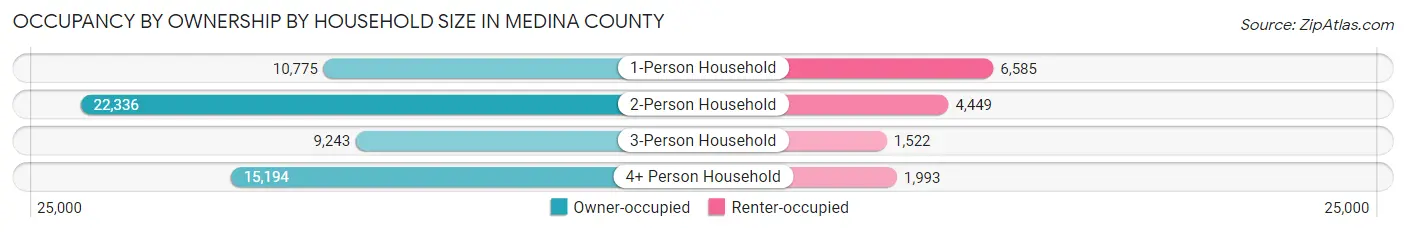
| Household Size | Owner-occupied | Renter-occupied |
| 1-Person Household | 10,775 (62.1%) | 6,585 (37.9%) |
| 2-Person Household | 22,336 (83.4%) | 4,449 (16.6%) |
| 3-Person Household | 9,243 (85.9%) | 1,522 (14.1%) |
| 4+ Person Household | 15,194 (88.4%) | 1,993 (11.6%) |
| Total Housing Units | 57,548 (79.8%) | 14,549 (20.2%) |
Occupancy by Educational Attainment in Medina County
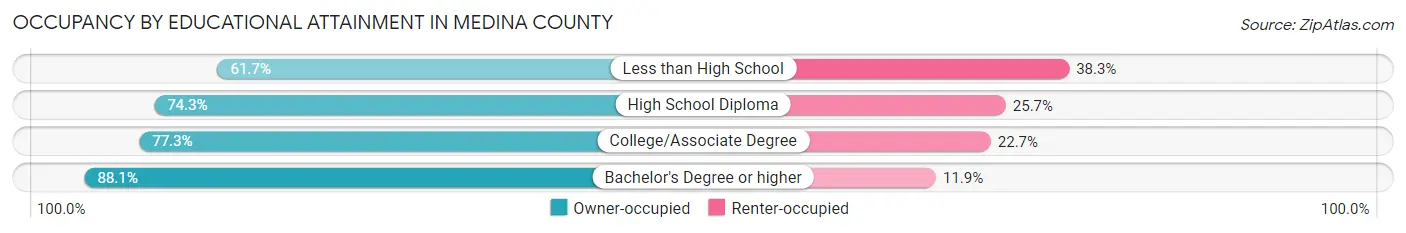
| Household Size | Owner-occupied | Renter-occupied |
| Less than High School | 1,934 (61.7%) | 1,199 (38.3%) |
| High School Diploma | 13,980 (74.3%) | 4,839 (25.7%) |
| College/Associate Degree | 18,168 (77.3%) | 5,348 (22.7%) |
| Bachelor's Degree or higher | 23,466 (88.1%) | 3,163 (11.9%) |
Occupancy by Age of Householder in Medina County
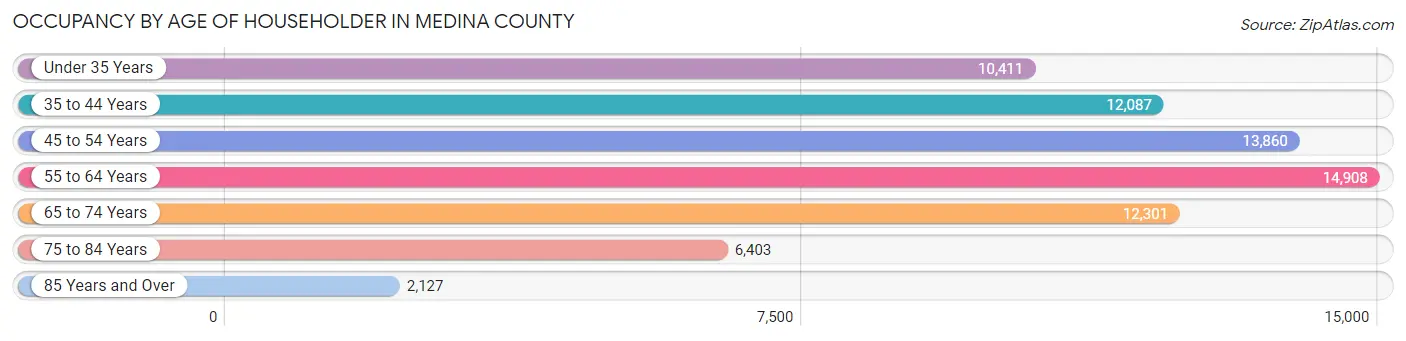
| Age Bracket | # Households | % Households |
| Under 35 Years | 10,411 | 14.4% |
| 35 to 44 Years | 12,087 | 16.8% |
| 45 to 54 Years | 13,860 | 19.2% |
| 55 to 64 Years | 14,908 | 20.7% |
| 65 to 74 Years | 12,301 | 17.1% |
| 75 to 84 Years | 6,403 | 8.9% |
| 85 Years and Over | 2,127 | 2.9% |
| Total | 72,097 | 100.0% |
Housing Finances in Medina County
Median Income by Occupancy in Medina County
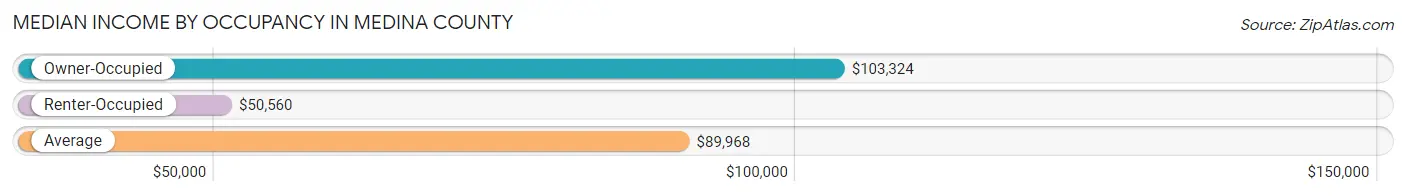
| Occupancy Type | # Households | Median Income |
| Owner-Occupied | 57,548 (79.8%) | $103,324 |
| Renter-Occupied | 14,549 (20.2%) | $50,560 |
| Average | 72,097 (100.0%) | $89,968 |
Occupancy by Householder Income Bracket in Medina County
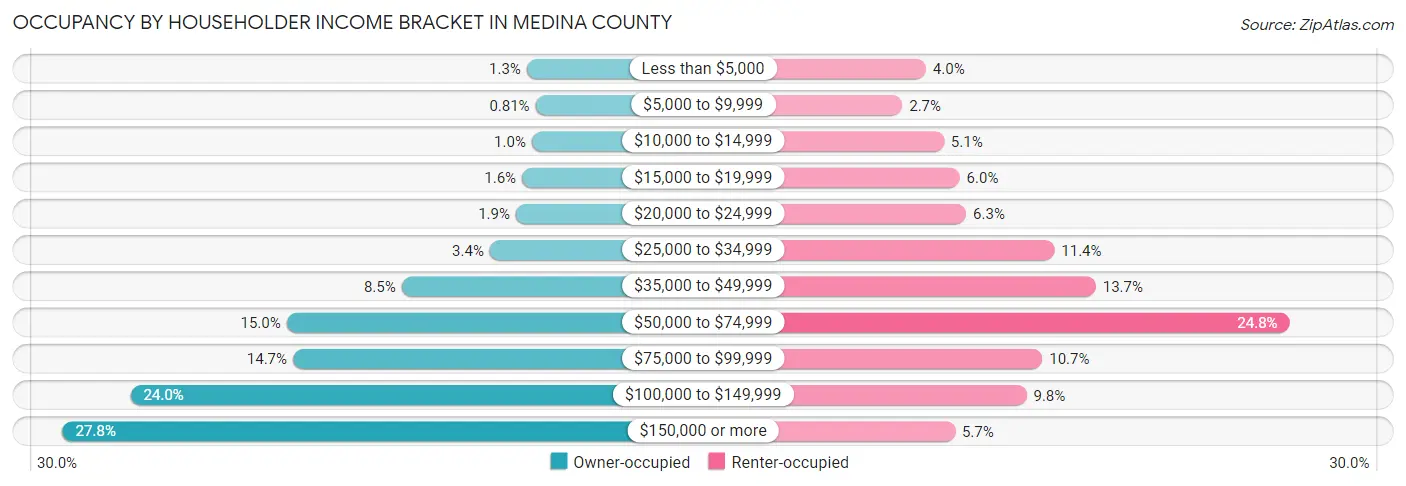
| Income Bracket | Owner-occupied | Renter-occupied |
| Less than $5,000 | 752 (1.3%) | 585 (4.0%) |
| $5,000 to $9,999 | 464 (0.8%) | 389 (2.7%) |
| $10,000 to $14,999 | 587 (1.0%) | 735 (5.1%) |
| $15,000 to $19,999 | 909 (1.6%) | 865 (5.9%) |
| $20,000 to $24,999 | 1,110 (1.9%) | 919 (6.3%) |
| $25,000 to $34,999 | 1,969 (3.4%) | 1,653 (11.4%) |
| $35,000 to $49,999 | 4,870 (8.5%) | 1,998 (13.7%) |
| $50,000 to $74,999 | 8,648 (15.0%) | 3,606 (24.8%) |
| $75,000 to $99,999 | 8,442 (14.7%) | 1,552 (10.7%) |
| $100,000 to $149,999 | 13,783 (23.9%) | 1,421 (9.8%) |
| $150,000 or more | 16,014 (27.8%) | 826 (5.7%) |
| Total | 57,548 (100.0%) | 14,549 (100.0%) |
Monthly Housing Cost Tiers in Medina County
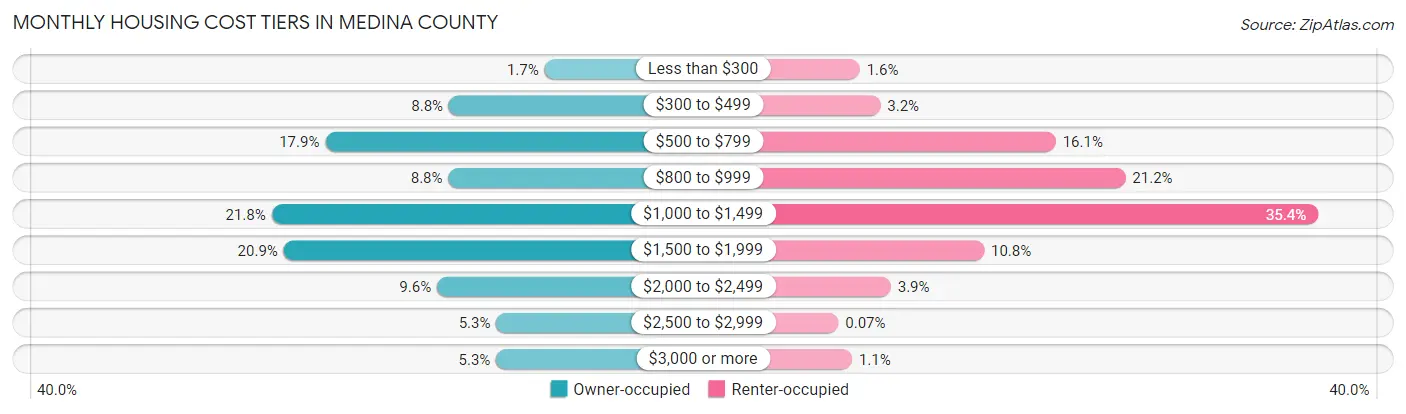
| Monthly Cost | Owner-occupied | Renter-occupied |
| Less than $300 | 982 (1.7%) | 239 (1.6%) |
| $300 to $499 | 5,033 (8.7%) | 460 (3.2%) |
| $500 to $799 | 10,279 (17.9%) | 2,339 (16.1%) |
| $800 to $999 | 5,056 (8.8%) | 3,086 (21.2%) |
| $1,000 to $1,499 | 12,554 (21.8%) | 5,149 (35.4%) |
| $1,500 to $1,999 | 12,039 (20.9%) | 1,571 (10.8%) |
| $2,000 to $2,499 | 5,543 (9.6%) | 572 (3.9%) |
| $2,500 to $2,999 | 3,027 (5.3%) | 10 (0.1%) |
| $3,000 or more | 3,035 (5.3%) | 155 (1.1%) |
| Total | 57,548 (100.0%) | 14,549 (100.0%) |
Physical Housing Characteristics in Medina County
Housing Structures in Medina County
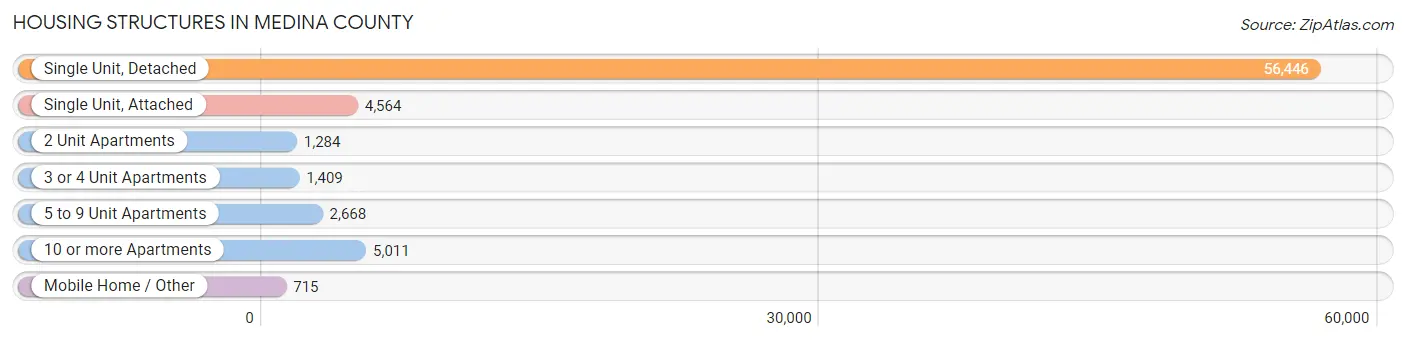
| Structure Type | # Housing Units | % Housing Units |
| Single Unit, Detached | 56,446 | 78.3% |
| Single Unit, Attached | 4,564 | 6.3% |
| 2 Unit Apartments | 1,284 | 1.8% |
| 3 or 4 Unit Apartments | 1,409 | 1.9% |
| 5 to 9 Unit Apartments | 2,668 | 3.7% |
| 10 or more Apartments | 5,011 | 7.0% |
| Mobile Home / Other | 715 | 1.0% |
| Total | 72,097 | 100.0% |
Housing Structures by Occupancy in Medina County
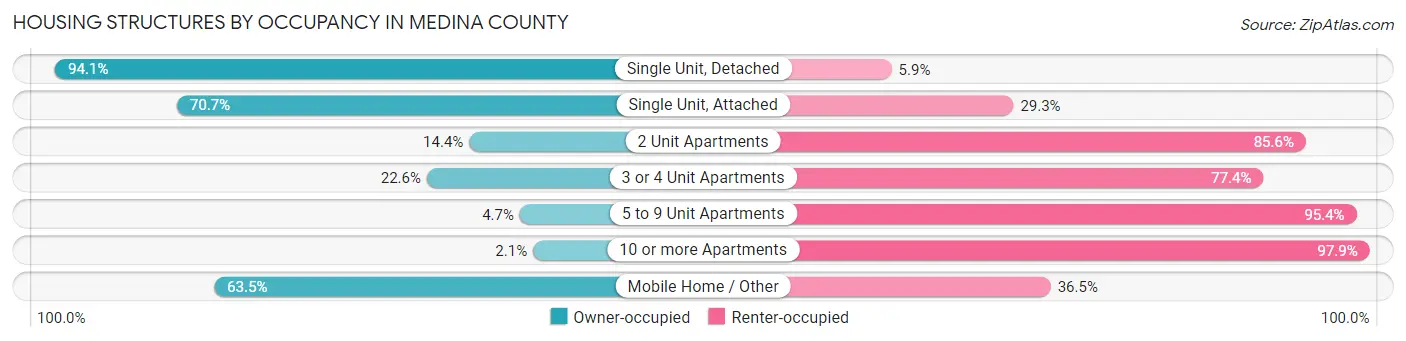
| Structure Type | Owner-occupied | Renter-occupied |
| Single Unit, Detached | 53,135 (94.1%) | 3,311 (5.9%) |
| Single Unit, Attached | 3,226 (70.7%) | 1,338 (29.3%) |
| 2 Unit Apartments | 185 (14.4%) | 1,099 (85.6%) |
| 3 or 4 Unit Apartments | 318 (22.6%) | 1,091 (77.4%) |
| 5 to 9 Unit Apartments | 124 (4.6%) | 2,544 (95.4%) |
| 10 or more Apartments | 106 (2.1%) | 4,905 (97.9%) |
| Mobile Home / Other | 454 (63.5%) | 261 (36.5%) |
| Total | 57,548 (79.8%) | 14,549 (20.2%) |
Housing Structures by Number of Rooms in Medina County
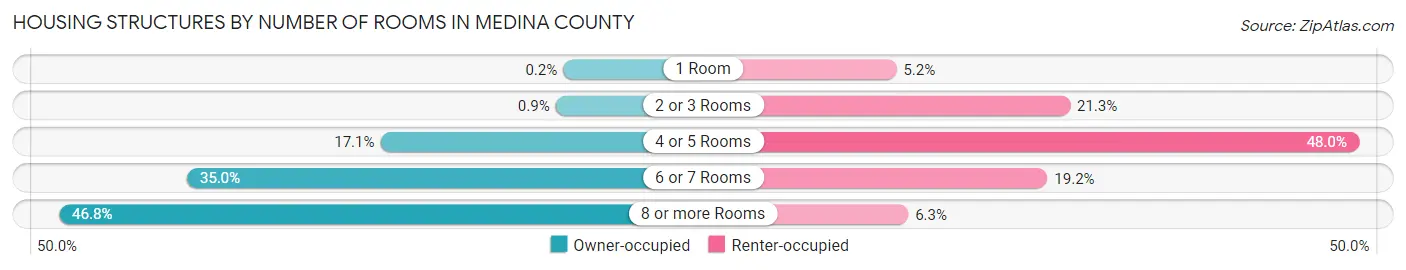
| Number of Rooms | Owner-occupied | Renter-occupied |
| 1 Room | 117 (0.2%) | 761 (5.2%) |
| 2 or 3 Rooms | 520 (0.9%) | 3,096 (21.3%) |
| 4 or 5 Rooms | 9,842 (17.1%) | 6,980 (48.0%) |
| 6 or 7 Rooms | 20,134 (35.0%) | 2,792 (19.2%) |
| 8 or more Rooms | 26,935 (46.8%) | 920 (6.3%) |
| Total | 57,548 (100.0%) | 14,549 (100.0%) |
Housing Structure by Heating Type in Medina County
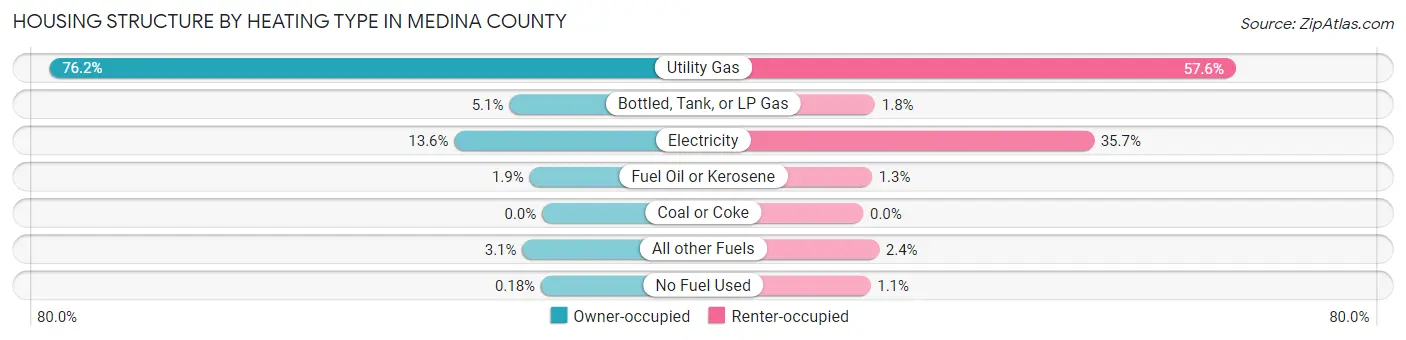
| Heating Type | Owner-occupied | Renter-occupied |
| Utility Gas | 43,845 (76.2%) | 8,383 (57.6%) |
| Bottled, Tank, or LP Gas | 2,918 (5.1%) | 265 (1.8%) |
| Electricity | 7,804 (13.6%) | 5,188 (35.7%) |
| Fuel Oil or Kerosene | 1,119 (1.9%) | 195 (1.3%) |
| Coal or Coke | 0 (0.0%) | 0 (0.0%) |
| All other Fuels | 1,756 (3.0%) | 355 (2.4%) |
| No Fuel Used | 106 (0.2%) | 163 (1.1%) |
| Total | 57,548 (100.0%) | 14,549 (100.0%) |
Household Vehicle Usage in Medina County
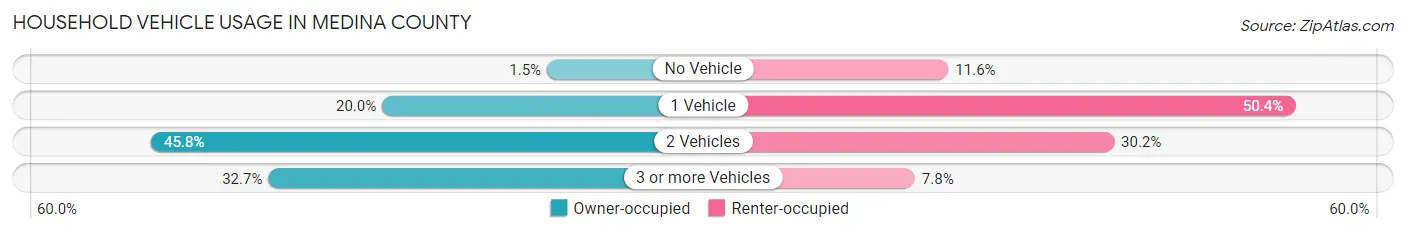
| Vehicles per Household | Owner-occupied | Renter-occupied |
| No Vehicle | 858 (1.5%) | 1,686 (11.6%) |
| 1 Vehicle | 11,487 (20.0%) | 7,335 (50.4%) |
| 2 Vehicles | 26,377 (45.8%) | 4,388 (30.2%) |
| 3 or more Vehicles | 18,826 (32.7%) | 1,140 (7.8%) |
| Total | 57,548 (100.0%) | 14,549 (100.0%) |
Real Estate & Mortgages in Medina County
Real Estate and Mortgage Overview in Medina County
| Characteristic | Without Mortgage | With Mortgage |
| Housing Units | 18,607 | 38,941 |
| Median Property Value | $237,400 | $256,500 |
| Median Household Income | $76,295 | $12,416 |
| Monthly Housing Costs | $613 | $2,961 |
| Real Estate Taxes | $3,061 | $489 |
Property Value by Mortgage Status in Medina County
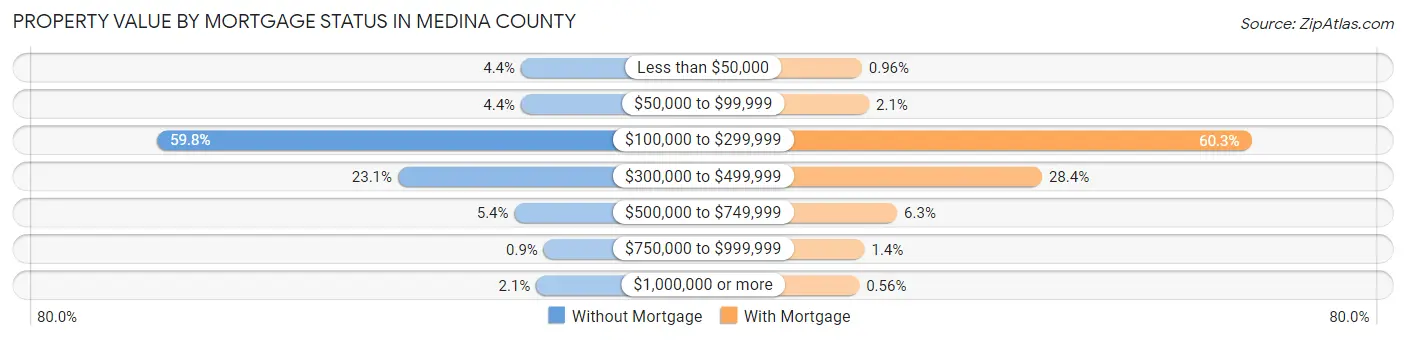
| Property Value | Without Mortgage | With Mortgage |
| Less than $50,000 | 815 (4.4%) | 374 (1.0%) |
| $50,000 to $99,999 | 813 (4.4%) | 804 (2.1%) |
| $100,000 to $299,999 | 11,129 (59.8%) | 23,481 (60.3%) |
| $300,000 to $499,999 | 4,302 (23.1%) | 11,062 (28.4%) |
| $500,000 to $749,999 | 999 (5.4%) | 2,469 (6.3%) |
| $750,000 to $999,999 | 167 (0.9%) | 533 (1.4%) |
| $1,000,000 or more | 382 (2.1%) | 218 (0.6%) |
| Total | 18,607 (100.0%) | 38,941 (100.0%) |
Household Income by Mortgage Status in Medina County
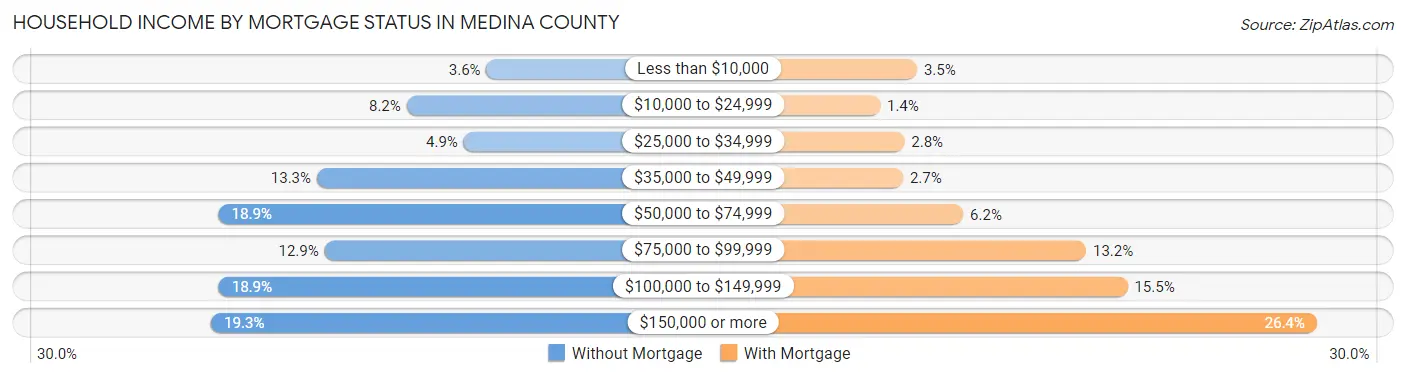
| Household Income | Without Mortgage | With Mortgage |
| Less than $10,000 | 672 (3.6%) | 1,368 (3.5%) |
| $10,000 to $24,999 | 1,520 (8.2%) | 544 (1.4%) |
| $25,000 to $34,999 | 914 (4.9%) | 1,086 (2.8%) |
| $35,000 to $49,999 | 2,475 (13.3%) | 1,055 (2.7%) |
| $50,000 to $74,999 | 3,519 (18.9%) | 2,395 (6.1%) |
| $75,000 to $99,999 | 2,392 (12.9%) | 5,129 (13.2%) |
| $100,000 to $149,999 | 3,517 (18.9%) | 6,050 (15.5%) |
| $150,000 or more | 3,598 (19.3%) | 10,266 (26.4%) |
| Total | 18,607 (100.0%) | 38,941 (100.0%) |
Property Value to Household Income Ratio in Medina County
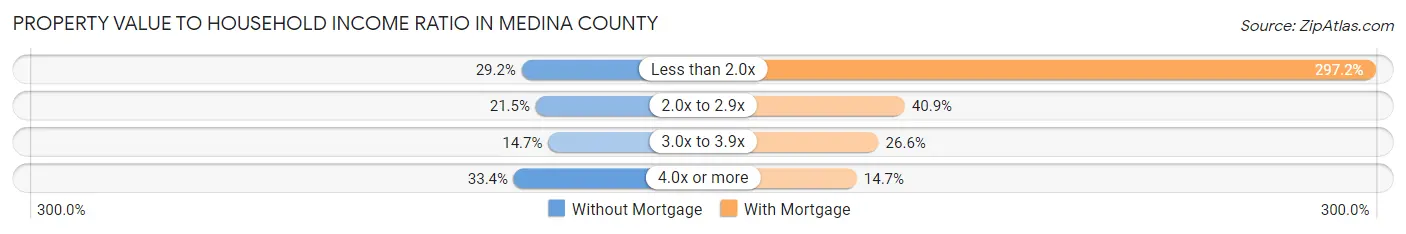
| Value-to-Income Ratio | Without Mortgage | With Mortgage |
| Less than 2.0x | 5,426 (29.2%) | 115,730 (297.2%) |
| 2.0x to 2.9x | 3,995 (21.5%) | 15,910 (40.9%) |
| 3.0x to 3.9x | 2,730 (14.7%) | 10,340 (26.6%) |
| 4.0x or more | 6,222 (33.4%) | 5,717 (14.7%) |
| Total | 18,607 (100.0%) | 38,941 (100.0%) |
Real Estate Taxes by Mortgage Status in Medina County
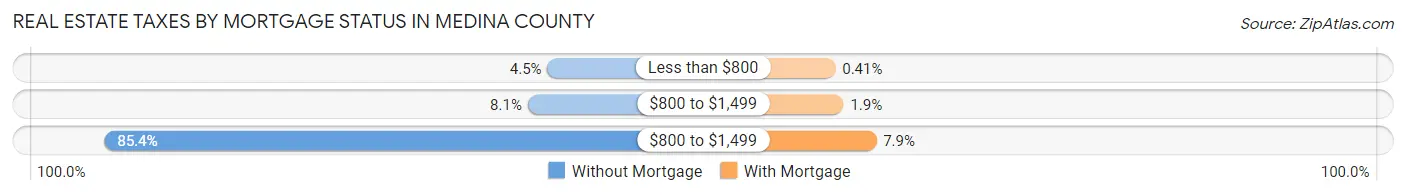
| Property Taxes | Without Mortgage | With Mortgage |
| Less than $800 | 837 (4.5%) | 160 (0.4%) |
| $800 to $1,499 | 1,507 (8.1%) | 740 (1.9%) |
| $800 to $1,499 | 15,898 (85.4%) | 3,067 (7.9%) |
| Total | 18,607 (100.0%) | 38,941 (100.0%) |
Health & Disability in Medina County
Health Insurance Coverage by Age in Medina County
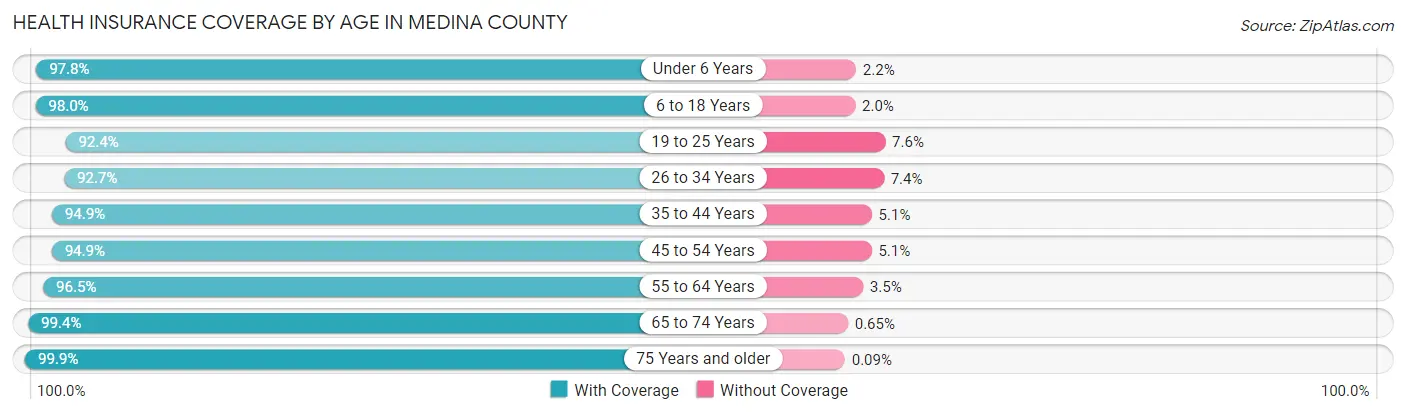
| Age Bracket | With Coverage | Without Coverage |
| Under 6 Years | 10,812 (97.8%) | 240 (2.2%) |
| 6 to 18 Years | 30,485 (98.0%) | 630 (2.0%) |
| 19 to 25 Years | 12,116 (92.4%) | 999 (7.6%) |
| 26 to 34 Years | 16,278 (92.6%) | 1,291 (7.3%) |
| 35 to 44 Years | 22,030 (94.9%) | 1,184 (5.1%) |
| 45 to 54 Years | 23,882 (94.9%) | 1,272 (5.1%) |
| 55 to 64 Years | 25,628 (96.5%) | 920 (3.5%) |
| 65 to 74 Years | 20,128 (99.4%) | 131 (0.6%) |
| 75 Years and older | 13,026 (99.9%) | 12 (0.1%) |
| Total | 174,385 (96.3%) | 6,679 (3.7%) |
Health Insurance Coverage by Citizenship Status in Medina County
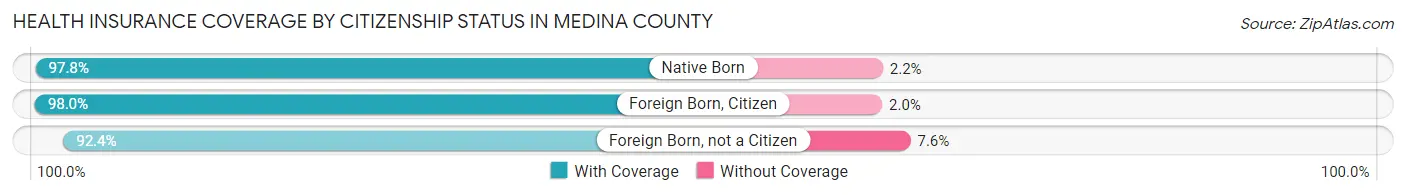
| Citizenship Status | With Coverage | Without Coverage |
| Native Born | 10,812 (97.8%) | 240 (2.2%) |
| Foreign Born, Citizen | 30,485 (98.0%) | 630 (2.0%) |
| Foreign Born, not a Citizen | 12,116 (92.4%) | 999 (7.6%) |
Health Insurance Coverage by Household Income in Medina County
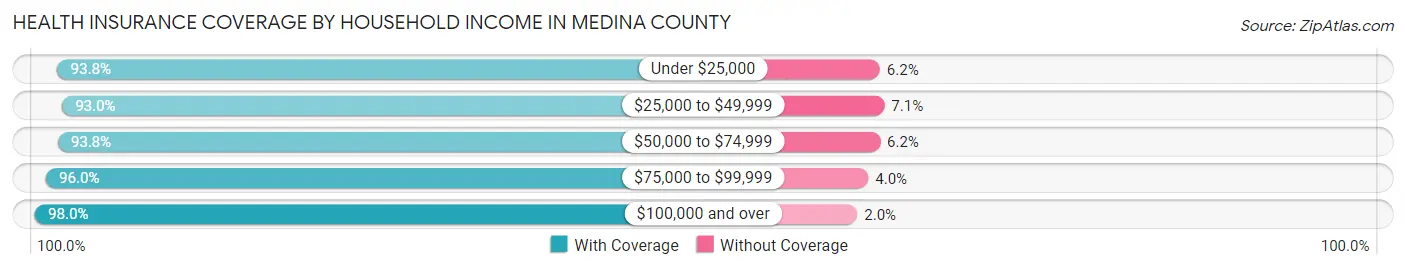
| Household Income | With Coverage | Without Coverage |
| Under $25,000 | 10,018 (93.8%) | 662 (6.2%) |
| $25,000 to $49,999 | 17,922 (92.9%) | 1,360 (7.0%) |
| $50,000 to $74,999 | 25,118 (93.8%) | 1,672 (6.2%) |
| $75,000 to $99,999 | 24,450 (96.0%) | 1,029 (4.0%) |
| $100,000 and over | 96,565 (98.0%) | 1,954 (2.0%) |
Public vs Private Health Insurance Coverage by Age in Medina County
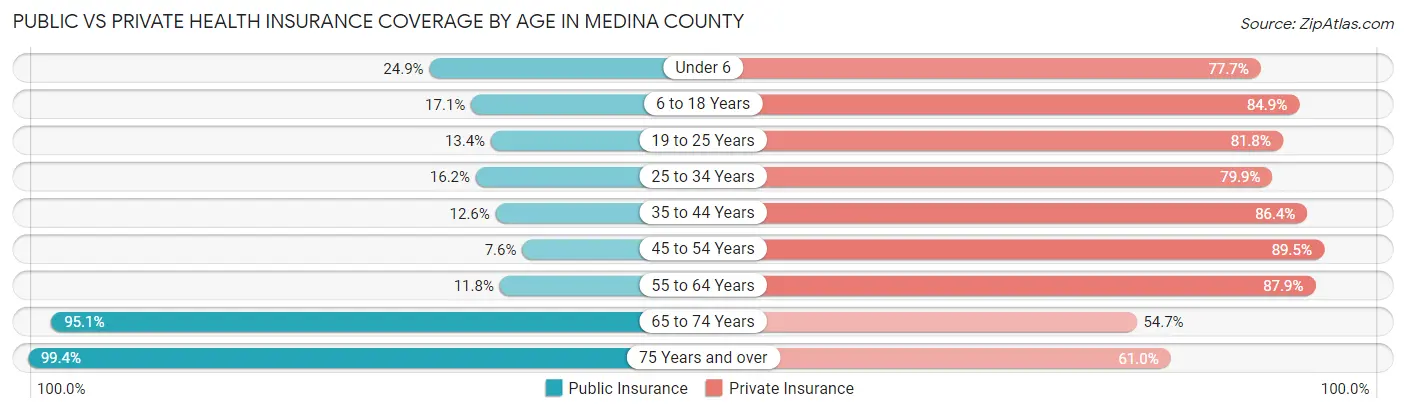
| Age Bracket | Public Insurance | Private Insurance |
| Under 6 | 2,747 (24.9%) | 8,591 (77.7%) |
| 6 to 18 Years | 5,325 (17.1%) | 26,401 (84.9%) |
| 19 to 25 Years | 1,763 (13.4%) | 10,733 (81.8%) |
| 25 to 34 Years | 2,853 (16.2%) | 14,039 (79.9%) |
| 35 to 44 Years | 2,918 (12.6%) | 20,053 (86.4%) |
| 45 to 54 Years | 1,916 (7.6%) | 22,499 (89.4%) |
| 55 to 64 Years | 3,135 (11.8%) | 23,327 (87.9%) |
| 65 to 74 Years | 19,256 (95.1%) | 11,079 (54.7%) |
| 75 Years and over | 12,963 (99.4%) | 7,955 (61.0%) |
| Total | 52,876 (29.2%) | 144,677 (79.9%) |
Disability Status by Sex by Age in Medina County
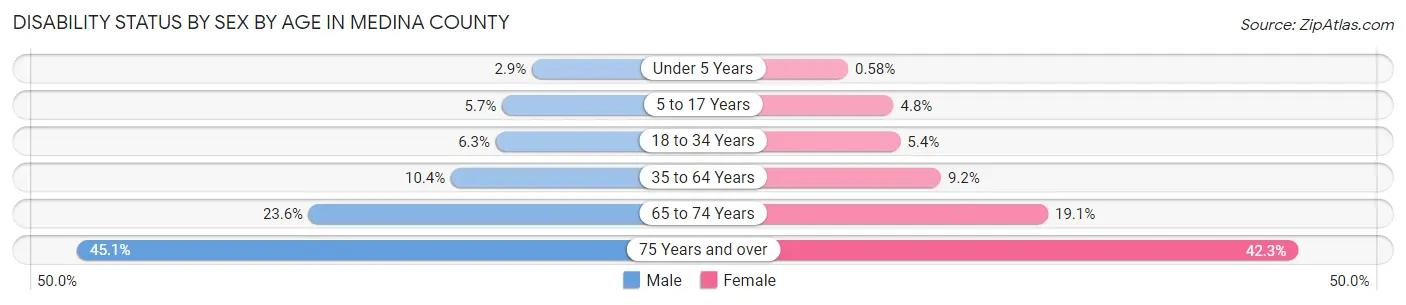
| Age Bracket | Male | Female |
| Under 5 Years | 136 (2.9%) | 26 (0.6%) |
| 5 to 17 Years | 884 (5.7%) | 716 (4.8%) |
| 18 to 34 Years | 1,066 (6.3%) | 882 (5.4%) |
| 35 to 64 Years | 3,928 (10.4%) | 3,426 (9.2%) |
| 65 to 74 Years | 2,300 (23.6%) | 2,013 (19.1%) |
| 75 Years and over | 2,565 (45.1%) | 3,114 (42.3%) |
Disability Class by Sex by Age in Medina County
Disability Class: Hearing Difficulty
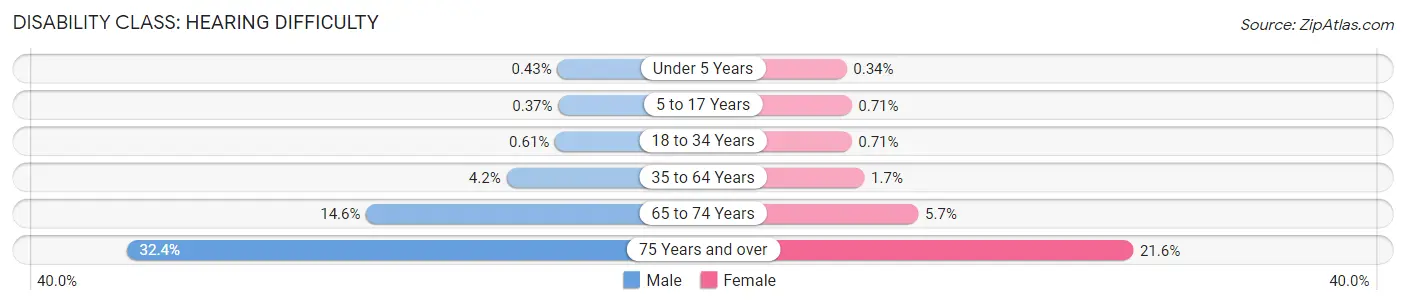
| Age Bracket | Male | Female |
| Under 5 Years | 20 (0.4%) | 15 (0.3%) |
| 5 to 17 Years | 58 (0.4%) | 105 (0.7%) |
| 18 to 34 Years | 103 (0.6%) | 116 (0.7%) |
| 35 to 64 Years | 1,592 (4.2%) | 618 (1.7%) |
| 65 to 74 Years | 1,425 (14.6%) | 596 (5.7%) |
| 75 Years and over | 1,843 (32.4%) | 1,590 (21.6%) |
Disability Class: Vision Difficulty
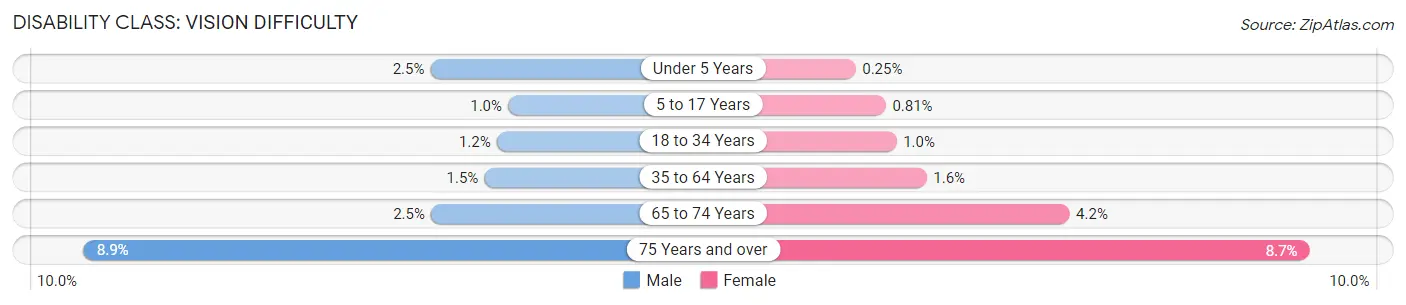
| Age Bracket | Male | Female |
| Under 5 Years | 116 (2.5%) | 11 (0.3%) |
| 5 to 17 Years | 160 (1.0%) | 120 (0.8%) |
| 18 to 34 Years | 211 (1.2%) | 164 (1.0%) |
| 35 to 64 Years | 553 (1.5%) | 586 (1.6%) |
| 65 to 74 Years | 240 (2.5%) | 444 (4.2%) |
| 75 Years and over | 506 (8.9%) | 638 (8.7%) |
Disability Class: Cognitive Difficulty
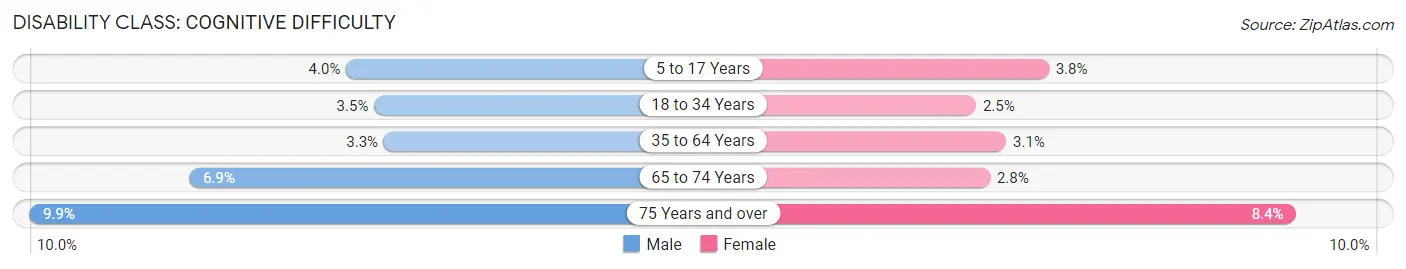
| Age Bracket | Male | Female |
| 5 to 17 Years | 628 (4.0%) | 571 (3.8%) |
| 18 to 34 Years | 597 (3.5%) | 404 (2.5%) |
| 35 to 64 Years | 1,257 (3.3%) | 1,135 (3.0%) |
| 65 to 74 Years | 675 (6.9%) | 289 (2.8%) |
| 75 Years and over | 563 (9.9%) | 619 (8.4%) |
Disability Class: Ambulatory Difficulty
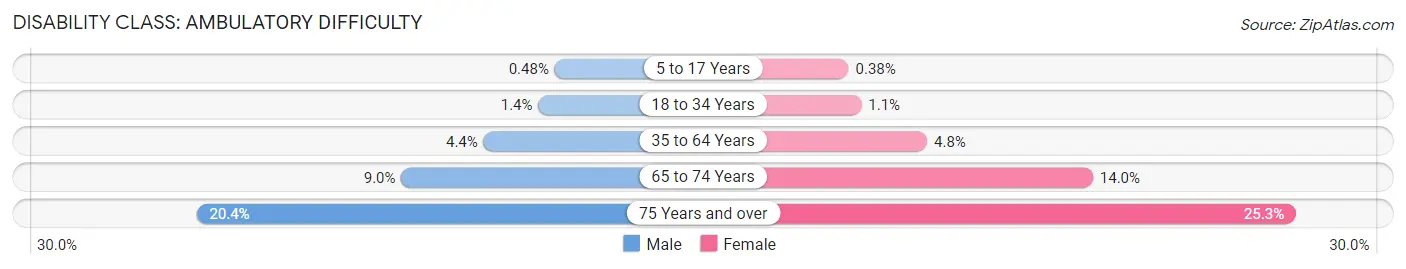
| Age Bracket | Male | Female |
| 5 to 17 Years | 75 (0.5%) | 56 (0.4%) |
| 18 to 34 Years | 237 (1.4%) | 177 (1.1%) |
| 35 to 64 Years | 1,673 (4.4%) | 1,766 (4.8%) |
| 65 to 74 Years | 879 (9.0%) | 1,470 (14.0%) |
| 75 Years and over | 1,161 (20.4%) | 1,860 (25.3%) |
Disability Class: Self-Care Difficulty
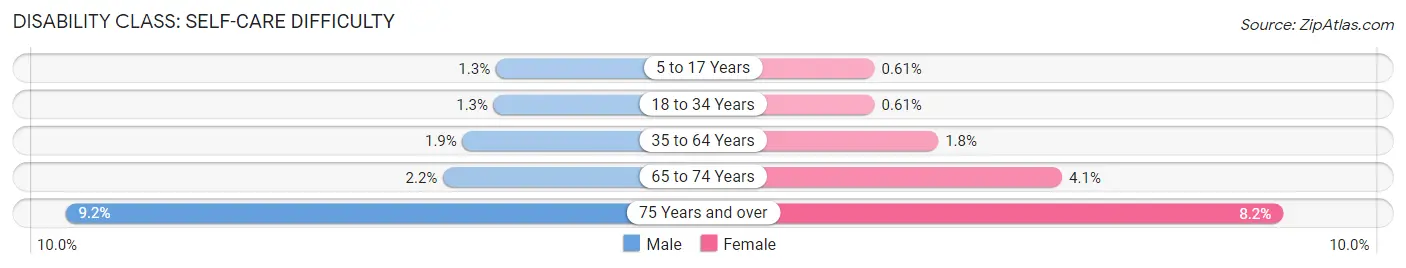
| Age Bracket | Male | Female |
| 5 to 17 Years | 195 (1.3%) | 91 (0.6%) |
| 18 to 34 Years | 219 (1.3%) | 99 (0.6%) |
| 35 to 64 Years | 705 (1.9%) | 667 (1.8%) |
| 65 to 74 Years | 217 (2.2%) | 430 (4.1%) |
| 75 Years and over | 525 (9.2%) | 602 (8.2%) |
Technology Access in Medina County
Computing Device Access in Medina County
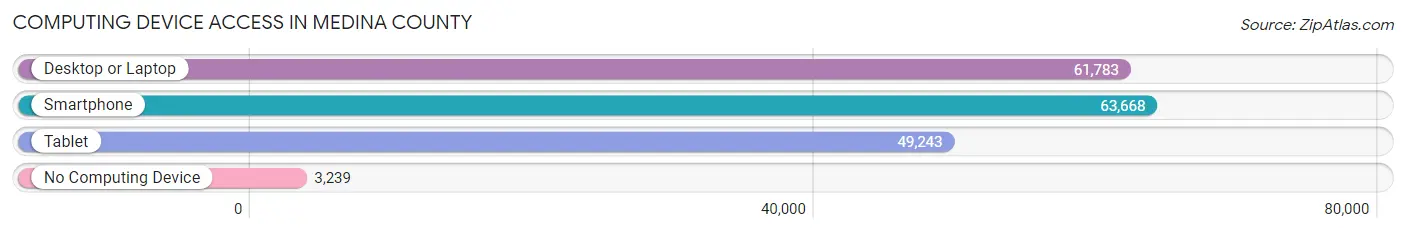
| Device Type | # Households | % Households |
| Desktop or Laptop | 61,783 | 85.7% |
| Smartphone | 63,668 | 88.3% |
| Tablet | 49,243 | 68.3% |
| No Computing Device | 3,239 | 4.5% |
| Total | 72,097 | 100.0% |
Internet Access in Medina County
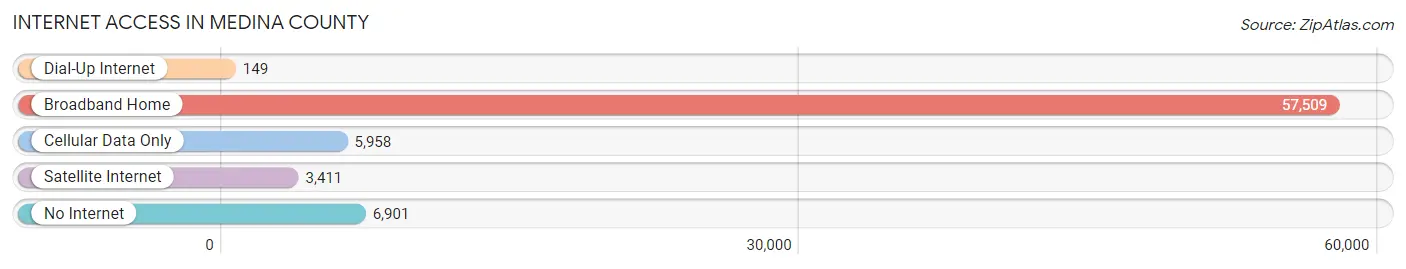
| Internet Type | # Households | % Households |
| Dial-Up Internet | 149 | 0.2% |
| Broadband Home | 57,509 | 79.8% |
| Cellular Data Only | 5,958 | 8.3% |
| Satellite Internet | 3,411 | 4.7% |
| No Internet | 6,901 | 9.6% |
| Total | 72,097 | 100.0% |
Medina County Summary
Medina County is located in the northeastern part of Ohio, and is part of the Cleveland-Akron-Canton metropolitan area. It is bordered by Lorain County to the north, Summit County to the east, Wayne County to the south, and Cuyahoga County to the west. The county seat is Medina, and the county is named after the city. The county has a total area of 422 square miles, of which 416 square miles is land and 6 square miles is water.
History
Medina County was established in 1818, and was originally part of the Connecticut Western Reserve. The county was named after the city of Medina, which was named after the city of Medina in Saudi Arabia. The county was originally part of the Connecticut Western Reserve, and was part of the Firelands, which was a tract of land set aside for veterans of the Revolutionary War.
The first settlers in the county were mostly of German and English descent, and the county was largely agricultural. The county was also home to several industries, including iron and steel production, and the manufacture of agricultural implements.
Geography
Medina County is located in the northeastern part of Ohio, and is part of the Cleveland-Akron-Canton metropolitan area. It is bordered by Lorain County to the north, Summit County to the east, Wayne County to the south, and Cuyahoga County to the west. The county seat is Medina, and the county is named after the city. The county has a total area of 422 square miles, of which 416 square miles is land and 6 square miles is water.
The county is mostly flat, with some rolling hills in the northern and eastern parts of the county. The county is drained by the Chippewa and Rocky rivers, and is home to several lakes, including Chippewa Lake, Lake Medina, and Lake Rockwell.
Economy
Medina County has a diverse economy, with a mix of manufacturing, agriculture, and service industries. The county is home to several large employers, including the Cleveland Clinic, the University of Akron, and the Cleveland Browns.
The county is also home to several smaller businesses, including several wineries, a brewery, and several small farms. The county is also home to several technology companies, including the software company, Oracle.
Demographics
As of the 2010 census, the population of Medina County was 172,332. The racial makeup of the county was 94.2% White, 2.7% African American, 0.3% Native American, 1.2% Asian, 0.1% Pacific Islander, 0.7% from other races, and 1.0% from two or more races. Hispanic or Latino of any race were 2.3% of the population.
The median income for a household in the county was $50,945, and the median income for a family was $60,945. The per capita income for the county was $25,945. About 6.2% of families and 8.3% of the population were below the poverty line, including 10.2% of those under age 18 and 6.2% of those age 65 or over.
Common Questions
What is the Total Population of Medina County?
Total Population of Medina County is 182,347.
What is the Total Male Population of Medina County?
Total Male Population of Medina County is 90,831.
What is the Total Female Population of Medina County?
Total Female Population of Medina County is 91,516.
What is the Ratio of Males per 100 Females in Medina County?
There are 99.25 Males per 100 Females in Medina County.
What is the Ratio of Females per 100 Males in Medina County?
There are 100.75 Females per 100 Males in Medina County.
What is the Median Population Age in Medina County?
Median Population Age in Medina County is 42.7 Years.
What is the Average Family Size in Medina County
Average Family Size in Medina County is 3.0 People.
What is the Average Household Size in Medina County
Average Household Size in Medina County is 2.5 People.
What is Per Capita Income in Medina County?
Per Capita income in Medina County is $45,038.
What is the Median Family Income in Medina County?
Median Family Income in Medina County is $108,701.
What is the Median Household income in Medina County?
Median Household Income in Medina County is $89,968.
What is Income or Wage Gap in Medina County?
Income or Wage Gap in Medina County is 37.6%.
Women in Medina County earn 62.4 cents for every dollar earned by a man.
What is Family Income Deficit in Medina County?
Family Income Deficit in Medina County is $11,323.
Families that are below poverty line in Medina County earn $11,323 less on average than the poverty threshold level.
What is Inequality or Gini Index in Medina County?
Inequality or Gini Index in Medina County is 0.42.
How Large is the Labor Force in Medina County?
There are 99,362 People in the Labor Forcein in Medina County.
What is the Percentage of People in the Labor Force in Medina County?
67.2% of People are in the Labor Force in Medina County.
What is the Unemployment Rate in Medina County?
Unemployment Rate in Medina County is 3.0%.