Mahoning County, OH
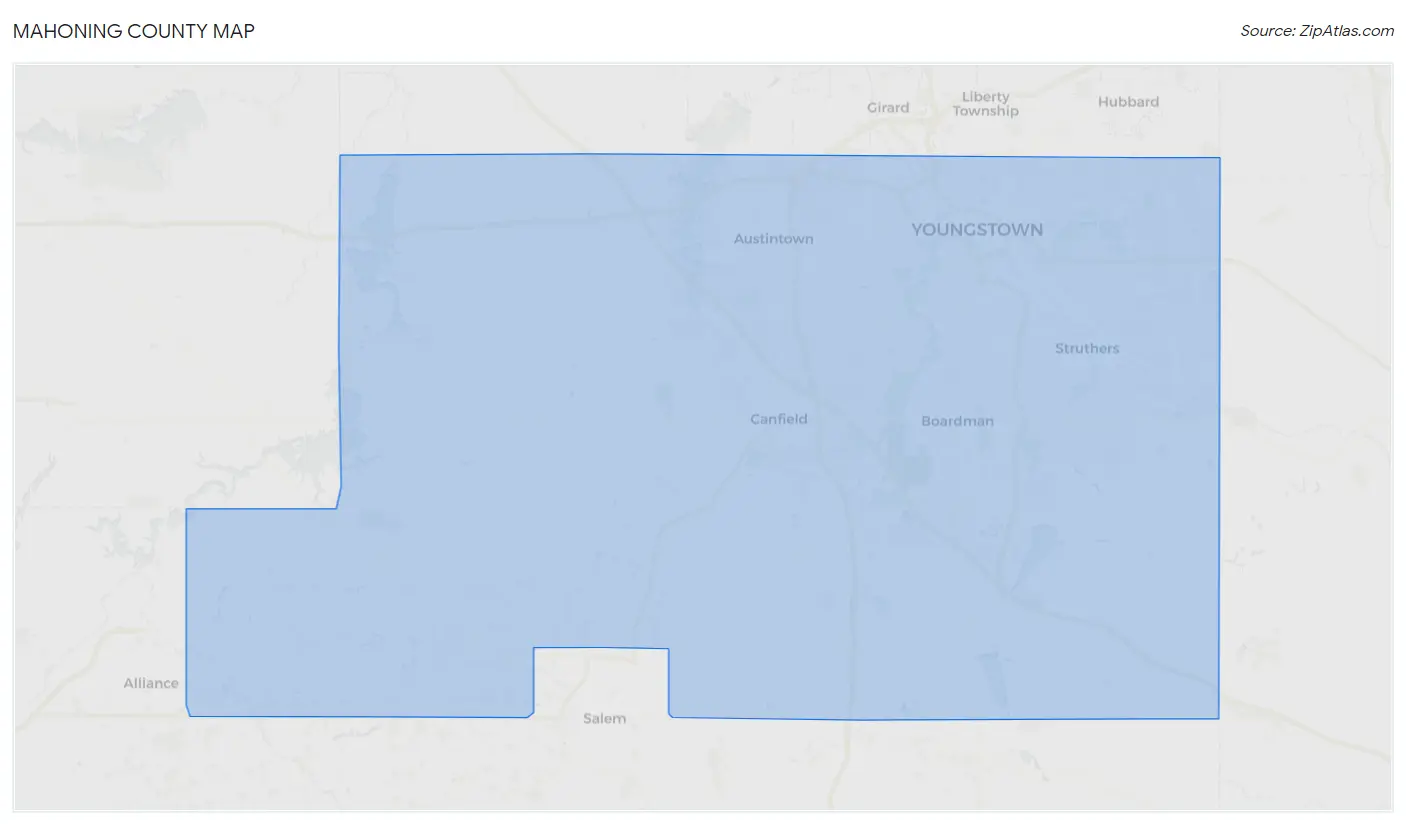
Mahoning County Map
Mahoning County Overview
227,979
TOTAL POPULATION
112,026
MALE POPULATION
115,953
FEMALE POPULATION
96.61
MALES / 100 FEMALES
103.51
FEMALES / 100 MALES
43.3
MEDIAN AGE
2.9
AVG FAMILY SIZE
2.3
AVG HOUSEHOLD SIZE
$32,591
PER CAPITA INCOME
$73,583
AVG FAMILY INCOME
$54,279
AVG HOUSEHOLD INCOME
33.0%
WAGE / INCOME GAP [ % ]
67.0¢/ $1
WAGE / INCOME GAP [ $ ]
$10,579
FAMILY INCOME DEFICIT
0.47
INEQUALITY / GINI INDEX
112,076
LABOR FORCE [ PEOPLE ]
59.7%
PERCENT IN LABOR FORCE
7.2%
UNEMPLOYMENT RATE
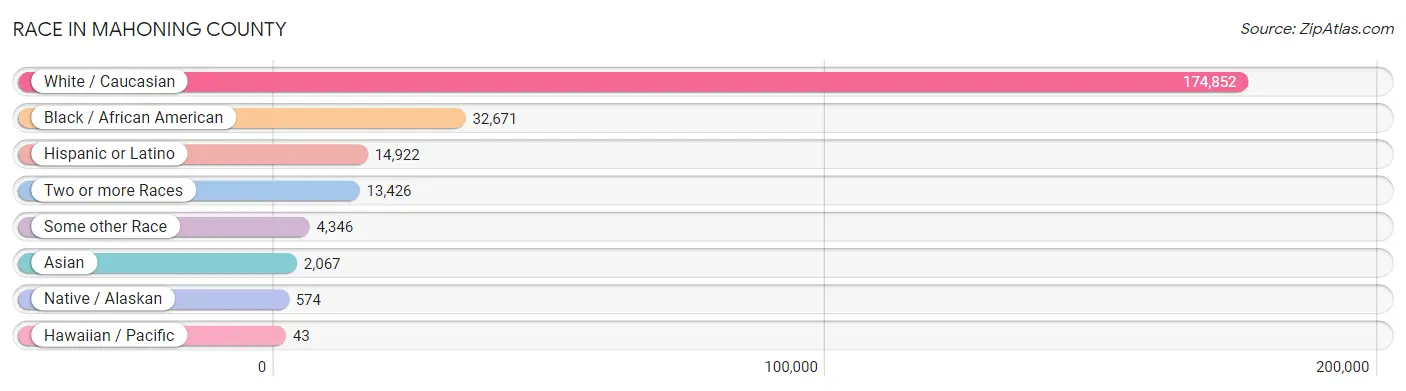
Race in Mahoning County
The most populous races in Mahoning County are White / Caucasian (174,852 | 76.7%), Black / African American (32,671 | 14.3%), and Hispanic or Latino (14,922 | 6.6%).
| Race | # Population | % Population |
| Asian | 2,067 | 0.9% |
| Black / African American | 32,671 | 14.3% |
| Hawaiian / Pacific | 43 | 0.0% |
| Hispanic or Latino | 14,922 | 6.6% |
| Native / Alaskan | 574 | 0.3% |
| White / Caucasian | 174,852 | 76.7% |
| Two or more Races | 13,426 | 5.9% |
| Some other Race | 4,346 | 1.9% |
| Total | 227,979 | 100.0% |
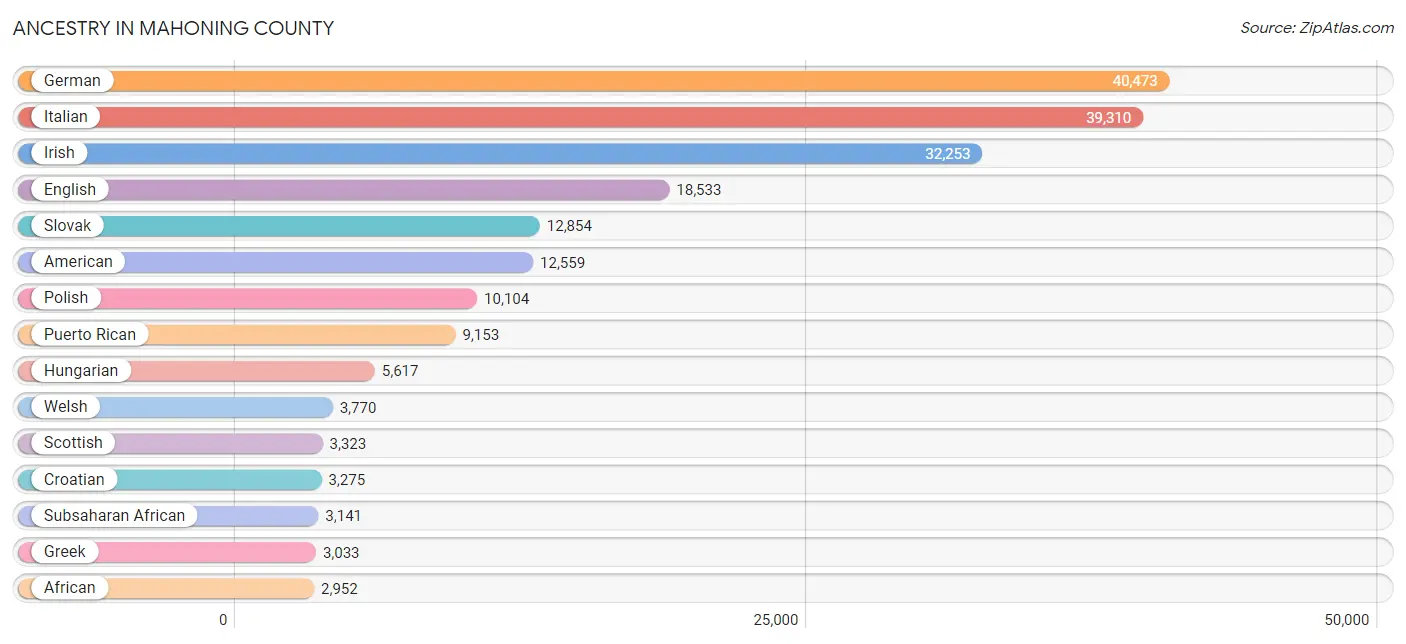
Ancestry in Mahoning County
The most populous ancestries reported in Mahoning County are German (40,473 | 17.7%), Italian (39,310 | 17.2%), Irish (32,253 | 14.1%), English (18,533 | 8.1%), and Slovak (12,854 | 5.6%), together accounting for 62.9% of all Mahoning County residents.
| Ancestry | # Population | % Population |
| African | 2,952 | 1.3% |
| Albanian | 8 | 0.0% |
| American | 12,559 | 5.5% |
| Apache | 34 | 0.0% |
| Arab | 2,706 | 1.2% |
| Armenian | 97 | 0.0% |
| Australian | 32 | 0.0% |
| Austrian | 479 | 0.2% |
| Bahamian | 20 | 0.0% |
| Barbadian | 14 | 0.0% |
| Belgian | 142 | 0.1% |
| Bhutanese | 222 | 0.1% |
| Blackfeet | 299 | 0.1% |
| Brazilian | 71 | 0.0% |
| British | 869 | 0.4% |
| British West Indian | 6 | 0.0% |
| Bulgarian | 244 | 0.1% |
| Burmese | 153 | 0.1% |
| Canadian | 166 | 0.1% |
| Carpatho Rusyn | 74 | 0.0% |
| Celtic | 10 | 0.0% |
| Central American | 903 | 0.4% |
| Central American Indian | 102 | 0.0% |
| Cherokee | 441 | 0.2% |
| Chilean | 38 | 0.0% |
| Chippewa | 2 | 0.0% |
| Choctaw | 22 | 0.0% |
| Colombian | 97 | 0.0% |
| Cree | 4 | 0.0% |
| Creek | 26 | 0.0% |
| Croatian | 3,275 | 1.4% |
| Cuban | 325 | 0.1% |
| Cypriot | 19 | 0.0% |
| Czech | 727 | 0.3% |
| Czechoslovakian | 565 | 0.3% |
| Danish | 253 | 0.1% |
| Dominican | 102 | 0.0% |
| Dutch | 1,420 | 0.6% |
| Dutch West Indian | 4 | 0.0% |
| Eastern European | 504 | 0.2% |
| Ecuadorian | 60 | 0.0% |
| Egyptian | 57 | 0.0% |
| English | 18,533 | 8.1% |
| European | 1,590 | 0.7% |
| Finnish | 523 | 0.2% |
| French | 2,950 | 1.3% |
| French American Indian | 14 | 0.0% |
| French Canadian | 325 | 0.1% |
| German | 40,473 | 17.7% |
| Ghanaian | 24 | 0.0% |
| Greek | 3,033 | 1.3% |
| Guamanian / Chamorro | 9 | 0.0% |
| Guatemalan | 273 | 0.1% |
| Guyanese | 7 | 0.0% |
| Haitian | 274 | 0.1% |
| Honduran | 461 | 0.2% |
| Hungarian | 5,617 | 2.5% |
| Indian (Asian) | 313 | 0.1% |
| Iranian | 84 | 0.0% |
| Iraqi | 22 | 0.0% |
| Irish | 32,253 | 14.1% |
| Iroquois | 104 | 0.1% |
| Israeli | 4 | 0.0% |
| Italian | 39,310 | 17.2% |
| Jamaican | 454 | 0.2% |
| Jordanian | 333 | 0.2% |
| Kenyan | 40 | 0.0% |
| Korean | 436 | 0.2% |
| Lebanese | 1,293 | 0.6% |
| Lithuanian | 503 | 0.2% |
| Macedonian | 166 | 0.1% |
| Malaysian | 26 | 0.0% |
| Maltese | 29 | 0.0% |
| Mexican | 2,506 | 1.1% |
| Mexican American Indian | 19 | 0.0% |
| Mongolian | 8 | 0.0% |
| Moroccan | 13 | 0.0% |
| Native Hawaiian | 311 | 0.1% |
| Navajo | 3 | 0.0% |
| New Zealander | 30 | 0.0% |
| Nicaraguan | 17 | 0.0% |
| Nigerian | 53 | 0.0% |
| Northern European | 154 | 0.1% |
| Norwegian | 259 | 0.1% |
| Okinawan | 10 | 0.0% |
| Osage | 4 | 0.0% |
| Ottawa | 5 | 0.0% |
| Pakistani | 75 | 0.0% |
| Palestinian | 506 | 0.2% |
| Panamanian | 10 | 0.0% |
| Pennsylvania German | 453 | 0.2% |
| Peruvian | 64 | 0.0% |
| Polish | 10,104 | 4.4% |
| Portuguese | 226 | 0.1% |
| Pueblo | 8 | 0.0% |
| Puerto Rican | 9,153 | 4.0% |
| Romanian | 1,288 | 0.6% |
| Russian | 1,503 | 0.7% |
| Salvadoran | 142 | 0.1% |
| Scandinavian | 94 | 0.0% |
| Scotch-Irish | 1,650 | 0.7% |
| Scottish | 3,323 | 1.5% |
| Seminole | 9 | 0.0% |
| Serbian | 431 | 0.2% |
| Sierra Leonean | 12 | 0.0% |
| Sioux | 90 | 0.0% |
| Slavic | 391 | 0.2% |
| Slovak | 12,854 | 5.6% |
| Slovene | 293 | 0.1% |
| South American | 311 | 0.1% |
| Spaniard | 224 | 0.1% |
| Spanish | 796 | 0.4% |
| Sri Lankan | 112 | 0.1% |
| Subsaharan African | 3,141 | 1.4% |
| Swedish | 2,048 | 0.9% |
| Swiss | 848 | 0.4% |
| Syrian | 34 | 0.0% |
| Thai | 1,398 | 0.6% |
| Trinidadian and Tobagonian | 95 | 0.0% |
| Turkish | 182 | 0.1% |
| U.S. Virgin Islander | 9 | 0.0% |
| Ukrainian | 1,986 | 0.9% |
| Uruguayan | 6 | 0.0% |
| Venezuelan | 46 | 0.0% |
| Welsh | 3,770 | 1.7% |
| West Indian | 110 | 0.1% |
| Yugoslavian | 43 | 0.0% |
| Zimbabwean | 21 | 0.0% | View All 128 Rows |
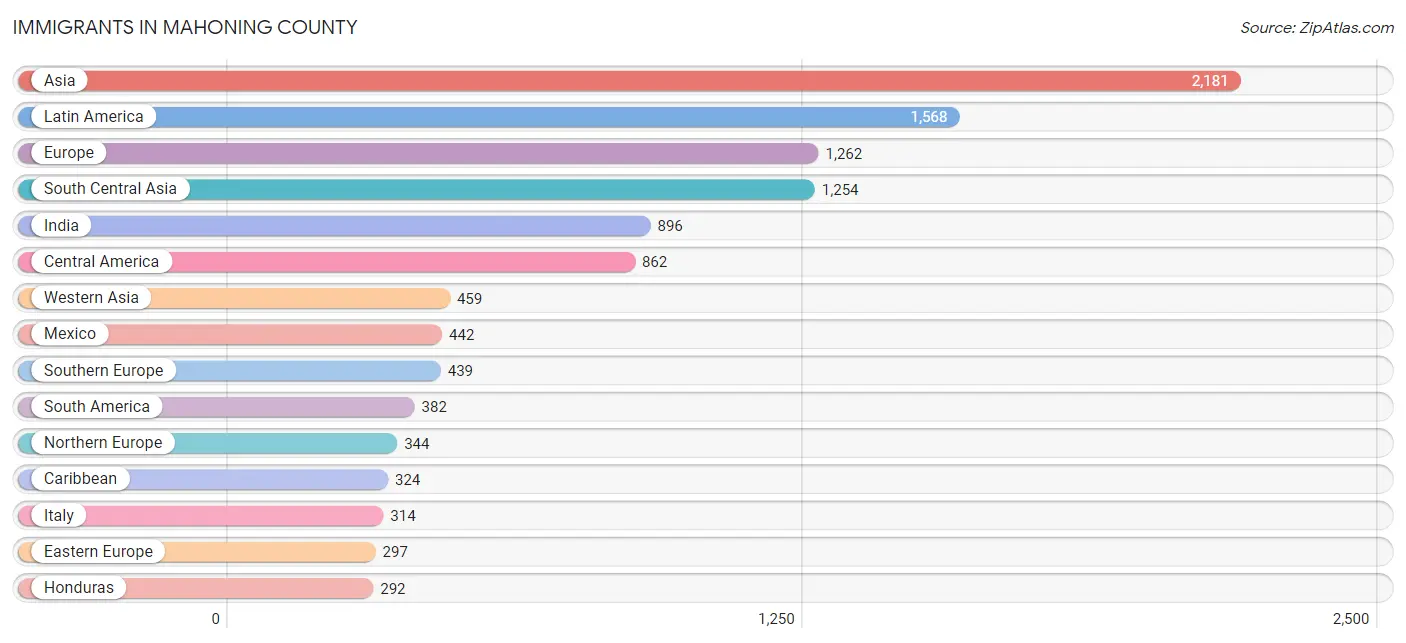
Immigrants in Mahoning County
The most numerous immigrant groups reported in Mahoning County came from Asia (2,181 | 1.0%), Latin America (1,568 | 0.7%), Europe (1,262 | 0.5%), South Central Asia (1,254 | 0.5%), and India (896 | 0.4%), together accounting for 3.1% of all Mahoning County residents.
| Immigration Origin | # Population | % Population |
| Africa | 205 | 0.1% |
| Argentina | 40 | 0.0% |
| Asia | 2,181 | 1.0% |
| Austria | 24 | 0.0% |
| Bahamas | 29 | 0.0% |
| Belgium | 39 | 0.0% |
| Brazil | 64 | 0.0% |
| Canada | 111 | 0.1% |
| Caribbean | 324 | 0.1% |
| Central America | 862 | 0.4% |
| Chile | 27 | 0.0% |
| China | 87 | 0.0% |
| Colombia | 63 | 0.0% |
| Croatia | 33 | 0.0% |
| Czechoslovakia | 13 | 0.0% |
| Dominican Republic | 53 | 0.0% |
| Eastern Africa | 94 | 0.0% |
| Eastern Asia | 133 | 0.1% |
| Eastern Europe | 297 | 0.1% |
| Ecuador | 77 | 0.0% |
| Egypt | 52 | 0.0% |
| El Salvador | 7 | 0.0% |
| England | 62 | 0.0% |
| Europe | 1,262 | 0.5% |
| Germany | 110 | 0.1% |
| Ghana | 14 | 0.0% |
| Greece | 104 | 0.1% |
| Guatemala | 111 | 0.1% |
| Haiti | 33 | 0.0% |
| Honduras | 292 | 0.1% |
| Hungary | 21 | 0.0% |
| India | 896 | 0.4% |
| Iran | 67 | 0.0% |
| Iraq | 22 | 0.0% |
| Ireland | 13 | 0.0% |
| Israel | 50 | 0.0% |
| Italy | 314 | 0.1% |
| Jamaica | 139 | 0.1% |
| Japan | 20 | 0.0% |
| Jordan | 267 | 0.1% |
| Kenya | 55 | 0.0% |
| Korea | 26 | 0.0% |
| Kuwait | 13 | 0.0% |
| Latin America | 1,568 | 0.7% |
| Lebanon | 79 | 0.0% |
| Liberia | 8 | 0.0% |
| Malaysia | 8 | 0.0% |
| Mexico | 442 | 0.2% |
| Morocco | 9 | 0.0% |
| Nepal | 76 | 0.0% |
| Netherlands | 9 | 0.0% |
| Nicaragua | 10 | 0.0% |
| Nigeria | 23 | 0.0% |
| Northern Africa | 66 | 0.0% |
| Northern Europe | 344 | 0.2% |
| Oceania | 51 | 0.0% |
| Pakistan | 202 | 0.1% |
| Peru | 74 | 0.0% |
| Philippines | 88 | 0.0% |
| Poland | 41 | 0.0% |
| Portugal | 11 | 0.0% |
| Romania | 79 | 0.0% |
| Russia | 43 | 0.0% |
| Scotland | 20 | 0.0% |
| Singapore | 10 | 0.0% |
| South America | 382 | 0.2% |
| South Central Asia | 1,254 | 0.5% |
| South Eastern Asia | 201 | 0.1% |
| Southern Europe | 439 | 0.2% |
| Spain | 10 | 0.0% |
| Sweden | 8 | 0.0% |
| Syria | 28 | 0.0% |
| Thailand | 49 | 0.0% |
| Trinidad and Tobago | 32 | 0.0% |
| Ukraine | 17 | 0.0% |
| Uruguay | 6 | 0.0% |
| Venezuela | 31 | 0.0% |
| Vietnam | 46 | 0.0% |
| Western Africa | 45 | 0.0% |
| Western Asia | 459 | 0.2% |
| Western Europe | 182 | 0.1% |
| Zimbabwe | 21 | 0.0% | View All 82 Rows |
Sex and Age in Mahoning County
Sex and Age in Mahoning County
The most populous age groups in Mahoning County are 60 to 64 Years (9,071 | 8.1%) for men and 60 to 64 Years (9,057 | 7.8%) for women.
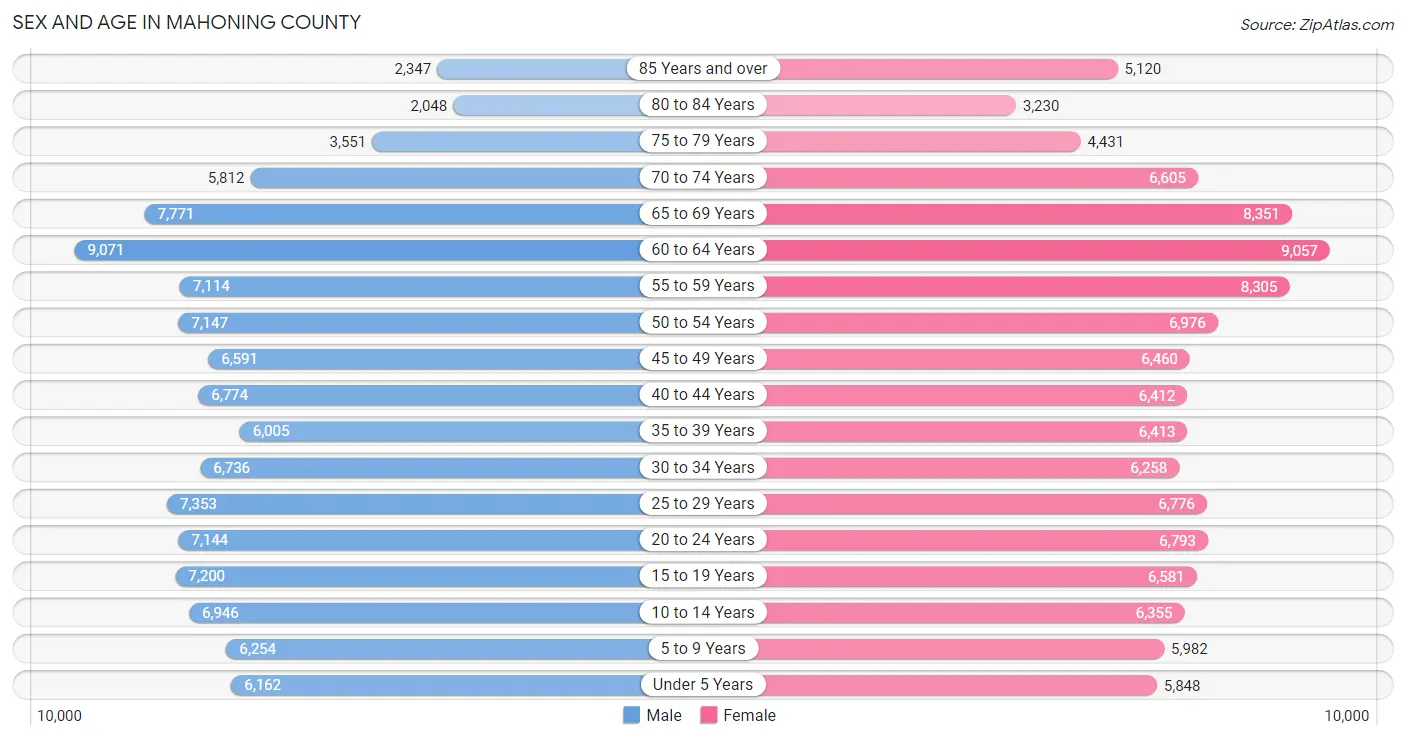
| Age Bracket | Male | Female |
| Under 5 Years | 6,162 (5.5%) | 5,848 (5.0%) |
| 5 to 9 Years | 6,254 (5.6%) | 5,982 (5.2%) |
| 10 to 14 Years | 6,946 (6.2%) | 6,355 (5.5%) |
| 15 to 19 Years | 7,200 (6.4%) | 6,581 (5.7%) |
| 20 to 24 Years | 7,144 (6.4%) | 6,793 (5.9%) |
| 25 to 29 Years | 7,353 (6.6%) | 6,776 (5.8%) |
| 30 to 34 Years | 6,736 (6.0%) | 6,258 (5.4%) |
| 35 to 39 Years | 6,005 (5.4%) | 6,413 (5.5%) |
| 40 to 44 Years | 6,774 (6.0%) | 6,412 (5.5%) |
| 45 to 49 Years | 6,591 (5.9%) | 6,460 (5.6%) |
| 50 to 54 Years | 7,147 (6.4%) | 6,976 (6.0%) |
| 55 to 59 Years | 7,114 (6.4%) | 8,305 (7.2%) |
| 60 to 64 Years | 9,071 (8.1%) | 9,057 (7.8%) |
| 65 to 69 Years | 7,771 (6.9%) | 8,351 (7.2%) |
| 70 to 74 Years | 5,812 (5.2%) | 6,605 (5.7%) |
| 75 to 79 Years | 3,551 (3.2%) | 4,431 (3.8%) |
| 80 to 84 Years | 2,048 (1.8%) | 3,230 (2.8%) |
| 85 Years and over | 2,347 (2.1%) | 5,120 (4.4%) |
| Total | 112,026 (100.0%) | 115,953 (100.0%) |
Families and Households in Mahoning County
Median Family Size in Mahoning County
The median family size in Mahoning County is 2.92 persons per family, with married-couple families (39,851 | 68.4%) accounting for the largest median family size of 2.95 persons per family. On the other hand, single male/father families (4,489 | 7.7%) represent the smallest median family size with 2.61 persons per family.
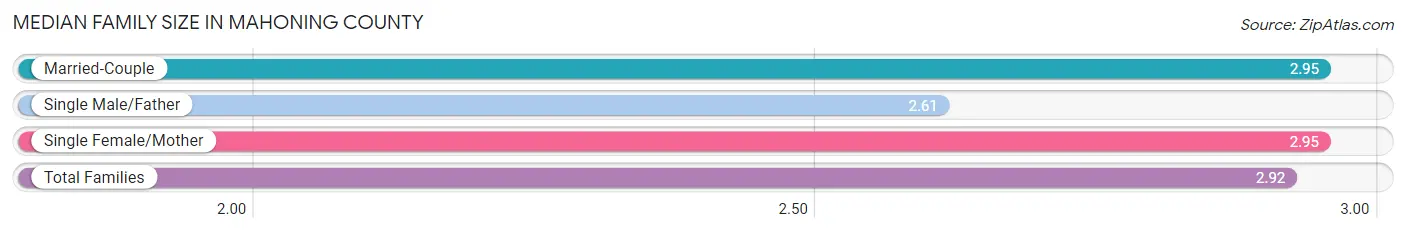
| Family Type | # Families | Family Size |
| Married-Couple | 39,851 (68.4%) | 2.95 |
| Single Male/Father | 4,489 (7.7%) | 2.61 |
| Single Female/Mother | 13,905 (23.9%) | 2.95 |
| Total Families | 58,245 (100.0%) | 2.92 |
Median Household Size in Mahoning County
The median household size in Mahoning County is 2.27 persons per household, with single female/mother households (13,905 | 14.2%) accounting for the largest median household size of 3.17 persons per household. non-family households (39,410 | 40.4%) represent the smallest median household size with 1.17 persons per household.
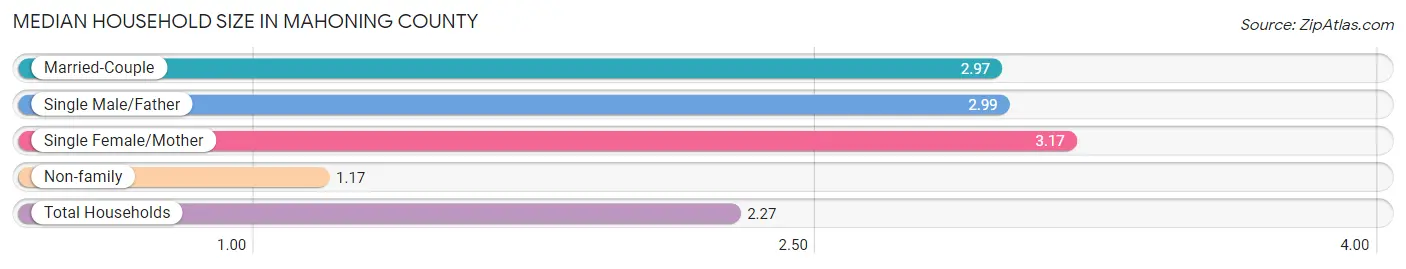
| Household Type | # Households | Household Size |
| Married-Couple | 39,851 (40.8%) | 2.97 |
| Single Male/Father | 4,489 (4.6%) | 2.99 |
| Single Female/Mother | 13,905 (14.2%) | 3.17 |
| Non-family | 39,410 (40.4%) | 1.17 |
| Total Households | 97,655 (100.0%) | 2.27 |
Household Size by Marriage Status in Mahoning County
Out of a total of 97,655 households in Mahoning County, 58,245 (59.6%) are family households, while 39,410 (40.4%) are nonfamily households. The most numerous type of family households are 2-person households, comprising 28,858, and the most common type of nonfamily households are 1-person households, comprising 34,055.
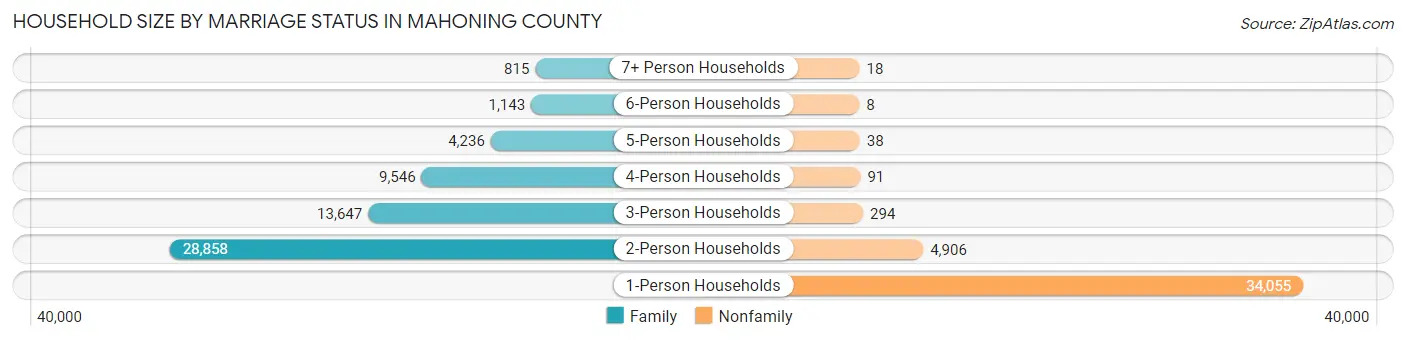
| Household Size | Family Households | Nonfamily Households |
| 1-Person Households | - | 34,055 (34.9%) |
| 2-Person Households | 28,858 (29.5%) | 4,906 (5.0%) |
| 3-Person Households | 13,647 (14.0%) | 294 (0.3%) |
| 4-Person Households | 9,546 (9.8%) | 91 (0.1%) |
| 5-Person Households | 4,236 (4.3%) | 38 (0.0%) |
| 6-Person Households | 1,143 (1.2%) | 8 (0.0%) |
| 7+ Person Households | 815 (0.8%) | 18 (0.0%) |
| Total | 58,245 (59.6%) | 39,410 (40.4%) |
Female Fertility in Mahoning County
Fertility by Age in Mahoning County
Average fertility rate in Mahoning County is 44.0 births per 1,000 women. Women in the age bracket of 20 to 34 years have the highest fertility rate with 79.0 births per 1,000 women. Women in the age bracket of 20 to 34 years acount for 75.0% of all women with births.
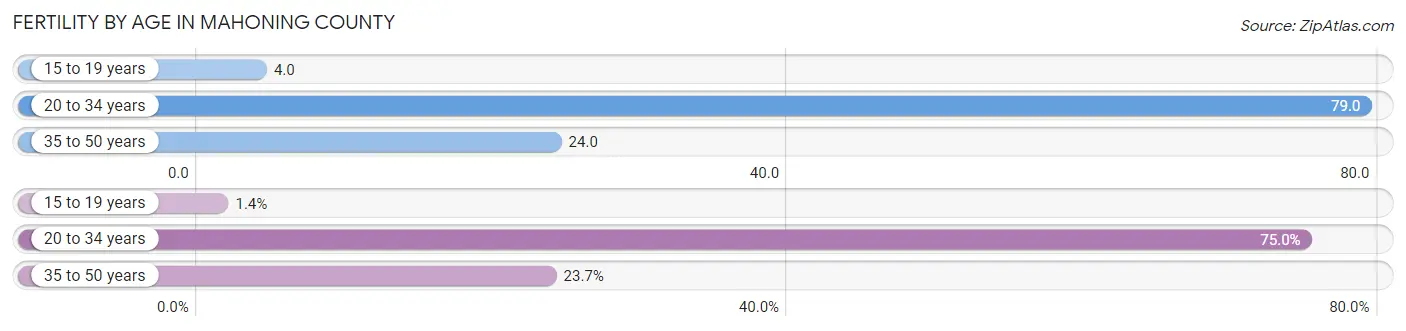
| Age Bracket | Women with Births | Births / 1,000 Women |
| 15 to 19 years | 29 (1.4%) | 4.0 |
| 20 to 34 years | 1,568 (75.0%) | 79.0 |
| 35 to 50 years | 495 (23.7%) | 24.0 |
| Total | 2,092 (100.0%) | 44.0 |
Fertility by Age by Marriage Status in Mahoning County
60.5% of women with births (2,092) in Mahoning County are married. The highest percentage of unmarried women with births falls into 15 to 19 years age bracket with 100.0% of them unmarried at the time of birth, while the lowest percentage of unmarried women with births belong to 35 to 50 years age bracket with 23.6% of them unmarried.
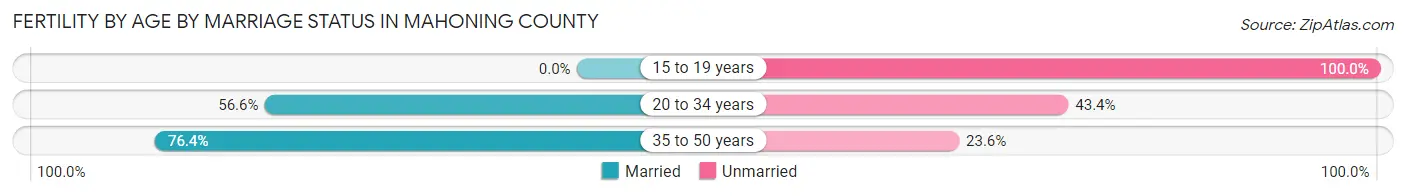
| Age Bracket | Married | Unmarried |
| 15 to 19 years | 0 (0.0%) | 29 (100.0%) |
| 20 to 34 years | 887 (56.6%) | 681 (43.4%) |
| 35 to 50 years | 378 (76.4%) | 117 (23.6%) |
| Total | 1,266 (60.5%) | 826 (39.5%) |
Fertility by Education in Mahoning County
Average fertility rate in Mahoning County is 44.0 births per 1,000 women. Women with the education attainment of graduate degree have the highest fertility rate of 88.0 births per 1,000 women, while women with the education attainment of less than high school have the lowest fertility at 27.0 births per 1,000 women. Women with the education attainment of college or associate's degree represent 28.8% of all women with births.
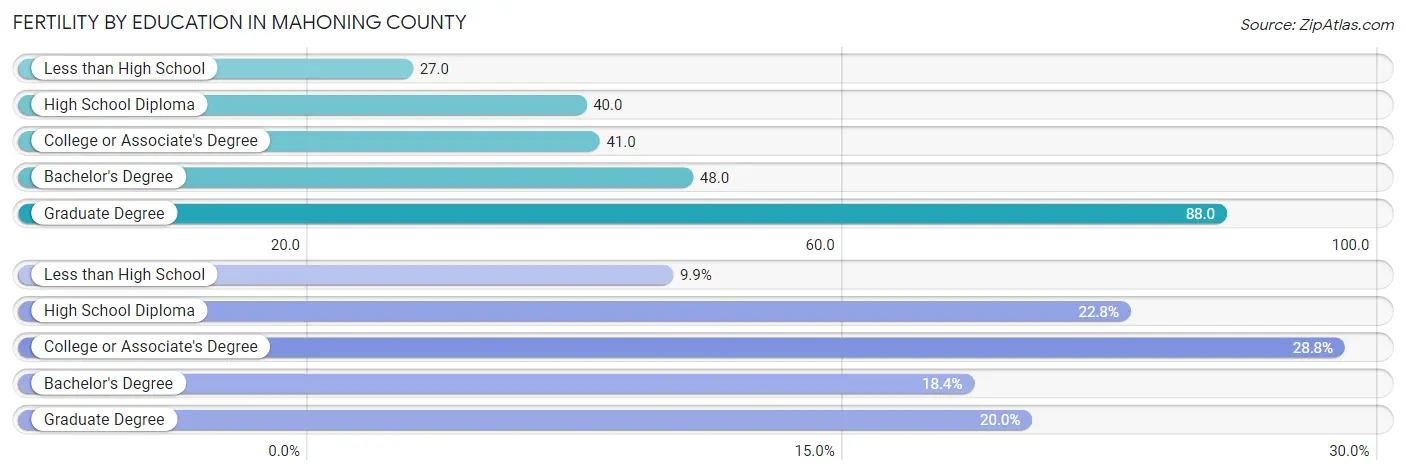
| Educational Attainment | Women with Births | Births / 1,000 Women |
| Less than High School | 208 (9.9%) | 27.0 |
| High School Diploma | 477 (22.8%) | 40.0 |
| College or Associate's Degree | 603 (28.8%) | 41.0 |
| Bachelor's Degree | 385 (18.4%) | 48.0 |
| Graduate Degree | 419 (20.0%) | 88.0 |
| Total | 2,092 (100.0%) | 44.0 |
Fertility by Education by Marriage Status in Mahoning County
39.5% of women with births in Mahoning County are unmarried. Women with the educational attainment of bachelor's degree are most likely to be married with 87.8% of them married at childbirth, while women with the educational attainment of less than high school are least likely to be married with 69.7% of them unmarried at childbirth.
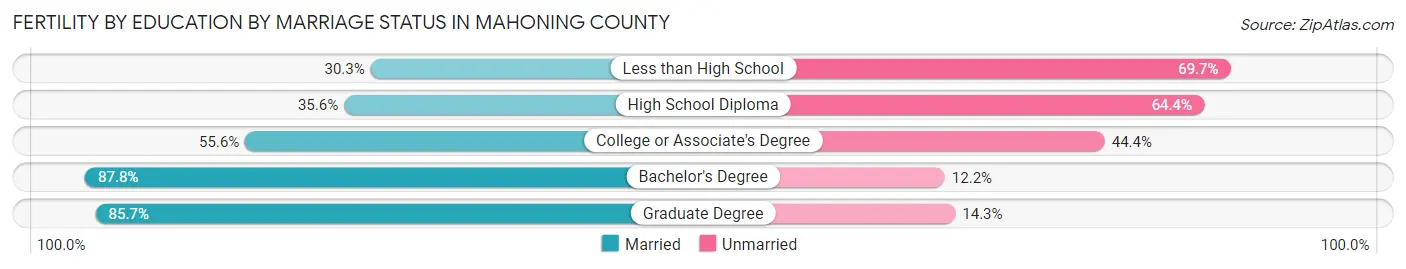
| Educational Attainment | Married | Unmarried |
| Less than High School | 63 (30.3%) | 145 (69.7%) |
| High School Diploma | 170 (35.6%) | 307 (64.4%) |
| College or Associate's Degree | 335 (55.6%) | 268 (44.4%) |
| Bachelor's Degree | 338 (87.8%) | 47 (12.2%) |
| Graduate Degree | 359 (85.7%) | 60 (14.3%) |
| Total | 1,266 (60.5%) | 826 (39.5%) |
Income in Mahoning County
Income Overview in Mahoning County
Per Capita Income in Mahoning County is $32,591, while median incomes of families and households are $73,583 and $54,279 respectively.
| Characteristic | Number | Measure |
| Per Capita Income | 227,979 | $32,591 |
| Median Family Income | 58,245 | $73,583 |
| Mean Family Income | 58,245 | $91,849 |
| Median Household Income | 97,655 | $54,279 |
| Mean Household Income | 97,655 | $74,565 |
| Income Deficit | 58,245 | $10,579 |
| Wage / Income Gap (%) | 227,979 | 32.97% |
| Wage / Income Gap ($) | 227,979 | 67.03¢ per $1 |
| Gini / Inequality Index | 227,979 | 0.47 |
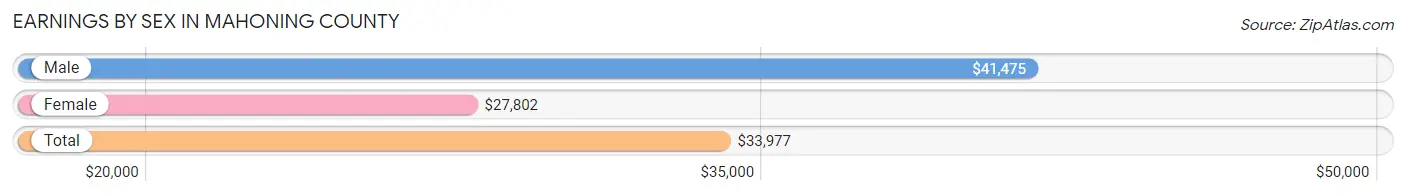
Earnings by Sex in Mahoning County
Average Earnings in Mahoning County are $33,977, $41,475 for men and $27,802 for women, a difference of 33.0%.
| Sex | Number | Average Earnings |
| Male | 59,467 (51.2%) | $41,475 |
| Female | 56,686 (48.8%) | $27,802 |
| Total | 116,153 (100.0%) | $33,977 |
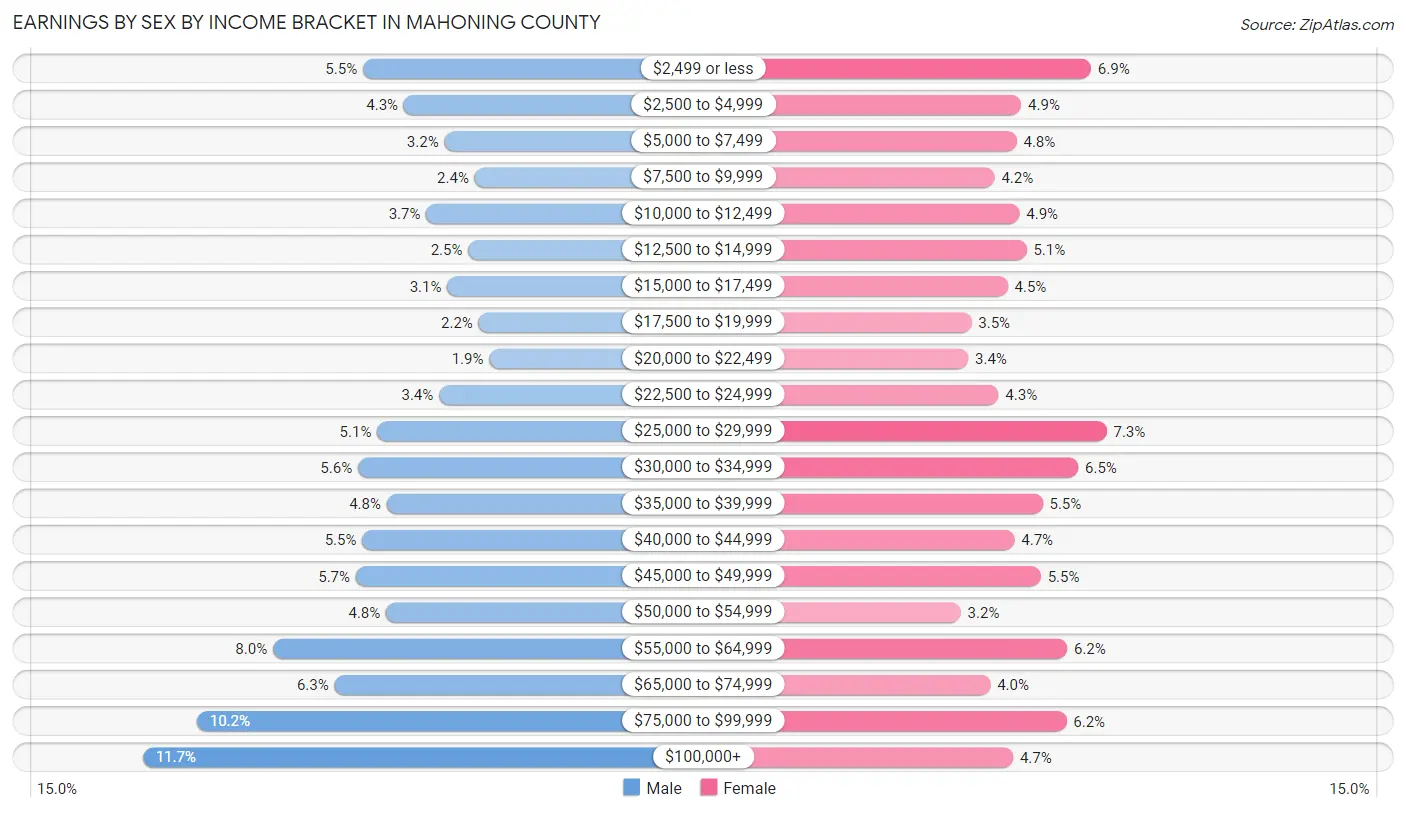
Earnings by Sex by Income Bracket in Mahoning County
The most common earnings brackets in Mahoning County are $100,000+ for men (6,948 | 11.7%) and $25,000 to $29,999 for women (4,138 | 7.3%).
| Income | Male | Female |
| $2,499 or less | 3,262 (5.5%) | 3,890 (6.9%) |
| $2,500 to $4,999 | 2,582 (4.3%) | 2,777 (4.9%) |
| $5,000 to $7,499 | 1,901 (3.2%) | 2,704 (4.8%) |
| $7,500 to $9,999 | 1,400 (2.4%) | 2,353 (4.2%) |
| $10,000 to $12,499 | 2,209 (3.7%) | 2,750 (4.9%) |
| $12,500 to $14,999 | 1,506 (2.5%) | 2,865 (5.1%) |
| $15,000 to $17,499 | 1,853 (3.1%) | 2,563 (4.5%) |
| $17,500 to $19,999 | 1,333 (2.2%) | 1,985 (3.5%) |
| $20,000 to $22,499 | 1,155 (1.9%) | 1,932 (3.4%) |
| $22,500 to $24,999 | 1,991 (3.4%) | 2,412 (4.3%) |
| $25,000 to $29,999 | 3,028 (5.1%) | 4,138 (7.3%) |
| $30,000 to $34,999 | 3,349 (5.6%) | 3,683 (6.5%) |
| $35,000 to $39,999 | 2,866 (4.8%) | 3,117 (5.5%) |
| $40,000 to $44,999 | 3,275 (5.5%) | 2,668 (4.7%) |
| $45,000 to $49,999 | 3,381 (5.7%) | 3,092 (5.4%) |
| $50,000 to $54,999 | 2,876 (4.8%) | 1,815 (3.2%) |
| $55,000 to $64,999 | 4,772 (8.0%) | 3,511 (6.2%) |
| $65,000 to $74,999 | 3,741 (6.3%) | 2,287 (4.0%) |
| $75,000 to $99,999 | 6,039 (10.2%) | 3,499 (6.2%) |
| $100,000+ | 6,948 (11.7%) | 2,645 (4.7%) |
| Total | 59,467 (100.0%) | 56,686 (100.0%) |
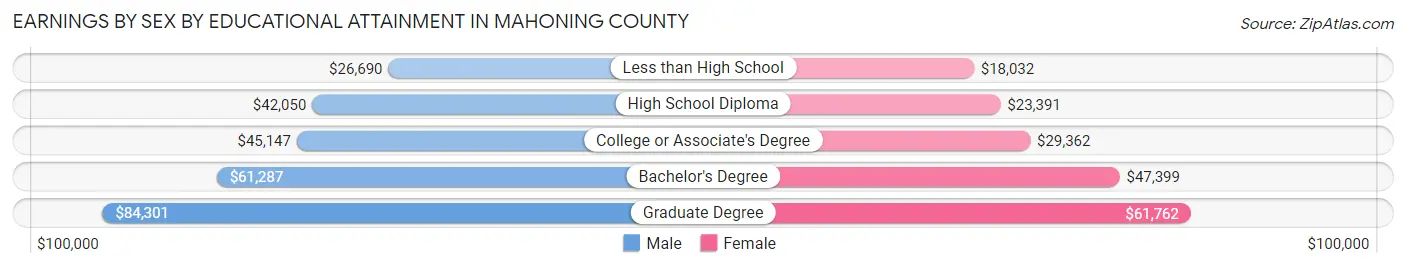
Earnings by Sex by Educational Attainment in Mahoning County
Average earnings in Mahoning County are $47,038 for men and $32,628 for women, a difference of 30.6%. Men with an educational attainment of graduate degree enjoy the highest average annual earnings of $84,301, while those with less than high school education earn the least with $26,690. Women with an educational attainment of graduate degree earn the most with the average annual earnings of $61,762, while those with less than high school education have the smallest earnings of $18,032.
| Educational Attainment | Male Income | Female Income |
| Less than High School | $26,690 | $18,032 |
| High School Diploma | $42,050 | $23,391 |
| College or Associate's Degree | $45,147 | $29,362 |
| Bachelor's Degree | $61,287 | $47,399 |
| Graduate Degree | $84,301 | $61,762 |
| Total | $47,038 | $32,628 |
Family Income in Mahoning County
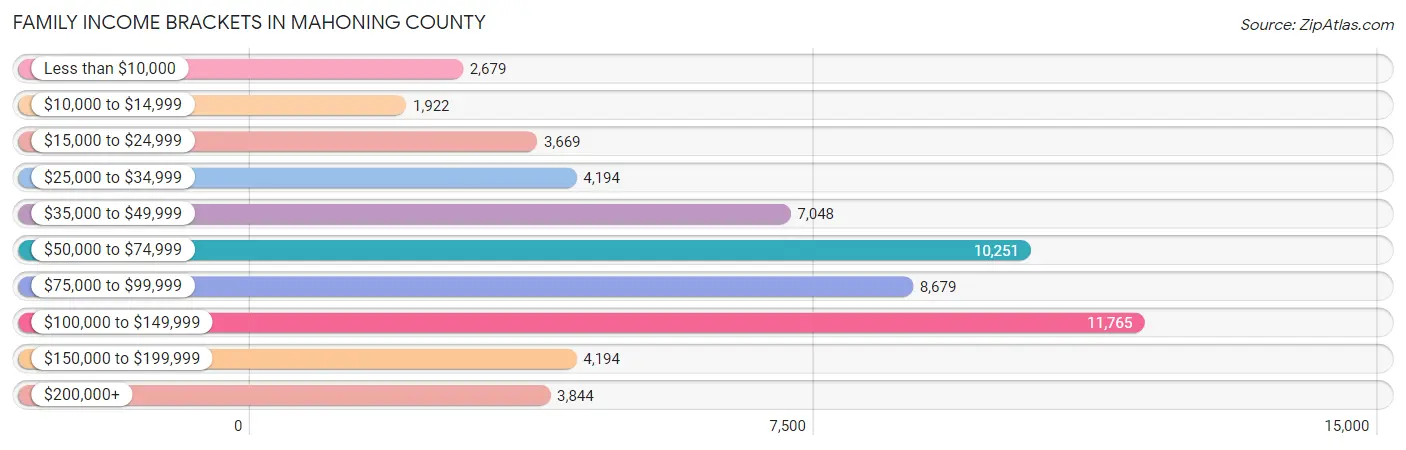
Family Income Brackets in Mahoning County
According to the Mahoning County family income data, there are 11,765 families falling into the $100,000 to $149,999 income range, which is the most common income bracket and makes up 20.2% of all families. Conversely, the $10,000 to $14,999 income bracket is the least frequent group with only 1,922 families (3.3%) belonging to this category.
| Income Bracket | # Families | % Families |
| Less than $10,000 | 2,679 | 4.6% |
| $10,000 to $14,999 | 1,922 | 3.3% |
| $15,000 to $24,999 | 3,669 | 6.3% |
| $25,000 to $34,999 | 4,194 | 7.2% |
| $35,000 to $49,999 | 7,048 | 12.1% |
| $50,000 to $74,999 | 10,251 | 17.6% |
| $75,000 to $99,999 | 8,679 | 14.9% |
| $100,000 to $149,999 | 11,765 | 20.2% |
| $150,000 to $199,999 | 4,194 | 7.2% |
| $200,000+ | 3,844 | 6.6% |
Family Income by Famaliy Size in Mahoning County
5-person families (3,573 | 6.1%) account for the highest median family income in Mahoning County with $100,855 per family, while 2-person families (30,896 | 53.0%) have the highest median income of $32,962 per family member.
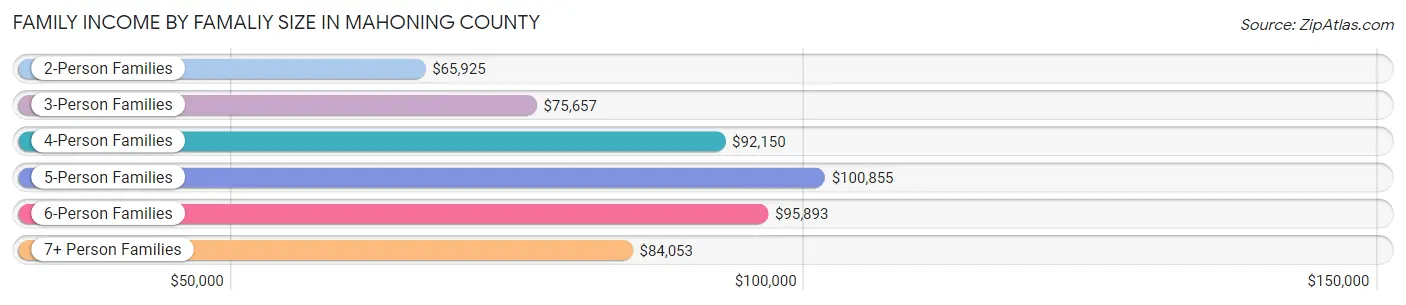
| Income Bracket | # Families | Median Income |
| 2-Person Families | 30,896 (53.0%) | $65,925 |
| 3-Person Families | 13,326 (22.9%) | $75,657 |
| 4-Person Families | 8,720 (15.0%) | $92,150 |
| 5-Person Families | 3,573 (6.1%) | $100,855 |
| 6-Person Families | 969 (1.7%) | $95,893 |
| 7+ Person Families | 761 (1.3%) | $84,053 |
| Total | 58,245 (100.0%) | $73,583 |
Family Income by Number of Earners in Mahoning County
The median family income in Mahoning County is $73,583, with families comprising 3+ earners (6,262) having the highest median family income of $118,203, while families with no earners (10,882) have the lowest median family income of $44,941, accounting for 10.7% and 18.7% of families, respectively.
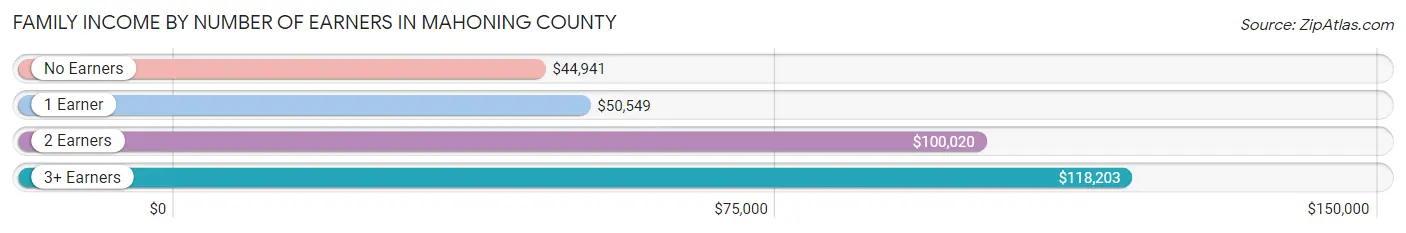
| Number of Earners | # Families | Median Income |
| No Earners | 10,882 (18.7%) | $44,941 |
| 1 Earner | 19,405 (33.3%) | $50,549 |
| 2 Earners | 21,696 (37.2%) | $100,020 |
| 3+ Earners | 6,262 (10.7%) | $118,203 |
| Total | 58,245 (100.0%) | $73,583 |
Household Income in Mahoning County
Household Income Brackets in Mahoning County
With 16,992 households falling in the category, the $50,000 to $74,999 income range is the most frequent in Mahoning County, accounting for 17.4% of all households. In contrast, only 4,394 households (4.5%) fall into the $200,000+ income bracket, making it the least populous group.
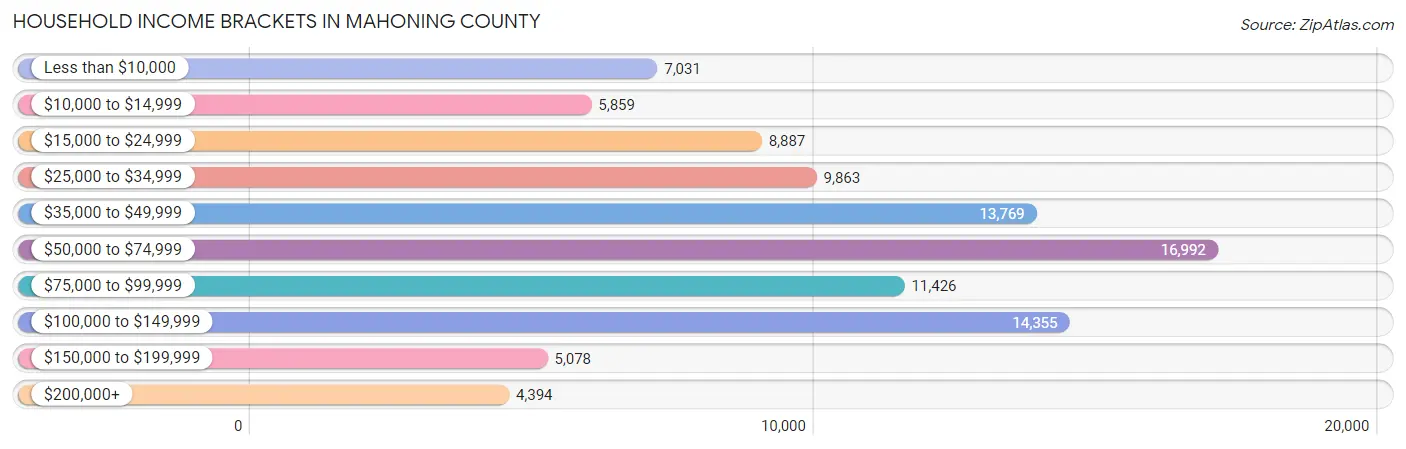
| Income Bracket | # Households | % Households |
| Less than $10,000 | 7,031 | 7.2% |
| $10,000 to $14,999 | 5,859 | 6.0% |
| $15,000 to $24,999 | 8,887 | 9.1% |
| $25,000 to $34,999 | 9,863 | 10.1% |
| $35,000 to $49,999 | 13,769 | 14.1% |
| $50,000 to $74,999 | 16,992 | 17.4% |
| $75,000 to $99,999 | 11,426 | 11.7% |
| $100,000 to $149,999 | 14,355 | 14.7% |
| $150,000 to $199,999 | 5,078 | 5.2% |
| $200,000+ | 4,394 | 4.5% |
Household Income by Householder Age in Mahoning County
The median household income in Mahoning County is $54,279, with the highest median household income of $64,371 found in the 45 to 64 years age bracket for the primary householder. A total of 37,149 households (38.0%) fall into this category. Meanwhile, the 15 to 24 years age bracket for the primary householder has the lowest median household income of $31,642, with 3,405 households (3.5%) in this group.
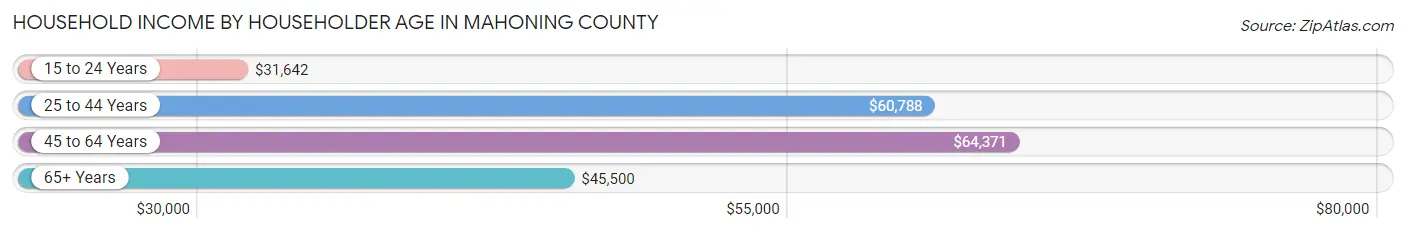
| Income Bracket | # Households | Median Income |
| 15 to 24 Years | 3,405 (3.5%) | $31,642 |
| 25 to 44 Years | 25,836 (26.5%) | $60,788 |
| 45 to 64 Years | 37,149 (38.0%) | $64,371 |
| 65+ Years | 31,265 (32.0%) | $45,500 |
| Total | 97,655 (100.0%) | $54,279 |
Poverty in Mahoning County
Income Below Poverty by Sex and Age in Mahoning County
With 16.1% poverty level for males and 19.0% for females among the residents of Mahoning County, under 5 year old males and under 5 year old females are the most vulnerable to poverty, with 2,181 males (36.4%) and 1,718 females (29.7%) in their respective age groups living below the poverty level.
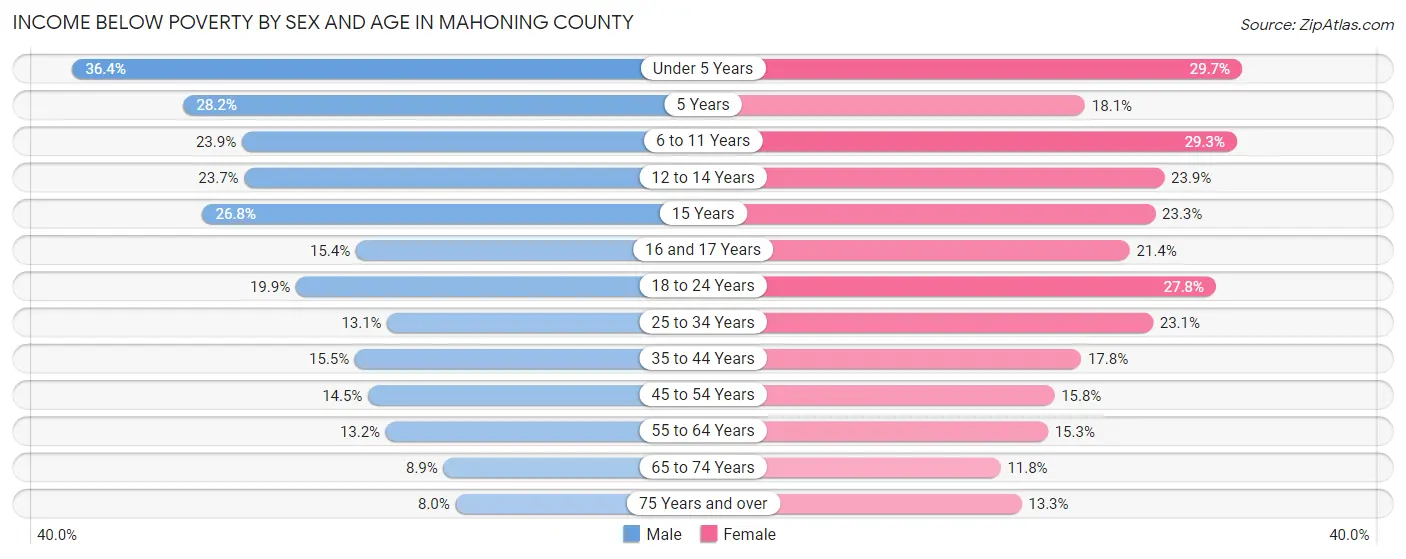
| Age Bracket | Male | Female |
| Under 5 Years | 2,181 (36.4%) | 1,718 (29.7%) |
| 5 Years | 322 (28.2%) | 183 (18.0%) |
| 6 to 11 Years | 1,841 (23.9%) | 2,126 (29.3%) |
| 12 to 14 Years | 978 (23.7%) | 926 (23.9%) |
| 15 Years | 377 (26.8%) | 298 (23.3%) |
| 16 and 17 Years | 462 (15.4%) | 597 (21.4%) |
| 18 to 24 Years | 1,818 (19.9%) | 2,389 (27.8%) |
| 25 to 34 Years | 1,738 (13.1%) | 3,005 (23.1%) |
| 35 to 44 Years | 1,900 (15.5%) | 2,274 (17.8%) |
| 45 to 54 Years | 1,967 (14.5%) | 2,112 (15.8%) |
| 55 to 64 Years | 2,103 (13.2%) | 2,644 (15.3%) |
| 65 to 74 Years | 1,184 (8.9%) | 1,738 (11.8%) |
| 75 Years and over | 596 (8.0%) | 1,540 (13.3%) |
| Total | 17,467 (16.1%) | 21,550 (19.0%) |
Income Above Poverty by Sex and Age in Mahoning County
According to the poverty statistics in Mahoning County, males aged 75 years and over and females aged 65 to 74 years are the age groups that are most secure financially, with 92.0% of males and 88.2% of females in these age groups living above the poverty line.
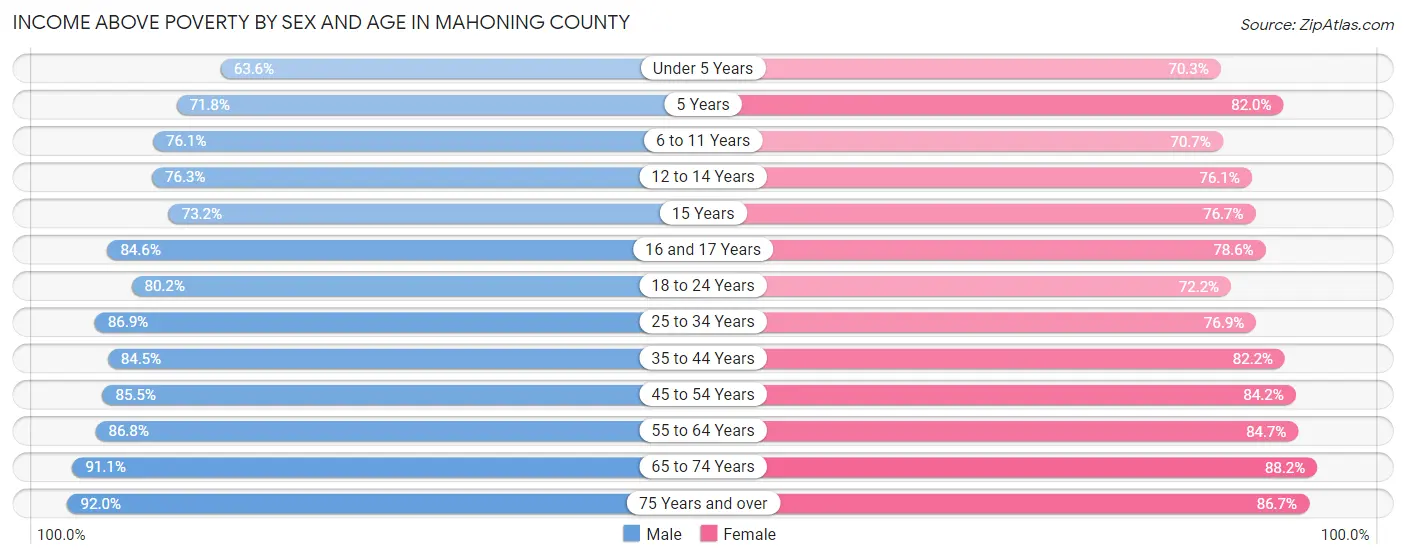
| Age Bracket | Male | Female |
| Under 5 Years | 3,805 (63.6%) | 4,066 (70.3%) |
| 5 Years | 820 (71.8%) | 831 (82.0%) |
| 6 to 11 Years | 5,876 (76.1%) | 5,126 (70.7%) |
| 12 to 14 Years | 3,152 (76.3%) | 2,944 (76.1%) |
| 15 Years | 1,031 (73.2%) | 983 (76.7%) |
| 16 and 17 Years | 2,540 (84.6%) | 2,196 (78.6%) |
| 18 to 24 Years | 7,341 (80.1%) | 6,215 (72.2%) |
| 25 to 34 Years | 11,566 (86.9%) | 10,009 (76.9%) |
| 35 to 44 Years | 10,393 (84.5%) | 10,533 (82.2%) |
| 45 to 54 Years | 11,609 (85.5%) | 11,278 (84.2%) |
| 55 to 64 Years | 13,866 (86.8%) | 14,654 (84.7%) |
| 65 to 74 Years | 12,139 (91.1%) | 13,019 (88.2%) |
| 75 Years and over | 6,854 (92.0%) | 10,009 (86.7%) |
| Total | 90,992 (83.9%) | 91,863 (81.0%) |
Income Below Poverty Among Married-Couple Families in Mahoning County
The poverty statistics for married-couple families in Mahoning County show that 5.3% or 2,115 of the total 39,851 families live below the poverty line. Families with 3 or 4 children have the highest poverty rate of 14.5%, comprising of 344 families. On the other hand, families with no children have the lowest poverty rate of 4.0%, which includes 1,075 families.
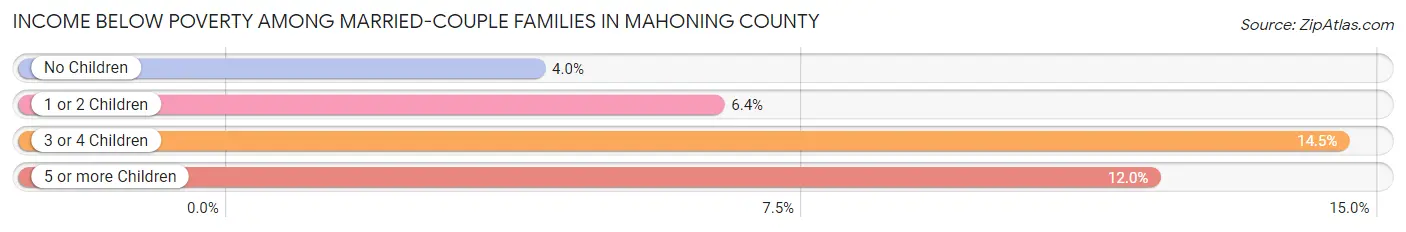
| Children | Above Poverty | Below Poverty |
| No Children | 25,729 (96.0%) | 1,075 (4.0%) |
| 1 or 2 Children | 9,695 (93.6%) | 657 (6.4%) |
| 3 or 4 Children | 2,027 (85.5%) | 344 (14.5%) |
| 5 or more Children | 285 (88.0%) | 39 (12.0%) |
| Total | 37,736 (94.7%) | 2,115 (5.3%) |
Income Below Poverty Among Single-Parent Households in Mahoning County
According to the poverty data in Mahoning County, 17.3% or 776 single-father households and 35.1% or 4,877 single-mother households are living below the poverty line. Among single-father households, those with 3 or 4 children have the highest poverty rate, with 58 households (40.0%) experiencing poverty. Likewise, among single-mother households, those with 5 or more children have the highest poverty rate, with 152 households (87.9%) falling below the poverty line.
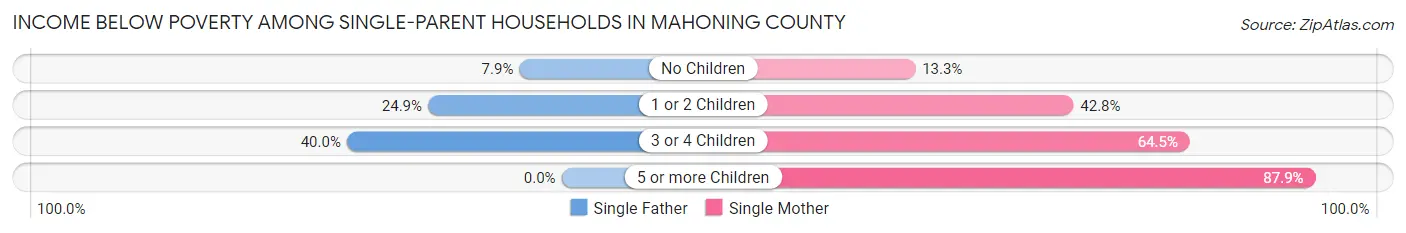
| Children | Single Father | Single Mother |
| No Children | 168 (7.9%) | 662 (13.3%) |
| 1 or 2 Children | 550 (24.9%) | 3,127 (42.8%) |
| 3 or 4 Children | 58 (40.0%) | 936 (64.5%) |
| 5 or more Children | 0 (0.0%) | 152 (87.9%) |
| Total | 776 (17.3%) | 4,877 (35.1%) |
Income Below Poverty Among Married-Couple vs Single-Parent Households in Mahoning County
The poverty data for Mahoning County shows that 2,115 of the married-couple family households (5.3%) and 5,653 of the single-parent households (30.7%) are living below the poverty level. Within the married-couple family households, those with 3 or 4 children have the highest poverty rate, with 344 households (14.5%) falling below the poverty line. Among the single-parent households, those with 5 or more children have the highest poverty rate, with 152 household (87.9%) living below poverty.
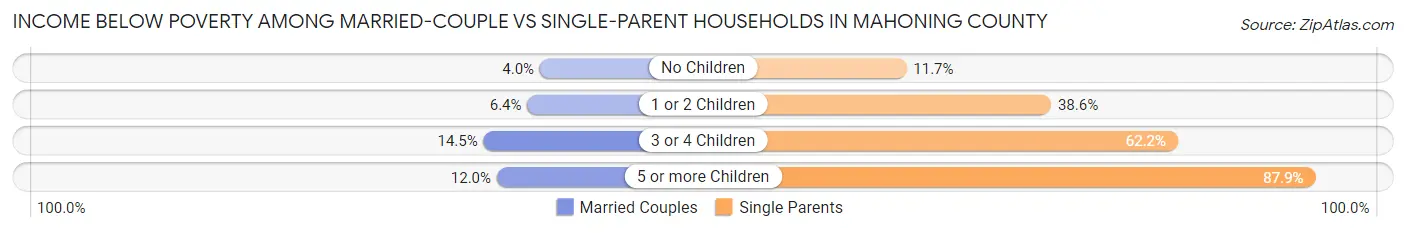
| Children | Married-Couple Families | Single-Parent Households |
| No Children | 1,075 (4.0%) | 830 (11.7%) |
| 1 or 2 Children | 657 (6.4%) | 3,677 (38.6%) |
| 3 or 4 Children | 344 (14.5%) | 994 (62.2%) |
| 5 or more Children | 39 (12.0%) | 152 (87.9%) |
| Total | 2,115 (5.3%) | 5,653 (30.7%) |
Employment Characteristics in Mahoning County
Employment by Class of Employer in Mahoning County
Among the 100,983 employed individuals in Mahoning County, private company employees (70,030 | 69.4%), not-for-profit organizations (10,120 | 10.0%), and local government employees (7,597 | 7.5%) make up the most common classes of employment.
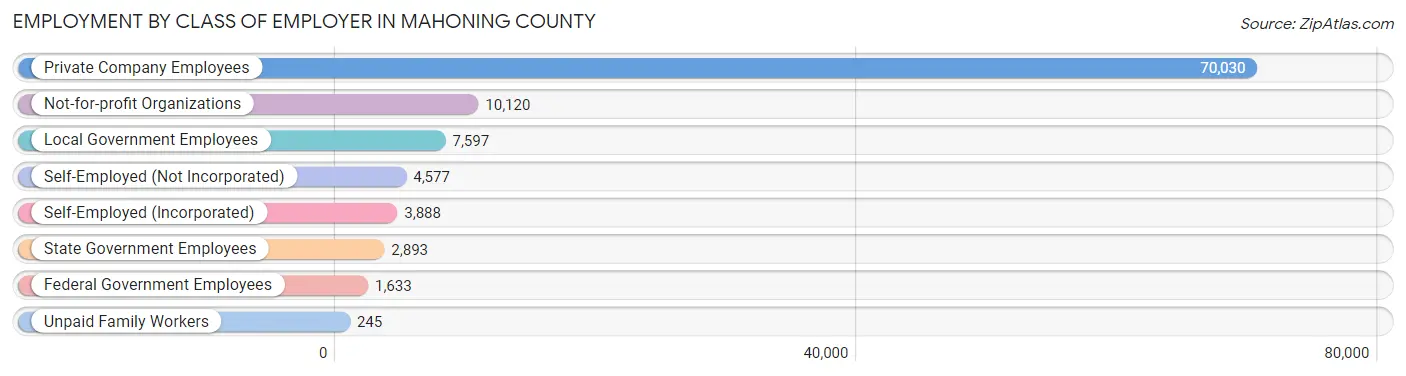
| Employer Class | # Employees | % Employees |
| Private Company Employees | 70,030 | 69.4% |
| Self-Employed (Incorporated) | 3,888 | 3.8% |
| Self-Employed (Not Incorporated) | 4,577 | 4.5% |
| Not-for-profit Organizations | 10,120 | 10.0% |
| Local Government Employees | 7,597 | 7.5% |
| State Government Employees | 2,893 | 2.9% |
| Federal Government Employees | 1,633 | 1.6% |
| Unpaid Family Workers | 245 | 0.2% |
| Total | 100,983 | 100.0% |
Employment Status by Age in Mahoning County
According to the labor force statistics for Mahoning County, out of the total population over 16 years of age (187,732), 59.7% or 112,076 individuals are in the labor force, with 7.2% or 8,069 of them unemployed. The age group with the highest labor force participation rate is 25 to 29 years, with 84.4% or 11,925 individuals in the labor force. Within the labor force, the 16 to 19 years age range has the highest percentage of unemployed individuals, with 17.7% or 904 of them being unemployed.
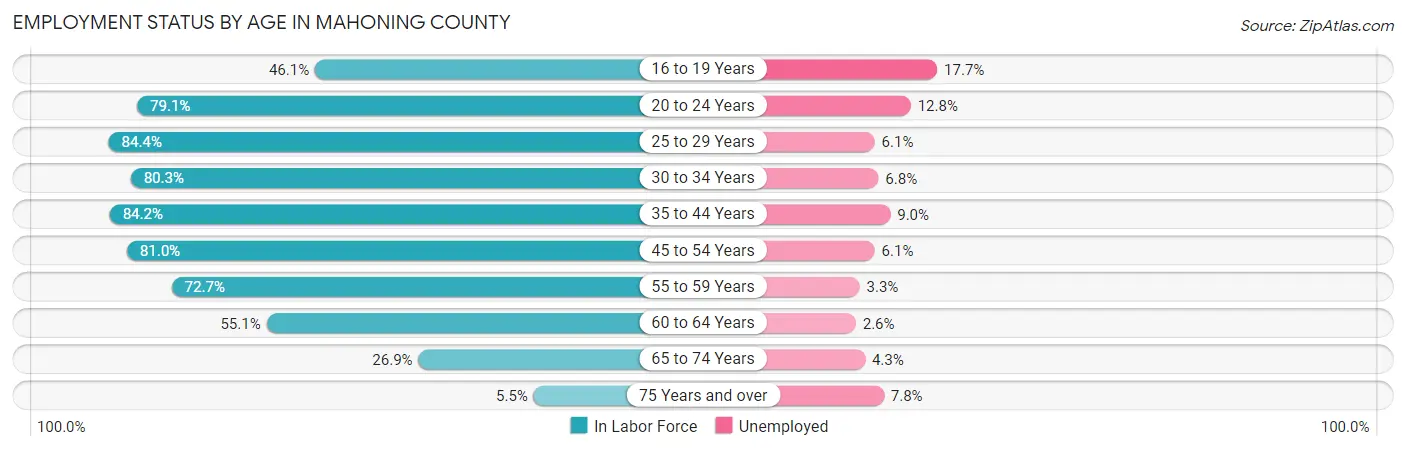
| Age Bracket | In Labor Force | Unemployed |
| 16 to 19 Years | 5,108 (46.1%) | 904 (17.7%) |
| 20 to 24 Years | 11,024 (79.1%) | 1,411 (12.8%) |
| 25 to 29 Years | 11,925 (84.4%) | 727 (6.1%) |
| 30 to 34 Years | 10,434 (80.3%) | 710 (6.8%) |
| 35 to 44 Years | 21,559 (84.2%) | 1,940 (9.0%) |
| 45 to 54 Years | 22,011 (81.0%) | 1,343 (6.1%) |
| 55 to 59 Years | 11,210 (72.7%) | 370 (3.3%) |
| 60 to 64 Years | 9,989 (55.1%) | 260 (2.6%) |
| 65 to 74 Years | 7,677 (26.9%) | 330 (4.3%) |
| 75 Years and over | 1,140 (5.5%) | 89 (7.8%) |
| Total | 112,076 (59.7%) | 8,069 (7.2%) |
Employment Status by Educational Attainment in Mahoning County
According to labor force statistics for Mahoning County, 76.8% of individuals (87,128) out of the total population between 25 and 64 years of age (113,448) are in the labor force, with 6.1% or 5,315 of them being unemployed. The group with the highest labor force participation rate are those with the educational attainment of bachelor's degree or higher, with 88.3% or 28,115 individuals in the labor force. Within the labor force, individuals with less than high school education have the highest percentage of unemployment, with 13.2% or 696 of them being unemployed.
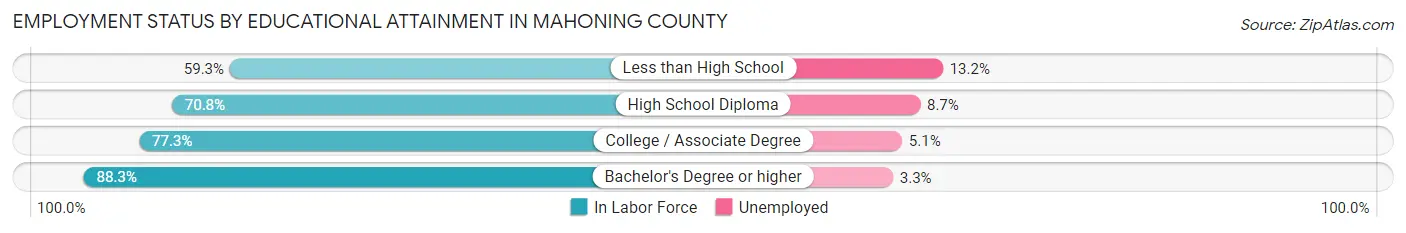
| Educational Attainment | In Labor Force | Unemployed |
| Less than High School | 5,270 (59.3%) | 1,173 (13.2%) |
| High School Diploma | 26,924 (70.8%) | 3,308 (8.7%) |
| College / Associate Degree | 26,818 (77.3%) | 1,769 (5.1%) |
| Bachelor's Degree or higher | 28,115 (88.3%) | 1,051 (3.3%) |
| Total | 87,128 (76.8%) | 6,920 (6.1%) |
Employment Occupations by Sex in Mahoning County
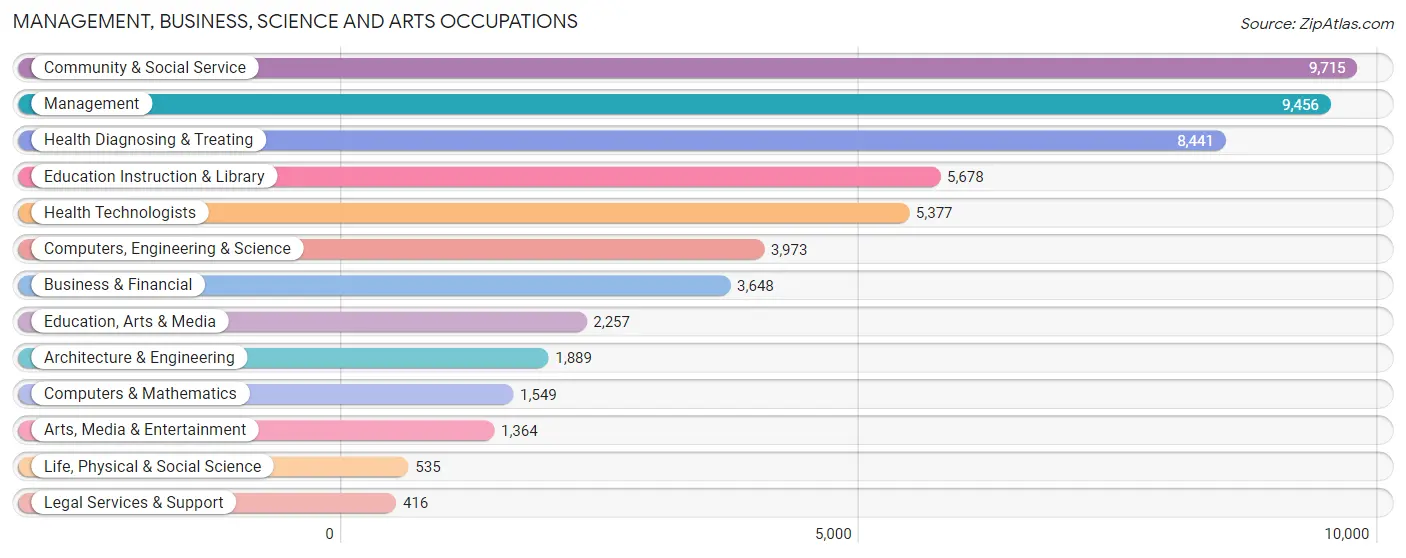
Management, Business, Science and Arts Occupations
The most common Management, Business, Science and Arts occupations in Mahoning County are Community & Social Service (9,715 | 9.3%), Management (9,456 | 9.1%), Health Diagnosing & Treating (8,441 | 8.1%), Education Instruction & Library (5,678 | 5.5%), and Health Technologists (5,377 | 5.2%).
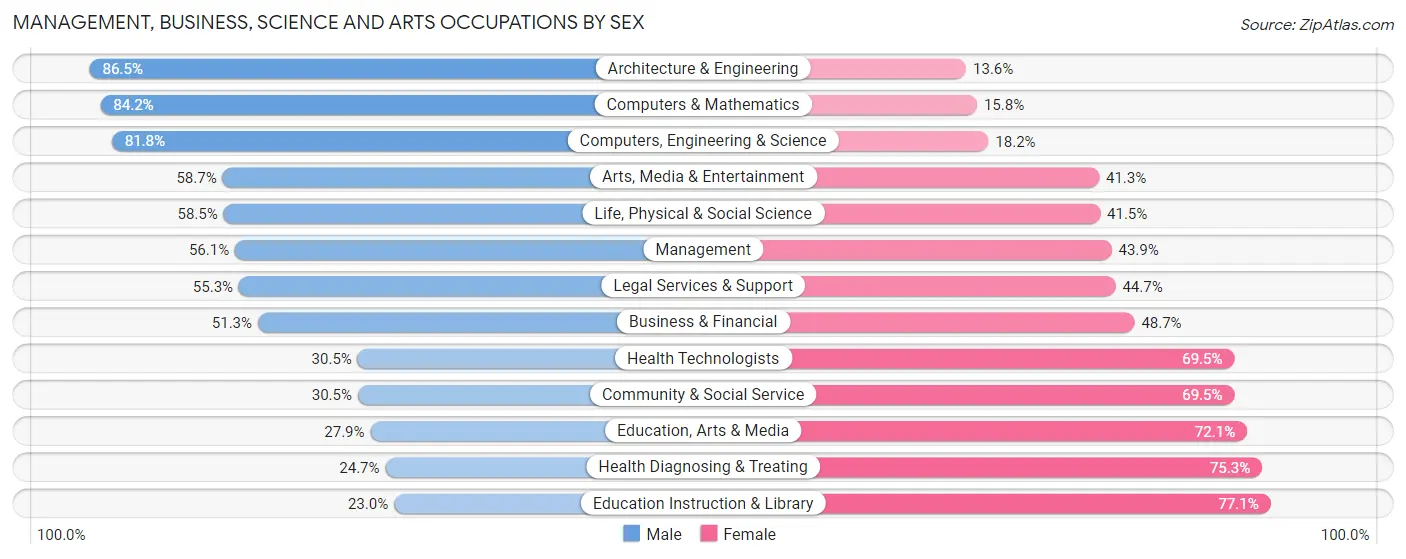
Management, Business, Science and Arts Occupations by Sex
Within the Management, Business, Science and Arts occupations in Mahoning County, the most male-oriented occupations are Architecture & Engineering (86.5%), Computers & Mathematics (84.2%), and Computers, Engineering & Science (81.8%), while the most female-oriented occupations are Education Instruction & Library (77.0%), Health Diagnosing & Treating (75.3%), and Education, Arts & Media (72.1%).
| Occupation | Male | Female |
| Management | 5,306 (56.1%) | 4,150 (43.9%) |
| Business & Financial | 1,873 (51.3%) | 1,775 (48.7%) |
| Computers, Engineering & Science | 3,250 (81.8%) | 723 (18.2%) |
| Computers & Mathematics | 1,304 (84.2%) | 245 (15.8%) |
| Architecture & Engineering | 1,633 (86.5%) | 256 (13.6%) |
| Life, Physical & Social Science | 313 (58.5%) | 222 (41.5%) |
| Community & Social Service | 2,963 (30.5%) | 6,752 (69.5%) |
| Education, Arts & Media | 629 (27.9%) | 1,628 (72.1%) |
| Legal Services & Support | 230 (55.3%) | 186 (44.7%) |
| Education Instruction & Library | 1,303 (23.0%) | 4,375 (77.0%) |
| Arts, Media & Entertainment | 801 (58.7%) | 563 (41.3%) |
| Health Diagnosing & Treating | 2,088 (24.7%) | 6,353 (75.3%) |
| Health Technologists | 1,641 (30.5%) | 3,736 (69.5%) |
| Total (Category) | 15,480 (43.9%) | 19,753 (56.1%) |
| Total (Overall) | 52,535 (50.6%) | 51,337 (49.4%) |
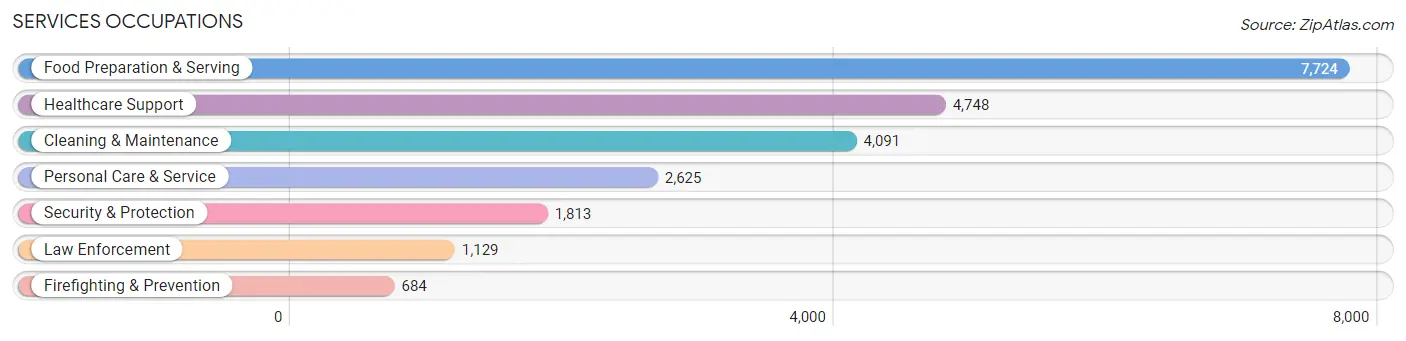
Services Occupations
The most common Services occupations in Mahoning County are Food Preparation & Serving (7,724 | 7.4%), Healthcare Support (4,748 | 4.6%), Cleaning & Maintenance (4,091 | 3.9%), Personal Care & Service (2,625 | 2.5%), and Security & Protection (1,813 | 1.8%).
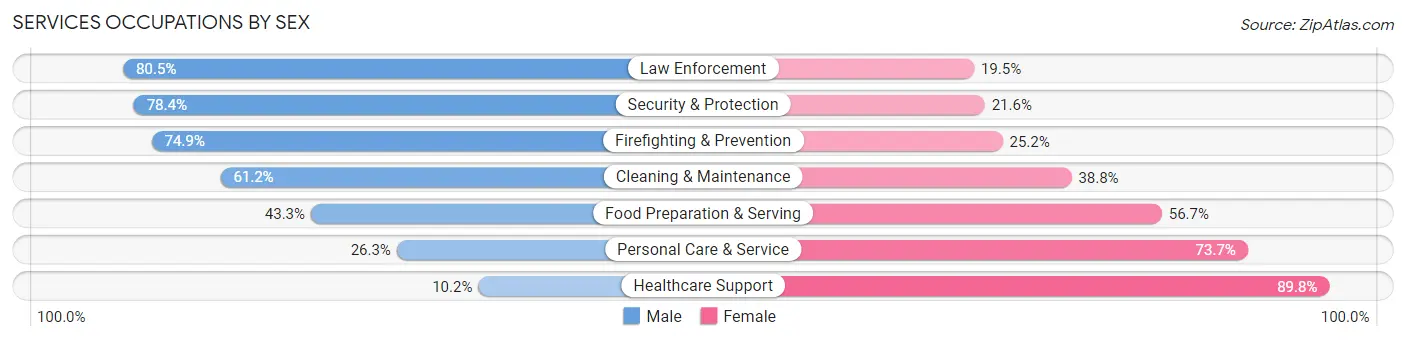
Services Occupations by Sex
Within the Services occupations in Mahoning County, the most male-oriented occupations are Law Enforcement (80.5%), Security & Protection (78.4%), and Firefighting & Prevention (74.9%), while the most female-oriented occupations are Healthcare Support (89.8%), Personal Care & Service (73.7%), and Food Preparation & Serving (56.7%).
| Occupation | Male | Female |
| Healthcare Support | 483 (10.2%) | 4,265 (89.8%) |
| Security & Protection | 1,421 (78.4%) | 392 (21.6%) |
| Firefighting & Prevention | 512 (74.9%) | 172 (25.2%) |
| Law Enforcement | 909 (80.5%) | 220 (19.5%) |
| Food Preparation & Serving | 3,345 (43.3%) | 4,379 (56.7%) |
| Cleaning & Maintenance | 2,504 (61.2%) | 1,587 (38.8%) |
| Personal Care & Service | 691 (26.3%) | 1,934 (73.7%) |
| Total (Category) | 8,444 (40.2%) | 12,557 (59.8%) |
| Total (Overall) | 52,535 (50.6%) | 51,337 (49.4%) |
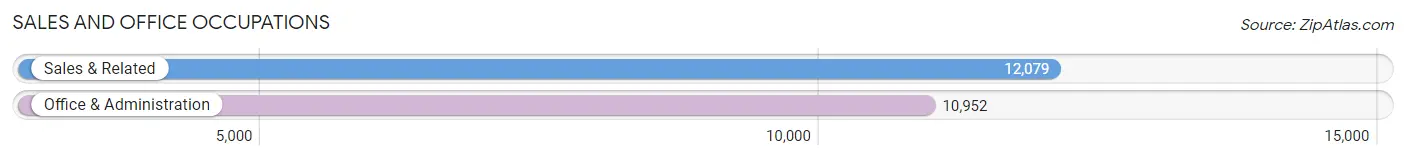
Sales and Office Occupations
The most common Sales and Office occupations in Mahoning County are Sales & Related (12,079 | 11.6%), and Office & Administration (10,952 | 10.5%).
Sales and Office Occupations by Sex
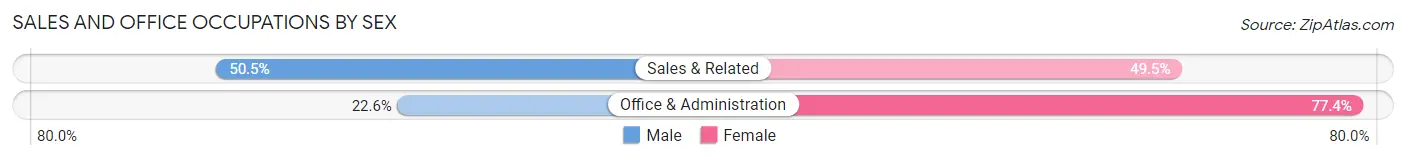
| Occupation | Male | Female |
| Sales & Related | 6,100 (50.5%) | 5,979 (49.5%) |
| Office & Administration | 2,475 (22.6%) | 8,477 (77.4%) |
| Total (Category) | 8,575 (37.2%) | 14,456 (62.8%) |
| Total (Overall) | 52,535 (50.6%) | 51,337 (49.4%) |
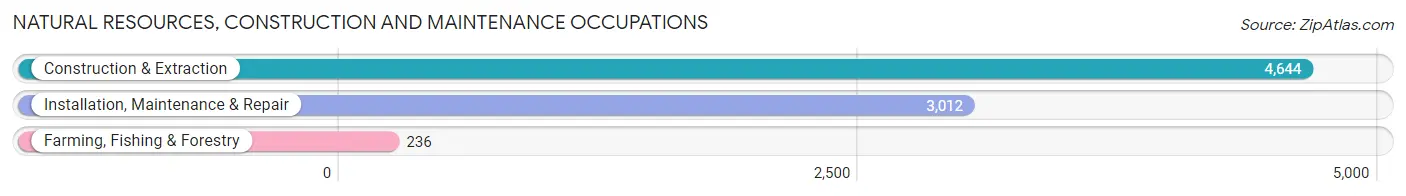
Natural Resources, Construction and Maintenance Occupations
The most common Natural Resources, Construction and Maintenance occupations in Mahoning County are Construction & Extraction (4,644 | 4.5%), Installation, Maintenance & Repair (3,012 | 2.9%), and Farming, Fishing & Forestry (236 | 0.2%).
Natural Resources, Construction and Maintenance Occupations by Sex
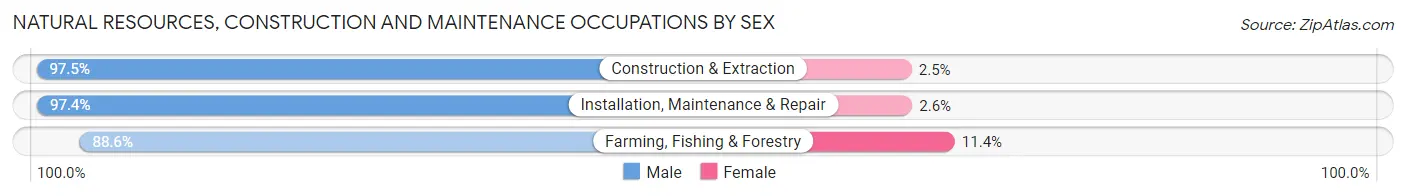
| Occupation | Male | Female |
| Farming, Fishing & Forestry | 209 (88.6%) | 27 (11.4%) |
| Construction & Extraction | 4,529 (97.5%) | 115 (2.5%) |
| Installation, Maintenance & Repair | 2,934 (97.4%) | 78 (2.6%) |
| Total (Category) | 7,672 (97.2%) | 220 (2.8%) |
| Total (Overall) | 52,535 (50.6%) | 51,337 (49.4%) |
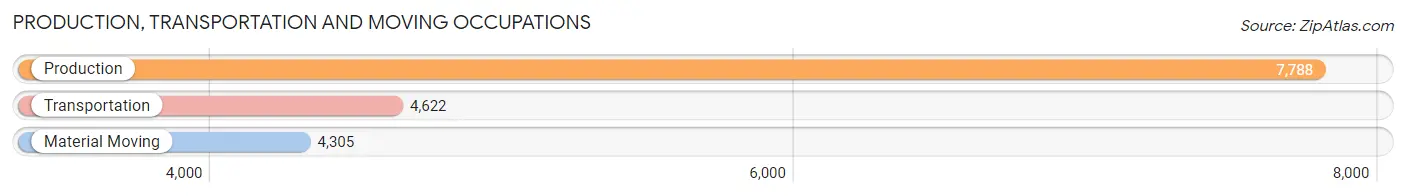
Production, Transportation and Moving Occupations
The most common Production, Transportation and Moving occupations in Mahoning County are Production (7,788 | 7.5%), Transportation (4,622 | 4.4%), and Material Moving (4,305 | 4.1%).
Production, Transportation and Moving Occupations by Sex
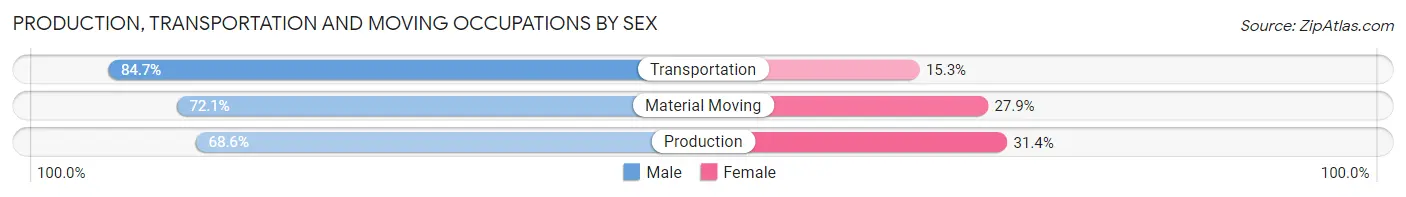
| Occupation | Male | Female |
| Production | 5,344 (68.6%) | 2,444 (31.4%) |
| Transportation | 3,915 (84.7%) | 707 (15.3%) |
| Material Moving | 3,105 (72.1%) | 1,200 (27.9%) |
| Total (Category) | 12,364 (74.0%) | 4,351 (26.0%) |
| Total (Overall) | 52,535 (50.6%) | 51,337 (49.4%) |
Employment Industries by Sex in Mahoning County
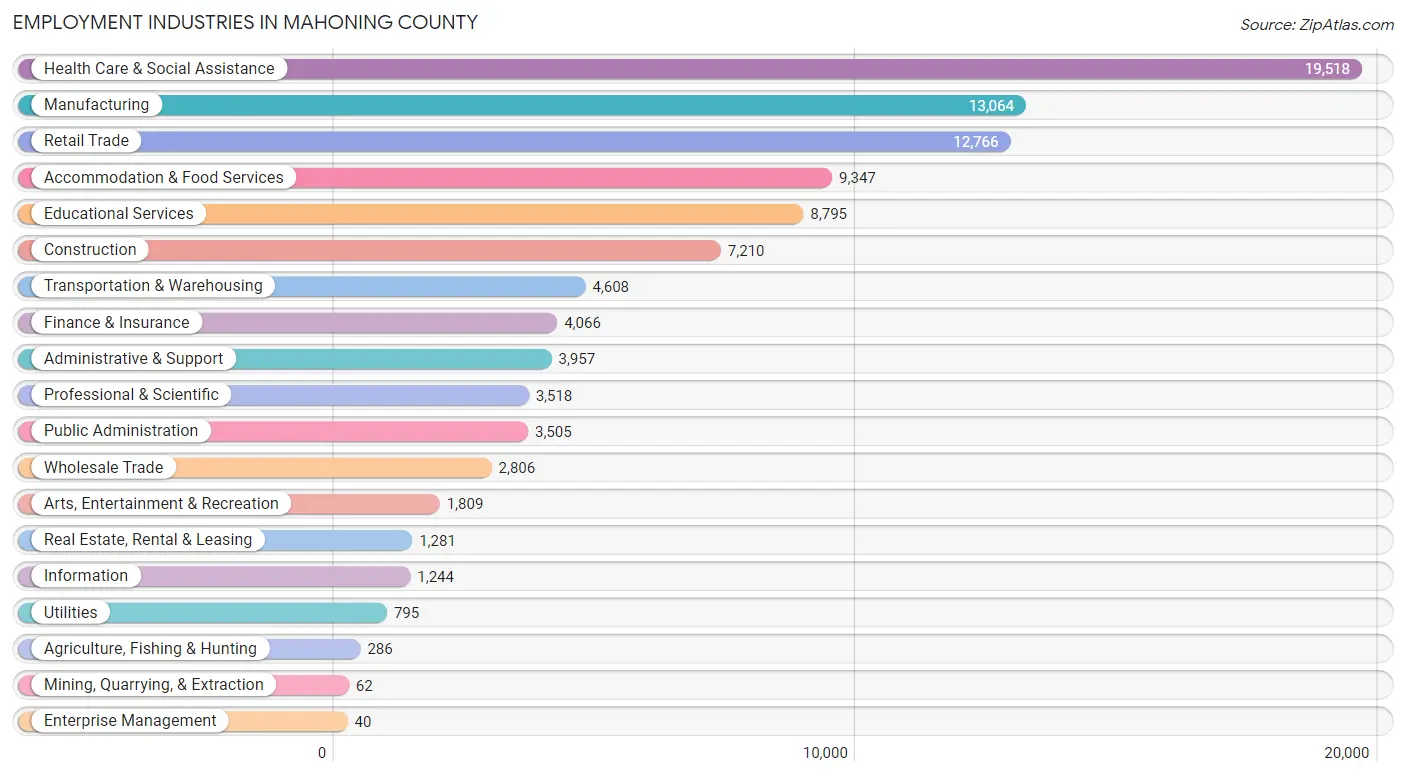
Employment Industries in Mahoning County
The major employment industries in Mahoning County include Health Care & Social Assistance (19,518 | 18.8%), Manufacturing (13,064 | 12.6%), Retail Trade (12,766 | 12.3%), Accommodation & Food Services (9,347 | 9.0%), and Educational Services (8,795 | 8.5%).
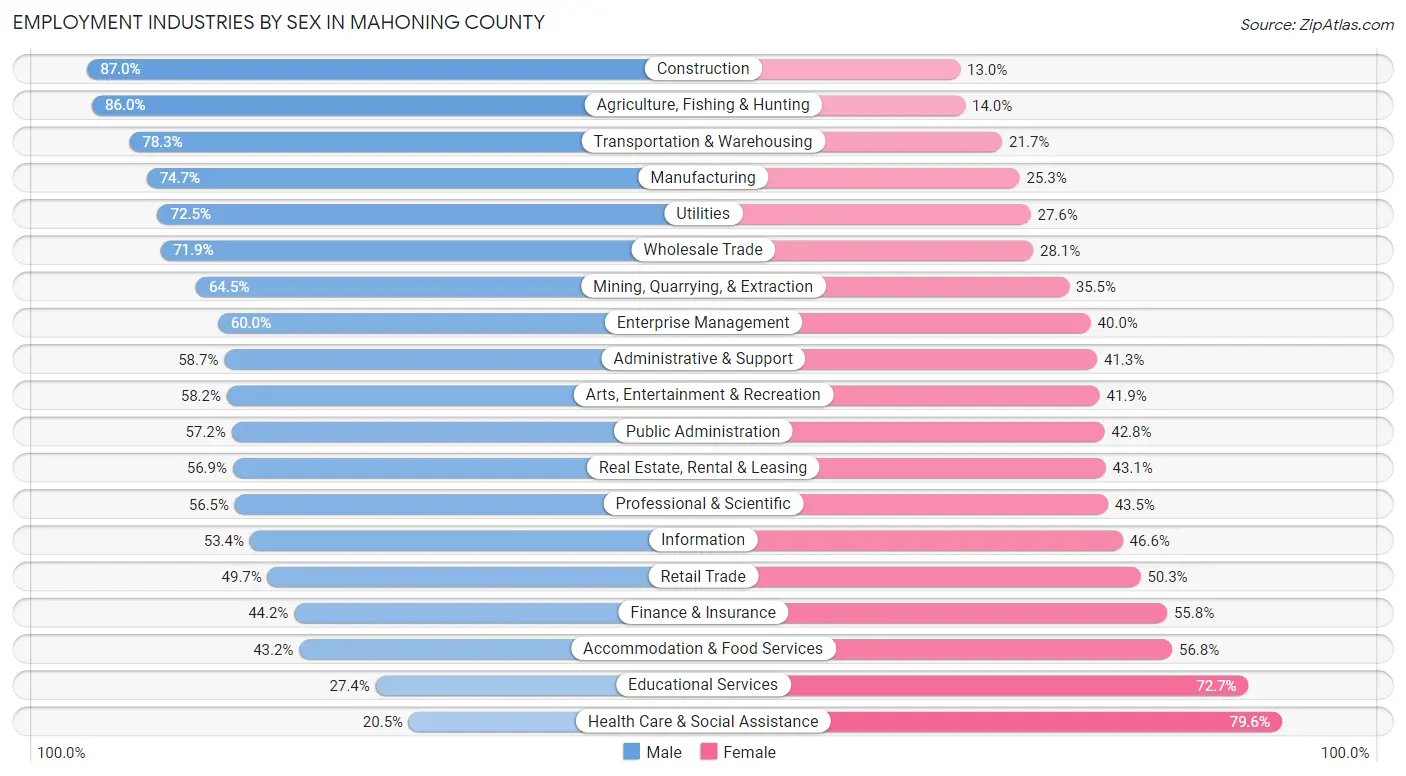
Employment Industries by Sex in Mahoning County
The Mahoning County industries that see more men than women are Construction (87.0%), Agriculture, Fishing & Hunting (86.0%), and Transportation & Warehousing (78.3%), whereas the industries that tend to have a higher number of women are Health Care & Social Assistance (79.5%), Educational Services (72.7%), and Accommodation & Food Services (56.8%).
| Industry | Male | Female |
| Agriculture, Fishing & Hunting | 246 (86.0%) | 40 (14.0%) |
| Mining, Quarrying, & Extraction | 40 (64.5%) | 22 (35.5%) |
| Construction | 6,274 (87.0%) | 936 (13.0%) |
| Manufacturing | 9,761 (74.7%) | 3,303 (25.3%) |
| Wholesale Trade | 2,018 (71.9%) | 788 (28.1%) |
| Retail Trade | 6,345 (49.7%) | 6,421 (50.3%) |
| Transportation & Warehousing | 3,609 (78.3%) | 999 (21.7%) |
| Utilities | 576 (72.5%) | 219 (27.6%) |
| Information | 664 (53.4%) | 580 (46.6%) |
| Finance & Insurance | 1,797 (44.2%) | 2,269 (55.8%) |
| Real Estate, Rental & Leasing | 729 (56.9%) | 552 (43.1%) |
| Professional & Scientific | 1,987 (56.5%) | 1,531 (43.5%) |
| Enterprise Management | 24 (60.0%) | 16 (40.0%) |
| Administrative & Support | 2,322 (58.7%) | 1,635 (41.3%) |
| Educational Services | 2,405 (27.4%) | 6,390 (72.7%) |
| Health Care & Social Assistance | 3,992 (20.4%) | 15,526 (79.5%) |
| Arts, Entertainment & Recreation | 1,052 (58.2%) | 757 (41.8%) |
| Accommodation & Food Services | 4,034 (43.2%) | 5,313 (56.8%) |
| Public Administration | 2,004 (57.2%) | 1,501 (42.8%) |
| Total | 52,535 (50.6%) | 51,337 (49.4%) |
Education in Mahoning County
School Enrollment in Mahoning County
The most common levels of schooling among the 49,732 students in Mahoning County are high school (11,207 | 22.5%), middle school (10,795 | 21.7%), and elementary school (10,130 | 20.4%).
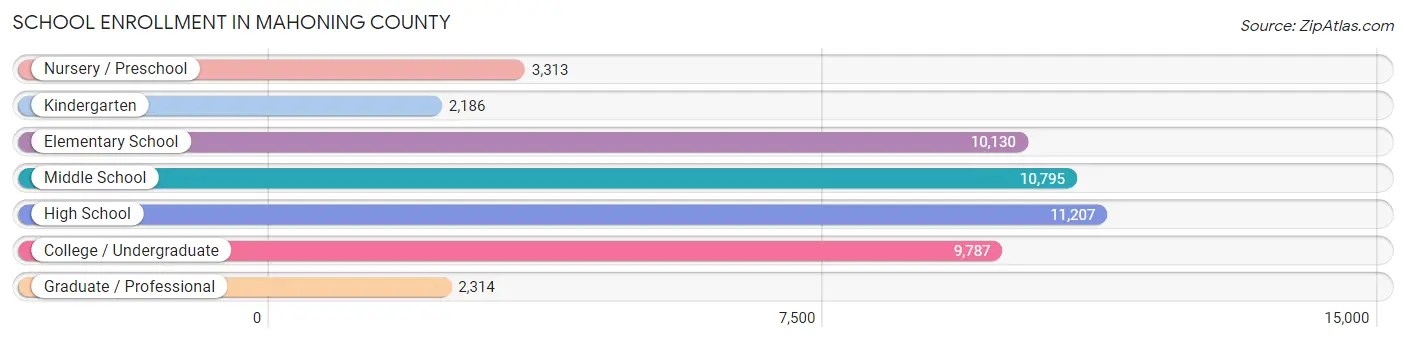
| School Level | # Students | % Students |
| Nursery / Preschool | 3,313 | 6.7% |
| Kindergarten | 2,186 | 4.4% |
| Elementary School | 10,130 | 20.4% |
| Middle School | 10,795 | 21.7% |
| High School | 11,207 | 22.5% |
| College / Undergraduate | 9,787 | 19.7% |
| Graduate / Professional | 2,314 | 4.6% |
| Total | 49,732 | 100.0% |
School Enrollment by Age by Funding Source in Mahoning County
Out of a total of 49,732 students who are enrolled in schools in Mahoning County, 8,007 (16.1%) attend a private institution, while the remaining 41,725 (83.9%) are enrolled in public schools. The age group of 3 to 4 year olds has the highest likelihood of being enrolled in private schools, with 851 (35.4% in the age bracket) enrolled. Conversely, the age group of 18 to 19 year olds has the lowest likelihood of being enrolled in a private school, with 3,448 (90.2% in the age bracket) attending a public institution.
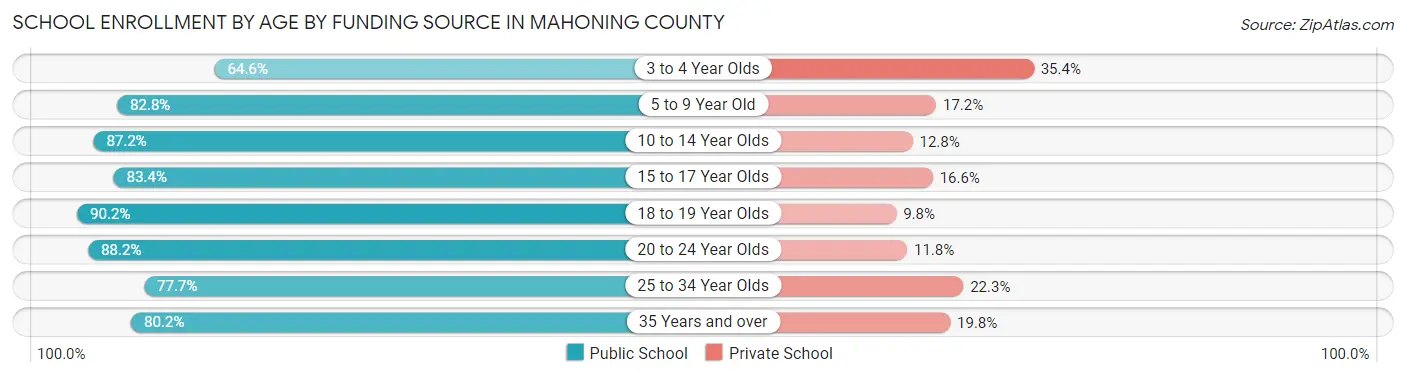
| Age Bracket | Public School | Private School |
| 3 to 4 Year Olds | 1,553 (64.6%) | 851 (35.4%) |
| 5 to 9 Year Old | 9,634 (82.8%) | 2,003 (17.2%) |
| 10 to 14 Year Olds | 11,520 (87.2%) | 1,695 (12.8%) |
| 15 to 17 Year Olds | 6,865 (83.4%) | 1,364 (16.6%) |
| 18 to 19 Year Olds | 3,448 (90.2%) | 374 (9.8%) |
| 20 to 24 Year Olds | 4,583 (88.2%) | 614 (11.8%) |
| 25 to 34 Year Olds | 1,916 (77.7%) | 549 (22.3%) |
| 35 Years and over | 2,215 (80.2%) | 548 (19.8%) |
| Total | 41,725 (83.9%) | 8,007 (16.1%) |
Educational Attainment by Field of Study in Mahoning County
Business (9,610 | 20.9%), education (9,001 | 19.6%), science & technology (6,417 | 13.9%), arts & humanities (3,233 | 7.0%), and engineering (2,803 | 6.1%) are the most common fields of study among 46,036 individuals in Mahoning County who have obtained a bachelor's degree or higher.
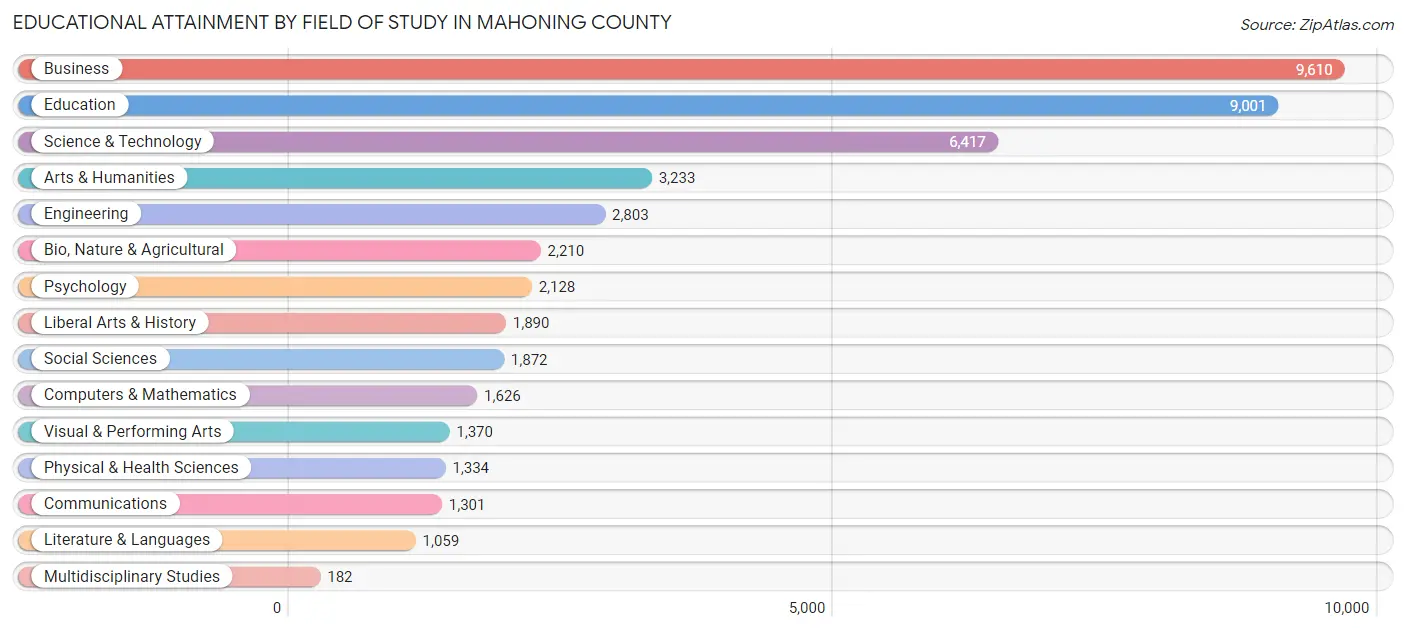
| Field of Study | # Graduates | % Graduates |
| Computers & Mathematics | 1,626 | 3.5% |
| Bio, Nature & Agricultural | 2,210 | 4.8% |
| Physical & Health Sciences | 1,334 | 2.9% |
| Psychology | 2,128 | 4.6% |
| Social Sciences | 1,872 | 4.1% |
| Engineering | 2,803 | 6.1% |
| Multidisciplinary Studies | 182 | 0.4% |
| Science & Technology | 6,417 | 13.9% |
| Business | 9,610 | 20.9% |
| Education | 9,001 | 19.6% |
| Literature & Languages | 1,059 | 2.3% |
| Liberal Arts & History | 1,890 | 4.1% |
| Visual & Performing Arts | 1,370 | 3.0% |
| Communications | 1,301 | 2.8% |
| Arts & Humanities | 3,233 | 7.0% |
| Total | 46,036 | 100.0% |
Transportation & Commute in Mahoning County
Vehicle Availability by Sex in Mahoning County
The most prevalent vehicle ownership categories in Mahoning County are males with 2 vehicles (22,015, accounting for 43.1%) and females with 2 vehicles (19,495, making up 44.7%).
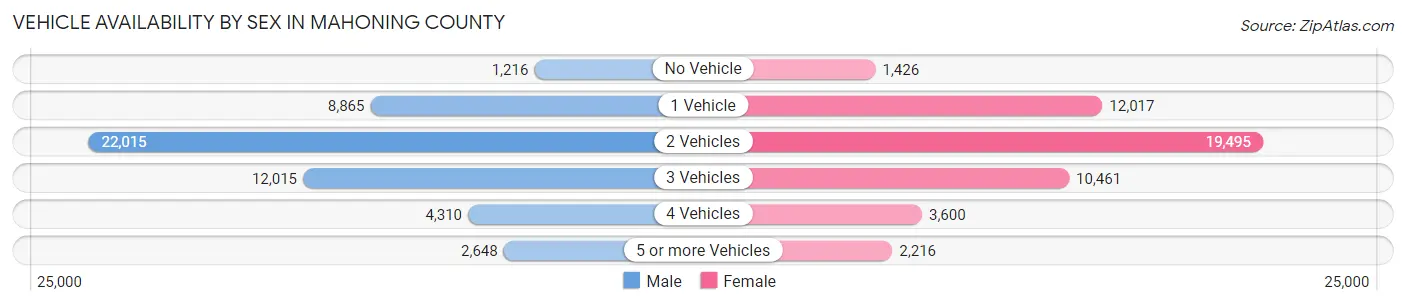
| Vehicles Available | Male | Female |
| No Vehicle | 1,216 (2.4%) | 1,426 (2.9%) |
| 1 Vehicle | 8,865 (17.4%) | 12,017 (24.4%) |
| 2 Vehicles | 22,015 (43.1%) | 19,495 (39.6%) |
| 3 Vehicles | 12,015 (23.5%) | 10,461 (21.3%) |
| 4 Vehicles | 4,310 (8.4%) | 3,600 (7.3%) |
| 5 or more Vehicles | 2,648 (5.2%) | 2,216 (4.5%) |
| Total | 51,069 (100.0%) | 49,215 (100.0%) |
Commute Time in Mahoning County
The most frequently occuring commute durations in Mahoning County are 15 to 19 minutes (18,156 commuters, 19.4%), 10 to 14 minutes (17,179 commuters, 18.4%), and 20 to 24 minutes (14,770 commuters, 15.8%).
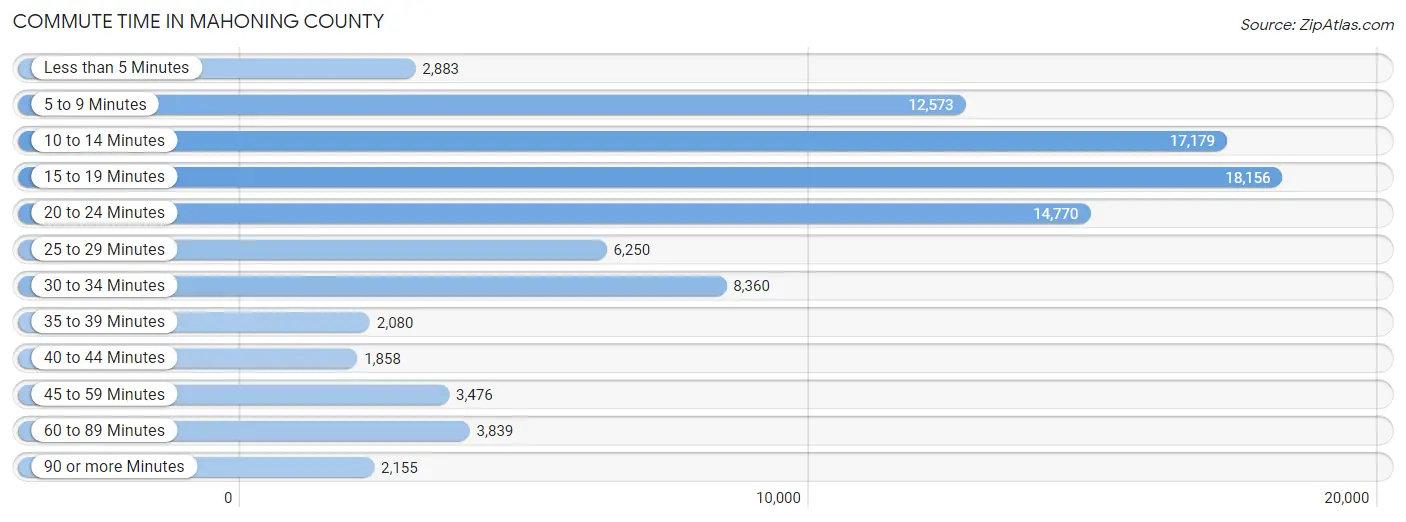
| Commute Time | # Commuters | % Commuters |
| Less than 5 Minutes | 2,883 | 3.1% |
| 5 to 9 Minutes | 12,573 | 13.4% |
| 10 to 14 Minutes | 17,179 | 18.4% |
| 15 to 19 Minutes | 18,156 | 19.4% |
| 20 to 24 Minutes | 14,770 | 15.8% |
| 25 to 29 Minutes | 6,250 | 6.7% |
| 30 to 34 Minutes | 8,360 | 8.9% |
| 35 to 39 Minutes | 2,080 | 2.2% |
| 40 to 44 Minutes | 1,858 | 2.0% |
| 45 to 59 Minutes | 3,476 | 3.7% |
| 60 to 89 Minutes | 3,839 | 4.1% |
| 90 or more Minutes | 2,155 | 2.3% |
Commute Time by Sex in Mahoning County
The most common commute times in Mahoning County are 15 to 19 minutes (9,076 commuters, 18.9%) for males and 15 to 19 minutes (9,080 commuters, 20.0%) for females.
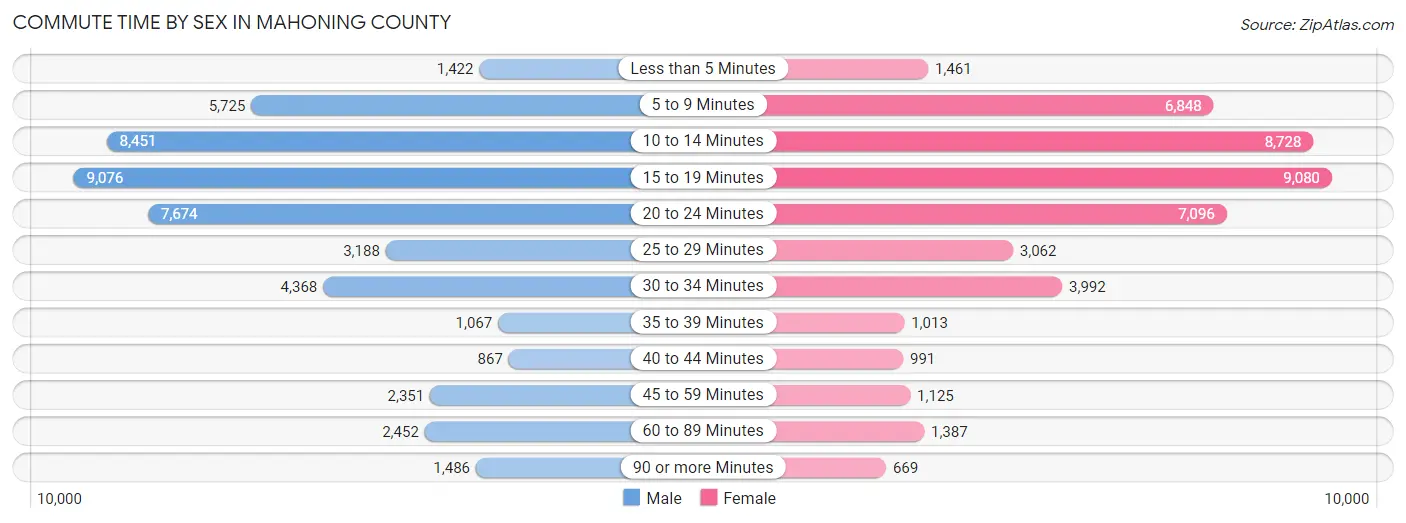
| Commute Time | Male | Female |
| Less than 5 Minutes | 1,422 (2.9%) | 1,461 (3.2%) |
| 5 to 9 Minutes | 5,725 (11.9%) | 6,848 (15.1%) |
| 10 to 14 Minutes | 8,451 (17.6%) | 8,728 (19.2%) |
| 15 to 19 Minutes | 9,076 (18.9%) | 9,080 (20.0%) |
| 20 to 24 Minutes | 7,674 (16.0%) | 7,096 (15.6%) |
| 25 to 29 Minutes | 3,188 (6.6%) | 3,062 (6.7%) |
| 30 to 34 Minutes | 4,368 (9.1%) | 3,992 (8.8%) |
| 35 to 39 Minutes | 1,067 (2.2%) | 1,013 (2.2%) |
| 40 to 44 Minutes | 867 (1.8%) | 991 (2.2%) |
| 45 to 59 Minutes | 2,351 (4.9%) | 1,125 (2.5%) |
| 60 to 89 Minutes | 2,452 (5.1%) | 1,387 (3.0%) |
| 90 or more Minutes | 1,486 (3.1%) | 669 (1.5%) |
Time of Departure to Work by Sex in Mahoning County
The most frequent times of departure to work in Mahoning County are 7:00 AM to 7:29 AM (5,858, 12.2%) for males and 7:30 AM to 7:59 AM (6,520, 14.3%) for females.
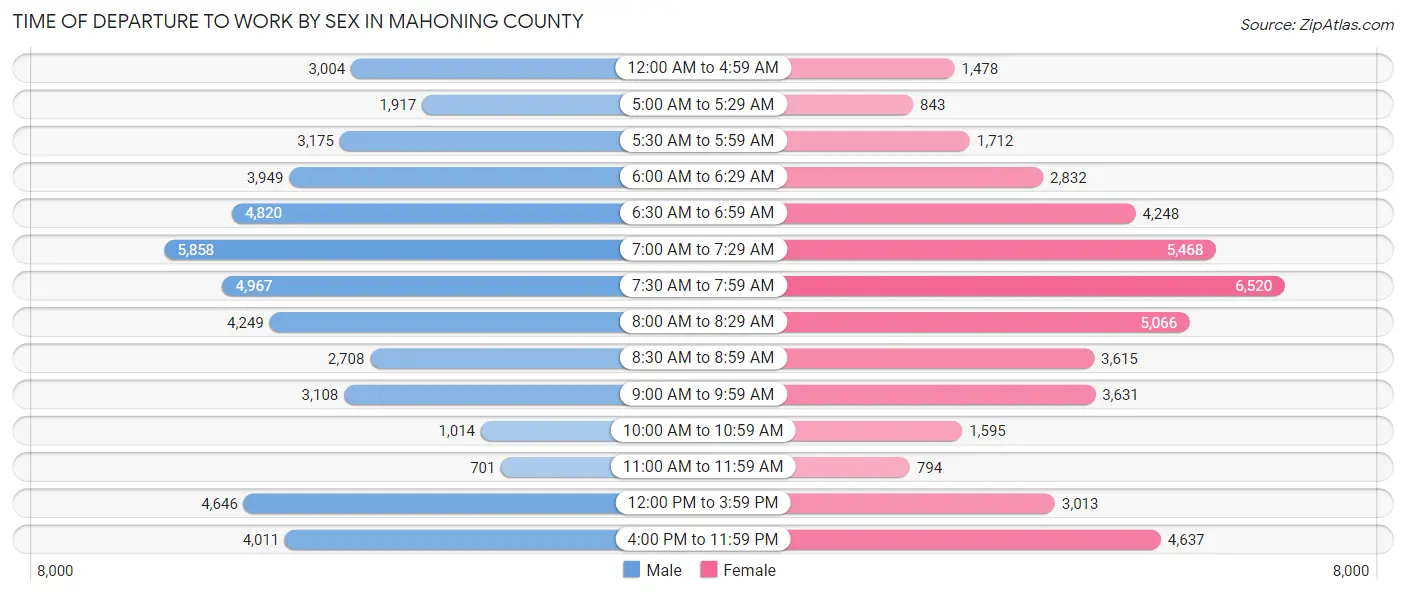
| Time of Departure | Male | Female |
| 12:00 AM to 4:59 AM | 3,004 (6.2%) | 1,478 (3.3%) |
| 5:00 AM to 5:29 AM | 1,917 (4.0%) | 843 (1.8%) |
| 5:30 AM to 5:59 AM | 3,175 (6.6%) | 1,712 (3.8%) |
| 6:00 AM to 6:29 AM | 3,949 (8.2%) | 2,832 (6.2%) |
| 6:30 AM to 6:59 AM | 4,820 (10.0%) | 4,248 (9.3%) |
| 7:00 AM to 7:29 AM | 5,858 (12.2%) | 5,468 (12.0%) |
| 7:30 AM to 7:59 AM | 4,967 (10.3%) | 6,520 (14.3%) |
| 8:00 AM to 8:29 AM | 4,249 (8.8%) | 5,066 (11.2%) |
| 8:30 AM to 8:59 AM | 2,708 (5.6%) | 3,615 (8.0%) |
| 9:00 AM to 9:59 AM | 3,108 (6.5%) | 3,631 (8.0%) |
| 10:00 AM to 10:59 AM | 1,014 (2.1%) | 1,595 (3.5%) |
| 11:00 AM to 11:59 AM | 701 (1.5%) | 794 (1.8%) |
| 12:00 PM to 3:59 PM | 4,646 (9.7%) | 3,013 (6.6%) |
| 4:00 PM to 11:59 PM | 4,011 (8.3%) | 4,637 (10.2%) |
| Total | 48,127 (100.0%) | 45,452 (100.0%) |
Housing Occupancy in Mahoning County
Occupancy by Ownership in Mahoning County
Of the total 97,655 dwellings in Mahoning County, owner-occupied units account for 68,136 (69.8%), while renter-occupied units make up 29,519 (30.2%).
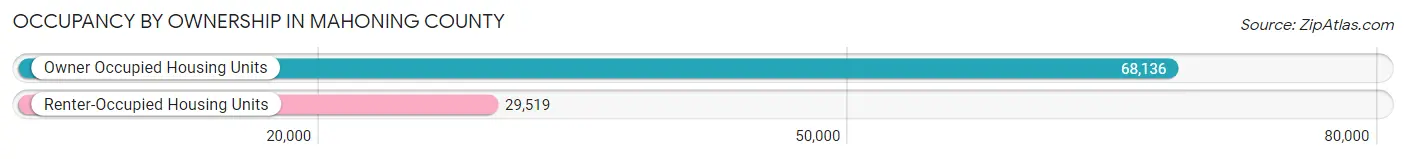
| Occupancy | # Housing Units | % Housing Units |
| Owner Occupied Housing Units | 68,136 | 69.8% |
| Renter-Occupied Housing Units | 29,519 | 30.2% |
| Total Occupied Housing Units | 97,655 | 100.0% |
Occupancy by Household Size in Mahoning County
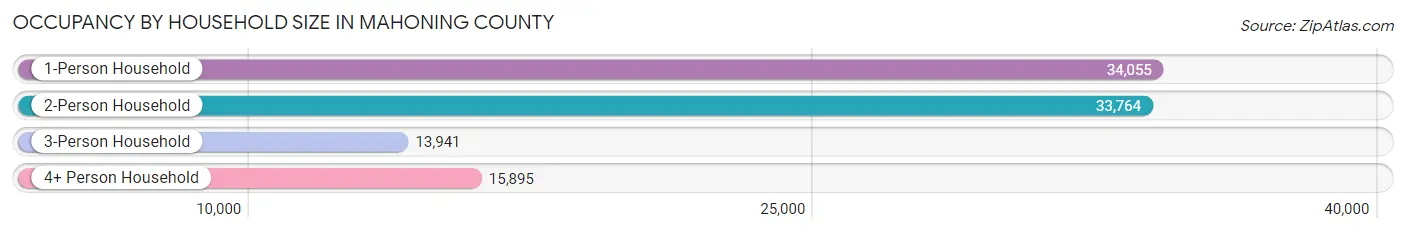
| Household Size | # Housing Units | % Housing Units |
| 1-Person Household | 34,055 | 34.9% |
| 2-Person Household | 33,764 | 34.6% |
| 3-Person Household | 13,941 | 14.3% |
| 4+ Person Household | 15,895 | 16.3% |
| Total Housing Units | 97,655 | 100.0% |
Occupancy by Ownership by Household Size in Mahoning County
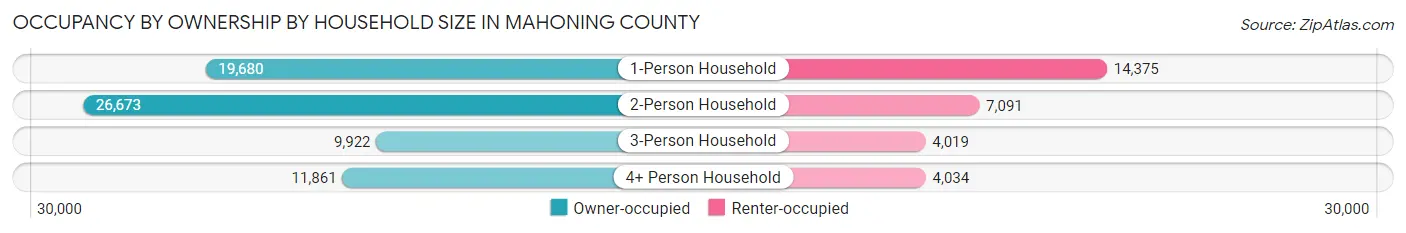
| Household Size | Owner-occupied | Renter-occupied |
| 1-Person Household | 19,680 (57.8%) | 14,375 (42.2%) |
| 2-Person Household | 26,673 (79.0%) | 7,091 (21.0%) |
| 3-Person Household | 9,922 (71.2%) | 4,019 (28.8%) |
| 4+ Person Household | 11,861 (74.6%) | 4,034 (25.4%) |
| Total Housing Units | 68,136 (69.8%) | 29,519 (30.2%) |
Occupancy by Educational Attainment in Mahoning County
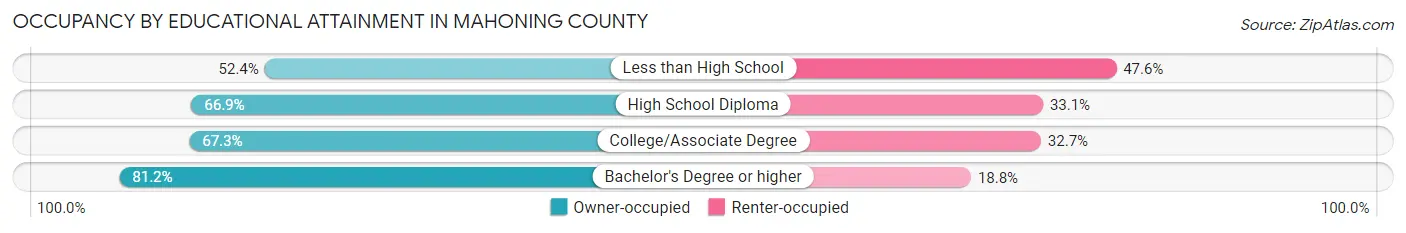
| Household Size | Owner-occupied | Renter-occupied |
| Less than High School | 3,914 (52.4%) | 3,554 (47.6%) |
| High School Diploma | 22,103 (66.9%) | 10,921 (33.1%) |
| College/Associate Degree | 20,889 (67.3%) | 10,133 (32.7%) |
| Bachelor's Degree or higher | 21,230 (81.2%) | 4,911 (18.8%) |
Occupancy by Age of Householder in Mahoning County
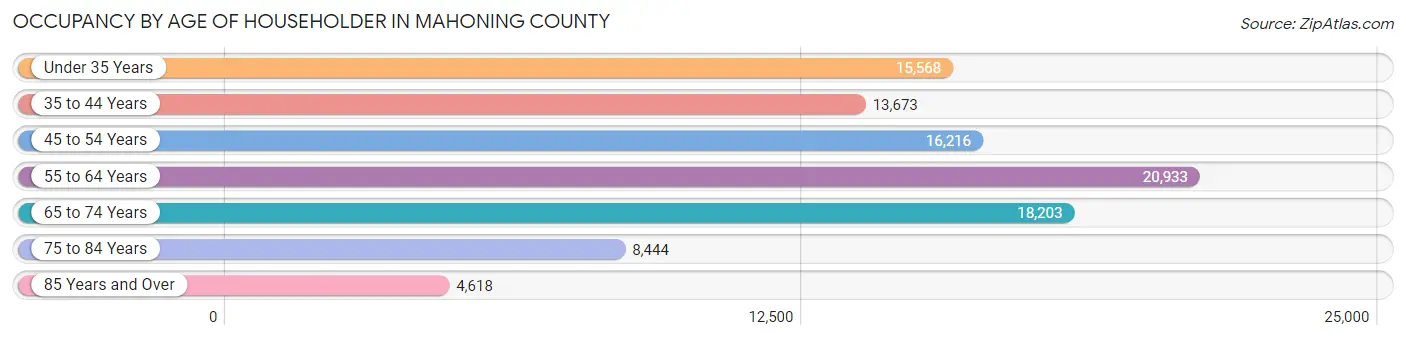
| Age Bracket | # Households | % Households |
| Under 35 Years | 15,568 | 15.9% |
| 35 to 44 Years | 13,673 | 14.0% |
| 45 to 54 Years | 16,216 | 16.6% |
| 55 to 64 Years | 20,933 | 21.4% |
| 65 to 74 Years | 18,203 | 18.6% |
| 75 to 84 Years | 8,444 | 8.6% |
| 85 Years and Over | 4,618 | 4.7% |
| Total | 97,655 | 100.0% |
Housing Finances in Mahoning County
Median Income by Occupancy in Mahoning County
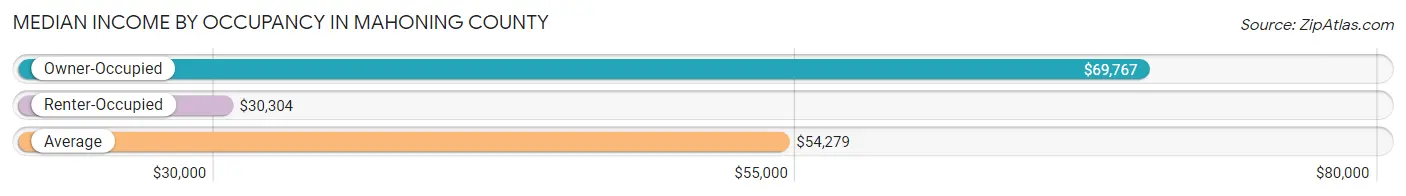
| Occupancy Type | # Households | Median Income |
| Owner-Occupied | 68,136 (69.8%) | $69,767 |
| Renter-Occupied | 29,519 (30.2%) | $30,304 |
| Average | 97,655 (100.0%) | $54,279 |
Occupancy by Householder Income Bracket in Mahoning County
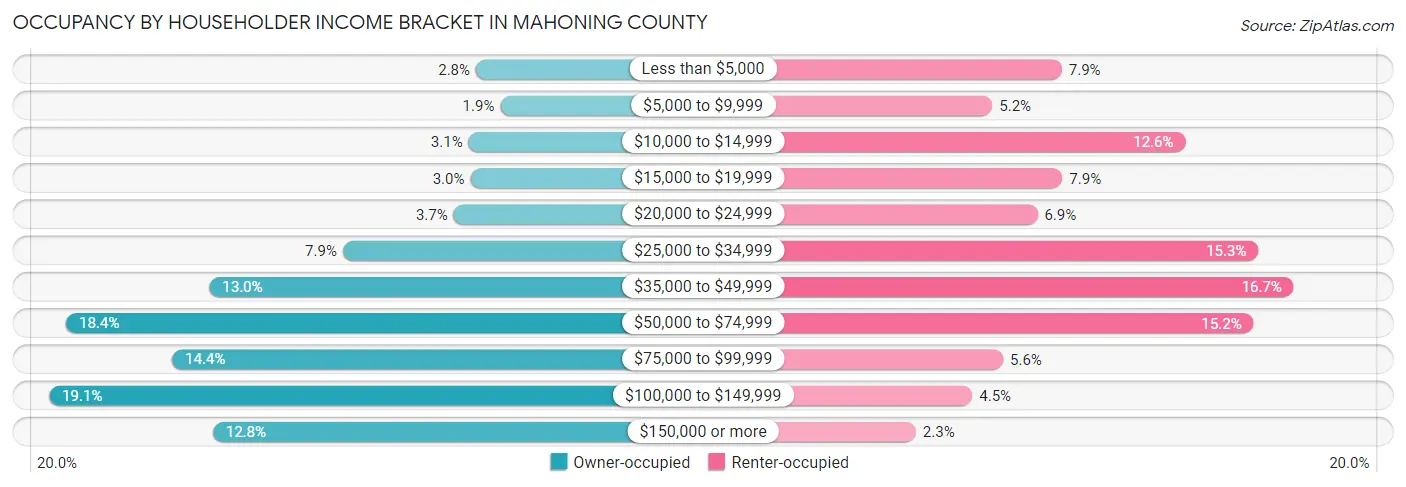
| Income Bracket | Owner-occupied | Renter-occupied |
| Less than $5,000 | 1,916 (2.8%) | 2,320 (7.9%) |
| $5,000 to $9,999 | 1,280 (1.9%) | 1,538 (5.2%) |
| $10,000 to $14,999 | 2,104 (3.1%) | 3,707 (12.6%) |
| $15,000 to $19,999 | 2,058 (3.0%) | 2,327 (7.9%) |
| $20,000 to $24,999 | 2,497 (3.7%) | 2,045 (6.9%) |
| $25,000 to $34,999 | 5,368 (7.9%) | 4,527 (15.3%) |
| $35,000 to $49,999 | 8,829 (13.0%) | 4,926 (16.7%) |
| $50,000 to $74,999 | 12,550 (18.4%) | 4,475 (15.2%) |
| $75,000 to $99,999 | 9,796 (14.4%) | 1,660 (5.6%) |
| $100,000 to $149,999 | 12,996 (19.1%) | 1,314 (4.4%) |
| $150,000 or more | 8,742 (12.8%) | 680 (2.3%) |
| Total | 68,136 (100.0%) | 29,519 (100.0%) |
Monthly Housing Cost Tiers in Mahoning County
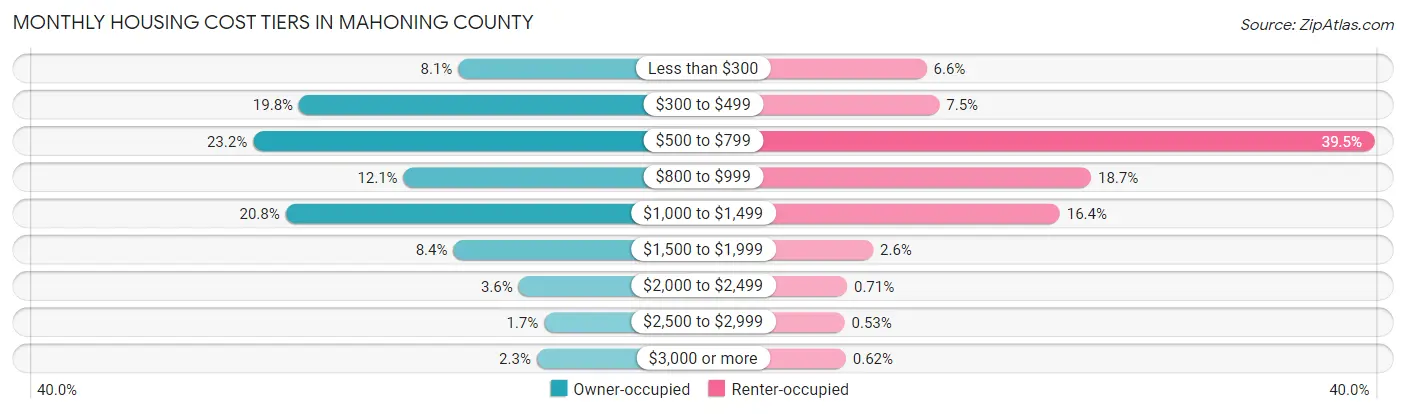
| Monthly Cost | Owner-occupied | Renter-occupied |
| Less than $300 | 5,497 (8.1%) | 1,938 (6.6%) |
| $300 to $499 | 13,491 (19.8%) | 2,218 (7.5%) |
| $500 to $799 | 15,794 (23.2%) | 11,659 (39.5%) |
| $800 to $999 | 8,243 (12.1%) | 5,514 (18.7%) |
| $1,000 to $1,499 | 14,162 (20.8%) | 4,835 (16.4%) |
| $1,500 to $1,999 | 5,741 (8.4%) | 775 (2.6%) |
| $2,000 to $2,499 | 2,467 (3.6%) | 210 (0.7%) |
| $2,500 to $2,999 | 1,188 (1.7%) | 157 (0.5%) |
| $3,000 or more | 1,553 (2.3%) | 184 (0.6%) |
| Total | 68,136 (100.0%) | 29,519 (100.0%) |
Physical Housing Characteristics in Mahoning County
Housing Structures in Mahoning County
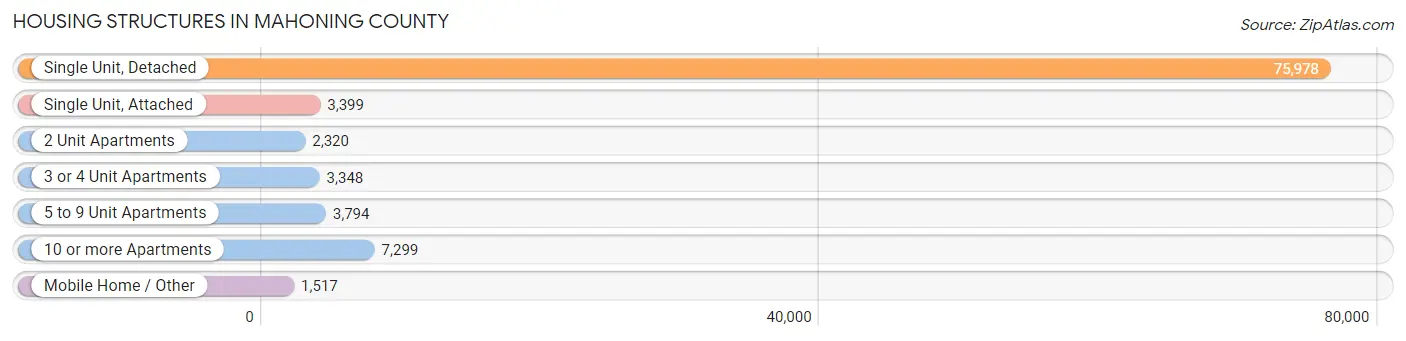
| Structure Type | # Housing Units | % Housing Units |
| Single Unit, Detached | 75,978 | 77.8% |
| Single Unit, Attached | 3,399 | 3.5% |
| 2 Unit Apartments | 2,320 | 2.4% |
| 3 or 4 Unit Apartments | 3,348 | 3.4% |
| 5 to 9 Unit Apartments | 3,794 | 3.9% |
| 10 or more Apartments | 7,299 | 7.5% |
| Mobile Home / Other | 1,517 | 1.5% |
| Total | 97,655 | 100.0% |
Housing Structures by Occupancy in Mahoning County
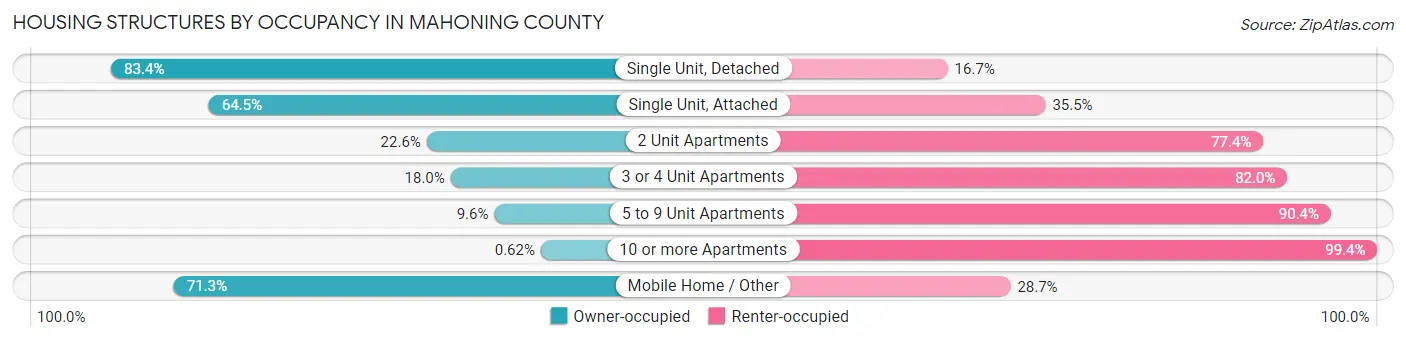
| Structure Type | Owner-occupied | Renter-occupied |
| Single Unit, Detached | 63,328 (83.4%) | 12,650 (16.7%) |
| Single Unit, Attached | 2,193 (64.5%) | 1,206 (35.5%) |
| 2 Unit Apartments | 524 (22.6%) | 1,796 (77.4%) |
| 3 or 4 Unit Apartments | 602 (18.0%) | 2,746 (82.0%) |
| 5 to 9 Unit Apartments | 363 (9.6%) | 3,431 (90.4%) |
| 10 or more Apartments | 45 (0.6%) | 7,254 (99.4%) |
| Mobile Home / Other | 1,081 (71.3%) | 436 (28.7%) |
| Total | 68,136 (69.8%) | 29,519 (30.2%) |
Housing Structures by Number of Rooms in Mahoning County
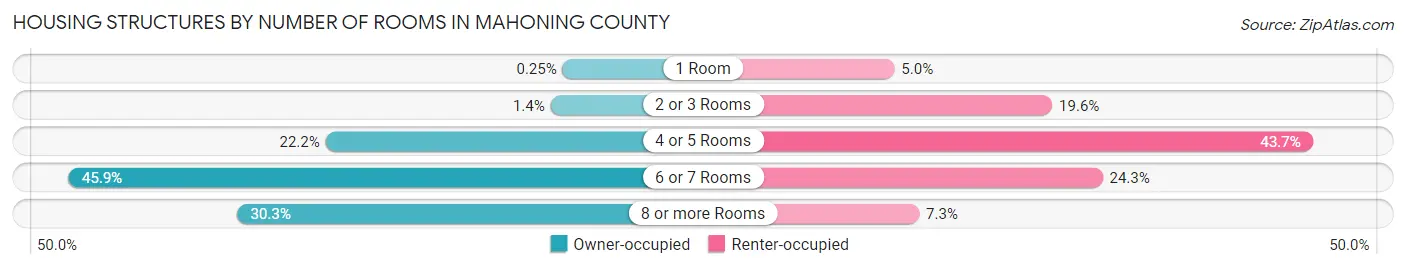
| Number of Rooms | Owner-occupied | Renter-occupied |
| 1 Room | 172 (0.3%) | 1,487 (5.0%) |
| 2 or 3 Rooms | 925 (1.4%) | 5,795 (19.6%) |
| 4 or 5 Rooms | 15,108 (22.2%) | 12,902 (43.7%) |
| 6 or 7 Rooms | 31,276 (45.9%) | 7,170 (24.3%) |
| 8 or more Rooms | 20,655 (30.3%) | 2,165 (7.3%) |
| Total | 68,136 (100.0%) | 29,519 (100.0%) |
Housing Structure by Heating Type in Mahoning County
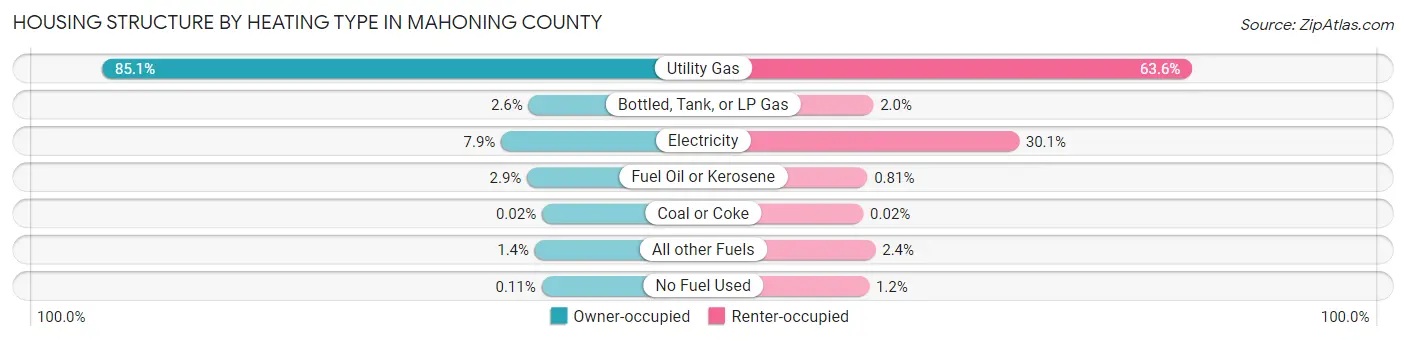
| Heating Type | Owner-occupied | Renter-occupied |
| Utility Gas | 57,956 (85.1%) | 18,770 (63.6%) |
| Bottled, Tank, or LP Gas | 1,780 (2.6%) | 581 (2.0%) |
| Electricity | 5,381 (7.9%) | 8,882 (30.1%) |
| Fuel Oil or Kerosene | 1,970 (2.9%) | 240 (0.8%) |
| Coal or Coke | 15 (0.0%) | 6 (0.0%) |
| All other Fuels | 957 (1.4%) | 700 (2.4%) |
| No Fuel Used | 77 (0.1%) | 340 (1.1%) |
| Total | 68,136 (100.0%) | 29,519 (100.0%) |
Household Vehicle Usage in Mahoning County
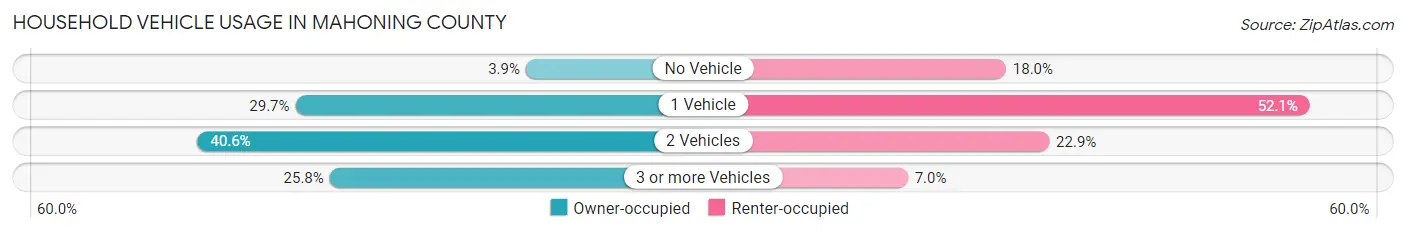
| Vehicles per Household | Owner-occupied | Renter-occupied |
| No Vehicle | 2,629 (3.9%) | 5,323 (18.0%) |
| 1 Vehicle | 20,218 (29.7%) | 15,368 (52.1%) |
| 2 Vehicles | 27,691 (40.6%) | 6,754 (22.9%) |
| 3 or more Vehicles | 17,598 (25.8%) | 2,074 (7.0%) |
| Total | 68,136 (100.0%) | 29,519 (100.0%) |
Real Estate & Mortgages in Mahoning County
Real Estate and Mortgage Overview in Mahoning County
| Characteristic | Without Mortgage | With Mortgage |
| Housing Units | 32,497 | 35,639 |
| Median Property Value | $112,800 | $146,100 |
| Median Household Income | $52,610 | $5,865 |
| Monthly Housing Costs | $468 | $1,499 |
| Real Estate Taxes | $1,611 | $803 |
Property Value by Mortgage Status in Mahoning County
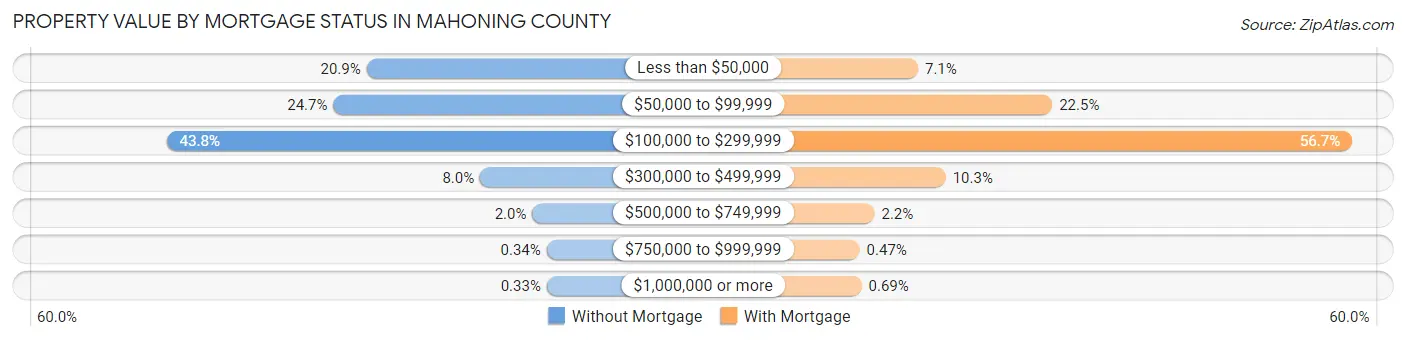
| Property Value | Without Mortgage | With Mortgage |
| Less than $50,000 | 6,799 (20.9%) | 2,544 (7.1%) |
| $50,000 to $99,999 | 8,034 (24.7%) | 8,012 (22.5%) |
| $100,000 to $299,999 | 14,222 (43.8%) | 20,223 (56.7%) |
| $300,000 to $499,999 | 2,582 (8.0%) | 3,674 (10.3%) |
| $500,000 to $749,999 | 643 (2.0%) | 773 (2.2%) |
| $750,000 to $999,999 | 110 (0.3%) | 168 (0.5%) |
| $1,000,000 or more | 107 (0.3%) | 245 (0.7%) |
| Total | 32,497 (100.0%) | 35,639 (100.0%) |
Household Income by Mortgage Status in Mahoning County
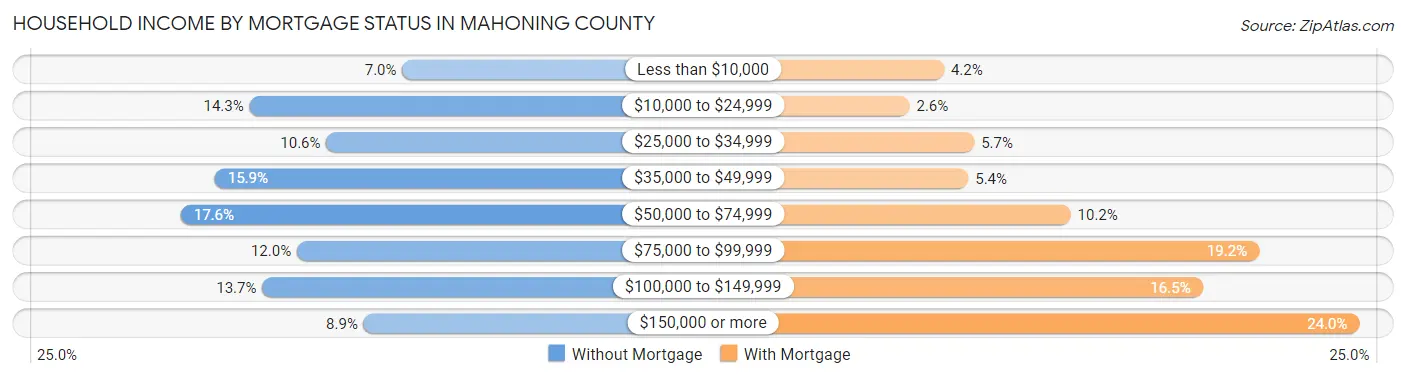
| Household Income | Without Mortgage | With Mortgage |
| Less than $10,000 | 2,279 (7.0%) | 1,499 (4.2%) |
| $10,000 to $24,999 | 4,644 (14.3%) | 917 (2.6%) |
| $25,000 to $34,999 | 3,455 (10.6%) | 2,015 (5.7%) |
| $35,000 to $49,999 | 5,181 (15.9%) | 1,913 (5.4%) |
| $50,000 to $74,999 | 5,705 (17.6%) | 3,648 (10.2%) |
| $75,000 to $99,999 | 3,909 (12.0%) | 6,845 (19.2%) |
| $100,000 to $149,999 | 4,447 (13.7%) | 5,887 (16.5%) |
| $150,000 or more | 2,877 (8.8%) | 8,549 (24.0%) |
| Total | 32,497 (100.0%) | 35,639 (100.0%) |
Property Value to Household Income Ratio in Mahoning County
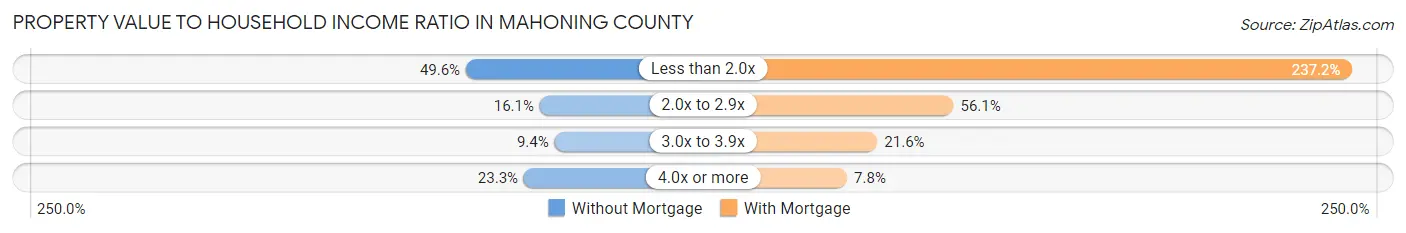
| Value-to-Income Ratio | Without Mortgage | With Mortgage |
| Less than 2.0x | 16,126 (49.6%) | 84,524 (237.2%) |
| 2.0x to 2.9x | 5,225 (16.1%) | 20,006 (56.1%) |
| 3.0x to 3.9x | 3,055 (9.4%) | 7,683 (21.6%) |
| 4.0x or more | 7,573 (23.3%) | 2,792 (7.8%) |
| Total | 32,497 (100.0%) | 35,639 (100.0%) |
Real Estate Taxes by Mortgage Status in Mahoning County
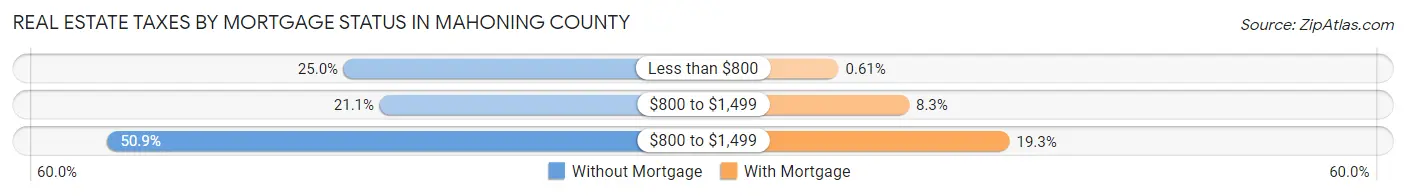
| Property Taxes | Without Mortgage | With Mortgage |
| Less than $800 | 8,128 (25.0%) | 216 (0.6%) |
| $800 to $1,499 | 6,847 (21.1%) | 2,969 (8.3%) |
| $800 to $1,499 | 16,543 (50.9%) | 6,891 (19.3%) |
| Total | 32,497 (100.0%) | 35,639 (100.0%) |
Health & Disability in Mahoning County
Health Insurance Coverage by Age in Mahoning County
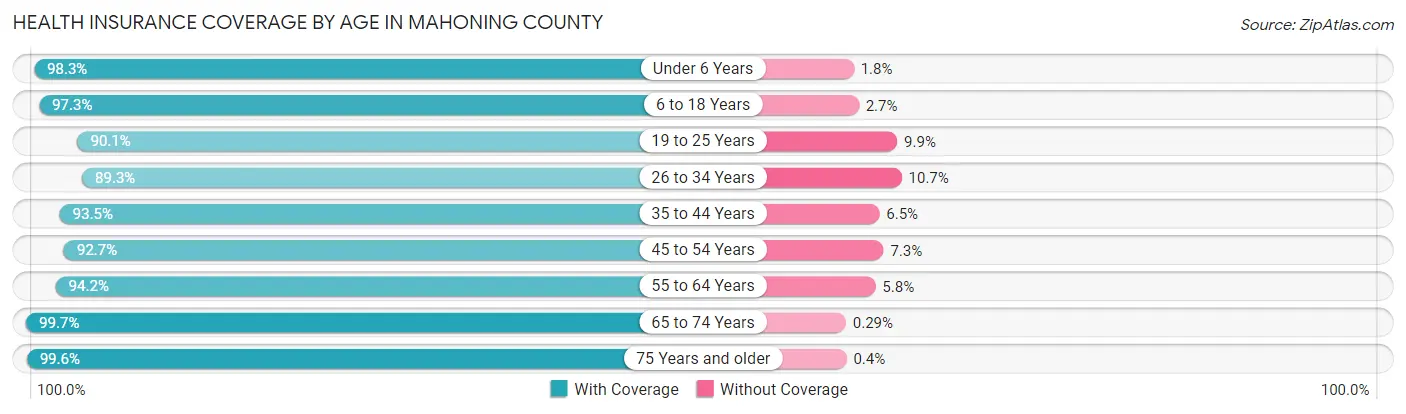
| Age Bracket | With Coverage | Without Coverage |
| Under 6 Years | 13,937 (98.3%) | 248 (1.8%) |
| 6 to 18 Years | 33,651 (97.3%) | 931 (2.7%) |
| 19 to 25 Years | 16,894 (90.1%) | 1,848 (9.9%) |
| 26 to 34 Years | 21,140 (89.3%) | 2,531 (10.7%) |
| 35 to 44 Years | 23,459 (93.5%) | 1,641 (6.5%) |
| 45 to 54 Years | 24,976 (92.7%) | 1,971 (7.3%) |
| 55 to 64 Years | 31,339 (94.2%) | 1,928 (5.8%) |
| 65 to 74 Years | 27,999 (99.7%) | 81 (0.3%) |
| 75 Years and older | 18,923 (99.6%) | 76 (0.4%) |
| Total | 212,318 (95.0%) | 11,255 (5.0%) |
Health Insurance Coverage by Citizenship Status in Mahoning County
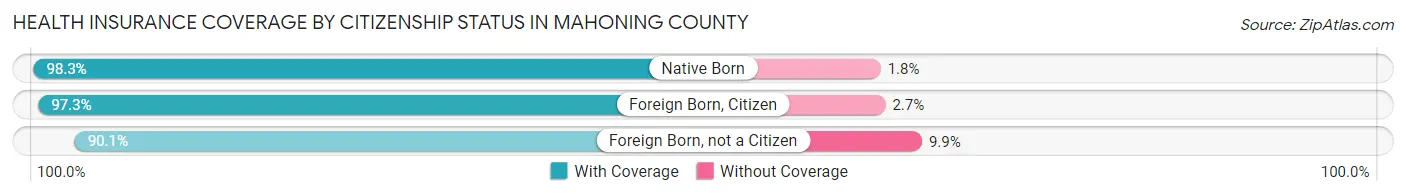
| Citizenship Status | With Coverage | Without Coverage |
| Native Born | 13,937 (98.3%) | 248 (1.8%) |
| Foreign Born, Citizen | 33,651 (97.3%) | 931 (2.7%) |
| Foreign Born, not a Citizen | 16,894 (90.1%) | 1,848 (9.9%) |
Health Insurance Coverage by Household Income in Mahoning County
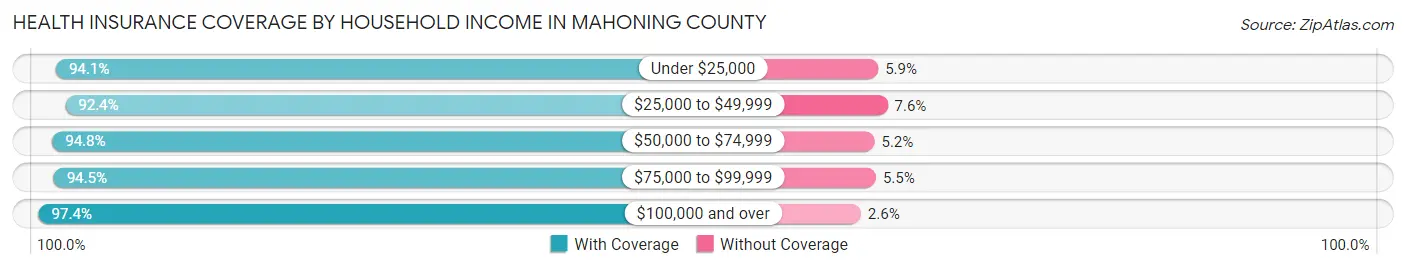
| Household Income | With Coverage | Without Coverage |
| Under $25,000 | 33,948 (94.1%) | 2,124 (5.9%) |
| $25,000 to $49,999 | 42,900 (92.4%) | 3,551 (7.6%) |
| $50,000 to $74,999 | 35,954 (94.8%) | 1,972 (5.2%) |
| $75,000 to $99,999 | 27,955 (94.5%) | 1,613 (5.5%) |
| $100,000 and over | 69,597 (97.4%) | 1,888 (2.6%) |
Public vs Private Health Insurance Coverage by Age in Mahoning County
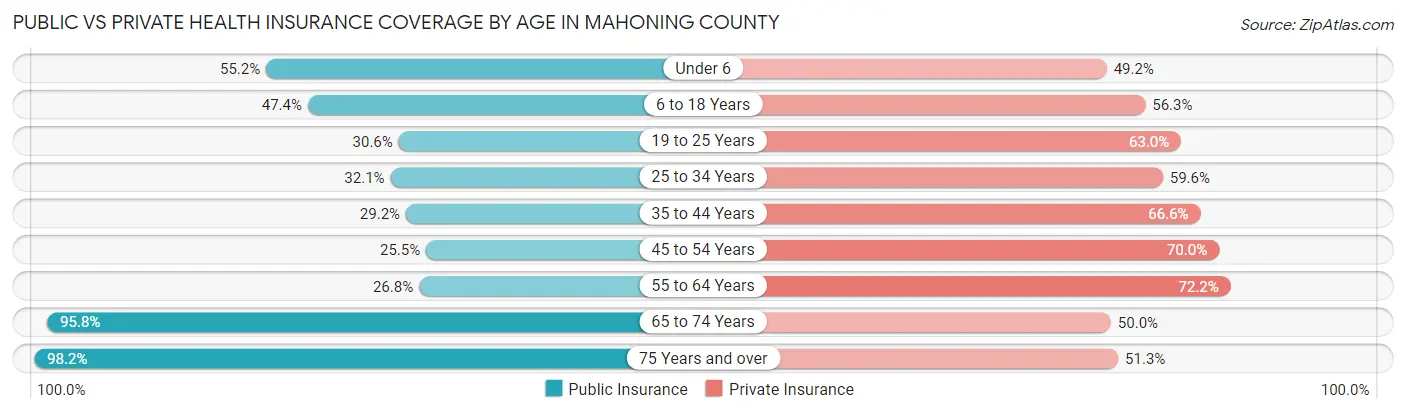
| Age Bracket | Public Insurance | Private Insurance |
| Under 6 | 7,827 (55.2%) | 6,975 (49.2%) |
| 6 to 18 Years | 16,406 (47.4%) | 19,479 (56.3%) |
| 19 to 25 Years | 5,732 (30.6%) | 11,801 (63.0%) |
| 25 to 34 Years | 7,598 (32.1%) | 14,103 (59.6%) |
| 35 to 44 Years | 7,335 (29.2%) | 16,706 (66.6%) |
| 45 to 54 Years | 6,865 (25.5%) | 18,868 (70.0%) |
| 55 to 64 Years | 8,916 (26.8%) | 24,006 (72.2%) |
| 65 to 74 Years | 26,912 (95.8%) | 14,025 (49.9%) |
| 75 Years and over | 18,662 (98.2%) | 9,746 (51.3%) |
| Total | 106,253 (47.5%) | 135,709 (60.7%) |
Disability Status by Sex by Age in Mahoning County
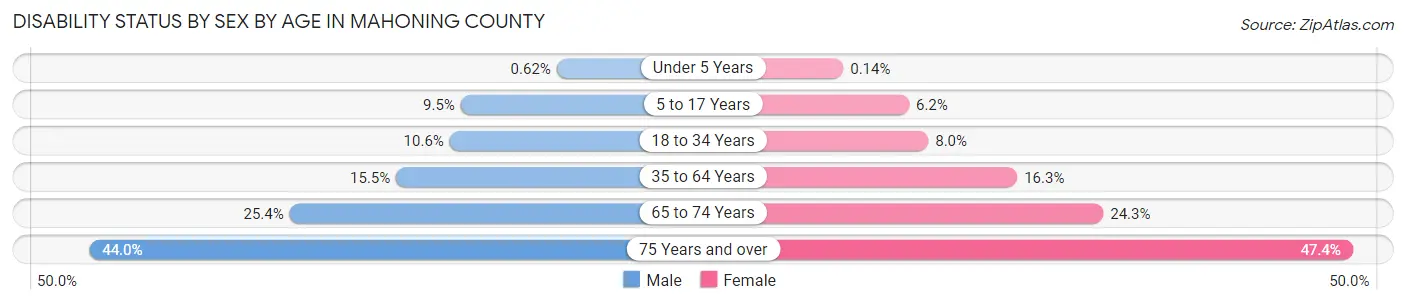
| Age Bracket | Male | Female |
| Under 5 Years | 38 (0.6%) | 8 (0.1%) |
| 5 to 17 Years | 1,677 (9.5%) | 1,024 (6.2%) |
| 18 to 34 Years | 2,416 (10.5%) | 1,789 (8.0%) |
| 35 to 64 Years | 6,492 (15.5%) | 7,078 (16.3%) |
| 65 to 74 Years | 3,385 (25.4%) | 3,582 (24.3%) |
| 75 Years and over | 3,277 (44.0%) | 5,475 (47.4%) |
Disability Class by Sex by Age in Mahoning County
Disability Class: Hearing Difficulty
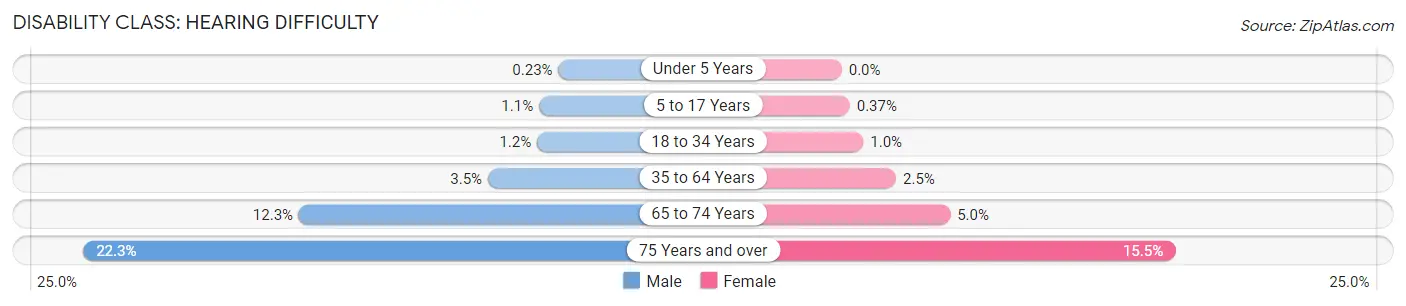
| Age Bracket | Male | Female |
| Under 5 Years | 14 (0.2%) | 0 (0.0%) |
| 5 to 17 Years | 199 (1.1%) | 60 (0.4%) |
| 18 to 34 Years | 279 (1.2%) | 223 (1.0%) |
| 35 to 64 Years | 1,465 (3.5%) | 1,095 (2.5%) |
| 65 to 74 Years | 1,635 (12.3%) | 743 (5.0%) |
| 75 Years and over | 1,660 (22.3%) | 1,785 (15.5%) |
Disability Class: Vision Difficulty
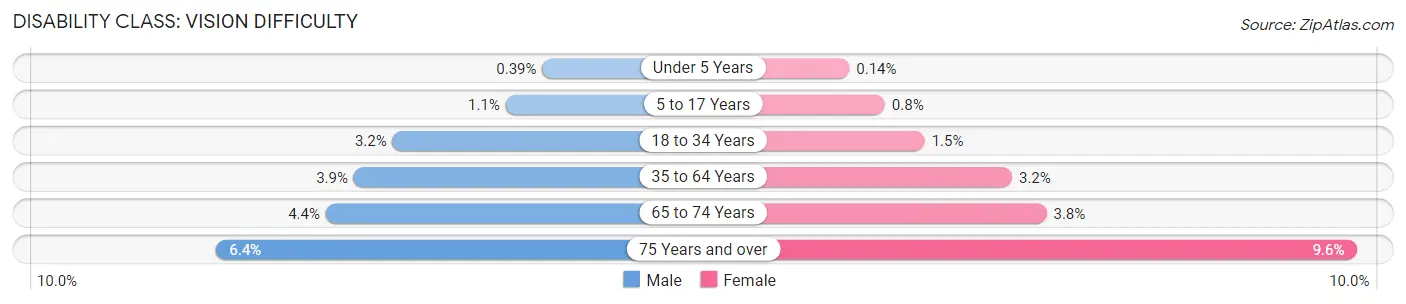
| Age Bracket | Male | Female |
| Under 5 Years | 24 (0.4%) | 8 (0.1%) |
| 5 to 17 Years | 188 (1.1%) | 132 (0.8%) |
| 18 to 34 Years | 725 (3.2%) | 343 (1.5%) |
| 35 to 64 Years | 1,628 (3.9%) | 1,375 (3.2%) |
| 65 to 74 Years | 588 (4.4%) | 561 (3.8%) |
| 75 Years and over | 480 (6.4%) | 1,103 (9.6%) |
Disability Class: Cognitive Difficulty
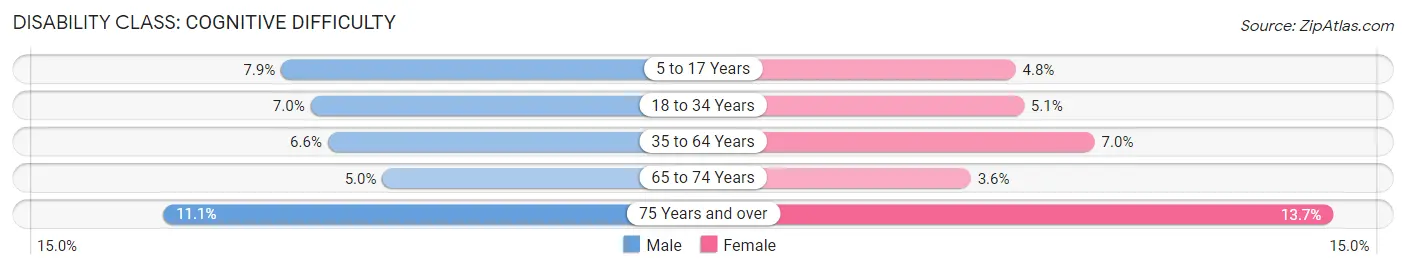
| Age Bracket | Male | Female |
| 5 to 17 Years | 1,384 (7.9%) | 794 (4.8%) |
| 18 to 34 Years | 1,611 (7.0%) | 1,129 (5.1%) |
| 35 to 64 Years | 2,745 (6.6%) | 3,059 (7.0%) |
| 65 to 74 Years | 672 (5.0%) | 530 (3.6%) |
| 75 Years and over | 830 (11.1%) | 1,580 (13.7%) |
Disability Class: Ambulatory Difficulty
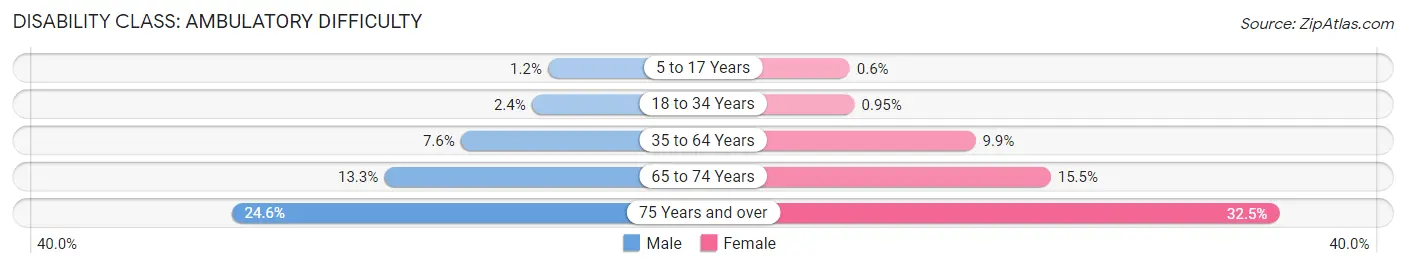
| Age Bracket | Male | Female |
| 5 to 17 Years | 205 (1.2%) | 99 (0.6%) |
| 18 to 34 Years | 540 (2.4%) | 212 (0.9%) |
| 35 to 64 Years | 3,194 (7.6%) | 4,316 (9.9%) |
| 65 to 74 Years | 1,773 (13.3%) | 2,291 (15.5%) |
| 75 Years and over | 1,835 (24.6%) | 3,750 (32.5%) |
Disability Class: Self-Care Difficulty
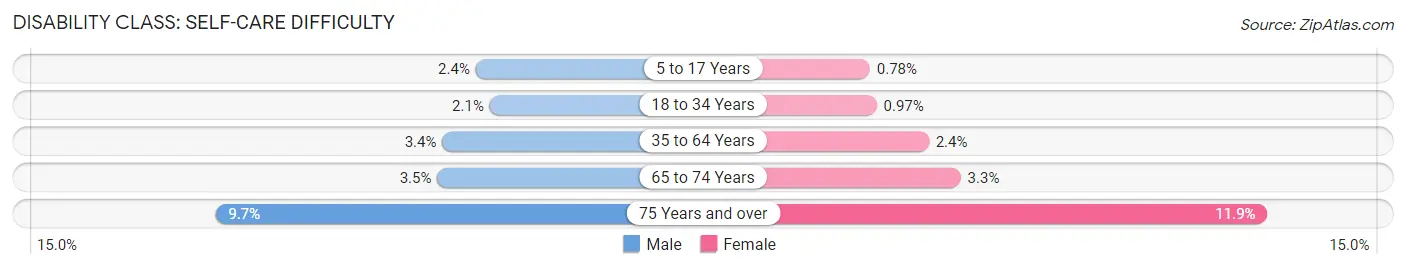
| Age Bracket | Male | Female |
| 5 to 17 Years | 429 (2.4%) | 128 (0.8%) |
| 18 to 34 Years | 470 (2.1%) | 217 (1.0%) |
| 35 to 64 Years | 1,412 (3.4%) | 1,054 (2.4%) |
| 65 to 74 Years | 468 (3.5%) | 488 (3.3%) |
| 75 Years and over | 722 (9.7%) | 1,368 (11.8%) |
Technology Access in Mahoning County
Computing Device Access in Mahoning County
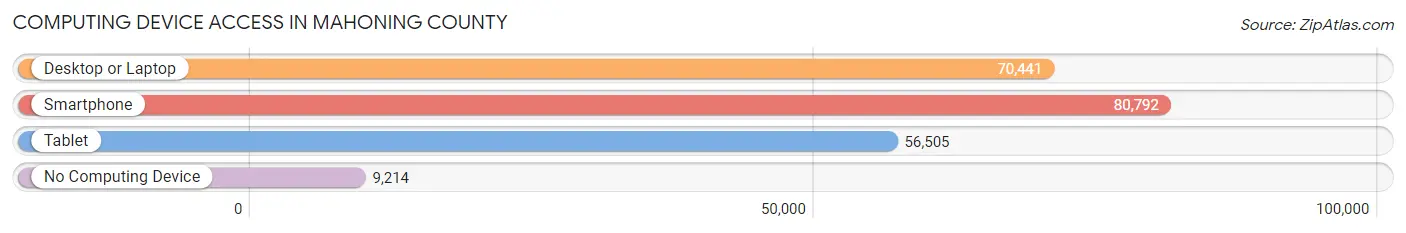
| Device Type | # Households | % Households |
| Desktop or Laptop | 70,441 | 72.1% |
| Smartphone | 80,792 | 82.7% |
| Tablet | 56,505 | 57.9% |
| No Computing Device | 9,214 | 9.4% |
| Total | 97,655 | 100.0% |
Internet Access in Mahoning County
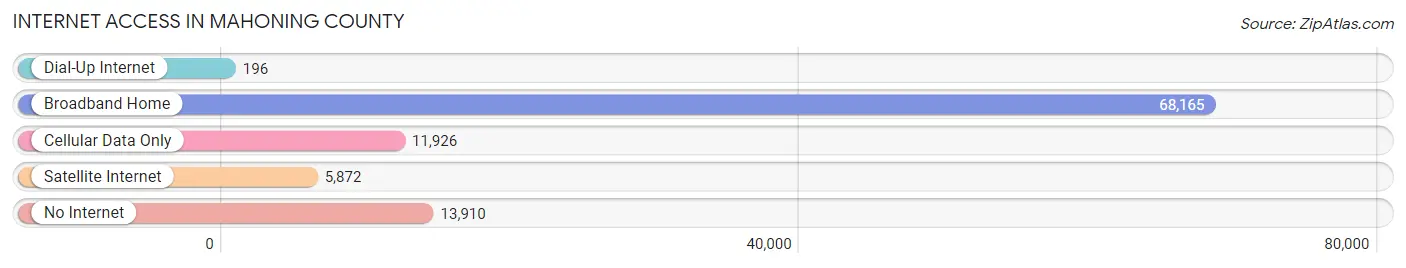
| Internet Type | # Households | % Households |
| Dial-Up Internet | 196 | 0.2% |
| Broadband Home | 68,165 | 69.8% |
| Cellular Data Only | 11,926 | 12.2% |
| Satellite Internet | 5,872 | 6.0% |
| No Internet | 13,910 | 14.2% |
| Total | 97,655 | 100.0% |
Mahoning County Summary
Mahoning County, Ohio is located in the northeastern part of the state and is part of the Youngstown-Warren-Boardman metropolitan area. The county was established in 1846 and is named after the Mahoning River, which runs through the county. The county seat is located in the city of Youngstown. As of the 2010 census, the population of Mahoning County was 238,823.
Geography
Mahoning County is located in the northeastern part of Ohio and is bordered by Trumbull County to the north, Columbiana County to the east, Stark County to the south, and Lawrence County to the west. The county covers an area of 446 square miles and is home to several rivers, including the Mahoning River, which runs through the county. The county is mostly flat with some rolling hills in the northern and western parts. The highest point in the county is located in the western part of the county and is 1,092 feet above sea level.
Climate
Mahoning County has a humid continental climate, with hot summers and cold winters. The average annual temperature is around 50 degrees Fahrenheit, with temperatures ranging from an average low of around 30 degrees in the winter to an average high of around 70 degrees in the summer. The county receives an average of around 40 inches of precipitation per year, with most of it falling in the spring and summer months.
Demographics
As of the 2010 census, the population of Mahoning County was 238,823. The population is made up of a diverse mix of ethnicities, with the largest group being White (83.3%), followed by African American (11.2%), Hispanic or Latino (3.2%), and Asian (1.2%). The median household income in the county is $41,945, and the median age is 40.
Economy
Mahoning County has a diverse economy, with a mix of manufacturing, retail, and service industries. The county is home to several large employers, including General Motors, Delphi Automotive, and the Youngstown-Warren Regional Airport. The county also has a strong agricultural sector, with corn, soybeans, and wheat being the main crops. The county is also home to several wineries and breweries, as well as a number of small businesses.
The county has a strong tourism industry, with several attractions, including the Youngstown Historical Center of Industry and Labor, the Butler Institute of American Art, and the Mill Creek MetroParks. The county also has a number of outdoor recreation opportunities, including several parks, golf courses, and hiking trails.
Conclusion
Mahoning County, Ohio is a diverse county located in the northeastern part of the state. The county is home to a diverse population and a strong economy, with a mix of manufacturing, retail, and service industries. The county also has a strong agricultural sector and a thriving tourism industry. Mahoning County is a great place to live, work, and play.
Common Questions
What is the Total Population of Mahoning County?
Total Population of Mahoning County is 227,979.
What is the Total Male Population of Mahoning County?
Total Male Population of Mahoning County is 112,026.
What is the Total Female Population of Mahoning County?
Total Female Population of Mahoning County is 115,953.
What is the Ratio of Males per 100 Females in Mahoning County?
There are 96.61 Males per 100 Females in Mahoning County.
What is the Ratio of Females per 100 Males in Mahoning County?
There are 103.51 Females per 100 Males in Mahoning County.
What is the Median Population Age in Mahoning County?
Median Population Age in Mahoning County is 43.3 Years.
What is the Average Family Size in Mahoning County
Average Family Size in Mahoning County is 2.9 People.
What is the Average Household Size in Mahoning County
Average Household Size in Mahoning County is 2.3 People.
What is Per Capita Income in Mahoning County?
Per Capita income in Mahoning County is $32,591.
What is the Median Family Income in Mahoning County?
Median Family Income in Mahoning County is $73,583.
What is the Median Household income in Mahoning County?
Median Household Income in Mahoning County is $54,279.
What is Income or Wage Gap in Mahoning County?
Income or Wage Gap in Mahoning County is 33.0%.
Women in Mahoning County earn 67.0 cents for every dollar earned by a man.
What is Family Income Deficit in Mahoning County?
Family Income Deficit in Mahoning County is $10,579.
Families that are below poverty line in Mahoning County earn $10,579 less on average than the poverty threshold level.
What is Inequality or Gini Index in Mahoning County?
Inequality or Gini Index in Mahoning County is 0.47.
How Large is the Labor Force in Mahoning County?
There are 112,076 People in the Labor Forcein in Mahoning County.
What is the Percentage of People in the Labor Force in Mahoning County?
59.7% of People are in the Labor Force in Mahoning County.
What is the Unemployment Rate in Mahoning County?
Unemployment Rate in Mahoning County is 7.2%.