Lucas County, OH
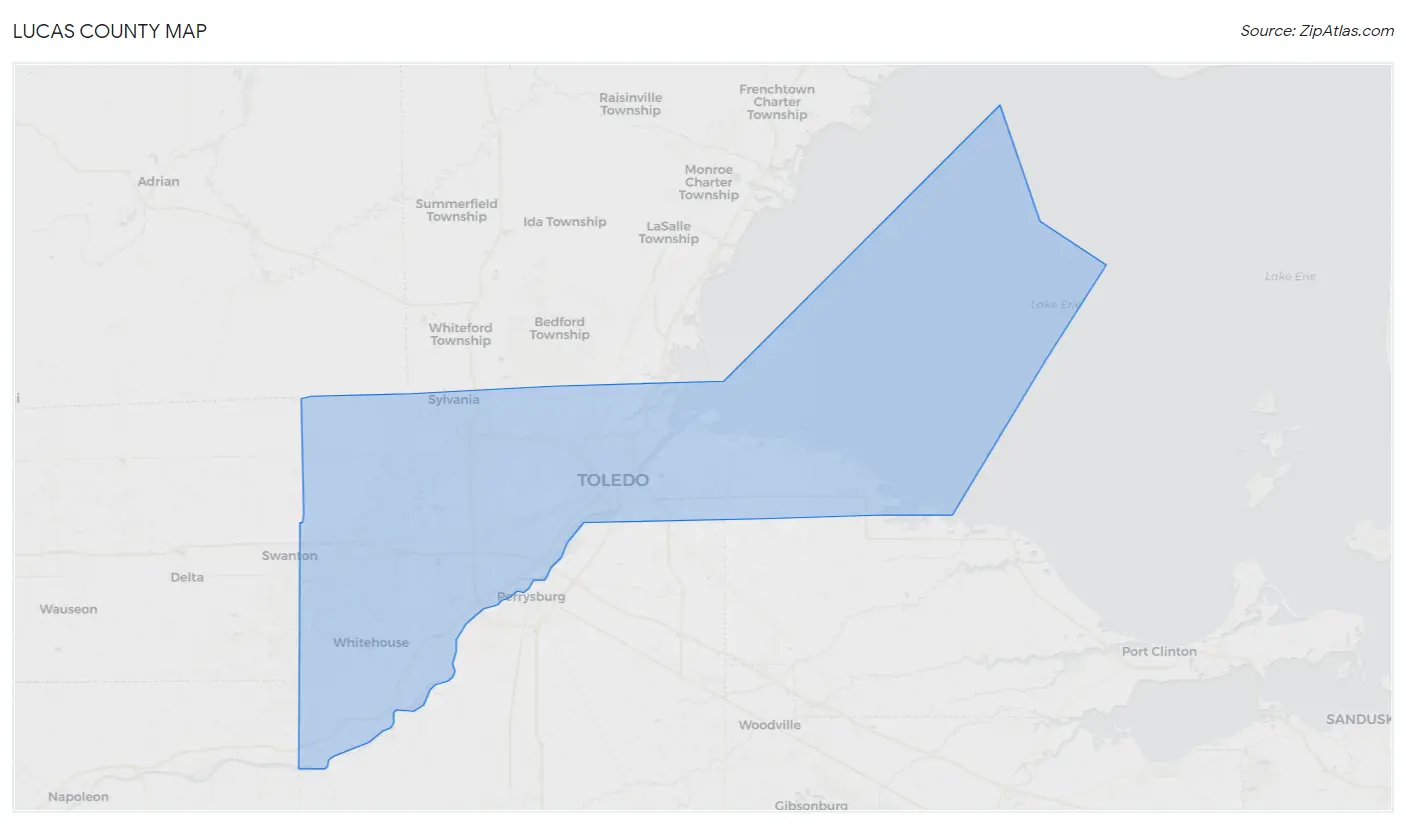
Lucas County Map
Lucas County Overview
430,014
TOTAL POPULATION
209,528
MALE POPULATION
220,486
FEMALE POPULATION
95.03
MALES / 100 FEMALES
105.23
FEMALES / 100 MALES
38.1
MEDIAN AGE
3.0
AVG FAMILY SIZE
2.3
AVG HOUSEHOLD SIZE
$34,399
PER CAPITA INCOME
$76,089
AVG FAMILY INCOME
$57,265
AVG HOUSEHOLD INCOME
24.1%
WAGE / INCOME GAP [ % ]
75.9¢/ $1
WAGE / INCOME GAP [ $ ]
$12,229
FAMILY INCOME DEFICIT
0.49
INEQUALITY / GINI INDEX
216,123
LABOR FORCE [ PEOPLE ]
63.0%
PERCENT IN LABOR FORCE
6.8%
UNEMPLOYMENT RATE
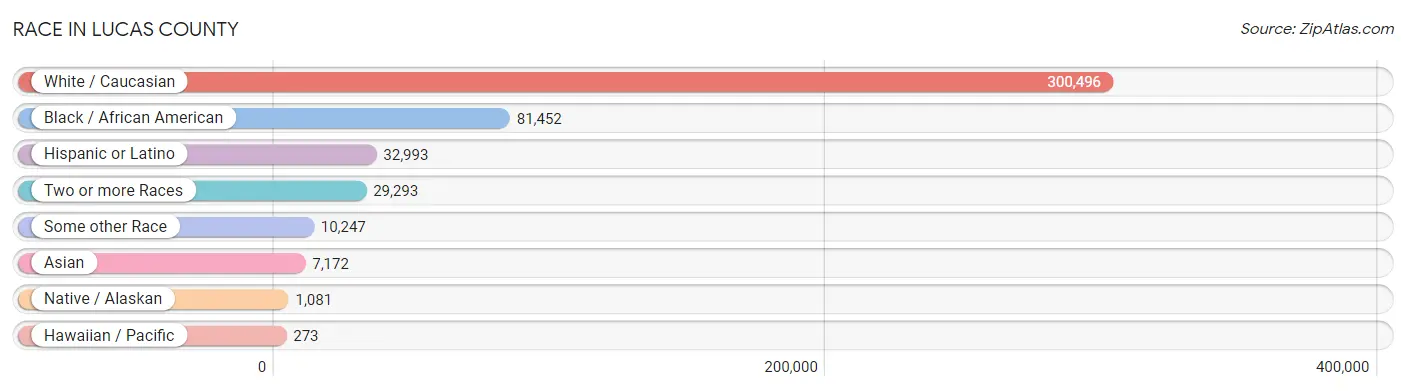
Race in Lucas County
The most populous races in Lucas County are White / Caucasian (300,496 | 69.9%), Black / African American (81,452 | 18.9%), and Hispanic or Latino (32,993 | 7.7%).
| Race | # Population | % Population |
| Asian | 7,172 | 1.7% |
| Black / African American | 81,452 | 18.9% |
| Hawaiian / Pacific | 273 | 0.1% |
| Hispanic or Latino | 32,993 | 7.7% |
| Native / Alaskan | 1,081 | 0.3% |
| White / Caucasian | 300,496 | 69.9% |
| Two or more Races | 29,293 | 6.8% |
| Some other Race | 10,247 | 2.4% |
| Total | 430,014 | 100.0% |
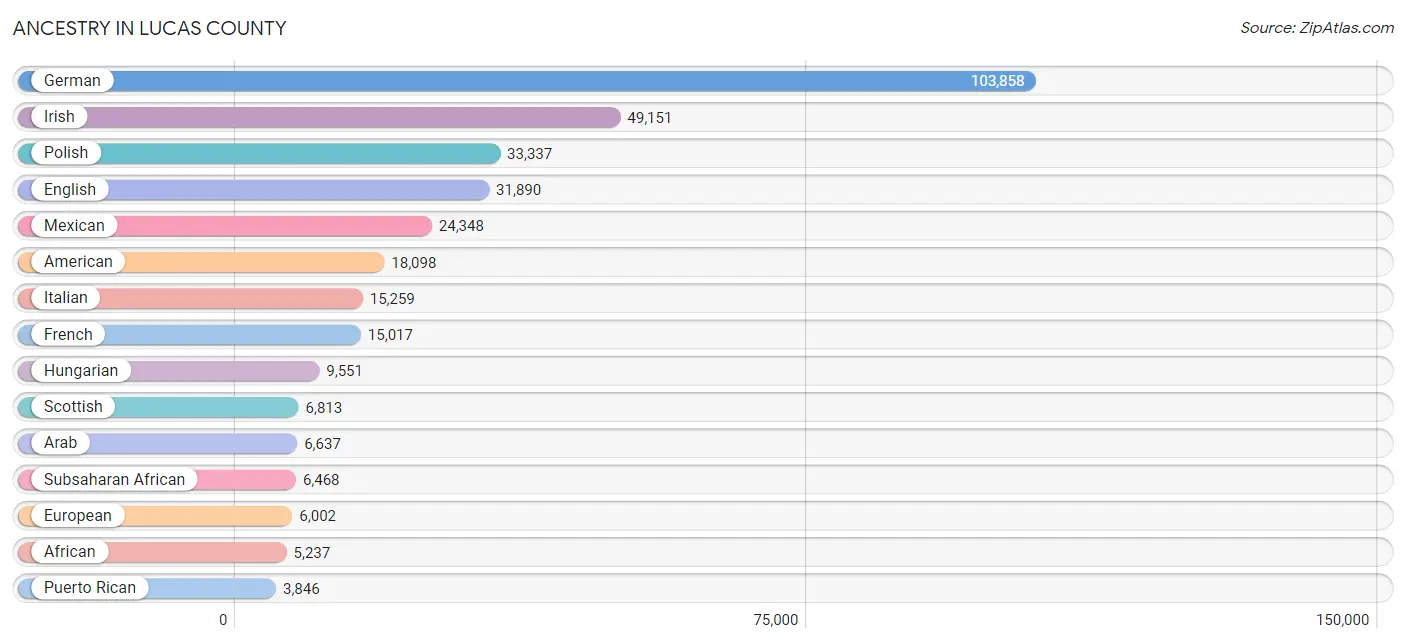
Ancestry in Lucas County
The most populous ancestries reported in Lucas County are German (103,858 | 24.1%), Irish (49,151 | 11.4%), Polish (33,337 | 7.7%), English (31,890 | 7.4%), and Mexican (24,348 | 5.7%), together accounting for 56.4% of all Lucas County residents.
| Ancestry | # Population | % Population |
| Afghan | 116 | 0.0% |
| African | 5,237 | 1.2% |
| Alaska Native | 20 | 0.0% |
| Albanian | 22 | 0.0% |
| Alsatian | 46 | 0.0% |
| American | 18,098 | 4.2% |
| Apache | 83 | 0.0% |
| Arab | 6,637 | 1.5% |
| Argentinean | 53 | 0.0% |
| Armenian | 231 | 0.1% |
| Assyrian / Chaldean / Syriac | 33 | 0.0% |
| Australian | 56 | 0.0% |
| Austrian | 396 | 0.1% |
| Bahamian | 19 | 0.0% |
| Basque | 16 | 0.0% |
| Belgian | 579 | 0.1% |
| Belizean | 98 | 0.0% |
| Bhutanese | 591 | 0.1% |
| Blackfeet | 639 | 0.2% |
| Bolivian | 28 | 0.0% |
| Brazilian | 172 | 0.0% |
| British | 1,591 | 0.4% |
| British West Indian | 18 | 0.0% |
| Bulgarian | 318 | 0.1% |
| Burmese | 852 | 0.2% |
| Cajun | 12 | 0.0% |
| Cambodian | 6 | 0.0% |
| Canadian | 965 | 0.2% |
| Celtic | 251 | 0.1% |
| Central American | 562 | 0.1% |
| Central American Indian | 359 | 0.1% |
| Cherokee | 1,156 | 0.3% |
| Cheyenne | 7 | 0.0% |
| Chickasaw | 15 | 0.0% |
| Chilean | 19 | 0.0% |
| Chippewa | 128 | 0.0% |
| Choctaw | 20 | 0.0% |
| Colombian | 490 | 0.1% |
| Comanche | 71 | 0.0% |
| Costa Rican | 48 | 0.0% |
| Creek | 9 | 0.0% |
| Croatian | 334 | 0.1% |
| Cuban | 693 | 0.2% |
| Cypriot | 84 | 0.0% |
| Czech | 1,542 | 0.4% |
| Czechoslovakian | 469 | 0.1% |
| Danish | 622 | 0.1% |
| Delaware | 65 | 0.0% |
| Dominican | 207 | 0.1% |
| Dutch | 3,820 | 0.9% |
| Eastern European | 1,213 | 0.3% |
| Ecuadorian | 175 | 0.0% |
| Egyptian | 729 | 0.2% |
| English | 31,890 | 7.4% |
| Estonian | 17 | 0.0% |
| Ethiopian | 76 | 0.0% |
| European | 6,002 | 1.4% |
| Filipino | 113 | 0.0% |
| Finnish | 769 | 0.2% |
| French | 15,017 | 3.5% |
| French American Indian | 90 | 0.0% |
| French Canadian | 2,932 | 0.7% |
| German | 103,858 | 24.1% |
| German Russian | 41 | 0.0% |
| Ghanaian | 194 | 0.1% |
| Greek | 1,819 | 0.4% |
| Guamanian / Chamorro | 130 | 0.0% |
| Guatemalan | 233 | 0.1% |
| Guyanese | 435 | 0.1% |
| Haitian | 115 | 0.0% |
| Honduran | 44 | 0.0% |
| Hungarian | 9,551 | 2.2% |
| Icelander | 12 | 0.0% |
| Indian (Asian) | 2,427 | 0.6% |
| Inupiat | 2 | 0.0% |
| Iranian | 168 | 0.0% |
| Iraqi | 96 | 0.0% |
| Irish | 49,151 | 11.4% |
| Iroquois | 99 | 0.0% |
| Israeli | 84 | 0.0% |
| Italian | 15,259 | 3.5% |
| Jamaican | 835 | 0.2% |
| Japanese | 31 | 0.0% |
| Jordanian | 371 | 0.1% |
| Kenyan | 137 | 0.0% |
| Korean | 1,707 | 0.4% |
| Laotian | 25 | 0.0% |
| Latvian | 25 | 0.0% |
| Lebanese | 2,802 | 0.6% |
| Liberian | 195 | 0.1% |
| Lithuanian | 361 | 0.1% |
| Luxembourger | 16 | 0.0% |
| Macedonian | 49 | 0.0% |
| Malaysian | 117 | 0.0% |
| Maltese | 31 | 0.0% |
| Menominee | 12 | 0.0% |
| Mexican | 24,348 | 5.7% |
| Mexican American Indian | 249 | 0.1% |
| Mongolian | 26 | 0.0% |
| Moroccan | 52 | 0.0% |
| Native Hawaiian | 92 | 0.0% |
| Navajo | 59 | 0.0% |
| Nicaraguan | 28 | 0.0% |
| Nigerian | 319 | 0.1% |
| Northern European | 247 | 0.1% |
| Norwegian | 1,743 | 0.4% |
| Osage | 1 | 0.0% |
| Ottawa | 18 | 0.0% |
| Pakistani | 309 | 0.1% |
| Palestinian | 170 | 0.0% |
| Panamanian | 70 | 0.0% |
| Paraguayan | 163 | 0.0% |
| Pennsylvania German | 251 | 0.1% |
| Peruvian | 275 | 0.1% |
| Polish | 33,337 | 7.7% |
| Portuguese | 263 | 0.1% |
| Potawatomi | 15 | 0.0% |
| Pueblo | 15 | 0.0% |
| Puerto Rican | 3,846 | 0.9% |
| Romanian | 476 | 0.1% |
| Russian | 1,654 | 0.4% |
| Salvadoran | 139 | 0.0% |
| Samoan | 41 | 0.0% |
| Scandinavian | 604 | 0.1% |
| Scotch-Irish | 2,436 | 0.6% |
| Scottish | 6,813 | 1.6% |
| Seminole | 11 | 0.0% |
| Senegalese | 8 | 0.0% |
| Serbian | 155 | 0.0% |
| Shoshone | 19 | 0.0% |
| Sierra Leonean | 47 | 0.0% |
| Sioux | 89 | 0.0% |
| Slavic | 86 | 0.0% |
| Slovak | 1,802 | 0.4% |
| Slovene | 175 | 0.0% |
| Somali | 30 | 0.0% |
| South African | 43 | 0.0% |
| South American | 1,443 | 0.3% |
| Soviet Union | 28 | 0.0% |
| Spaniard | 474 | 0.1% |
| Spanish | 328 | 0.1% |
| Sri Lankan | 744 | 0.2% |
| Subsaharan African | 6,468 | 1.5% |
| Sudanese | 18 | 0.0% |
| Swedish | 2,445 | 0.6% |
| Swiss | 1,414 | 0.3% |
| Syrian | 1,013 | 0.2% |
| Taiwanese | 55 | 0.0% |
| Thai | 2,022 | 0.5% |
| Trinidadian and Tobagonian | 109 | 0.0% |
| Turkish | 224 | 0.1% |
| Ukrainian | 822 | 0.2% |
| Venezuelan | 240 | 0.1% |
| Vietnamese | 33 | 0.0% |
| Welsh | 2,527 | 0.6% |
| West Indian | 201 | 0.1% |
| Yaqui | 27 | 0.0% |
| Yugoslavian | 125 | 0.0% |
| Zimbabwean | 47 | 0.0% | View All 159 Rows |
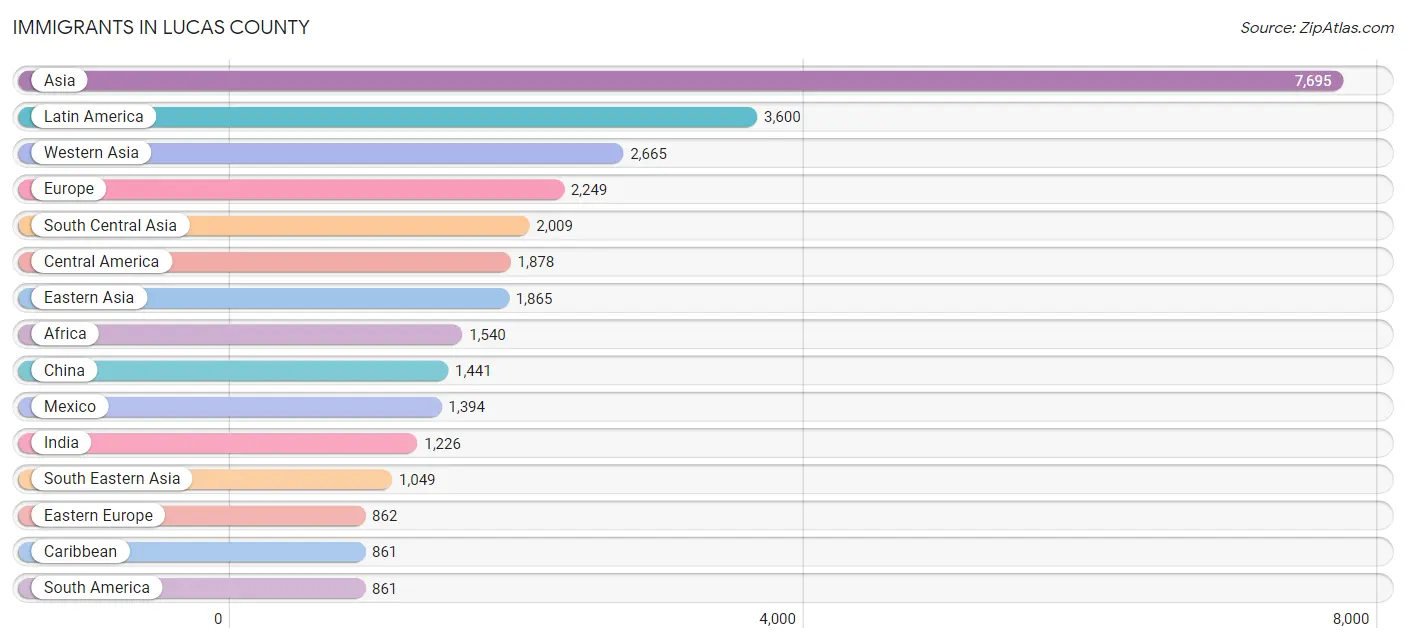
Immigrants in Lucas County
The most numerous immigrant groups reported in Lucas County came from Asia (7,695 | 1.8%), Latin America (3,600 | 0.8%), Western Asia (2,665 | 0.6%), Europe (2,249 | 0.5%), and South Central Asia (2,009 | 0.5%), together accounting for 4.2% of all Lucas County residents.
| Immigration Origin | # Population | % Population |
| Afghanistan | 102 | 0.0% |
| Africa | 1,540 | 0.4% |
| Argentina | 11 | 0.0% |
| Asia | 7,695 | 1.8% |
| Australia | 39 | 0.0% |
| Bahamas | 45 | 0.0% |
| Bangladesh | 26 | 0.0% |
| Belarus | 21 | 0.0% |
| Bosnia and Herzegovina | 41 | 0.0% |
| Brazil | 153 | 0.0% |
| Bulgaria | 25 | 0.0% |
| Cambodia | 20 | 0.0% |
| Cameroon | 154 | 0.0% |
| Canada | 705 | 0.2% |
| Caribbean | 861 | 0.2% |
| Central America | 1,878 | 0.4% |
| Chile | 19 | 0.0% |
| China | 1,441 | 0.3% |
| Colombia | 232 | 0.1% |
| Congo | 26 | 0.0% |
| Costa Rica | 48 | 0.0% |
| Cuba | 148 | 0.0% |
| Czechoslovakia | 10 | 0.0% |
| Denmark | 20 | 0.0% |
| Dominican Republic | 183 | 0.0% |
| Eastern Africa | 267 | 0.1% |
| Eastern Asia | 1,865 | 0.4% |
| Eastern Europe | 862 | 0.2% |
| Ecuador | 89 | 0.0% |
| Egypt | 249 | 0.1% |
| El Salvador | 84 | 0.0% |
| England | 198 | 0.1% |
| Ethiopia | 20 | 0.0% |
| Europe | 2,249 | 0.5% |
| Fiji | 38 | 0.0% |
| France | 29 | 0.0% |
| Germany | 585 | 0.1% |
| Ghana | 176 | 0.0% |
| Greece | 73 | 0.0% |
| Guatemala | 299 | 0.1% |
| Guyana | 152 | 0.0% |
| Haiti | 62 | 0.0% |
| Honduras | 31 | 0.0% |
| Hong Kong | 115 | 0.0% |
| Hungary | 60 | 0.0% |
| India | 1,226 | 0.3% |
| Indonesia | 26 | 0.0% |
| Iran | 78 | 0.0% |
| Iraq | 129 | 0.0% |
| Ireland | 73 | 0.0% |
| Israel | 44 | 0.0% |
| Italy | 153 | 0.0% |
| Jamaica | 232 | 0.1% |
| Japan | 74 | 0.0% |
| Jordan | 298 | 0.1% |
| Kazakhstan | 10 | 0.0% |
| Kenya | 115 | 0.0% |
| Korea | 350 | 0.1% |
| Kuwait | 125 | 0.0% |
| Laos | 12 | 0.0% |
| Latin America | 3,600 | 0.8% |
| Lebanon | 839 | 0.2% |
| Liberia | 128 | 0.0% |
| Malaysia | 56 | 0.0% |
| Mexico | 1,394 | 0.3% |
| Middle Africa | 180 | 0.0% |
| Morocco | 52 | 0.0% |
| Nepal | 91 | 0.0% |
| Netherlands | 25 | 0.0% |
| Nicaragua | 19 | 0.0% |
| Nigeria | 147 | 0.0% |
| Northern Africa | 508 | 0.1% |
| Northern Europe | 492 | 0.1% |
| Norway | 5 | 0.0% |
| Oceania | 104 | 0.0% |
| Pakistan | 296 | 0.1% |
| Panama | 3 | 0.0% |
| Peru | 117 | 0.0% |
| Philippines | 442 | 0.1% |
| Poland | 106 | 0.0% |
| Romania | 187 | 0.0% |
| Russia | 97 | 0.0% |
| Saudi Arabia | 399 | 0.1% |
| Scotland | 22 | 0.0% |
| Serbia | 40 | 0.0% |
| Sierra Leone | 47 | 0.0% |
| Somalia | 30 | 0.0% |
| South Africa | 43 | 0.0% |
| South America | 861 | 0.2% |
| South Central Asia | 2,009 | 0.5% |
| South Eastern Asia | 1,049 | 0.2% |
| Southern Europe | 256 | 0.1% |
| Spain | 30 | 0.0% |
| Sri Lanka | 134 | 0.0% |
| Sudan | 161 | 0.0% |
| Sweden | 100 | 0.0% |
| Syria | 615 | 0.1% |
| Taiwan | 196 | 0.1% |
| Thailand | 139 | 0.0% |
| Trinidad and Tobago | 72 | 0.0% |
| Turkey | 93 | 0.0% |
| Ukraine | 230 | 0.1% |
| Uzbekistan | 12 | 0.0% |
| Venezuela | 74 | 0.0% |
| Vietnam | 354 | 0.1% |
| Western Africa | 506 | 0.1% |
| Western Asia | 2,665 | 0.6% |
| Western Europe | 639 | 0.2% |
| Zimbabwe | 53 | 0.0% | View All 109 Rows |
Sex and Age in Lucas County
Sex and Age in Lucas County
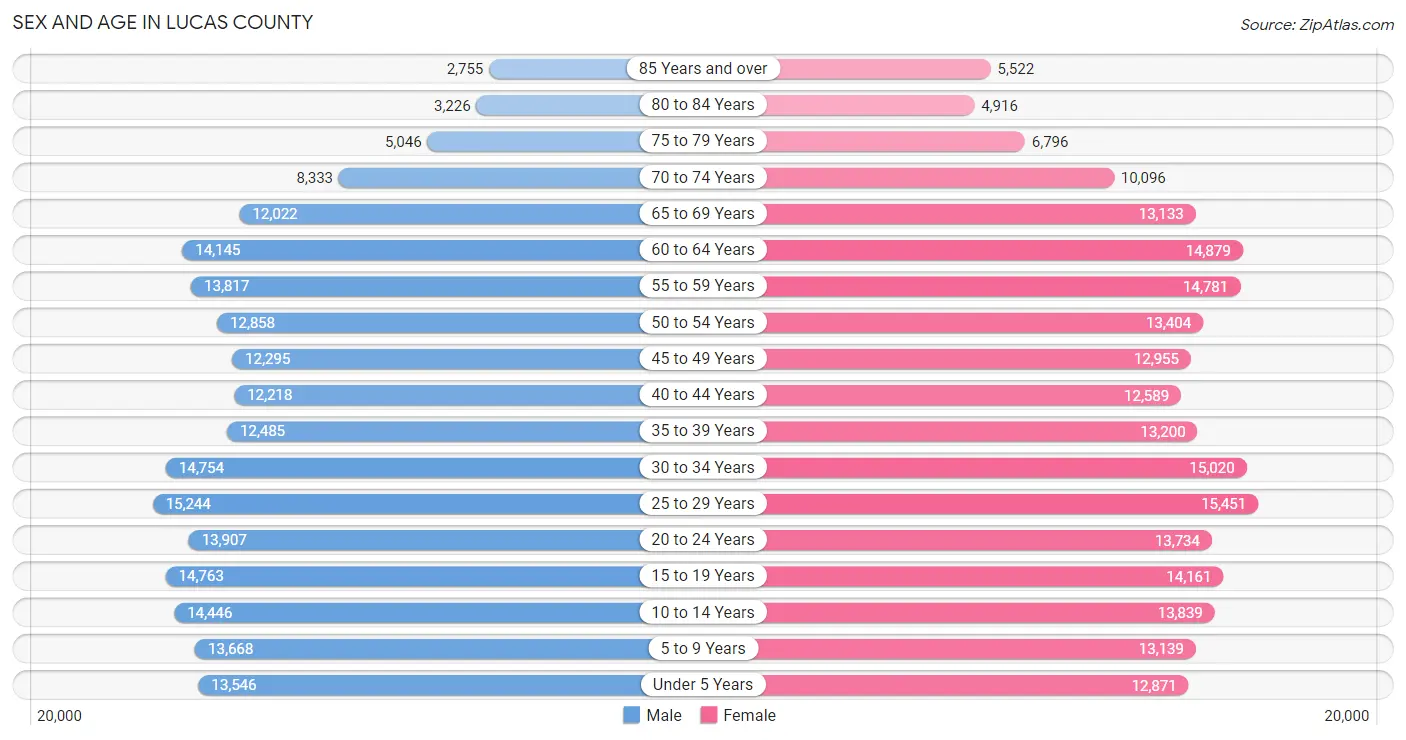
The most populous age groups in Lucas County are 25 to 29 Years (15,244 | 7.3%) for men and 25 to 29 Years (15,451 | 7.0%) for women.
| Age Bracket | Male | Female |
| Under 5 Years | 13,546 (6.5%) | 12,871 (5.8%) |
| 5 to 9 Years | 13,668 (6.5%) | 13,139 (6.0%) |
| 10 to 14 Years | 14,446 (6.9%) | 13,839 (6.3%) |
| 15 to 19 Years | 14,763 (7.0%) | 14,161 (6.4%) |
| 20 to 24 Years | 13,907 (6.6%) | 13,734 (6.2%) |
| 25 to 29 Years | 15,244 (7.3%) | 15,451 (7.0%) |
| 30 to 34 Years | 14,754 (7.0%) | 15,020 (6.8%) |
| 35 to 39 Years | 12,485 (6.0%) | 13,200 (6.0%) |
| 40 to 44 Years | 12,218 (5.8%) | 12,589 (5.7%) |
| 45 to 49 Years | 12,295 (5.9%) | 12,955 (5.9%) |
| 50 to 54 Years | 12,858 (6.1%) | 13,404 (6.1%) |
| 55 to 59 Years | 13,817 (6.6%) | 14,781 (6.7%) |
| 60 to 64 Years | 14,145 (6.8%) | 14,879 (6.8%) |
| 65 to 69 Years | 12,022 (5.7%) | 13,133 (6.0%) |
| 70 to 74 Years | 8,333 (4.0%) | 10,096 (4.6%) |
| 75 to 79 Years | 5,046 (2.4%) | 6,796 (3.1%) |
| 80 to 84 Years | 3,226 (1.5%) | 4,916 (2.2%) |
| 85 Years and over | 2,755 (1.3%) | 5,522 (2.5%) |
| Total | 209,528 (100.0%) | 220,486 (100.0%) |
Families and Households in Lucas County
Median Family Size in Lucas County
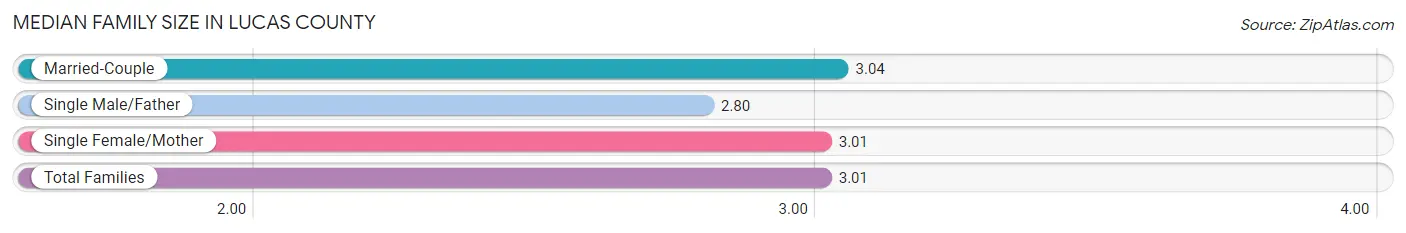
The median family size in Lucas County is 3.01 persons per family, with married-couple families (68,881 | 65.6%) accounting for the largest median family size of 3.04 persons per family. On the other hand, single male/father families (8,843 | 8.4%) represent the smallest median family size with 2.80 persons per family.
| Family Type | # Families | Family Size |
| Married-Couple | 68,881 (65.6%) | 3.04 |
| Single Male/Father | 8,843 (8.4%) | 2.80 |
| Single Female/Mother | 27,212 (25.9%) | 3.01 |
| Total Families | 104,936 (100.0%) | 3.01 |
Median Household Size in Lucas County
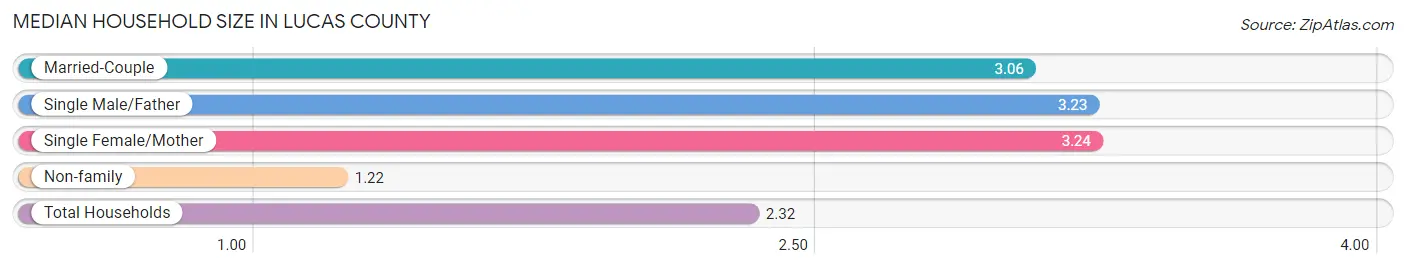
The median household size in Lucas County is 2.32 persons per household, with single female/mother households (27,212 | 15.0%) accounting for the largest median household size of 3.24 persons per household. non-family households (76,447 | 42.1%) represent the smallest median household size with 1.22 persons per household.
| Household Type | # Households | Household Size |
| Married-Couple | 68,881 (38.0%) | 3.06 |
| Single Male/Father | 8,843 (4.9%) | 3.23 |
| Single Female/Mother | 27,212 (15.0%) | 3.24 |
| Non-family | 76,447 (42.1%) | 1.22 |
| Total Households | 181,383 (100.0%) | 2.32 |
Household Size by Marriage Status in Lucas County
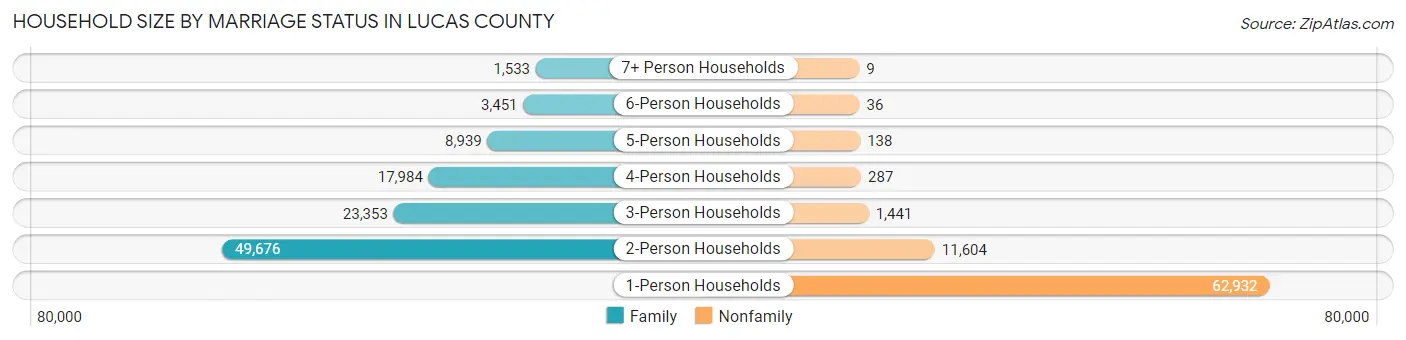
Out of a total of 181,383 households in Lucas County, 104,936 (57.9%) are family households, while 76,447 (42.1%) are nonfamily households. The most numerous type of family households are 2-person households, comprising 49,676, and the most common type of nonfamily households are 1-person households, comprising 62,932.
| Household Size | Family Households | Nonfamily Households |
| 1-Person Households | - | 62,932 (34.7%) |
| 2-Person Households | 49,676 (27.4%) | 11,604 (6.4%) |
| 3-Person Households | 23,353 (12.9%) | 1,441 (0.8%) |
| 4-Person Households | 17,984 (9.9%) | 287 (0.2%) |
| 5-Person Households | 8,939 (4.9%) | 138 (0.1%) |
| 6-Person Households | 3,451 (1.9%) | 36 (0.0%) |
| 7+ Person Households | 1,533 (0.9%) | 9 (0.0%) |
| Total | 104,936 (57.9%) | 76,447 (42.1%) |
Female Fertility in Lucas County
Fertility by Age in Lucas County
Average fertility rate in Lucas County is 56.0 births per 1,000 women. Women in the age bracket of 20 to 34 years have the highest fertility rate with 94.0 births per 1,000 women. Women in the age bracket of 20 to 34 years acount for 74.3% of all women with births.
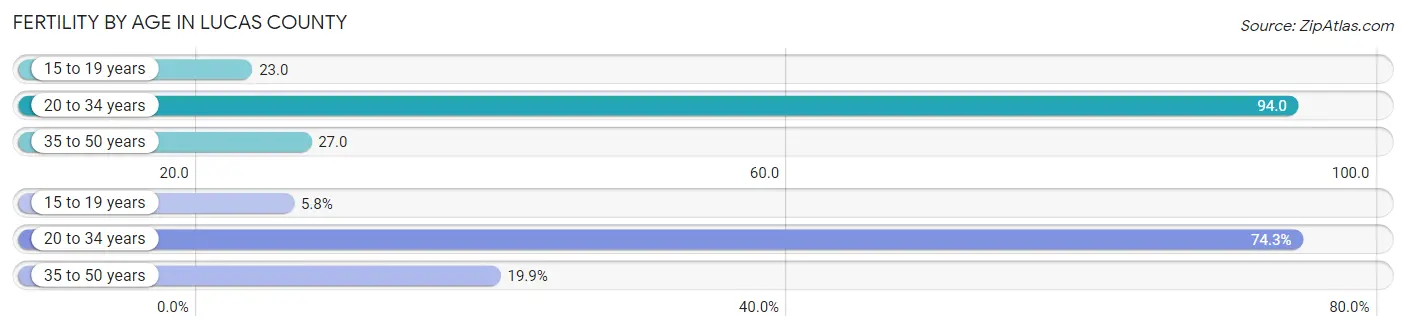
| Age Bracket | Women with Births | Births / 1,000 Women |
| 15 to 19 years | 325 (5.8%) | 23.0 |
| 20 to 34 years | 4,144 (74.3%) | 94.0 |
| 35 to 50 years | 1,107 (19.9%) | 27.0 |
| Total | 5,576 (100.0%) | 56.0 |
Fertility by Age by Marriage Status in Lucas County
51.2% of women with births (5,576) in Lucas County are married. The highest percentage of unmarried women with births falls into 15 to 19 years age bracket with 100.0% of them unmarried at the time of birth, while the lowest percentage of unmarried women with births belong to 35 to 50 years age bracket with 25.8% of them unmarried.
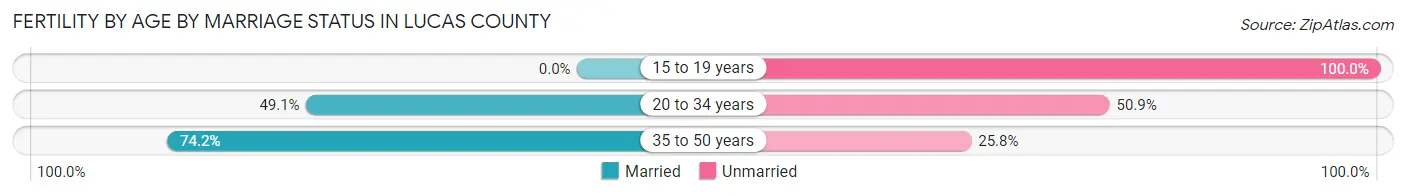
| Age Bracket | Married | Unmarried |
| 15 to 19 years | 0 (0.0%) | 325 (100.0%) |
| 20 to 34 years | 2,035 (49.1%) | 2,109 (50.9%) |
| 35 to 50 years | 821 (74.2%) | 286 (25.8%) |
| Total | 2,855 (51.2%) | 2,721 (48.8%) |
Fertility by Education in Lucas County
Average fertility rate in Lucas County is 56.0 births per 1,000 women. Women with the education attainment of graduate degree have the highest fertility rate of 72.0 births per 1,000 women, while women with the education attainment of less than high school have the lowest fertility at 41.0 births per 1,000 women. Women with the education attainment of college or associate's degree represent 33.2% of all women with births.
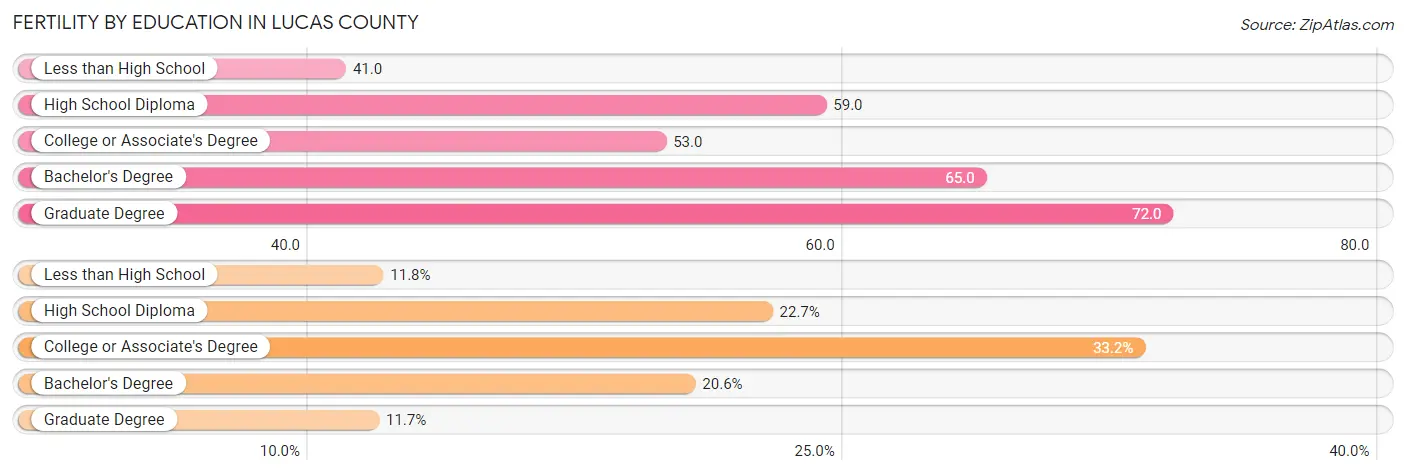
| Educational Attainment | Women with Births | Births / 1,000 Women |
| Less than High School | 658 (11.8%) | 41.0 |
| High School Diploma | 1,268 (22.7%) | 59.0 |
| College or Associate's Degree | 1,852 (33.2%) | 53.0 |
| Bachelor's Degree | 1,147 (20.6%) | 65.0 |
| Graduate Degree | 651 (11.7%) | 72.0 |
| Total | 5,576 (100.0%) | 56.0 |
Fertility by Education by Marriage Status in Lucas County
48.8% of women with births in Lucas County are unmarried. Women with the educational attainment of graduate degree are most likely to be married with 85.6% of them married at childbirth, while women with the educational attainment of less than high school are least likely to be married with 86.9% of them unmarried at childbirth.
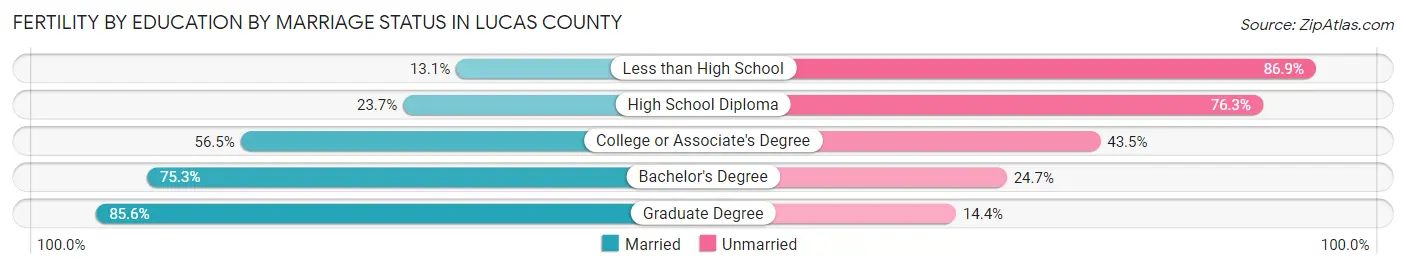
| Educational Attainment | Married | Unmarried |
| Less than High School | 86 (13.1%) | 572 (86.9%) |
| High School Diploma | 301 (23.7%) | 967 (76.3%) |
| College or Associate's Degree | 1,046 (56.5%) | 806 (43.5%) |
| Bachelor's Degree | 864 (75.3%) | 283 (24.7%) |
| Graduate Degree | 557 (85.6%) | 94 (14.4%) |
| Total | 2,855 (51.2%) | 2,721 (48.8%) |
Income in Lucas County
Income Overview in Lucas County
Per Capita Income in Lucas County is $34,399, while median incomes of families and households are $76,089 and $57,265 respectively.
| Characteristic | Number | Measure |
| Per Capita Income | 430,014 | $34,399 |
| Median Family Income | 104,936 | $76,089 |
| Mean Family Income | 104,936 | $100,871 |
| Median Household Income | 181,383 | $57,265 |
| Mean Household Income | 181,383 | $80,697 |
| Income Deficit | 104,936 | $12,229 |
| Wage / Income Gap (%) | 430,014 | 24.12% |
| Wage / Income Gap ($) | 430,014 | 75.88¢ per $1 |
| Gini / Inequality Index | 430,014 | 0.49 |
Earnings by Sex in Lucas County
Average Earnings in Lucas County are $36,112, $41,698 for men and $31,641 for women, a difference of 24.1%.
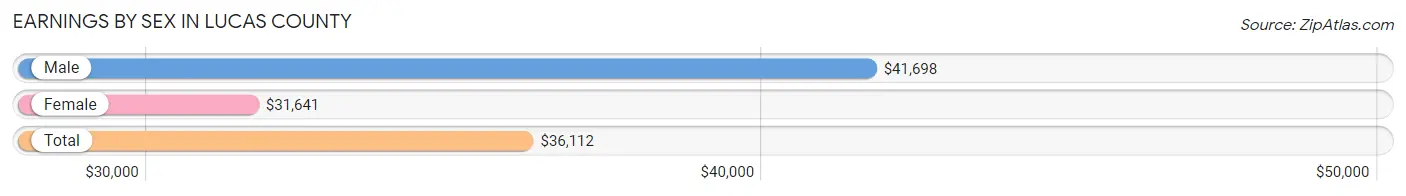
| Sex | Number | Average Earnings |
| Male | 115,391 (50.9%) | $41,698 |
| Female | 111,144 (49.1%) | $31,641 |
| Total | 226,535 (100.0%) | $36,112 |
Earnings by Sex by Income Bracket in Lucas County
The most common earnings brackets in Lucas County are $100,000+ for men (15,849 | 13.7%) and $25,000 to $29,999 for women (8,106 | 7.3%).
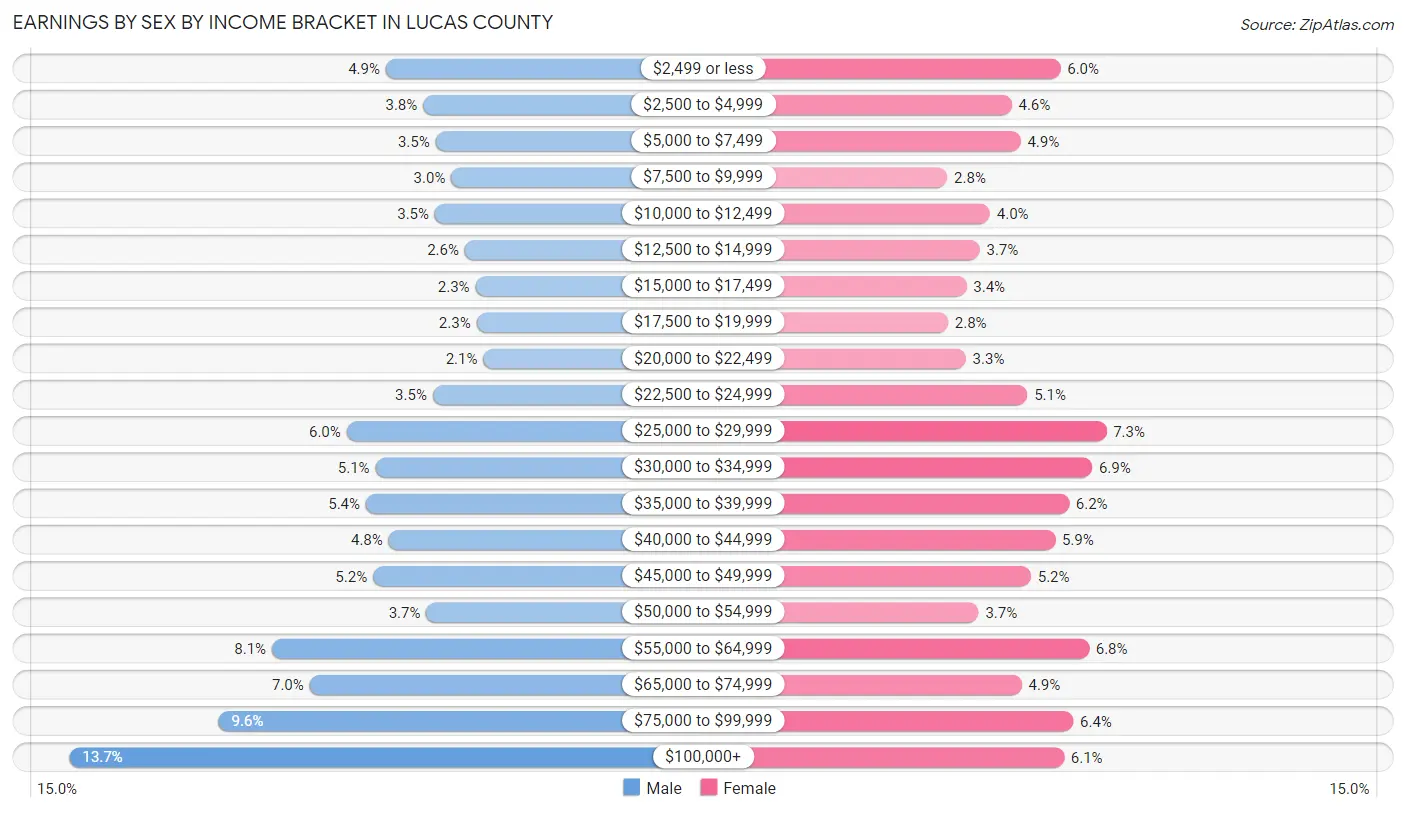
| Income | Male | Female |
| $2,499 or less | 5,602 (4.9%) | 6,664 (6.0%) |
| $2,500 to $4,999 | 4,385 (3.8%) | 5,145 (4.6%) |
| $5,000 to $7,499 | 3,981 (3.5%) | 5,424 (4.9%) |
| $7,500 to $9,999 | 3,473 (3.0%) | 3,132 (2.8%) |
| $10,000 to $12,499 | 4,009 (3.5%) | 4,470 (4.0%) |
| $12,500 to $14,999 | 3,034 (2.6%) | 4,145 (3.7%) |
| $15,000 to $17,499 | 2,693 (2.3%) | 3,738 (3.4%) |
| $17,500 to $19,999 | 2,657 (2.3%) | 3,162 (2.8%) |
| $20,000 to $22,499 | 2,439 (2.1%) | 3,708 (3.3%) |
| $22,500 to $24,999 | 4,068 (3.5%) | 5,632 (5.1%) |
| $25,000 to $29,999 | 6,862 (5.9%) | 8,106 (7.3%) |
| $30,000 to $34,999 | 5,928 (5.1%) | 7,661 (6.9%) |
| $35,000 to $39,999 | 6,237 (5.4%) | 6,931 (6.2%) |
| $40,000 to $44,999 | 5,501 (4.8%) | 6,507 (5.9%) |
| $45,000 to $49,999 | 6,012 (5.2%) | 5,741 (5.2%) |
| $50,000 to $54,999 | 4,281 (3.7%) | 4,116 (3.7%) |
| $55,000 to $64,999 | 9,291 (8.1%) | 7,554 (6.8%) |
| $65,000 to $74,999 | 8,070 (7.0%) | 5,458 (4.9%) |
| $75,000 to $99,999 | 11,019 (9.6%) | 7,073 (6.4%) |
| $100,000+ | 15,849 (13.7%) | 6,777 (6.1%) |
| Total | 115,391 (100.0%) | 111,144 (100.0%) |
Earnings by Sex by Educational Attainment in Lucas County
Average earnings in Lucas County are $49,169 for men and $36,399 for women, a difference of 26.0%. Men with an educational attainment of graduate degree enjoy the highest average annual earnings of $91,659, while those with less than high school education earn the least with $29,205. Women with an educational attainment of graduate degree earn the most with the average annual earnings of $64,227, while those with less than high school education have the smallest earnings of $16,827.
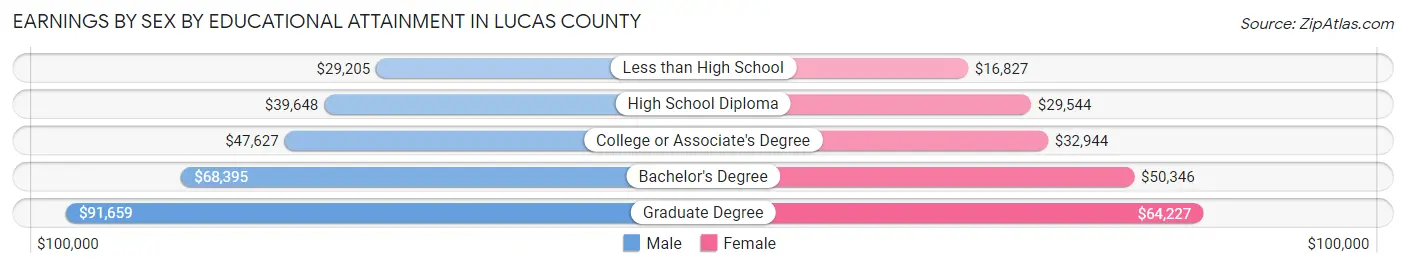
| Educational Attainment | Male Income | Female Income |
| Less than High School | $29,205 | $16,827 |
| High School Diploma | $39,648 | $29,544 |
| College or Associate's Degree | $47,627 | $32,944 |
| Bachelor's Degree | $68,395 | $50,346 |
| Graduate Degree | $91,659 | $64,227 |
| Total | $49,169 | $36,399 |
Family Income in Lucas County
Family Income Brackets in Lucas County
According to the Lucas County family income data, there are 20,253 families falling into the $100,000 to $149,999 income range, which is the most common income bracket and makes up 19.3% of all families. Conversely, the $10,000 to $14,999 income bracket is the least frequent group with only 2,938 families (2.8%) belonging to this category.
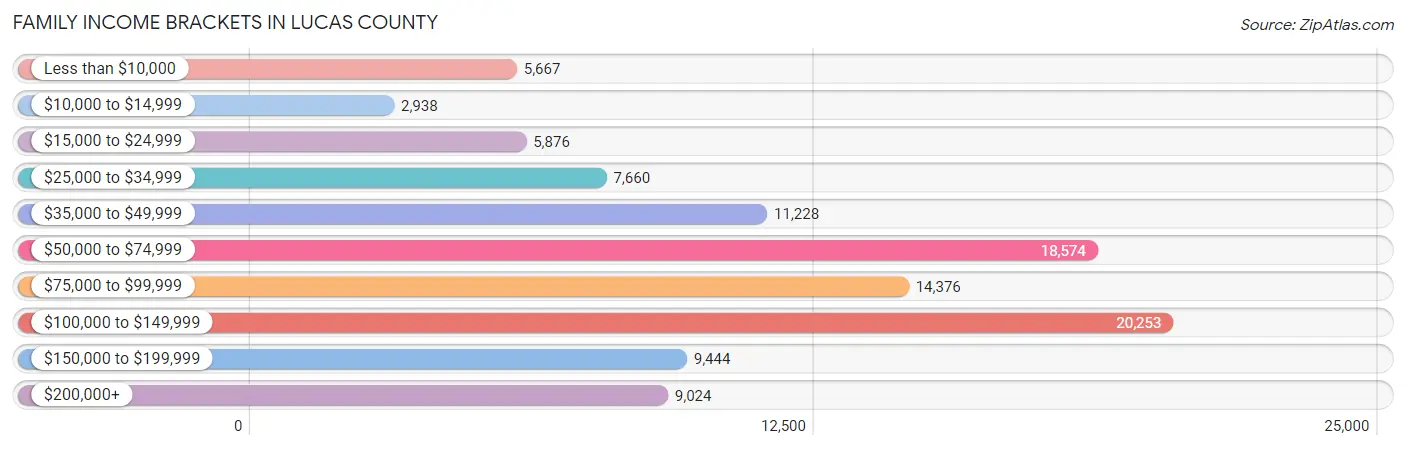
| Income Bracket | # Families | % Families |
| Less than $10,000 | 5,667 | 5.4% |
| $10,000 to $14,999 | 2,938 | 2.8% |
| $15,000 to $24,999 | 5,876 | 5.6% |
| $25,000 to $34,999 | 7,660 | 7.3% |
| $35,000 to $49,999 | 11,228 | 10.7% |
| $50,000 to $74,999 | 18,574 | 17.7% |
| $75,000 to $99,999 | 14,376 | 13.7% |
| $100,000 to $149,999 | 20,253 | 19.3% |
| $150,000 to $199,999 | 9,444 | 9.0% |
| $200,000+ | 9,024 | 8.6% |
Family Income by Famaliy Size in Lucas County
4-person families (16,460 | 15.7%) account for the highest median family income in Lucas County with $101,369 per family, while 2-person families (53,713 | 51.2%) have the highest median income of $34,315 per family member.

| Income Bracket | # Families | Median Income |
| 2-Person Families | 53,713 (51.2%) | $68,630 |
| 3-Person Families | 22,709 (21.6%) | $77,690 |
| 4-Person Families | 16,460 (15.7%) | $101,369 |
| 5-Person Families | 8,127 (7.7%) | $92,098 |
| 6-Person Families | 2,605 (2.5%) | $81,518 |
| 7+ Person Families | 1,322 (1.3%) | $89,318 |
| Total | 104,936 (100.0%) | $76,089 |
Family Income by Number of Earners in Lucas County
The median family income in Lucas County is $76,089, with families comprising 3+ earners (10,549) having the highest median family income of $139,534, while families with no earners (16,733) have the lowest median family income of $42,734, accounting for 10.1% and 16.0% of families, respectively.
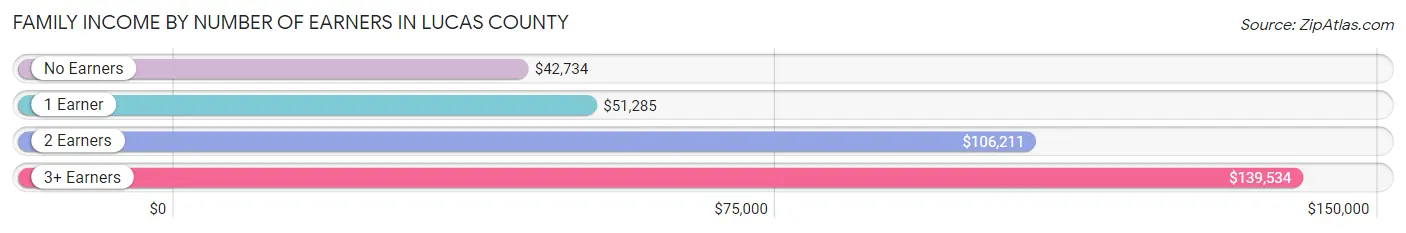
| Number of Earners | # Families | Median Income |
| No Earners | 16,733 (16.0%) | $42,734 |
| 1 Earner | 37,687 (35.9%) | $51,285 |
| 2 Earners | 39,967 (38.1%) | $106,211 |
| 3+ Earners | 10,549 (10.1%) | $139,534 |
| Total | 104,936 (100.0%) | $76,089 |
Household Income in Lucas County
Household Income Brackets in Lucas County
With 31,561 households falling in the category, the $50,000 to $74,999 income range is the most frequent in Lucas County, accounting for 17.4% of all households. In contrast, only 10,339 households (5.7%) fall into the $200,000+ income bracket, making it the least populous group.
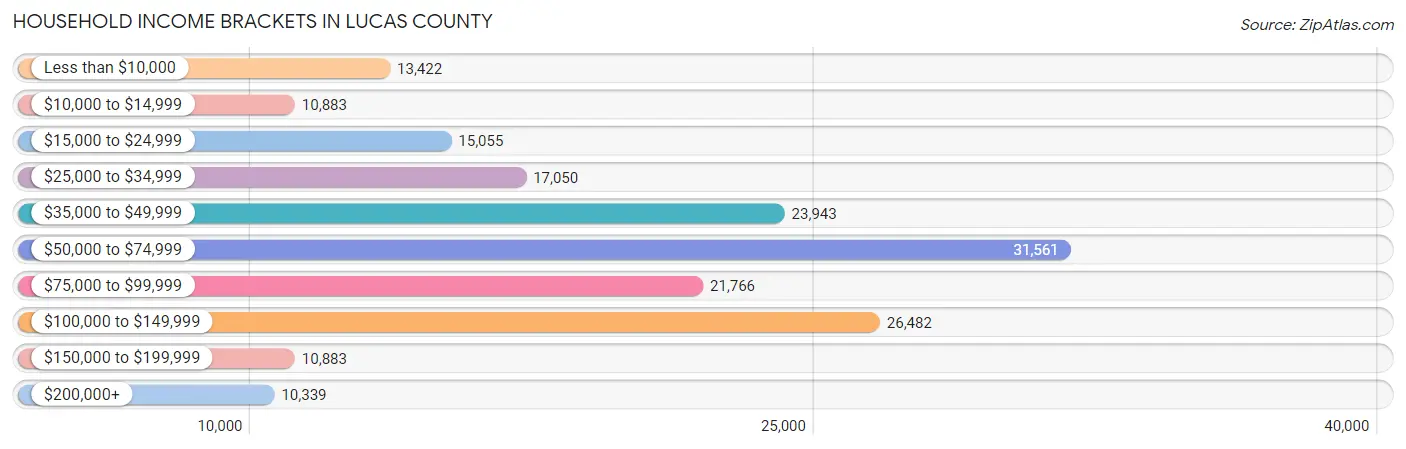
| Income Bracket | # Households | % Households |
| Less than $10,000 | 13,422 | 7.4% |
| $10,000 to $14,999 | 10,883 | 6.0% |
| $15,000 to $24,999 | 15,055 | 8.3% |
| $25,000 to $34,999 | 17,050 | 9.4% |
| $35,000 to $49,999 | 23,943 | 13.2% |
| $50,000 to $74,999 | 31,561 | 17.4% |
| $75,000 to $99,999 | 21,766 | 12.0% |
| $100,000 to $149,999 | 26,482 | 14.6% |
| $150,000 to $199,999 | 10,883 | 6.0% |
| $200,000+ | 10,339 | 5.7% |
Household Income by Householder Age in Lucas County
The median household income in Lucas County is $57,265, with the highest median household income of $71,568 found in the 45 to 64 years age bracket for the primary householder. A total of 65,902 households (36.3%) fall into this category. Meanwhile, the 15 to 24 years age bracket for the primary householder has the lowest median household income of $31,019, with 8,953 households (4.9%) in this group.
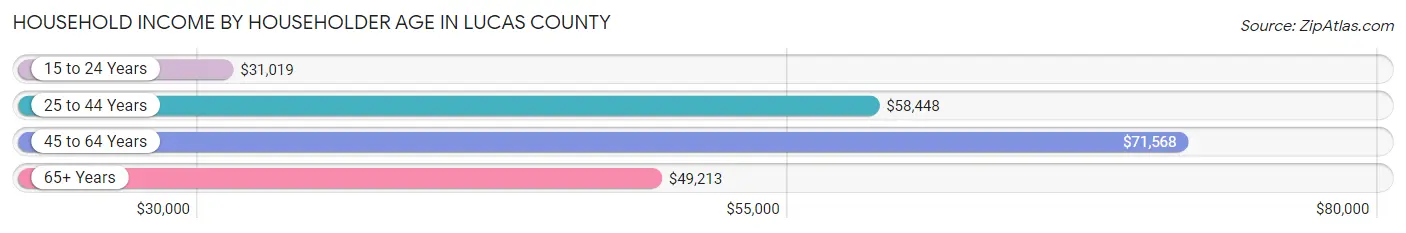
| Income Bracket | # Households | Median Income |
| 15 to 24 Years | 8,953 (4.9%) | $31,019 |
| 25 to 44 Years | 59,028 (32.5%) | $58,448 |
| 45 to 64 Years | 65,902 (36.3%) | $71,568 |
| 65+ Years | 47,500 (26.2%) | $49,213 |
| Total | 181,383 (100.0%) | $57,265 |
Poverty in Lucas County
Income Below Poverty by Sex and Age in Lucas County
With 16.6% poverty level for males and 19.1% for females among the residents of Lucas County, 5 year old males and 5 year old females are the most vulnerable to poverty, with 1,075 males (38.9%) and 1,002 females (34.4%) in their respective age groups living below the poverty level.
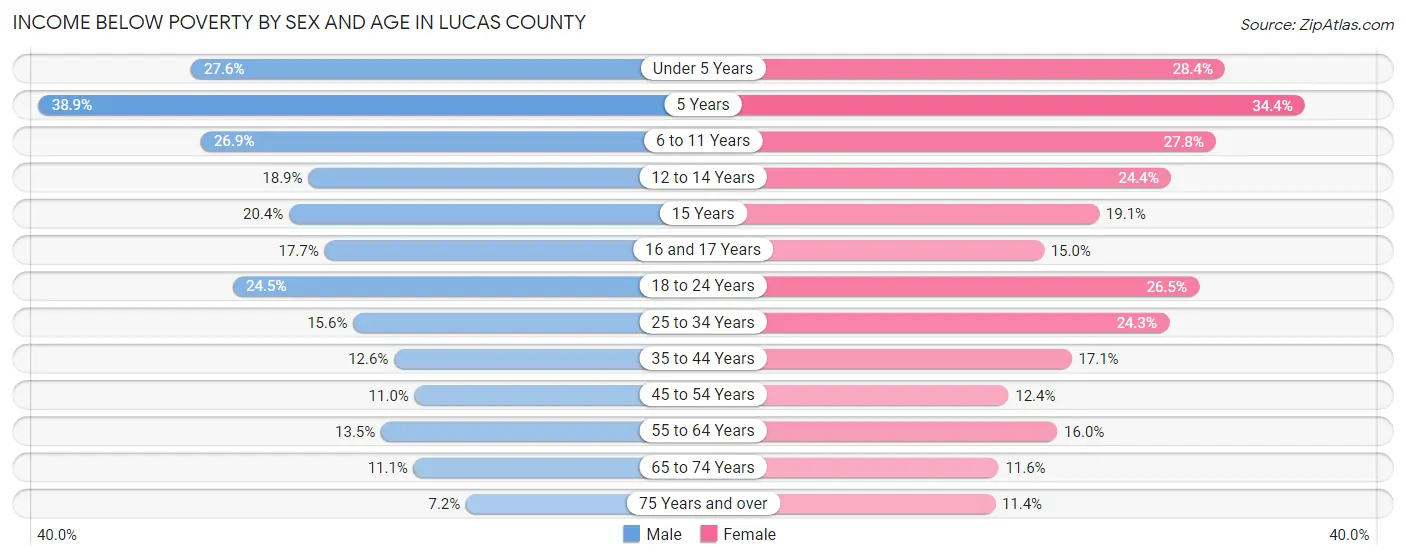
| Age Bracket | Male | Female |
| Under 5 Years | 3,613 (27.6%) | 3,574 (28.4%) |
| 5 Years | 1,075 (38.9%) | 1,002 (34.4%) |
| 6 to 11 Years | 4,200 (26.9%) | 4,192 (27.8%) |
| 12 to 14 Years | 1,742 (18.9%) | 2,052 (24.4%) |
| 15 Years | 596 (20.4%) | 478 (19.1%) |
| 16 and 17 Years | 985 (17.7%) | 853 (15.0%) |
| 18 to 24 Years | 4,573 (24.5%) | 4,791 (26.5%) |
| 25 to 34 Years | 4,609 (15.6%) | 7,386 (24.3%) |
| 35 to 44 Years | 3,075 (12.6%) | 4,378 (17.1%) |
| 45 to 54 Years | 2,758 (11.0%) | 3,258 (12.4%) |
| 55 to 64 Years | 3,737 (13.5%) | 4,715 (16.0%) |
| 65 to 74 Years | 2,220 (11.1%) | 2,655 (11.6%) |
| 75 Years and over | 761 (7.2%) | 1,803 (11.4%) |
| Total | 33,944 (16.6%) | 41,137 (19.1%) |
Income Above Poverty by Sex and Age in Lucas County
According to the poverty statistics in Lucas County, males aged 75 years and over and females aged 75 years and over are the age groups that are most secure financially, with 92.8% of males and 88.6% of females in these age groups living above the poverty line.
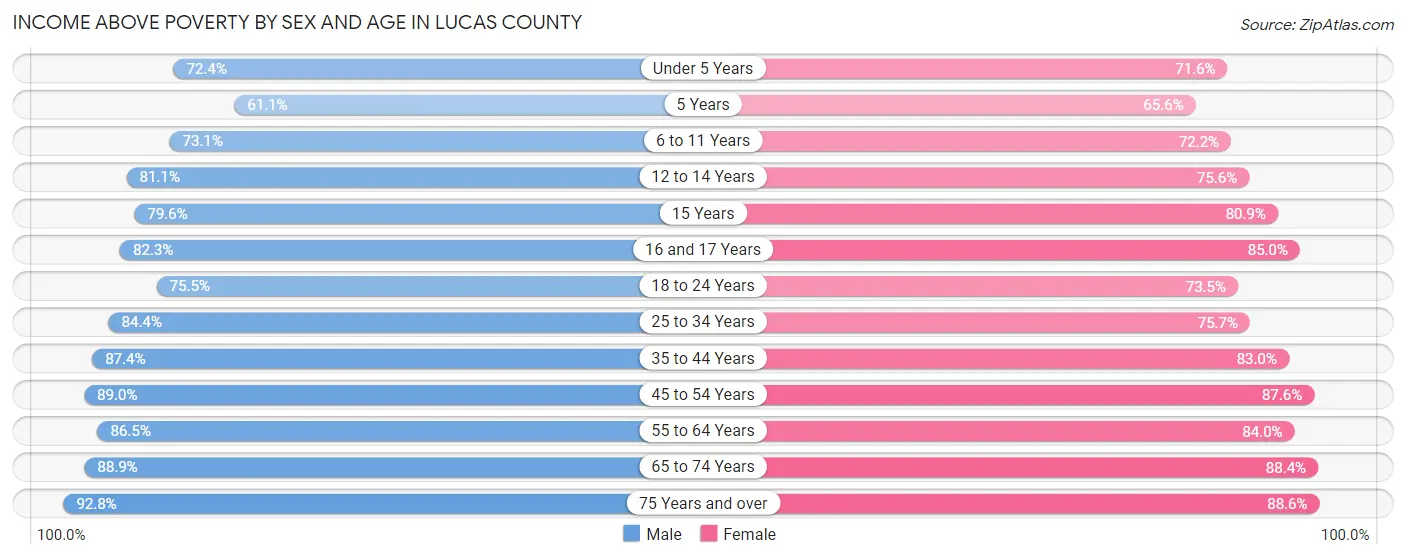
| Age Bracket | Male | Female |
| Under 5 Years | 9,457 (72.4%) | 8,999 (71.6%) |
| 5 Years | 1,686 (61.1%) | 1,914 (65.6%) |
| 6 to 11 Years | 11,412 (73.1%) | 10,904 (72.2%) |
| 12 to 14 Years | 7,459 (81.1%) | 6,355 (75.6%) |
| 15 Years | 2,332 (79.6%) | 2,026 (80.9%) |
| 16 and 17 Years | 4,571 (82.3%) | 4,838 (85.0%) |
| 18 to 24 Years | 14,075 (75.5%) | 13,289 (73.5%) |
| 25 to 34 Years | 24,938 (84.4%) | 23,049 (75.7%) |
| 35 to 44 Years | 21,403 (87.4%) | 21,303 (83.0%) |
| 45 to 54 Years | 22,218 (89.0%) | 23,091 (87.6%) |
| 55 to 64 Years | 23,884 (86.5%) | 24,768 (84.0%) |
| 65 to 74 Years | 17,754 (88.9%) | 20,167 (88.4%) |
| 75 Years and over | 9,774 (92.8%) | 14,054 (88.6%) |
| Total | 170,963 (83.4%) | 174,757 (80.9%) |
Income Below Poverty Among Married-Couple Families in Lucas County
The poverty statistics for married-couple families in Lucas County show that 4.5% or 3,102 of the total 68,881 families live below the poverty line. Families with 5 or more children have the highest poverty rate of 26.7%, comprising of 138 families. On the other hand, families with no children have the lowest poverty rate of 3.6%, which includes 1,560 families.
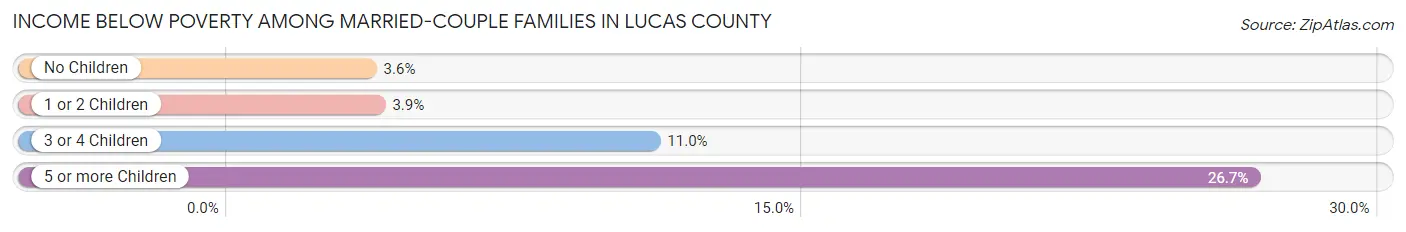
| Children | Above Poverty | Below Poverty |
| No Children | 41,523 (96.4%) | 1,560 (3.6%) |
| 1 or 2 Children | 18,535 (96.2%) | 742 (3.8%) |
| 3 or 4 Children | 5,342 (89.0%) | 662 (11.0%) |
| 5 or more Children | 379 (73.3%) | 138 (26.7%) |
| Total | 65,779 (95.5%) | 3,102 (4.5%) |
Income Below Poverty Among Single-Parent Households in Lucas County
According to the poverty data in Lucas County, 15.3% or 1,351 single-father households and 32.6% or 8,872 single-mother households are living below the poverty line. Among single-father households, those with 5 or more children have the highest poverty rate, with 75 households (61.5%) experiencing poverty. Likewise, among single-mother households, those with 5 or more children have the highest poverty rate, with 392 households (83.4%) falling below the poverty line.
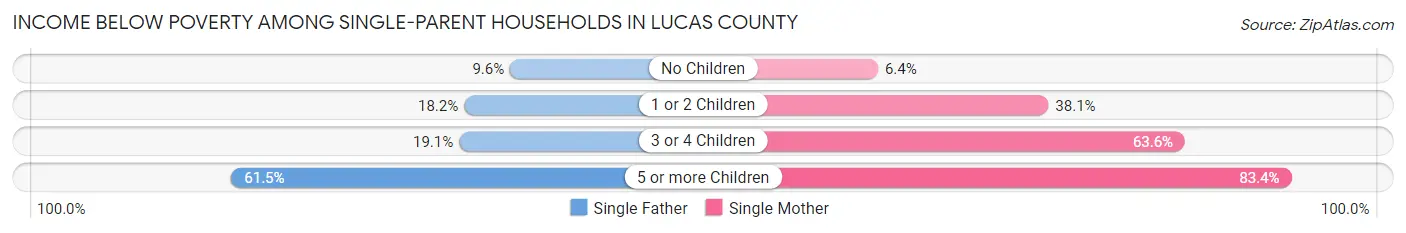
| Children | Single Father | Single Mother |
| No Children | 350 (9.6%) | 528 (6.4%) |
| 1 or 2 Children | 797 (18.1%) | 5,686 (38.1%) |
| 3 or 4 Children | 129 (19.1%) | 2,266 (63.6%) |
| 5 or more Children | 75 (61.5%) | 392 (83.4%) |
| Total | 1,351 (15.3%) | 8,872 (32.6%) |
Income Below Poverty Among Married-Couple vs Single-Parent Households in Lucas County
The poverty data for Lucas County shows that 3,102 of the married-couple family households (4.5%) and 10,223 of the single-parent households (28.3%) are living below the poverty level. Within the married-couple family households, those with 5 or more children have the highest poverty rate, with 138 households (26.7%) falling below the poverty line. Among the single-parent households, those with 5 or more children have the highest poverty rate, with 467 household (78.9%) living below poverty.
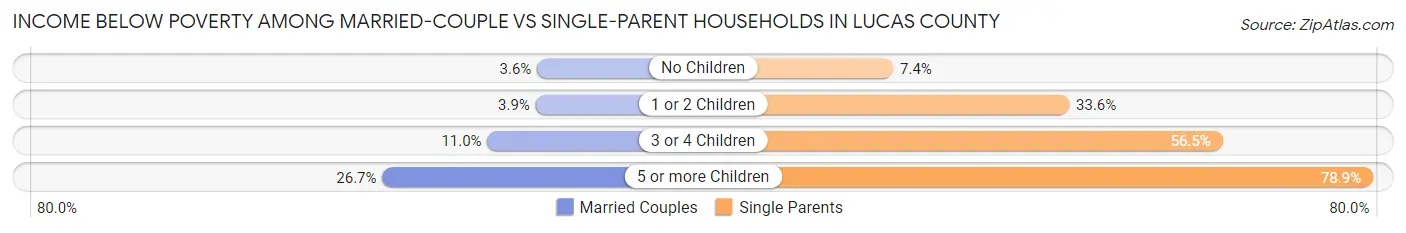
| Children | Married-Couple Families | Single-Parent Households |
| No Children | 1,560 (3.6%) | 878 (7.4%) |
| 1 or 2 Children | 742 (3.8%) | 6,483 (33.6%) |
| 3 or 4 Children | 662 (11.0%) | 2,395 (56.5%) |
| 5 or more Children | 138 (26.7%) | 467 (78.9%) |
| Total | 3,102 (4.5%) | 10,223 (28.3%) |
Employment Characteristics in Lucas County
Employment by Class of Employer in Lucas County
Among the 195,444 employed individuals in Lucas County, private company employees (136,939 | 70.1%), not-for-profit organizations (21,806 | 11.2%), and local government employees (13,699 | 7.0%) make up the most common classes of employment.
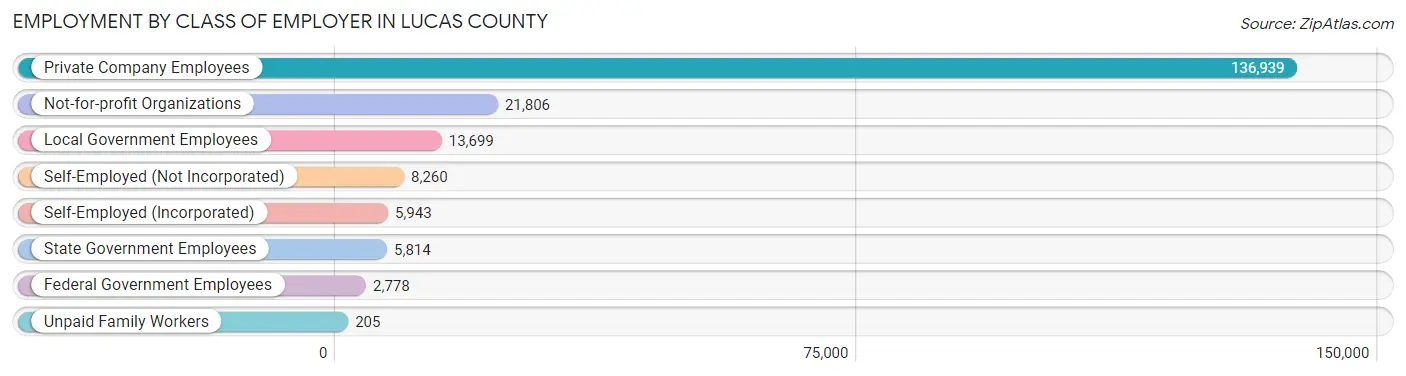
| Employer Class | # Employees | % Employees |
| Private Company Employees | 136,939 | 70.1% |
| Self-Employed (Incorporated) | 5,943 | 3.0% |
| Self-Employed (Not Incorporated) | 8,260 | 4.2% |
| Not-for-profit Organizations | 21,806 | 11.2% |
| Local Government Employees | 13,699 | 7.0% |
| State Government Employees | 5,814 | 3.0% |
| Federal Government Employees | 2,778 | 1.4% |
| Unpaid Family Workers | 205 | 0.1% |
| Total | 195,444 | 100.0% |
Employment Status by Age in Lucas County
According to the labor force statistics for Lucas County, out of the total population over 16 years of age (343,053), 63.0% or 216,123 individuals are in the labor force, with 6.8% or 14,696 of them unemployed. The age group with the highest labor force participation rate is 35 to 44 years, with 85.1% or 42,969 individuals in the labor force. Within the labor force, the 16 to 19 years age range has the highest percentage of unemployed individuals, with 18.2% or 2,055 of them being unemployed.
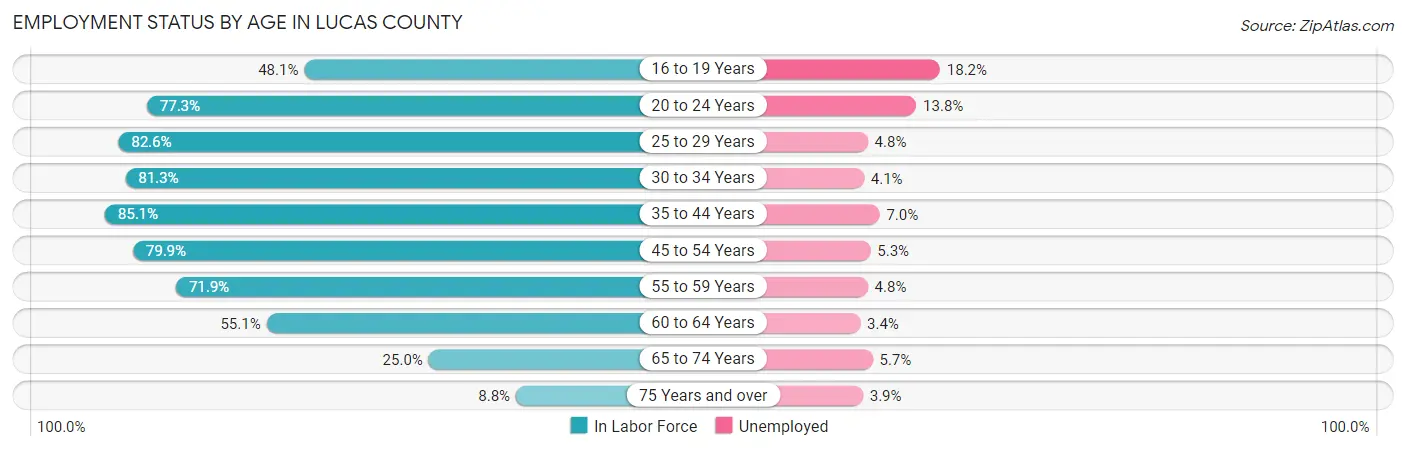
| Age Bracket | In Labor Force | Unemployed |
| 16 to 19 Years | 11,290 (48.1%) | 2,055 (18.2%) |
| 20 to 24 Years | 21,366 (77.3%) | 2,949 (13.8%) |
| 25 to 29 Years | 25,354 (82.6%) | 1,217 (4.8%) |
| 30 to 34 Years | 24,206 (81.3%) | 992 (4.1%) |
| 35 to 44 Years | 42,969 (85.1%) | 3,008 (7.0%) |
| 45 to 54 Years | 41,158 (79.9%) | 2,181 (5.3%) |
| 55 to 59 Years | 20,562 (71.9%) | 987 (4.8%) |
| 60 to 64 Years | 15,992 (55.1%) | 544 (3.4%) |
| 65 to 74 Years | 10,896 (25.0%) | 621 (5.7%) |
| 75 Years and over | 2,487 (8.8%) | 97 (3.9%) |
| Total | 216,123 (63.0%) | 14,696 (6.8%) |
Employment Status by Educational Attainment in Lucas County
According to labor force statistics for Lucas County, 77.4% of individuals (170,354) out of the total population between 25 and 64 years of age (220,095) are in the labor force, with 5.2% or 8,858 of them being unemployed. The group with the highest labor force participation rate are those with the educational attainment of bachelor's degree or higher, with 87.2% or 55,236 individuals in the labor force. Within the labor force, individuals with less than high school education have the highest percentage of unemployment, with 15.3% or 1,553 of them being unemployed.
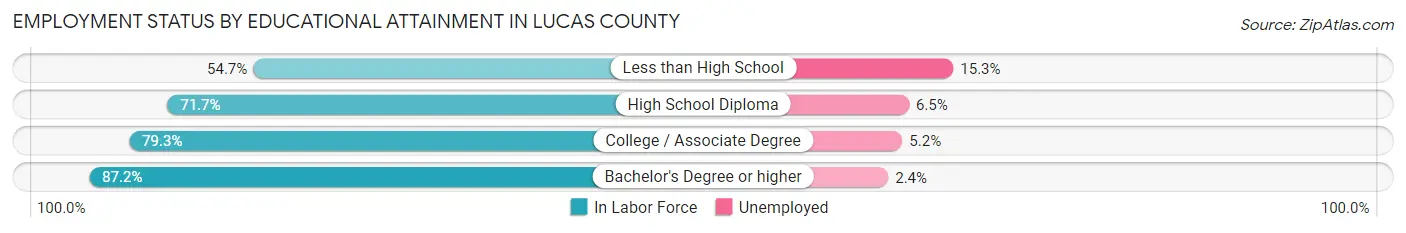
| Educational Attainment | In Labor Force | Unemployed |
| Less than High School | 10,148 (54.7%) | 2,839 (15.3%) |
| High School Diploma | 44,992 (71.7%) | 4,079 (6.5%) |
| College / Associate Degree | 59,829 (79.3%) | 3,923 (5.2%) |
| Bachelor's Degree or higher | 55,236 (87.2%) | 1,520 (2.4%) |
| Total | 170,354 (77.4%) | 11,445 (5.2%) |
Employment Occupations by Sex in Lucas County
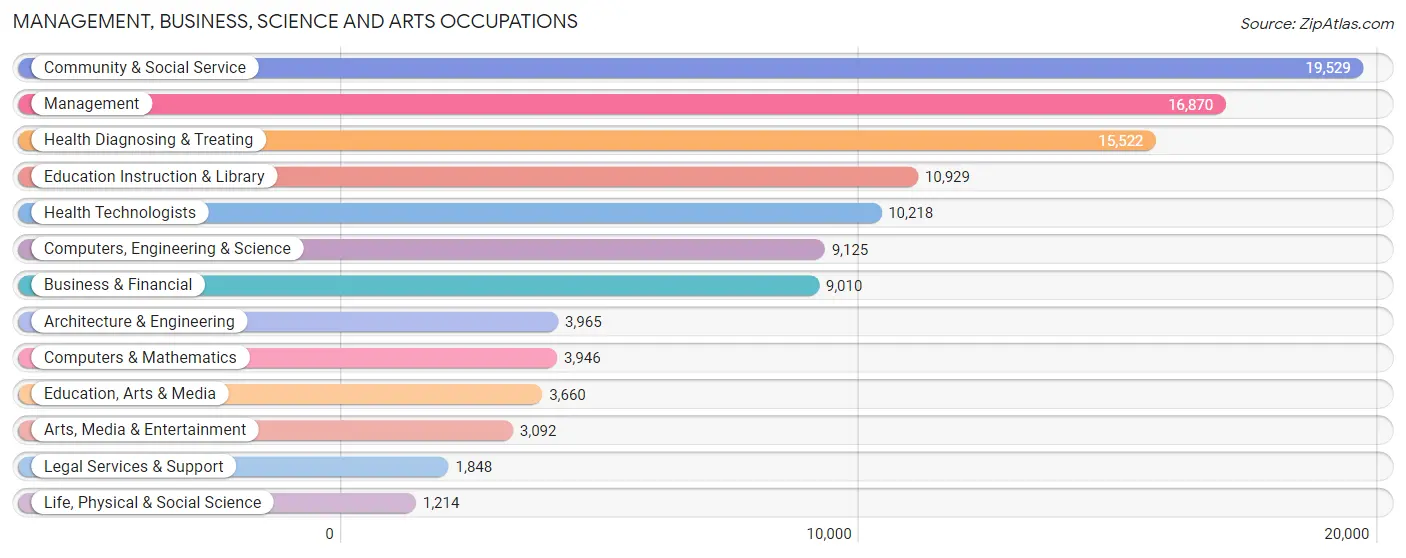
Management, Business, Science and Arts Occupations
The most common Management, Business, Science and Arts occupations in Lucas County are Community & Social Service (19,529 | 9.7%), Management (16,870 | 8.4%), Health Diagnosing & Treating (15,522 | 7.7%), Education Instruction & Library (10,929 | 5.4%), and Health Technologists (10,218 | 5.1%).
Management, Business, Science and Arts Occupations by Sex
Within the Management, Business, Science and Arts occupations in Lucas County, the most male-oriented occupations are Architecture & Engineering (89.1%), Computers, Engineering & Science (77.0%), and Computers & Mathematics (74.4%), while the most female-oriented occupations are Health Diagnosing & Treating (76.9%), Health Technologists (75.0%), and Education Instruction & Library (74.2%).
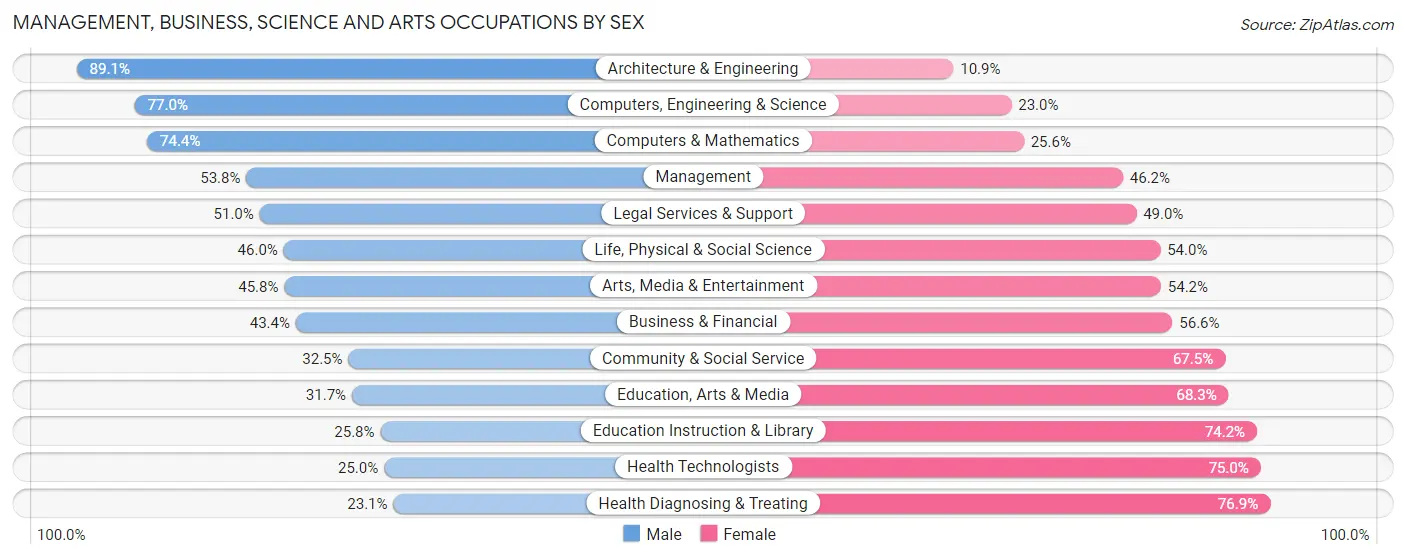
| Occupation | Male | Female |
| Management | 9,070 (53.8%) | 7,800 (46.2%) |
| Business & Financial | 3,913 (43.4%) | 5,097 (56.6%) |
| Computers, Engineering & Science | 7,029 (77.0%) | 2,096 (23.0%) |
| Computers & Mathematics | 2,937 (74.4%) | 1,009 (25.6%) |
| Architecture & Engineering | 3,534 (89.1%) | 431 (10.9%) |
| Life, Physical & Social Science | 558 (46.0%) | 656 (54.0%) |
| Community & Social Service | 6,339 (32.5%) | 13,190 (67.5%) |
| Education, Arts & Media | 1,161 (31.7%) | 2,499 (68.3%) |
| Legal Services & Support | 942 (51.0%) | 906 (49.0%) |
| Education Instruction & Library | 2,819 (25.8%) | 8,110 (74.2%) |
| Arts, Media & Entertainment | 1,417 (45.8%) | 1,675 (54.2%) |
| Health Diagnosing & Treating | 3,581 (23.1%) | 11,941 (76.9%) |
| Health Technologists | 2,556 (25.0%) | 7,662 (75.0%) |
| Total (Category) | 29,932 (42.7%) | 40,124 (57.3%) |
| Total (Overall) | 102,896 (51.1%) | 98,378 (48.9%) |
Services Occupations
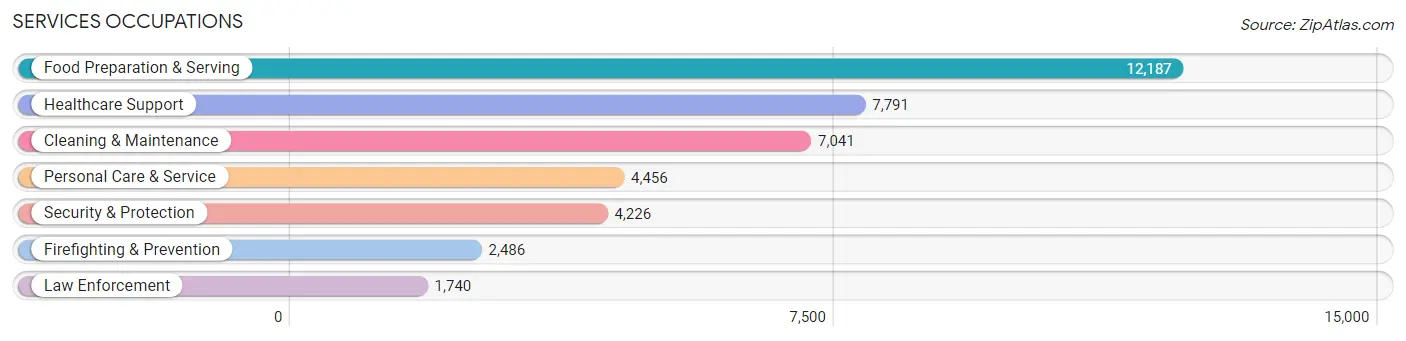
The most common Services occupations in Lucas County are Food Preparation & Serving (12,187 | 6.0%), Healthcare Support (7,791 | 3.9%), Cleaning & Maintenance (7,041 | 3.5%), Personal Care & Service (4,456 | 2.2%), and Security & Protection (4,226 | 2.1%).
Services Occupations by Sex
Within the Services occupations in Lucas County, the most male-oriented occupations are Law Enforcement (83.2%), Security & Protection (79.0%), and Firefighting & Prevention (76.0%), while the most female-oriented occupations are Healthcare Support (91.8%), Personal Care & Service (75.0%), and Food Preparation & Serving (56.0%).
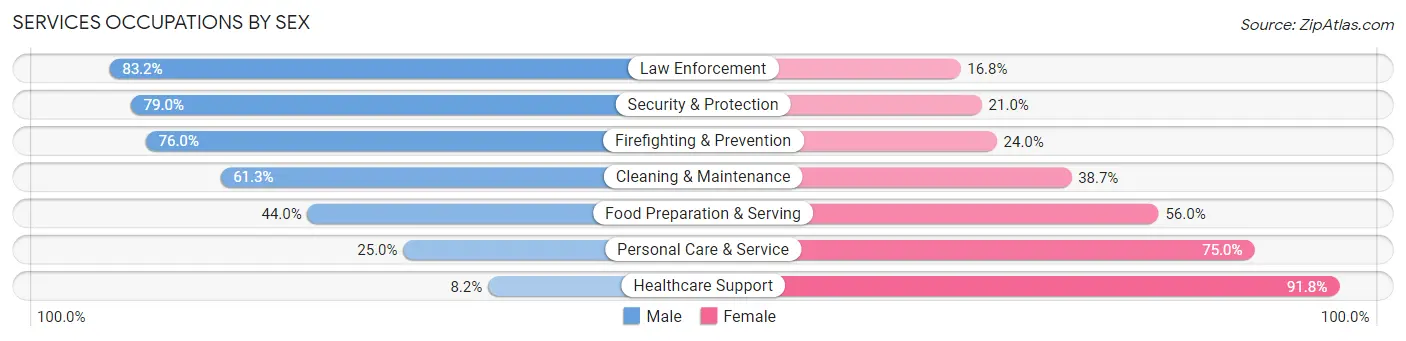
| Occupation | Male | Female |
| Healthcare Support | 641 (8.2%) | 7,150 (91.8%) |
| Security & Protection | 3,338 (79.0%) | 888 (21.0%) |
| Firefighting & Prevention | 1,890 (76.0%) | 596 (24.0%) |
| Law Enforcement | 1,448 (83.2%) | 292 (16.8%) |
| Food Preparation & Serving | 5,359 (44.0%) | 6,828 (56.0%) |
| Cleaning & Maintenance | 4,313 (61.3%) | 2,728 (38.7%) |
| Personal Care & Service | 1,114 (25.0%) | 3,342 (75.0%) |
| Total (Category) | 14,765 (41.4%) | 20,936 (58.6%) |
| Total (Overall) | 102,896 (51.1%) | 98,378 (48.9%) |
Sales and Office Occupations
The most common Sales and Office occupations in Lucas County are Office & Administration (22,346 | 11.1%), and Sales & Related (19,473 | 9.7%).

Sales and Office Occupations by Sex
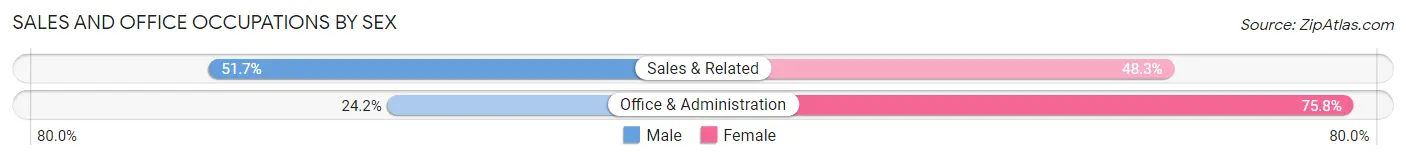
| Occupation | Male | Female |
| Sales & Related | 10,071 (51.7%) | 9,402 (48.3%) |
| Office & Administration | 5,398 (24.2%) | 16,948 (75.8%) |
| Total (Category) | 15,469 (37.0%) | 26,350 (63.0%) |
| Total (Overall) | 102,896 (51.1%) | 98,378 (48.9%) |
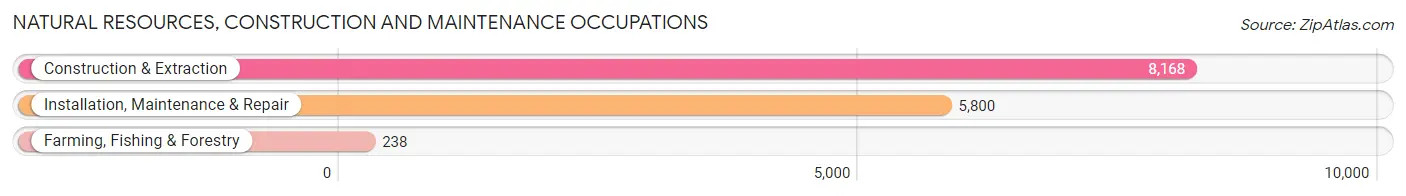
Natural Resources, Construction and Maintenance Occupations
The most common Natural Resources, Construction and Maintenance occupations in Lucas County are Construction & Extraction (8,168 | 4.1%), Installation, Maintenance & Repair (5,800 | 2.9%), and Farming, Fishing & Forestry (238 | 0.1%).
Natural Resources, Construction and Maintenance Occupations by Sex
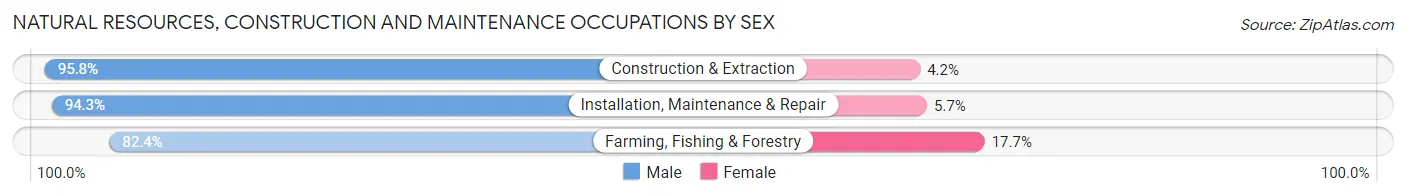
| Occupation | Male | Female |
| Farming, Fishing & Forestry | 196 (82.4%) | 42 (17.6%) |
| Construction & Extraction | 7,823 (95.8%) | 345 (4.2%) |
| Installation, Maintenance & Repair | 5,472 (94.3%) | 328 (5.7%) |
| Total (Category) | 13,491 (95.0%) | 715 (5.0%) |
| Total (Overall) | 102,896 (51.1%) | 98,378 (48.9%) |
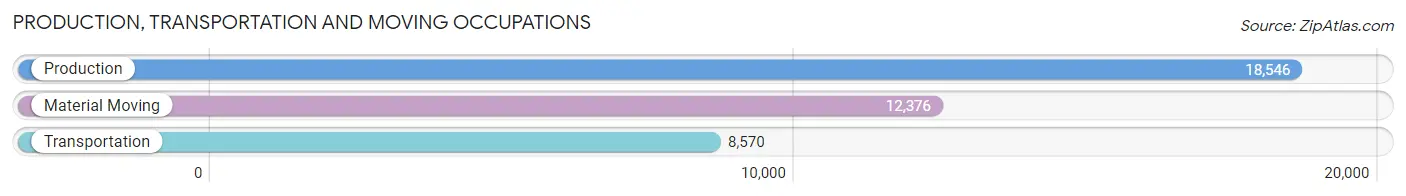
Production, Transportation and Moving Occupations
The most common Production, Transportation and Moving occupations in Lucas County are Production (18,546 | 9.2%), Material Moving (12,376 | 6.1%), and Transportation (8,570 | 4.3%).
Production, Transportation and Moving Occupations by Sex
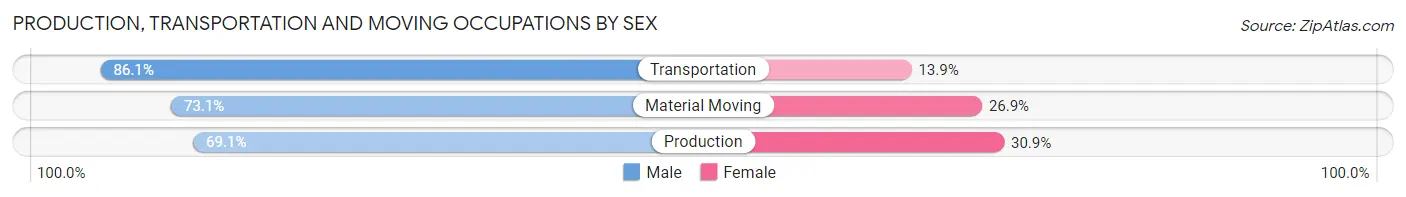
| Occupation | Male | Female |
| Production | 12,811 (69.1%) | 5,735 (30.9%) |
| Transportation | 7,376 (86.1%) | 1,194 (13.9%) |
| Material Moving | 9,052 (73.1%) | 3,324 (26.9%) |
| Total (Category) | 29,239 (74.0%) | 10,253 (26.0%) |
| Total (Overall) | 102,896 (51.1%) | 98,378 (48.9%) |
Employment Industries by Sex in Lucas County
Employment Industries in Lucas County
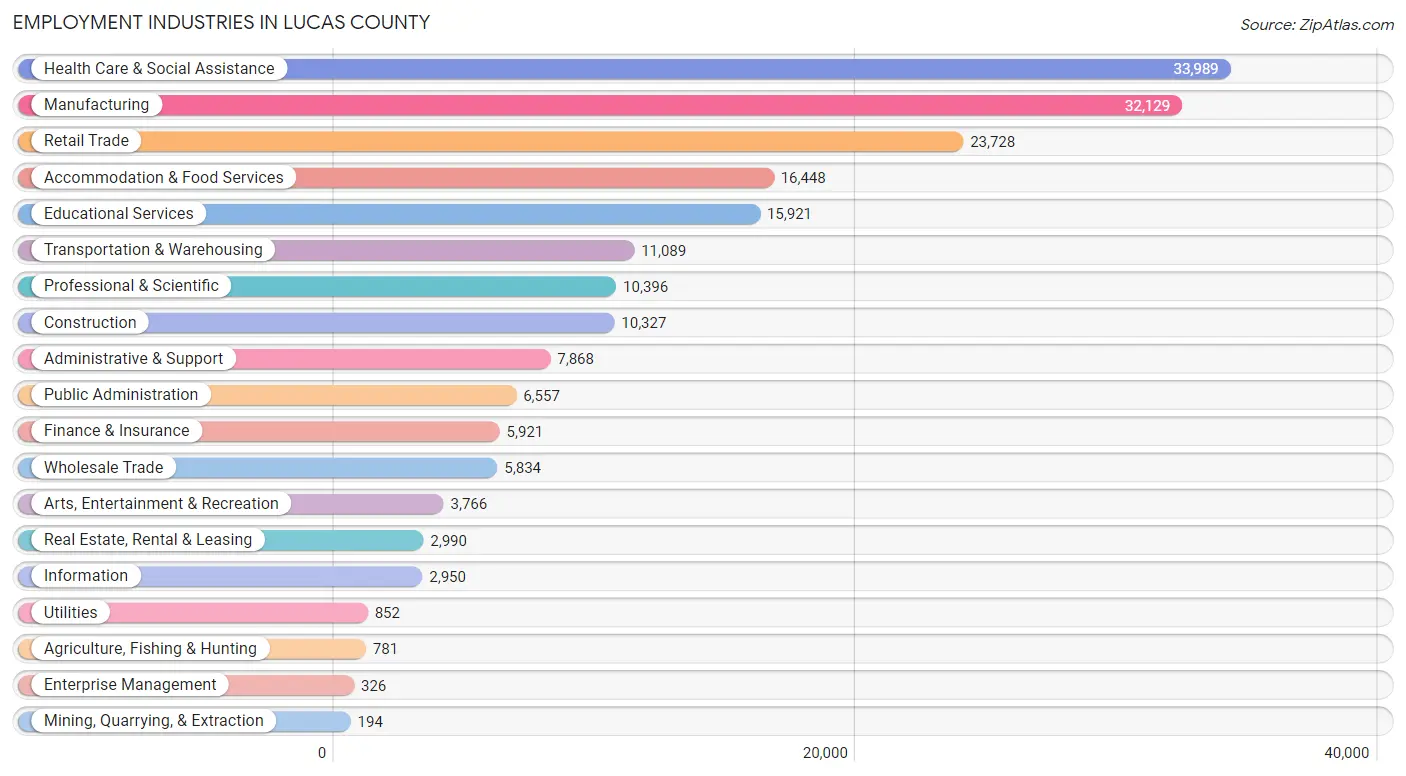
The major employment industries in Lucas County include Health Care & Social Assistance (33,989 | 16.9%), Manufacturing (32,129 | 16.0%), Retail Trade (23,728 | 11.8%), Accommodation & Food Services (16,448 | 8.2%), and Educational Services (15,921 | 7.9%).
Employment Industries by Sex in Lucas County
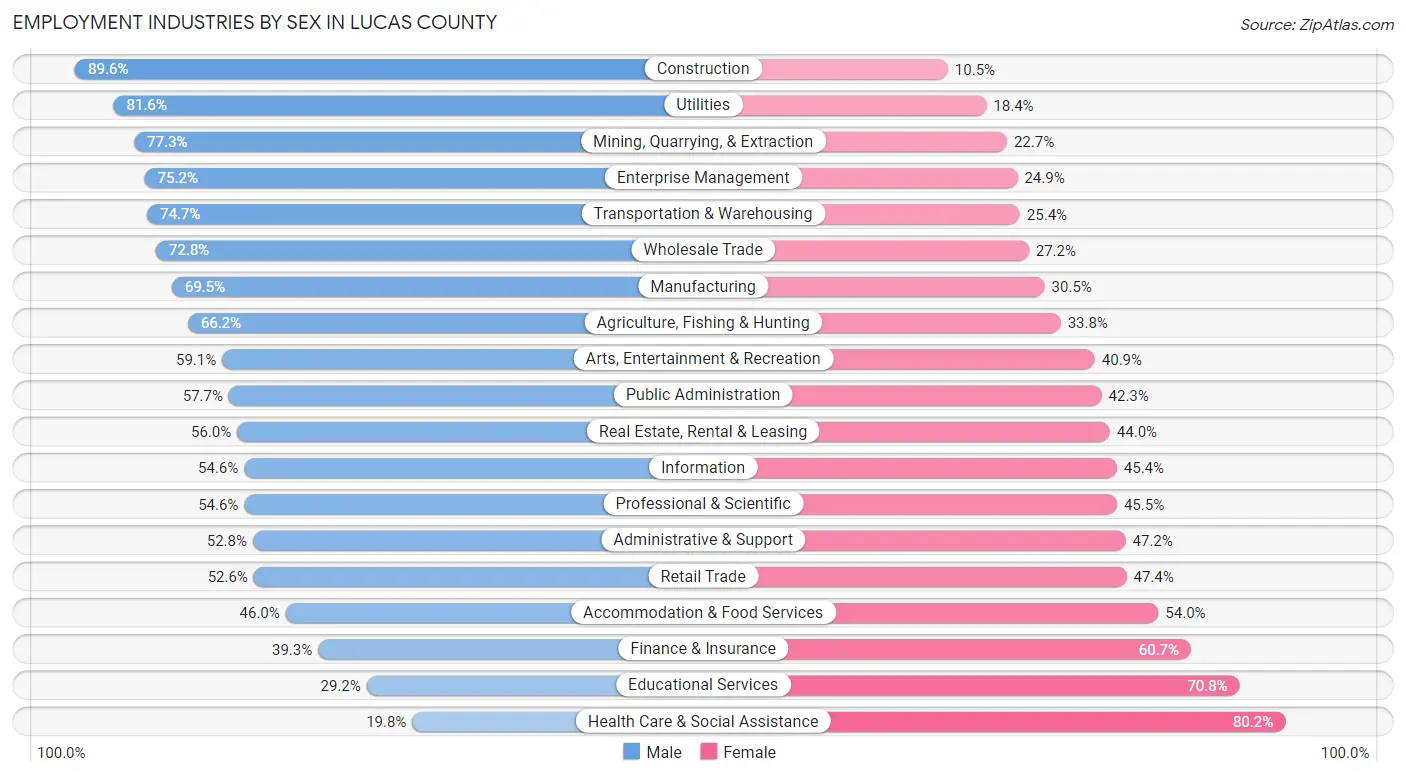
The Lucas County industries that see more men than women are Construction (89.5%), Utilities (81.6%), and Mining, Quarrying, & Extraction (77.3%), whereas the industries that tend to have a higher number of women are Health Care & Social Assistance (80.2%), Educational Services (70.8%), and Finance & Insurance (60.7%).
| Industry | Male | Female |
| Agriculture, Fishing & Hunting | 517 (66.2%) | 264 (33.8%) |
| Mining, Quarrying, & Extraction | 150 (77.3%) | 44 (22.7%) |
| Construction | 9,248 (89.5%) | 1,079 (10.4%) |
| Manufacturing | 22,339 (69.5%) | 9,790 (30.5%) |
| Wholesale Trade | 4,248 (72.8%) | 1,586 (27.2%) |
| Retail Trade | 12,475 (52.6%) | 11,253 (47.4%) |
| Transportation & Warehousing | 8,278 (74.7%) | 2,811 (25.4%) |
| Utilities | 695 (81.6%) | 157 (18.4%) |
| Information | 1,610 (54.6%) | 1,340 (45.4%) |
| Finance & Insurance | 2,325 (39.3%) | 3,596 (60.7%) |
| Real Estate, Rental & Leasing | 1,675 (56.0%) | 1,315 (44.0%) |
| Professional & Scientific | 5,671 (54.5%) | 4,725 (45.5%) |
| Enterprise Management | 245 (75.1%) | 81 (24.8%) |
| Administrative & Support | 4,152 (52.8%) | 3,716 (47.2%) |
| Educational Services | 4,651 (29.2%) | 11,270 (70.8%) |
| Health Care & Social Assistance | 6,719 (19.8%) | 27,270 (80.2%) |
| Arts, Entertainment & Recreation | 2,227 (59.1%) | 1,539 (40.9%) |
| Accommodation & Food Services | 7,563 (46.0%) | 8,885 (54.0%) |
| Public Administration | 3,786 (57.7%) | 2,771 (42.3%) |
| Total | 102,896 (51.1%) | 98,378 (48.9%) |
Education in Lucas County
School Enrollment in Lucas County
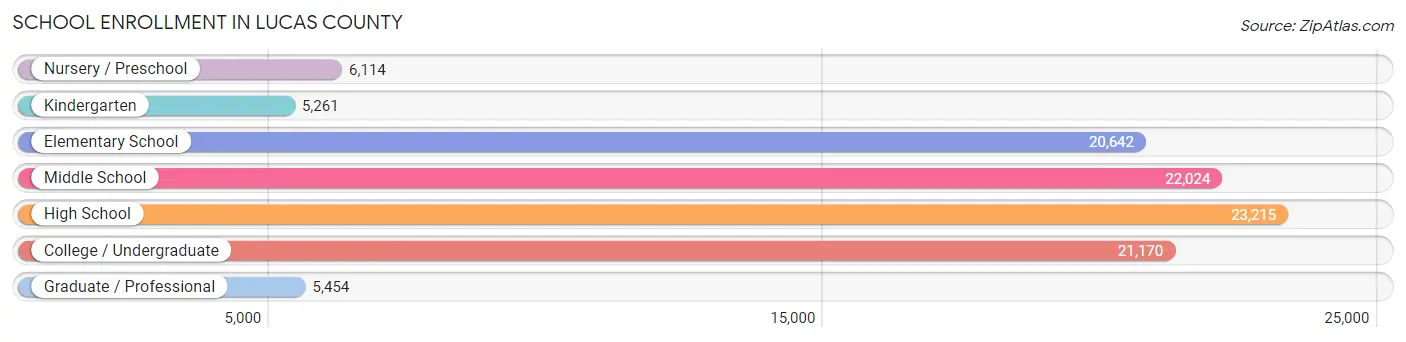
The most common levels of schooling among the 103,880 students in Lucas County are high school (23,215 | 22.4%), middle school (22,024 | 21.2%), and college / undergraduate (21,170 | 20.4%).
| School Level | # Students | % Students |
| Nursery / Preschool | 6,114 | 5.9% |
| Kindergarten | 5,261 | 5.1% |
| Elementary School | 20,642 | 19.9% |
| Middle School | 22,024 | 21.2% |
| High School | 23,215 | 22.4% |
| College / Undergraduate | 21,170 | 20.4% |
| Graduate / Professional | 5,454 | 5.2% |
| Total | 103,880 | 100.0% |
School Enrollment by Age by Funding Source in Lucas County
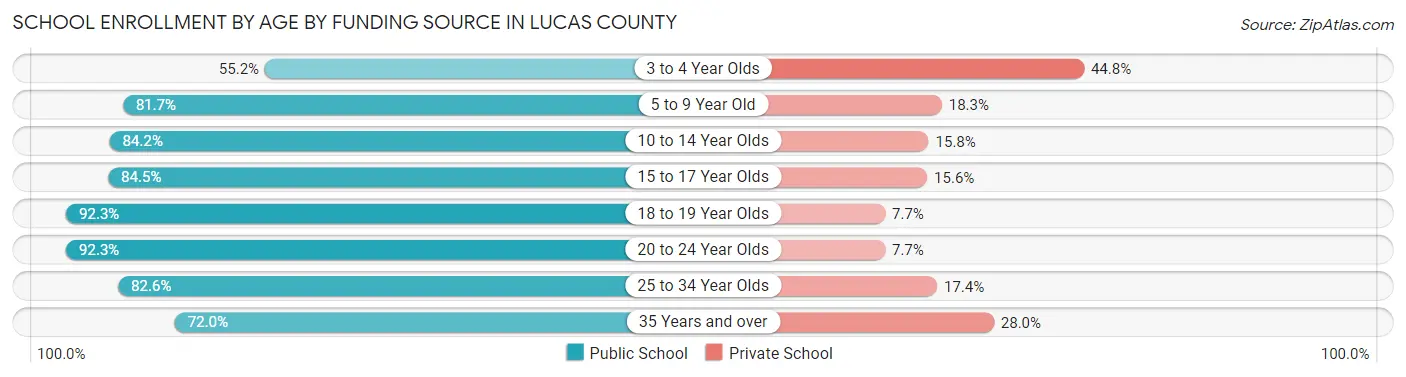
Out of a total of 103,880 students who are enrolled in schools in Lucas County, 17,348 (16.7%) attend a private institution, while the remaining 86,532 (83.3%) are enrolled in public schools. The age group of 3 to 4 year olds has the highest likelihood of being enrolled in private schools, with 1,972 (44.8% in the age bracket) enrolled. Conversely, the age group of 20 to 24 year olds has the lowest likelihood of being enrolled in a private school, with 10,192 (92.3% in the age bracket) attending a public institution.
| Age Bracket | Public School | Private School |
| 3 to 4 Year Olds | 2,434 (55.2%) | 1,972 (44.8%) |
| 5 to 9 Year Old | 20,184 (81.7%) | 4,515 (18.3%) |
| 10 to 14 Year Olds | 23,056 (84.2%) | 4,332 (15.8%) |
| 15 to 17 Year Olds | 13,798 (84.5%) | 2,540 (15.5%) |
| 18 to 19 Year Olds | 7,951 (92.3%) | 664 (7.7%) |
| 20 to 24 Year Olds | 10,192 (92.3%) | 850 (7.7%) |
| 25 to 34 Year Olds | 5,529 (82.6%) | 1,165 (17.4%) |
| 35 Years and over | 3,384 (72.0%) | 1,314 (28.0%) |
| Total | 86,532 (83.3%) | 17,348 (16.7%) |
Educational Attainment by Field of Study in Lucas County
Business (16,854 | 19.1%), education (13,257 | 15.0%), science & technology (12,822 | 14.5%), engineering (6,185 | 7.0%), and arts & humanities (5,456 | 6.2%) are the most common fields of study among 88,146 individuals in Lucas County who have obtained a bachelor's degree or higher.
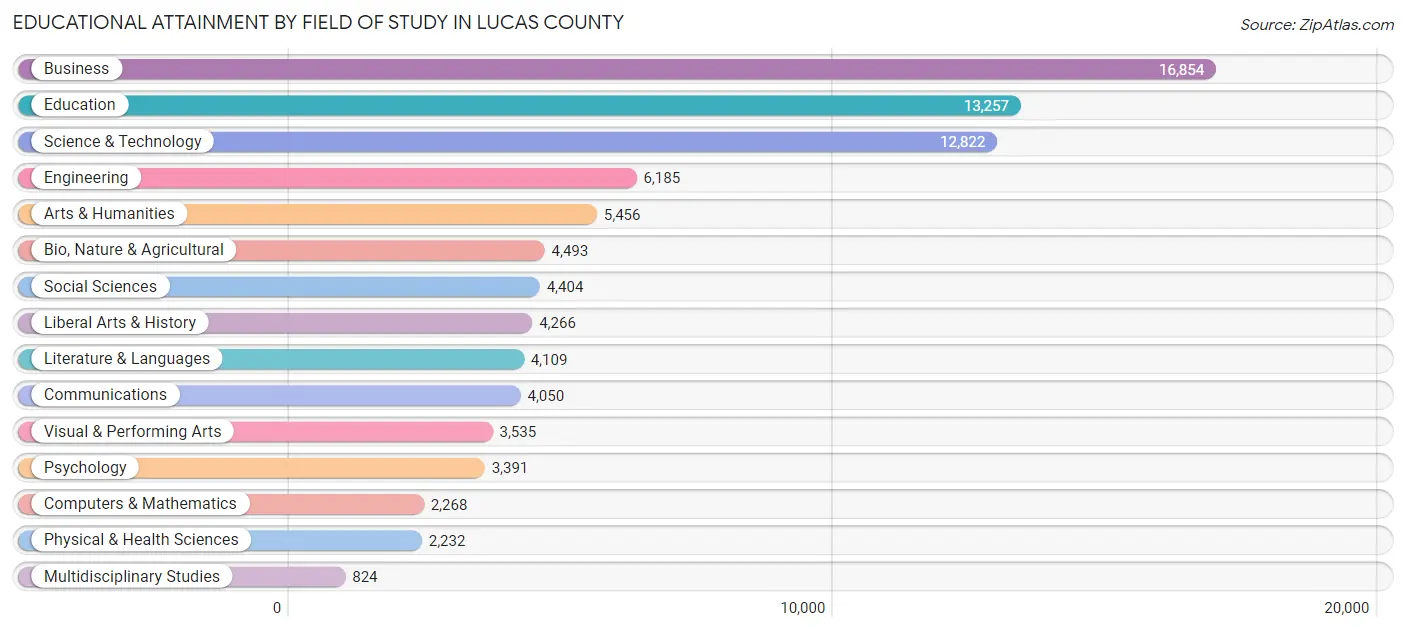
| Field of Study | # Graduates | % Graduates |
| Computers & Mathematics | 2,268 | 2.6% |
| Bio, Nature & Agricultural | 4,493 | 5.1% |
| Physical & Health Sciences | 2,232 | 2.5% |
| Psychology | 3,391 | 3.8% |
| Social Sciences | 4,404 | 5.0% |
| Engineering | 6,185 | 7.0% |
| Multidisciplinary Studies | 824 | 0.9% |
| Science & Technology | 12,822 | 14.5% |
| Business | 16,854 | 19.1% |
| Education | 13,257 | 15.0% |
| Literature & Languages | 4,109 | 4.7% |
| Liberal Arts & History | 4,266 | 4.8% |
| Visual & Performing Arts | 3,535 | 4.0% |
| Communications | 4,050 | 4.6% |
| Arts & Humanities | 5,456 | 6.2% |
| Total | 88,146 | 100.0% |
Transportation & Commute in Lucas County
Vehicle Availability by Sex in Lucas County
The most prevalent vehicle ownership categories in Lucas County are males with 2 vehicles (45,810, accounting for 45.6%) and females with 2 vehicles (40,742, making up 48.8%).
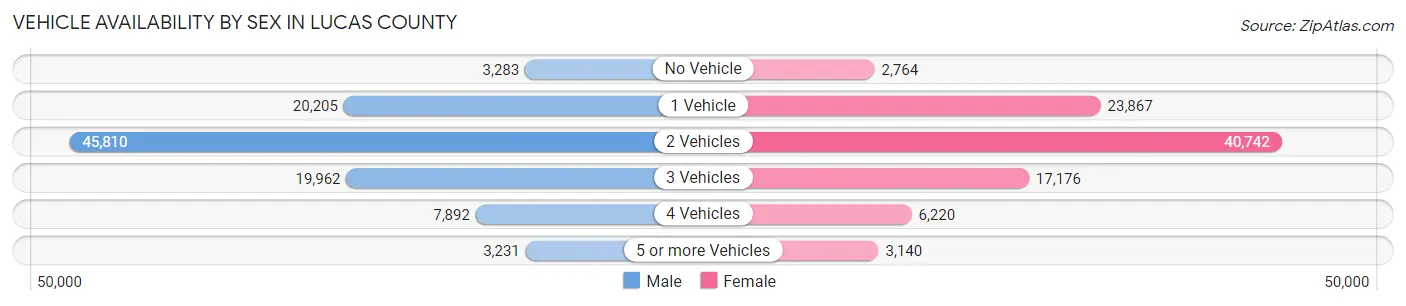
| Vehicles Available | Male | Female |
| No Vehicle | 3,283 (3.3%) | 2,764 (2.9%) |
| 1 Vehicle | 20,205 (20.1%) | 23,867 (25.4%) |
| 2 Vehicles | 45,810 (45.6%) | 40,742 (43.4%) |
| 3 Vehicles | 19,962 (19.9%) | 17,176 (18.3%) |
| 4 Vehicles | 7,892 (7.9%) | 6,220 (6.6%) |
| 5 or more Vehicles | 3,231 (3.2%) | 3,140 (3.3%) |
| Total | 100,383 (100.0%) | 93,909 (100.0%) |
Commute Time in Lucas County
The most frequently occuring commute durations in Lucas County are 15 to 19 minutes (37,915 commuters, 20.7%), 20 to 24 minutes (35,662 commuters, 19.5%), and 10 to 14 minutes (32,811 commuters, 17.9%).
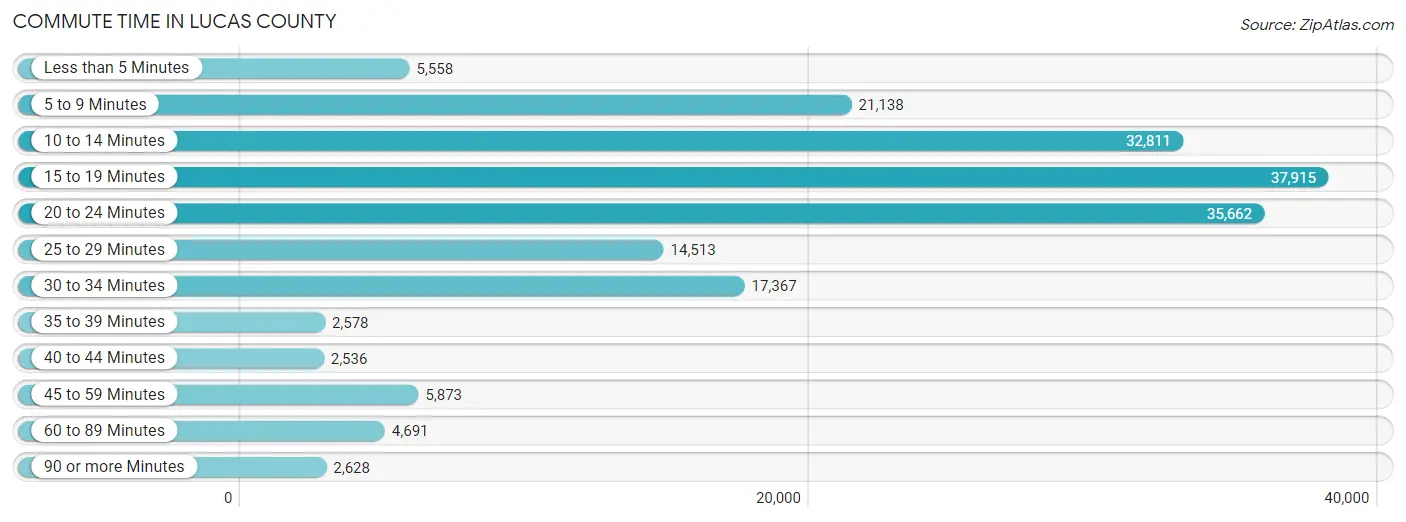
| Commute Time | # Commuters | % Commuters |
| Less than 5 Minutes | 5,558 | 3.0% |
| 5 to 9 Minutes | 21,138 | 11.5% |
| 10 to 14 Minutes | 32,811 | 17.9% |
| 15 to 19 Minutes | 37,915 | 20.7% |
| 20 to 24 Minutes | 35,662 | 19.5% |
| 25 to 29 Minutes | 14,513 | 7.9% |
| 30 to 34 Minutes | 17,367 | 9.5% |
| 35 to 39 Minutes | 2,578 | 1.4% |
| 40 to 44 Minutes | 2,536 | 1.4% |
| 45 to 59 Minutes | 5,873 | 3.2% |
| 60 to 89 Minutes | 4,691 | 2.6% |
| 90 or more Minutes | 2,628 | 1.4% |
Commute Time by Sex in Lucas County
The most common commute times in Lucas County are 15 to 19 minutes (19,469 commuters, 20.4%) for males and 15 to 19 minutes (18,446 commuters, 20.9%) for females.
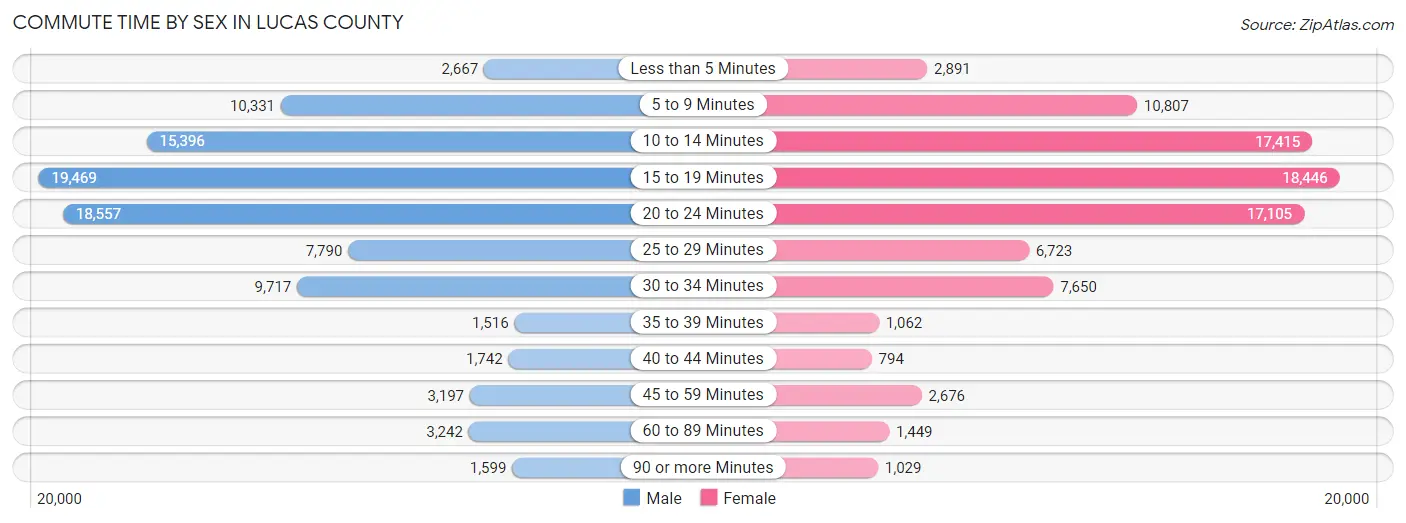
| Commute Time | Male | Female |
| Less than 5 Minutes | 2,667 (2.8%) | 2,891 (3.3%) |
| 5 to 9 Minutes | 10,331 (10.8%) | 10,807 (12.3%) |
| 10 to 14 Minutes | 15,396 (16.2%) | 17,415 (19.8%) |
| 15 to 19 Minutes | 19,469 (20.4%) | 18,446 (20.9%) |
| 20 to 24 Minutes | 18,557 (19.5%) | 17,105 (19.4%) |
| 25 to 29 Minutes | 7,790 (8.2%) | 6,723 (7.6%) |
| 30 to 34 Minutes | 9,717 (10.2%) | 7,650 (8.7%) |
| 35 to 39 Minutes | 1,516 (1.6%) | 1,062 (1.2%) |
| 40 to 44 Minutes | 1,742 (1.8%) | 794 (0.9%) |
| 45 to 59 Minutes | 3,197 (3.4%) | 2,676 (3.0%) |
| 60 to 89 Minutes | 3,242 (3.4%) | 1,449 (1.7%) |
| 90 or more Minutes | 1,599 (1.7%) | 1,029 (1.2%) |
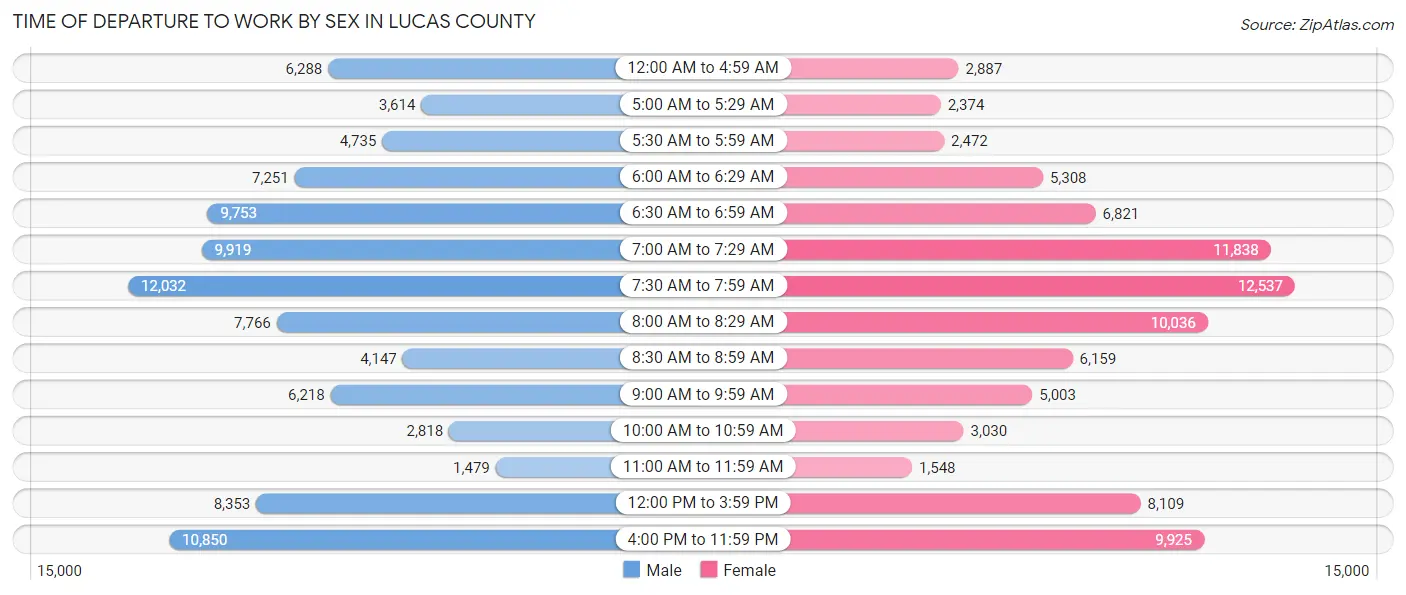
Time of Departure to Work by Sex in Lucas County
The most frequent times of departure to work in Lucas County are 7:30 AM to 7:59 AM (12,032, 12.6%) for males and 7:30 AM to 7:59 AM (12,537, 14.2%) for females.
| Time of Departure | Male | Female |
| 12:00 AM to 4:59 AM | 6,288 (6.6%) | 2,887 (3.3%) |
| 5:00 AM to 5:29 AM | 3,614 (3.8%) | 2,374 (2.7%) |
| 5:30 AM to 5:59 AM | 4,735 (5.0%) | 2,472 (2.8%) |
| 6:00 AM to 6:29 AM | 7,251 (7.6%) | 5,308 (6.0%) |
| 6:30 AM to 6:59 AM | 9,753 (10.2%) | 6,821 (7.7%) |
| 7:00 AM to 7:29 AM | 9,919 (10.4%) | 11,838 (13.5%) |
| 7:30 AM to 7:59 AM | 12,032 (12.6%) | 12,537 (14.2%) |
| 8:00 AM to 8:29 AM | 7,766 (8.2%) | 10,036 (11.4%) |
| 8:30 AM to 8:59 AM | 4,147 (4.4%) | 6,159 (7.0%) |
| 9:00 AM to 9:59 AM | 6,218 (6.5%) | 5,003 (5.7%) |
| 10:00 AM to 10:59 AM | 2,818 (3.0%) | 3,030 (3.4%) |
| 11:00 AM to 11:59 AM | 1,479 (1.5%) | 1,548 (1.8%) |
| 12:00 PM to 3:59 PM | 8,353 (8.8%) | 8,109 (9.2%) |
| 4:00 PM to 11:59 PM | 10,850 (11.4%) | 9,925 (11.3%) |
| Total | 95,223 (100.0%) | 88,047 (100.0%) |
Housing Occupancy in Lucas County
Occupancy by Ownership in Lucas County
Of the total 181,383 dwellings in Lucas County, owner-occupied units account for 111,632 (61.5%), while renter-occupied units make up 69,751 (38.5%).
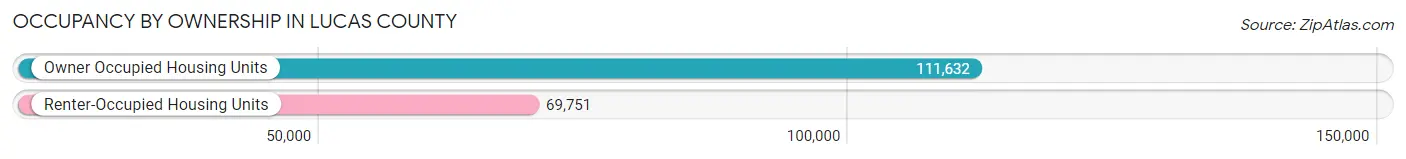
| Occupancy | # Housing Units | % Housing Units |
| Owner Occupied Housing Units | 111,632 | 61.5% |
| Renter-Occupied Housing Units | 69,751 | 38.5% |
| Total Occupied Housing Units | 181,383 | 100.0% |
Occupancy by Household Size in Lucas County
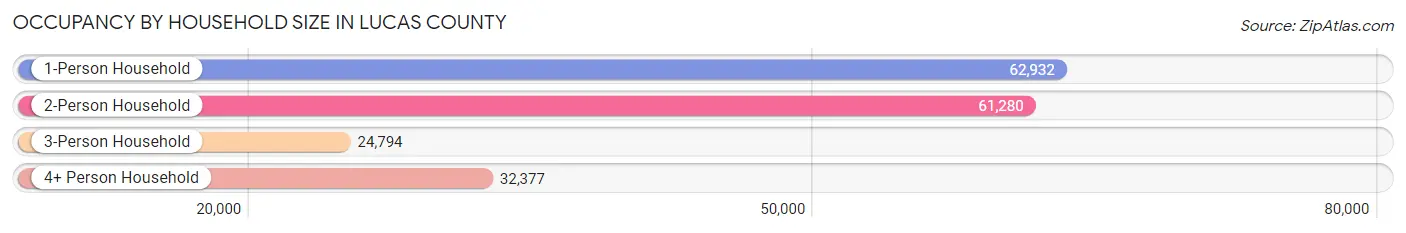
| Household Size | # Housing Units | % Housing Units |
| 1-Person Household | 62,932 | 34.7% |
| 2-Person Household | 61,280 | 33.8% |
| 3-Person Household | 24,794 | 13.7% |
| 4+ Person Household | 32,377 | 17.8% |
| Total Housing Units | 181,383 | 100.0% |
Occupancy by Ownership by Household Size in Lucas County
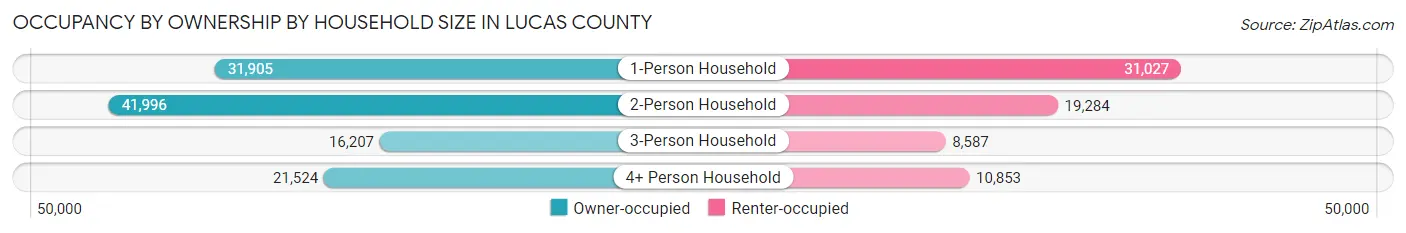
| Household Size | Owner-occupied | Renter-occupied |
| 1-Person Household | 31,905 (50.7%) | 31,027 (49.3%) |
| 2-Person Household | 41,996 (68.5%) | 19,284 (31.5%) |
| 3-Person Household | 16,207 (65.4%) | 8,587 (34.6%) |
| 4+ Person Household | 21,524 (66.5%) | 10,853 (33.5%) |
| Total Housing Units | 111,632 (61.5%) | 69,751 (38.5%) |
Occupancy by Educational Attainment in Lucas County
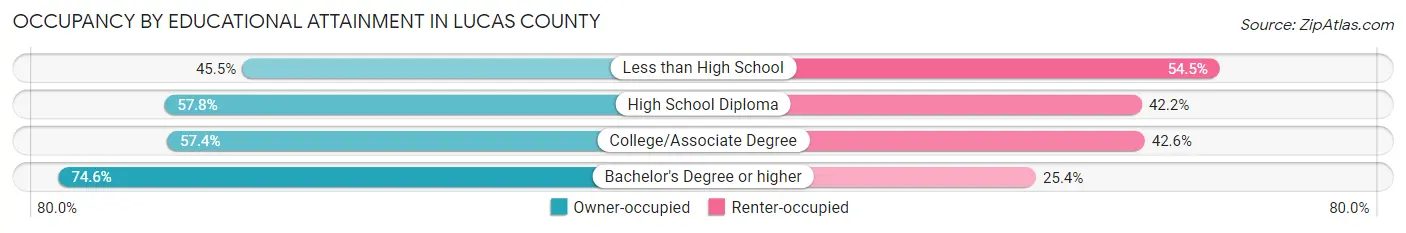
| Household Size | Owner-occupied | Renter-occupied |
| Less than High School | 6,729 (45.5%) | 8,054 (54.5%) |
| High School Diploma | 28,102 (57.8%) | 20,487 (42.2%) |
| College/Associate Degree | 37,531 (57.4%) | 27,861 (42.6%) |
| Bachelor's Degree or higher | 39,270 (74.6%) | 13,349 (25.4%) |
Occupancy by Age of Householder in Lucas County
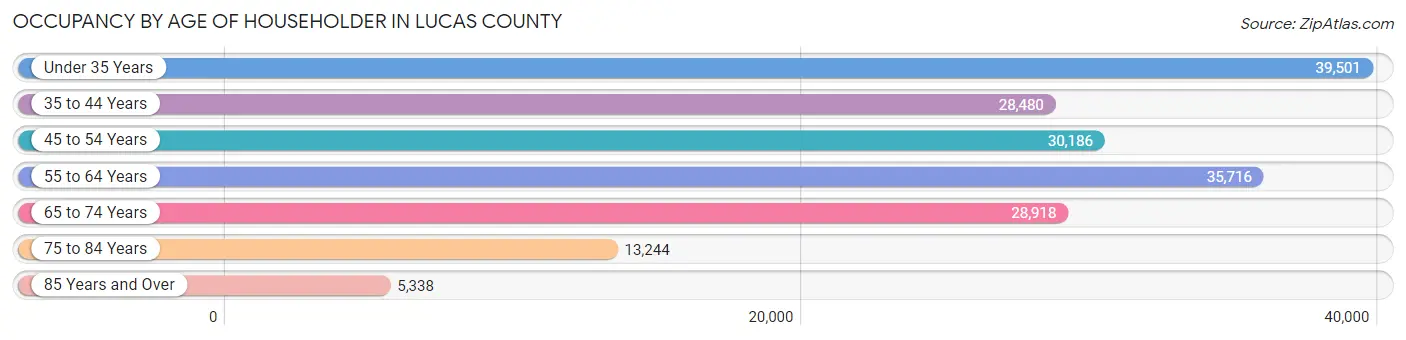
| Age Bracket | # Households | % Households |
| Under 35 Years | 39,501 | 21.8% |
| 35 to 44 Years | 28,480 | 15.7% |
| 45 to 54 Years | 30,186 | 16.6% |
| 55 to 64 Years | 35,716 | 19.7% |
| 65 to 74 Years | 28,918 | 15.9% |
| 75 to 84 Years | 13,244 | 7.3% |
| 85 Years and Over | 5,338 | 2.9% |
| Total | 181,383 | 100.0% |
Housing Finances in Lucas County
Median Income by Occupancy in Lucas County
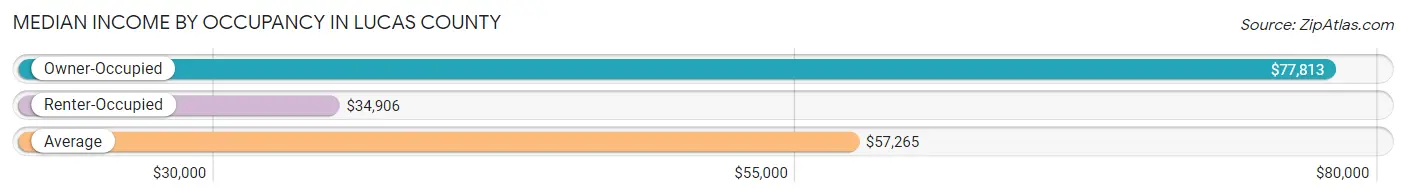
| Occupancy Type | # Households | Median Income |
| Owner-Occupied | 111,632 (61.5%) | $77,813 |
| Renter-Occupied | 69,751 (38.5%) | $34,906 |
| Average | 181,383 (100.0%) | $57,265 |
Occupancy by Householder Income Bracket in Lucas County
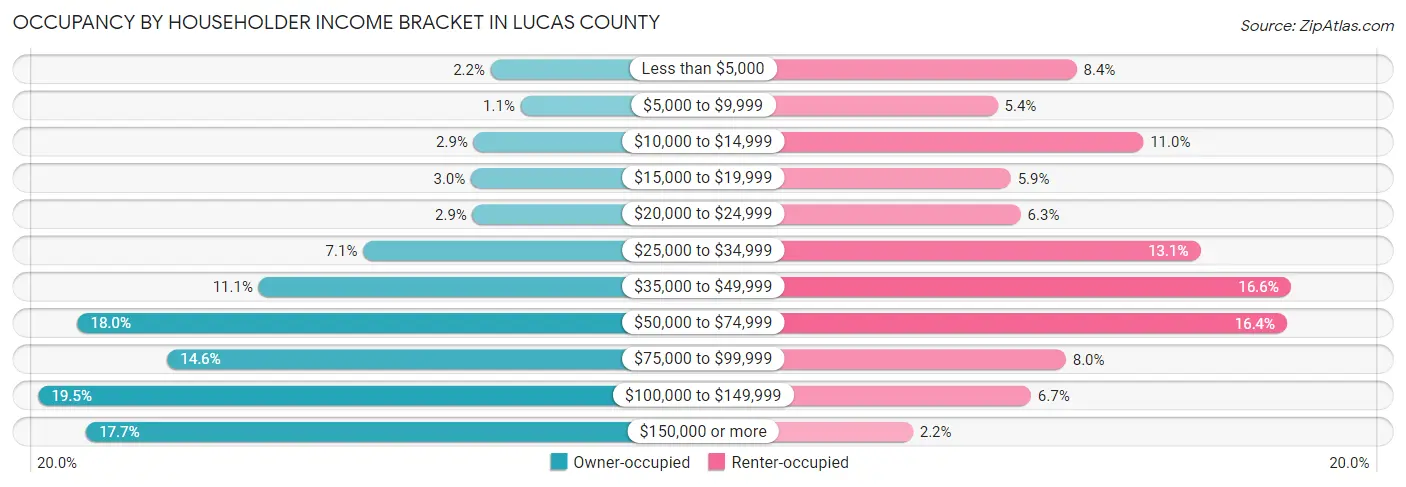
| Income Bracket | Owner-occupied | Renter-occupied |
| Less than $5,000 | 2,499 (2.2%) | 5,873 (8.4%) |
| $5,000 to $9,999 | 1,232 (1.1%) | 3,772 (5.4%) |
| $10,000 to $14,999 | 3,231 (2.9%) | 7,648 (11.0%) |
| $15,000 to $19,999 | 3,335 (3.0%) | 4,119 (5.9%) |
| $20,000 to $24,999 | 3,267 (2.9%) | 4,389 (6.3%) |
| $25,000 to $34,999 | 7,929 (7.1%) | 9,161 (13.1%) |
| $35,000 to $49,999 | 12,372 (11.1%) | 11,561 (16.6%) |
| $50,000 to $74,999 | 20,072 (18.0%) | 11,460 (16.4%) |
| $75,000 to $99,999 | 16,249 (14.6%) | 5,588 (8.0%) |
| $100,000 to $149,999 | 21,739 (19.5%) | 4,662 (6.7%) |
| $150,000 or more | 19,707 (17.6%) | 1,518 (2.2%) |
| Total | 111,632 (100.0%) | 69,751 (100.0%) |
Monthly Housing Cost Tiers in Lucas County
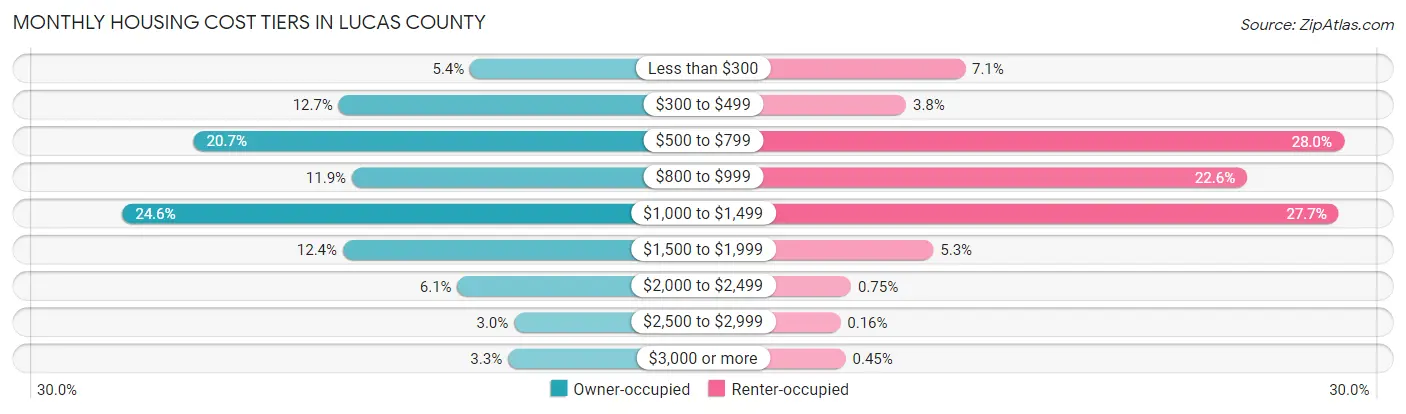
| Monthly Cost | Owner-occupied | Renter-occupied |
| Less than $300 | 6,012 (5.4%) | 4,918 (7.0%) |
| $300 to $499 | 14,123 (12.7%) | 2,641 (3.8%) |
| $500 to $799 | 23,071 (20.7%) | 19,512 (28.0%) |
| $800 to $999 | 13,306 (11.9%) | 15,779 (22.6%) |
| $1,000 to $1,499 | 27,466 (24.6%) | 19,309 (27.7%) |
| $1,500 to $1,999 | 13,866 (12.4%) | 3,697 (5.3%) |
| $2,000 to $2,499 | 6,796 (6.1%) | 520 (0.7%) |
| $2,500 to $2,999 | 3,308 (3.0%) | 112 (0.2%) |
| $3,000 or more | 3,684 (3.3%) | 316 (0.4%) |
| Total | 111,632 (100.0%) | 69,751 (100.0%) |
Physical Housing Characteristics in Lucas County
Housing Structures in Lucas County
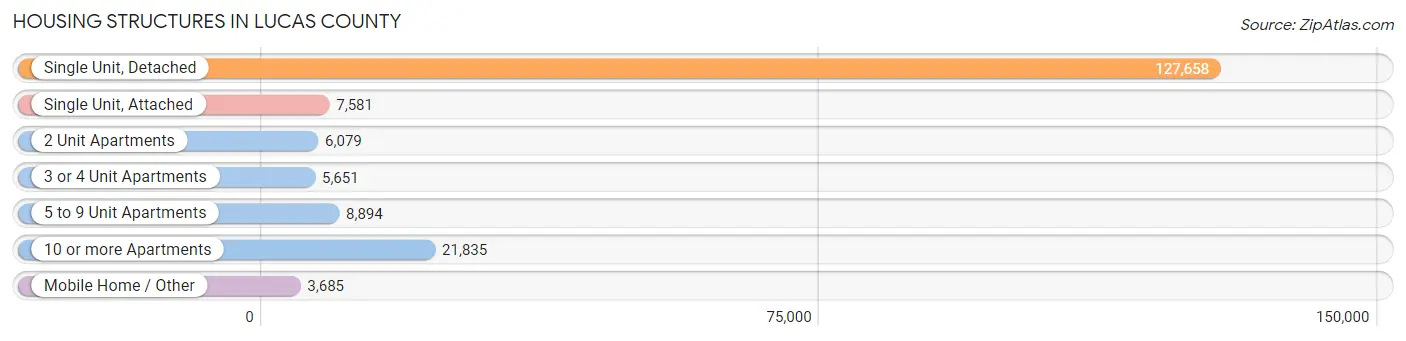
| Structure Type | # Housing Units | % Housing Units |
| Single Unit, Detached | 127,658 | 70.4% |
| Single Unit, Attached | 7,581 | 4.2% |
| 2 Unit Apartments | 6,079 | 3.4% |
| 3 or 4 Unit Apartments | 5,651 | 3.1% |
| 5 to 9 Unit Apartments | 8,894 | 4.9% |
| 10 or more Apartments | 21,835 | 12.0% |
| Mobile Home / Other | 3,685 | 2.0% |
| Total | 181,383 | 100.0% |
Housing Structures by Occupancy in Lucas County
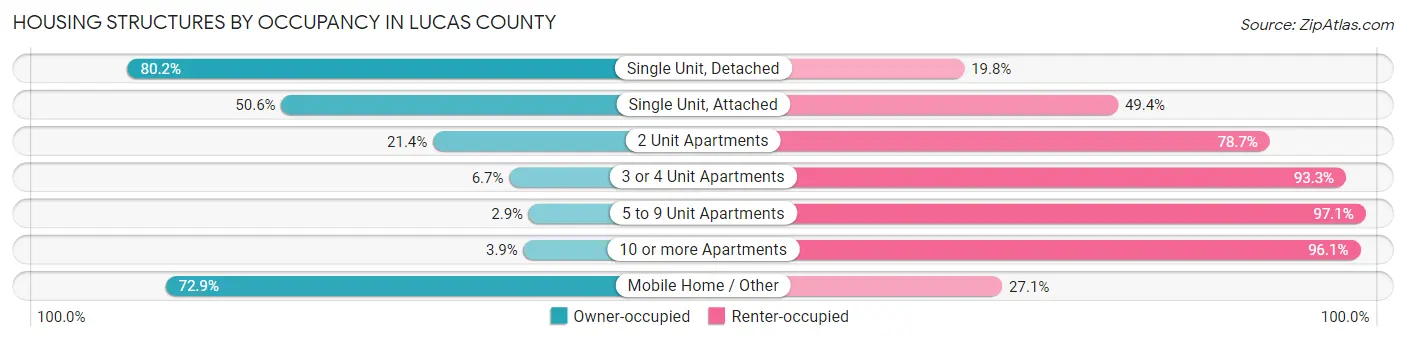
| Structure Type | Owner-occupied | Renter-occupied |
| Single Unit, Detached | 102,326 (80.2%) | 25,332 (19.8%) |
| Single Unit, Attached | 3,833 (50.6%) | 3,748 (49.4%) |
| 2 Unit Apartments | 1,298 (21.3%) | 4,781 (78.6%) |
| 3 or 4 Unit Apartments | 377 (6.7%) | 5,274 (93.3%) |
| 5 to 9 Unit Apartments | 258 (2.9%) | 8,636 (97.1%) |
| 10 or more Apartments | 855 (3.9%) | 20,980 (96.1%) |
| Mobile Home / Other | 2,685 (72.9%) | 1,000 (27.1%) |
| Total | 111,632 (61.5%) | 69,751 (38.5%) |
Housing Structures by Number of Rooms in Lucas County
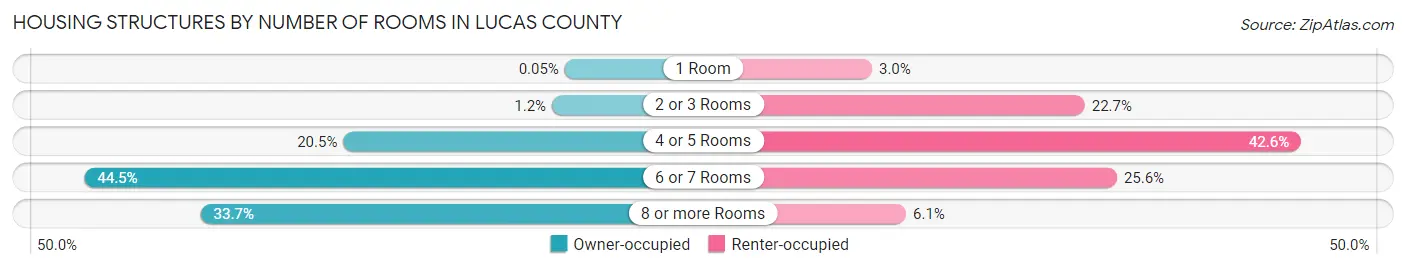
| Number of Rooms | Owner-occupied | Renter-occupied |
| 1 Room | 58 (0.1%) | 2,072 (3.0%) |
| 2 or 3 Rooms | 1,373 (1.2%) | 15,800 (22.7%) |
| 4 or 5 Rooms | 22,915 (20.5%) | 29,740 (42.6%) |
| 6 or 7 Rooms | 49,639 (44.5%) | 17,869 (25.6%) |
| 8 or more Rooms | 37,647 (33.7%) | 4,270 (6.1%) |
| Total | 111,632 (100.0%) | 69,751 (100.0%) |
Housing Structure by Heating Type in Lucas County
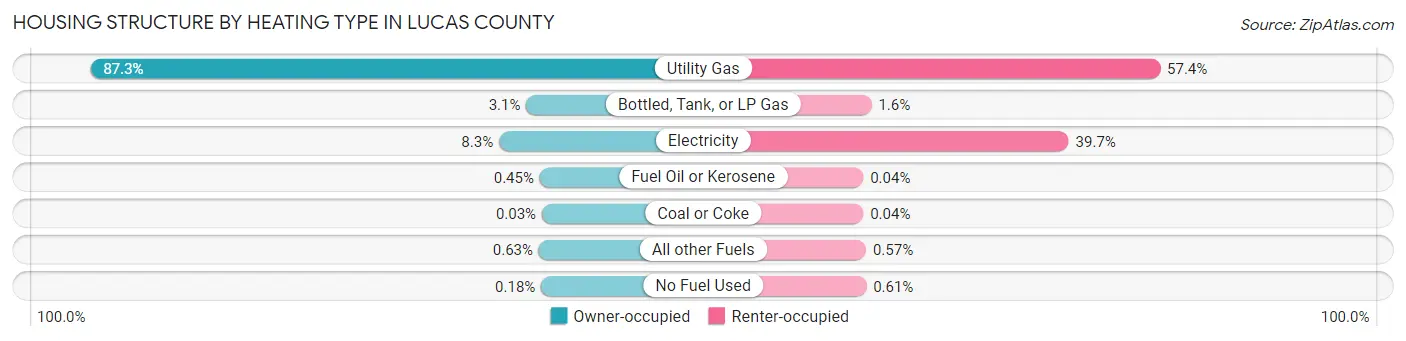
| Heating Type | Owner-occupied | Renter-occupied |
| Utility Gas | 97,476 (87.3%) | 40,039 (57.4%) |
| Bottled, Tank, or LP Gas | 3,415 (3.1%) | 1,129 (1.6%) |
| Electricity | 9,299 (8.3%) | 27,710 (39.7%) |
| Fuel Oil or Kerosene | 499 (0.4%) | 29 (0.0%) |
| Coal or Coke | 39 (0.0%) | 26 (0.0%) |
| All other Fuels | 705 (0.6%) | 396 (0.6%) |
| No Fuel Used | 199 (0.2%) | 422 (0.6%) |
| Total | 111,632 (100.0%) | 69,751 (100.0%) |
Household Vehicle Usage in Lucas County
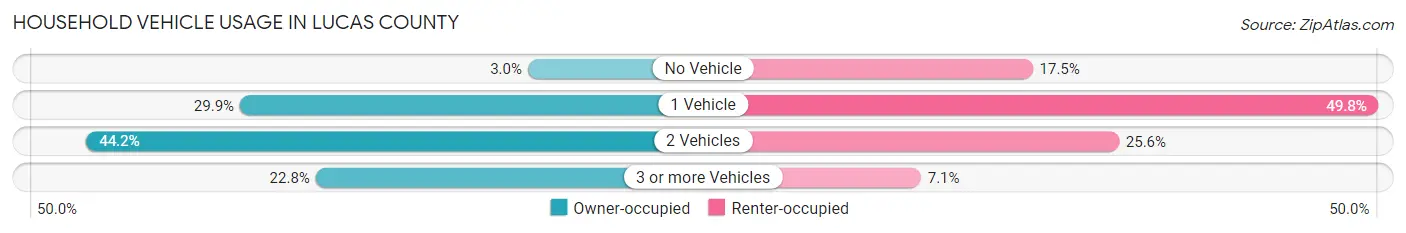
| Vehicles per Household | Owner-occupied | Renter-occupied |
| No Vehicle | 3,384 (3.0%) | 12,223 (17.5%) |
| 1 Vehicle | 33,376 (29.9%) | 34,750 (49.8%) |
| 2 Vehicles | 49,384 (44.2%) | 17,837 (25.6%) |
| 3 or more Vehicles | 25,488 (22.8%) | 4,941 (7.1%) |
| Total | 111,632 (100.0%) | 69,751 (100.0%) |
Real Estate & Mortgages in Lucas County
Real Estate and Mortgage Overview in Lucas County
| Characteristic | Without Mortgage | With Mortgage |
| Housing Units | 44,071 | 67,561 |
| Median Property Value | $118,200 | $157,700 |
| Median Household Income | $57,603 | $14,820 |
| Monthly Housing Costs | $540 | $3,494 |
| Real Estate Taxes | $2,158 | $1,668 |
Property Value by Mortgage Status in Lucas County
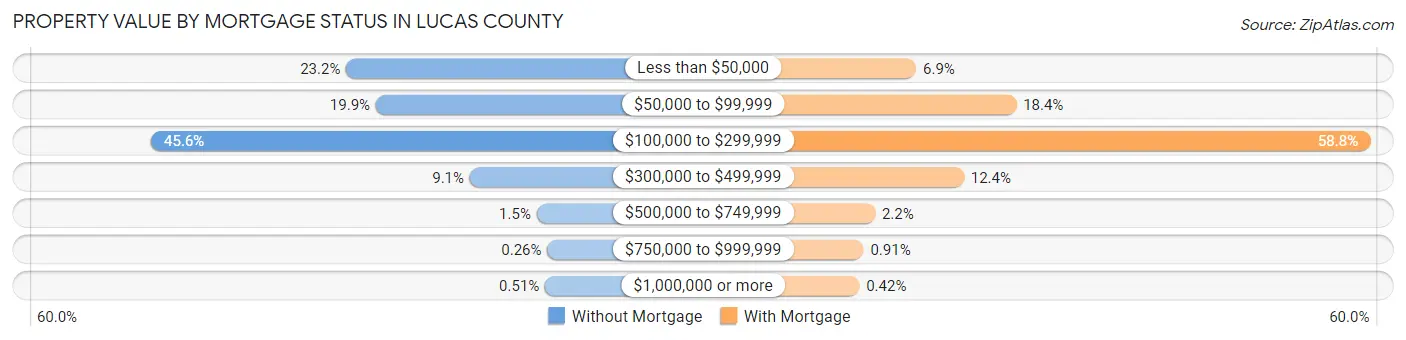
| Property Value | Without Mortgage | With Mortgage |
| Less than $50,000 | 10,241 (23.2%) | 4,674 (6.9%) |
| $50,000 to $99,999 | 8,750 (19.9%) | 12,407 (18.4%) |
| $100,000 to $299,999 | 20,078 (45.6%) | 39,721 (58.8%) |
| $300,000 to $499,999 | 4,015 (9.1%) | 8,359 (12.4%) |
| $500,000 to $749,999 | 649 (1.5%) | 1,498 (2.2%) |
| $750,000 to $999,999 | 113 (0.3%) | 616 (0.9%) |
| $1,000,000 or more | 225 (0.5%) | 286 (0.4%) |
| Total | 44,071 (100.0%) | 67,561 (100.0%) |
Household Income by Mortgage Status in Lucas County
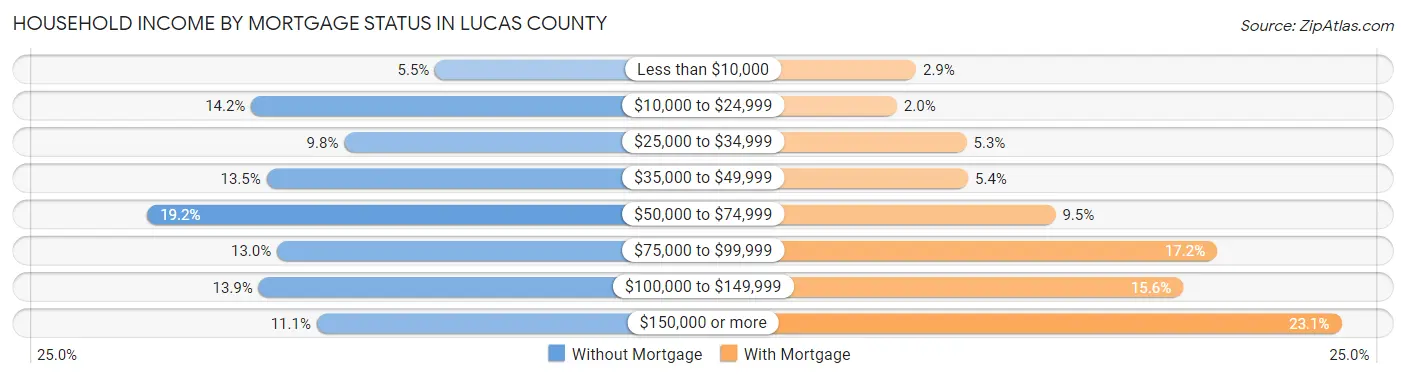
| Household Income | Without Mortgage | With Mortgage |
| Less than $10,000 | 2,402 (5.4%) | 1,946 (2.9%) |
| $10,000 to $24,999 | 6,262 (14.2%) | 1,329 (2.0%) |
| $25,000 to $34,999 | 4,310 (9.8%) | 3,571 (5.3%) |
| $35,000 to $49,999 | 5,939 (13.5%) | 3,619 (5.4%) |
| $50,000 to $74,999 | 8,442 (19.2%) | 6,433 (9.5%) |
| $75,000 to $99,999 | 5,719 (13.0%) | 11,630 (17.2%) |
| $100,000 to $149,999 | 6,110 (13.9%) | 10,530 (15.6%) |
| $150,000 or more | 4,887 (11.1%) | 15,629 (23.1%) |
| Total | 44,071 (100.0%) | 67,561 (100.0%) |
Property Value to Household Income Ratio in Lucas County
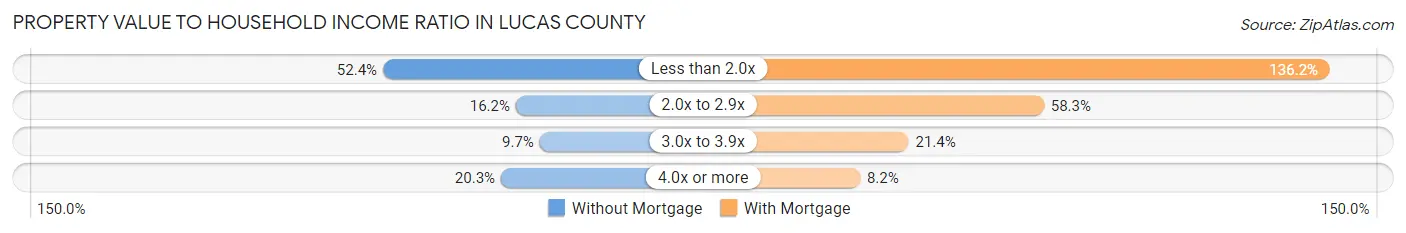
| Value-to-Income Ratio | Without Mortgage | With Mortgage |
| Less than 2.0x | 23,089 (52.4%) | 92,011 (136.2%) |
| 2.0x to 2.9x | 7,137 (16.2%) | 39,369 (58.3%) |
| 3.0x to 3.9x | 4,272 (9.7%) | 14,474 (21.4%) |
| 4.0x or more | 8,926 (20.3%) | 5,531 (8.2%) |
| Total | 44,071 (100.0%) | 67,561 (100.0%) |
Real Estate Taxes by Mortgage Status in Lucas County
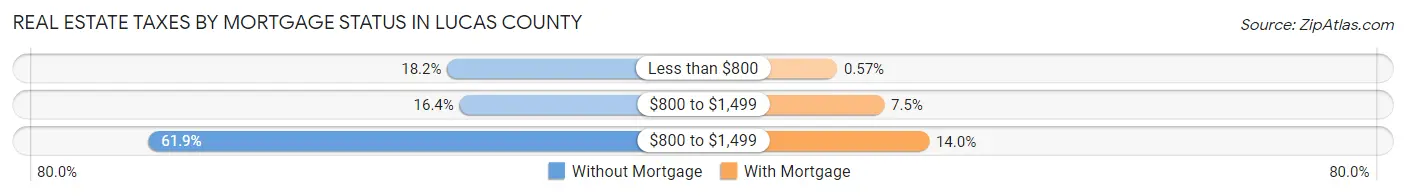
| Property Taxes | Without Mortgage | With Mortgage |
| Less than $800 | 8,039 (18.2%) | 385 (0.6%) |
| $800 to $1,499 | 7,245 (16.4%) | 5,042 (7.5%) |
| $800 to $1,499 | 27,284 (61.9%) | 9,474 (14.0%) |
| Total | 44,071 (100.0%) | 67,561 (100.0%) |
Health & Disability in Lucas County
Health Insurance Coverage by Age in Lucas County
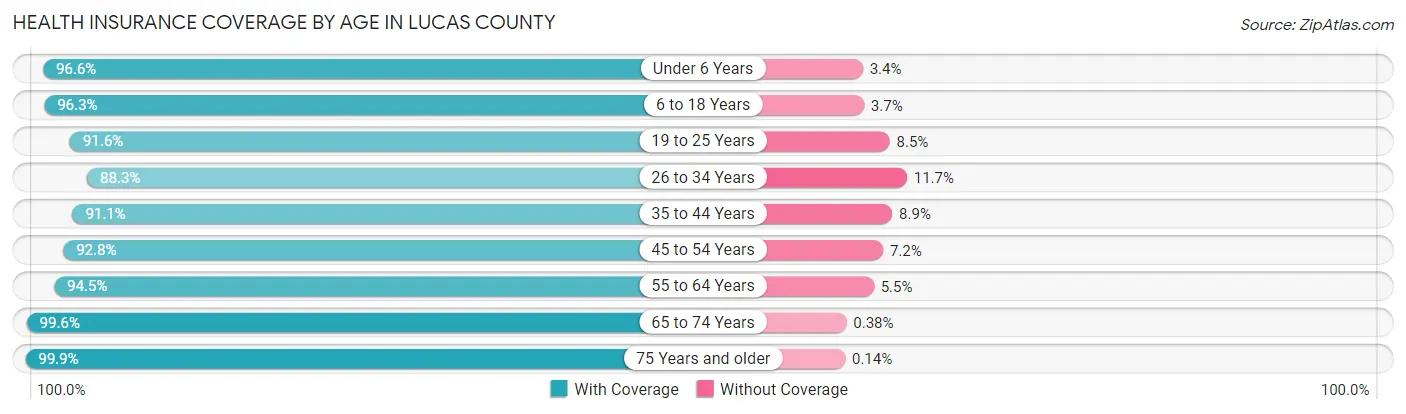
| Age Bracket | With Coverage | Without Coverage |
| Under 6 Years | 31,080 (96.6%) | 1,105 (3.4%) |
| 6 to 18 Years | 68,870 (96.3%) | 2,616 (3.7%) |
| 19 to 25 Years | 36,393 (91.5%) | 3,357 (8.5%) |
| 26 to 34 Years | 47,853 (88.3%) | 6,314 (11.7%) |
| 35 to 44 Years | 45,613 (91.1%) | 4,474 (8.9%) |
| 45 to 54 Years | 47,602 (92.8%) | 3,700 (7.2%) |
| 55 to 64 Years | 53,969 (94.5%) | 3,135 (5.5%) |
| 65 to 74 Years | 42,632 (99.6%) | 164 (0.4%) |
| 75 Years and older | 26,355 (99.9%) | 37 (0.1%) |
| Total | 400,367 (94.1%) | 24,902 (5.9%) |
Health Insurance Coverage by Citizenship Status in Lucas County
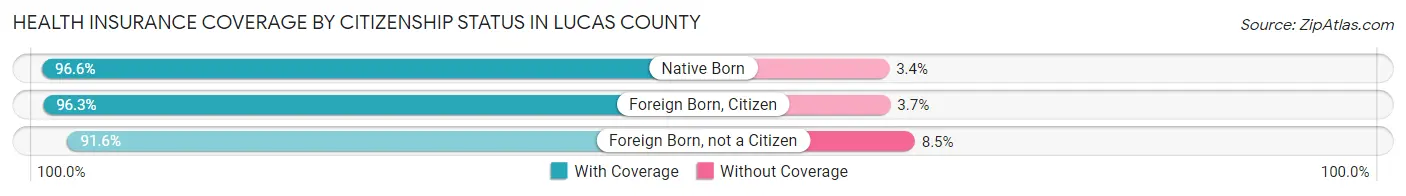
| Citizenship Status | With Coverage | Without Coverage |
| Native Born | 31,080 (96.6%) | 1,105 (3.4%) |
| Foreign Born, Citizen | 68,870 (96.3%) | 2,616 (3.7%) |
| Foreign Born, not a Citizen | 36,393 (91.5%) | 3,357 (8.5%) |
Health Insurance Coverage by Household Income in Lucas County
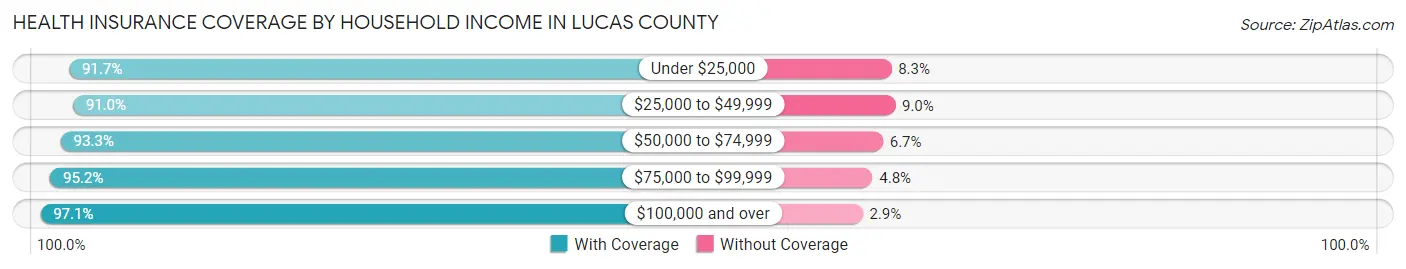
| Household Income | With Coverage | Without Coverage |
| Under $25,000 | 61,757 (91.7%) | 5,608 (8.3%) |
| $25,000 to $49,999 | 73,651 (91.0%) | 7,321 (9.0%) |
| $50,000 to $74,999 | 68,519 (93.3%) | 4,954 (6.7%) |
| $75,000 to $99,999 | 51,551 (95.2%) | 2,585 (4.8%) |
| $100,000 and over | 140,471 (97.1%) | 4,239 (2.9%) |
Public vs Private Health Insurance Coverage by Age in Lucas County
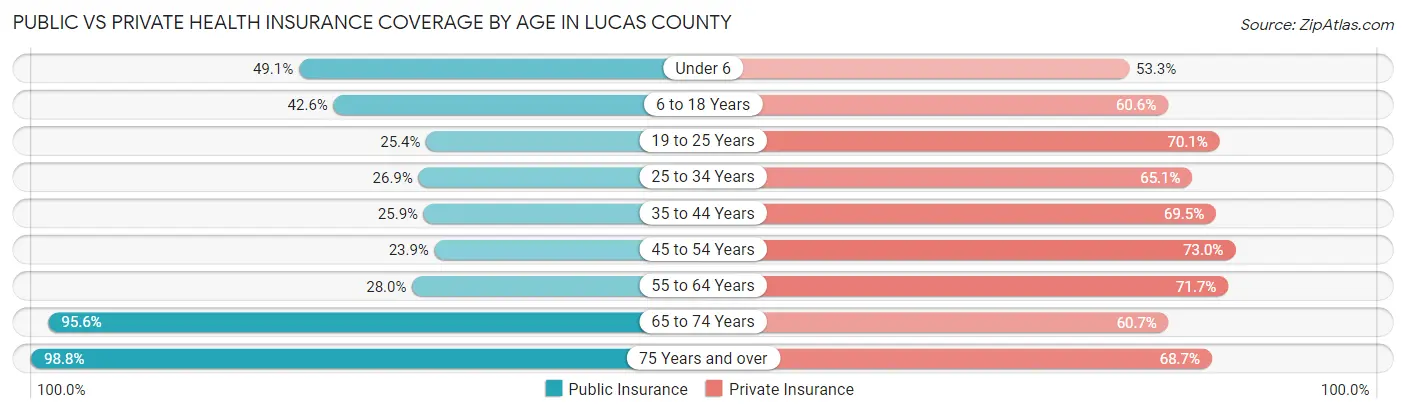
| Age Bracket | Public Insurance | Private Insurance |
| Under 6 | 15,793 (49.1%) | 17,159 (53.3%) |
| 6 to 18 Years | 30,477 (42.6%) | 43,293 (60.6%) |
| 19 to 25 Years | 10,112 (25.4%) | 27,874 (70.1%) |
| 25 to 34 Years | 14,555 (26.9%) | 35,237 (65.0%) |
| 35 to 44 Years | 12,961 (25.9%) | 34,789 (69.5%) |
| 45 to 54 Years | 12,251 (23.9%) | 37,454 (73.0%) |
| 55 to 64 Years | 16,012 (28.0%) | 40,952 (71.7%) |
| 65 to 74 Years | 40,900 (95.6%) | 25,963 (60.7%) |
| 75 Years and over | 26,074 (98.8%) | 18,124 (68.7%) |
| Total | 179,135 (42.1%) | 280,845 (66.0%) |
Disability Status by Sex by Age in Lucas County
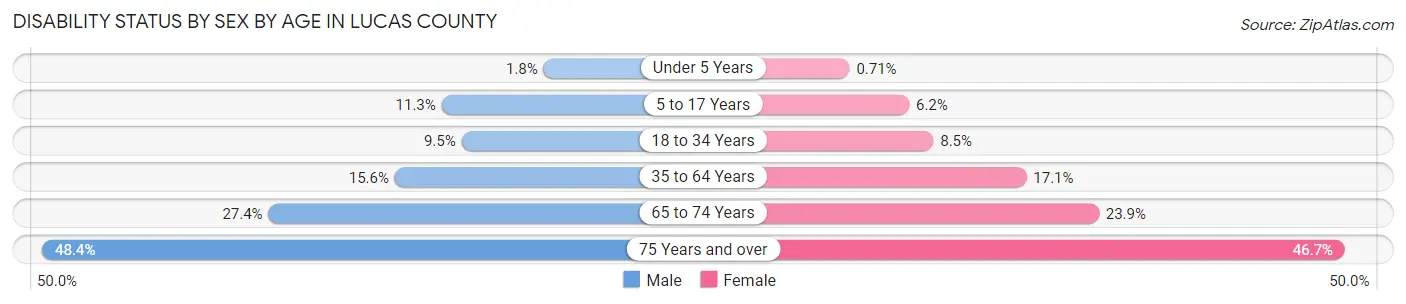
| Age Bracket | Male | Female |
| Under 5 Years | 249 (1.8%) | 91 (0.7%) |
| 5 to 17 Years | 4,139 (11.3%) | 2,194 (6.2%) |
| 18 to 34 Years | 4,656 (9.5%) | 4,258 (8.5%) |
| 35 to 64 Years | 12,048 (15.6%) | 13,955 (17.1%) |
| 65 to 74 Years | 5,467 (27.4%) | 5,443 (23.8%) |
| 75 Years and over | 5,096 (48.4%) | 7,403 (46.7%) |
Disability Class by Sex by Age in Lucas County
Disability Class: Hearing Difficulty
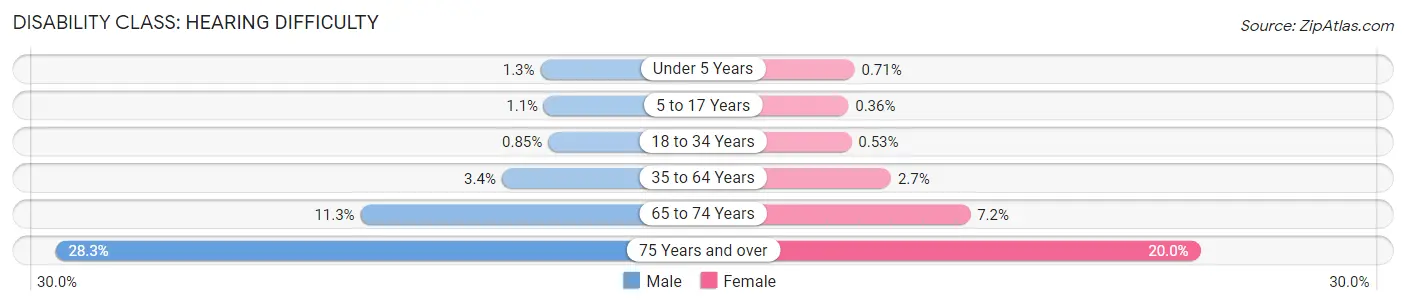
| Age Bracket | Male | Female |
| Under 5 Years | 173 (1.3%) | 91 (0.7%) |
| 5 to 17 Years | 395 (1.1%) | 128 (0.4%) |
| 18 to 34 Years | 421 (0.9%) | 267 (0.5%) |
| 35 to 64 Years | 2,645 (3.4%) | 2,232 (2.7%) |
| 65 to 74 Years | 2,257 (11.3%) | 1,632 (7.1%) |
| 75 Years and over | 2,979 (28.3%) | 3,166 (20.0%) |
Disability Class: Vision Difficulty
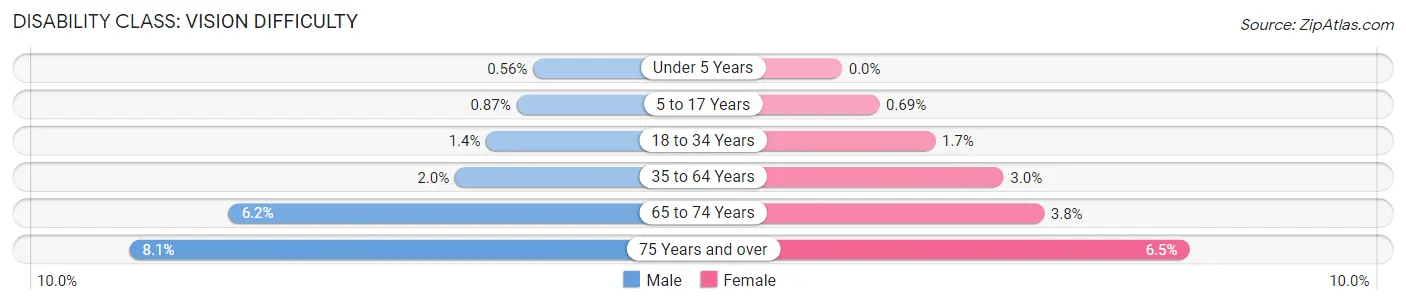
| Age Bracket | Male | Female |
| Under 5 Years | 76 (0.6%) | 0 (0.0%) |
| 5 to 17 Years | 317 (0.9%) | 241 (0.7%) |
| 18 to 34 Years | 702 (1.4%) | 866 (1.7%) |
| 35 to 64 Years | 1,548 (2.0%) | 2,442 (3.0%) |
| 65 to 74 Years | 1,241 (6.2%) | 856 (3.7%) |
| 75 Years and over | 848 (8.1%) | 1,022 (6.5%) |
Disability Class: Cognitive Difficulty
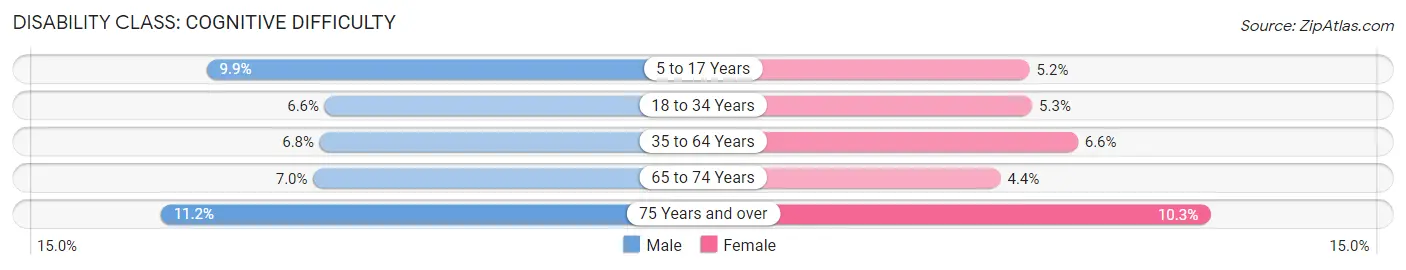
| Age Bracket | Male | Female |
| 5 to 17 Years | 3,636 (9.9%) | 1,841 (5.2%) |
| 18 to 34 Years | 3,271 (6.6%) | 2,659 (5.3%) |
| 35 to 64 Years | 5,219 (6.8%) | 5,353 (6.6%) |
| 65 to 74 Years | 1,391 (7.0%) | 1,009 (4.4%) |
| 75 Years and over | 1,181 (11.2%) | 1,625 (10.2%) |
Disability Class: Ambulatory Difficulty
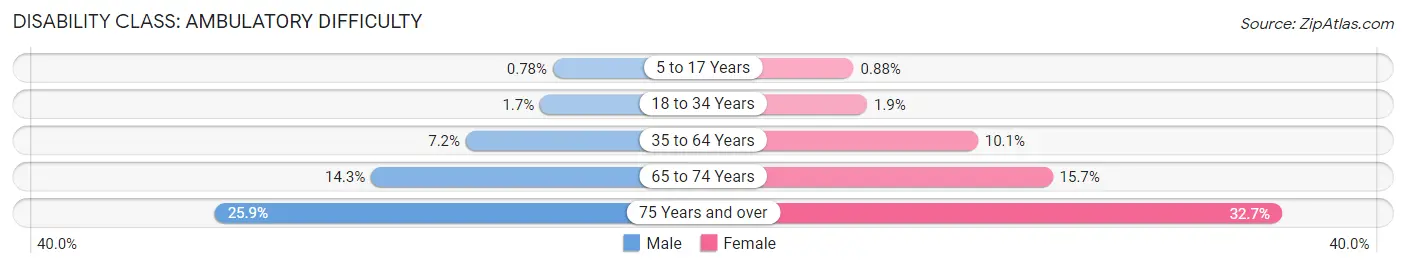
| Age Bracket | Male | Female |
| 5 to 17 Years | 285 (0.8%) | 308 (0.9%) |
| 18 to 34 Years | 851 (1.7%) | 936 (1.9%) |
| 35 to 64 Years | 5,574 (7.2%) | 8,225 (10.1%) |
| 65 to 74 Years | 2,852 (14.3%) | 3,571 (15.7%) |
| 75 Years and over | 2,726 (25.9%) | 5,179 (32.7%) |
Disability Class: Self-Care Difficulty
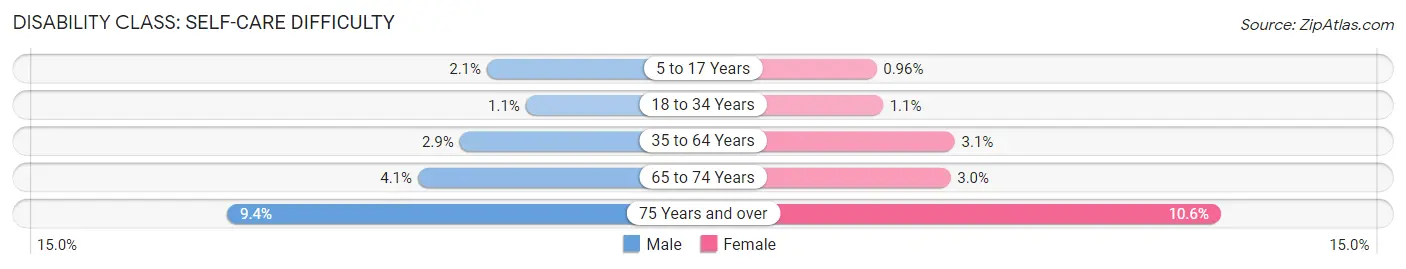
| Age Bracket | Male | Female |
| 5 to 17 Years | 781 (2.1%) | 337 (1.0%) |
| 18 to 34 Years | 516 (1.1%) | 572 (1.1%) |
| 35 to 64 Years | 2,226 (2.9%) | 2,554 (3.1%) |
| 65 to 74 Years | 809 (4.1%) | 689 (3.0%) |
| 75 Years and over | 986 (9.4%) | 1,673 (10.5%) |
Technology Access in Lucas County
Computing Device Access in Lucas County
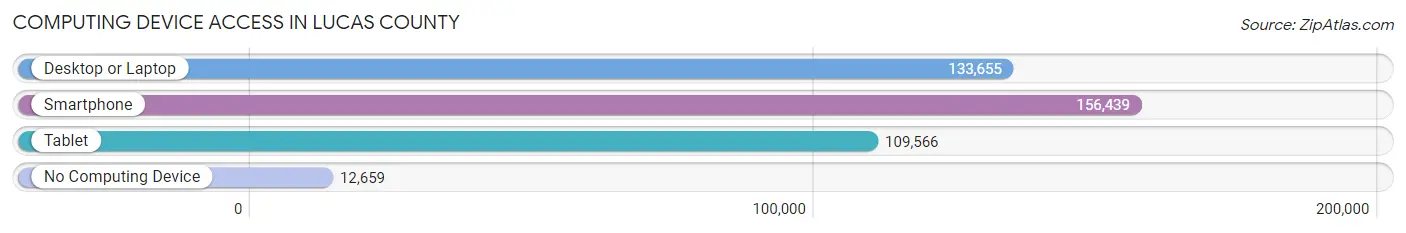
| Device Type | # Households | % Households |
| Desktop or Laptop | 133,655 | 73.7% |
| Smartphone | 156,439 | 86.3% |
| Tablet | 109,566 | 60.4% |
| No Computing Device | 12,659 | 7.0% |
| Total | 181,383 | 100.0% |
Internet Access in Lucas County
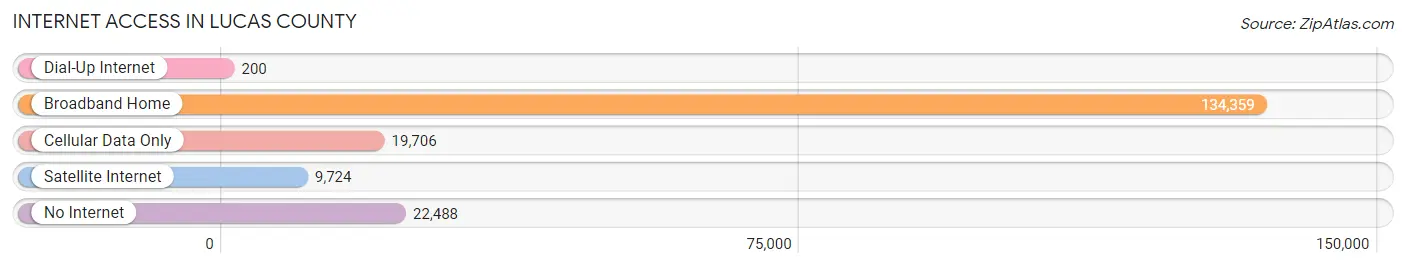
| Internet Type | # Households | % Households |
| Dial-Up Internet | 200 | 0.1% |
| Broadband Home | 134,359 | 74.1% |
| Cellular Data Only | 19,706 | 10.9% |
| Satellite Internet | 9,724 | 5.4% |
| No Internet | 22,488 | 12.4% |
| Total | 181,383 | 100.0% |
Lucas County Summary
Lucas County, Ohio is located in the northwest corner of the state and is part of the Toledo Metropolitan Statistical Area. It is bordered by Fulton County to the north, Wood County to the east, and the state of Michigan to the west. The county seat is Toledo, the fourth largest city in Ohio. The county was named after Robert Lucas, the 12th governor of Ohio.
Geography
Lucas County covers an area of 576 square miles and is the fourth largest county in Ohio. It is located in the Great Black Swamp region of the state and is mostly flat with some rolling hills. The Maumee River runs through the county and is a major source of recreation and commerce. The county is also home to several lakes, including Lake Erie, which forms the western border of the county.
The climate of Lucas County is humid continental, with hot summers and cold winters. The average annual temperature is around 50°F, and the average annual precipitation is around 36 inches.
Demographics
As of the 2010 census, Lucas County had a population of 441,815. The population was spread out with 24.3% under the age of 18, 10.2% from 18 to 24, 28.2% from 25 to 44, 22.7% from 45 to 64, and 14.6% who were 65 years of age or older. The median age was 36.4 years.
The racial makeup of the county was 79.2% White, 15.2% African American, 0.4% Native American, 1.7% Asian, 0.1% Pacific Islander, 1.2% from other races, and 2.2% from two or more races. Hispanic or Latino of any race were 4.2% of the population.
Economy
Lucas County has a diverse economy, with a mix of manufacturing, services, and retail. The county is home to several major employers, including ProMedica, Owens Corning, and the University of Toledo. The county is also home to several major shopping centers, including Westfield Franklin Park and the Shops at Fallen Timbers.
The county has a strong agricultural sector, with corn, soybeans, and wheat being the major crops. The county is also home to several wineries and breweries, as well as a growing craft beer industry.
The median household income in Lucas County was $45,845 in 2019, and the median home value was $128,400. The unemployment rate was 4.2% in 2019.
Conclusion
Lucas County is a diverse and vibrant county located in the northwest corner of Ohio. It is home to a mix of industries, including manufacturing, services, and retail, as well as a strong agricultural sector. The county has a population of 441,815 and a median household income of $45,845. The unemployment rate is 4.2%, and the median home value is $128,400. Lucas County is a great place to live, work, and play.
Common Questions
What is the Total Population of Lucas County?
Total Population of Lucas County is 430,014.
What is the Total Male Population of Lucas County?
Total Male Population of Lucas County is 209,528.
What is the Total Female Population of Lucas County?
Total Female Population of Lucas County is 220,486.
What is the Ratio of Males per 100 Females in Lucas County?
There are 95.03 Males per 100 Females in Lucas County.
What is the Ratio of Females per 100 Males in Lucas County?
There are 105.23 Females per 100 Males in Lucas County.
What is the Median Population Age in Lucas County?
Median Population Age in Lucas County is 38.1 Years.
What is the Average Family Size in Lucas County
Average Family Size in Lucas County is 3.0 People.
What is the Average Household Size in Lucas County
Average Household Size in Lucas County is 2.3 People.
What is Per Capita Income in Lucas County?
Per Capita income in Lucas County is $34,399.
What is the Median Family Income in Lucas County?
Median Family Income in Lucas County is $76,089.
What is the Median Household income in Lucas County?
Median Household Income in Lucas County is $57,265.
What is Income or Wage Gap in Lucas County?
Income or Wage Gap in Lucas County is 24.1%.
Women in Lucas County earn 75.9 cents for every dollar earned by a man.
What is Family Income Deficit in Lucas County?
Family Income Deficit in Lucas County is $12,229.
Families that are below poverty line in Lucas County earn $12,229 less on average than the poverty threshold level.
What is Inequality or Gini Index in Lucas County?
Inequality or Gini Index in Lucas County is 0.49.
How Large is the Labor Force in Lucas County?
There are 216,123 People in the Labor Forcein in Lucas County.
What is the Percentage of People in the Labor Force in Lucas County?
63.0% of People are in the Labor Force in Lucas County.
What is the Unemployment Rate in Lucas County?
Unemployment Rate in Lucas County is 6.8%.