Lorain County, OH
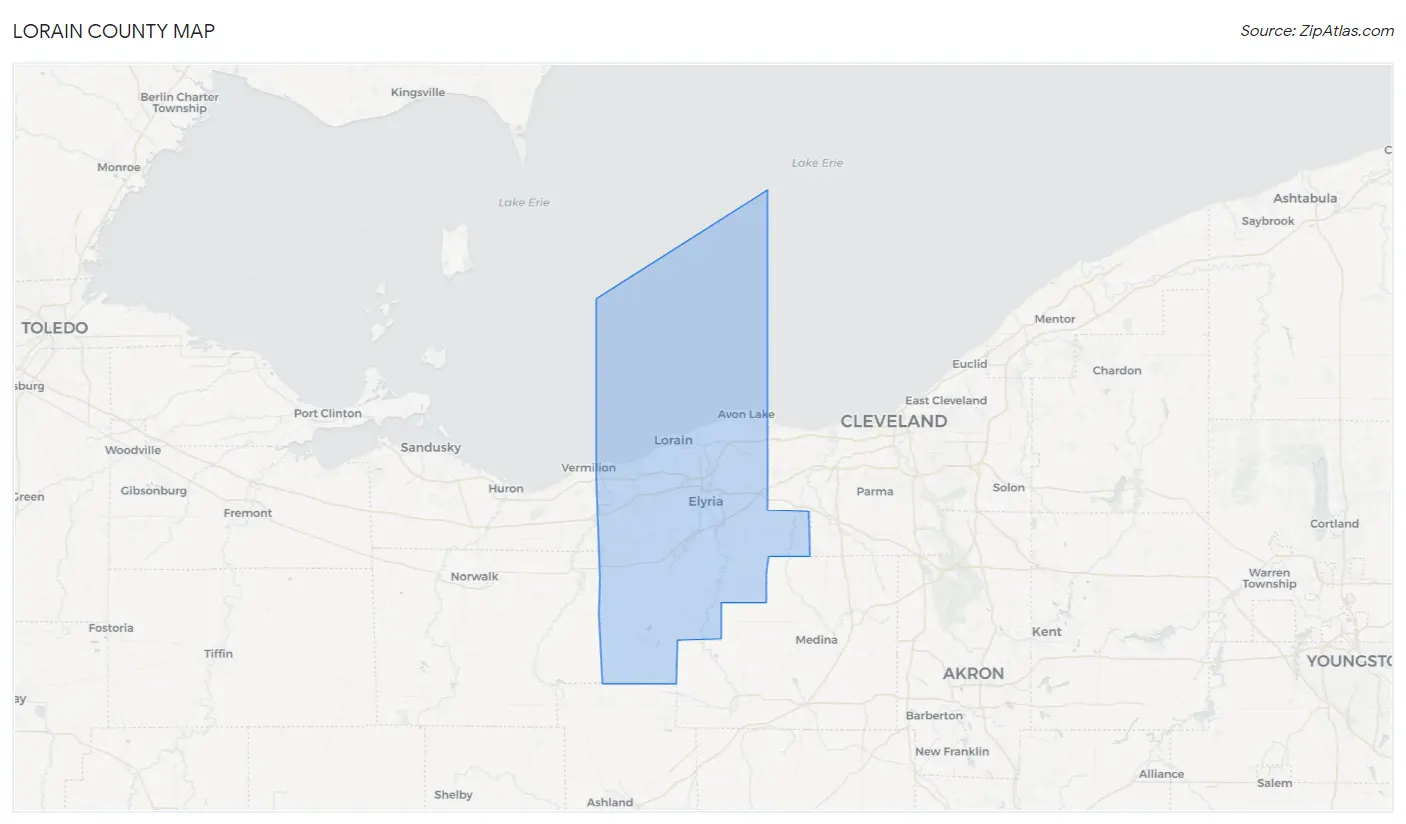
Lorain County Map
Lorain County Overview
313,101
TOTAL POPULATION
155,272
MALE POPULATION
157,829
FEMALE POPULATION
98.38
MALES / 100 FEMALES
101.65
FEMALES / 100 MALES
41.9
MEDIAN AGE
3.1
AVG FAMILY SIZE
2.5
AVG HOUSEHOLD SIZE
$37,171
PER CAPITA INCOME
$88,934
AVG FAMILY INCOME
$67,272
AVG HOUSEHOLD INCOME
30.7%
WAGE / INCOME GAP [ % ]
69.3¢/ $1
WAGE / INCOME GAP [ $ ]
$11,390
FAMILY INCOME DEFICIT
0.46
INEQUALITY / GINI INDEX
153,542
LABOR FORCE [ PEOPLE ]
60.6%
PERCENT IN LABOR FORCE
4.4%
UNEMPLOYMENT RATE
Lorain County Area Codes
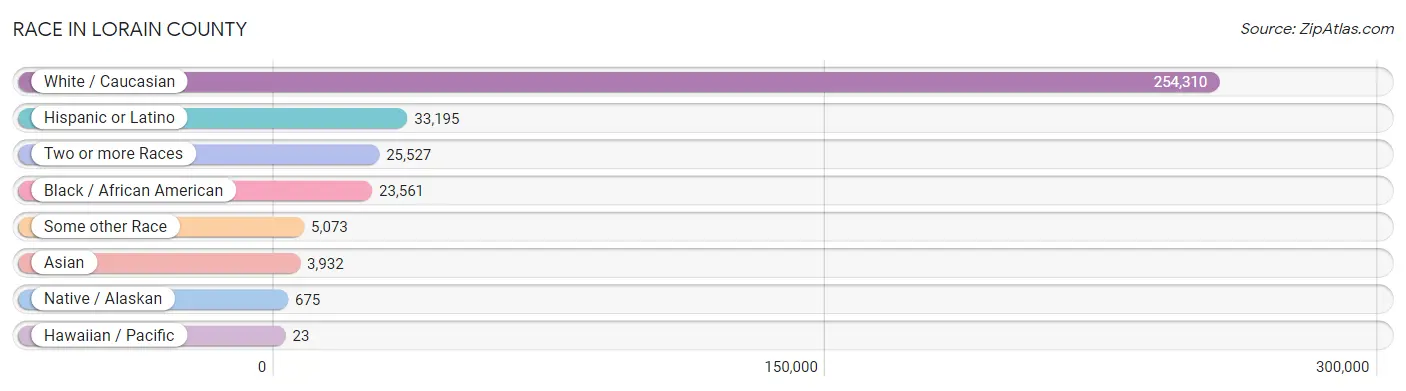
Race in Lorain County
The most populous races in Lorain County are White / Caucasian (254,310 | 81.2%), Hispanic or Latino (33,195 | 10.6%), and Two or more Races (25,527 | 8.2%).
| Race | # Population | % Population |
| Asian | 3,932 | 1.3% |
| Black / African American | 23,561 | 7.5% |
| Hawaiian / Pacific | 23 | 0.0% |
| Hispanic or Latino | 33,195 | 10.6% |
| Native / Alaskan | 675 | 0.2% |
| White / Caucasian | 254,310 | 81.2% |
| Two or more Races | 25,527 | 8.2% |
| Some other Race | 5,073 | 1.6% |
| Total | 313,101 | 100.0% |
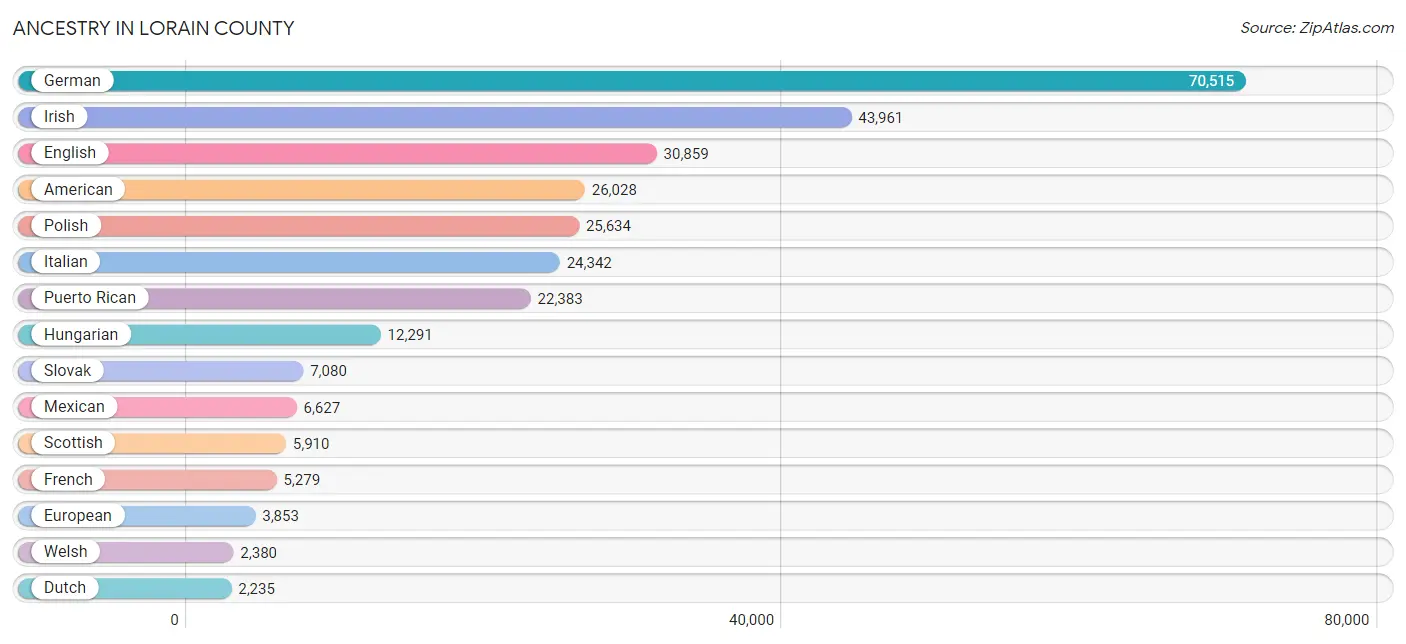
Ancestry in Lorain County
The most populous ancestries reported in Lorain County are German (70,515 | 22.5%), Irish (43,961 | 14.0%), English (30,859 | 9.9%), American (26,028 | 8.3%), and Polish (25,634 | 8.2%), together accounting for 62.9% of all Lorain County residents.
| Ancestry | # Population | % Population |
| Afghan | 6 | 0.0% |
| African | 1,155 | 0.4% |
| Albanian | 110 | 0.0% |
| American | 26,028 | 8.3% |
| Apache | 2 | 0.0% |
| Arab | 1,847 | 0.6% |
| Argentinean | 60 | 0.0% |
| Armenian | 68 | 0.0% |
| Australian | 54 | 0.0% |
| Austrian | 543 | 0.2% |
| Bahamian | 134 | 0.0% |
| Belgian | 202 | 0.1% |
| Bhutanese | 460 | 0.2% |
| Blackfeet | 598 | 0.2% |
| Brazilian | 54 | 0.0% |
| British | 1,183 | 0.4% |
| British West Indian | 5 | 0.0% |
| Bulgarian | 204 | 0.1% |
| Burmese | 407 | 0.1% |
| Canadian | 416 | 0.1% |
| Carpatho Rusyn | 18 | 0.0% |
| Celtic | 10 | 0.0% |
| Central American | 928 | 0.3% |
| Central American Indian | 704 | 0.2% |
| Cherokee | 1,427 | 0.5% |
| Chilean | 29 | 0.0% |
| Choctaw | 73 | 0.0% |
| Colombian | 296 | 0.1% |
| Costa Rican | 208 | 0.1% |
| Creek | 38 | 0.0% |
| Croatian | 1,913 | 0.6% |
| Crow | 10 | 0.0% |
| Cuban | 556 | 0.2% |
| Cypriot | 56 | 0.0% |
| Czech | 1,996 | 0.6% |
| Czechoslovakian | 980 | 0.3% |
| Danish | 448 | 0.1% |
| Dominican | 95 | 0.0% |
| Dutch | 2,235 | 0.7% |
| Eastern European | 1,896 | 0.6% |
| Ecuadorian | 37 | 0.0% |
| Egyptian | 92 | 0.0% |
| English | 30,859 | 9.9% |
| Estonian | 8 | 0.0% |
| Ethiopian | 31 | 0.0% |
| European | 3,853 | 1.2% |
| Filipino | 42 | 0.0% |
| Finnish | 459 | 0.2% |
| French | 5,279 | 1.7% |
| French American Indian | 19 | 0.0% |
| French Canadian | 716 | 0.2% |
| German | 70,515 | 22.5% |
| Greek | 1,407 | 0.4% |
| Guamanian / Chamorro | 30 | 0.0% |
| Guatemalan | 81 | 0.0% |
| Guyanese | 67 | 0.0% |
| Haitian | 23 | 0.0% |
| Honduran | 195 | 0.1% |
| Hopi | 26 | 0.0% |
| Hungarian | 12,291 | 3.9% |
| Indian (Asian) | 1,167 | 0.4% |
| Indonesian | 43 | 0.0% |
| Iranian | 60 | 0.0% |
| Iraqi | 17 | 0.0% |
| Irish | 43,961 | 14.0% |
| Iroquois | 59 | 0.0% |
| Italian | 24,342 | 7.8% |
| Jamaican | 52 | 0.0% |
| Japanese | 26 | 0.0% |
| Jordanian | 30 | 0.0% |
| Kenyan | 16 | 0.0% |
| Korean | 1,035 | 0.3% |
| Laotian | 47 | 0.0% |
| Latvian | 106 | 0.0% |
| Lebanese | 1,024 | 0.3% |
| Liberian | 6 | 0.0% |
| Lithuanian | 615 | 0.2% |
| Macedonian | 331 | 0.1% |
| Malaysian | 131 | 0.0% |
| Mexican | 6,627 | 2.1% |
| Mexican American Indian | 56 | 0.0% |
| Moroccan | 4 | 0.0% |
| Native Hawaiian | 57 | 0.0% |
| Navajo | 17 | 0.0% |
| Nigerian | 163 | 0.1% |
| Northern European | 302 | 0.1% |
| Norwegian | 980 | 0.3% |
| Osage | 38 | 0.0% |
| Ottawa | 6 | 0.0% |
| Pakistani | 219 | 0.1% |
| Palestinian | 186 | 0.1% |
| Panamanian | 50 | 0.0% |
| Pennsylvania German | 237 | 0.1% |
| Peruvian | 88 | 0.0% |
| Polish | 25,634 | 8.2% |
| Portuguese | 443 | 0.1% |
| Potawatomi | 10 | 0.0% |
| Pueblo | 6 | 0.0% |
| Puerto Rican | 22,383 | 7.1% |
| Romanian | 810 | 0.3% |
| Russian | 1,896 | 0.6% |
| Salvadoran | 394 | 0.1% |
| Samoan | 77 | 0.0% |
| Scandinavian | 336 | 0.1% |
| Scotch-Irish | 2,181 | 0.7% |
| Scottish | 5,910 | 1.9% |
| Serbian | 540 | 0.2% |
| Shoshone | 4 | 0.0% |
| Sioux | 6 | 0.0% |
| Slavic | 273 | 0.1% |
| Slovak | 7,080 | 2.3% |
| Slovene | 2,045 | 0.6% |
| Somali | 25 | 0.0% |
| South African | 7 | 0.0% |
| South American | 853 | 0.3% |
| Spaniard | 927 | 0.3% |
| Spanish | 385 | 0.1% |
| Spanish American | 22 | 0.0% |
| Sri Lankan | 246 | 0.1% |
| Subsaharan African | 1,436 | 0.5% |
| Sudanese | 6 | 0.0% |
| Swedish | 1,390 | 0.4% |
| Swiss | 780 | 0.3% |
| Syrian | 190 | 0.1% |
| Thai | 1,805 | 0.6% |
| Turkish | 139 | 0.0% |
| Ukrainian | 1,609 | 0.5% |
| Uruguayan | 13 | 0.0% |
| Venezuelan | 330 | 0.1% |
| Welsh | 2,380 | 0.8% |
| West Indian | 142 | 0.1% |
| Yaqui | 17 | 0.0% |
| Yugoslavian | 206 | 0.1% | View All 133 Rows |
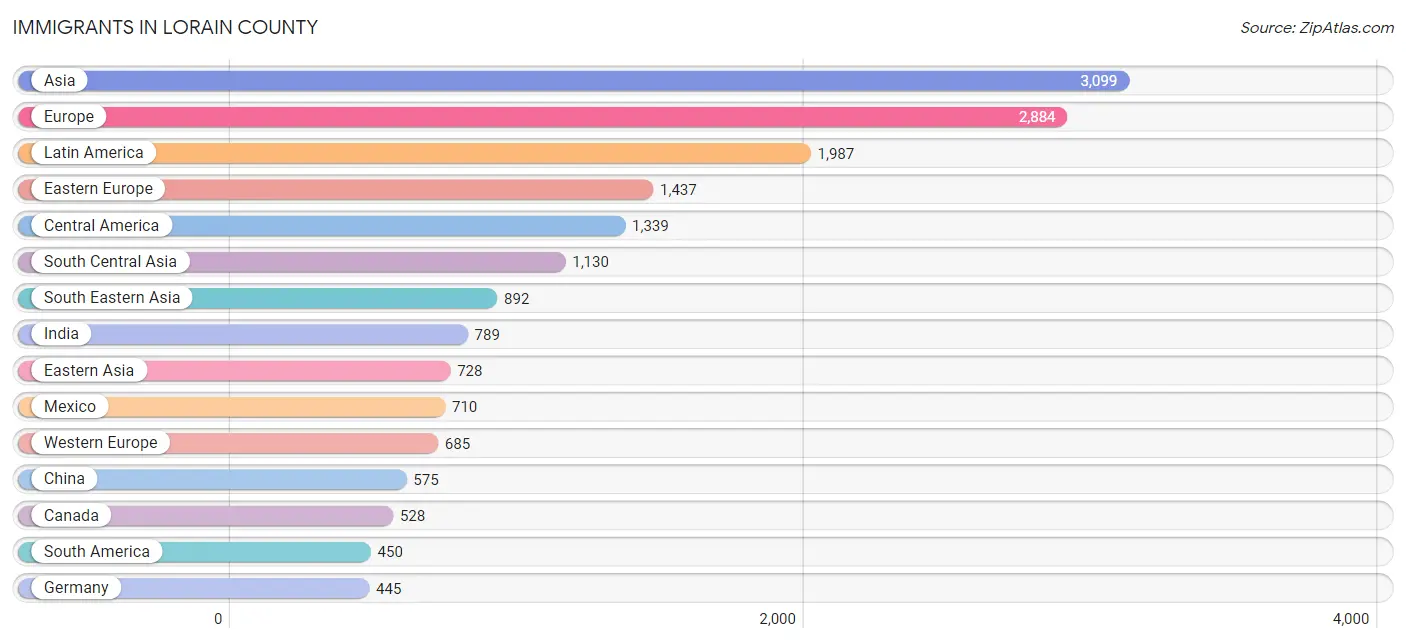
Immigrants in Lorain County
The most numerous immigrant groups reported in Lorain County came from Asia (3,099 | 1.0%), Europe (2,884 | 0.9%), Latin America (1,987 | 0.6%), Eastern Europe (1,437 | 0.5%), and Central America (1,339 | 0.4%), together accounting for 3.4% of all Lorain County residents.
| Immigration Origin | # Population | % Population |
| Afghanistan | 6 | 0.0% |
| Africa | 241 | 0.1% |
| Argentina | 33 | 0.0% |
| Armenia | 20 | 0.0% |
| Asia | 3,099 | 1.0% |
| Australia | 28 | 0.0% |
| Austria | 152 | 0.1% |
| Bangladesh | 194 | 0.1% |
| Belgium | 5 | 0.0% |
| Bosnia and Herzegovina | 31 | 0.0% |
| Brazil | 29 | 0.0% |
| Bulgaria | 63 | 0.0% |
| Cambodia | 94 | 0.0% |
| Canada | 528 | 0.2% |
| Caribbean | 198 | 0.1% |
| Central America | 1,339 | 0.4% |
| Chile | 11 | 0.0% |
| China | 575 | 0.2% |
| Colombia | 44 | 0.0% |
| Congo | 28 | 0.0% |
| Costa Rica | 126 | 0.0% |
| Croatia | 103 | 0.0% |
| Cuba | 65 | 0.0% |
| Czechoslovakia | 54 | 0.0% |
| Denmark | 31 | 0.0% |
| Dominican Republic | 55 | 0.0% |
| Eastern Africa | 80 | 0.0% |
| Eastern Asia | 728 | 0.2% |
| Eastern Europe | 1,437 | 0.5% |
| Ecuador | 37 | 0.0% |
| Egypt | 54 | 0.0% |
| El Salvador | 178 | 0.1% |
| England | 153 | 0.1% |
| Ethiopia | 29 | 0.0% |
| Europe | 2,884 | 0.9% |
| France | 46 | 0.0% |
| Germany | 445 | 0.1% |
| Ghana | 14 | 0.0% |
| Greece | 56 | 0.0% |
| Guatemala | 73 | 0.0% |
| Guyana | 8 | 0.0% |
| Haiti | 14 | 0.0% |
| Honduras | 178 | 0.1% |
| Hong Kong | 20 | 0.0% |
| Hungary | 181 | 0.1% |
| India | 789 | 0.3% |
| Indonesia | 18 | 0.0% |
| Iran | 23 | 0.0% |
| Ireland | 58 | 0.0% |
| Israel | 10 | 0.0% |
| Italy | 215 | 0.1% |
| Jamaica | 45 | 0.0% |
| Japan | 37 | 0.0% |
| Jordan | 10 | 0.0% |
| Kazakhstan | 15 | 0.0% |
| Kenya | 23 | 0.0% |
| Korea | 116 | 0.0% |
| Kuwait | 12 | 0.0% |
| Laos | 61 | 0.0% |
| Latin America | 1,987 | 0.6% |
| Lebanon | 155 | 0.1% |
| Liberia | 6 | 0.0% |
| Malaysia | 60 | 0.0% |
| Mexico | 710 | 0.2% |
| Middle Africa | 28 | 0.0% |
| Nepal | 38 | 0.0% |
| Netherlands | 27 | 0.0% |
| Nicaragua | 59 | 0.0% |
| Nigeria | 41 | 0.0% |
| North Macedonia | 22 | 0.0% |
| Northern Africa | 54 | 0.0% |
| Northern Europe | 399 | 0.1% |
| Norway | 23 | 0.0% |
| Oceania | 28 | 0.0% |
| Pakistan | 22 | 0.0% |
| Panama | 15 | 0.0% |
| Peru | 55 | 0.0% |
| Philippines | 391 | 0.1% |
| Poland | 196 | 0.1% |
| Portugal | 5 | 0.0% |
| Romania | 191 | 0.1% |
| Russia | 225 | 0.1% |
| Saudi Arabia | 34 | 0.0% |
| Scotland | 44 | 0.0% |
| Serbia | 23 | 0.0% |
| South Africa | 7 | 0.0% |
| South America | 450 | 0.1% |
| South Central Asia | 1,130 | 0.4% |
| South Eastern Asia | 892 | 0.3% |
| Southern Europe | 363 | 0.1% |
| Spain | 87 | 0.0% |
| Sri Lanka | 18 | 0.0% |
| St. Vincent and the Grenadines | 5 | 0.0% |
| Switzerland | 10 | 0.0% |
| Syria | 70 | 0.0% |
| Taiwan | 81 | 0.0% |
| Thailand | 24 | 0.0% |
| Turkey | 18 | 0.0% |
| Ukraine | 117 | 0.0% |
| Uruguay | 7 | 0.0% |
| Venezuela | 226 | 0.1% |
| Vietnam | 244 | 0.1% |
| Western Africa | 68 | 0.0% |
| Western Asia | 349 | 0.1% |
| Western Europe | 685 | 0.2% | View All 105 Rows |
Sex and Age in Lorain County
Sex and Age in Lorain County
The most populous age groups in Lorain County are 55 to 59 Years (11,865 | 7.6%) for men and 60 to 64 Years (11,577 | 7.3%) for women.
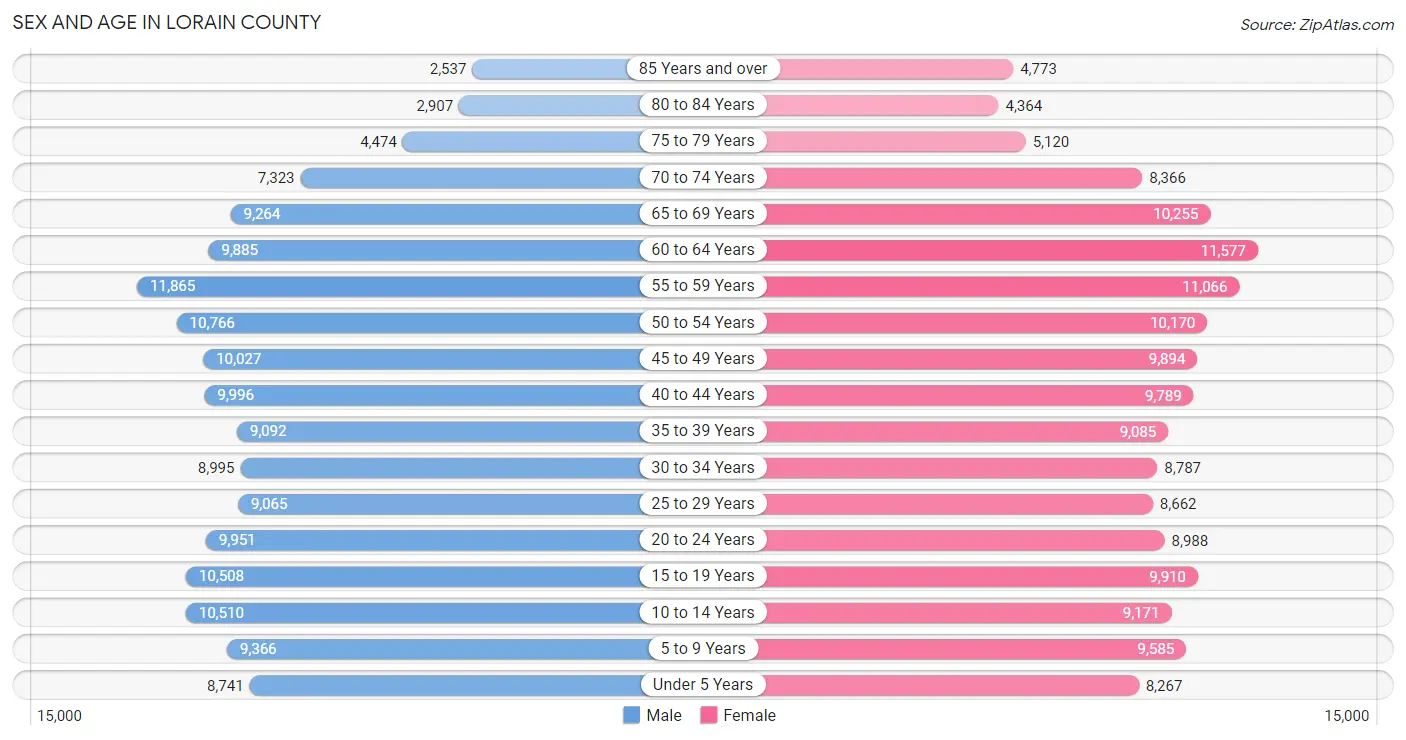
| Age Bracket | Male | Female |
| Under 5 Years | 8,741 (5.6%) | 8,267 (5.2%) |
| 5 to 9 Years | 9,366 (6.0%) | 9,585 (6.1%) |
| 10 to 14 Years | 10,510 (6.8%) | 9,171 (5.8%) |
| 15 to 19 Years | 10,508 (6.8%) | 9,910 (6.3%) |
| 20 to 24 Years | 9,951 (6.4%) | 8,988 (5.7%) |
| 25 to 29 Years | 9,065 (5.8%) | 8,662 (5.5%) |
| 30 to 34 Years | 8,995 (5.8%) | 8,787 (5.6%) |
| 35 to 39 Years | 9,092 (5.9%) | 9,085 (5.8%) |
| 40 to 44 Years | 9,996 (6.4%) | 9,789 (6.2%) |
| 45 to 49 Years | 10,027 (6.5%) | 9,894 (6.3%) |
| 50 to 54 Years | 10,766 (6.9%) | 10,170 (6.4%) |
| 55 to 59 Years | 11,865 (7.6%) | 11,066 (7.0%) |
| 60 to 64 Years | 9,885 (6.4%) | 11,577 (7.3%) |
| 65 to 69 Years | 9,264 (6.0%) | 10,255 (6.5%) |
| 70 to 74 Years | 7,323 (4.7%) | 8,366 (5.3%) |
| 75 to 79 Years | 4,474 (2.9%) | 5,120 (3.2%) |
| 80 to 84 Years | 2,907 (1.9%) | 4,364 (2.8%) |
| 85 Years and over | 2,537 (1.6%) | 4,773 (3.0%) |
| Total | 155,272 (100.0%) | 157,829 (100.0%) |
Families and Households in Lorain County
Median Family Size in Lorain County
The median family size in Lorain County is 3.09 persons per family, with single female/mother families (14,280 | 18.3%) accounting for the largest median family size of 3.18 persons per family. On the other hand, single male/father families (5,816 | 7.4%) represent the smallest median family size with 2.96 persons per family.
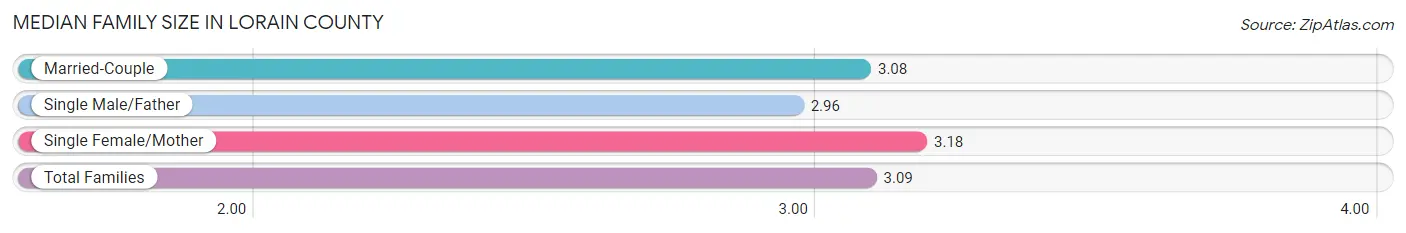
| Family Type | # Families | Family Size |
| Married-Couple | 58,078 (74.3%) | 3.08 |
| Single Male/Father | 5,816 (7.4%) | 2.96 |
| Single Female/Mother | 14,280 (18.3%) | 3.18 |
| Total Families | 78,174 (100.0%) | 3.09 |
Median Household Size in Lorain County
The median household size in Lorain County is 2.45 persons per household, with single male/father households (5,816 | 4.7%) accounting for the largest median household size of 3.48 persons per household. non-family households (46,336 | 37.2%) represent the smallest median household size with 1.19 persons per household.
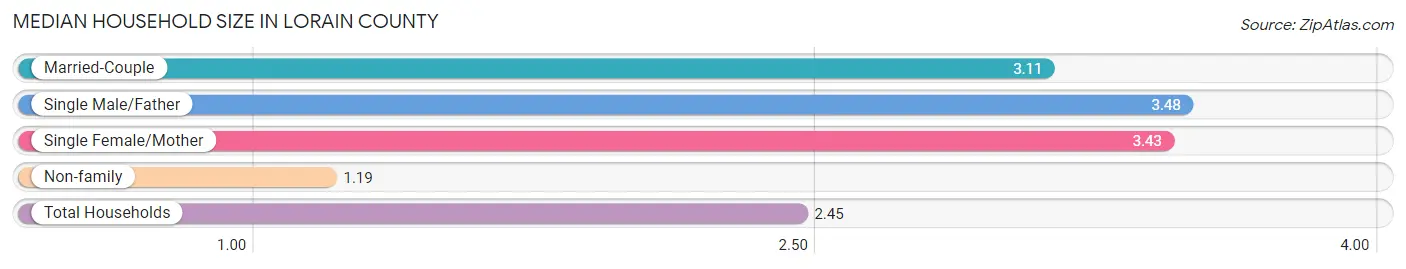
| Household Type | # Households | Household Size |
| Married-Couple | 58,078 (46.7%) | 3.11 |
| Single Male/Father | 5,816 (4.7%) | 3.48 |
| Single Female/Mother | 14,280 (11.5%) | 3.43 |
| Non-family | 46,336 (37.2%) | 1.19 |
| Total Households | 124,510 (100.0%) | 2.45 |
Household Size by Marriage Status in Lorain County
Out of a total of 124,510 households in Lorain County, 78,174 (62.8%) are family households, while 46,336 (37.2%) are nonfamily households. The most numerous type of family households are 2-person households, comprising 36,406, and the most common type of nonfamily households are 1-person households, comprising 39,488.
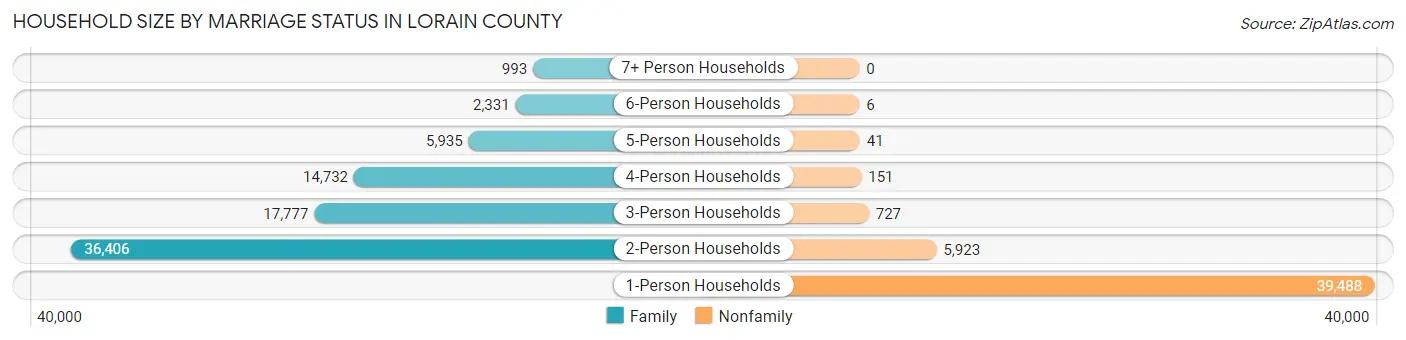
| Household Size | Family Households | Nonfamily Households |
| 1-Person Households | - | 39,488 (31.7%) |
| 2-Person Households | 36,406 (29.2%) | 5,923 (4.8%) |
| 3-Person Households | 17,777 (14.3%) | 727 (0.6%) |
| 4-Person Households | 14,732 (11.8%) | 151 (0.1%) |
| 5-Person Households | 5,935 (4.8%) | 41 (0.0%) |
| 6-Person Households | 2,331 (1.9%) | 6 (0.0%) |
| 7+ Person Households | 993 (0.8%) | 0 (0.0%) |
| Total | 78,174 (62.8%) | 46,336 (37.2%) |
Female Fertility in Lorain County
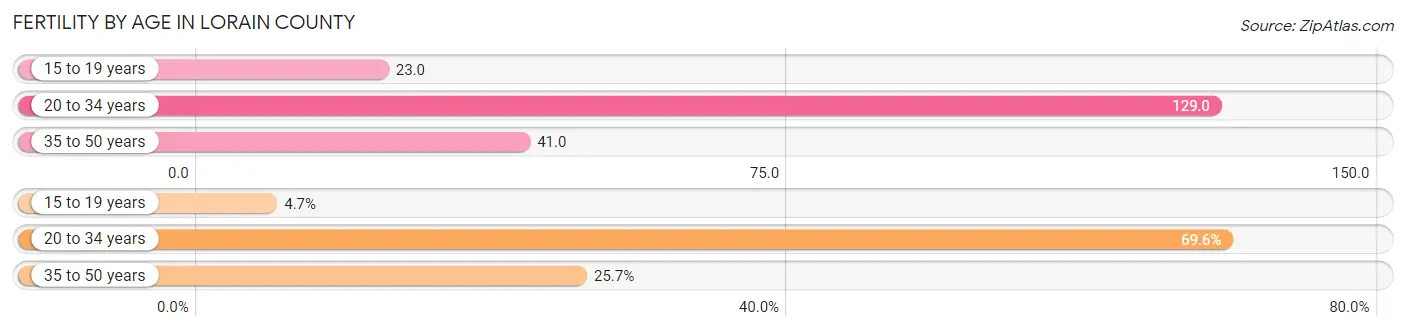
Fertility by Age in Lorain County
Average fertility rate in Lorain County is 73.0 births per 1,000 women. Women in the age bracket of 20 to 34 years have the highest fertility rate with 129.0 births per 1,000 women. Women in the age bracket of 20 to 34 years acount for 69.6% of all women with births.
| Age Bracket | Women with Births | Births / 1,000 Women |
| 15 to 19 years | 231 (4.7%) | 23.0 |
| 20 to 34 years | 3,422 (69.6%) | 129.0 |
| 35 to 50 years | 1,265 (25.7%) | 41.0 |
| Total | 4,918 (100.0%) | 73.0 |
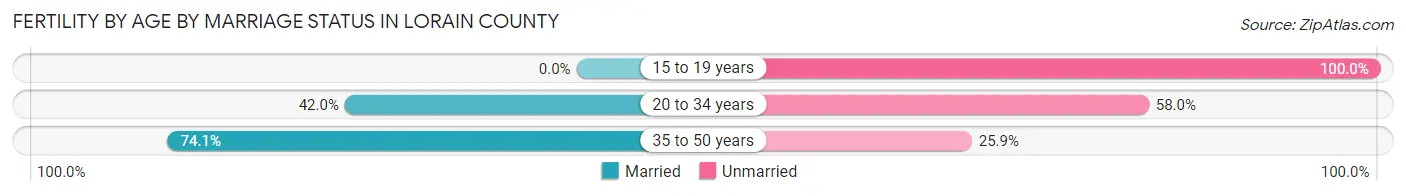
Fertility by Age by Marriage Status in Lorain County
48.3% of women with births (4,918) in Lorain County are married. The highest percentage of unmarried women with births falls into 15 to 19 years age bracket with 100.0% of them unmarried at the time of birth, while the lowest percentage of unmarried women with births belong to 35 to 50 years age bracket with 25.9% of them unmarried.
| Age Bracket | Married | Unmarried |
| 15 to 19 years | 0 (0.0%) | 231 (100.0%) |
| 20 to 34 years | 1,437 (42.0%) | 1,985 (58.0%) |
| 35 to 50 years | 937 (74.1%) | 328 (25.9%) |
| Total | 2,375 (48.3%) | 2,543 (51.7%) |
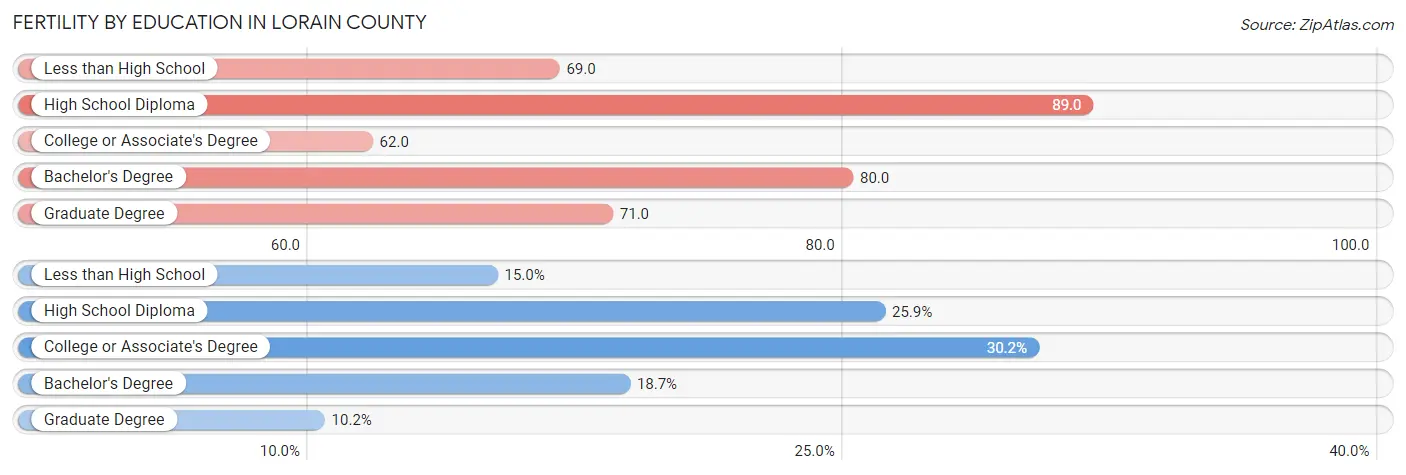
Fertility by Education in Lorain County
Average fertility rate in Lorain County is 73.0 births per 1,000 women. Women with the education attainment of high school diploma have the highest fertility rate of 89.0 births per 1,000 women, while women with the education attainment of college or associate's degree have the lowest fertility at 62.0 births per 1,000 women. Women with the education attainment of college or associate's degree represent 30.2% of all women with births.
| Educational Attainment | Women with Births | Births / 1,000 Women |
| Less than High School | 738 (15.0%) | 69.0 |
| High School Diploma | 1,274 (25.9%) | 89.0 |
| College or Associate's Degree | 1,486 (30.2%) | 62.0 |
| Bachelor's Degree | 921 (18.7%) | 80.0 |
| Graduate Degree | 499 (10.2%) | 71.0 |
| Total | 4,918 (100.0%) | 73.0 |
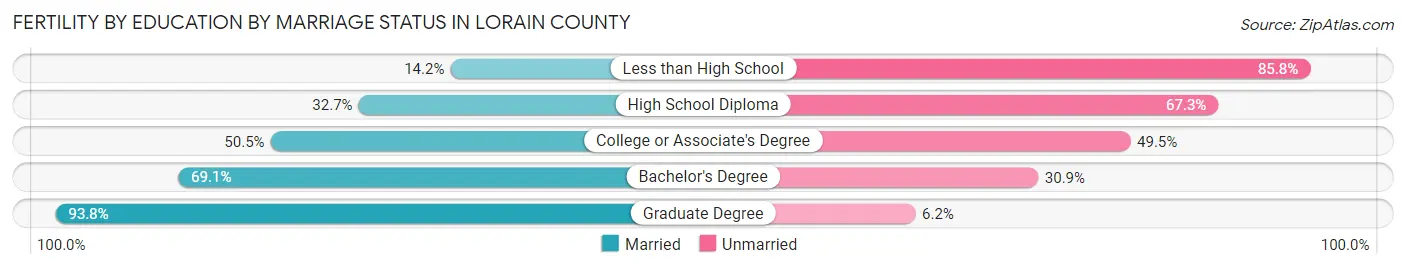
Fertility by Education by Marriage Status in Lorain County
51.7% of women with births in Lorain County are unmarried. Women with the educational attainment of graduate degree are most likely to be married with 93.8% of them married at childbirth, while women with the educational attainment of less than high school are least likely to be married with 85.8% of them unmarried at childbirth.
| Educational Attainment | Married | Unmarried |
| Less than High School | 105 (14.2%) | 633 (85.8%) |
| High School Diploma | 417 (32.7%) | 857 (67.3%) |
| College or Associate's Degree | 750 (50.5%) | 736 (49.5%) |
| Bachelor's Degree | 636 (69.1%) | 285 (30.9%) |
| Graduate Degree | 468 (93.8%) | 31 (6.2%) |
| Total | 2,375 (48.3%) | 2,543 (51.7%) |
Income in Lorain County
Income Overview in Lorain County
Per Capita Income in Lorain County is $37,171, while median incomes of families and households are $88,934 and $67,272 respectively.
| Characteristic | Number | Measure |
| Per Capita Income | 313,101 | $37,171 |
| Median Family Income | 78,174 | $88,934 |
| Mean Family Income | 78,174 | $110,119 |
| Median Household Income | 124,510 | $67,272 |
| Mean Household Income | 124,510 | $90,679 |
| Income Deficit | 78,174 | $11,390 |
| Wage / Income Gap (%) | 313,101 | 30.66% |
| Wage / Income Gap ($) | 313,101 | 69.34¢ per $1 |
| Gini / Inequality Index | 313,101 | 0.46 |
Earnings by Sex in Lorain County
Average Earnings in Lorain County are $41,433, $49,001 for men and $33,975 for women, a difference of 30.7%.
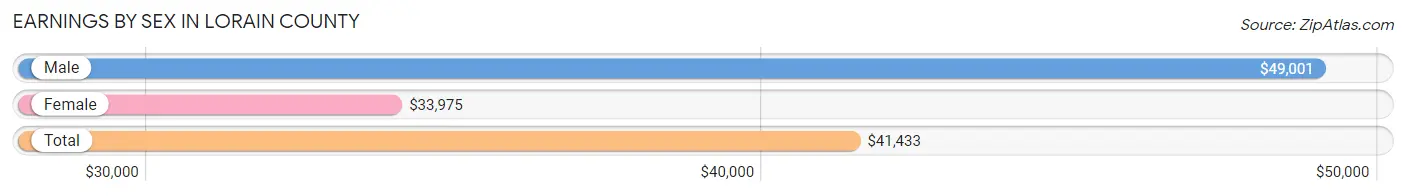
| Sex | Number | Average Earnings |
| Male | 83,722 (51.8%) | $49,001 |
| Female | 77,962 (48.2%) | $33,975 |
| Total | 161,684 (100.0%) | $41,433 |
Earnings by Sex by Income Bracket in Lorain County
The most common earnings brackets in Lorain County are $100,000+ for men (14,760 | 17.6%) and $55,000 to $64,999 for women (5,998 | 7.7%).
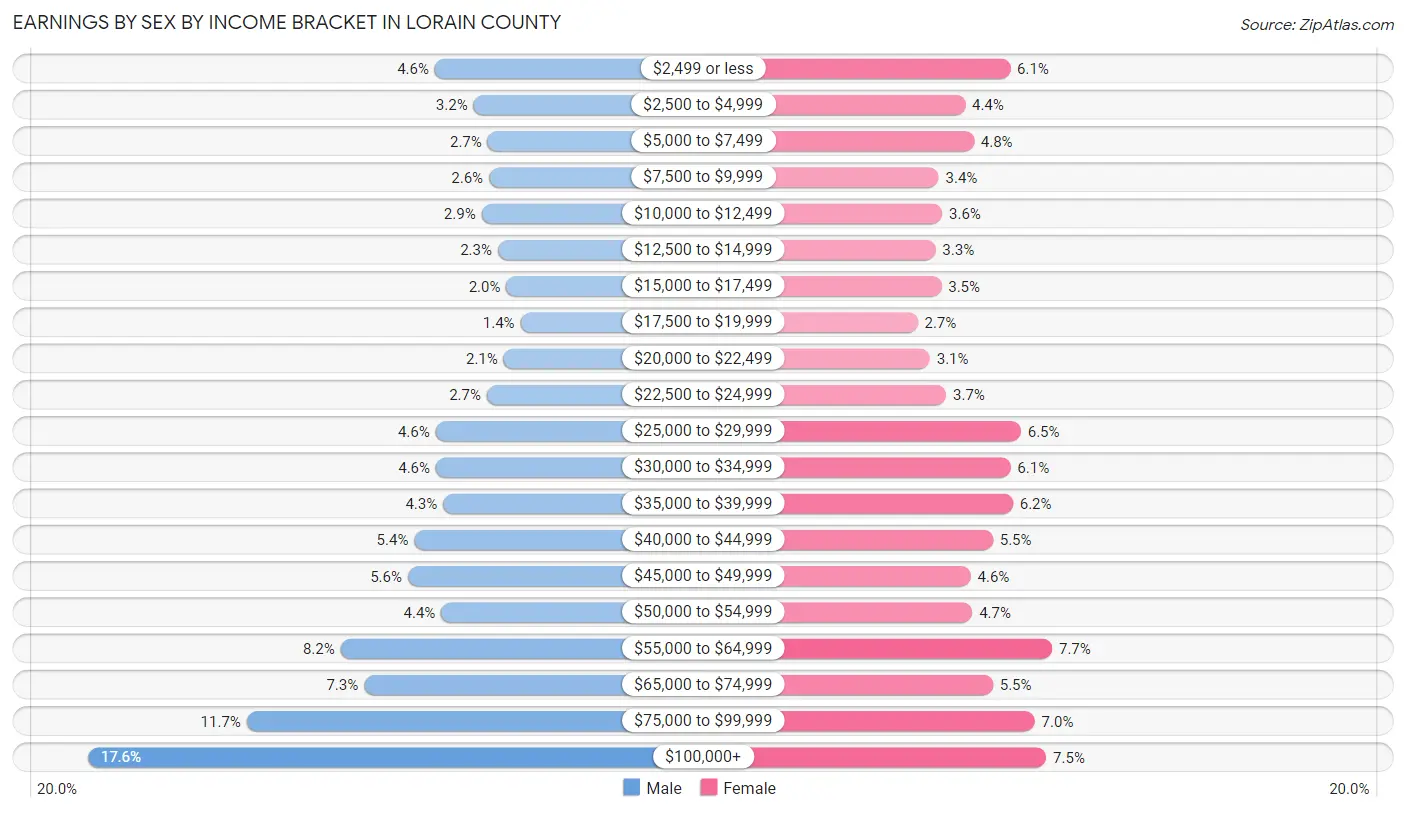
| Income | Male | Female |
| $2,499 or less | 3,880 (4.6%) | 4,770 (6.1%) |
| $2,500 to $4,999 | 2,666 (3.2%) | 3,454 (4.4%) |
| $5,000 to $7,499 | 2,217 (2.6%) | 3,711 (4.8%) |
| $7,500 to $9,999 | 2,173 (2.6%) | 2,680 (3.4%) |
| $10,000 to $12,499 | 2,409 (2.9%) | 2,782 (3.6%) |
| $12,500 to $14,999 | 1,901 (2.3%) | 2,585 (3.3%) |
| $15,000 to $17,499 | 1,629 (1.9%) | 2,763 (3.5%) |
| $17,500 to $19,999 | 1,188 (1.4%) | 2,069 (2.6%) |
| $20,000 to $22,499 | 1,715 (2.1%) | 2,426 (3.1%) |
| $22,500 to $24,999 | 2,242 (2.7%) | 2,898 (3.7%) |
| $25,000 to $29,999 | 3,855 (4.6%) | 5,081 (6.5%) |
| $30,000 to $34,999 | 3,839 (4.6%) | 4,779 (6.1%) |
| $35,000 to $39,999 | 3,620 (4.3%) | 4,849 (6.2%) |
| $40,000 to $44,999 | 4,523 (5.4%) | 4,261 (5.5%) |
| $45,000 to $49,999 | 4,724 (5.6%) | 3,616 (4.6%) |
| $50,000 to $54,999 | 3,672 (4.4%) | 3,668 (4.7%) |
| $55,000 to $64,999 | 6,832 (8.2%) | 5,998 (7.7%) |
| $65,000 to $74,999 | 6,096 (7.3%) | 4,264 (5.5%) |
| $75,000 to $99,999 | 9,781 (11.7%) | 5,486 (7.0%) |
| $100,000+ | 14,760 (17.6%) | 5,822 (7.5%) |
| Total | 83,722 (100.0%) | 77,962 (100.0%) |
Earnings by Sex by Educational Attainment in Lorain County
Average earnings in Lorain County are $57,390 for men and $39,346 for women, a difference of 31.4%. Men with an educational attainment of graduate degree enjoy the highest average annual earnings of $96,879, while those with less than high school education earn the least with $33,702. Women with an educational attainment of graduate degree earn the most with the average annual earnings of $75,111, while those with less than high school education have the smallest earnings of $23,863.
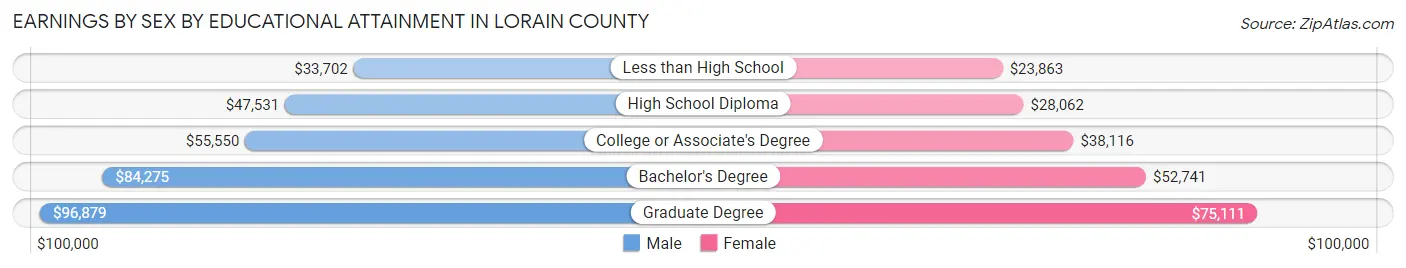
| Educational Attainment | Male Income | Female Income |
| Less than High School | $33,702 | $23,863 |
| High School Diploma | $47,531 | $28,062 |
| College or Associate's Degree | $55,550 | $38,116 |
| Bachelor's Degree | $84,275 | $52,741 |
| Graduate Degree | $96,879 | $75,111 |
| Total | $57,390 | $39,346 |
Family Income in Lorain County
Family Income Brackets in Lorain County
According to the Lorain County family income data, there are 16,651 families falling into the $100,000 to $149,999 income range, which is the most common income bracket and makes up 21.3% of all families. Conversely, the $10,000 to $14,999 income bracket is the least frequent group with only 1,563 families (2.0%) belonging to this category.
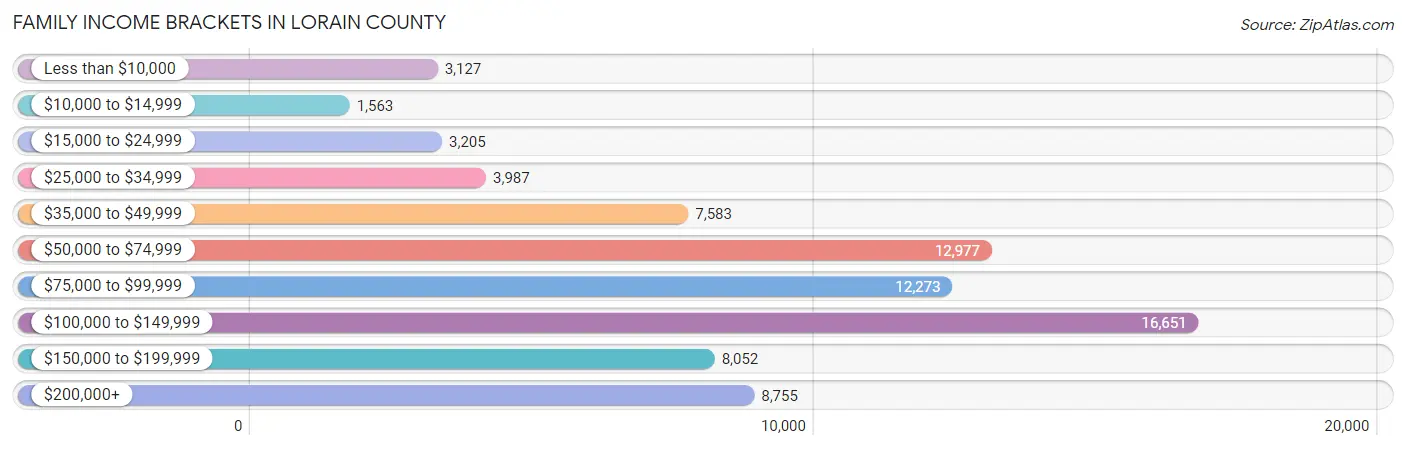
| Income Bracket | # Families | % Families |
| Less than $10,000 | 3,127 | 4.0% |
| $10,000 to $14,999 | 1,563 | 2.0% |
| $15,000 to $24,999 | 3,205 | 4.1% |
| $25,000 to $34,999 | 3,987 | 5.1% |
| $35,000 to $49,999 | 7,583 | 9.7% |
| $50,000 to $74,999 | 12,977 | 16.6% |
| $75,000 to $99,999 | 12,273 | 15.7% |
| $100,000 to $149,999 | 16,651 | 21.3% |
| $150,000 to $199,999 | 8,052 | 10.3% |
| $200,000+ | 8,755 | 11.2% |
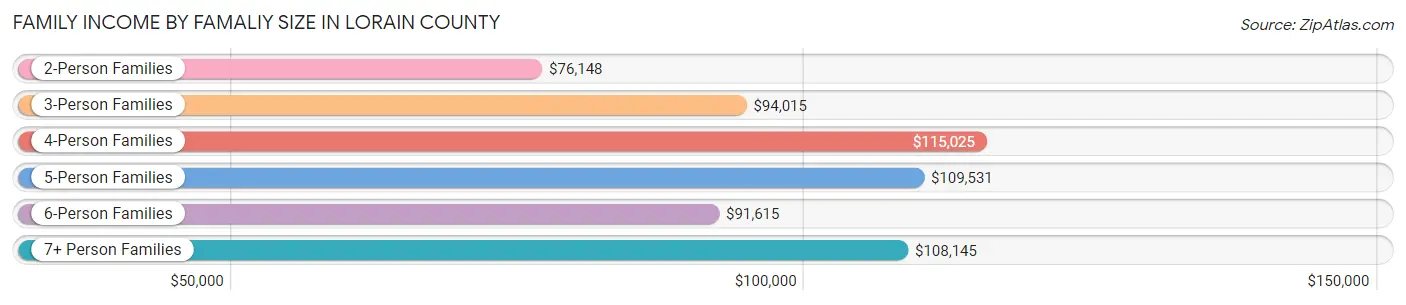
Family Income by Famaliy Size in Lorain County
4-person families (13,906 | 17.8%) account for the highest median family income in Lorain County with $115,025 per family, while 2-person families (39,211 | 50.2%) have the highest median income of $38,074 per family member.
| Income Bracket | # Families | Median Income |
| 2-Person Families | 39,211 (50.2%) | $76,148 |
| 3-Person Families | 16,897 (21.6%) | $94,015 |
| 4-Person Families | 13,906 (17.8%) | $115,025 |
| 5-Person Families | 5,399 (6.9%) | $109,531 |
| 6-Person Families | 1,993 (2.5%) | $91,615 |
| 7+ Person Families | 768 (1.0%) | $108,145 |
| Total | 78,174 (100.0%) | $88,934 |
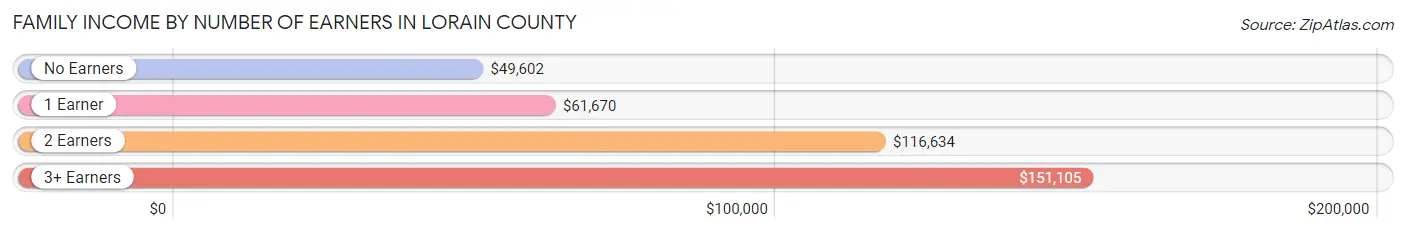
Family Income by Number of Earners in Lorain County
The median family income in Lorain County is $88,934, with families comprising 3+ earners (8,699) having the highest median family income of $151,105, while families with no earners (14,335) have the lowest median family income of $49,602, accounting for 11.1% and 18.3% of families, respectively.
| Number of Earners | # Families | Median Income |
| No Earners | 14,335 (18.3%) | $49,602 |
| 1 Earner | 24,259 (31.0%) | $61,670 |
| 2 Earners | 30,881 (39.5%) | $116,634 |
| 3+ Earners | 8,699 (11.1%) | $151,105 |
| Total | 78,174 (100.0%) | $88,934 |
Household Income in Lorain County
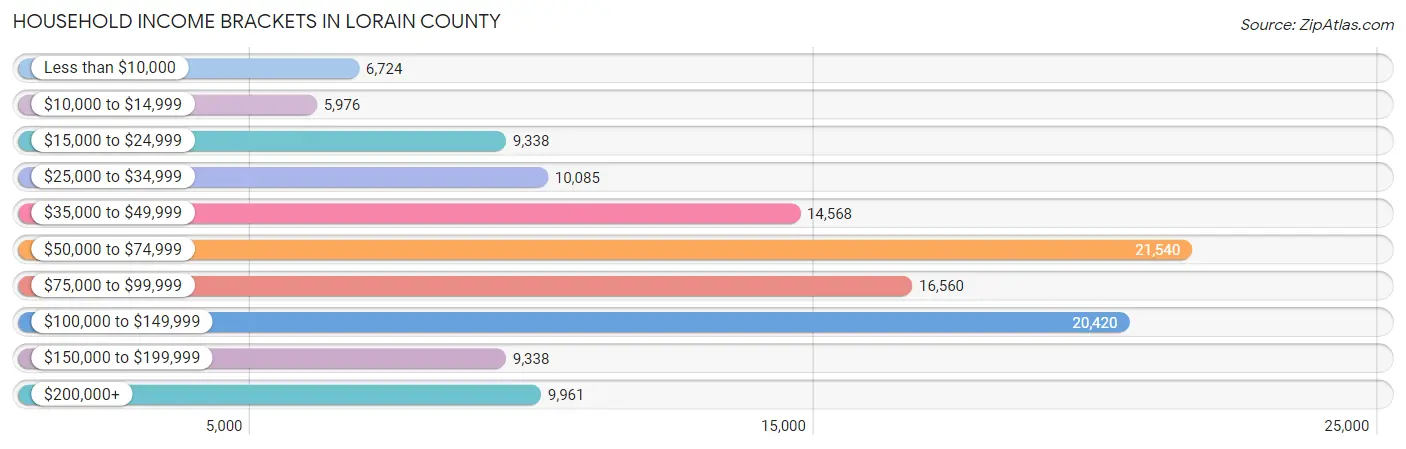
Household Income Brackets in Lorain County
With 21,540 households falling in the category, the $50,000 to $74,999 income range is the most frequent in Lorain County, accounting for 17.3% of all households. In contrast, only 5,976 households (4.8%) fall into the $10,000 to $14,999 income bracket, making it the least populous group.
| Income Bracket | # Households | % Households |
| Less than $10,000 | 6,724 | 5.4% |
| $10,000 to $14,999 | 5,976 | 4.8% |
| $15,000 to $24,999 | 9,338 | 7.5% |
| $25,000 to $34,999 | 10,085 | 8.1% |
| $35,000 to $49,999 | 14,568 | 11.7% |
| $50,000 to $74,999 | 21,540 | 17.3% |
| $75,000 to $99,999 | 16,560 | 13.3% |
| $100,000 to $149,999 | 20,420 | 16.4% |
| $150,000 to $199,999 | 9,338 | 7.5% |
| $200,000+ | 9,961 | 8.0% |
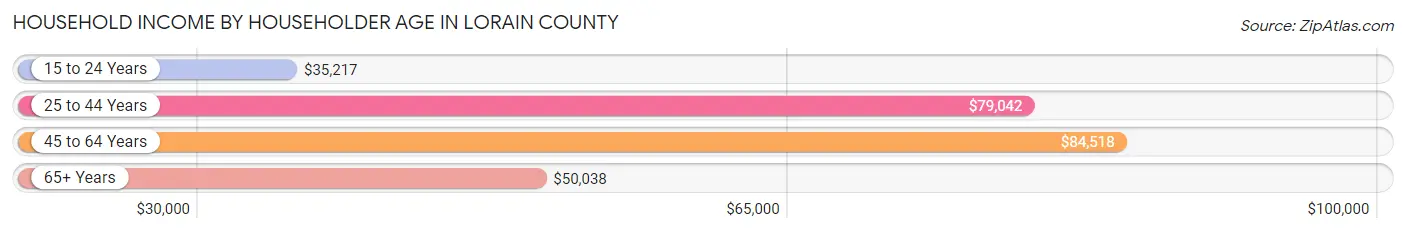
Household Income by Householder Age in Lorain County
The median household income in Lorain County is $67,272, with the highest median household income of $84,518 found in the 45 to 64 years age bracket for the primary householder. A total of 47,860 households (38.4%) fall into this category. Meanwhile, the 15 to 24 years age bracket for the primary householder has the lowest median household income of $35,217, with 3,708 households (3.0%) in this group.
| Income Bracket | # Households | Median Income |
| 15 to 24 Years | 3,708 (3.0%) | $35,217 |
| 25 to 44 Years | 35,148 (28.2%) | $79,042 |
| 45 to 64 Years | 47,860 (38.4%) | $84,518 |
| 65+ Years | 37,794 (30.3%) | $50,038 |
| Total | 124,510 (100.0%) | $67,272 |
Poverty in Lorain County
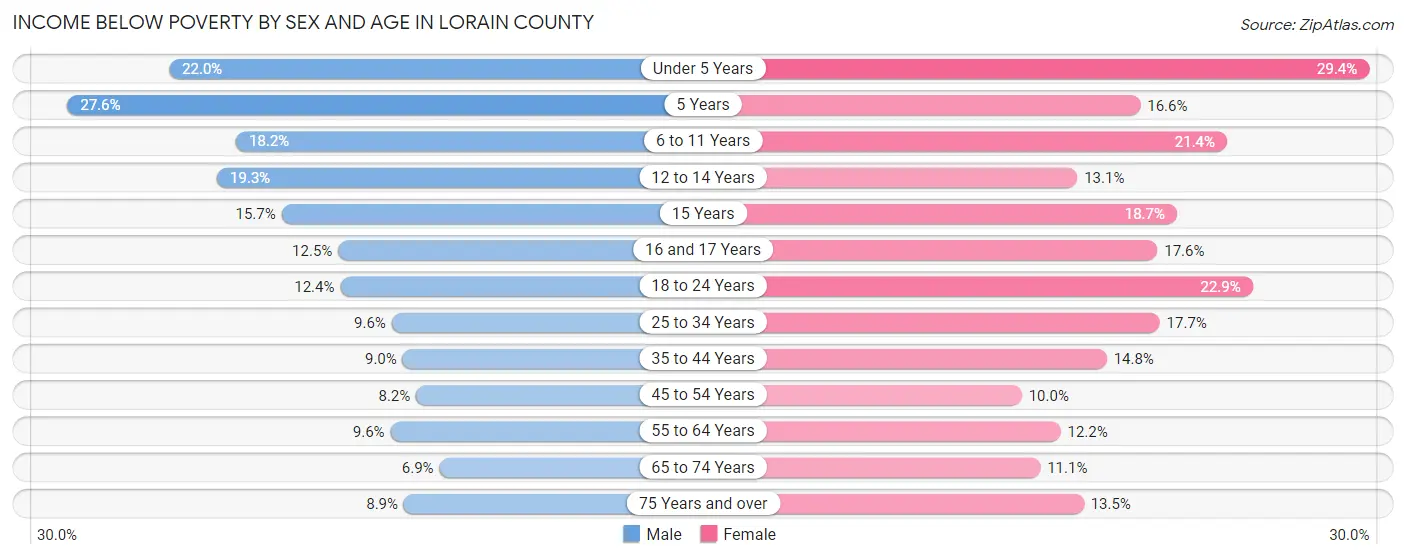
Income Below Poverty by Sex and Age in Lorain County
With 11.4% poverty level for males and 15.5% for females among the residents of Lorain County, 5 year old males and under 5 year old females are the most vulnerable to poverty, with 579 males (27.6%) and 2,393 females (29.4%) in their respective age groups living below the poverty level.
| Age Bracket | Male | Female |
| Under 5 Years | 1,893 (22.0%) | 2,393 (29.4%) |
| 5 Years | 579 (27.6%) | 296 (16.6%) |
| 6 to 11 Years | 1,910 (18.2%) | 2,434 (21.4%) |
| 12 to 14 Years | 1,355 (19.3%) | 660 (13.1%) |
| 15 Years | 371 (15.7%) | 320 (18.6%) |
| 16 and 17 Years | 490 (12.5%) | 745 (17.6%) |
| 18 to 24 Years | 1,603 (12.4%) | 2,643 (22.9%) |
| 25 to 34 Years | 1,660 (9.6%) | 3,074 (17.7%) |
| 35 to 44 Years | 1,620 (8.9%) | 2,782 (14.7%) |
| 45 to 54 Years | 1,639 (8.2%) | 2,008 (10.0%) |
| 55 to 64 Years | 2,040 (9.6%) | 2,749 (12.2%) |
| 65 to 74 Years | 1,114 (6.9%) | 2,029 (11.1%) |
| 75 Years and over | 843 (8.9%) | 1,842 (13.5%) |
| Total | 17,117 (11.4%) | 23,975 (15.5%) |
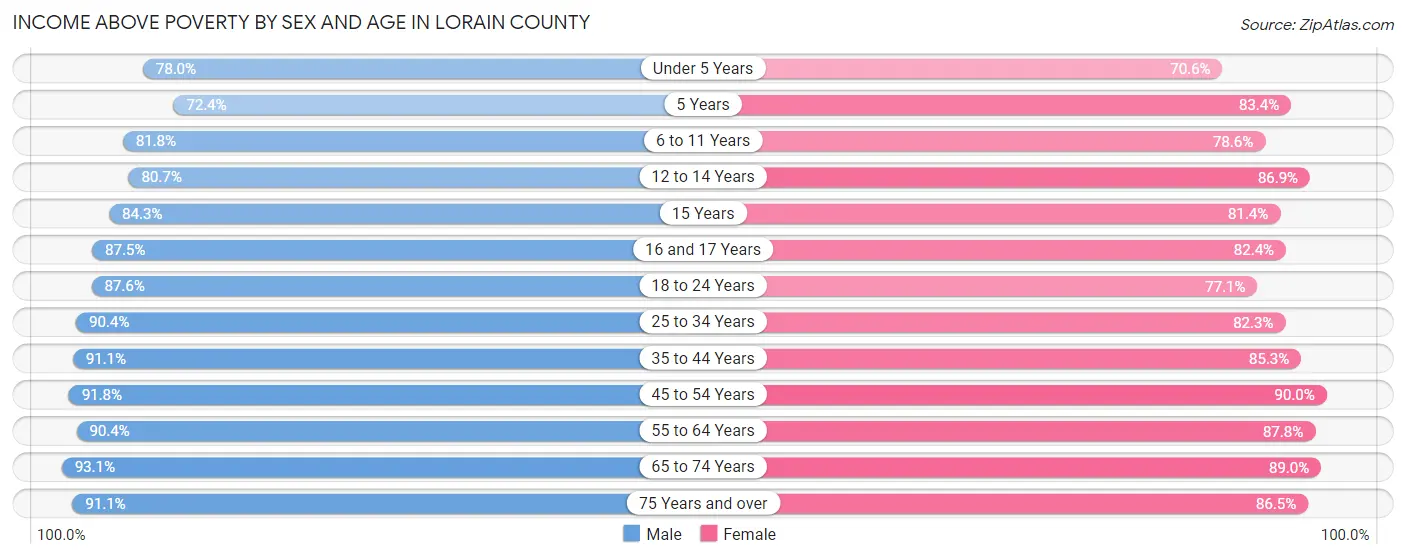
Income Above Poverty by Sex and Age in Lorain County
According to the poverty statistics in Lorain County, males aged 65 to 74 years and females aged 45 to 54 years are the age groups that are most secure financially, with 93.1% of males and 90.0% of females in these age groups living above the poverty line.
| Age Bracket | Male | Female |
| Under 5 Years | 6,726 (78.0%) | 5,757 (70.6%) |
| 5 Years | 1,517 (72.4%) | 1,485 (83.4%) |
| 6 to 11 Years | 8,570 (81.8%) | 8,918 (78.6%) |
| 12 to 14 Years | 5,670 (80.7%) | 4,375 (86.9%) |
| 15 Years | 1,994 (84.3%) | 1,396 (81.4%) |
| 16 and 17 Years | 3,417 (87.5%) | 3,496 (82.4%) |
| 18 to 24 Years | 11,302 (87.6%) | 8,915 (77.1%) |
| 25 to 34 Years | 15,710 (90.4%) | 14,289 (82.3%) |
| 35 to 44 Years | 16,479 (91.0%) | 16,083 (85.3%) |
| 45 to 54 Years | 18,351 (91.8%) | 18,032 (90.0%) |
| 55 to 64 Years | 19,150 (90.4%) | 19,813 (87.8%) |
| 65 to 74 Years | 15,028 (93.1%) | 16,341 (88.9%) |
| 75 Years and over | 8,652 (91.1%) | 11,830 (86.5%) |
| Total | 132,566 (88.6%) | 130,730 (84.5%) |
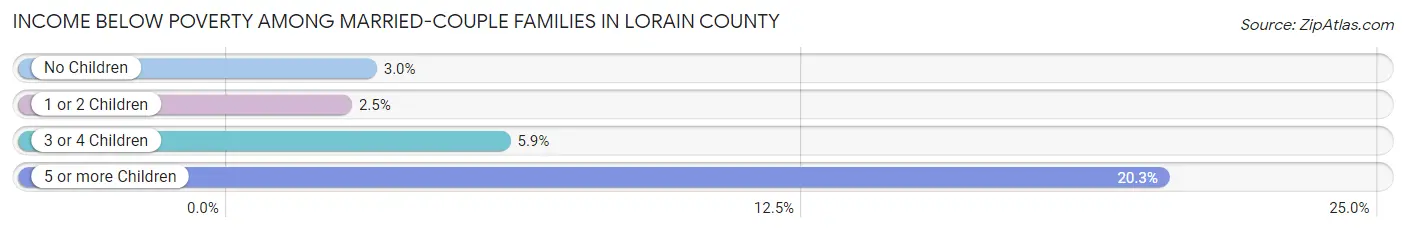
Income Below Poverty Among Married-Couple Families in Lorain County
The poverty statistics for married-couple families in Lorain County show that 3.2% or 1,842 of the total 58,078 families live below the poverty line. Families with 5 or more children have the highest poverty rate of 20.3%, comprising of 75 families. On the other hand, families with 1 or 2 children have the lowest poverty rate of 2.5%, which includes 425 families.
| Children | Above Poverty | Below Poverty |
| No Children | 35,414 (97.0%) | 1,103 (3.0%) |
| 1 or 2 Children | 16,736 (97.5%) | 425 (2.5%) |
| 3 or 4 Children | 3,791 (94.1%) | 239 (5.9%) |
| 5 or more Children | 295 (79.7%) | 75 (20.3%) |
| Total | 56,236 (96.8%) | 1,842 (3.2%) |
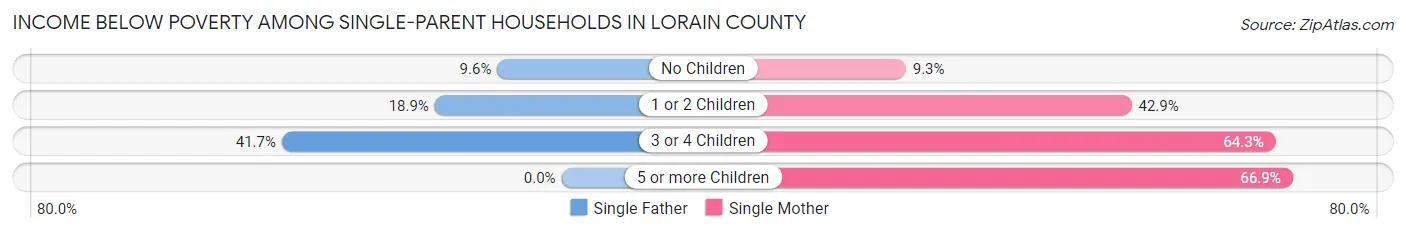
Income Below Poverty Among Single-Parent Households in Lorain County
According to the poverty data in Lorain County, 17.1% or 995 single-father households and 34.6% or 4,947 single-mother households are living below the poverty line. Among single-father households, those with 3 or 4 children have the highest poverty rate, with 233 households (41.7%) experiencing poverty. Likewise, among single-mother households, those with 5 or more children have the highest poverty rate, with 99 households (66.9%) falling below the poverty line.
| Children | Single Father | Single Mother |
| No Children | 234 (9.6%) | 461 (9.3%) |
| 1 or 2 Children | 528 (18.9%) | 3,005 (42.9%) |
| 3 or 4 Children | 233 (41.7%) | 1,382 (64.3%) |
| 5 or more Children | 0 (0.0%) | 99 (66.9%) |
| Total | 995 (17.1%) | 4,947 (34.6%) |
Income Below Poverty Among Married-Couple vs Single-Parent Households in Lorain County
The poverty data for Lorain County shows that 1,842 of the married-couple family households (3.2%) and 5,942 of the single-parent households (29.6%) are living below the poverty level. Within the married-couple family households, those with 5 or more children have the highest poverty rate, with 75 households (20.3%) falling below the poverty line. Among the single-parent households, those with 5 or more children have the highest poverty rate, with 99 household (60.0%) living below poverty.
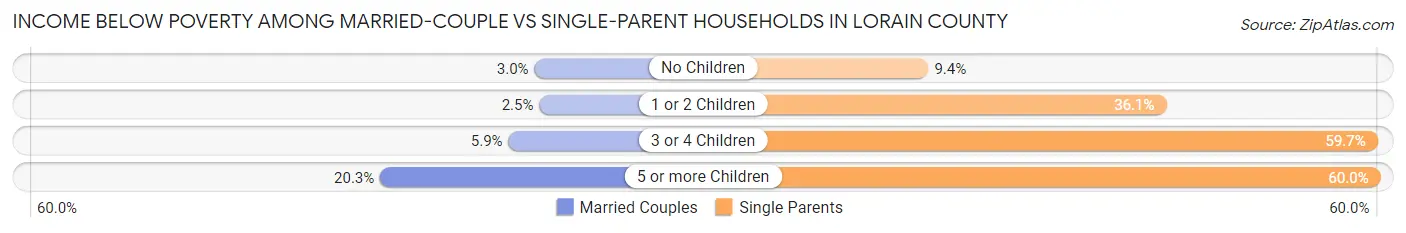
| Children | Married-Couple Families | Single-Parent Households |
| No Children | 1,103 (3.0%) | 695 (9.4%) |
| 1 or 2 Children | 425 (2.5%) | 3,533 (36.0%) |
| 3 or 4 Children | 239 (5.9%) | 1,615 (59.7%) |
| 5 or more Children | 75 (20.3%) | 99 (60.0%) |
| Total | 1,842 (3.2%) | 5,942 (29.6%) |
Employment Characteristics in Lorain County
Employment by Class of Employer in Lorain County
Among the 144,410 employed individuals in Lorain County, private company employees (102,328 | 70.9%), not-for-profit organizations (12,404 | 8.6%), and local government employees (12,001 | 8.3%) make up the most common classes of employment.
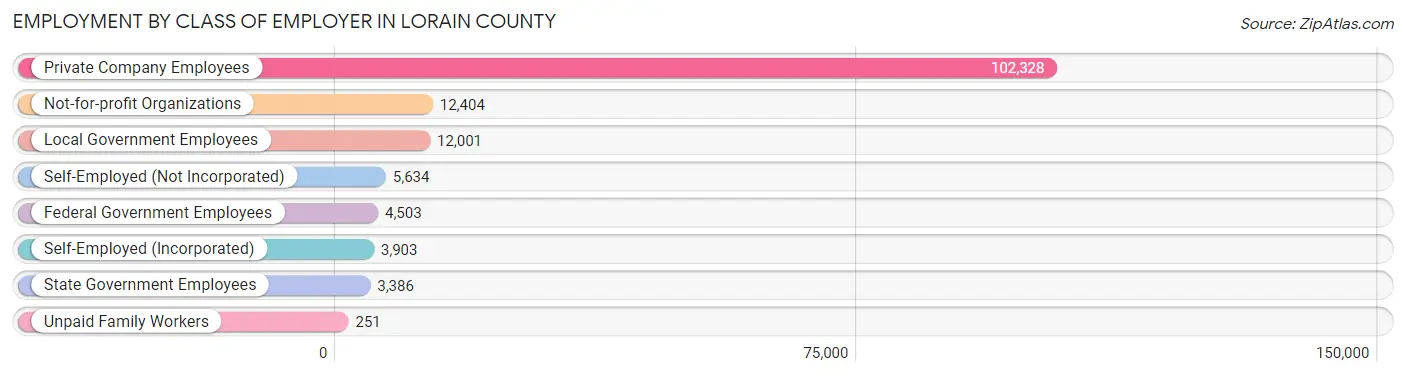
| Employer Class | # Employees | % Employees |
| Private Company Employees | 102,328 | 70.9% |
| Self-Employed (Incorporated) | 3,903 | 2.7% |
| Self-Employed (Not Incorporated) | 5,634 | 3.9% |
| Not-for-profit Organizations | 12,404 | 8.6% |
| Local Government Employees | 12,001 | 8.3% |
| State Government Employees | 3,386 | 2.3% |
| Federal Government Employees | 4,503 | 3.1% |
| Unpaid Family Workers | 251 | 0.2% |
| Total | 144,410 | 100.0% |
Employment Status by Age in Lorain County
According to the labor force statistics for Lorain County, out of the total population over 16 years of age (253,369), 60.6% or 153,542 individuals are in the labor force, with 4.4% or 6,756 of them unemployed. The age group with the highest labor force participation rate is 45 to 54 years, with 82.9% or 33,870 individuals in the labor force. Within the labor force, the 16 to 19 years age range has the highest percentage of unemployed individuals, with 12.5% or 978 of them being unemployed.
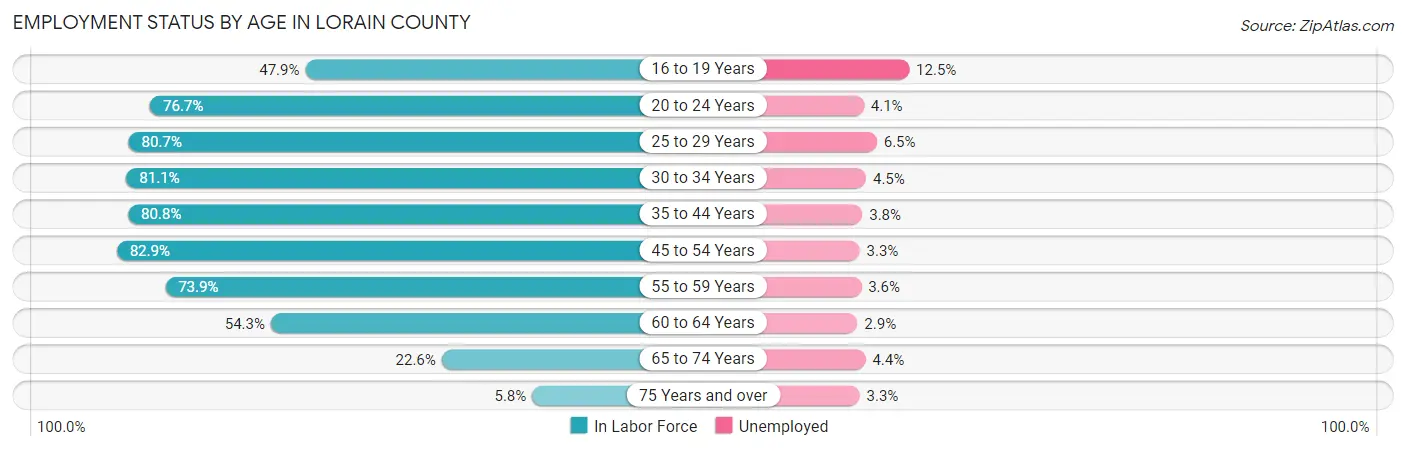
| Age Bracket | In Labor Force | Unemployed |
| 16 to 19 Years | 7,820 (47.9%) | 978 (12.5%) |
| 20 to 24 Years | 14,526 (76.7%) | 596 (4.1%) |
| 25 to 29 Years | 14,306 (80.7%) | 930 (6.5%) |
| 30 to 34 Years | 14,421 (81.1%) | 649 (4.5%) |
| 35 to 44 Years | 30,673 (80.8%) | 1,166 (3.8%) |
| 45 to 54 Years | 33,870 (82.9%) | 1,118 (3.3%) |
| 55 to 59 Years | 16,946 (73.9%) | 610 (3.6%) |
| 60 to 64 Years | 11,654 (54.3%) | 338 (2.9%) |
| 65 to 74 Years | 7,957 (22.6%) | 350 (4.4%) |
| 75 Years and over | 1,402 (5.8%) | 46 (3.3%) |
| Total | 153,542 (60.6%) | 6,756 (4.4%) |
Employment Status by Educational Attainment in Lorain County
According to labor force statistics for Lorain County, 76.8% of individuals (121,898) out of the total population between 25 and 64 years of age (158,721) are in the labor force, with 3.9% or 4,754 of them being unemployed. The group with the highest labor force participation rate are those with the educational attainment of bachelor's degree or higher, with 87.6% or 39,228 individuals in the labor force. Within the labor force, individuals with less than high school education have the highest percentage of unemployment, with 13.8% or 898 of them being unemployed.
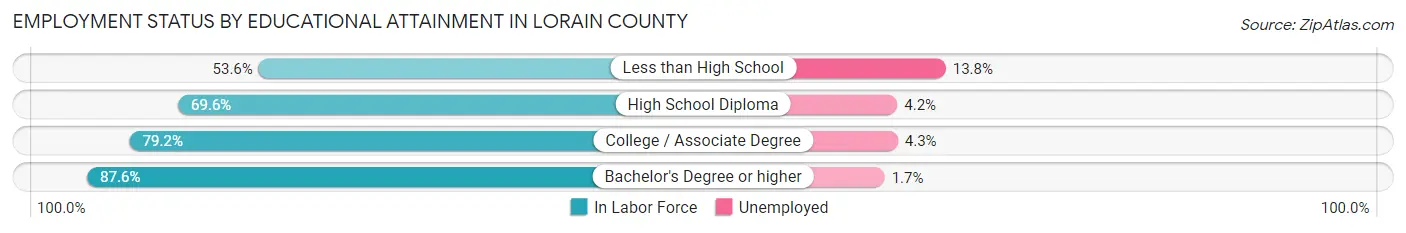
| Educational Attainment | In Labor Force | Unemployed |
| Less than High School | 6,510 (53.6%) | 1,676 (13.8%) |
| High School Diploma | 32,615 (69.6%) | 1,968 (4.2%) |
| College / Associate Degree | 43,508 (79.2%) | 2,362 (4.3%) |
| Bachelor's Degree or higher | 39,228 (87.6%) | 761 (1.7%) |
| Total | 121,898 (76.8%) | 6,190 (3.9%) |
Employment Occupations by Sex in Lorain County
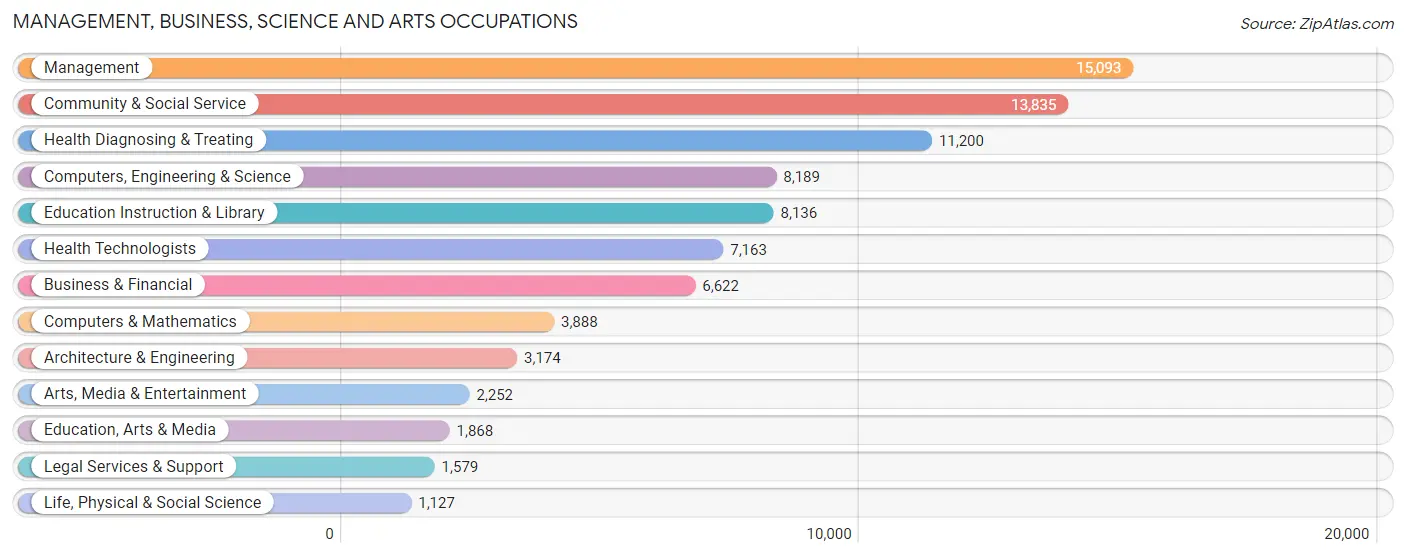
Management, Business, Science and Arts Occupations
The most common Management, Business, Science and Arts occupations in Lorain County are Management (15,093 | 10.3%), Community & Social Service (13,835 | 9.4%), Health Diagnosing & Treating (11,200 | 7.6%), Computers, Engineering & Science (8,189 | 5.6%), and Education Instruction & Library (8,136 | 5.6%).
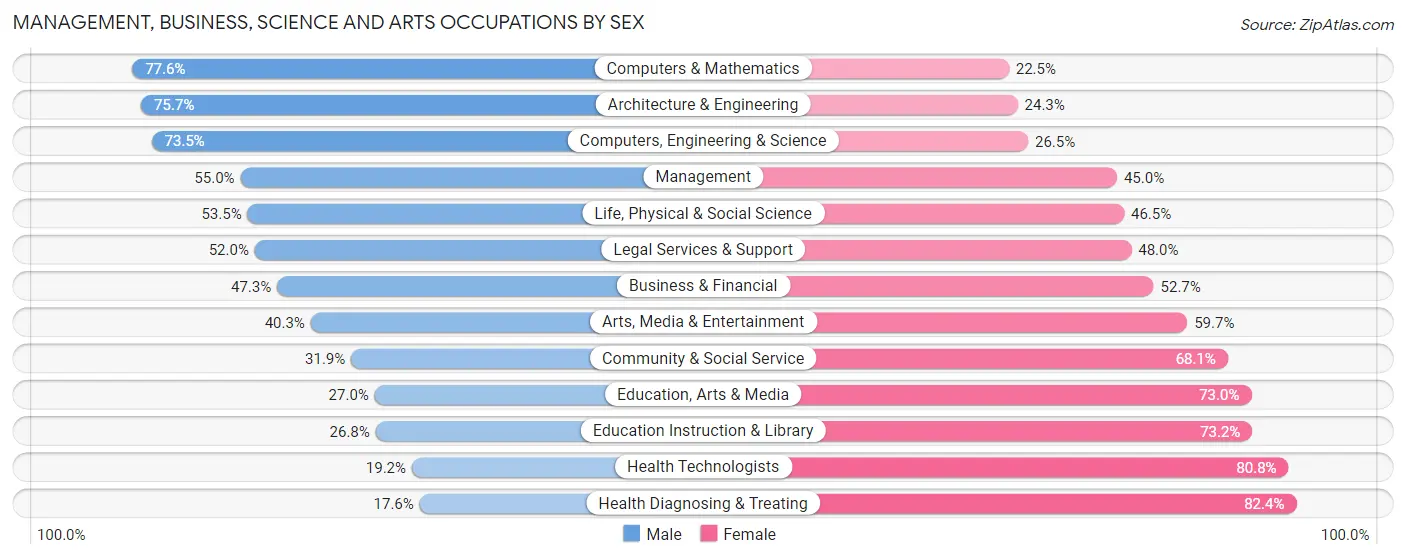
Management, Business, Science and Arts Occupations by Sex
Within the Management, Business, Science and Arts occupations in Lorain County, the most male-oriented occupations are Computers & Mathematics (77.5%), Architecture & Engineering (75.7%), and Computers, Engineering & Science (73.5%), while the most female-oriented occupations are Health Diagnosing & Treating (82.4%), Health Technologists (80.8%), and Education Instruction & Library (73.2%).
| Occupation | Male | Female |
| Management | 8,298 (55.0%) | 6,795 (45.0%) |
| Business & Financial | 3,135 (47.3%) | 3,487 (52.7%) |
| Computers, Engineering & Science | 6,021 (73.5%) | 2,168 (26.5%) |
| Computers & Mathematics | 3,015 (77.5%) | 873 (22.5%) |
| Architecture & Engineering | 2,403 (75.7%) | 771 (24.3%) |
| Life, Physical & Social Science | 603 (53.5%) | 524 (46.5%) |
| Community & Social Service | 4,412 (31.9%) | 9,423 (68.1%) |
| Education, Arts & Media | 504 (27.0%) | 1,364 (73.0%) |
| Legal Services & Support | 821 (52.0%) | 758 (48.0%) |
| Education Instruction & Library | 2,179 (26.8%) | 5,957 (73.2%) |
| Arts, Media & Entertainment | 908 (40.3%) | 1,344 (59.7%) |
| Health Diagnosing & Treating | 1,971 (17.6%) | 9,229 (82.4%) |
| Health Technologists | 1,377 (19.2%) | 5,786 (80.8%) |
| Total (Category) | 23,837 (43.4%) | 31,102 (56.6%) |
| Total (Overall) | 75,094 (51.3%) | 71,409 (48.7%) |
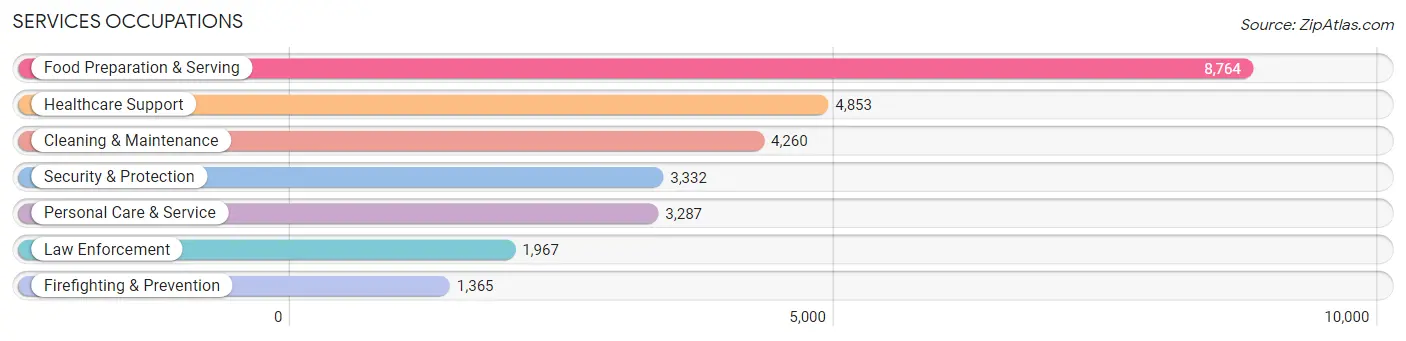
Services Occupations
The most common Services occupations in Lorain County are Food Preparation & Serving (8,764 | 6.0%), Healthcare Support (4,853 | 3.3%), Cleaning & Maintenance (4,260 | 2.9%), Security & Protection (3,332 | 2.3%), and Personal Care & Service (3,287 | 2.2%).
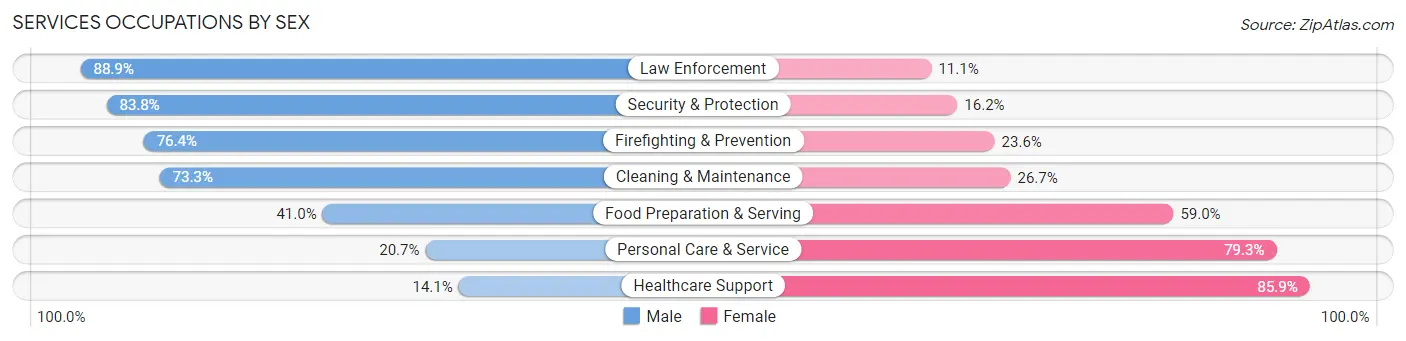
Services Occupations by Sex
Within the Services occupations in Lorain County, the most male-oriented occupations are Law Enforcement (88.9%), Security & Protection (83.8%), and Firefighting & Prevention (76.4%), while the most female-oriented occupations are Healthcare Support (85.9%), Personal Care & Service (79.3%), and Food Preparation & Serving (59.0%).
| Occupation | Male | Female |
| Healthcare Support | 683 (14.1%) | 4,170 (85.9%) |
| Security & Protection | 2,792 (83.8%) | 540 (16.2%) |
| Firefighting & Prevention | 1,043 (76.4%) | 322 (23.6%) |
| Law Enforcement | 1,749 (88.9%) | 218 (11.1%) |
| Food Preparation & Serving | 3,594 (41.0%) | 5,170 (59.0%) |
| Cleaning & Maintenance | 3,121 (73.3%) | 1,139 (26.7%) |
| Personal Care & Service | 679 (20.7%) | 2,608 (79.3%) |
| Total (Category) | 10,869 (44.4%) | 13,627 (55.6%) |
| Total (Overall) | 75,094 (51.3%) | 71,409 (48.7%) |
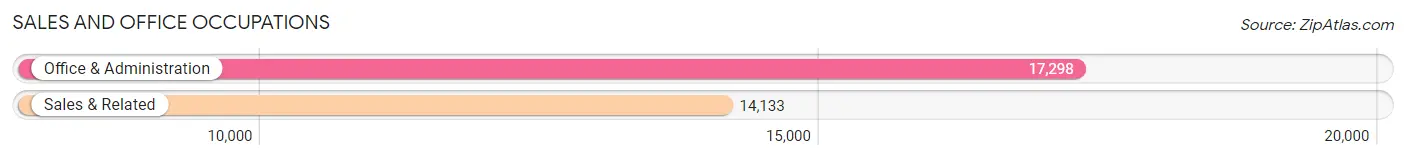
Sales and Office Occupations
The most common Sales and Office occupations in Lorain County are Office & Administration (17,298 | 11.8%), and Sales & Related (14,133 | 9.7%).
Sales and Office Occupations by Sex
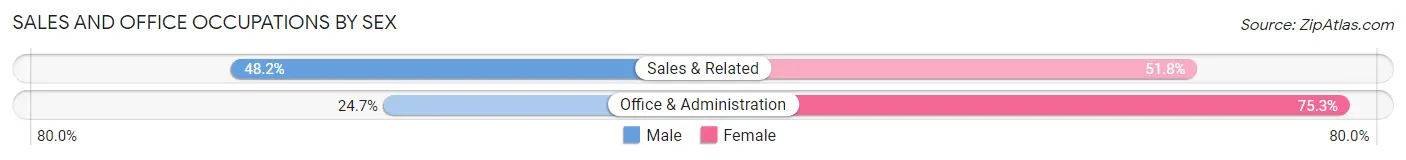
| Occupation | Male | Female |
| Sales & Related | 6,809 (48.2%) | 7,324 (51.8%) |
| Office & Administration | 4,276 (24.7%) | 13,022 (75.3%) |
| Total (Category) | 11,085 (35.3%) | 20,346 (64.7%) |
| Total (Overall) | 75,094 (51.3%) | 71,409 (48.7%) |
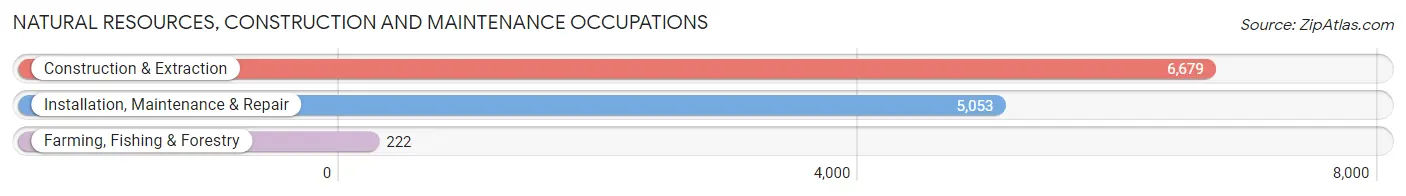
Natural Resources, Construction and Maintenance Occupations
The most common Natural Resources, Construction and Maintenance occupations in Lorain County are Construction & Extraction (6,679 | 4.6%), Installation, Maintenance & Repair (5,053 | 3.5%), and Farming, Fishing & Forestry (222 | 0.2%).
Natural Resources, Construction and Maintenance Occupations by Sex
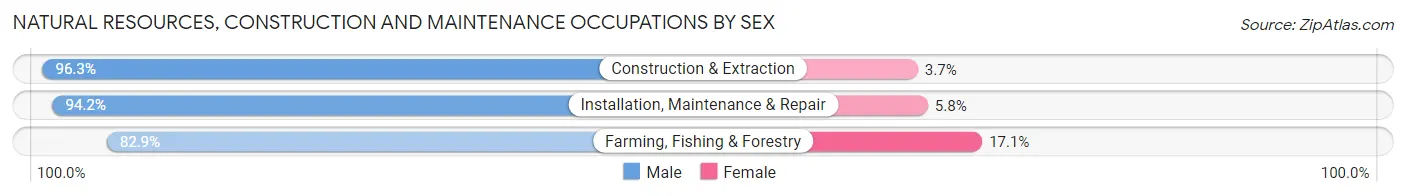
| Occupation | Male | Female |
| Farming, Fishing & Forestry | 184 (82.9%) | 38 (17.1%) |
| Construction & Extraction | 6,429 (96.3%) | 250 (3.7%) |
| Installation, Maintenance & Repair | 4,759 (94.2%) | 294 (5.8%) |
| Total (Category) | 11,372 (95.1%) | 582 (4.9%) |
| Total (Overall) | 75,094 (51.3%) | 71,409 (48.7%) |
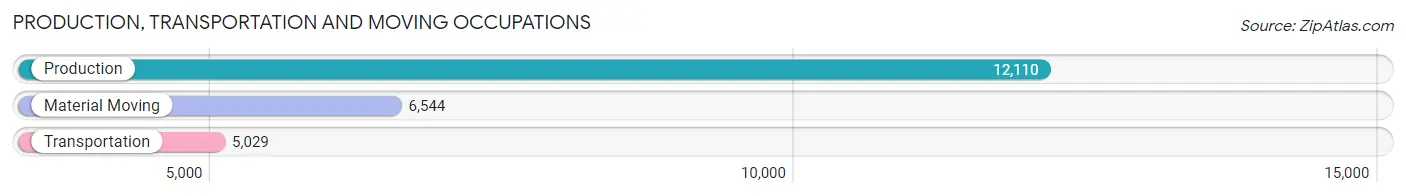
Production, Transportation and Moving Occupations
The most common Production, Transportation and Moving occupations in Lorain County are Production (12,110 | 8.3%), Material Moving (6,544 | 4.5%), and Transportation (5,029 | 3.4%).
Production, Transportation and Moving Occupations by Sex
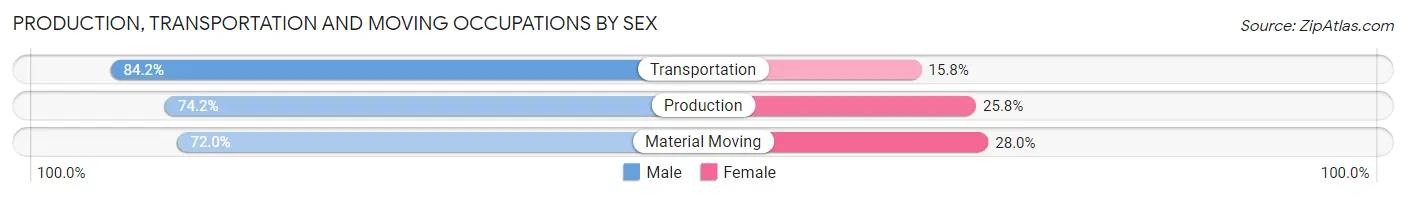
| Occupation | Male | Female |
| Production | 8,987 (74.2%) | 3,123 (25.8%) |
| Transportation | 4,235 (84.2%) | 794 (15.8%) |
| Material Moving | 4,709 (72.0%) | 1,835 (28.0%) |
| Total (Category) | 17,931 (75.7%) | 5,752 (24.3%) |
| Total (Overall) | 75,094 (51.3%) | 71,409 (48.7%) |
Employment Industries by Sex in Lorain County
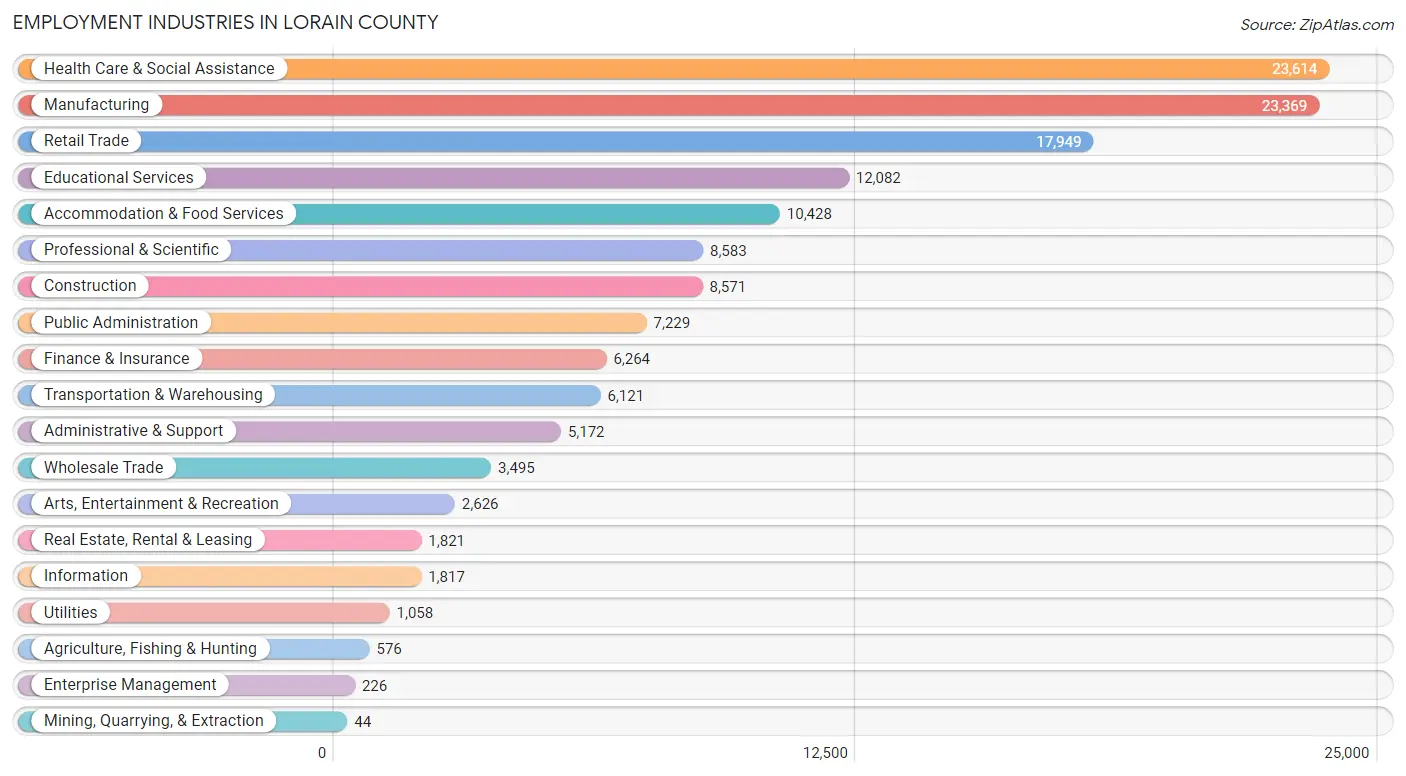
Employment Industries in Lorain County
The major employment industries in Lorain County include Health Care & Social Assistance (23,614 | 16.1%), Manufacturing (23,369 | 16.0%), Retail Trade (17,949 | 12.2%), Educational Services (12,082 | 8.3%), and Accommodation & Food Services (10,428 | 7.1%).
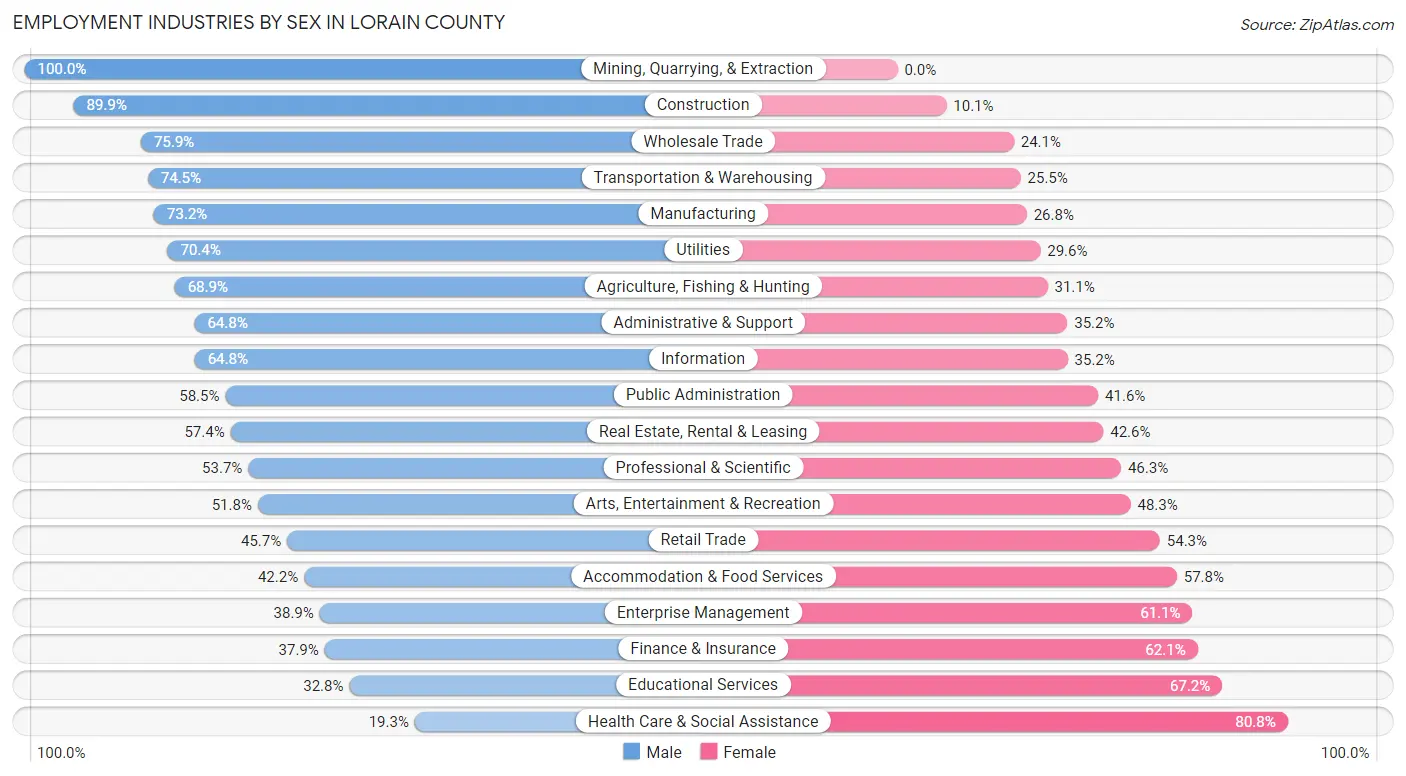
Employment Industries by Sex in Lorain County
The Lorain County industries that see more men than women are Mining, Quarrying, & Extraction (100.0%), Construction (89.9%), and Wholesale Trade (75.9%), whereas the industries that tend to have a higher number of women are Health Care & Social Assistance (80.7%), Educational Services (67.2%), and Finance & Insurance (62.1%).
| Industry | Male | Female |
| Agriculture, Fishing & Hunting | 397 (68.9%) | 179 (31.1%) |
| Mining, Quarrying, & Extraction | 44 (100.0%) | 0 (0.0%) |
| Construction | 7,703 (89.9%) | 868 (10.1%) |
| Manufacturing | 17,112 (73.2%) | 6,257 (26.8%) |
| Wholesale Trade | 2,653 (75.9%) | 842 (24.1%) |
| Retail Trade | 8,199 (45.7%) | 9,750 (54.3%) |
| Transportation & Warehousing | 4,560 (74.5%) | 1,561 (25.5%) |
| Utilities | 745 (70.4%) | 313 (29.6%) |
| Information | 1,177 (64.8%) | 640 (35.2%) |
| Finance & Insurance | 2,374 (37.9%) | 3,890 (62.1%) |
| Real Estate, Rental & Leasing | 1,045 (57.4%) | 776 (42.6%) |
| Professional & Scientific | 4,612 (53.7%) | 3,971 (46.3%) |
| Enterprise Management | 88 (38.9%) | 138 (61.1%) |
| Administrative & Support | 3,353 (64.8%) | 1,819 (35.2%) |
| Educational Services | 3,963 (32.8%) | 8,119 (67.2%) |
| Health Care & Social Assistance | 4,546 (19.3%) | 19,068 (80.7%) |
| Arts, Entertainment & Recreation | 1,359 (51.7%) | 1,267 (48.2%) |
| Accommodation & Food Services | 4,398 (42.2%) | 6,030 (57.8%) |
| Public Administration | 4,225 (58.5%) | 3,004 (41.5%) |
| Total | 75,094 (51.3%) | 71,409 (48.7%) |
Education in Lorain County
School Enrollment in Lorain County
The most common levels of schooling among the 72,925 students in Lorain County are high school (17,022 | 23.3%), college / undergraduate (15,625 | 21.4%), and middle school (15,060 | 20.6%).
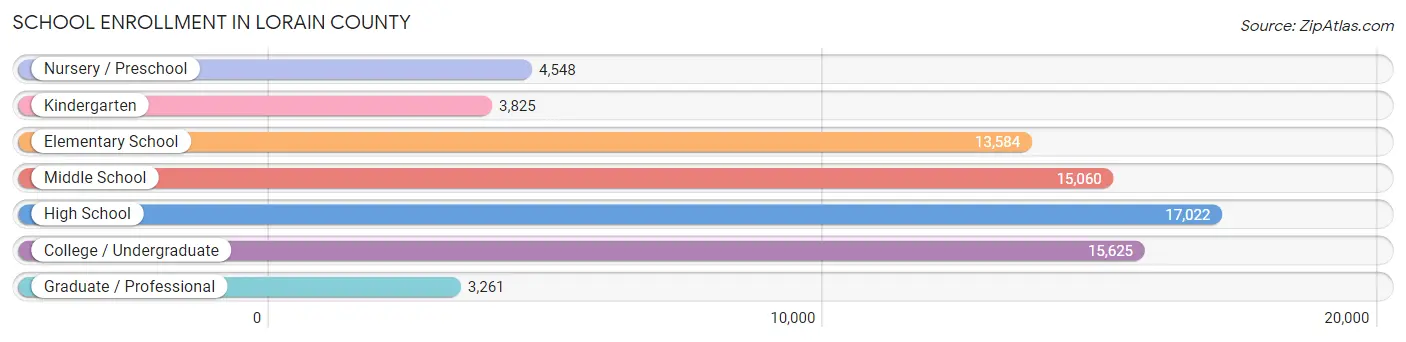
| School Level | # Students | % Students |
| Nursery / Preschool | 4,548 | 6.2% |
| Kindergarten | 3,825 | 5.2% |
| Elementary School | 13,584 | 18.6% |
| Middle School | 15,060 | 20.6% |
| High School | 17,022 | 23.3% |
| College / Undergraduate | 15,625 | 21.4% |
| Graduate / Professional | 3,261 | 4.5% |
| Total | 72,925 | 100.0% |
School Enrollment by Age by Funding Source in Lorain County
Out of a total of 72,925 students who are enrolled in schools in Lorain County, 15,898 (21.8%) attend a private institution, while the remaining 57,027 (78.2%) are enrolled in public schools. The age group of 3 to 4 year olds has the highest likelihood of being enrolled in private schools, with 1,334 (43.7% in the age bracket) enrolled. Conversely, the age group of 10 to 14 year olds has the lowest likelihood of being enrolled in a private school, with 16,315 (86.6% in the age bracket) attending a public institution.
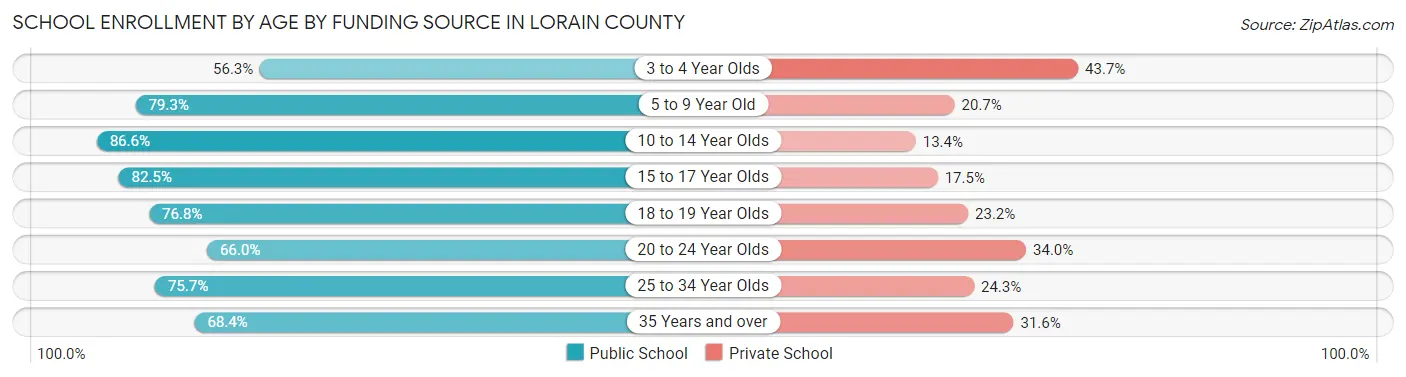
| Age Bracket | Public School | Private School |
| 3 to 4 Year Olds | 1,720 (56.3%) | 1,334 (43.7%) |
| 5 to 9 Year Old | 13,566 (79.3%) | 3,533 (20.7%) |
| 10 to 14 Year Olds | 16,315 (86.6%) | 2,534 (13.4%) |
| 15 to 17 Year Olds | 9,625 (82.5%) | 2,044 (17.5%) |
| 18 to 19 Year Olds | 4,659 (76.8%) | 1,406 (23.2%) |
| 20 to 24 Year Olds | 4,714 (66.0%) | 2,426 (34.0%) |
| 25 to 34 Year Olds | 2,802 (75.7%) | 899 (24.3%) |
| 35 Years and over | 3,656 (68.4%) | 1,692 (31.6%) |
| Total | 57,027 (78.2%) | 15,898 (21.8%) |
Educational Attainment by Field of Study in Lorain County
Business (14,417 | 22.7%), education (10,247 | 16.2%), science & technology (8,178 | 12.9%), engineering (4,167 | 6.6%), and arts & humanities (4,085 | 6.4%) are the most common fields of study among 63,401 individuals in Lorain County who have obtained a bachelor's degree or higher.
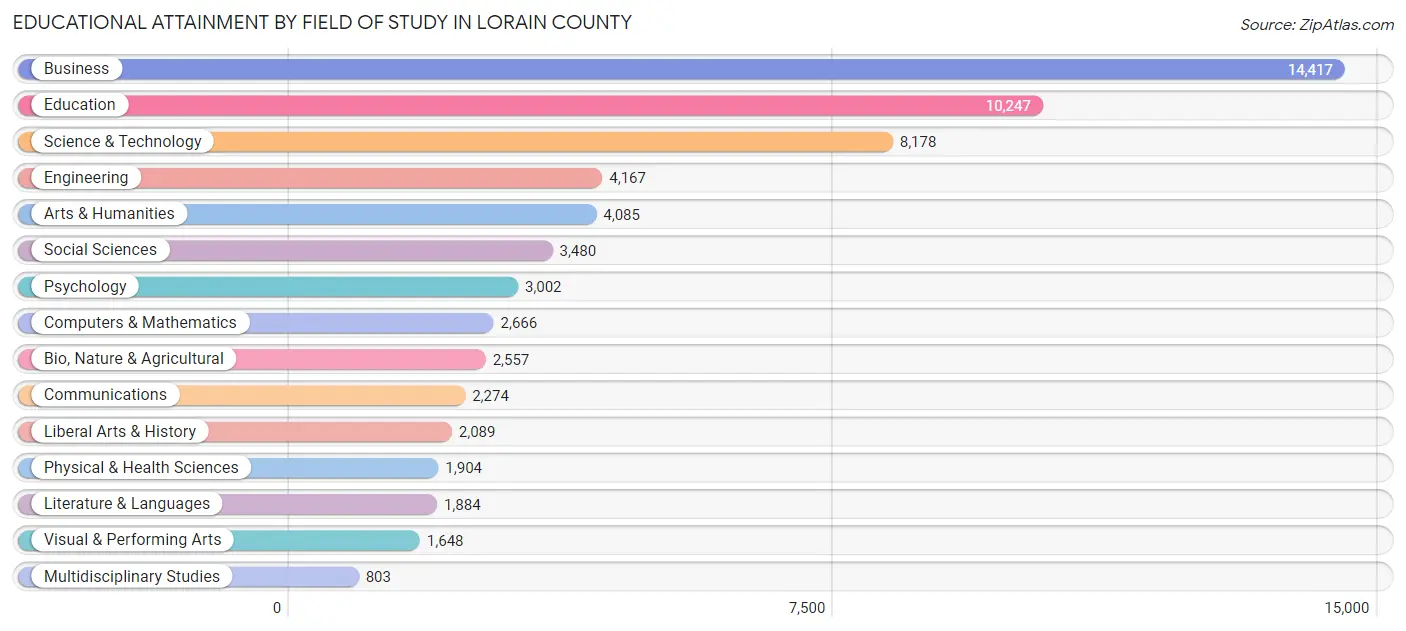
| Field of Study | # Graduates | % Graduates |
| Computers & Mathematics | 2,666 | 4.2% |
| Bio, Nature & Agricultural | 2,557 | 4.0% |
| Physical & Health Sciences | 1,904 | 3.0% |
| Psychology | 3,002 | 4.7% |
| Social Sciences | 3,480 | 5.5% |
| Engineering | 4,167 | 6.6% |
| Multidisciplinary Studies | 803 | 1.3% |
| Science & Technology | 8,178 | 12.9% |
| Business | 14,417 | 22.7% |
| Education | 10,247 | 16.2% |
| Literature & Languages | 1,884 | 3.0% |
| Liberal Arts & History | 2,089 | 3.3% |
| Visual & Performing Arts | 1,648 | 2.6% |
| Communications | 2,274 | 3.6% |
| Arts & Humanities | 4,085 | 6.4% |
| Total | 63,401 | 100.0% |
Transportation & Commute in Lorain County
Vehicle Availability by Sex in Lorain County
The most prevalent vehicle ownership categories in Lorain County are males with 2 vehicles (33,425, accounting for 45.3%) and females with 2 vehicles (27,920, making up 48.2%).
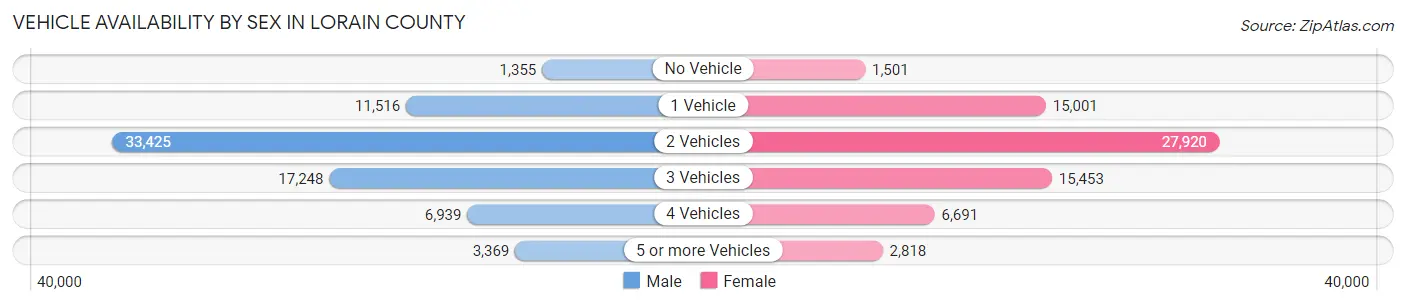
| Vehicles Available | Male | Female |
| No Vehicle | 1,355 (1.8%) | 1,501 (2.2%) |
| 1 Vehicle | 11,516 (15.6%) | 15,001 (21.6%) |
| 2 Vehicles | 33,425 (45.3%) | 27,920 (40.2%) |
| 3 Vehicles | 17,248 (23.4%) | 15,453 (22.3%) |
| 4 Vehicles | 6,939 (9.4%) | 6,691 (9.6%) |
| 5 or more Vehicles | 3,369 (4.6%) | 2,818 (4.1%) |
| Total | 73,852 (100.0%) | 69,384 (100.0%) |
Commute Time in Lorain County
The most frequently occuring commute durations in Lorain County are 15 to 19 minutes (19,456 commuters, 14.7%), 20 to 24 minutes (18,938 commuters, 14.3%), and 30 to 34 minutes (18,790 commuters, 14.2%).
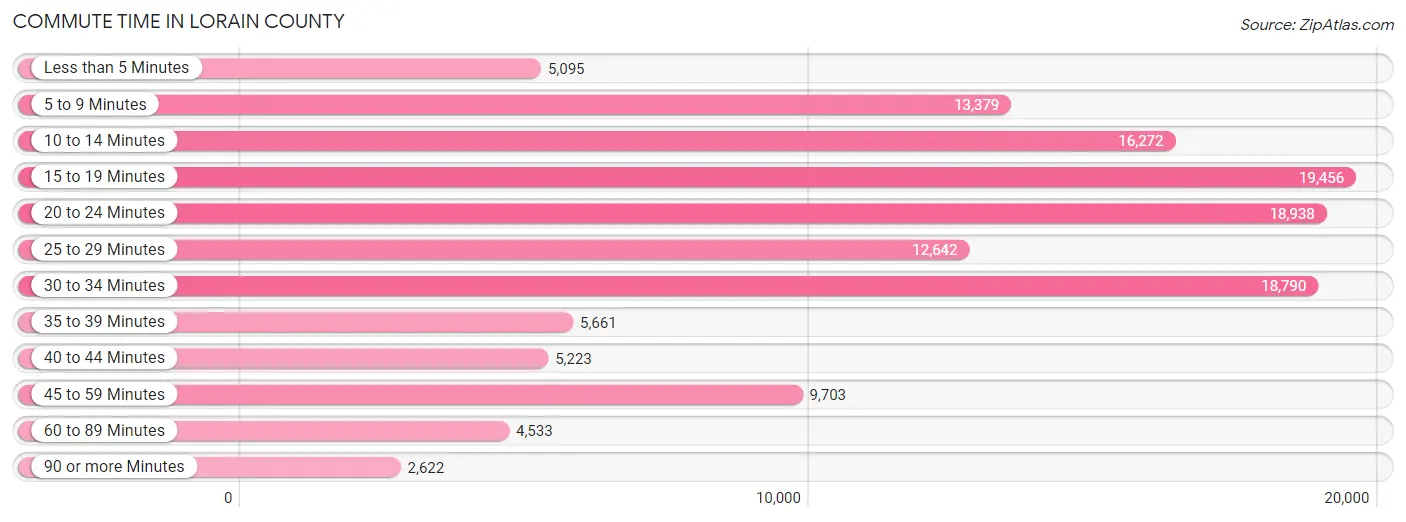
| Commute Time | # Commuters | % Commuters |
| Less than 5 Minutes | 5,095 | 3.8% |
| 5 to 9 Minutes | 13,379 | 10.1% |
| 10 to 14 Minutes | 16,272 | 12.3% |
| 15 to 19 Minutes | 19,456 | 14.7% |
| 20 to 24 Minutes | 18,938 | 14.3% |
| 25 to 29 Minutes | 12,642 | 9.6% |
| 30 to 34 Minutes | 18,790 | 14.2% |
| 35 to 39 Minutes | 5,661 | 4.3% |
| 40 to 44 Minutes | 5,223 | 4.0% |
| 45 to 59 Minutes | 9,703 | 7.3% |
| 60 to 89 Minutes | 4,533 | 3.4% |
| 90 or more Minutes | 2,622 | 2.0% |
Commute Time by Sex in Lorain County
The most common commute times in Lorain County are 30 to 34 minutes (10,293 commuters, 14.9%) for males and 15 to 19 minutes (9,867 commuters, 15.6%) for females.
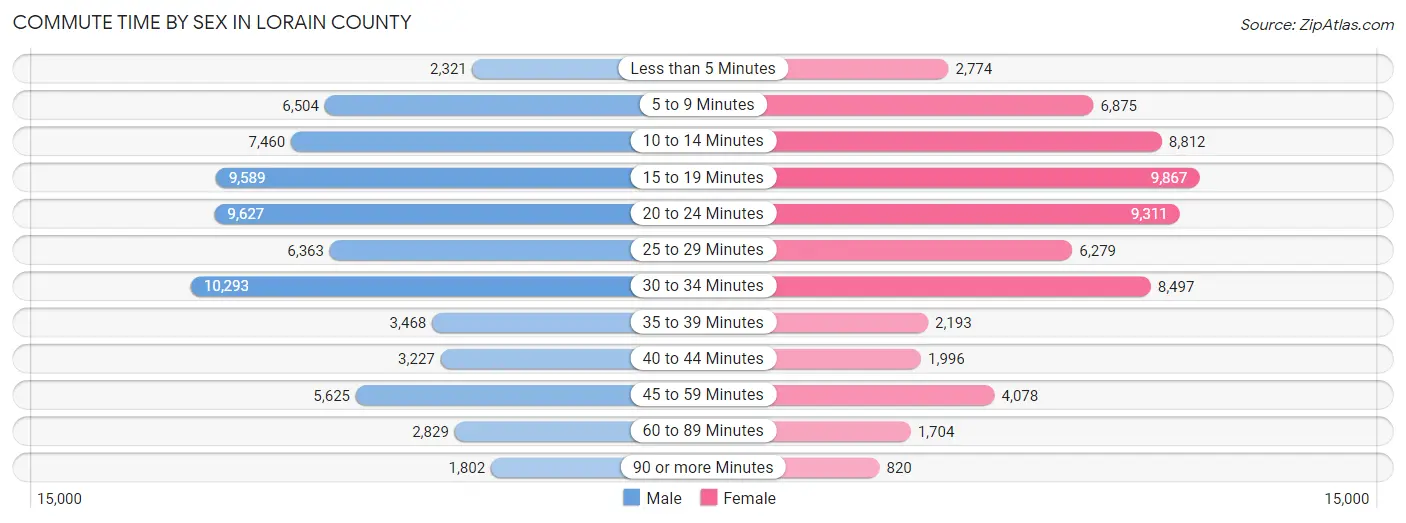
| Commute Time | Male | Female |
| Less than 5 Minutes | 2,321 (3.4%) | 2,774 (4.4%) |
| 5 to 9 Minutes | 6,504 (9.4%) | 6,875 (10.9%) |
| 10 to 14 Minutes | 7,460 (10.8%) | 8,812 (13.9%) |
| 15 to 19 Minutes | 9,589 (13.9%) | 9,867 (15.6%) |
| 20 to 24 Minutes | 9,627 (13.9%) | 9,311 (14.7%) |
| 25 to 29 Minutes | 6,363 (9.2%) | 6,279 (9.9%) |
| 30 to 34 Minutes | 10,293 (14.9%) | 8,497 (13.4%) |
| 35 to 39 Minutes | 3,468 (5.0%) | 2,193 (3.5%) |
| 40 to 44 Minutes | 3,227 (4.7%) | 1,996 (3.2%) |
| 45 to 59 Minutes | 5,625 (8.1%) | 4,078 (6.5%) |
| 60 to 89 Minutes | 2,829 (4.1%) | 1,704 (2.7%) |
| 90 or more Minutes | 1,802 (2.6%) | 820 (1.3%) |
Time of Departure to Work by Sex in Lorain County
The most frequent times of departure to work in Lorain County are 7:00 AM to 7:29 AM (10,645, 15.4%) for males and 7:00 AM to 7:29 AM (9,818, 15.5%) for females.
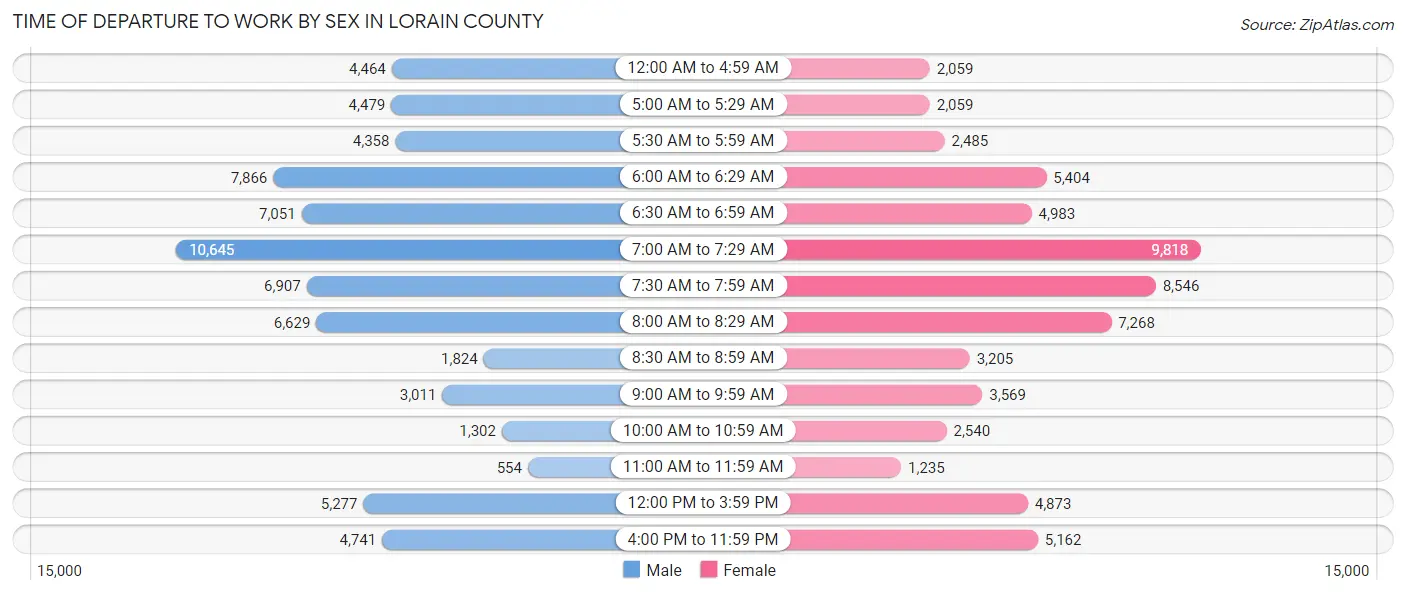
| Time of Departure | Male | Female |
| 12:00 AM to 4:59 AM | 4,464 (6.5%) | 2,059 (3.3%) |
| 5:00 AM to 5:29 AM | 4,479 (6.5%) | 2,059 (3.3%) |
| 5:30 AM to 5:59 AM | 4,358 (6.3%) | 2,485 (3.9%) |
| 6:00 AM to 6:29 AM | 7,866 (11.4%) | 5,404 (8.6%) |
| 6:30 AM to 6:59 AM | 7,051 (10.2%) | 4,983 (7.9%) |
| 7:00 AM to 7:29 AM | 10,645 (15.4%) | 9,818 (15.5%) |
| 7:30 AM to 7:59 AM | 6,907 (10.0%) | 8,546 (13.5%) |
| 8:00 AM to 8:29 AM | 6,629 (9.6%) | 7,268 (11.5%) |
| 8:30 AM to 8:59 AM | 1,824 (2.6%) | 3,205 (5.1%) |
| 9:00 AM to 9:59 AM | 3,011 (4.4%) | 3,569 (5.7%) |
| 10:00 AM to 10:59 AM | 1,302 (1.9%) | 2,540 (4.0%) |
| 11:00 AM to 11:59 AM | 554 (0.8%) | 1,235 (1.9%) |
| 12:00 PM to 3:59 PM | 5,277 (7.6%) | 4,873 (7.7%) |
| 4:00 PM to 11:59 PM | 4,741 (6.9%) | 5,162 (8.2%) |
| Total | 69,108 (100.0%) | 63,206 (100.0%) |
Housing Occupancy in Lorain County
Occupancy by Ownership in Lorain County
Of the total 124,510 dwellings in Lorain County, owner-occupied units account for 90,707 (72.9%), while renter-occupied units make up 33,803 (27.2%).
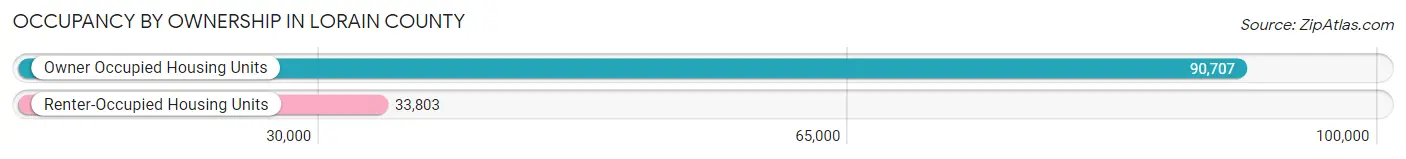
| Occupancy | # Housing Units | % Housing Units |
| Owner Occupied Housing Units | 90,707 | 72.9% |
| Renter-Occupied Housing Units | 33,803 | 27.2% |
| Total Occupied Housing Units | 124,510 | 100.0% |
Occupancy by Household Size in Lorain County
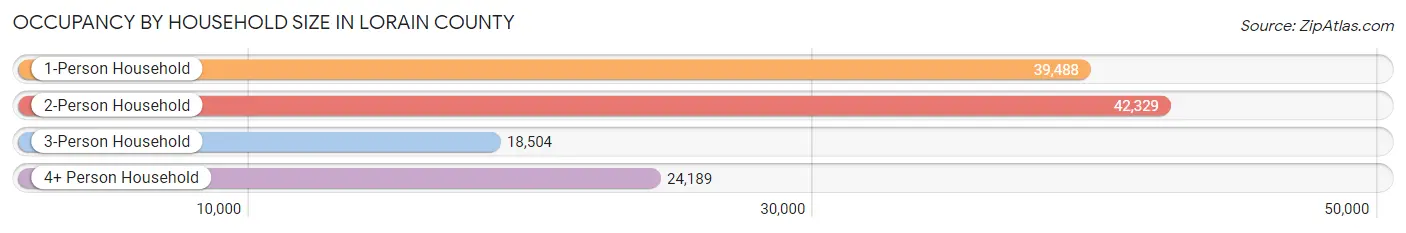
| Household Size | # Housing Units | % Housing Units |
| 1-Person Household | 39,488 | 31.7% |
| 2-Person Household | 42,329 | 34.0% |
| 3-Person Household | 18,504 | 14.9% |
| 4+ Person Household | 24,189 | 19.4% |
| Total Housing Units | 124,510 | 100.0% |
Occupancy by Ownership by Household Size in Lorain County
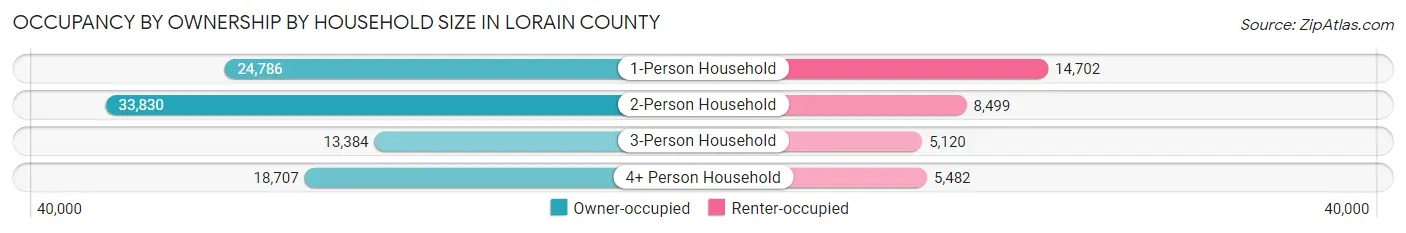
| Household Size | Owner-occupied | Renter-occupied |
| 1-Person Household | 24,786 (62.8%) | 14,702 (37.2%) |
| 2-Person Household | 33,830 (79.9%) | 8,499 (20.1%) |
| 3-Person Household | 13,384 (72.3%) | 5,120 (27.7%) |
| 4+ Person Household | 18,707 (77.3%) | 5,482 (22.7%) |
| Total Housing Units | 90,707 (72.9%) | 33,803 (27.2%) |
Occupancy by Educational Attainment in Lorain County
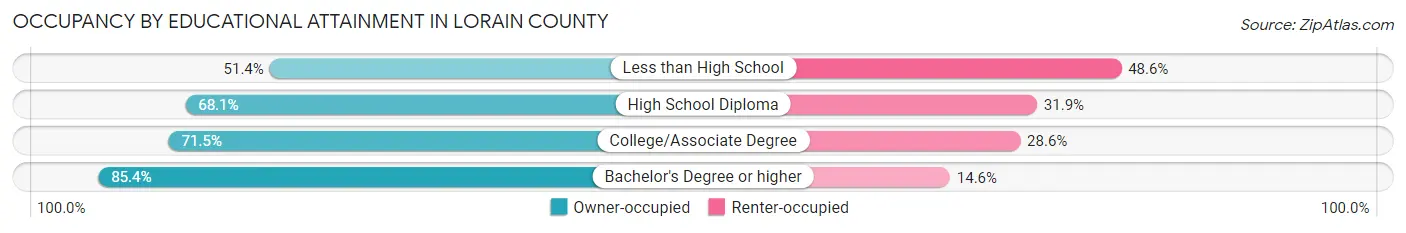
| Household Size | Owner-occupied | Renter-occupied |
| Less than High School | 5,025 (51.4%) | 4,748 (48.6%) |
| High School Diploma | 24,742 (68.1%) | 11,572 (31.9%) |
| College/Associate Degree | 30,875 (71.5%) | 12,337 (28.5%) |
| Bachelor's Degree or higher | 30,065 (85.4%) | 5,146 (14.6%) |
Occupancy by Age of Householder in Lorain County
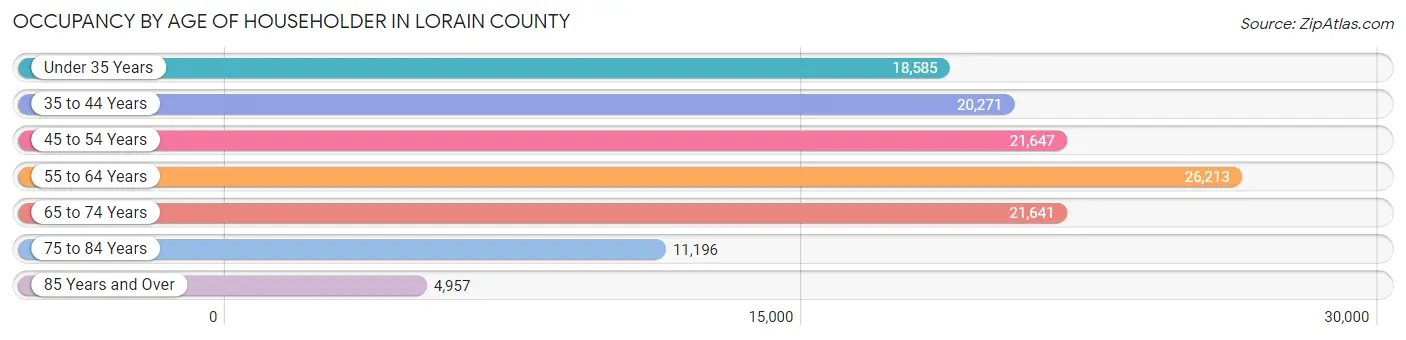
| Age Bracket | # Households | % Households |
| Under 35 Years | 18,585 | 14.9% |
| 35 to 44 Years | 20,271 | 16.3% |
| 45 to 54 Years | 21,647 | 17.4% |
| 55 to 64 Years | 26,213 | 21.0% |
| 65 to 74 Years | 21,641 | 17.4% |
| 75 to 84 Years | 11,196 | 9.0% |
| 85 Years and Over | 4,957 | 4.0% |
| Total | 124,510 | 100.0% |
Housing Finances in Lorain County
Median Income by Occupancy in Lorain County
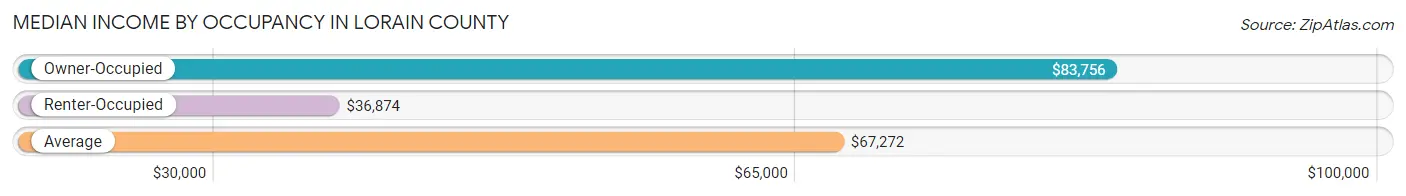
| Occupancy Type | # Households | Median Income |
| Owner-Occupied | 90,707 (72.9%) | $83,756 |
| Renter-Occupied | 33,803 (27.2%) | $36,874 |
| Average | 124,510 (100.0%) | $67,272 |
Occupancy by Householder Income Bracket in Lorain County
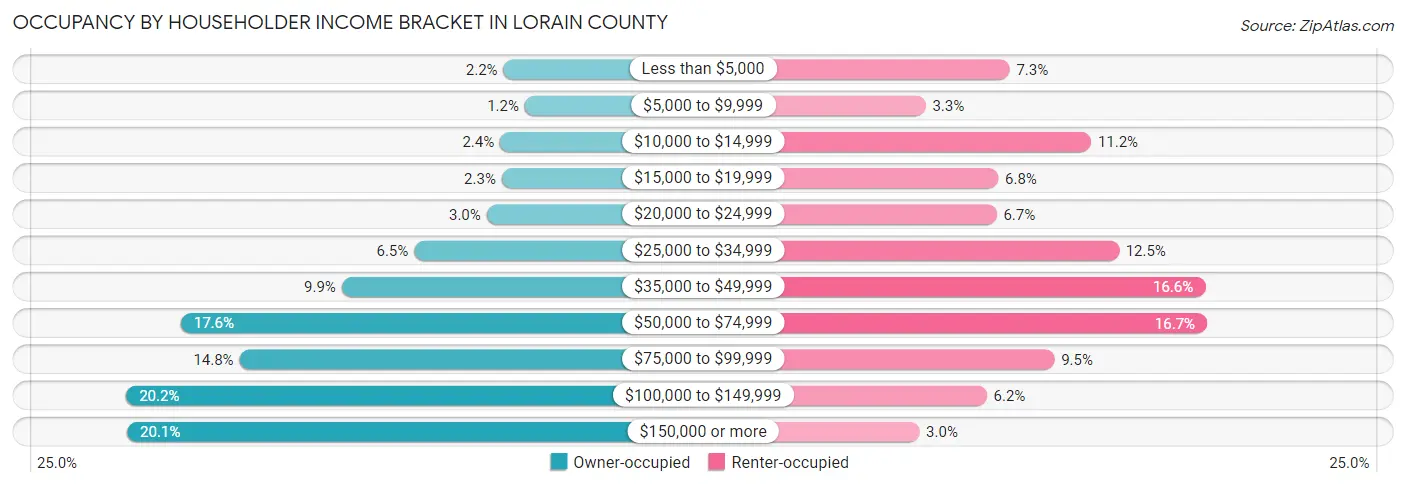
| Income Bracket | Owner-occupied | Renter-occupied |
| Less than $5,000 | 1,998 (2.2%) | 2,477 (7.3%) |
| $5,000 to $9,999 | 1,071 (1.2%) | 1,126 (3.3%) |
| $10,000 to $14,999 | 2,144 (2.4%) | 3,790 (11.2%) |
| $15,000 to $19,999 | 2,070 (2.3%) | 2,295 (6.8%) |
| $20,000 to $24,999 | 2,717 (3.0%) | 2,269 (6.7%) |
| $25,000 to $34,999 | 5,855 (6.5%) | 4,236 (12.5%) |
| $35,000 to $49,999 | 8,981 (9.9%) | 5,626 (16.6%) |
| $50,000 to $74,999 | 15,930 (17.6%) | 5,654 (16.7%) |
| $75,000 to $99,999 | 13,397 (14.8%) | 3,198 (9.5%) |
| $100,000 to $149,999 | 18,290 (20.2%) | 2,108 (6.2%) |
| $150,000 or more | 18,254 (20.1%) | 1,024 (3.0%) |
| Total | 90,707 (100.0%) | 33,803 (100.0%) |
Monthly Housing Cost Tiers in Lorain County
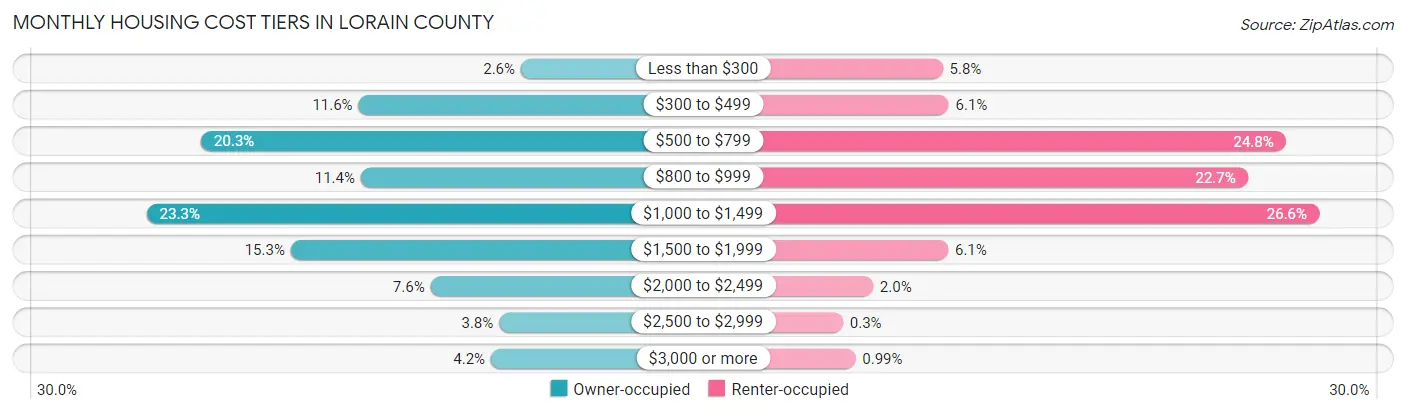
| Monthly Cost | Owner-occupied | Renter-occupied |
| Less than $300 | 2,351 (2.6%) | 1,963 (5.8%) |
| $300 to $499 | 10,486 (11.6%) | 2,077 (6.1%) |
| $500 to $799 | 18,377 (20.3%) | 8,367 (24.7%) |
| $800 to $999 | 10,367 (11.4%) | 7,658 (22.7%) |
| $1,000 to $1,499 | 21,095 (23.3%) | 8,988 (26.6%) |
| $1,500 to $1,999 | 13,879 (15.3%) | 2,066 (6.1%) |
| $2,000 to $2,499 | 6,872 (7.6%) | 664 (2.0%) |
| $2,500 to $2,999 | 3,437 (3.8%) | 101 (0.3%) |
| $3,000 or more | 3,843 (4.2%) | 334 (1.0%) |
| Total | 90,707 (100.0%) | 33,803 (100.0%) |
Physical Housing Characteristics in Lorain County
Housing Structures in Lorain County
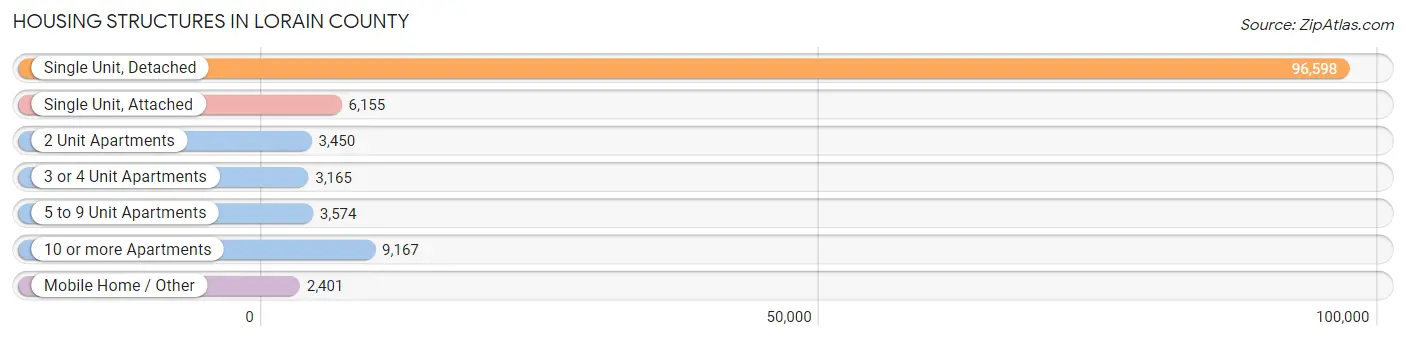
| Structure Type | # Housing Units | % Housing Units |
| Single Unit, Detached | 96,598 | 77.6% |
| Single Unit, Attached | 6,155 | 4.9% |
| 2 Unit Apartments | 3,450 | 2.8% |
| 3 or 4 Unit Apartments | 3,165 | 2.5% |
| 5 to 9 Unit Apartments | 3,574 | 2.9% |
| 10 or more Apartments | 9,167 | 7.4% |
| Mobile Home / Other | 2,401 | 1.9% |
| Total | 124,510 | 100.0% |
Housing Structures by Occupancy in Lorain County
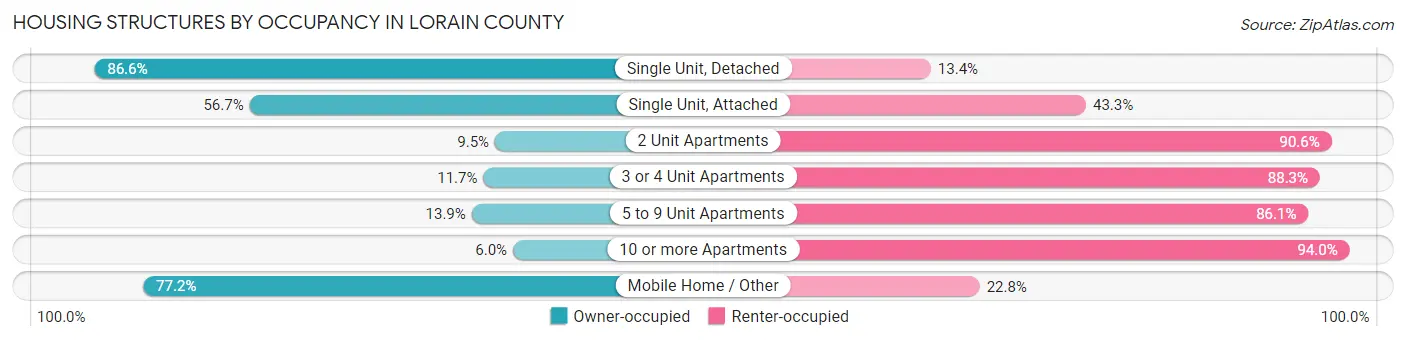
| Structure Type | Owner-occupied | Renter-occupied |
| Single Unit, Detached | 83,622 (86.6%) | 12,976 (13.4%) |
| Single Unit, Attached | 3,490 (56.7%) | 2,665 (43.3%) |
| 2 Unit Apartments | 326 (9.5%) | 3,124 (90.5%) |
| 3 or 4 Unit Apartments | 370 (11.7%) | 2,795 (88.3%) |
| 5 to 9 Unit Apartments | 498 (13.9%) | 3,076 (86.1%) |
| 10 or more Apartments | 548 (6.0%) | 8,619 (94.0%) |
| Mobile Home / Other | 1,853 (77.2%) | 548 (22.8%) |
| Total | 90,707 (72.9%) | 33,803 (27.2%) |
Housing Structures by Number of Rooms in Lorain County
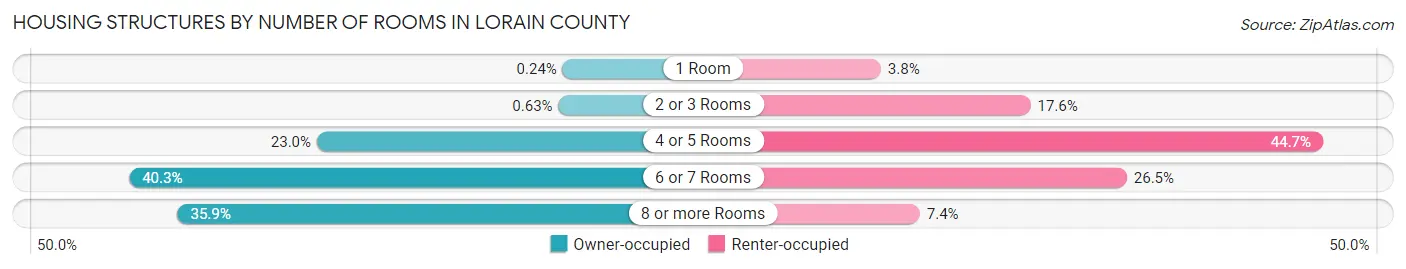
| Number of Rooms | Owner-occupied | Renter-occupied |
| 1 Room | 220 (0.2%) | 1,280 (3.8%) |
| 2 or 3 Rooms | 570 (0.6%) | 5,960 (17.6%) |
| 4 or 5 Rooms | 20,831 (23.0%) | 15,096 (44.7%) |
| 6 or 7 Rooms | 36,569 (40.3%) | 8,970 (26.5%) |
| 8 or more Rooms | 32,517 (35.8%) | 2,497 (7.4%) |
| Total | 90,707 (100.0%) | 33,803 (100.0%) |
Housing Structure by Heating Type in Lorain County
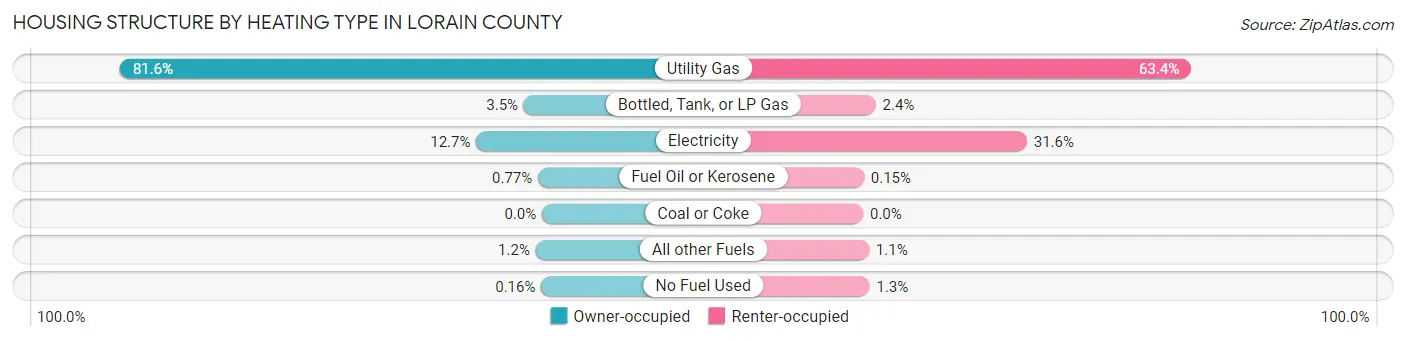
| Heating Type | Owner-occupied | Renter-occupied |
| Utility Gas | 74,024 (81.6%) | 21,431 (63.4%) |
| Bottled, Tank, or LP Gas | 3,181 (3.5%) | 819 (2.4%) |
| Electricity | 11,536 (12.7%) | 10,695 (31.6%) |
| Fuel Oil or Kerosene | 702 (0.8%) | 52 (0.2%) |
| Coal or Coke | 1 (0.0%) | 0 (0.0%) |
| All other Fuels | 1,119 (1.2%) | 383 (1.1%) |
| No Fuel Used | 144 (0.2%) | 423 (1.3%) |
| Total | 90,707 (100.0%) | 33,803 (100.0%) |
Household Vehicle Usage in Lorain County
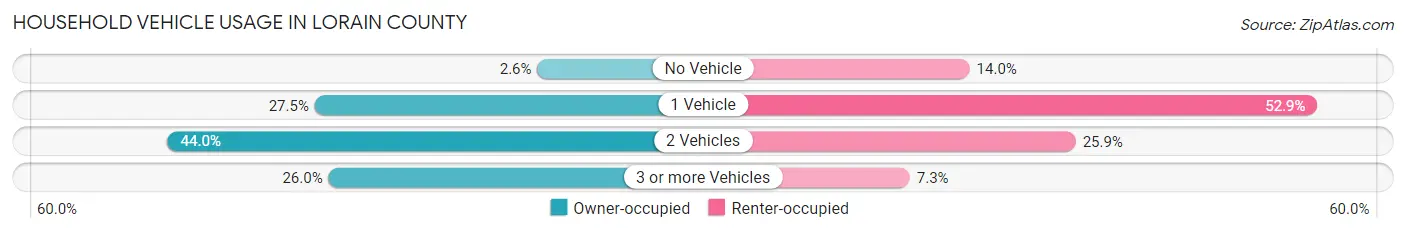
| Vehicles per Household | Owner-occupied | Renter-occupied |
| No Vehicle | 2,325 (2.6%) | 4,721 (14.0%) |
| 1 Vehicle | 24,943 (27.5%) | 17,887 (52.9%) |
| 2 Vehicles | 39,888 (44.0%) | 8,737 (25.9%) |
| 3 or more Vehicles | 23,551 (26.0%) | 2,458 (7.3%) |
| Total | 90,707 (100.0%) | 33,803 (100.0%) |
Real Estate & Mortgages in Lorain County
Real Estate and Mortgage Overview in Lorain County
| Characteristic | Without Mortgage | With Mortgage |
| Housing Units | 34,140 | 56,567 |
| Median Property Value | $171,700 | $204,200 |
| Median Household Income | $61,975 | $14,079 |
| Monthly Housing Costs | $591 | $3,750 |
| Real Estate Taxes | $2,626 | $1,078 |
Property Value by Mortgage Status in Lorain County
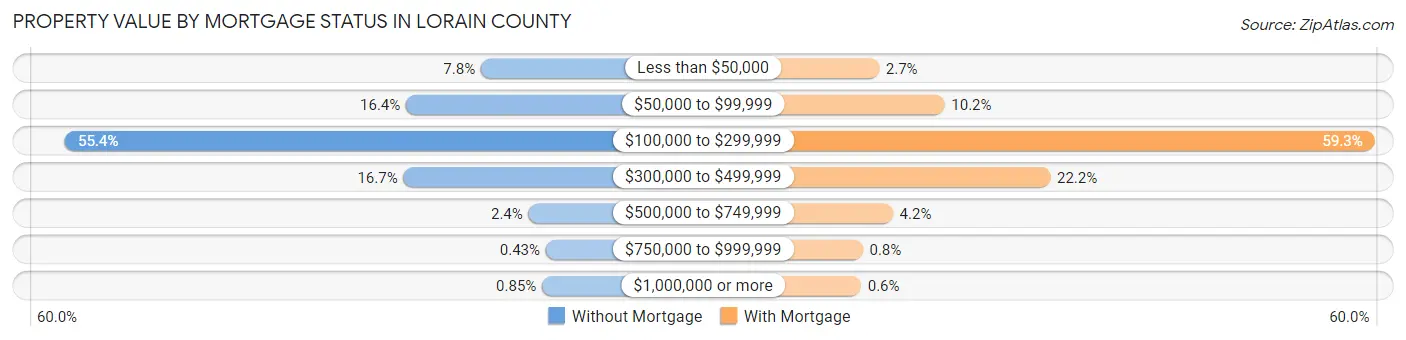
| Property Value | Without Mortgage | With Mortgage |
| Less than $50,000 | 2,676 (7.8%) | 1,502 (2.7%) |
| $50,000 to $99,999 | 5,600 (16.4%) | 5,739 (10.2%) |
| $100,000 to $299,999 | 18,904 (55.4%) | 33,555 (59.3%) |
| $300,000 to $499,999 | 5,701 (16.7%) | 12,576 (22.2%) |
| $500,000 to $749,999 | 820 (2.4%) | 2,401 (4.2%) |
| $750,000 to $999,999 | 148 (0.4%) | 454 (0.8%) |
| $1,000,000 or more | 291 (0.9%) | 340 (0.6%) |
| Total | 34,140 (100.0%) | 56,567 (100.0%) |
Household Income by Mortgage Status in Lorain County
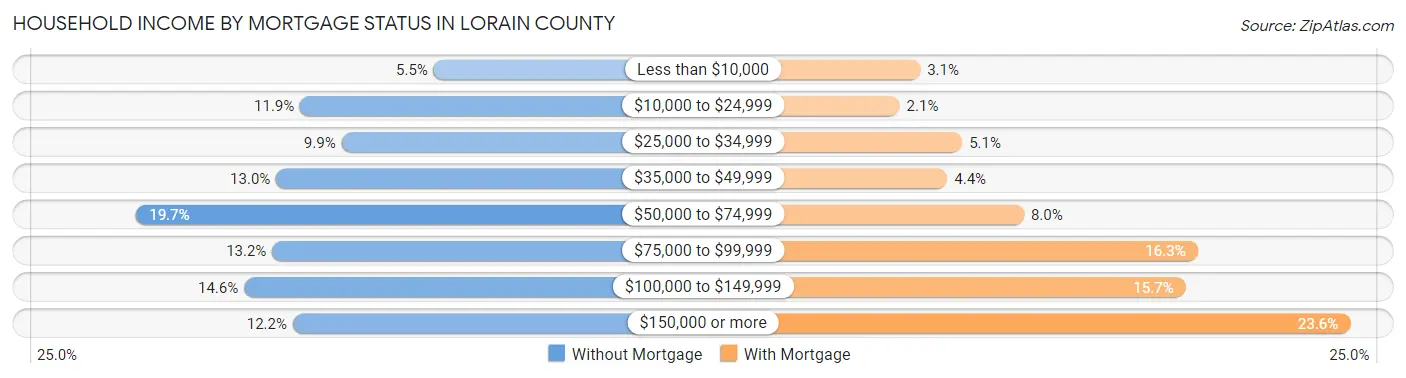
| Household Income | Without Mortgage | With Mortgage |
| Less than $10,000 | 1,883 (5.5%) | 1,743 (3.1%) |
| $10,000 to $24,999 | 4,056 (11.9%) | 1,186 (2.1%) |
| $25,000 to $34,999 | 3,383 (9.9%) | 2,875 (5.1%) |
| $35,000 to $49,999 | 4,444 (13.0%) | 2,472 (4.4%) |
| $50,000 to $74,999 | 6,720 (19.7%) | 4,537 (8.0%) |
| $75,000 to $99,999 | 4,510 (13.2%) | 9,210 (16.3%) |
| $100,000 to $149,999 | 4,969 (14.5%) | 8,887 (15.7%) |
| $150,000 or more | 4,175 (12.2%) | 13,321 (23.5%) |
| Total | 34,140 (100.0%) | 56,567 (100.0%) |
Property Value to Household Income Ratio in Lorain County
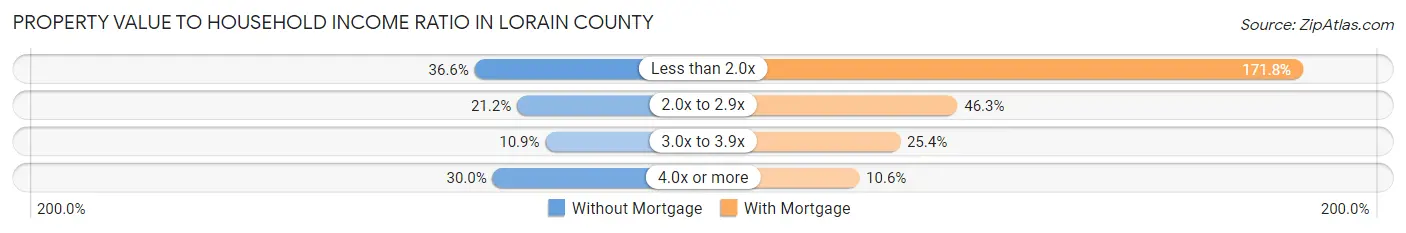
| Value-to-Income Ratio | Without Mortgage | With Mortgage |
| Less than 2.0x | 12,477 (36.5%) | 97,176 (171.8%) |
| 2.0x to 2.9x | 7,221 (21.1%) | 26,173 (46.3%) |
| 3.0x to 3.9x | 3,715 (10.9%) | 14,388 (25.4%) |
| 4.0x or more | 10,253 (30.0%) | 6,006 (10.6%) |
| Total | 34,140 (100.0%) | 56,567 (100.0%) |
Real Estate Taxes by Mortgage Status in Lorain County
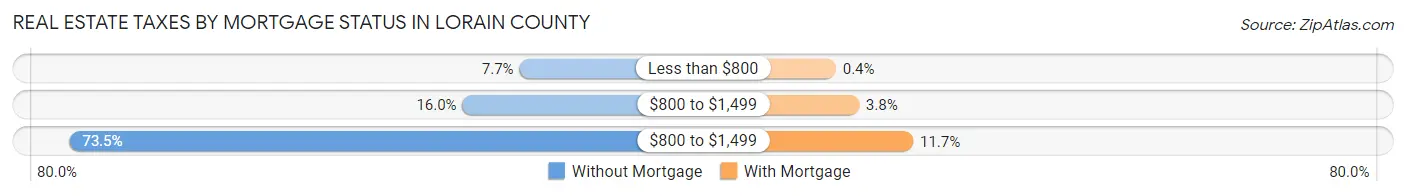
| Property Taxes | Without Mortgage | With Mortgage |
| Less than $800 | 2,629 (7.7%) | 224 (0.4%) |
| $800 to $1,499 | 5,470 (16.0%) | 2,140 (3.8%) |
| $800 to $1,499 | 25,080 (73.5%) | 6,612 (11.7%) |
| Total | 34,140 (100.0%) | 56,567 (100.0%) |
Health & Disability in Lorain County
Health Insurance Coverage by Age in Lorain County
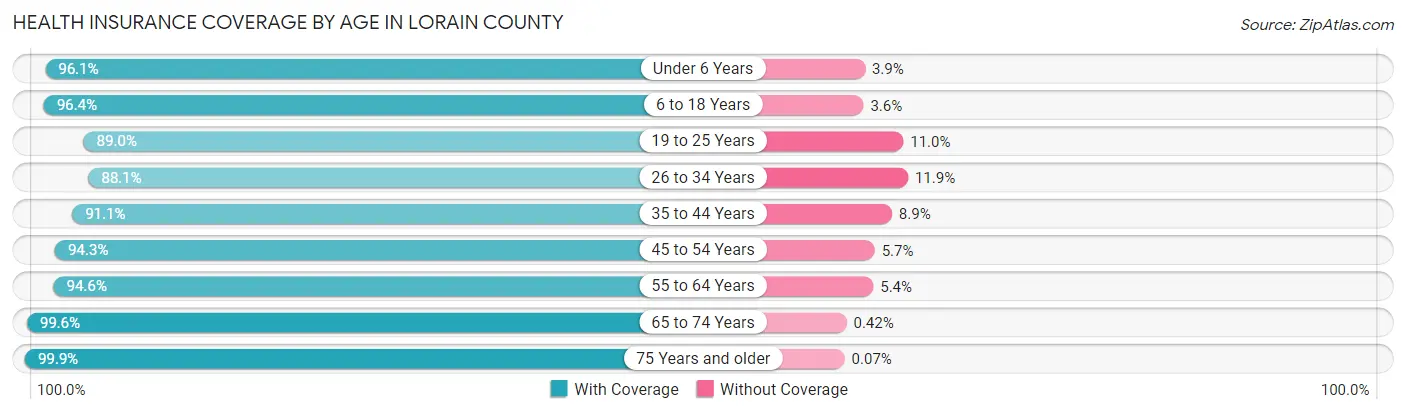
| Age Bracket | With Coverage | Without Coverage |
| Under 6 Years | 20,122 (96.1%) | 808 (3.9%) |
| 6 to 18 Years | 49,455 (96.4%) | 1,835 (3.6%) |
| 19 to 25 Years | 23,035 (89.0%) | 2,847 (11.0%) |
| 26 to 34 Years | 27,342 (88.1%) | 3,686 (11.9%) |
| 35 to 44 Years | 33,651 (91.1%) | 3,279 (8.9%) |
| 45 to 54 Years | 37,778 (94.3%) | 2,270 (5.7%) |
| 55 to 64 Years | 41,384 (94.6%) | 2,368 (5.4%) |
| 65 to 74 Years | 34,366 (99.6%) | 146 (0.4%) |
| 75 Years and older | 23,150 (99.9%) | 17 (0.1%) |
| Total | 290,283 (94.4%) | 17,256 (5.6%) |
Health Insurance Coverage by Citizenship Status in Lorain County
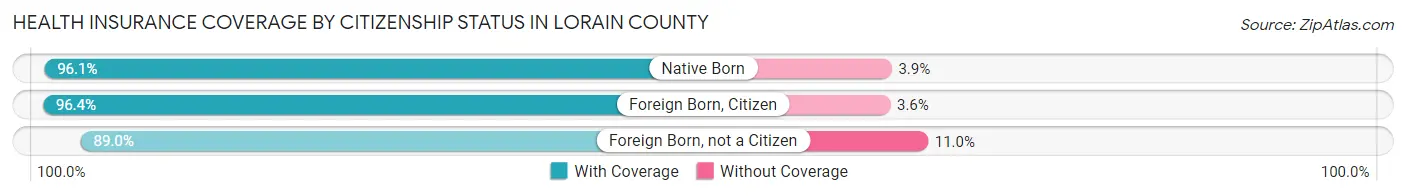
| Citizenship Status | With Coverage | Without Coverage |
| Native Born | 20,122 (96.1%) | 808 (3.9%) |
| Foreign Born, Citizen | 49,455 (96.4%) | 1,835 (3.6%) |
| Foreign Born, not a Citizen | 23,035 (89.0%) | 2,847 (11.0%) |
Health Insurance Coverage by Household Income in Lorain County
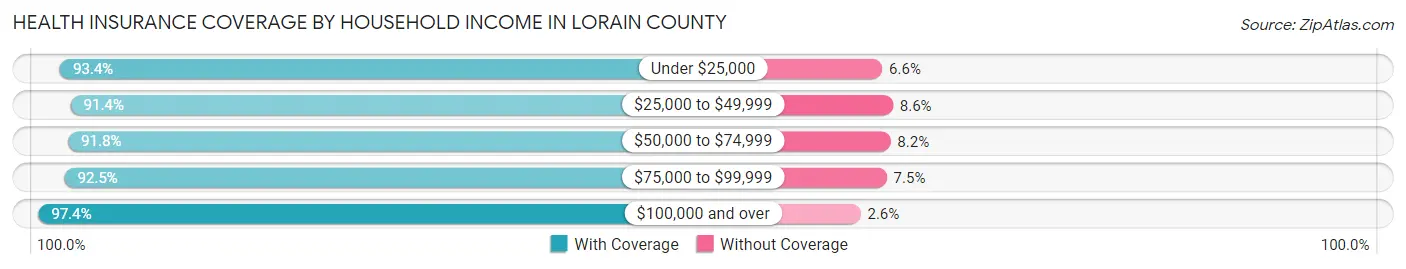
| Household Income | With Coverage | Without Coverage |
| Under $25,000 | 34,718 (93.4%) | 2,464 (6.6%) |
| $25,000 to $49,999 | 45,139 (91.4%) | 4,263 (8.6%) |
| $50,000 to $74,999 | 43,498 (91.8%) | 3,870 (8.2%) |
| $75,000 to $99,999 | 40,833 (92.5%) | 3,296 (7.5%) |
| $100,000 and over | 123,009 (97.4%) | 3,240 (2.6%) |
Public vs Private Health Insurance Coverage by Age in Lorain County
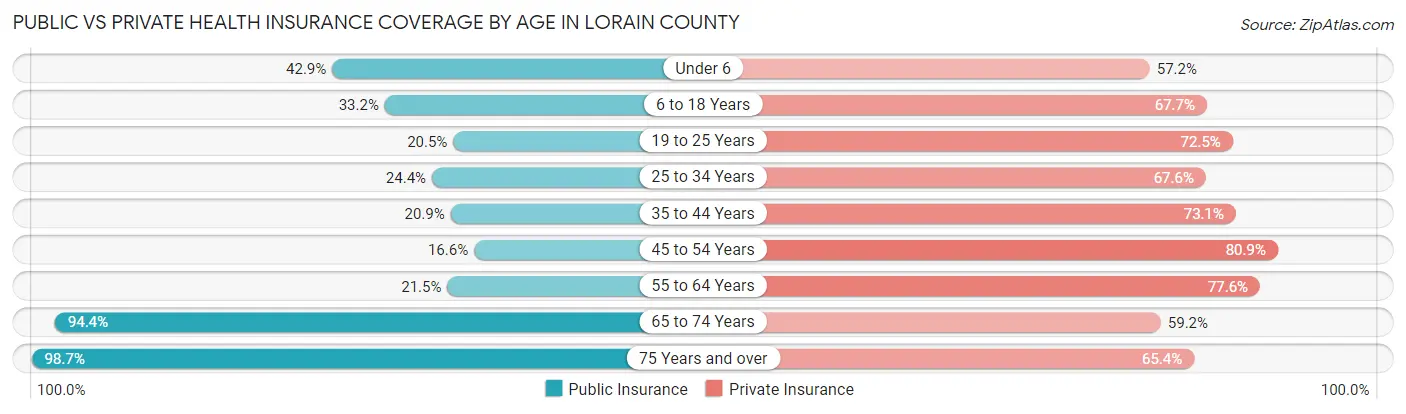
| Age Bracket | Public Insurance | Private Insurance |
| Under 6 | 8,983 (42.9%) | 11,966 (57.2%) |
| 6 to 18 Years | 17,003 (33.2%) | 34,745 (67.7%) |
| 19 to 25 Years | 5,294 (20.4%) | 18,776 (72.5%) |
| 25 to 34 Years | 7,571 (24.4%) | 20,958 (67.5%) |
| 35 to 44 Years | 7,734 (20.9%) | 27,006 (73.1%) |
| 45 to 54 Years | 6,645 (16.6%) | 32,403 (80.9%) |
| 55 to 64 Years | 9,422 (21.5%) | 33,955 (77.6%) |
| 65 to 74 Years | 32,571 (94.4%) | 20,438 (59.2%) |
| 75 Years and over | 22,870 (98.7%) | 15,144 (65.4%) |
| Total | 118,093 (38.4%) | 215,391 (70.0%) |
Disability Status by Sex by Age in Lorain County
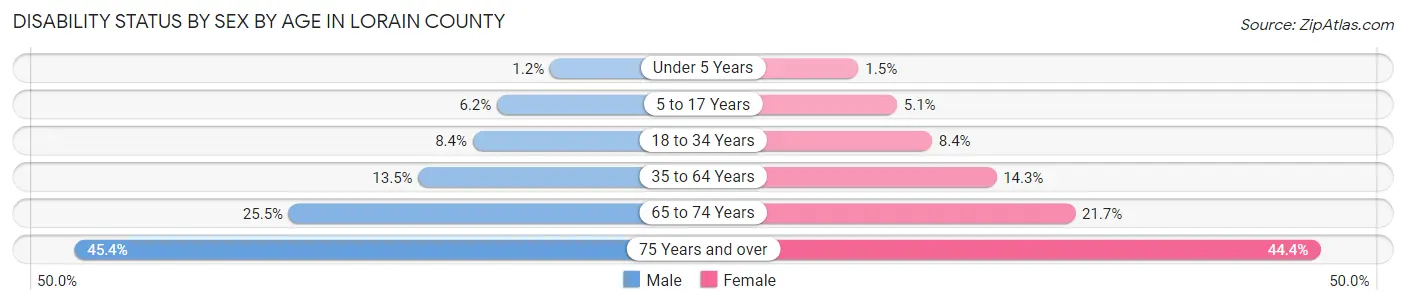
| Age Bracket | Male | Female |
| Under 5 Years | 108 (1.2%) | 127 (1.5%) |
| 5 to 17 Years | 1,608 (6.1%) | 1,264 (5.1%) |
| 18 to 34 Years | 2,608 (8.4%) | 2,526 (8.4%) |
| 35 to 64 Years | 7,971 (13.5%) | 8,813 (14.3%) |
| 65 to 74 Years | 4,112 (25.5%) | 3,978 (21.6%) |
| 75 Years and over | 4,309 (45.4%) | 6,068 (44.4%) |
Disability Class by Sex by Age in Lorain County
Disability Class: Hearing Difficulty
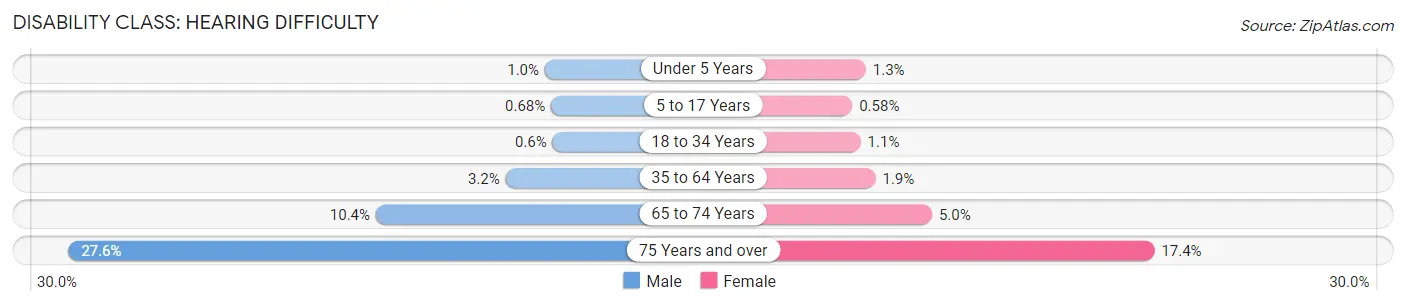
| Age Bracket | Male | Female |
| Under 5 Years | 90 (1.0%) | 111 (1.3%) |
| 5 to 17 Years | 177 (0.7%) | 143 (0.6%) |
| 18 to 34 Years | 186 (0.6%) | 316 (1.1%) |
| 35 to 64 Years | 1,907 (3.2%) | 1,154 (1.9%) |
| 65 to 74 Years | 1,685 (10.4%) | 923 (5.0%) |
| 75 Years and over | 2,618 (27.6%) | 2,380 (17.4%) |
Disability Class: Vision Difficulty
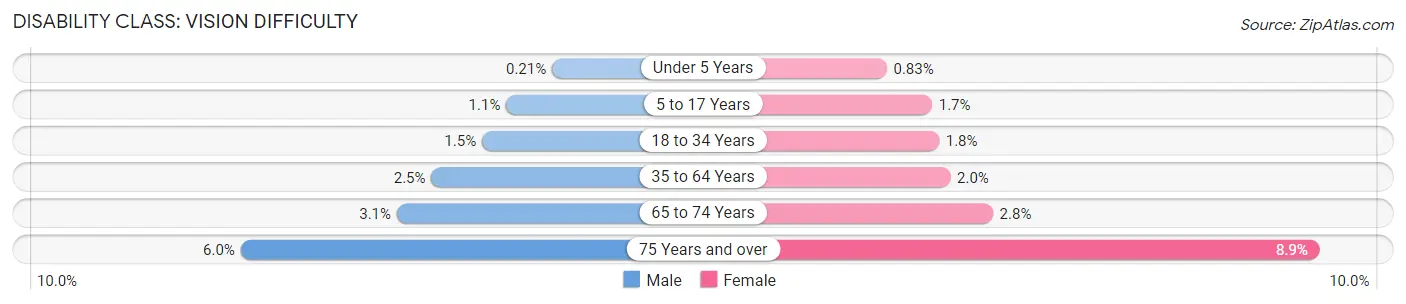
| Age Bracket | Male | Female |
| Under 5 Years | 18 (0.2%) | 69 (0.8%) |
| 5 to 17 Years | 276 (1.1%) | 414 (1.7%) |
| 18 to 34 Years | 469 (1.5%) | 544 (1.8%) |
| 35 to 64 Years | 1,453 (2.5%) | 1,238 (2.0%) |
| 65 to 74 Years | 498 (3.1%) | 515 (2.8%) |
| 75 Years and over | 569 (6.0%) | 1,213 (8.9%) |
Disability Class: Cognitive Difficulty
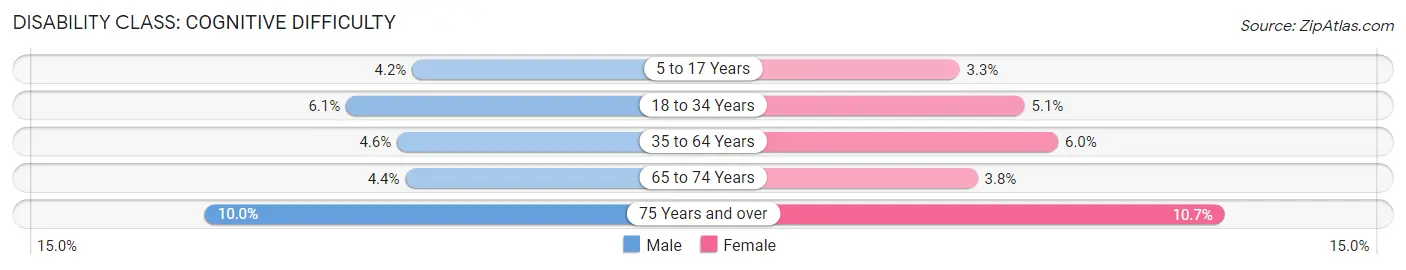
| Age Bracket | Male | Female |
| 5 to 17 Years | 1,102 (4.2%) | 812 (3.3%) |
| 18 to 34 Years | 1,878 (6.0%) | 1,538 (5.1%) |
| 35 to 64 Years | 2,745 (4.6%) | 3,699 (6.0%) |
| 65 to 74 Years | 711 (4.4%) | 694 (3.8%) |
| 75 Years and over | 948 (10.0%) | 1,458 (10.7%) |
Disability Class: Ambulatory Difficulty
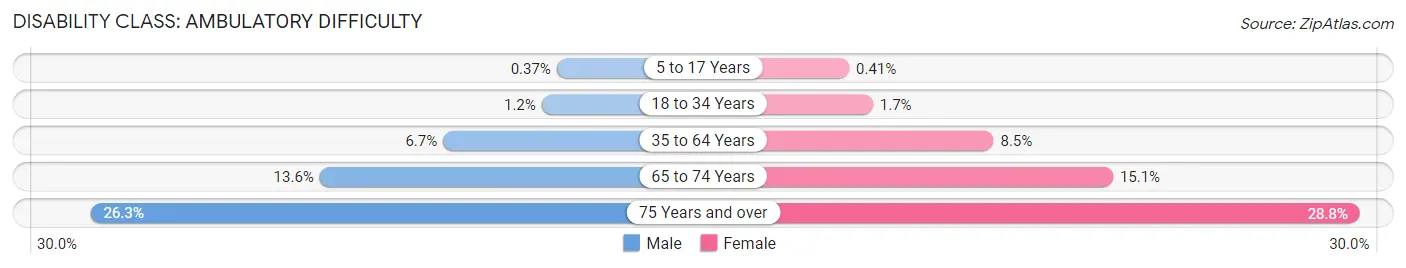
| Age Bracket | Male | Female |
| 5 to 17 Years | 97 (0.4%) | 101 (0.4%) |
| 18 to 34 Years | 376 (1.2%) | 522 (1.7%) |
| 35 to 64 Years | 3,969 (6.7%) | 5,194 (8.5%) |
| 65 to 74 Years | 2,190 (13.6%) | 2,773 (15.1%) |
| 75 Years and over | 2,500 (26.3%) | 3,943 (28.8%) |
Disability Class: Self-Care Difficulty
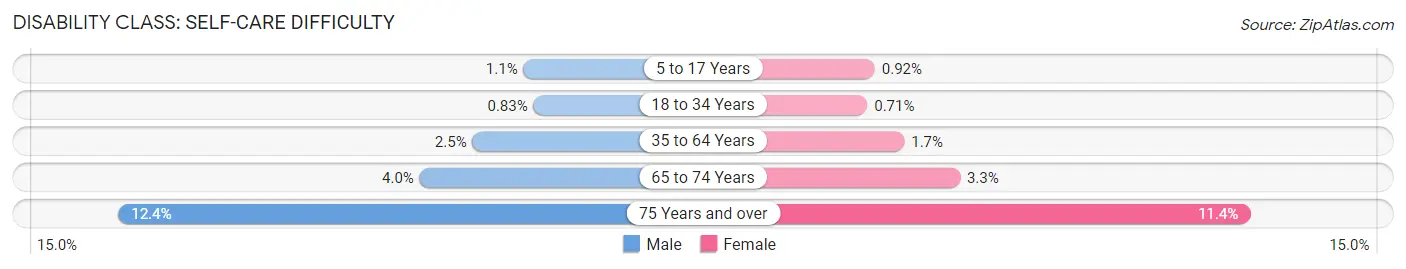
| Age Bracket | Male | Female |
| 5 to 17 Years | 291 (1.1%) | 227 (0.9%) |
| 18 to 34 Years | 258 (0.8%) | 214 (0.7%) |
| 35 to 64 Years | 1,498 (2.5%) | 1,068 (1.7%) |
| 65 to 74 Years | 645 (4.0%) | 605 (3.3%) |
| 75 Years and over | 1,176 (12.4%) | 1,554 (11.4%) |
Technology Access in Lorain County
Computing Device Access in Lorain County
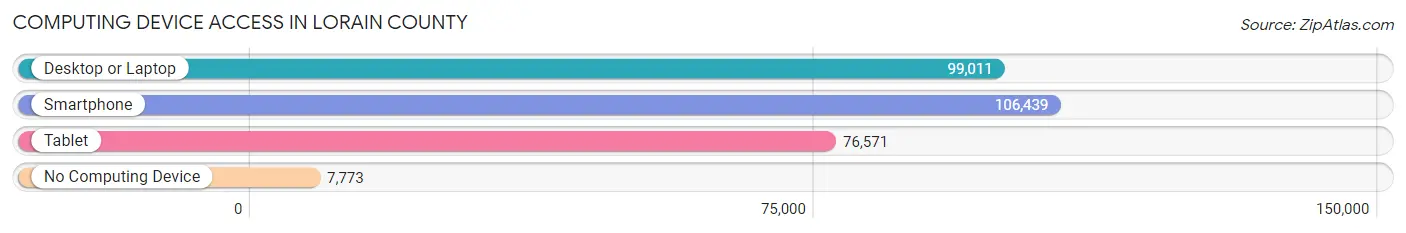
| Device Type | # Households | % Households |
| Desktop or Laptop | 99,011 | 79.5% |
| Smartphone | 106,439 | 85.5% |
| Tablet | 76,571 | 61.5% |
| No Computing Device | 7,773 | 6.2% |
| Total | 124,510 | 100.0% |
Internet Access in Lorain County
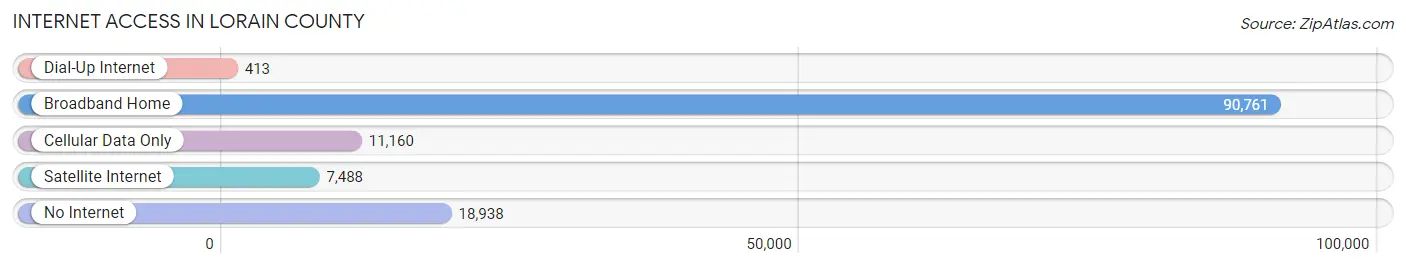
| Internet Type | # Households | % Households |
| Dial-Up Internet | 413 | 0.3% |
| Broadband Home | 90,761 | 72.9% |
| Cellular Data Only | 11,160 | 9.0% |
| Satellite Internet | 7,488 | 6.0% |
| No Internet | 18,938 | 15.2% |
| Total | 124,510 | 100.0% |
Lorain County Summary
Lorain County is located in the northeastern part of Ohio, along the southern shore of Lake Erie. It is bordered by Cuyahoga, Medina, Huron, Erie, and Sandusky counties. The county seat is Elyria, and the largest city is Lorain. The county was established in 1822 and named after the French province of Lorraine.
History
The area that is now Lorain County was originally inhabited by the Erie, Iroquois, and Wyandot Native American tribes. The first European settlers arrived in the area in the late 1700s. The county was officially established in 1822 and named after the French province of Lorraine.
In the early 1800s, the area was largely agricultural, with small towns and villages scattered throughout the county. The first railroad line was built in 1851, connecting Elyria and Oberlin. This allowed for the development of industry in the area, and by the late 1800s, Lorain County was home to several steel mills, coal mines, and other industries.
The Great Lakes region was hit hard by the Great Depression, and Lorain County was no exception. Many of the steel mills and other industries closed, leaving many people unemployed. The county was also hit hard by the Great Lakes Storm of 1913, which caused extensive damage to the area.
In the 1950s, the county began to experience a period of growth and prosperity. The steel mills and other industries began to reopen, and new businesses began to move into the area. The population of the county grew rapidly, and by the 2000s, Lorain County was one of the fastest-growing counties in Ohio.
Geography
Lorain County covers an area of 837 square miles, making it the fourth-largest county in Ohio. The county is located in the northeastern part of the state, along the southern shore of Lake Erie. The county is bordered by Cuyahoga, Medina, Huron, Erie, and Sandusky counties.
The county is mostly flat, with some rolling hills in the northern and western parts. The Black River runs through the county, and there are several small lakes and ponds scattered throughout the area. The county is home to several state parks, including Lakeview Park, Vermilion River Reservation, and Black River Reservation.
Economy
Lorain County has a diverse economy, with a mix of manufacturing, retail, and service industries. The county is home to several large employers, including Ford Motor Company, U.S. Steel, and Lorain Products. The county is also home to several smaller businesses, including restaurants, retail stores, and medical centers.
The county is also home to several educational institutions, including Lorain County Community College, Oberlin College, and the University of Akron. The county is also home to several tourist attractions, including the Lorain County Historical Society, the Lorain County Metro Parks, and the Lorain County Speedway.
Demographics
As of the 2010 census, the population of Lorain County was 301,356. The population is fairly evenly split between men and women, with 50.3% of the population being male and 49.7% being female. The median age of the population is 40.7 years.
The racial makeup of the county is 87.3% White, 8.2% African American, 1.2% Asian, 0.5% Native American, and 2.8% from other races. The largest ancestry groups in the county are German (25.3%), Irish (17.2%), and English (14.2%).
The median household income in the county is $50,945, and the median family income is $60,945. The per capita income in the county is $25,945. The poverty rate in the county is 11.3%.
Common Questions
What is the Total Population of Lorain County?
Total Population of Lorain County is 313,101.
What is the Total Male Population of Lorain County?
Total Male Population of Lorain County is 155,272.
What is the Total Female Population of Lorain County?
Total Female Population of Lorain County is 157,829.
What is the Ratio of Males per 100 Females in Lorain County?
There are 98.38 Males per 100 Females in Lorain County.
What is the Ratio of Females per 100 Males in Lorain County?
There are 101.65 Females per 100 Males in Lorain County.
What is the Median Population Age in Lorain County?
Median Population Age in Lorain County is 41.9 Years.
What is the Average Family Size in Lorain County
Average Family Size in Lorain County is 3.1 People.
What is the Average Household Size in Lorain County
Average Household Size in Lorain County is 2.5 People.
What is Per Capita Income in Lorain County?
Per Capita income in Lorain County is $37,171.
What is the Median Family Income in Lorain County?
Median Family Income in Lorain County is $88,934.
What is the Median Household income in Lorain County?
Median Household Income in Lorain County is $67,272.
What is Income or Wage Gap in Lorain County?
Income or Wage Gap in Lorain County is 30.7%.
Women in Lorain County earn 69.3 cents for every dollar earned by a man.
What is Family Income Deficit in Lorain County?
Family Income Deficit in Lorain County is $11,390.
Families that are below poverty line in Lorain County earn $11,390 less on average than the poverty threshold level.
What is Inequality or Gini Index in Lorain County?
Inequality or Gini Index in Lorain County is 0.46.
How Large is the Labor Force in Lorain County?
There are 153,542 People in the Labor Forcein in Lorain County.
What is the Percentage of People in the Labor Force in Lorain County?
60.6% of People are in the Labor Force in Lorain County.
What is the Unemployment Rate in Lorain County?
Unemployment Rate in Lorain County is 4.4%.