Logan County, OH
Logan County Map

Logan County Overview
46,098
TOTAL POPULATION
23,146
MALE POPULATION
22,952
FEMALE POPULATION
100.85
MALES / 100 FEMALES
99.16
FEMALES / 100 MALES
41.8
MEDIAN AGE
2.8
AVG FAMILY SIZE
2.4
AVG HOUSEHOLD SIZE
$36,215
PER CAPITA INCOME
$83,278
AVG FAMILY INCOME
$69,125
AVG HOUSEHOLD INCOME
31.0%
WAGE / INCOME GAP [ % ]
69.0¢/ $1
WAGE / INCOME GAP [ $ ]
$11,074
FAMILY INCOME DEFICIT
0.44
INEQUALITY / GINI INDEX
22,544
LABOR FORCE [ PEOPLE ]
60.8%
PERCENT IN LABOR FORCE
3.5%
UNEMPLOYMENT RATE
Logan County Area Codes
Race in Logan County
The most populous races in Logan County are White / Caucasian (43,041 | 93.4%), Two or more Races (1,630 | 3.5%), and Hispanic or Latino (915 | 2.0%).

| Race | # Population | % Population |
| Asian | 300 | 0.6% |
| Black / African American | 742 | 1.6% |
| Hawaiian / Pacific | 20 | 0.0% |
| Hispanic or Latino | 915 | 2.0% |
| Native / Alaskan | 49 | 0.1% |
| White / Caucasian | 43,041 | 93.4% |
| Two or more Races | 1,630 | 3.5% |
| Some other Race | 316 | 0.7% |
| Total | 46,098 | 100.0% |
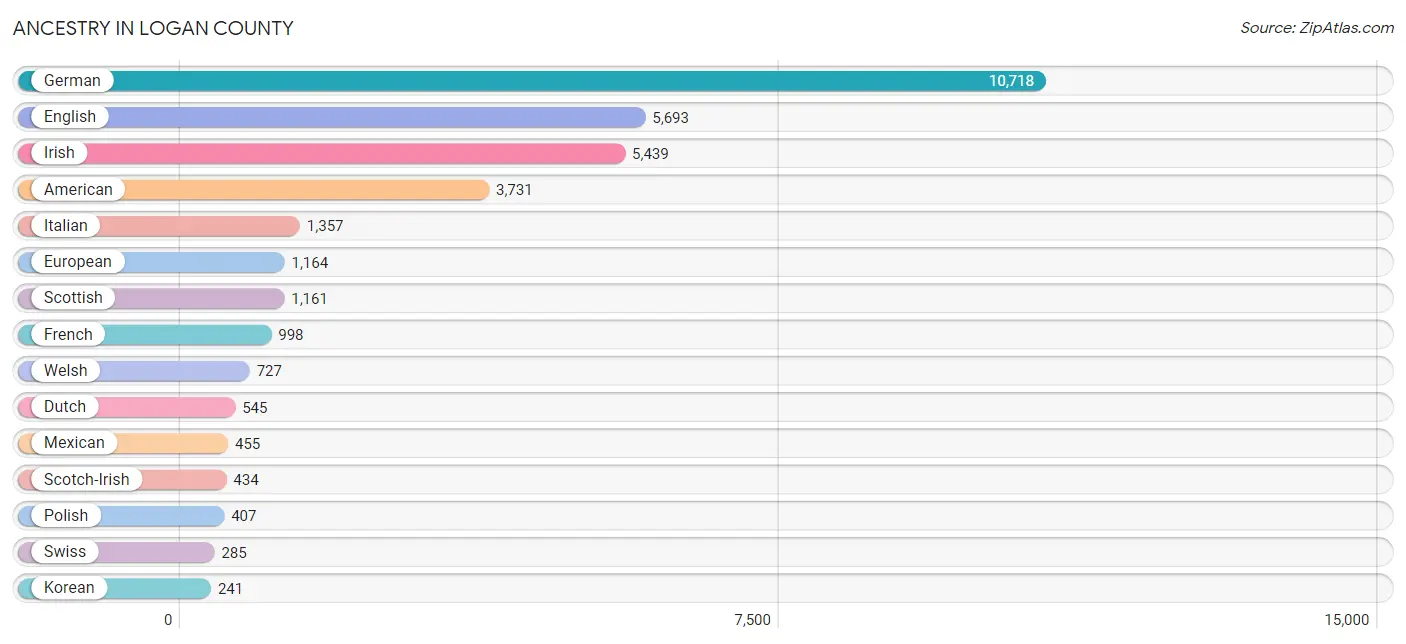
Ancestry in Logan County
The most populous ancestries reported in Logan County are German (10,718 | 23.3%), English (5,693 | 12.3%), Irish (5,439 | 11.8%), American (3,731 | 8.1%), and Italian (1,357 | 2.9%), together accounting for 58.4% of all Logan County residents.
| Ancestry | # Population | % Population |
| African | 31 | 0.1% |
| American | 3,731 | 8.1% |
| Arab | 61 | 0.1% |
| Australian | 29 | 0.1% |
| Austrian | 46 | 0.1% |
| Belgian | 44 | 0.1% |
| Bhutanese | 69 | 0.2% |
| Blackfeet | 11 | 0.0% |
| British | 133 | 0.3% |
| Burmese | 108 | 0.2% |
| Canadian | 91 | 0.2% |
| Celtic | 6 | 0.0% |
| Central American | 29 | 0.1% |
| Cherokee | 179 | 0.4% |
| Choctaw | 12 | 0.0% |
| Colombian | 32 | 0.1% |
| Costa Rican | 11 | 0.0% |
| Creek | 4 | 0.0% |
| Croatian | 3 | 0.0% |
| Czechoslovakian | 44 | 0.1% |
| Danish | 18 | 0.0% |
| Dutch | 545 | 1.2% |
| Eastern European | 65 | 0.1% |
| Ecuadorian | 7 | 0.0% |
| English | 5,693 | 12.3% |
| European | 1,164 | 2.5% |
| Fijian | 57 | 0.1% |
| Finnish | 13 | 0.0% |
| French | 998 | 2.2% |
| French Canadian | 186 | 0.4% |
| German | 10,718 | 23.3% |
| Ghanaian | 20 | 0.0% |
| Greek | 189 | 0.4% |
| Guamanian / Chamorro | 8 | 0.0% |
| Hungarian | 214 | 0.5% |
| Indian (Asian) | 71 | 0.2% |
| Irish | 5,439 | 11.8% |
| Iroquois | 6 | 0.0% |
| Italian | 1,357 | 2.9% |
| Korean | 241 | 0.5% |
| Lebanese | 26 | 0.1% |
| Lithuanian | 42 | 0.1% |
| Macedonian | 4 | 0.0% |
| Malaysian | 13 | 0.0% |
| Mexican | 455 | 1.0% |
| Mexican American Indian | 10 | 0.0% |
| Moroccan | 35 | 0.1% |
| Native Hawaiian | 4 | 0.0% |
| Navajo | 9 | 0.0% |
| Northern European | 26 | 0.1% |
| Norwegian | 49 | 0.1% |
| Panamanian | 18 | 0.0% |
| Pennsylvania German | 20 | 0.0% |
| Peruvian | 68 | 0.2% |
| Polish | 407 | 0.9% |
| Portuguese | 14 | 0.0% |
| Puerto Rican | 150 | 0.3% |
| Romanian | 85 | 0.2% |
| Russian | 162 | 0.4% |
| Samoan | 1 | 0.0% |
| Scandinavian | 188 | 0.4% |
| Scotch-Irish | 434 | 0.9% |
| Scottish | 1,161 | 2.5% |
| Sioux | 3 | 0.0% |
| Slovak | 33 | 0.1% |
| Slovene | 3 | 0.0% |
| South American | 130 | 0.3% |
| Spaniard | 86 | 0.2% |
| Sri Lankan | 6 | 0.0% |
| Subsaharan African | 51 | 0.1% |
| Swedish | 224 | 0.5% |
| Swiss | 285 | 0.6% |
| Thai | 66 | 0.1% |
| Ukrainian | 36 | 0.1% |
| Venezuelan | 23 | 0.1% |
| Welsh | 727 | 1.6% |
| Yugoslavian | 6 | 0.0% | View All 77 Rows |
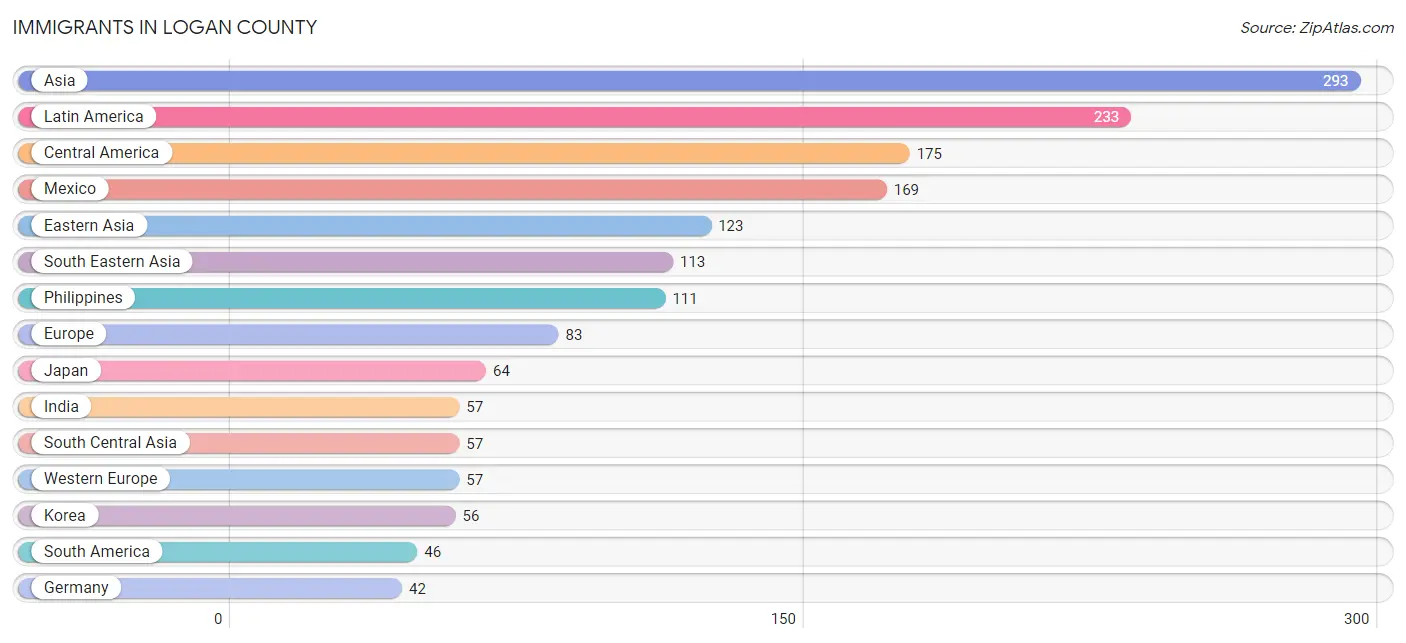
Immigrants in Logan County
The most numerous immigrant groups reported in Logan County came from Asia (293 | 0.6%), Latin America (233 | 0.5%), Central America (175 | 0.4%), Mexico (169 | 0.4%), and Eastern Asia (123 | 0.3%), together accounting for 2.2% of all Logan County residents.
| Immigration Origin | # Population | % Population |
| Africa | 20 | 0.0% |
| Argentina | 14 | 0.0% |
| Asia | 293 | 0.6% |
| Australia | 16 | 0.0% |
| Canada | 25 | 0.1% |
| Caribbean | 12 | 0.0% |
| Central America | 175 | 0.4% |
| China | 3 | 0.0% |
| Costa Rica | 6 | 0.0% |
| Eastern Asia | 123 | 0.3% |
| Eastern Europe | 15 | 0.0% |
| Ecuador | 7 | 0.0% |
| Europe | 83 | 0.2% |
| Germany | 42 | 0.1% |
| Ghana | 20 | 0.0% |
| India | 57 | 0.1% |
| Ireland | 11 | 0.0% |
| Japan | 64 | 0.1% |
| Korea | 56 | 0.1% |
| Latin America | 233 | 0.5% |
| Mexico | 169 | 0.4% |
| Netherlands | 15 | 0.0% |
| Northern Europe | 11 | 0.0% |
| Oceania | 16 | 0.0% |
| Philippines | 111 | 0.2% |
| South America | 46 | 0.1% |
| South Central Asia | 57 | 0.1% |
| South Eastern Asia | 113 | 0.3% |
| Ukraine | 15 | 0.0% |
| Venezuela | 25 | 0.1% |
| Vietnam | 2 | 0.0% |
| Western Africa | 20 | 0.0% |
| Western Europe | 57 | 0.1% | View All 33 Rows |
Sex and Age in Logan County
Sex and Age in Logan County
The most populous age groups in Logan County are 55 to 59 Years (1,845 | 8.0%) for men and 55 to 59 Years (1,802 | 7.9%) for women.

| Age Bracket | Male | Female |
| Under 5 Years | 1,383 (6.0%) | 1,240 (5.4%) |
| 5 to 9 Years | 1,547 (6.7%) | 1,173 (5.1%) |
| 10 to 14 Years | 1,590 (6.9%) | 1,640 (7.1%) |
| 15 to 19 Years | 1,540 (6.7%) | 1,461 (6.4%) |
| 20 to 24 Years | 1,311 (5.7%) | 1,180 (5.1%) |
| 25 to 29 Years | 1,361 (5.9%) | 1,295 (5.6%) |
| 30 to 34 Years | 1,260 (5.4%) | 1,392 (6.1%) |
| 35 to 39 Years | 1,167 (5.0%) | 1,383 (6.0%) |
| 40 to 44 Years | 1,644 (7.1%) | 1,278 (5.6%) |
| 45 to 49 Years | 1,417 (6.1%) | 1,396 (6.1%) |
| 50 to 54 Years | 1,516 (6.6%) | 1,502 (6.5%) |
| 55 to 59 Years | 1,845 (8.0%) | 1,802 (7.9%) |
| 60 to 64 Years | 1,619 (7.0%) | 1,531 (6.7%) |
| 65 to 69 Years | 1,347 (5.8%) | 1,656 (7.2%) |
| 70 to 74 Years | 1,221 (5.3%) | 1,123 (4.9%) |
| 75 to 79 Years | 635 (2.7%) | 853 (3.7%) |
| 80 to 84 Years | 512 (2.2%) | 625 (2.7%) |
| 85 Years and over | 231 (1.0%) | 422 (1.8%) |
| Total | 23,146 (100.0%) | 22,952 (100.0%) |
Families and Households in Logan County
Median Family Size in Logan County
The median family size in Logan County is 2.84 persons per family, with married-couple families (10,385 | 78.5%) accounting for the largest median family size of 2.9 persons per family. On the other hand, single male/father families (1,093 | 8.3%) represent the smallest median family size with 2.33 persons per family.

| Family Type | # Families | Family Size |
| Married-Couple | 10,385 (78.5%) | 2.90 |
| Single Male/Father | 1,093 (8.3%) | 2.33 |
| Single Female/Mother | 1,749 (13.2%) | 2.79 |
| Total Families | 13,227 (100.0%) | 2.84 |
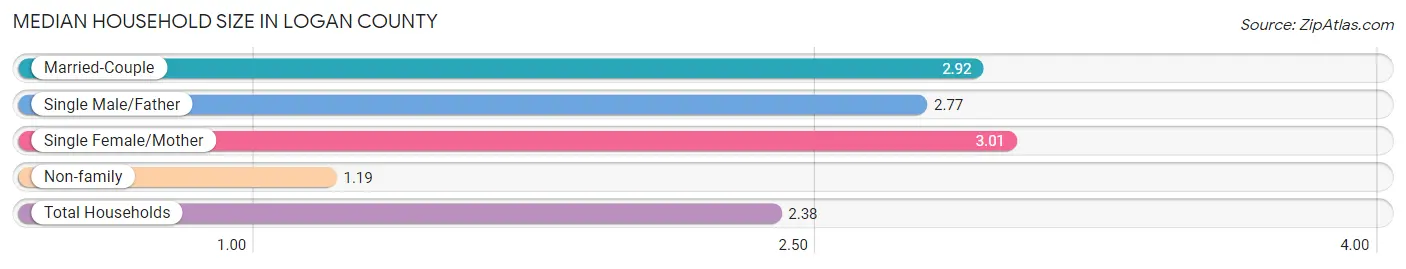
Median Household Size in Logan County
The median household size in Logan County is 2.38 persons per household, with single female/mother households (1,749 | 9.1%) accounting for the largest median household size of 3.01 persons per household. non-family households (5,941 | 31.0%) represent the smallest median household size with 1.19 persons per household.
| Household Type | # Households | Household Size |
| Married-Couple | 10,385 (54.2%) | 2.92 |
| Single Male/Father | 1,093 (5.7%) | 2.77 |
| Single Female/Mother | 1,749 (9.1%) | 3.01 |
| Non-family | 5,941 (31.0%) | 1.19 |
| Total Households | 19,168 (100.0%) | 2.38 |
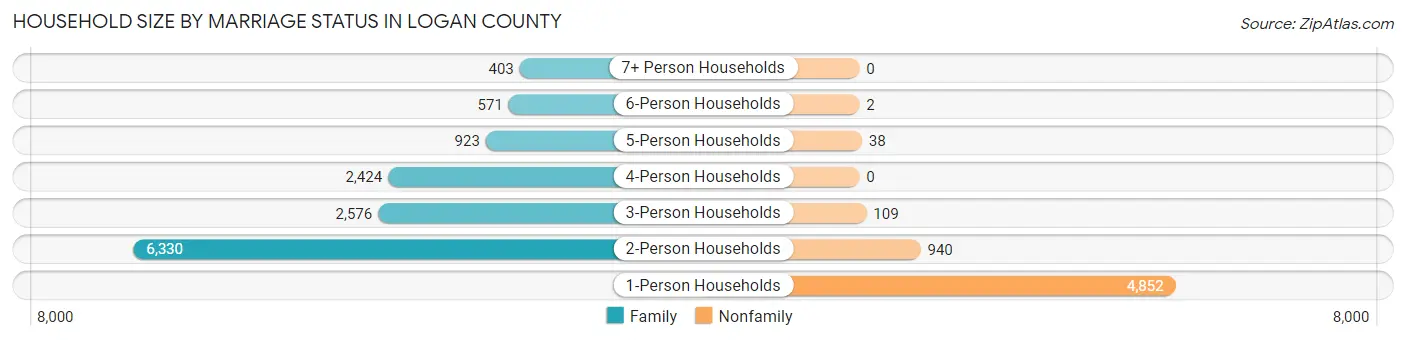
Household Size by Marriage Status in Logan County
Out of a total of 19,168 households in Logan County, 13,227 (69.0%) are family households, while 5,941 (31.0%) are nonfamily households. The most numerous type of family households are 2-person households, comprising 6,330, and the most common type of nonfamily households are 1-person households, comprising 4,852.
| Household Size | Family Households | Nonfamily Households |
| 1-Person Households | - | 4,852 (25.3%) |
| 2-Person Households | 6,330 (33.0%) | 940 (4.9%) |
| 3-Person Households | 2,576 (13.4%) | 109 (0.6%) |
| 4-Person Households | 2,424 (12.7%) | 0 (0.0%) |
| 5-Person Households | 923 (4.8%) | 38 (0.2%) |
| 6-Person Households | 571 (3.0%) | 2 (0.0%) |
| 7+ Person Households | 403 (2.1%) | 0 (0.0%) |
| Total | 13,227 (69.0%) | 5,941 (31.0%) |
Female Fertility in Logan County
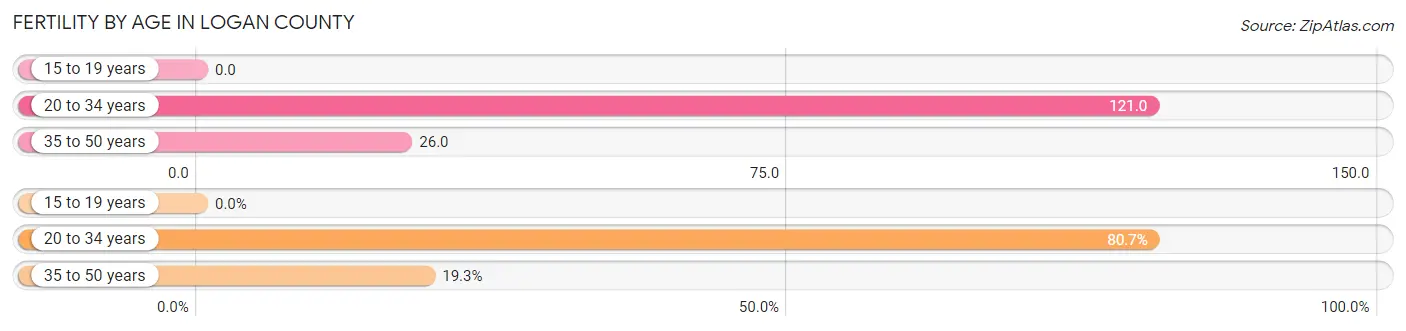
Fertility by Age in Logan County
Average fertility rate in Logan County is 60.0 births per 1,000 women. Women in the age bracket of 20 to 34 years have the highest fertility rate with 121.0 births per 1,000 women. Women in the age bracket of 20 to 34 years acount for 80.7% of all women with births.
| Age Bracket | Women with Births | Births / 1,000 Women |
| 15 to 19 years | 0 (0.0%) | 0.0 |
| 20 to 34 years | 469 (80.7%) | 121.0 |
| 35 to 50 years | 112 (19.3%) | 26.0 |
| Total | 581 (100.0%) | 60.0 |
Fertility by Age by Marriage Status in Logan County
62.1% of women with births (581) in Logan County are married. The highest percentage of unmarried women with births falls into 20 to 34 years age bracket with 41.6% of them unmarried at the time of birth, while the lowest percentage of unmarried women with births belong to 35 to 50 years age bracket with 22.3% of them unmarried.

| Age Bracket | Married | Unmarried |
| 15 to 19 years | 0 (0.0%) | 0 (0.0%) |
| 20 to 34 years | 274 (58.4%) | 195 (41.6%) |
| 35 to 50 years | 87 (77.7%) | 25 (22.3%) |
| Total | 361 (62.1%) | 220 (37.9%) |
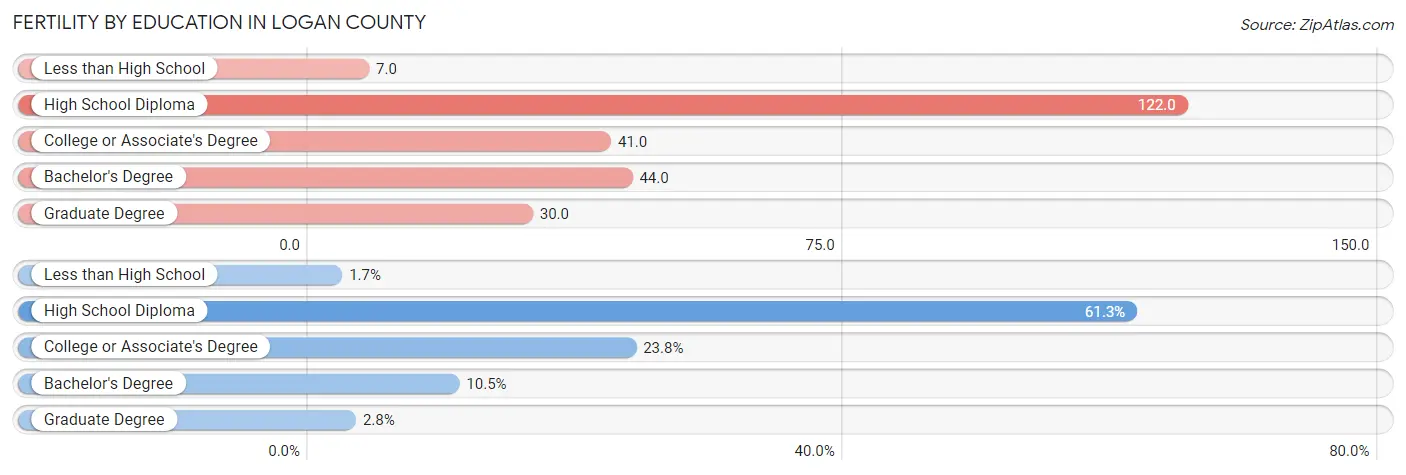
Fertility by Education in Logan County
Average fertility rate in Logan County is 60.0 births per 1,000 women. Women with the education attainment of high school diploma have the highest fertility rate of 122.0 births per 1,000 women, while women with the education attainment of less than high school have the lowest fertility at 7.0 births per 1,000 women. Women with the education attainment of high school diploma represent 61.3% of all women with births.
| Educational Attainment | Women with Births | Births / 1,000 Women |
| Less than High School | 10 (1.7%) | 7.0 |
| High School Diploma | 356 (61.3%) | 122.0 |
| College or Associate's Degree | 138 (23.7%) | 41.0 |
| Bachelor's Degree | 61 (10.5%) | 44.0 |
| Graduate Degree | 16 (2.8%) | 30.0 |
| Total | 581 (100.0%) | 60.0 |
Fertility by Education by Marriage Status in Logan County
37.9% of women with births in Logan County are unmarried. Women with the educational attainment of graduate degree are most likely to be married with 100.0% of them married at childbirth, while women with the educational attainment of college or associate's degree are least likely to be married with 47.8% of them unmarried at childbirth.

| Educational Attainment | Married | Unmarried |
| Less than High School | 7 (70.0%) | 3 (30.0%) |
| High School Diploma | 208 (58.4%) | 148 (41.6%) |
| College or Associate's Degree | 72 (52.2%) | 66 (47.8%) |
| Bachelor's Degree | 58 (95.1%) | 3 (4.9%) |
| Graduate Degree | 16 (100.0%) | 0 (0.0%) |
| Total | 361 (62.1%) | 220 (37.9%) |
Income in Logan County
Income Overview in Logan County
Per Capita Income in Logan County is $36,215, while median incomes of families and households are $83,278 and $69,125 respectively.
| Characteristic | Number | Measure |
| Per Capita Income | 46,098 | $36,215 |
| Median Family Income | 13,227 | $83,278 |
| Mean Family Income | 13,227 | $102,631 |
| Median Household Income | 19,168 | $69,125 |
| Mean Household Income | 19,168 | $89,225 |
| Income Deficit | 13,227 | $11,074 |
| Wage / Income Gap (%) | 46,098 | 31.02% |
| Wage / Income Gap ($) | 46,098 | 68.98¢ per $1 |
| Gini / Inequality Index | 46,098 | 0.44 |
Earnings by Sex in Logan County
Average Earnings in Logan County are $40,195, $46,992 for men and $32,417 for women, a difference of 31.0%.

| Sex | Number | Average Earnings |
| Male | 12,925 (53.5%) | $46,992 |
| Female | 11,241 (46.5%) | $32,417 |
| Total | 24,166 (100.0%) | $40,195 |
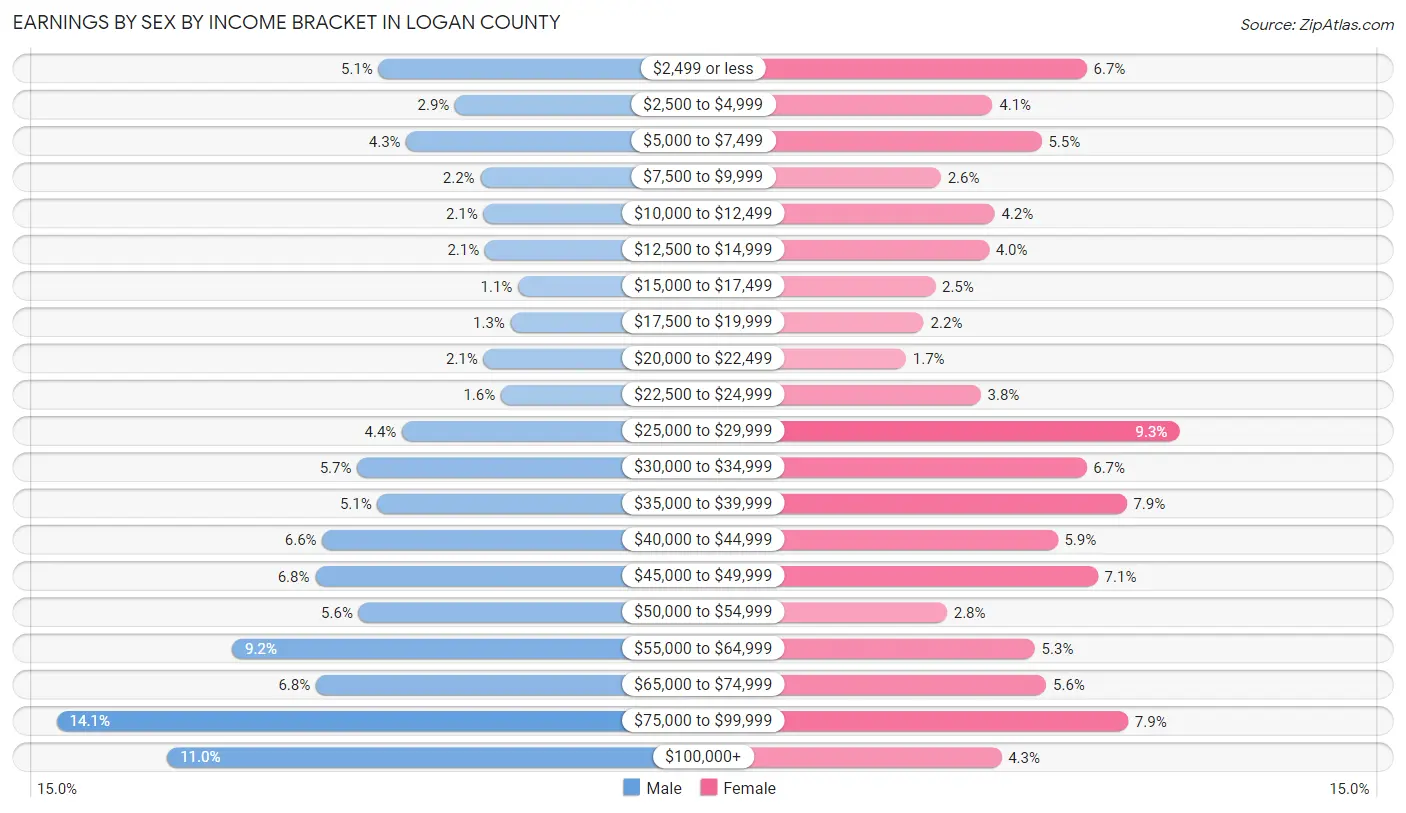
Earnings by Sex by Income Bracket in Logan County
The most common earnings brackets in Logan County are $75,000 to $99,999 for men (1,822 | 14.1%) and $25,000 to $29,999 for women (1,050 | 9.3%).
| Income | Male | Female |
| $2,499 or less | 653 (5.1%) | 758 (6.7%) |
| $2,500 to $4,999 | 375 (2.9%) | 460 (4.1%) |
| $5,000 to $7,499 | 552 (4.3%) | 615 (5.5%) |
| $7,500 to $9,999 | 283 (2.2%) | 297 (2.6%) |
| $10,000 to $12,499 | 271 (2.1%) | 467 (4.2%) |
| $12,500 to $14,999 | 266 (2.1%) | 449 (4.0%) |
| $15,000 to $17,499 | 146 (1.1%) | 279 (2.5%) |
| $17,500 to $19,999 | 173 (1.3%) | 243 (2.2%) |
| $20,000 to $22,499 | 271 (2.1%) | 187 (1.7%) |
| $22,500 to $24,999 | 208 (1.6%) | 423 (3.8%) |
| $25,000 to $29,999 | 568 (4.4%) | 1,050 (9.3%) |
| $30,000 to $34,999 | 730 (5.7%) | 757 (6.7%) |
| $35,000 to $39,999 | 657 (5.1%) | 883 (7.9%) |
| $40,000 to $44,999 | 857 (6.6%) | 665 (5.9%) |
| $45,000 to $49,999 | 883 (6.8%) | 793 (7.0%) |
| $50,000 to $54,999 | 725 (5.6%) | 316 (2.8%) |
| $55,000 to $64,999 | 1,185 (9.2%) | 593 (5.3%) |
| $65,000 to $74,999 | 880 (6.8%) | 630 (5.6%) |
| $75,000 to $99,999 | 1,822 (14.1%) | 888 (7.9%) |
| $100,000+ | 1,420 (11.0%) | 488 (4.3%) |
| Total | 12,925 (100.0%) | 11,241 (100.0%) |
Earnings by Sex by Educational Attainment in Logan County
Average earnings in Logan County are $54,143 for men and $37,049 for women, a difference of 31.6%. Men with an educational attainment of bachelor's degree enjoy the highest average annual earnings of $88,468, while those with less than high school education earn the least with $33,993. Women with an educational attainment of graduate degree earn the most with the average annual earnings of $69,975, while those with less than high school education have the smallest earnings of $25,089.

| Educational Attainment | Male Income | Female Income |
| Less than High School | $33,993 | $25,089 |
| High School Diploma | $48,060 | $29,555 |
| College or Associate's Degree | $56,707 | $35,366 |
| Bachelor's Degree | $88,468 | $49,351 |
| Graduate Degree | $86,859 | $69,975 |
| Total | $54,143 | $37,049 |
Family Income in Logan County
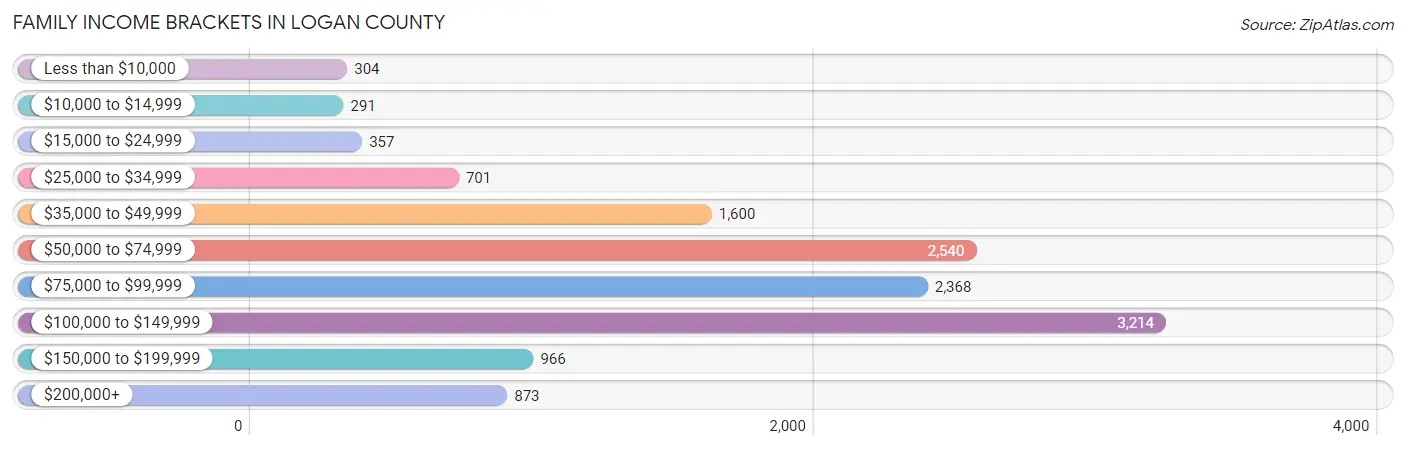
Family Income Brackets in Logan County
According to the Logan County family income data, there are 3,214 families falling into the $100,000 to $149,999 income range, which is the most common income bracket and makes up 24.3% of all families. Conversely, the $10,000 to $14,999 income bracket is the least frequent group with only 291 families (2.2%) belonging to this category.
| Income Bracket | # Families | % Families |
| Less than $10,000 | 304 | 2.3% |
| $10,000 to $14,999 | 291 | 2.2% |
| $15,000 to $24,999 | 357 | 2.7% |
| $25,000 to $34,999 | 701 | 5.3% |
| $35,000 to $49,999 | 1,600 | 12.1% |
| $50,000 to $74,999 | 2,540 | 19.2% |
| $75,000 to $99,999 | 2,368 | 17.9% |
| $100,000 to $149,999 | 3,214 | 24.3% |
| $150,000 to $199,999 | 966 | 7.3% |
| $200,000+ | 873 | 6.6% |
Family Income by Famaliy Size in Logan County
7+ person families (323 | 2.4%) account for the highest median family income in Logan County with $143,012 per family, while 2-person families (6,792 | 51.3%) have the highest median income of $38,070 per family member.
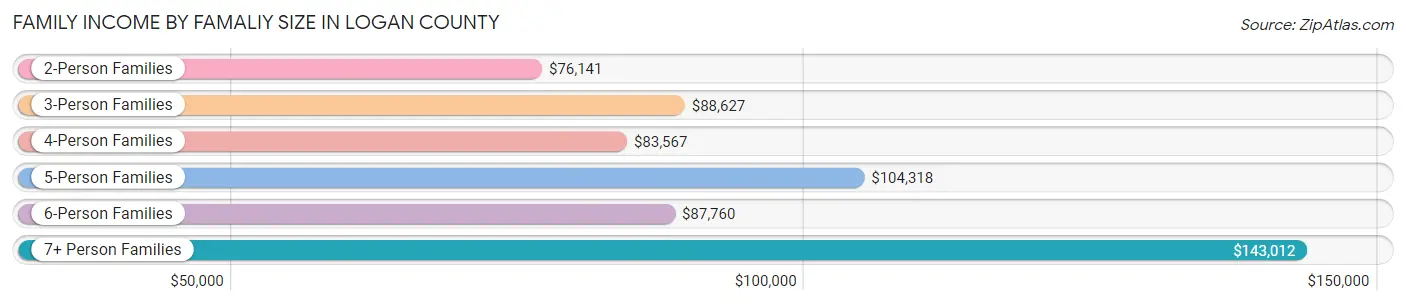
| Income Bracket | # Families | Median Income |
| 2-Person Families | 6,792 (51.3%) | $76,141 |
| 3-Person Families | 2,378 (18.0%) | $88,627 |
| 4-Person Families | 2,299 (17.4%) | $83,567 |
| 5-Person Families | 916 (6.9%) | $104,318 |
| 6-Person Families | 519 (3.9%) | $87,760 |
| 7+ Person Families | 323 (2.4%) | $143,012 |
| Total | 13,227 (100.0%) | $83,278 |
Family Income by Number of Earners in Logan County
The median family income in Logan County is $83,278, with families comprising 3+ earners (1,532) having the highest median family income of $137,589, while families with no earners (2,235) have the lowest median family income of $52,996, accounting for 11.6% and 16.9% of families, respectively.
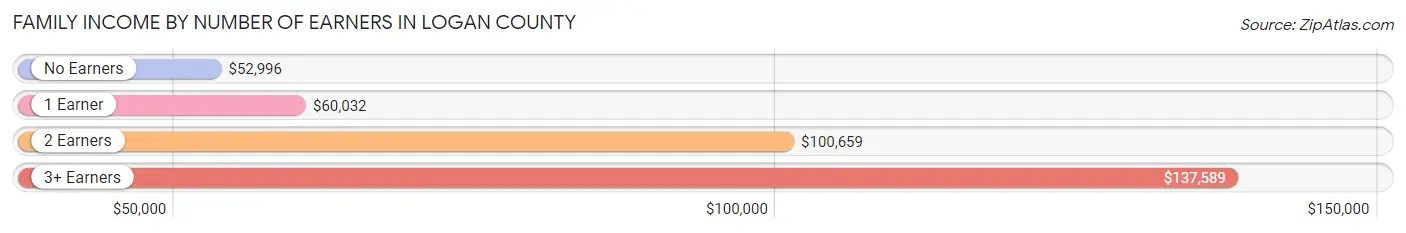
| Number of Earners | # Families | Median Income |
| No Earners | 2,235 (16.9%) | $52,996 |
| 1 Earner | 4,557 (34.4%) | $60,032 |
| 2 Earners | 4,903 (37.1%) | $100,659 |
| 3+ Earners | 1,532 (11.6%) | $137,589 |
| Total | 13,227 (100.0%) | $83,278 |
Household Income in Logan County
Household Income Brackets in Logan County
With 3,814 households falling in the category, the $100,000 to $149,999 income range is the most frequent in Logan County, accounting for 19.9% of all households. In contrast, only 786 households (4.1%) fall into the $10,000 to $14,999 income bracket, making it the least populous group.
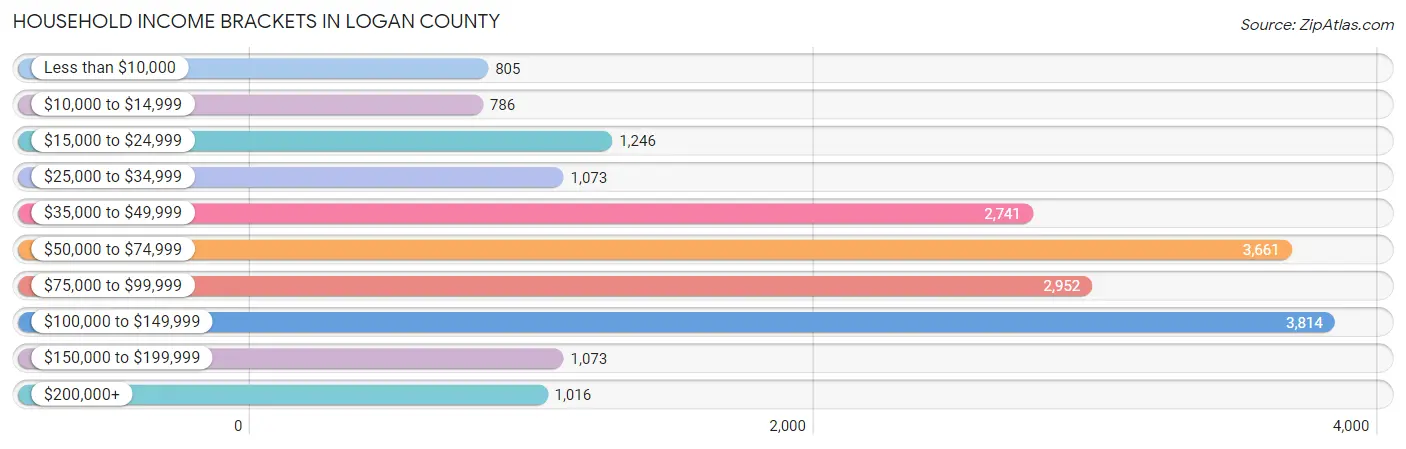
| Income Bracket | # Households | % Households |
| Less than $10,000 | 805 | 4.2% |
| $10,000 to $14,999 | 786 | 4.1% |
| $15,000 to $24,999 | 1,246 | 6.5% |
| $25,000 to $34,999 | 1,073 | 5.6% |
| $35,000 to $49,999 | 2,741 | 14.3% |
| $50,000 to $74,999 | 3,661 | 19.1% |
| $75,000 to $99,999 | 2,952 | 15.4% |
| $100,000 to $149,999 | 3,814 | 19.9% |
| $150,000 to $199,999 | 1,073 | 5.6% |
| $200,000+ | 1,016 | 5.3% |
Household Income by Householder Age in Logan County
The median household income in Logan County is $69,125, with the highest median household income of $85,313 found in the 45 to 64 years age bracket for the primary householder. A total of 7,272 households (37.9%) fall into this category. Meanwhile, the 65+ years age bracket for the primary householder has the lowest median household income of $51,788, with 5,271 households (27.5%) in this group.

| Income Bracket | # Households | Median Income |
| 15 to 24 Years | 675 (3.5%) | $60,697 |
| 25 to 44 Years | 5,950 (31.0%) | $77,787 |
| 45 to 64 Years | 7,272 (37.9%) | $85,313 |
| 65+ Years | 5,271 (27.5%) | $51,788 |
| Total | 19,168 (100.0%) | $69,125 |
Poverty in Logan County
Income Below Poverty by Sex and Age in Logan County
With 9.3% poverty level for males and 12.6% for females among the residents of Logan County, 15 year old males and 18 to 24 year old females are the most vulnerable to poverty, with 47 males (37.6%) and 484 females (29.0%) in their respective age groups living below the poverty level.
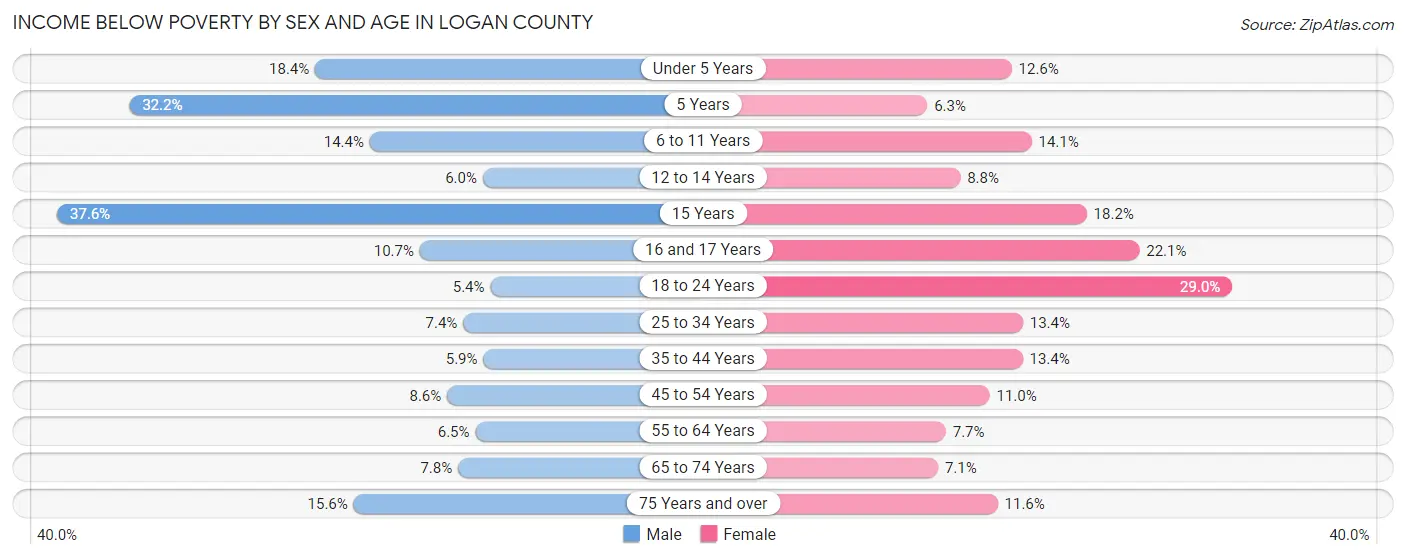
| Age Bracket | Male | Female |
| Under 5 Years | 252 (18.4%) | 153 (12.6%) |
| 5 Years | 68 (32.2%) | 9 (6.3%) |
| 6 to 11 Years | 266 (14.4%) | 221 (14.1%) |
| 12 to 14 Years | 62 (6.0%) | 95 (8.8%) |
| 15 Years | 47 (37.6%) | 58 (18.2%) |
| 16 and 17 Years | 90 (10.7%) | 144 (22.1%) |
| 18 to 24 Years | 100 (5.4%) | 484 (29.0%) |
| 25 to 34 Years | 195 (7.4%) | 361 (13.4%) |
| 35 to 44 Years | 167 (5.9%) | 357 (13.4%) |
| 45 to 54 Years | 253 (8.6%) | 318 (11.0%) |
| 55 to 64 Years | 226 (6.5%) | 256 (7.7%) |
| 65 to 74 Years | 200 (7.8%) | 193 (7.1%) |
| 75 Years and over | 203 (15.6%) | 203 (11.6%) |
| Total | 2,129 (9.3%) | 2,852 (12.6%) |
Income Above Poverty by Sex and Age in Logan County
According to the poverty statistics in Logan County, males aged 18 to 24 years and females aged 5 years are the age groups that are most secure financially, with 94.6% of males and 93.7% of females in these age groups living above the poverty line.
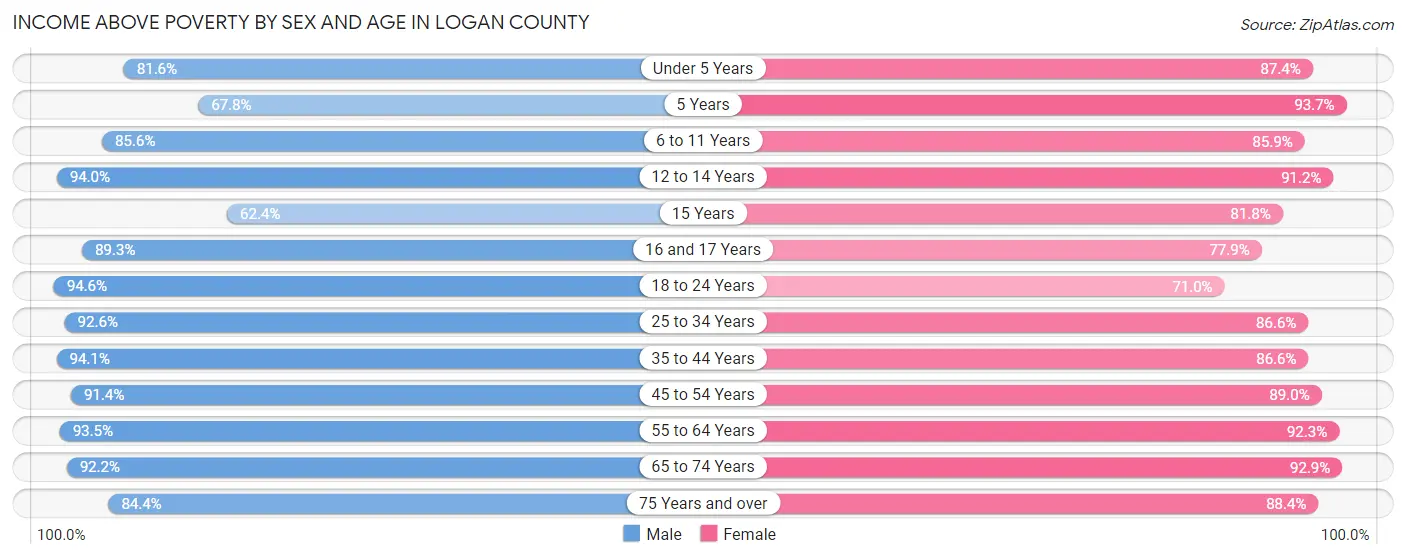
| Age Bracket | Male | Female |
| Under 5 Years | 1,115 (81.6%) | 1,060 (87.4%) |
| 5 Years | 143 (67.8%) | 133 (93.7%) |
| 6 to 11 Years | 1,585 (85.6%) | 1,347 (85.9%) |
| 12 to 14 Years | 975 (94.0%) | 986 (91.2%) |
| 15 Years | 78 (62.4%) | 261 (81.8%) |
| 16 and 17 Years | 754 (89.3%) | 508 (77.9%) |
| 18 to 24 Years | 1,746 (94.6%) | 1,186 (71.0%) |
| 25 to 34 Years | 2,426 (92.6%) | 2,326 (86.6%) |
| 35 to 44 Years | 2,644 (94.1%) | 2,304 (86.6%) |
| 45 to 54 Years | 2,680 (91.4%) | 2,580 (89.0%) |
| 55 to 64 Years | 3,233 (93.5%) | 3,061 (92.3%) |
| 65 to 74 Years | 2,356 (92.2%) | 2,509 (92.9%) |
| 75 Years and over | 1,101 (84.4%) | 1,552 (88.4%) |
| Total | 20,836 (90.7%) | 19,813 (87.4%) |
Income Below Poverty Among Married-Couple Families in Logan County
The poverty statistics for married-couple families in Logan County show that 4.3% or 447 of the total 10,385 families live below the poverty line. Families with 5 or more children have the highest poverty rate of 8.3%, comprising of 13 families. On the other hand, families with 1 or 2 children have the lowest poverty rate of 3.6%, which includes 106 families.

| Children | Above Poverty | Below Poverty |
| No Children | 6,142 (95.7%) | 273 (4.3%) |
| 1 or 2 Children | 2,804 (96.4%) | 106 (3.6%) |
| 3 or 4 Children | 848 (93.9%) | 55 (6.1%) |
| 5 or more Children | 144 (91.7%) | 13 (8.3%) |
| Total | 9,938 (95.7%) | 447 (4.3%) |
Income Below Poverty Among Single-Parent Households in Logan County
According to the poverty data in Logan County, 12.0% or 131 single-father households and 23.5% or 411 single-mother households are living below the poverty line. Among single-father households, those with 3 or 4 children have the highest poverty rate, with 62 households (31.3%) experiencing poverty. Likewise, among single-mother households, those with 3 or 4 children have the highest poverty rate, with 194 households (43.9%) falling below the poverty line.

| Children | Single Father | Single Mother |
| No Children | 4 (1.2%) | 35 (7.4%) |
| 1 or 2 Children | 65 (11.9%) | 182 (21.8%) |
| 3 or 4 Children | 62 (31.3%) | 194 (43.9%) |
| 5 or more Children | 0 (0.0%) | 0 (0.0%) |
| Total | 131 (12.0%) | 411 (23.5%) |
Income Below Poverty Among Married-Couple vs Single-Parent Households in Logan County
The poverty data for Logan County shows that 447 of the married-couple family households (4.3%) and 542 of the single-parent households (19.1%) are living below the poverty level. Within the married-couple family households, those with 5 or more children have the highest poverty rate, with 13 households (8.3%) falling below the poverty line. Among the single-parent households, those with 3 or 4 children have the highest poverty rate, with 256 household (40.0%) living below poverty.
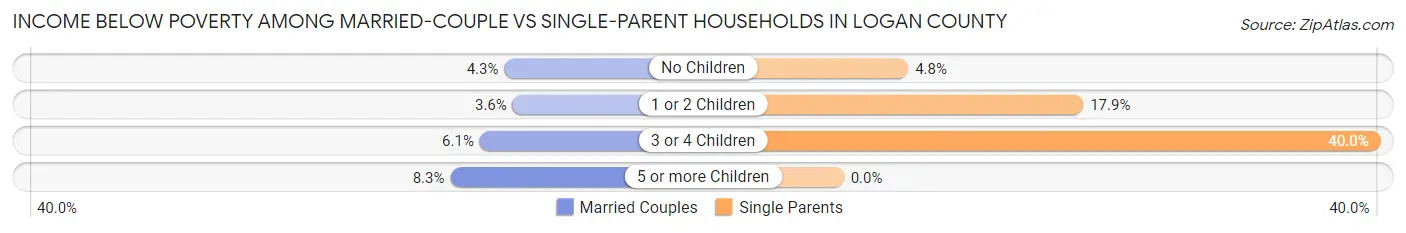
| Children | Married-Couple Families | Single-Parent Households |
| No Children | 273 (4.3%) | 39 (4.8%) |
| 1 or 2 Children | 106 (3.6%) | 247 (17.8%) |
| 3 or 4 Children | 55 (6.1%) | 256 (40.0%) |
| 5 or more Children | 13 (8.3%) | 0 (0.0%) |
| Total | 447 (4.3%) | 542 (19.1%) |
Employment Characteristics in Logan County
Employment by Class of Employer in Logan County
Among the 20,974 employed individuals in Logan County, private company employees (15,132 | 72.2%), local government employees (1,888 | 9.0%), and not-for-profit organizations (1,625 | 7.7%) make up the most common classes of employment.
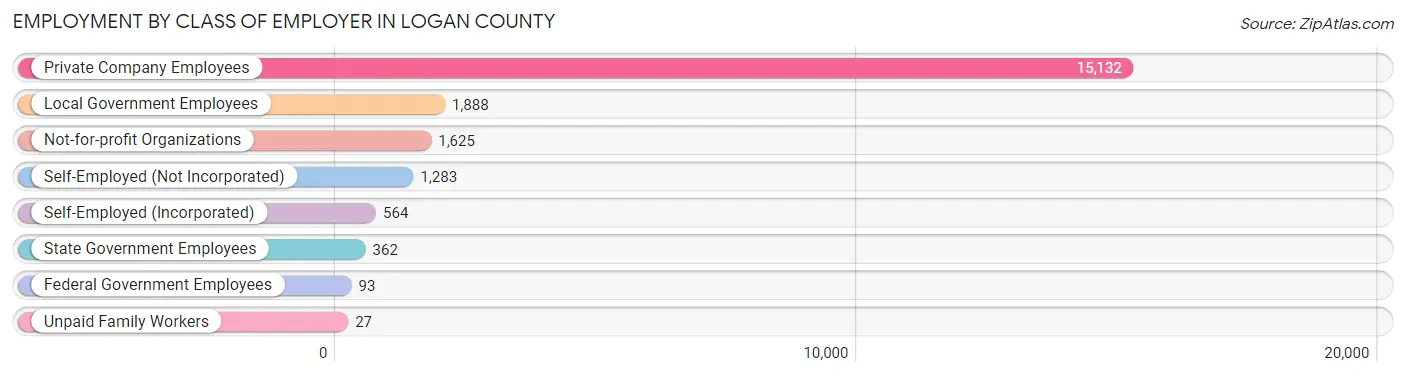
| Employer Class | # Employees | % Employees |
| Private Company Employees | 15,132 | 72.2% |
| Self-Employed (Incorporated) | 564 | 2.7% |
| Self-Employed (Not Incorporated) | 1,283 | 6.1% |
| Not-for-profit Organizations | 1,625 | 7.7% |
| Local Government Employees | 1,888 | 9.0% |
| State Government Employees | 362 | 1.7% |
| Federal Government Employees | 93 | 0.4% |
| Unpaid Family Workers | 27 | 0.1% |
| Total | 20,974 | 100.0% |
Employment Status by Age in Logan County
According to the labor force statistics for Logan County, out of the total population over 16 years of age (37,079), 60.8% or 22,544 individuals are in the labor force, with 3.5% or 789 of them unemployed. The age group with the highest labor force participation rate is 25 to 29 years, with 85.8% or 2,279 individuals in the labor force. Within the labor force, the 16 to 19 years age range has the highest percentage of unemployed individuals, with 17.2% or 229 of them being unemployed.
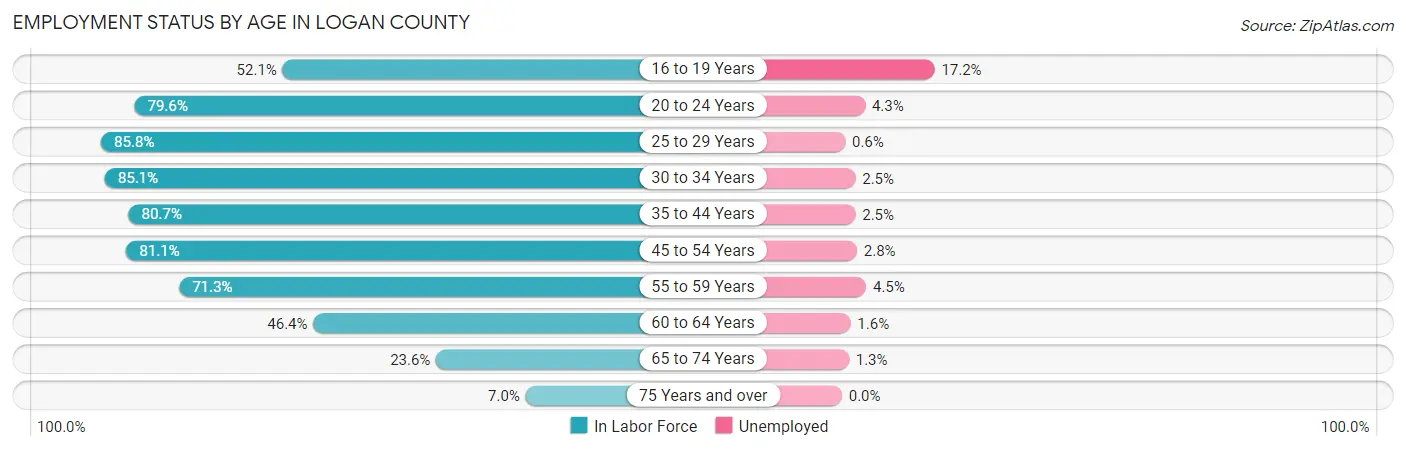
| Age Bracket | In Labor Force | Unemployed |
| 16 to 19 Years | 1,331 (52.1%) | 229 (17.2%) |
| 20 to 24 Years | 1,983 (79.6%) | 85 (4.3%) |
| 25 to 29 Years | 2,279 (85.8%) | 14 (0.6%) |
| 30 to 34 Years | 2,257 (85.1%) | 56 (2.5%) |
| 35 to 44 Years | 4,416 (80.7%) | 110 (2.5%) |
| 45 to 54 Years | 4,729 (81.1%) | 132 (2.8%) |
| 55 to 59 Years | 2,600 (71.3%) | 117 (4.5%) |
| 60 to 64 Years | 1,462 (46.4%) | 23 (1.6%) |
| 65 to 74 Years | 1,262 (23.6%) | 16 (1.3%) |
| 75 Years and over | 229 (7.0%) | 0 (0.0%) |
| Total | 22,544 (60.8%) | 789 (3.5%) |
Employment Status by Educational Attainment in Logan County
According to labor force statistics for Logan County, 75.8% of individuals (17,743) out of the total population between 25 and 64 years of age (23,408) are in the labor force, with 2.6% or 461 of them being unemployed. The group with the highest labor force participation rate are those with the educational attainment of bachelor's degree or higher, with 89.9% or 3,876 individuals in the labor force. Within the labor force, individuals with high school diploma education have the highest percentage of unemployment, with 4.2% or 284 of them being unemployed.
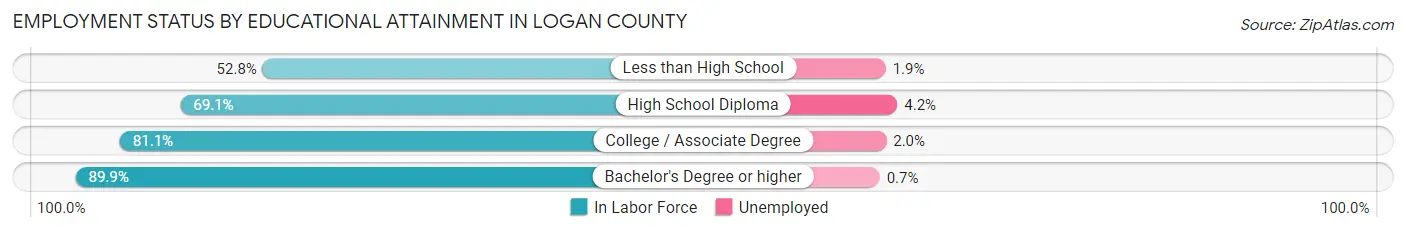
| Educational Attainment | In Labor Force | Unemployed |
| Less than High School | 825 (52.8%) | 30 (1.9%) |
| High School Diploma | 6,761 (69.1%) | 411 (4.2%) |
| College / Associate Degree | 6,285 (81.1%) | 155 (2.0%) |
| Bachelor's Degree or higher | 3,876 (89.9%) | 30 (0.7%) |
| Total | 17,743 (75.8%) | 609 (2.6%) |
Employment Occupations by Sex in Logan County
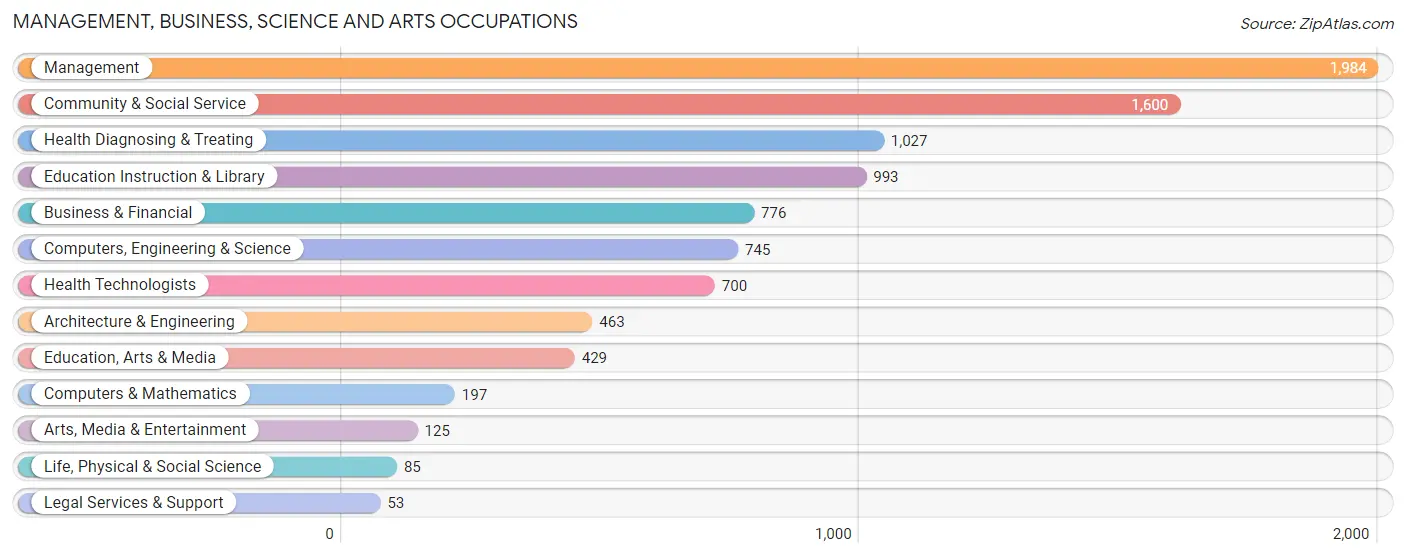
Management, Business, Science and Arts Occupations
The most common Management, Business, Science and Arts occupations in Logan County are Management (1,984 | 9.1%), Community & Social Service (1,600 | 7.4%), Health Diagnosing & Treating (1,027 | 4.7%), Education Instruction & Library (993 | 4.6%), and Business & Financial (776 | 3.6%).
Management, Business, Science and Arts Occupations by Sex
Within the Management, Business, Science and Arts occupations in Logan County, the most male-oriented occupations are Computers & Mathematics (77.7%), Architecture & Engineering (70.8%), and Computers, Engineering & Science (67.4%), while the most female-oriented occupations are Health Diagnosing & Treating (96.7%), Health Technologists (95.1%), and Arts, Media & Entertainment (94.4%).

| Occupation | Male | Female |
| Management | 1,258 (63.4%) | 726 (36.6%) |
| Business & Financial | 345 (44.5%) | 431 (55.5%) |
| Computers, Engineering & Science | 502 (67.4%) | 243 (32.6%) |
| Computers & Mathematics | 153 (77.7%) | 44 (22.3%) |
| Architecture & Engineering | 328 (70.8%) | 135 (29.2%) |
| Life, Physical & Social Science | 21 (24.7%) | 64 (75.3%) |
| Community & Social Service | 459 (28.7%) | 1,141 (71.3%) |
| Education, Arts & Media | 212 (49.4%) | 217 (50.6%) |
| Legal Services & Support | 14 (26.4%) | 39 (73.6%) |
| Education Instruction & Library | 226 (22.8%) | 767 (77.2%) |
| Arts, Media & Entertainment | 7 (5.6%) | 118 (94.4%) |
| Health Diagnosing & Treating | 34 (3.3%) | 993 (96.7%) |
| Health Technologists | 34 (4.9%) | 666 (95.1%) |
| Total (Category) | 2,598 (42.4%) | 3,534 (57.6%) |
| Total (Overall) | 11,518 (53.0%) | 10,228 (47.0%) |
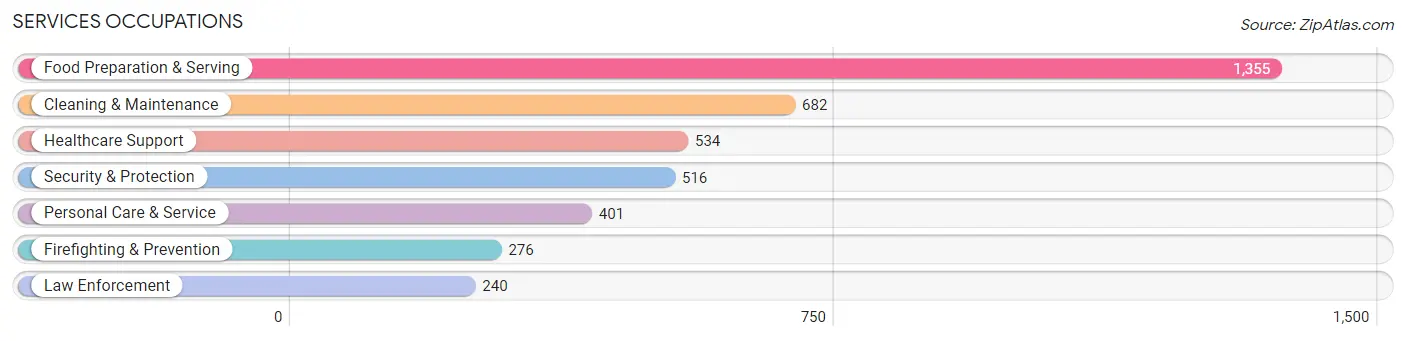
Services Occupations
The most common Services occupations in Logan County are Food Preparation & Serving (1,355 | 6.2%), Cleaning & Maintenance (682 | 3.1%), Healthcare Support (534 | 2.5%), Security & Protection (516 | 2.4%), and Personal Care & Service (401 | 1.8%).
Services Occupations by Sex
Within the Services occupations in Logan County, the most male-oriented occupations are Law Enforcement (94.6%), Security & Protection (84.3%), and Firefighting & Prevention (75.4%), while the most female-oriented occupations are Healthcare Support (90.8%), Personal Care & Service (88.5%), and Food Preparation & Serving (72.8%).
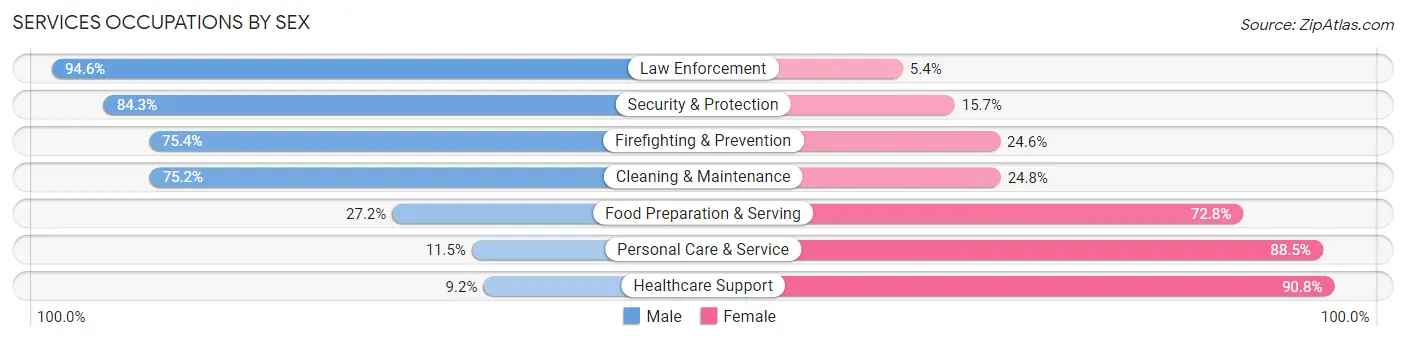
| Occupation | Male | Female |
| Healthcare Support | 49 (9.2%) | 485 (90.8%) |
| Security & Protection | 435 (84.3%) | 81 (15.7%) |
| Firefighting & Prevention | 208 (75.4%) | 68 (24.6%) |
| Law Enforcement | 227 (94.6%) | 13 (5.4%) |
| Food Preparation & Serving | 369 (27.2%) | 986 (72.8%) |
| Cleaning & Maintenance | 513 (75.2%) | 169 (24.8%) |
| Personal Care & Service | 46 (11.5%) | 355 (88.5%) |
| Total (Category) | 1,412 (40.5%) | 2,076 (59.5%) |
| Total (Overall) | 11,518 (53.0%) | 10,228 (47.0%) |
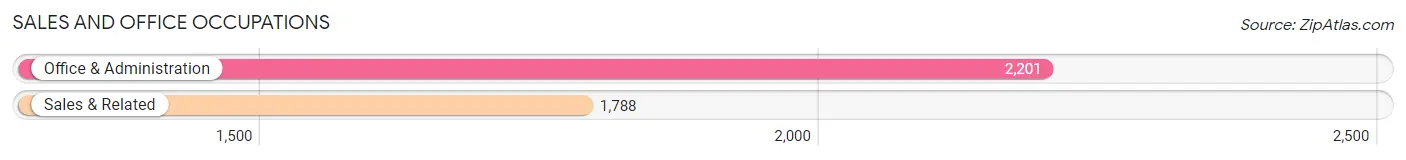
Sales and Office Occupations
The most common Sales and Office occupations in Logan County are Office & Administration (2,201 | 10.1%), and Sales & Related (1,788 | 8.2%).
Sales and Office Occupations by Sex

| Occupation | Male | Female |
| Sales & Related | 696 (38.9%) | 1,092 (61.1%) |
| Office & Administration | 478 (21.7%) | 1,723 (78.3%) |
| Total (Category) | 1,174 (29.4%) | 2,815 (70.6%) |
| Total (Overall) | 11,518 (53.0%) | 10,228 (47.0%) |
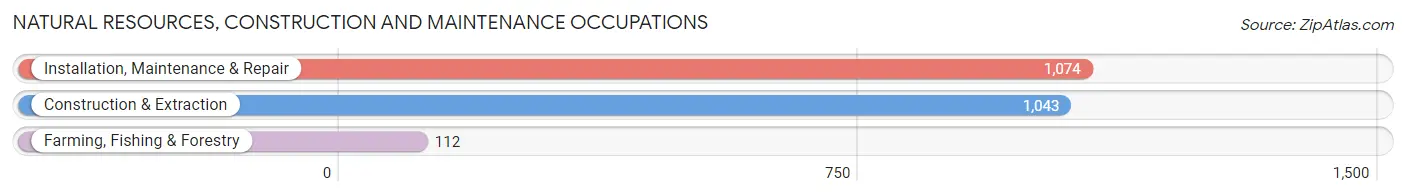
Natural Resources, Construction and Maintenance Occupations
The most common Natural Resources, Construction and Maintenance occupations in Logan County are Installation, Maintenance & Repair (1,074 | 4.9%), Construction & Extraction (1,043 | 4.8%), and Farming, Fishing & Forestry (112 | 0.5%).
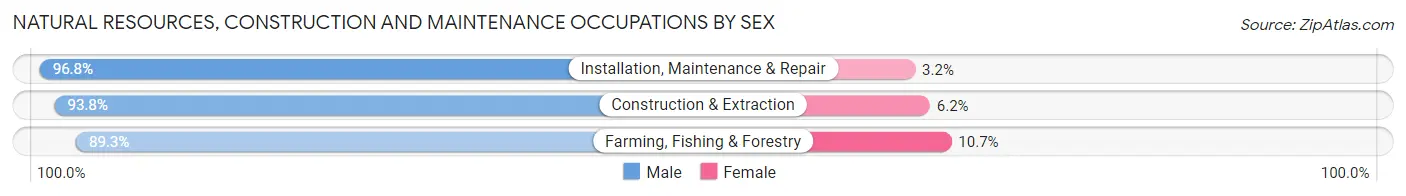
Natural Resources, Construction and Maintenance Occupations by Sex
| Occupation | Male | Female |
| Farming, Fishing & Forestry | 100 (89.3%) | 12 (10.7%) |
| Construction & Extraction | 978 (93.8%) | 65 (6.2%) |
| Installation, Maintenance & Repair | 1,040 (96.8%) | 34 (3.2%) |
| Total (Category) | 2,118 (95.0%) | 111 (5.0%) |
| Total (Overall) | 11,518 (53.0%) | 10,228 (47.0%) |
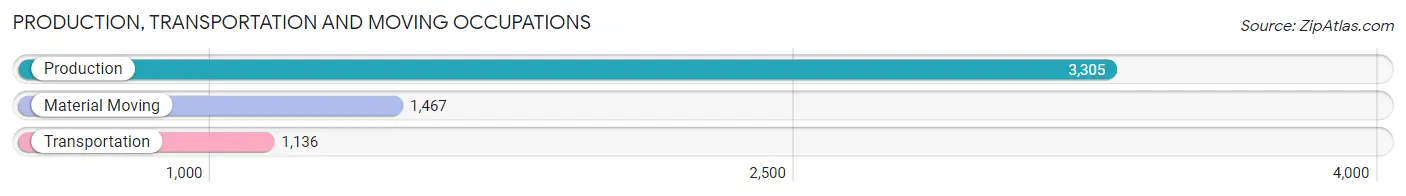
Production, Transportation and Moving Occupations
The most common Production, Transportation and Moving occupations in Logan County are Production (3,305 | 15.2%), Material Moving (1,467 | 6.8%), and Transportation (1,136 | 5.2%).
Production, Transportation and Moving Occupations by Sex

| Occupation | Male | Female |
| Production | 2,186 (66.1%) | 1,119 (33.9%) |
| Transportation | 951 (83.7%) | 185 (16.3%) |
| Material Moving | 1,079 (73.6%) | 388 (26.5%) |
| Total (Category) | 4,216 (71.4%) | 1,692 (28.6%) |
| Total (Overall) | 11,518 (53.0%) | 10,228 (47.0%) |
Employment Industries by Sex in Logan County
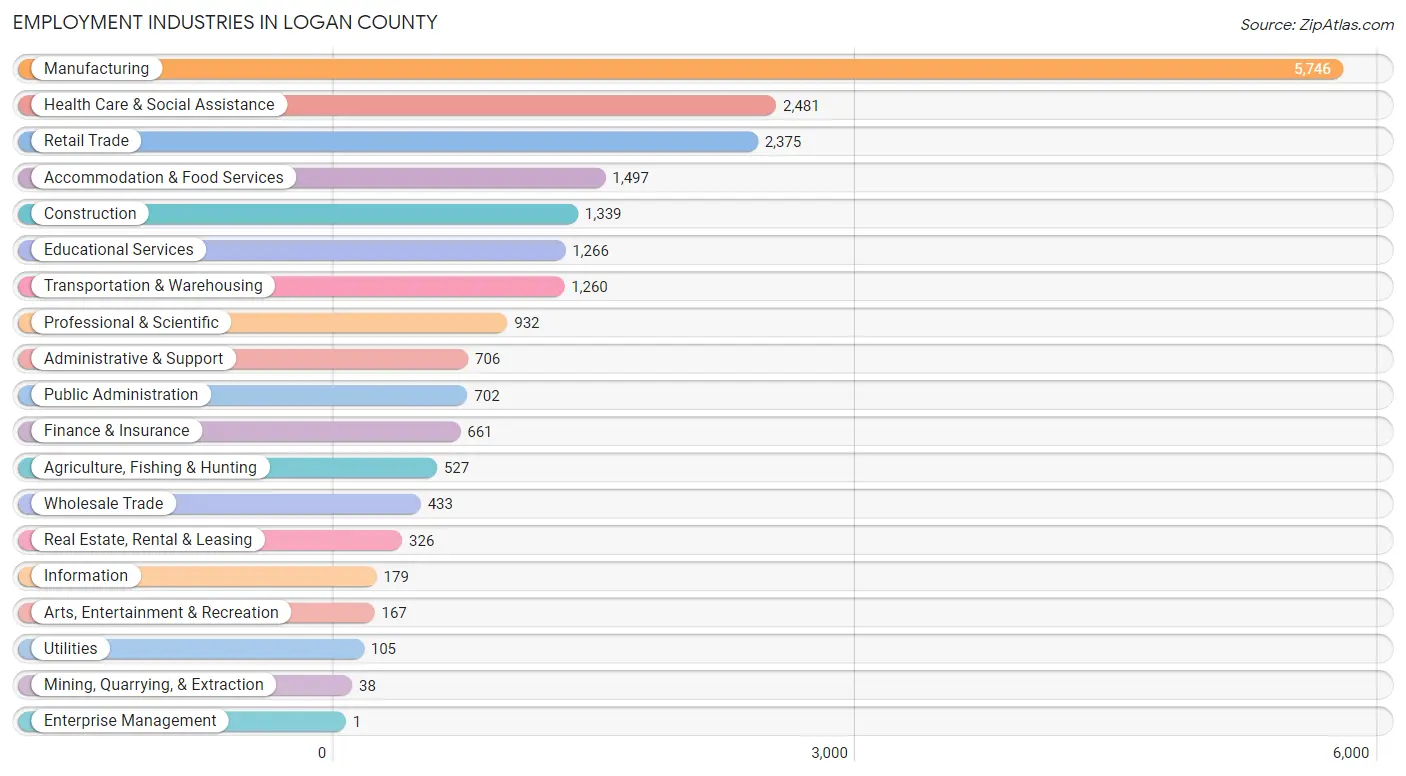
Employment Industries in Logan County
The major employment industries in Logan County include Manufacturing (5,746 | 26.4%), Health Care & Social Assistance (2,481 | 11.4%), Retail Trade (2,375 | 10.9%), Accommodation & Food Services (1,497 | 6.9%), and Construction (1,339 | 6.2%).
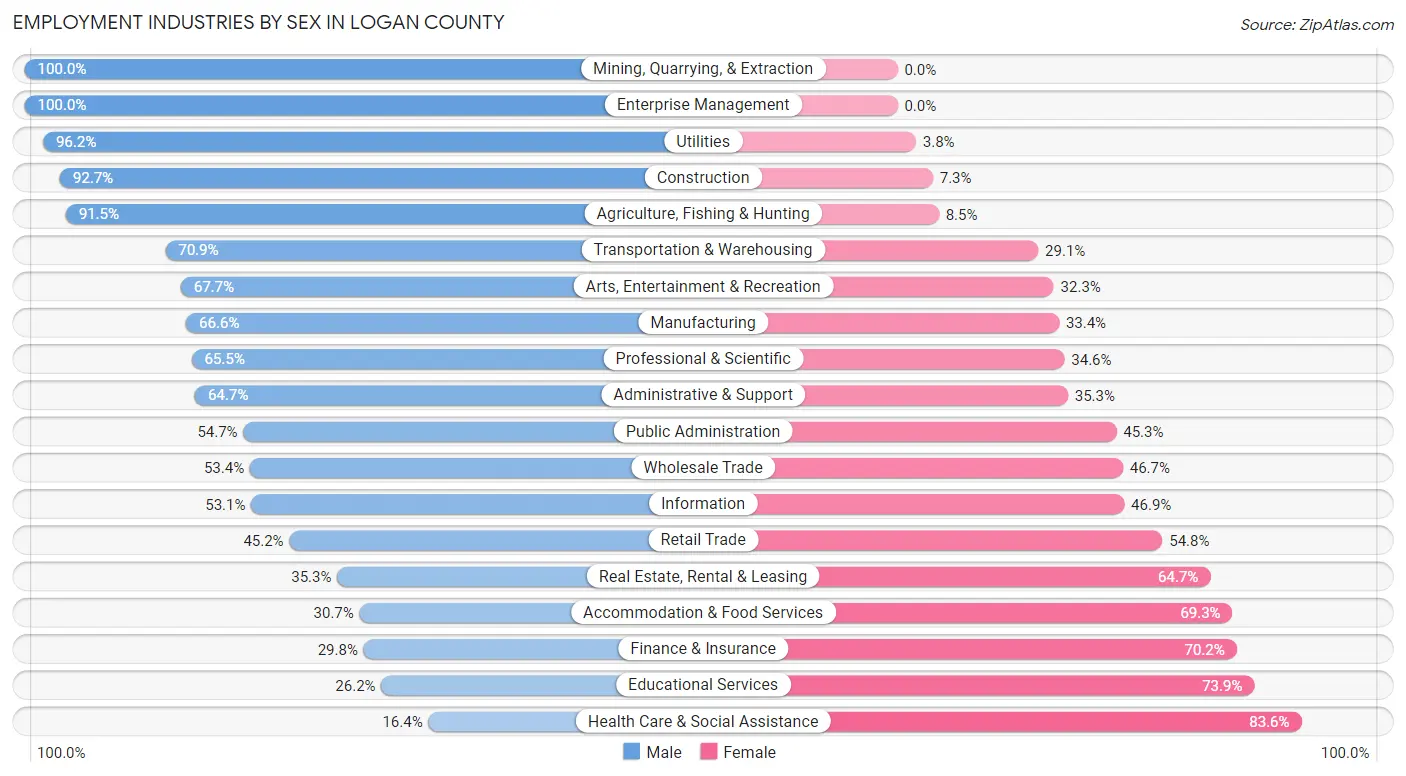
Employment Industries by Sex in Logan County
The Logan County industries that see more men than women are Mining, Quarrying, & Extraction (100.0%), Enterprise Management (100.0%), and Utilities (96.2%), whereas the industries that tend to have a higher number of women are Health Care & Social Assistance (83.6%), Educational Services (73.9%), and Finance & Insurance (70.2%).
| Industry | Male | Female |
| Agriculture, Fishing & Hunting | 482 (91.5%) | 45 (8.5%) |
| Mining, Quarrying, & Extraction | 38 (100.0%) | 0 (0.0%) |
| Construction | 1,241 (92.7%) | 98 (7.3%) |
| Manufacturing | 3,825 (66.6%) | 1,921 (33.4%) |
| Wholesale Trade | 231 (53.3%) | 202 (46.7%) |
| Retail Trade | 1,073 (45.2%) | 1,302 (54.8%) |
| Transportation & Warehousing | 893 (70.9%) | 367 (29.1%) |
| Utilities | 101 (96.2%) | 4 (3.8%) |
| Information | 95 (53.1%) | 84 (46.9%) |
| Finance & Insurance | 197 (29.8%) | 464 (70.2%) |
| Real Estate, Rental & Leasing | 115 (35.3%) | 211 (64.7%) |
| Professional & Scientific | 610 (65.4%) | 322 (34.5%) |
| Enterprise Management | 1 (100.0%) | 0 (0.0%) |
| Administrative & Support | 457 (64.7%) | 249 (35.3%) |
| Educational Services | 331 (26.2%) | 935 (73.9%) |
| Health Care & Social Assistance | 407 (16.4%) | 2,074 (83.6%) |
| Arts, Entertainment & Recreation | 113 (67.7%) | 54 (32.3%) |
| Accommodation & Food Services | 459 (30.7%) | 1,038 (69.3%) |
| Public Administration | 384 (54.7%) | 318 (45.3%) |
| Total | 11,518 (53.0%) | 10,228 (47.0%) |
Education in Logan County
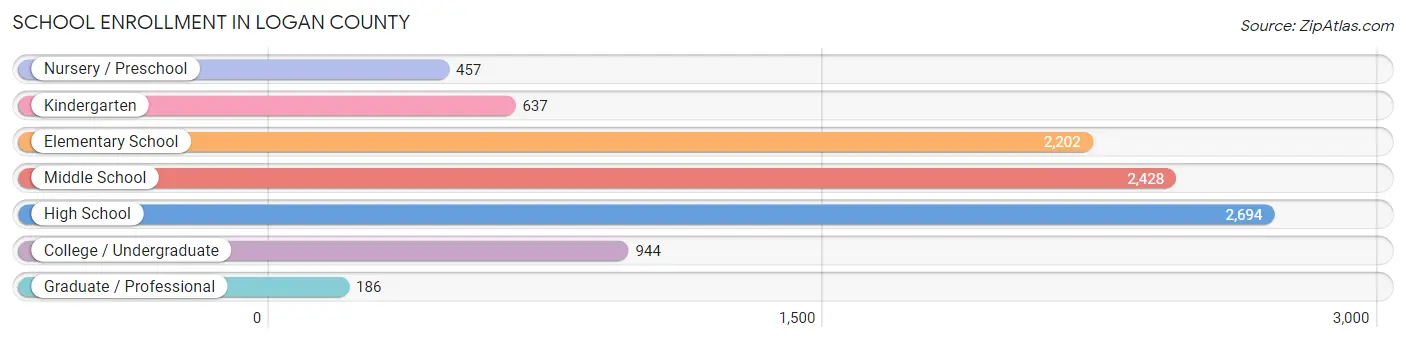
School Enrollment in Logan County
The most common levels of schooling among the 9,548 students in Logan County are high school (2,694 | 28.2%), middle school (2,428 | 25.4%), and elementary school (2,202 | 23.1%).
| School Level | # Students | % Students |
| Nursery / Preschool | 457 | 4.8% |
| Kindergarten | 637 | 6.7% |
| Elementary School | 2,202 | 23.1% |
| Middle School | 2,428 | 25.4% |
| High School | 2,694 | 28.2% |
| College / Undergraduate | 944 | 9.9% |
| Graduate / Professional | 186 | 1.9% |
| Total | 9,548 | 100.0% |
School Enrollment by Age by Funding Source in Logan County
Out of a total of 9,548 students who are enrolled in schools in Logan County, 783 (8.2%) attend a private institution, while the remaining 8,765 (91.8%) are enrolled in public schools. The age group of 20 to 24 year olds has the highest likelihood of being enrolled in private schools, with 147 (27.2% in the age bracket) enrolled. Conversely, the age group of 18 to 19 year olds has the lowest likelihood of being enrolled in a private school, with 559 (96.9% in the age bracket) attending a public institution.

| Age Bracket | Public School | Private School |
| 3 to 4 Year Olds | 287 (80.2%) | 71 (19.8%) |
| 5 to 9 Year Old | 2,412 (92.8%) | 188 (7.2%) |
| 10 to 14 Year Olds | 2,976 (95.6%) | 137 (4.4%) |
| 15 to 17 Year Olds | 1,800 (93.2%) | 132 (6.8%) |
| 18 to 19 Year Olds | 559 (96.9%) | 18 (3.1%) |
| 20 to 24 Year Olds | 394 (72.8%) | 147 (27.2%) |
| 25 to 34 Year Olds | 197 (82.1%) | 43 (17.9%) |
| 35 Years and over | 142 (75.9%) | 45 (24.1%) |
| Total | 8,765 (91.8%) | 783 (8.2%) |
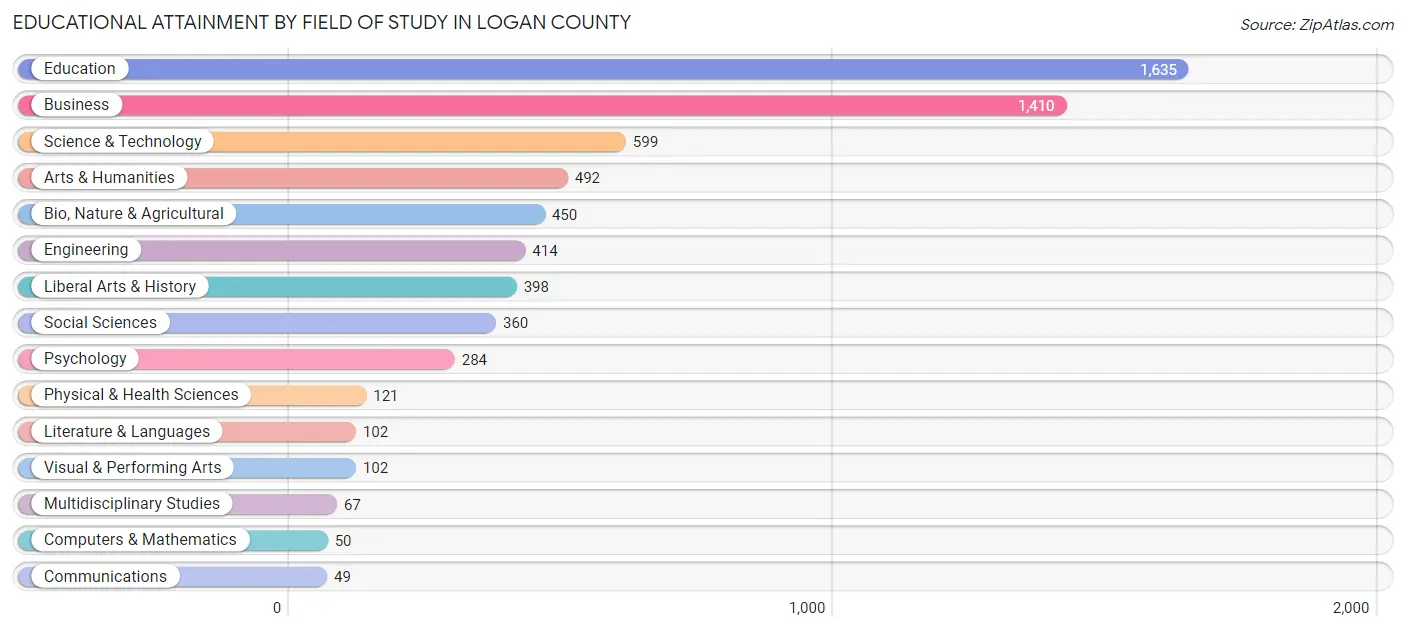
Educational Attainment by Field of Study in Logan County
Education (1,635 | 25.0%), business (1,410 | 21.6%), science & technology (599 | 9.2%), arts & humanities (492 | 7.5%), and bio, nature & agricultural (450 | 6.9%) are the most common fields of study among 6,533 individuals in Logan County who have obtained a bachelor's degree or higher.
| Field of Study | # Graduates | % Graduates |
| Computers & Mathematics | 50 | 0.8% |
| Bio, Nature & Agricultural | 450 | 6.9% |
| Physical & Health Sciences | 121 | 1.8% |
| Psychology | 284 | 4.3% |
| Social Sciences | 360 | 5.5% |
| Engineering | 414 | 6.3% |
| Multidisciplinary Studies | 67 | 1.0% |
| Science & Technology | 599 | 9.2% |
| Business | 1,410 | 21.6% |
| Education | 1,635 | 25.0% |
| Literature & Languages | 102 | 1.6% |
| Liberal Arts & History | 398 | 6.1% |
| Visual & Performing Arts | 102 | 1.6% |
| Communications | 49 | 0.7% |
| Arts & Humanities | 492 | 7.5% |
| Total | 6,533 | 100.0% |
Transportation & Commute in Logan County
Vehicle Availability by Sex in Logan County
The most prevalent vehicle ownership categories in Logan County are males with 2 vehicles (4,451, accounting for 39.6%) and females with 2 vehicles (3,628, making up 45.9%).

| Vehicles Available | Male | Female |
| No Vehicle | 345 (3.1%) | 116 (1.2%) |
| 1 Vehicle | 1,482 (13.2%) | 1,842 (19.0%) |
| 2 Vehicles | 4,451 (39.6%) | 3,628 (37.4%) |
| 3 Vehicles | 2,646 (23.5%) | 2,165 (22.3%) |
| 4 Vehicles | 1,229 (10.9%) | 992 (10.2%) |
| 5 or more Vehicles | 1,100 (9.8%) | 962 (9.9%) |
| Total | 11,253 (100.0%) | 9,705 (100.0%) |
Commute Time in Logan County
The most frequently occuring commute durations in Logan County are 15 to 19 minutes (3,291 commuters, 16.8%), 10 to 14 minutes (2,979 commuters, 15.2%), and 20 to 24 minutes (2,975 commuters, 15.2%).
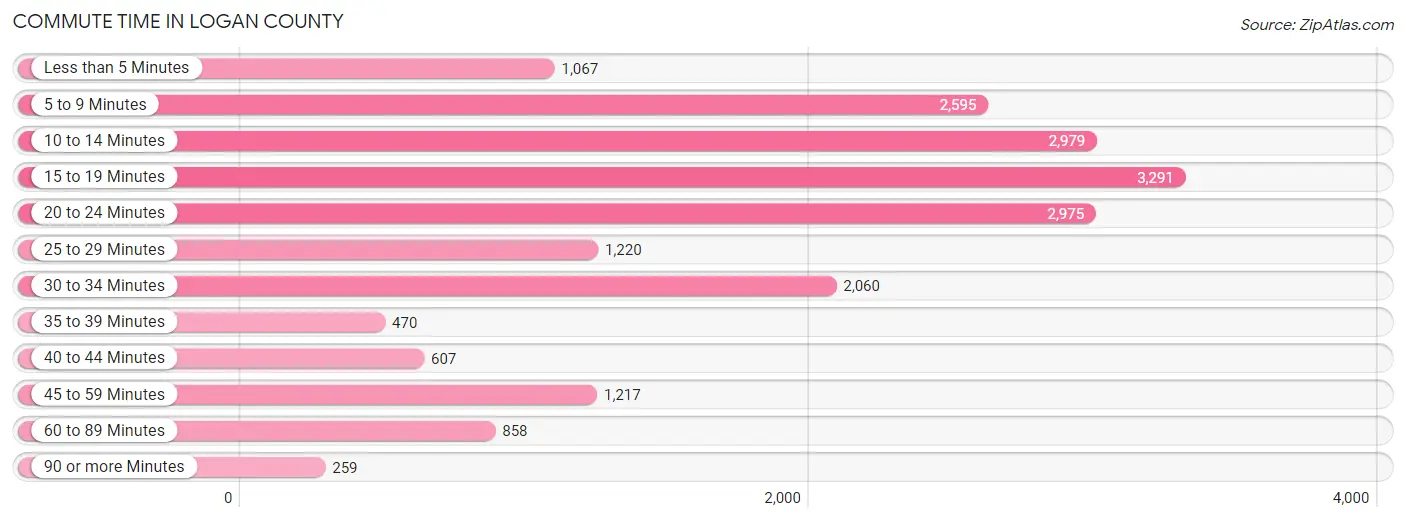
| Commute Time | # Commuters | % Commuters |
| Less than 5 Minutes | 1,067 | 5.4% |
| 5 to 9 Minutes | 2,595 | 13.2% |
| 10 to 14 Minutes | 2,979 | 15.2% |
| 15 to 19 Minutes | 3,291 | 16.8% |
| 20 to 24 Minutes | 2,975 | 15.2% |
| 25 to 29 Minutes | 1,220 | 6.2% |
| 30 to 34 Minutes | 2,060 | 10.5% |
| 35 to 39 Minutes | 470 | 2.4% |
| 40 to 44 Minutes | 607 | 3.1% |
| 45 to 59 Minutes | 1,217 | 6.2% |
| 60 to 89 Minutes | 858 | 4.4% |
| 90 or more Minutes | 259 | 1.3% |
Commute Time by Sex in Logan County
The most common commute times in Logan County are 20 to 24 minutes (1,904 commuters, 17.8%) for males and 15 to 19 minutes (1,834 commuters, 20.7%) for females.

| Commute Time | Male | Female |
| Less than 5 Minutes | 501 (4.7%) | 566 (6.4%) |
| 5 to 9 Minutes | 1,280 (11.9%) | 1,315 (14.8%) |
| 10 to 14 Minutes | 1,508 (14.1%) | 1,471 (16.6%) |
| 15 to 19 Minutes | 1,457 (13.6%) | 1,834 (20.7%) |
| 20 to 24 Minutes | 1,904 (17.8%) | 1,071 (12.1%) |
| 25 to 29 Minutes | 662 (6.2%) | 558 (6.3%) |
| 30 to 34 Minutes | 1,285 (12.0%) | 775 (8.7%) |
| 35 to 39 Minutes | 351 (3.3%) | 119 (1.3%) |
| 40 to 44 Minutes | 363 (3.4%) | 244 (2.8%) |
| 45 to 59 Minutes | 757 (7.1%) | 460 (5.2%) |
| 60 to 89 Minutes | 499 (4.7%) | 359 (4.0%) |
| 90 or more Minutes | 152 (1.4%) | 107 (1.2%) |
Time of Departure to Work by Sex in Logan County
The most frequent times of departure to work in Logan County are 4:00 PM to 11:59 PM (1,243, 11.6%) for males and 7:00 AM to 7:29 AM (1,268, 14.3%) for females.

| Time of Departure | Male | Female |
| 12:00 AM to 4:59 AM | 993 (9.3%) | 623 (7.0%) |
| 5:00 AM to 5:29 AM | 966 (9.0%) | 554 (6.2%) |
| 5:30 AM to 5:59 AM | 1,126 (10.5%) | 556 (6.3%) |
| 6:00 AM to 6:29 AM | 1,132 (10.6%) | 635 (7.1%) |
| 6:30 AM to 6:59 AM | 997 (9.3%) | 587 (6.6%) |
| 7:00 AM to 7:29 AM | 934 (8.7%) | 1,268 (14.3%) |
| 7:30 AM to 7:59 AM | 1,067 (10.0%) | 926 (10.4%) |
| 8:00 AM to 8:29 AM | 456 (4.3%) | 1,003 (11.3%) |
| 8:30 AM to 8:59 AM | 266 (2.5%) | 422 (4.8%) |
| 9:00 AM to 9:59 AM | 278 (2.6%) | 319 (3.6%) |
| 10:00 AM to 10:59 AM | 185 (1.7%) | 79 (0.9%) |
| 11:00 AM to 11:59 AM | 38 (0.4%) | 199 (2.2%) |
| 12:00 PM to 3:59 PM | 1,038 (9.7%) | 907 (10.2%) |
| 4:00 PM to 11:59 PM | 1,243 (11.6%) | 801 (9.0%) |
| Total | 10,719 (100.0%) | 8,879 (100.0%) |
Housing Occupancy in Logan County
Occupancy by Ownership in Logan County
Of the total 19,168 dwellings in Logan County, owner-occupied units account for 14,684 (76.6%), while renter-occupied units make up 4,484 (23.4%).
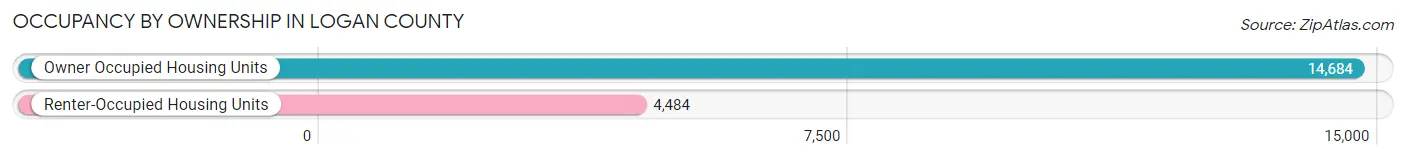
| Occupancy | # Housing Units | % Housing Units |
| Owner Occupied Housing Units | 14,684 | 76.6% |
| Renter-Occupied Housing Units | 4,484 | 23.4% |
| Total Occupied Housing Units | 19,168 | 100.0% |
Occupancy by Household Size in Logan County
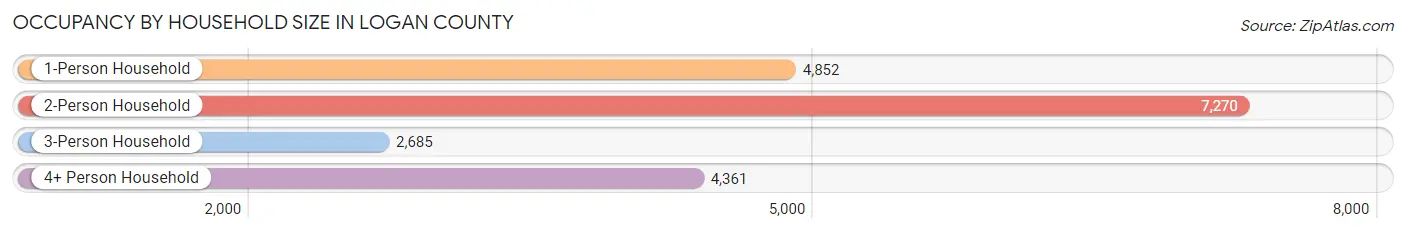
| Household Size | # Housing Units | % Housing Units |
| 1-Person Household | 4,852 | 25.3% |
| 2-Person Household | 7,270 | 37.9% |
| 3-Person Household | 2,685 | 14.0% |
| 4+ Person Household | 4,361 | 22.8% |
| Total Housing Units | 19,168 | 100.0% |
Occupancy by Ownership by Household Size in Logan County
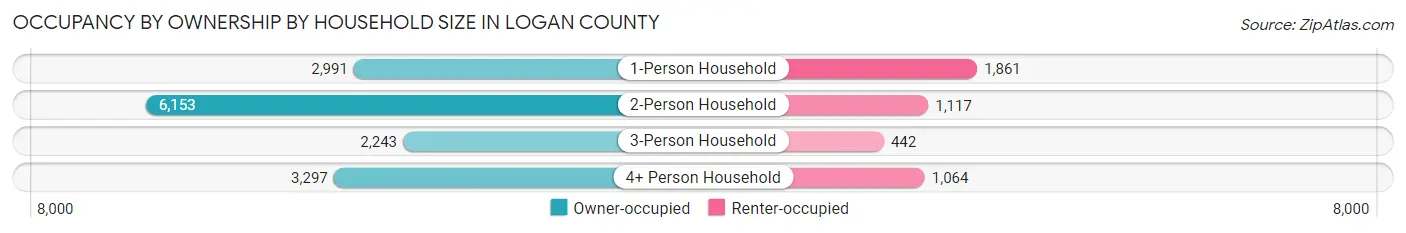
| Household Size | Owner-occupied | Renter-occupied |
| 1-Person Household | 2,991 (61.6%) | 1,861 (38.4%) |
| 2-Person Household | 6,153 (84.6%) | 1,117 (15.4%) |
| 3-Person Household | 2,243 (83.5%) | 442 (16.5%) |
| 4+ Person Household | 3,297 (75.6%) | 1,064 (24.4%) |
| Total Housing Units | 14,684 (76.6%) | 4,484 (23.4%) |
Occupancy by Educational Attainment in Logan County
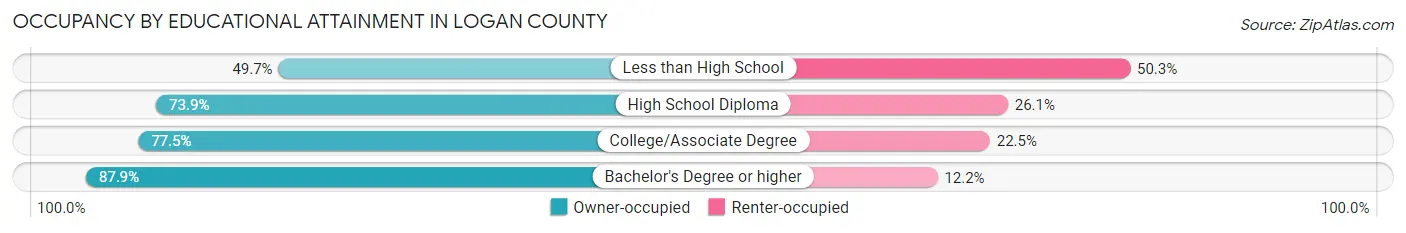
| Household Size | Owner-occupied | Renter-occupied |
| Less than High School | 519 (49.7%) | 526 (50.3%) |
| High School Diploma | 5,956 (73.9%) | 2,102 (26.1%) |
| College/Associate Degree | 4,725 (77.5%) | 1,374 (22.5%) |
| Bachelor's Degree or higher | 3,484 (87.8%) | 482 (12.1%) |
Occupancy by Age of Householder in Logan County
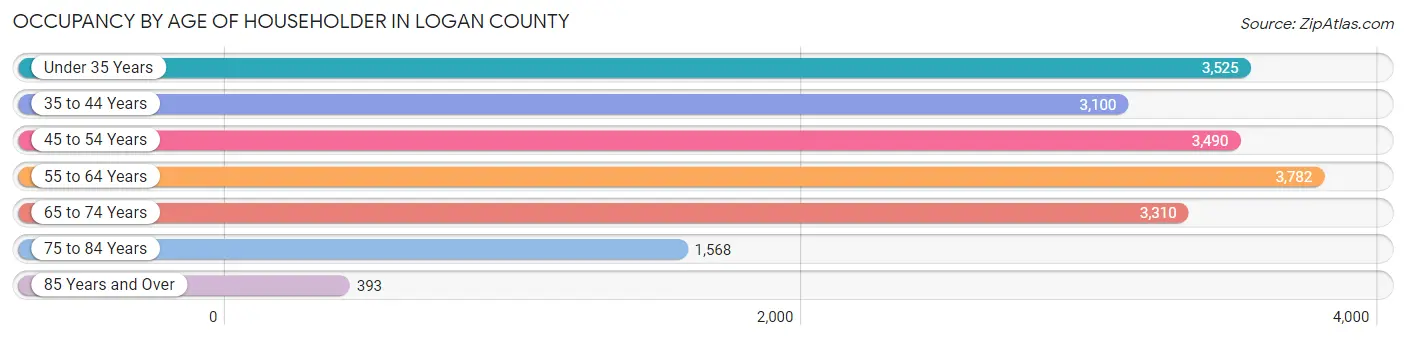
| Age Bracket | # Households | % Households |
| Under 35 Years | 3,525 | 18.4% |
| 35 to 44 Years | 3,100 | 16.2% |
| 45 to 54 Years | 3,490 | 18.2% |
| 55 to 64 Years | 3,782 | 19.7% |
| 65 to 74 Years | 3,310 | 17.3% |
| 75 to 84 Years | 1,568 | 8.2% |
| 85 Years and Over | 393 | 2.1% |
| Total | 19,168 | 100.0% |
Housing Finances in Logan County
Median Income by Occupancy in Logan County
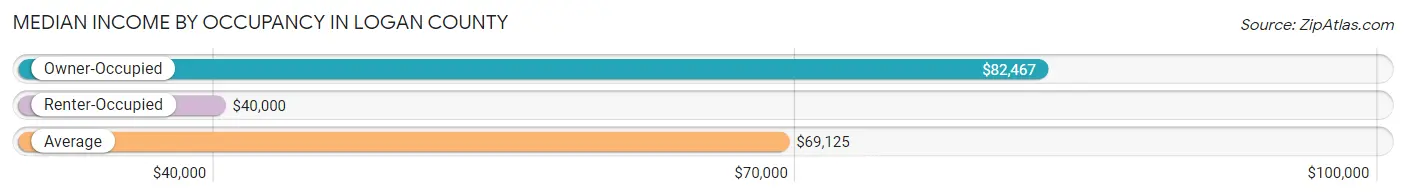
| Occupancy Type | # Households | Median Income |
| Owner-Occupied | 14,684 (76.6%) | $82,467 |
| Renter-Occupied | 4,484 (23.4%) | $40,000 |
| Average | 19,168 (100.0%) | $69,125 |
Occupancy by Householder Income Bracket in Logan County

| Income Bracket | Owner-occupied | Renter-occupied |
| Less than $5,000 | 297 (2.0%) | 256 (5.7%) |
| $5,000 to $9,999 | 159 (1.1%) | 100 (2.2%) |
| $10,000 to $14,999 | 271 (1.8%) | 518 (11.6%) |
| $15,000 to $19,999 | 297 (2.0%) | 464 (10.3%) |
| $20,000 to $24,999 | 285 (1.9%) | 206 (4.6%) |
| $25,000 to $34,999 | 701 (4.8%) | 369 (8.2%) |
| $35,000 to $49,999 | 1,881 (12.8%) | 862 (19.2%) |
| $50,000 to $74,999 | 2,778 (18.9%) | 878 (19.6%) |
| $75,000 to $99,999 | 2,592 (17.6%) | 356 (7.9%) |
| $100,000 to $149,999 | 3,409 (23.2%) | 406 (9.0%) |
| $150,000 or more | 2,014 (13.7%) | 69 (1.5%) |
| Total | 14,684 (100.0%) | 4,484 (100.0%) |
Monthly Housing Cost Tiers in Logan County
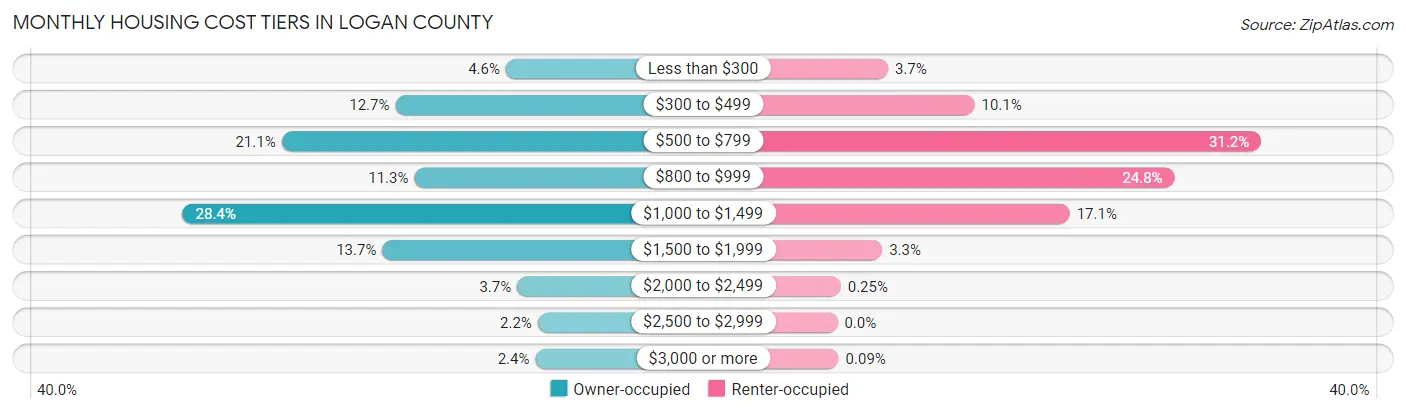
| Monthly Cost | Owner-occupied | Renter-occupied |
| Less than $300 | 670 (4.6%) | 167 (3.7%) |
| $300 to $499 | 1,865 (12.7%) | 453 (10.1%) |
| $500 to $799 | 3,095 (21.1%) | 1,399 (31.2%) |
| $800 to $999 | 1,660 (11.3%) | 1,113 (24.8%) |
| $1,000 to $1,499 | 4,164 (28.4%) | 767 (17.1%) |
| $1,500 to $1,999 | 2,006 (13.7%) | 148 (3.3%) |
| $2,000 to $2,499 | 548 (3.7%) | 11 (0.3%) |
| $2,500 to $2,999 | 325 (2.2%) | 0 (0.0%) |
| $3,000 or more | 351 (2.4%) | 4 (0.1%) |
| Total | 14,684 (100.0%) | 4,484 (100.0%) |
Physical Housing Characteristics in Logan County
Housing Structures in Logan County
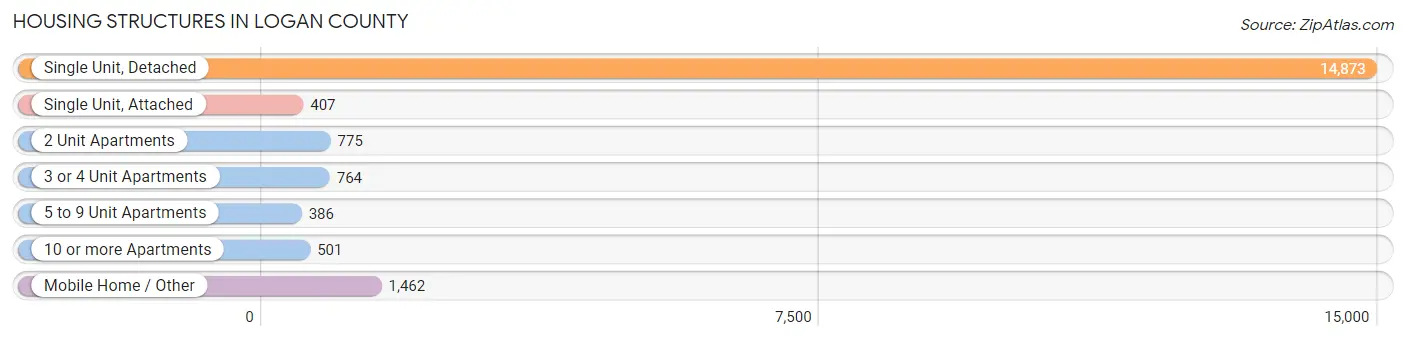
| Structure Type | # Housing Units | % Housing Units |
| Single Unit, Detached | 14,873 | 77.6% |
| Single Unit, Attached | 407 | 2.1% |
| 2 Unit Apartments | 775 | 4.0% |
| 3 or 4 Unit Apartments | 764 | 4.0% |
| 5 to 9 Unit Apartments | 386 | 2.0% |
| 10 or more Apartments | 501 | 2.6% |
| Mobile Home / Other | 1,462 | 7.6% |
| Total | 19,168 | 100.0% |
Housing Structures by Occupancy in Logan County
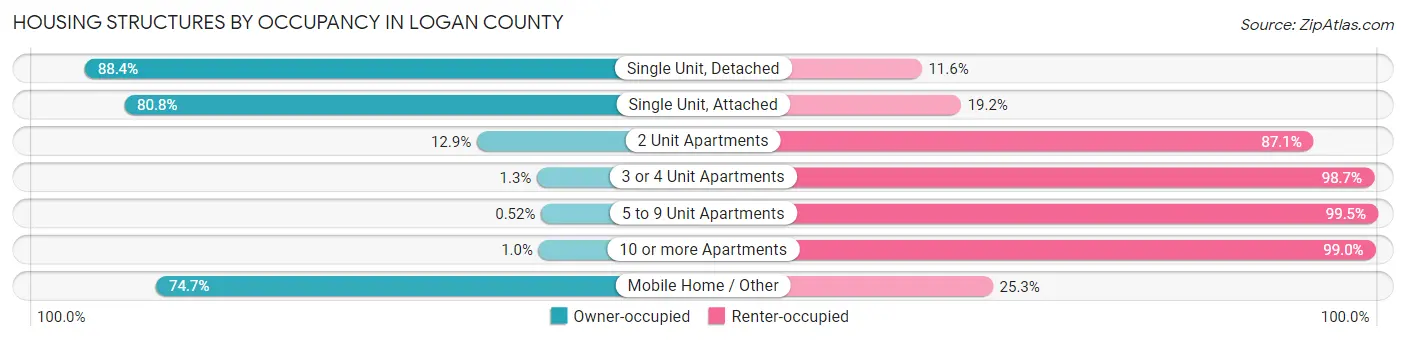
| Structure Type | Owner-occupied | Renter-occupied |
| Single Unit, Detached | 13,146 (88.4%) | 1,727 (11.6%) |
| Single Unit, Attached | 329 (80.8%) | 78 (19.2%) |
| 2 Unit Apartments | 100 (12.9%) | 675 (87.1%) |
| 3 or 4 Unit Apartments | 10 (1.3%) | 754 (98.7%) |
| 5 to 9 Unit Apartments | 2 (0.5%) | 384 (99.5%) |
| 10 or more Apartments | 5 (1.0%) | 496 (99.0%) |
| Mobile Home / Other | 1,092 (74.7%) | 370 (25.3%) |
| Total | 14,684 (76.6%) | 4,484 (23.4%) |
Housing Structures by Number of Rooms in Logan County
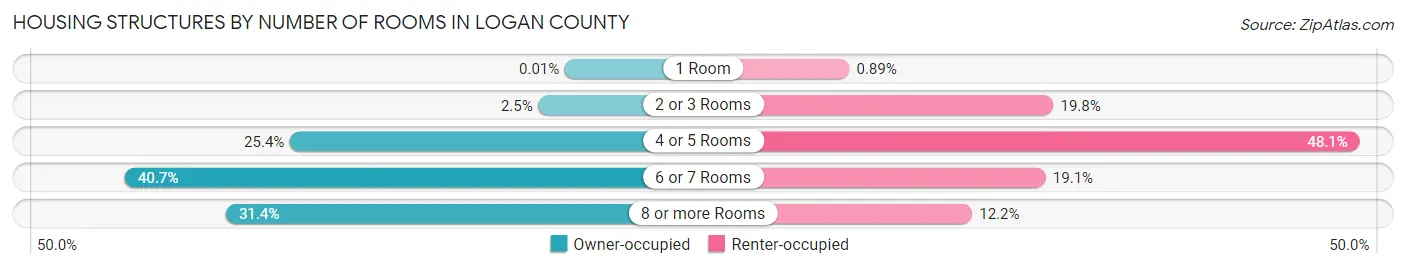
| Number of Rooms | Owner-occupied | Renter-occupied |
| 1 Room | 1 (0.0%) | 40 (0.9%) |
| 2 or 3 Rooms | 362 (2.5%) | 886 (19.8%) |
| 4 or 5 Rooms | 3,736 (25.4%) | 2,155 (48.1%) |
| 6 or 7 Rooms | 5,978 (40.7%) | 854 (19.1%) |
| 8 or more Rooms | 4,607 (31.4%) | 549 (12.2%) |
| Total | 14,684 (100.0%) | 4,484 (100.0%) |
Housing Structure by Heating Type in Logan County
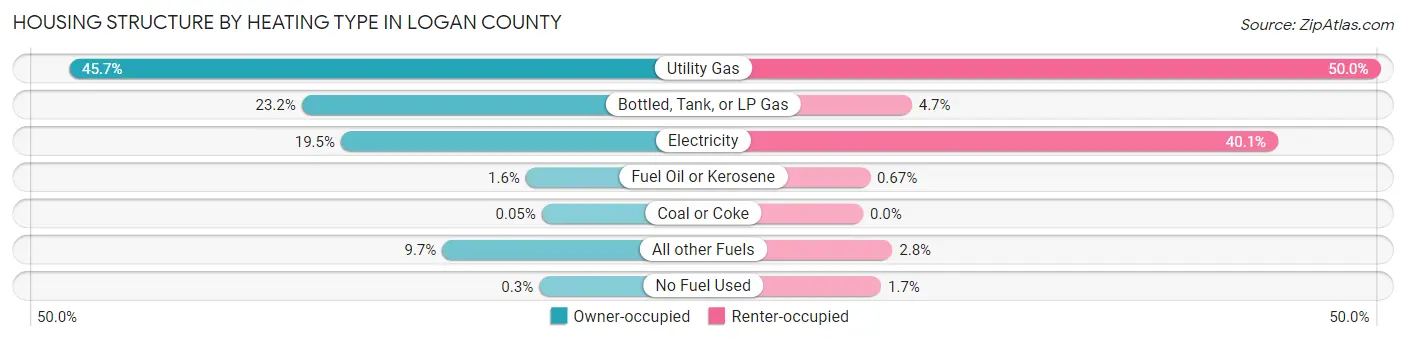
| Heating Type | Owner-occupied | Renter-occupied |
| Utility Gas | 6,711 (45.7%) | 2,241 (50.0%) |
| Bottled, Tank, or LP Gas | 3,413 (23.2%) | 211 (4.7%) |
| Electricity | 2,856 (19.5%) | 1,797 (40.1%) |
| Fuel Oil or Kerosene | 234 (1.6%) | 30 (0.7%) |
| Coal or Coke | 8 (0.1%) | 0 (0.0%) |
| All other Fuels | 1,418 (9.7%) | 127 (2.8%) |
| No Fuel Used | 44 (0.3%) | 78 (1.7%) |
| Total | 14,684 (100.0%) | 4,484 (100.0%) |
Household Vehicle Usage in Logan County
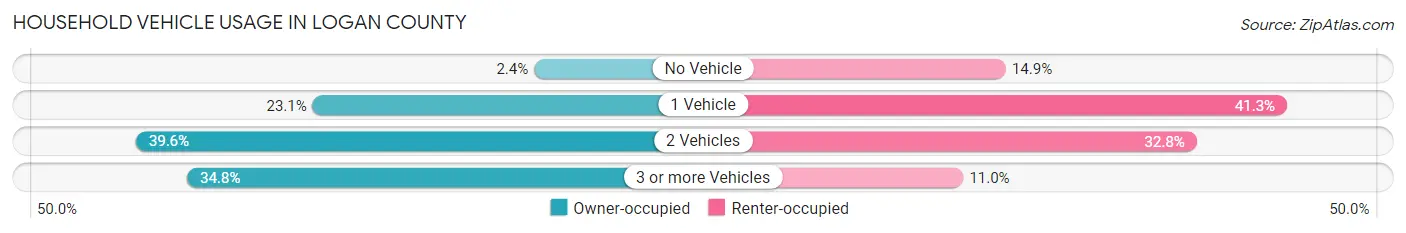
| Vehicles per Household | Owner-occupied | Renter-occupied |
| No Vehicle | 359 (2.4%) | 670 (14.9%) |
| 1 Vehicle | 3,395 (23.1%) | 1,850 (41.3%) |
| 2 Vehicles | 5,816 (39.6%) | 1,472 (32.8%) |
| 3 or more Vehicles | 5,114 (34.8%) | 492 (11.0%) |
| Total | 14,684 (100.0%) | 4,484 (100.0%) |
Real Estate & Mortgages in Logan County
Real Estate and Mortgage Overview in Logan County
| Characteristic | Without Mortgage | With Mortgage |
| Housing Units | 5,218 | 9,466 |
| Median Property Value | $157,400 | $172,600 |
| Median Household Income | $65,077 | $1,599 |
| Monthly Housing Costs | $529 | $351 |
| Real Estate Taxes | $1,729 | $195 |
Property Value by Mortgage Status in Logan County
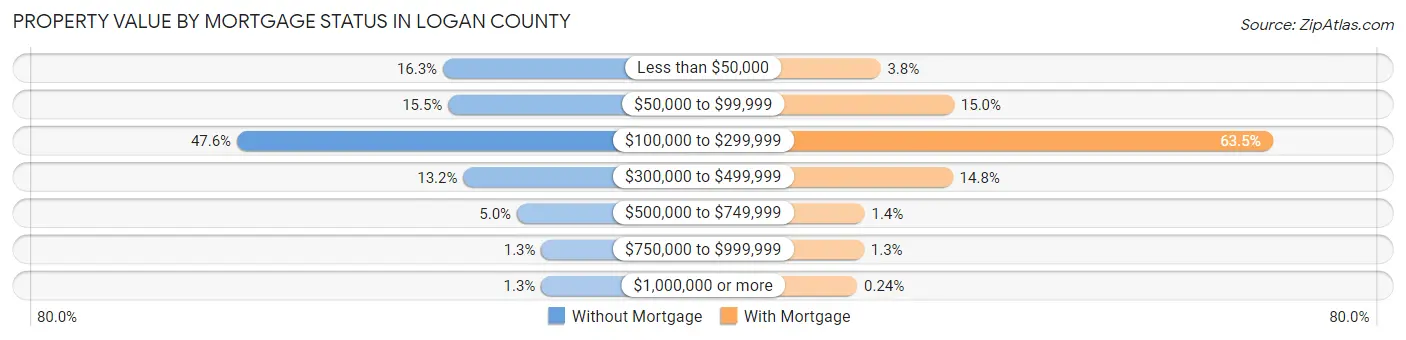
| Property Value | Without Mortgage | With Mortgage |
| Less than $50,000 | 848 (16.3%) | 360 (3.8%) |
| $50,000 to $99,999 | 806 (15.4%) | 1,418 (15.0%) |
| $100,000 to $299,999 | 2,486 (47.6%) | 6,014 (63.5%) |
| $300,000 to $499,999 | 686 (13.2%) | 1,401 (14.8%) |
| $500,000 to $749,999 | 260 (5.0%) | 130 (1.4%) |
| $750,000 to $999,999 | 65 (1.3%) | 120 (1.3%) |
| $1,000,000 or more | 67 (1.3%) | 23 (0.2%) |
| Total | 5,218 (100.0%) | 9,466 (100.0%) |
Household Income by Mortgage Status in Logan County
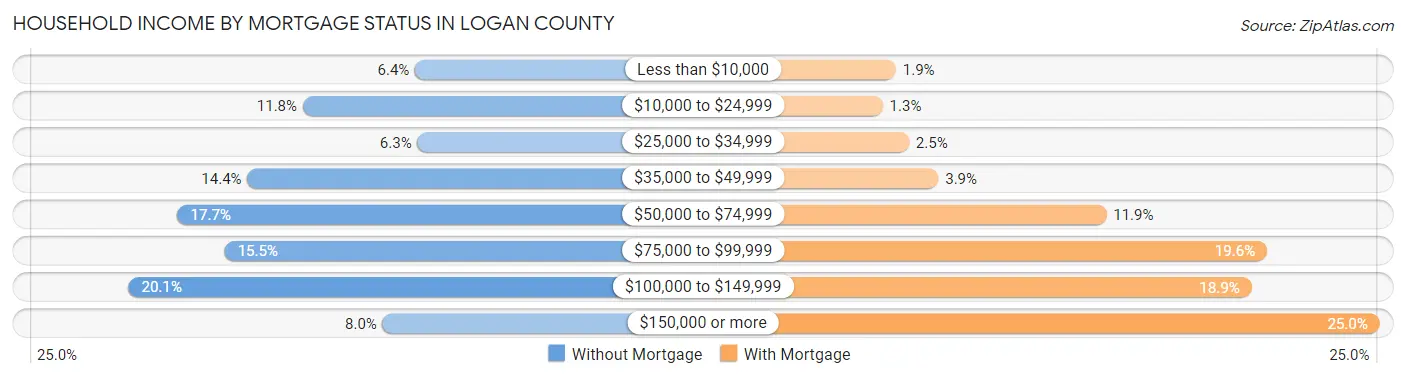
| Household Income | Without Mortgage | With Mortgage |
| Less than $10,000 | 334 (6.4%) | 182 (1.9%) |
| $10,000 to $24,999 | 613 (11.7%) | 122 (1.3%) |
| $25,000 to $34,999 | 328 (6.3%) | 240 (2.5%) |
| $35,000 to $49,999 | 751 (14.4%) | 373 (3.9%) |
| $50,000 to $74,999 | 924 (17.7%) | 1,130 (11.9%) |
| $75,000 to $99,999 | 807 (15.5%) | 1,854 (19.6%) |
| $100,000 to $149,999 | 1,046 (20.1%) | 1,785 (18.9%) |
| $150,000 or more | 415 (8.0%) | 2,363 (25.0%) |
| Total | 5,218 (100.0%) | 9,466 (100.0%) |
Property Value to Household Income Ratio in Logan County
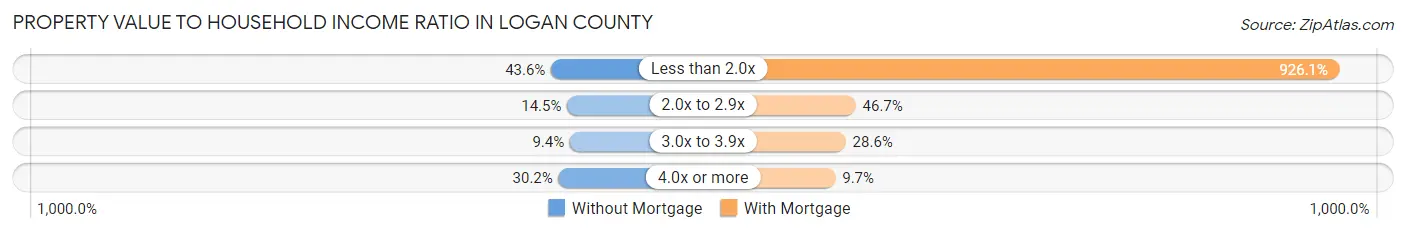
| Value-to-Income Ratio | Without Mortgage | With Mortgage |
| Less than 2.0x | 2,275 (43.6%) | 87,660 (926.1%) |
| 2.0x to 2.9x | 755 (14.5%) | 4,419 (46.7%) |
| 3.0x to 3.9x | 492 (9.4%) | 2,704 (28.6%) |
| 4.0x or more | 1,575 (30.2%) | 917 (9.7%) |
| Total | 5,218 (100.0%) | 9,466 (100.0%) |
Real Estate Taxes by Mortgage Status in Logan County

| Property Taxes | Without Mortgage | With Mortgage |
| Less than $800 | 958 (18.4%) | 25 (0.3%) |
| $800 to $1,499 | 1,211 (23.2%) | 901 (9.5%) |
| $800 to $1,499 | 2,885 (55.3%) | 2,659 (28.1%) |
| Total | 5,218 (100.0%) | 9,466 (100.0%) |
Health & Disability in Logan County
Health Insurance Coverage by Age in Logan County

| Age Bracket | With Coverage | Without Coverage |
| Under 6 Years | 2,909 (97.8%) | 67 (2.2%) |
| 6 to 18 Years | 7,833 (96.3%) | 305 (3.7%) |
| 19 to 25 Years | 2,960 (89.6%) | 344 (10.4%) |
| 26 to 34 Years | 4,562 (92.8%) | 352 (7.2%) |
| 35 to 44 Years | 5,132 (93.8%) | 340 (6.2%) |
| 45 to 54 Years | 5,484 (94.3%) | 332 (5.7%) |
| 55 to 64 Years | 6,231 (92.0%) | 545 (8.0%) |
| 65 to 74 Years | 5,227 (99.4%) | 31 (0.6%) |
| 75 Years and older | 3,036 (99.3%) | 23 (0.7%) |
| Total | 43,374 (94.9%) | 2,339 (5.1%) |
Health Insurance Coverage by Citizenship Status in Logan County
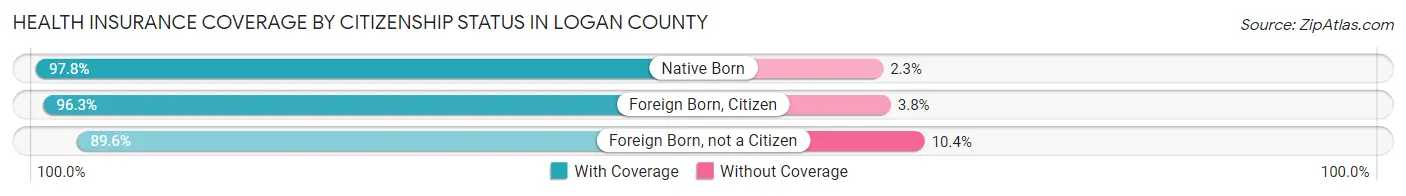
| Citizenship Status | With Coverage | Without Coverage |
| Native Born | 2,909 (97.8%) | 67 (2.2%) |
| Foreign Born, Citizen | 7,833 (96.3%) | 305 (3.7%) |
| Foreign Born, not a Citizen | 2,960 (89.6%) | 344 (10.4%) |
Health Insurance Coverage by Household Income in Logan County
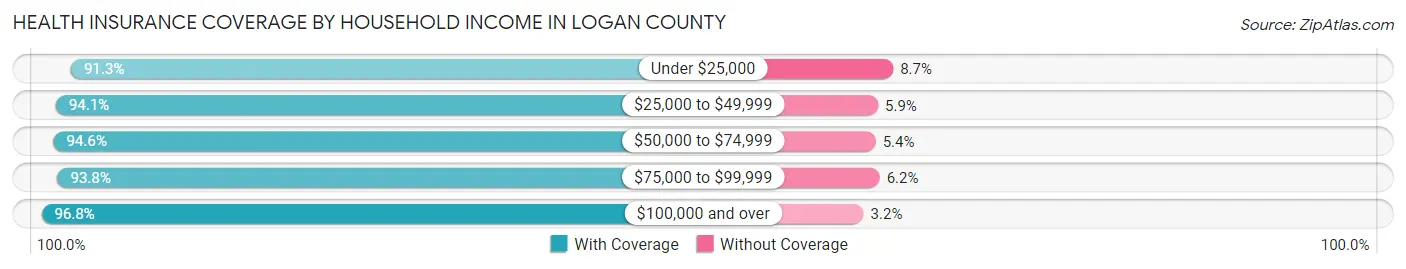
| Household Income | With Coverage | Without Coverage |
| Under $25,000 | 4,218 (91.3%) | 402 (8.7%) |
| $25,000 to $49,999 | 7,132 (94.1%) | 445 (5.9%) |
| $50,000 to $74,999 | 7,595 (94.6%) | 435 (5.4%) |
| $75,000 to $99,999 | 7,664 (93.8%) | 504 (6.2%) |
| $100,000 and over | 16,698 (96.8%) | 545 (3.2%) |
Public vs Private Health Insurance Coverage by Age in Logan County
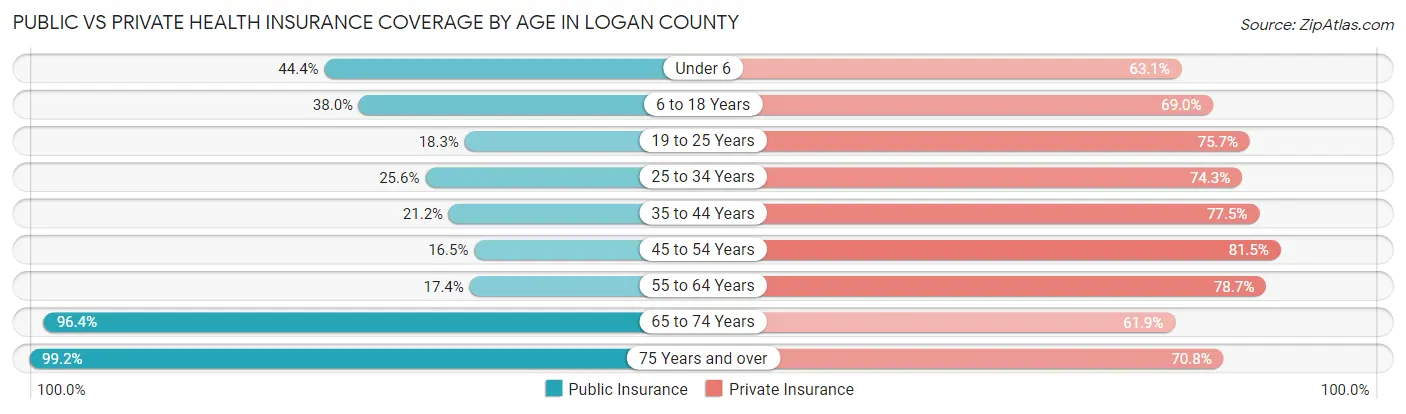
| Age Bracket | Public Insurance | Private Insurance |
| Under 6 | 1,320 (44.4%) | 1,877 (63.1%) |
| 6 to 18 Years | 3,088 (38.0%) | 5,612 (69.0%) |
| 19 to 25 Years | 605 (18.3%) | 2,502 (75.7%) |
| 25 to 34 Years | 1,260 (25.6%) | 3,650 (74.3%) |
| 35 to 44 Years | 1,162 (21.2%) | 4,239 (77.5%) |
| 45 to 54 Years | 962 (16.5%) | 4,739 (81.5%) |
| 55 to 64 Years | 1,179 (17.4%) | 5,335 (78.7%) |
| 65 to 74 Years | 5,071 (96.4%) | 3,255 (61.9%) |
| 75 Years and over | 3,033 (99.2%) | 2,167 (70.8%) |
| Total | 17,680 (38.7%) | 33,376 (73.0%) |
Disability Status by Sex by Age in Logan County
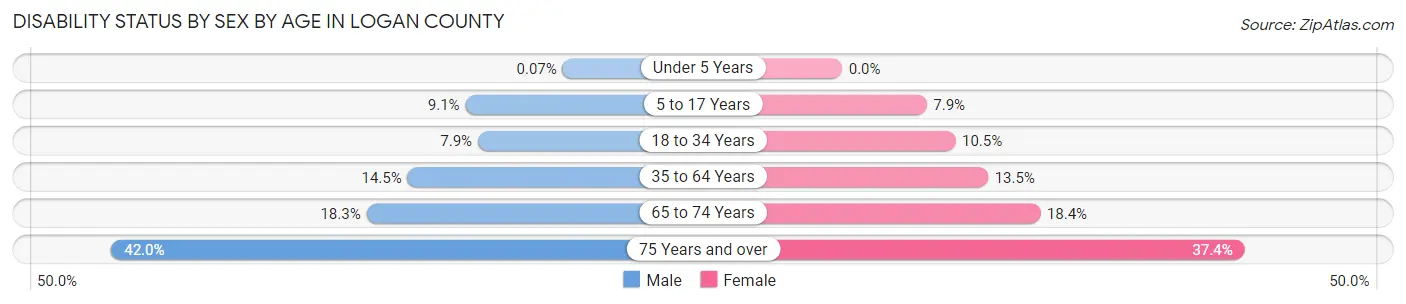
| Age Bracket | Male | Female |
| Under 5 Years | 1 (0.1%) | 0 (0.0%) |
| 5 to 17 Years | 373 (9.1%) | 297 (7.9%) |
| 18 to 34 Years | 354 (7.9%) | 458 (10.5%) |
| 35 to 64 Years | 1,329 (14.5%) | 1,202 (13.5%) |
| 65 to 74 Years | 467 (18.3%) | 497 (18.4%) |
| 75 Years and over | 547 (41.9%) | 656 (37.4%) |
Disability Class by Sex by Age in Logan County
Disability Class: Hearing Difficulty
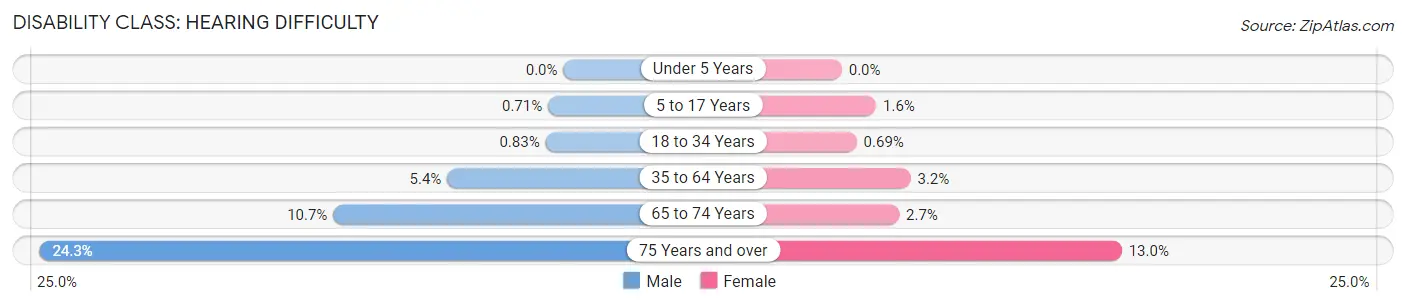
| Age Bracket | Male | Female |
| Under 5 Years | 0 (0.0%) | 0 (0.0%) |
| 5 to 17 Years | 29 (0.7%) | 60 (1.6%) |
| 18 to 34 Years | 37 (0.8%) | 30 (0.7%) |
| 35 to 64 Years | 495 (5.4%) | 283 (3.2%) |
| 65 to 74 Years | 273 (10.7%) | 72 (2.7%) |
| 75 Years and over | 317 (24.3%) | 228 (13.0%) |
Disability Class: Vision Difficulty
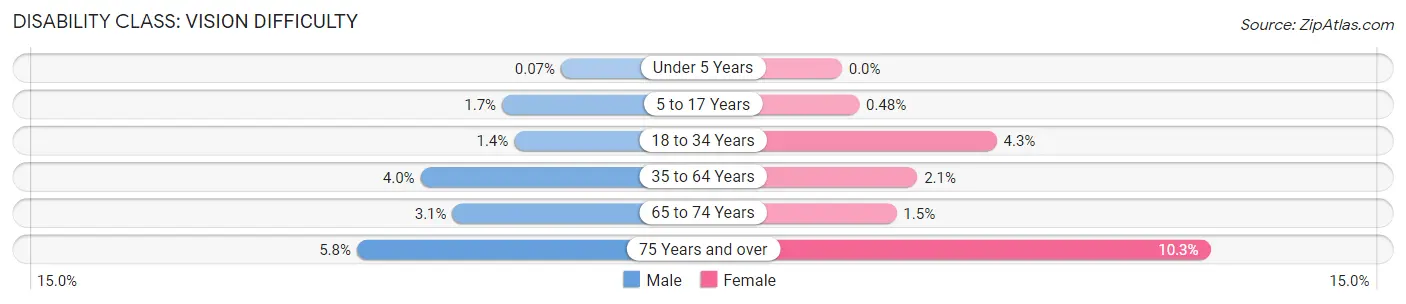
| Age Bracket | Male | Female |
| Under 5 Years | 1 (0.1%) | 0 (0.0%) |
| 5 to 17 Years | 70 (1.7%) | 18 (0.5%) |
| 18 to 34 Years | 61 (1.4%) | 188 (4.3%) |
| 35 to 64 Years | 366 (4.0%) | 186 (2.1%) |
| 65 to 74 Years | 79 (3.1%) | 41 (1.5%) |
| 75 Years and over | 75 (5.8%) | 180 (10.3%) |
Disability Class: Cognitive Difficulty
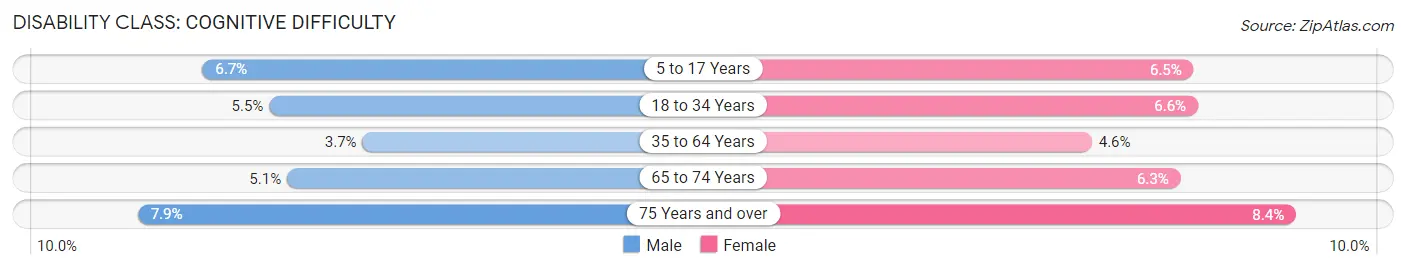
| Age Bracket | Male | Female |
| 5 to 17 Years | 275 (6.7%) | 247 (6.5%) |
| 18 to 34 Years | 244 (5.5%) | 288 (6.6%) |
| 35 to 64 Years | 343 (3.7%) | 412 (4.6%) |
| 65 to 74 Years | 131 (5.1%) | 170 (6.3%) |
| 75 Years and over | 103 (7.9%) | 148 (8.4%) |
Disability Class: Ambulatory Difficulty

| Age Bracket | Male | Female |
| 5 to 17 Years | 39 (0.9%) | 2 (0.1%) |
| 18 to 34 Years | 26 (0.6%) | 98 (2.2%) |
| 35 to 64 Years | 623 (6.8%) | 583 (6.6%) |
| 65 to 74 Years | 260 (10.2%) | 368 (13.6%) |
| 75 Years and over | 255 (19.6%) | 513 (29.2%) |
Disability Class: Self-Care Difficulty

| Age Bracket | Male | Female |
| 5 to 17 Years | 37 (0.9%) | 11 (0.3%) |
| 18 to 34 Years | 0 (0.0%) | 22 (0.5%) |
| 35 to 64 Years | 135 (1.5%) | 140 (1.6%) |
| 65 to 74 Years | 60 (2.4%) | 108 (4.0%) |
| 75 Years and over | 77 (5.9%) | 183 (10.4%) |
Technology Access in Logan County
Computing Device Access in Logan County
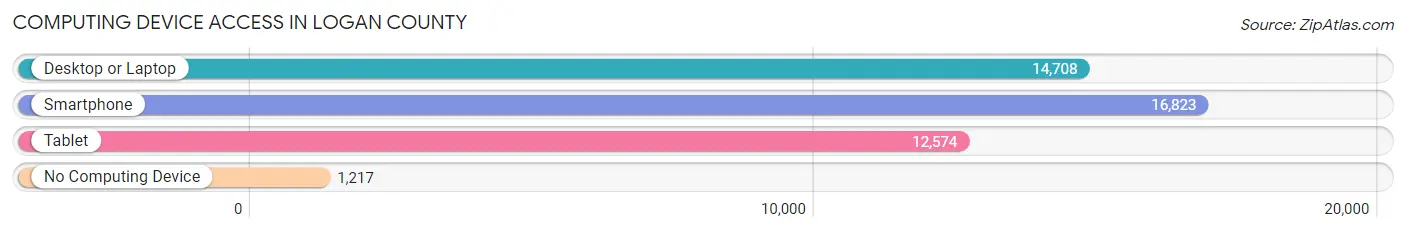
| Device Type | # Households | % Households |
| Desktop or Laptop | 14,708 | 76.7% |
| Smartphone | 16,823 | 87.8% |
| Tablet | 12,574 | 65.6% |
| No Computing Device | 1,217 | 6.4% |
| Total | 19,168 | 100.0% |
Internet Access in Logan County

| Internet Type | # Households | % Households |
| Dial-Up Internet | 61 | 0.3% |
| Broadband Home | 12,853 | 67.0% |
| Cellular Data Only | 3,000 | 15.7% |
| Satellite Internet | 1,024 | 5.3% |
| No Internet | 2,248 | 11.7% |
| Total | 19,168 | 100.0% |
Logan County Summary
Logan County, Ohio is located in the central part of the state, and is part of the Columbus, Ohio metropolitan area. It is bordered by Union, Hardin, Champaign, Shelby, Auglaize, and Union counties. The county seat is Bellefontaine, and the county was named after Benjamin Logan, a Revolutionary War hero. As of the 2010 census, the population was 45,858.
Geography
Logan County is located in the central part of Ohio, and is part of the Columbus, Ohio metropolitan area. It is bordered by Union, Hardin, Champaign, Shelby, Auglaize, and Union counties. The county has a total area of 437 square miles, of which 434 square miles is land and 3 square miles is water. The county is mostly flat, with some rolling hills in the northern part. The highest point in the county is 1,068 feet above sea level, located in the northern part of the county.
The county is drained by the Scioto River, which flows through the county from north to south. The county is also home to several small lakes, including Indian Lake, Lake Loramie, and Grand Lake St. Marys.
Demographics
As of the 2010 census, there were 45,858 people, 17,845 households, and 12,717 families living in the county. The population density was 105.3 people per square mile. The racial makeup of the county was 95.3% White, 1.3% African American, 0.3% Native American, 0.5% Asian, 0.1% Pacific Islander, 0.7% from other races, and 1.8% from two or more races. Hispanic or Latino of any race were 2.2% of the population.
The median income for a household in the county was $45,945, and the median income for a family was $54,945. The per capita income for the county was $21,945. About 8.3% of families and 10.7% of the population were below the poverty line, including 14.2% of those under age 18 and 7.2% of those age 65 or over.
Economy
Logan County is home to several major employers, including Honda of America, which has a manufacturing plant in the county. Other major employers include the Honda Research and Development Center, the Honda Transmission Plant, and the Honda Logistics Center. The county is also home to several smaller businesses, including manufacturing, retail, and service industries.
The county is also home to several educational institutions, including Ohio State University, Ohio Northern University, and the University of Northwestern Ohio.
History
Logan County was formed in 1817 from parts of Champaign, Hardin, and Shelby counties. The county was named after Benjamin Logan, a Revolutionary War hero. The county seat was originally located in Zanesfield, but was moved to Bellefontaine in 1820.
The county was largely agricultural in the 19th century, with the main crops being wheat, corn, and oats. The county also had several small manufacturing businesses, including a woolen mill, a sawmill, and a gristmill.
In the 20th century, the county's economy shifted to manufacturing, with the opening of the Honda of America plant in 1979. The plant has since become the county's largest employer, and has helped to diversify the county's economy.
Today, Logan County is a largely rural county, with a mix of agricultural and manufacturing businesses. The county is home to several educational institutions, and is part of the Columbus, Ohio metropolitan area.
Common Questions
What is the Total Population of Logan County?
Total Population of Logan County is 46,098.
What is the Total Male Population of Logan County?
Total Male Population of Logan County is 23,146.
What is the Total Female Population of Logan County?
Total Female Population of Logan County is 22,952.
What is the Ratio of Males per 100 Females in Logan County?
There are 100.85 Males per 100 Females in Logan County.
What is the Ratio of Females per 100 Males in Logan County?
There are 99.16 Females per 100 Males in Logan County.
What is the Median Population Age in Logan County?
Median Population Age in Logan County is 41.8 Years.
What is the Average Family Size in Logan County
Average Family Size in Logan County is 2.8 People.
What is the Average Household Size in Logan County
Average Household Size in Logan County is 2.4 People.
What is Per Capita Income in Logan County?
Per Capita income in Logan County is $36,215.
What is the Median Family Income in Logan County?
Median Family Income in Logan County is $83,278.
What is the Median Household income in Logan County?
Median Household Income in Logan County is $69,125.
What is Income or Wage Gap in Logan County?
Income or Wage Gap in Logan County is 31.0%.
Women in Logan County earn 69.0 cents for every dollar earned by a man.
What is Family Income Deficit in Logan County?
Family Income Deficit in Logan County is $11,074.
Families that are below poverty line in Logan County earn $11,074 less on average than the poverty threshold level.
What is Inequality or Gini Index in Logan County?
Inequality or Gini Index in Logan County is 0.44.
How Large is the Labor Force in Logan County?
There are 22,544 People in the Labor Forcein in Logan County.
What is the Percentage of People in the Labor Force in Logan County?
60.8% of People are in the Labor Force in Logan County.
What is the Unemployment Rate in Logan County?
Unemployment Rate in Logan County is 3.5%.