Licking County, OH
Licking County Overview
178,844
TOTAL POPULATION
88,628
MALE POPULATION
90,216
FEMALE POPULATION
98.24
MALES / 100 FEMALES
101.79
FEMALES / 100 MALES
40.2
MEDIAN AGE
3.1
AVG FAMILY SIZE
2.6
AVG HOUSEHOLD SIZE
$39,760
PER CAPITA INCOME
$96,410
AVG FAMILY INCOME
$78,505
AVG HOUSEHOLD INCOME
29.7%
WAGE / INCOME GAP [ % ]
70.3¢/ $1
WAGE / INCOME GAP [ $ ]
$10,630
FAMILY INCOME DEFICIT
0.45
INEQUALITY / GINI INDEX
90,033
LABOR FORCE [ PEOPLE ]
63.2%
PERCENT IN LABOR FORCE
3.3%
UNEMPLOYMENT RATE
Licking County Area Codes
Race in Licking County
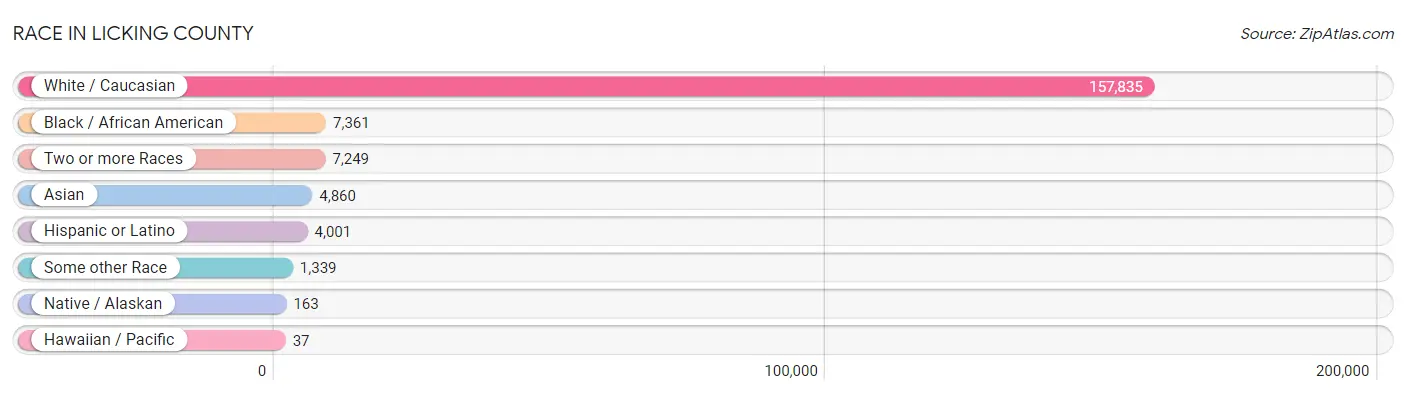
The most populous races in Licking County are White / Caucasian (157,835 | 88.2%), Black / African American (7,361 | 4.1%), and Two or more Races (7,249 | 4.1%).
| Race | # Population | % Population |
| Asian | 4,860 | 2.7% |
| Black / African American | 7,361 | 4.1% |
| Hawaiian / Pacific | 37 | 0.0% |
| Hispanic or Latino | 4,001 | 2.2% |
| Native / Alaskan | 163 | 0.1% |
| White / Caucasian | 157,835 | 88.2% |
| Two or more Races | 7,249 | 4.1% |
| Some other Race | 1,339 | 0.7% |
| Total | 178,844 | 100.0% |
Ancestry in Licking County
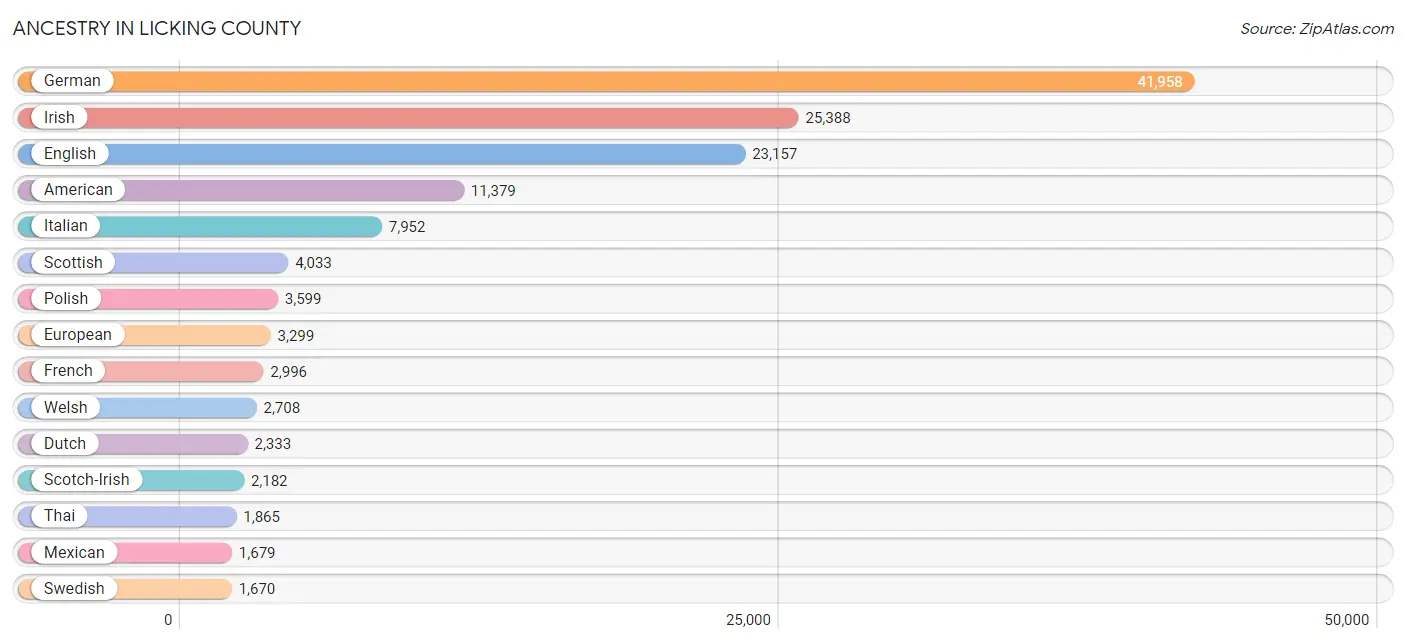
The most populous ancestries reported in Licking County are German (41,958 | 23.5%), Irish (25,388 | 14.2%), English (23,157 | 13.0%), American (11,379 | 6.4%), and Italian (7,952 | 4.4%), together accounting for 61.4% of all Licking County residents.
| Ancestry | # Population | % Population |
| African | 787 | 0.4% |
| Alaska Native | 3 | 0.0% |
| Albanian | 7 | 0.0% |
| American | 11,379 | 6.4% |
| Arab | 448 | 0.3% |
| Armenian | 6 | 0.0% |
| Assyrian / Chaldean / Syriac | 20 | 0.0% |
| Australian | 28 | 0.0% |
| Austrian | 265 | 0.2% |
| Bangladeshi | 18 | 0.0% |
| Barbadian | 20 | 0.0% |
| Basque | 32 | 0.0% |
| Belgian | 121 | 0.1% |
| Bhutanese | 223 | 0.1% |
| Blackfeet | 178 | 0.1% |
| British | 973 | 0.5% |
| Burmese | 274 | 0.2% |
| Canadian | 53 | 0.0% |
| Central American | 177 | 0.1% |
| Central American Indian | 25 | 0.0% |
| Cherokee | 448 | 0.3% |
| Chilean | 73 | 0.0% |
| Chippewa | 3 | 0.0% |
| Choctaw | 32 | 0.0% |
| Colombian | 113 | 0.1% |
| Costa Rican | 102 | 0.1% |
| Cree | 19 | 0.0% |
| Creek | 4 | 0.0% |
| Croatian | 188 | 0.1% |
| Cuban | 57 | 0.0% |
| Czech | 883 | 0.5% |
| Czechoslovakian | 182 | 0.1% |
| Danish | 310 | 0.2% |
| Delaware | 49 | 0.0% |
| Dominican | 252 | 0.1% |
| Dutch | 2,333 | 1.3% |
| Eastern European | 695 | 0.4% |
| Ecuadorian | 39 | 0.0% |
| English | 23,157 | 13.0% |
| Estonian | 16 | 0.0% |
| Ethiopian | 204 | 0.1% |
| European | 3,299 | 1.8% |
| Filipino | 63 | 0.0% |
| Finnish | 38 | 0.0% |
| French | 2,996 | 1.7% |
| French Canadian | 384 | 0.2% |
| German | 41,958 | 23.5% |
| Ghanaian | 60 | 0.0% |
| Greek | 598 | 0.3% |
| Guamanian / Chamorro | 42 | 0.0% |
| Guatemalan | 13 | 0.0% |
| Haitian | 116 | 0.1% |
| Honduran | 5 | 0.0% |
| Hungarian | 1,536 | 0.9% |
| Indian (Asian) | 529 | 0.3% |
| Indonesian | 16 | 0.0% |
| Iranian | 38 | 0.0% |
| Irish | 25,388 | 14.2% |
| Israeli | 64 | 0.0% |
| Italian | 7,952 | 4.4% |
| Japanese | 26 | 0.0% |
| Jordanian | 15 | 0.0% |
| Korean | 394 | 0.2% |
| Latvian | 16 | 0.0% |
| Lebanese | 41 | 0.0% |
| Lithuanian | 103 | 0.1% |
| Luxembourger | 7 | 0.0% |
| Macedonian | 30 | 0.0% |
| Malaysian | 67 | 0.0% |
| Maltese | 14 | 0.0% |
| Mexican | 1,679 | 0.9% |
| Mexican American Indian | 57 | 0.0% |
| Native Hawaiian | 1 | 0.0% |
| Nigerian | 16 | 0.0% |
| Northern European | 234 | 0.1% |
| Norwegian | 867 | 0.5% |
| Pakistani | 72 | 0.0% |
| Palestinian | 15 | 0.0% |
| Panamanian | 24 | 0.0% |
| Pennsylvania German | 149 | 0.1% |
| Peruvian | 133 | 0.1% |
| Polish | 3,599 | 2.0% |
| Portuguese | 87 | 0.1% |
| Puerto Rican | 838 | 0.5% |
| Romanian | 174 | 0.1% |
| Russian | 797 | 0.4% |
| Salvadoran | 33 | 0.0% |
| Samoan | 75 | 0.0% |
| Scandinavian | 535 | 0.3% |
| Scotch-Irish | 2,182 | 1.2% |
| Scottish | 4,033 | 2.3% |
| Seminole | 129 | 0.1% |
| Senegalese | 94 | 0.1% |
| Serbian | 175 | 0.1% |
| Sioux | 77 | 0.0% |
| Slavic | 70 | 0.0% |
| Slovak | 515 | 0.3% |
| Slovene | 71 | 0.0% |
| South African | 12 | 0.0% |
| South American | 397 | 0.2% |
| Spaniard | 9 | 0.0% |
| Spanish | 470 | 0.3% |
| Sri Lankan | 274 | 0.2% |
| Subsaharan African | 1,556 | 0.9% |
| Sudanese | 159 | 0.1% |
| Swedish | 1,670 | 0.9% |
| Swiss | 561 | 0.3% |
| Syrian | 4 | 0.0% |
| Thai | 1,865 | 1.0% |
| Tohono O'Odham | 10 | 0.0% |
| Trinidadian and Tobagonian | 88 | 0.1% |
| Ukrainian | 241 | 0.1% |
| Uruguayan | 20 | 0.0% |
| Venezuelan | 19 | 0.0% |
| Vietnamese | 4 | 0.0% |
| Welsh | 2,708 | 1.5% |
| West Indian | 13 | 0.0% |
| Yugoslavian | 45 | 0.0% | View All 118 Rows |
Immigrants in Licking County
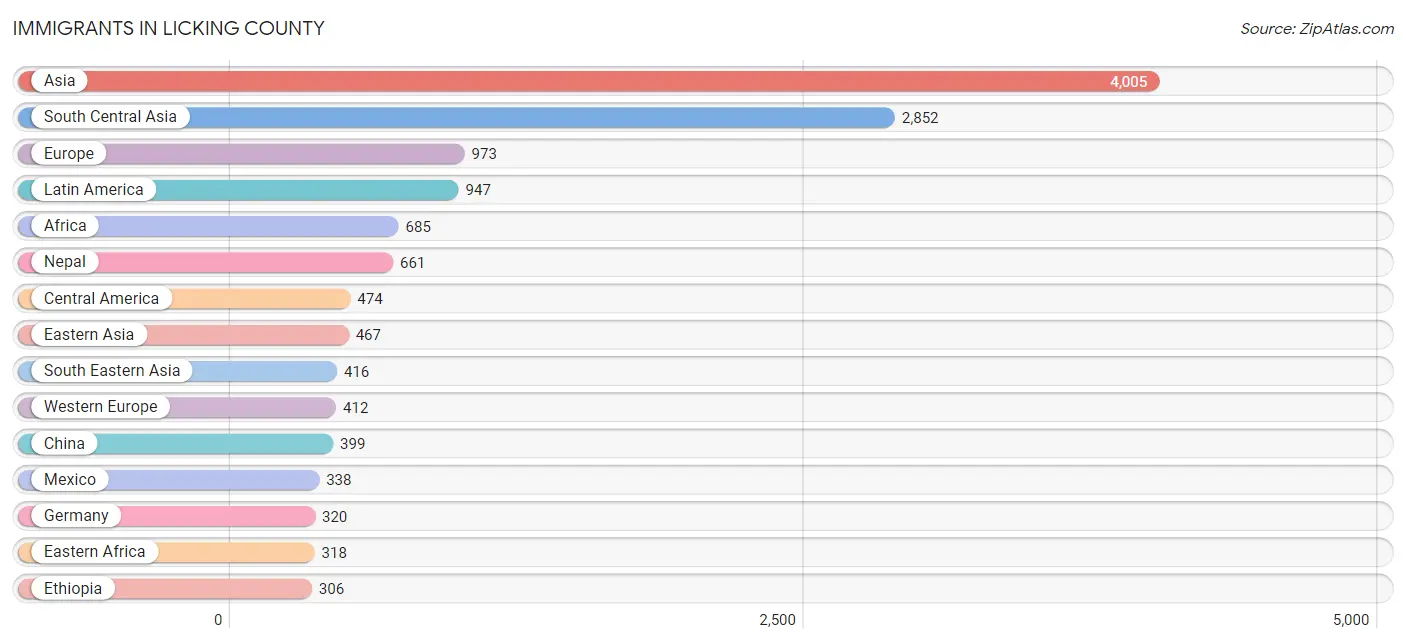
The most numerous immigrant groups reported in Licking County came from Asia (4,005 | 2.2%), South Central Asia (2,852 | 1.6%), Europe (973 | 0.5%), Latin America (947 | 0.5%), and Africa (685 | 0.4%), together accounting for 5.3% of all Licking County residents.
| Immigration Origin | # Population | % Population |
| Africa | 685 | 0.4% |
| Asia | 4,005 | 2.2% |
| Australia | 17 | 0.0% |
| Austria | 20 | 0.0% |
| Azores | 10 | 0.0% |
| Bahamas | 60 | 0.0% |
| Bangladesh | 4 | 0.0% |
| Belgium | 16 | 0.0% |
| Cameroon | 18 | 0.0% |
| Canada | 168 | 0.1% |
| Caribbean | 279 | 0.2% |
| Central America | 474 | 0.3% |
| Chile | 3 | 0.0% |
| China | 399 | 0.2% |
| Colombia | 51 | 0.0% |
| Costa Rica | 14 | 0.0% |
| Cuba | 32 | 0.0% |
| Czechoslovakia | 22 | 0.0% |
| Denmark | 24 | 0.0% |
| Dominican Republic | 61 | 0.0% |
| Eastern Africa | 318 | 0.2% |
| Eastern Asia | 467 | 0.3% |
| Eastern Europe | 275 | 0.2% |
| Ecuador | 12 | 0.0% |
| El Salvador | 13 | 0.0% |
| England | 86 | 0.1% |
| Ethiopia | 306 | 0.2% |
| Europe | 973 | 0.5% |
| France | 56 | 0.0% |
| Germany | 320 | 0.2% |
| Ghana | 47 | 0.0% |
| Greece | 26 | 0.0% |
| Guatemala | 13 | 0.0% |
| Guyana | 26 | 0.0% |
| Haiti | 59 | 0.0% |
| Hungary | 23 | 0.0% |
| India | 187 | 0.1% |
| Israel | 218 | 0.1% |
| Italy | 44 | 0.0% |
| Japan | 20 | 0.0% |
| Jordan | 21 | 0.0% |
| Kazakhstan | 42 | 0.0% |
| Korea | 48 | 0.0% |
| Kuwait | 23 | 0.0% |
| Laos | 55 | 0.0% |
| Latin America | 947 | 0.5% |
| Latvia | 7 | 0.0% |
| Liberia | 19 | 0.0% |
| Mexico | 338 | 0.2% |
| Middle Africa | 18 | 0.0% |
| Nepal | 661 | 0.4% |
| Nicaragua | 72 | 0.0% |
| Nigeria | 50 | 0.0% |
| North Macedonia | 17 | 0.0% |
| Northern Africa | 33 | 0.0% |
| Northern Europe | 206 | 0.1% |
| Oceania | 17 | 0.0% |
| Pakistan | 29 | 0.0% |
| Panama | 24 | 0.0% |
| Peru | 63 | 0.0% |
| Philippines | 196 | 0.1% |
| Poland | 58 | 0.0% |
| Portugal | 10 | 0.0% |
| Romania | 44 | 0.0% |
| Russia | 15 | 0.0% |
| Scotland | 30 | 0.0% |
| Senegal | 57 | 0.0% |
| South America | 194 | 0.1% |
| South Central Asia | 2,852 | 1.6% |
| South Eastern Asia | 416 | 0.2% |
| Southern Europe | 80 | 0.0% |
| St. Vincent and the Grenadines | 10 | 0.0% |
| Sudan | 33 | 0.0% |
| Taiwan | 35 | 0.0% |
| Thailand | 13 | 0.0% |
| Ukraine | 10 | 0.0% |
| Uruguay | 20 | 0.0% |
| Uzbekistan | 112 | 0.1% |
| Venezuela | 19 | 0.0% |
| Vietnam | 152 | 0.1% |
| Western Africa | 295 | 0.2% |
| Western Asia | 262 | 0.2% |
| Western Europe | 412 | 0.2% | View All 83 Rows |
Sex and Age in Licking County
Sex and Age in Licking County
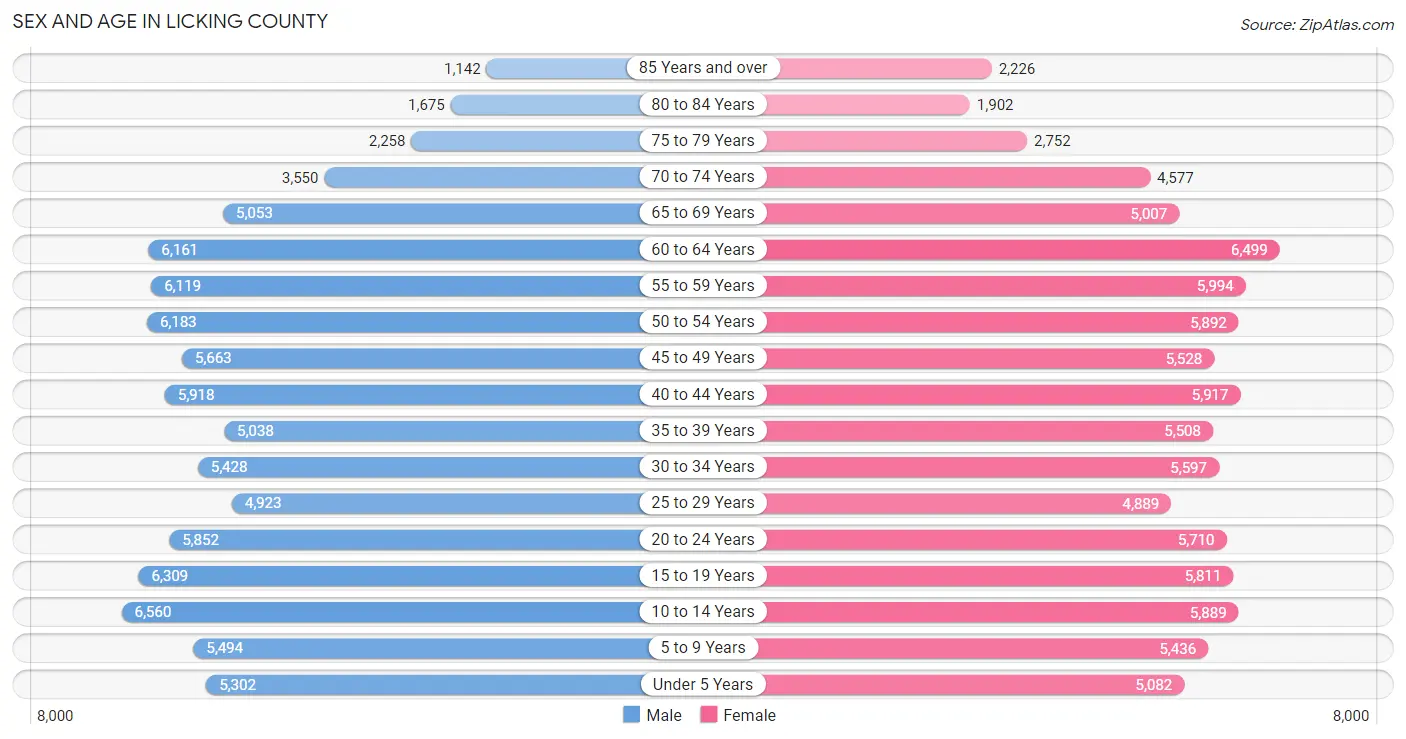
The most populous age groups in Licking County are 10 to 14 Years (6,560 | 7.4%) for men and 60 to 64 Years (6,499 | 7.2%) for women.
| Age Bracket | Male | Female |
| Under 5 Years | 5,302 (6.0%) | 5,082 (5.6%) |
| 5 to 9 Years | 5,494 (6.2%) | 5,436 (6.0%) |
| 10 to 14 Years | 6,560 (7.4%) | 5,889 (6.5%) |
| 15 to 19 Years | 6,309 (7.1%) | 5,811 (6.4%) |
| 20 to 24 Years | 5,852 (6.6%) | 5,710 (6.3%) |
| 25 to 29 Years | 4,923 (5.6%) | 4,889 (5.4%) |
| 30 to 34 Years | 5,428 (6.1%) | 5,597 (6.2%) |
| 35 to 39 Years | 5,038 (5.7%) | 5,508 (6.1%) |
| 40 to 44 Years | 5,918 (6.7%) | 5,917 (6.6%) |
| 45 to 49 Years | 5,663 (6.4%) | 5,528 (6.1%) |
| 50 to 54 Years | 6,183 (7.0%) | 5,892 (6.5%) |
| 55 to 59 Years | 6,119 (6.9%) | 5,994 (6.6%) |
| 60 to 64 Years | 6,161 (7.0%) | 6,499 (7.2%) |
| 65 to 69 Years | 5,053 (5.7%) | 5,007 (5.6%) |
| 70 to 74 Years | 3,550 (4.0%) | 4,577 (5.1%) |
| 75 to 79 Years | 2,258 (2.5%) | 2,752 (3.0%) |
| 80 to 84 Years | 1,675 (1.9%) | 1,902 (2.1%) |
| 85 Years and over | 1,142 (1.3%) | 2,226 (2.5%) |
| Total | 88,628 (100.0%) | 90,216 (100.0%) |
Families and Households in Licking County
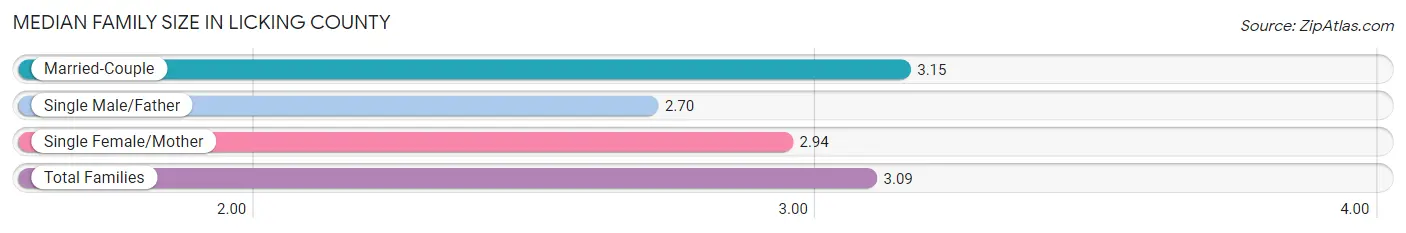
Median Family Size in Licking County
The median family size in Licking County is 3.09 persons per family, with married-couple families (37,462 | 79.1%) accounting for the largest median family size of 3.15 persons per family. On the other hand, single male/father families (2,708 | 5.7%) represent the smallest median family size with 2.70 persons per family.
| Family Type | # Families | Family Size |
| Married-Couple | 37,462 (79.1%) | 3.15 |
| Single Male/Father | 2,708 (5.7%) | 2.70 |
| Single Female/Mother | 7,165 (15.1%) | 2.94 |
| Total Families | 47,335 (100.0%) | 3.09 |
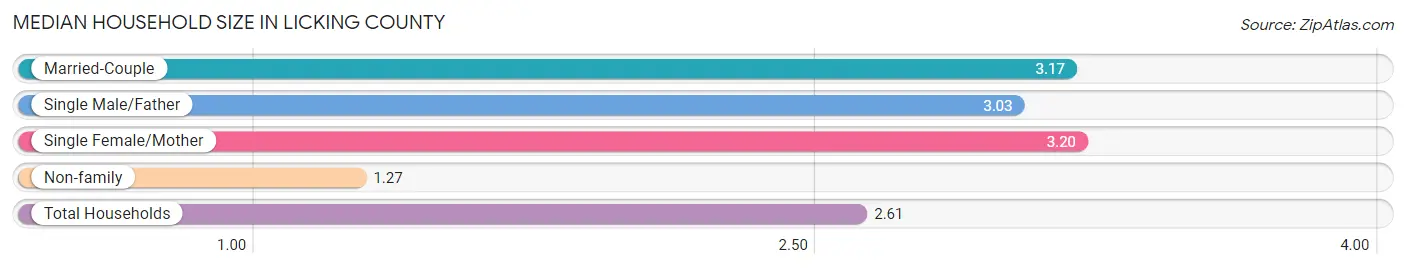
Median Household Size in Licking County
The median household size in Licking County is 2.61 persons per household, with single female/mother households (7,165 | 10.7%) accounting for the largest median household size of 3.2 persons per household. non-family households (19,904 | 29.6%) represent the smallest median household size with 1.27 persons per household.
| Household Type | # Households | Household Size |
| Married-Couple | 37,462 (55.7%) | 3.17 |
| Single Male/Father | 2,708 (4.0%) | 3.03 |
| Single Female/Mother | 7,165 (10.7%) | 3.20 |
| Non-family | 19,904 (29.6%) | 1.27 |
| Total Households | 67,239 (100.0%) | 2.61 |
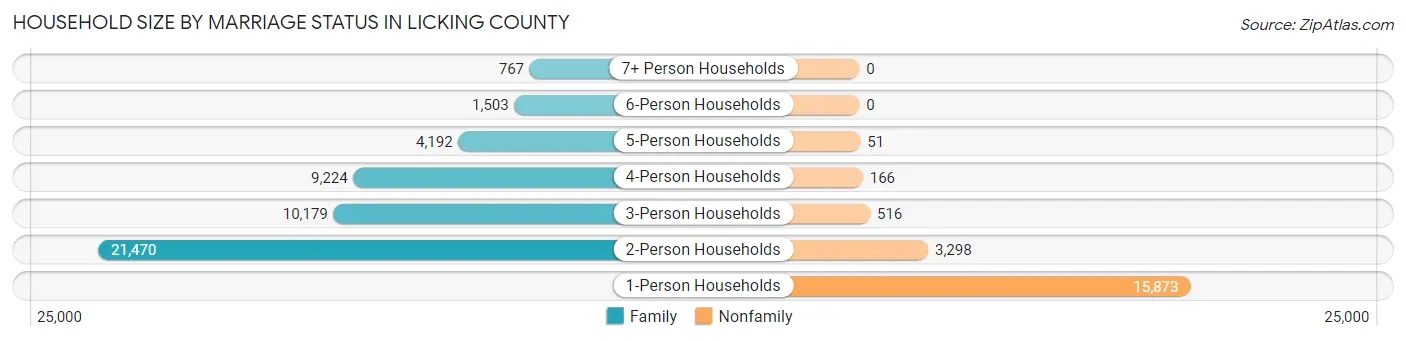
Household Size by Marriage Status in Licking County
Out of a total of 67,239 households in Licking County, 47,335 (70.4%) are family households, while 19,904 (29.6%) are nonfamily households. The most numerous type of family households are 2-person households, comprising 21,470, and the most common type of nonfamily households are 1-person households, comprising 15,873.
| Household Size | Family Households | Nonfamily Households |
| 1-Person Households | - | 15,873 (23.6%) |
| 2-Person Households | 21,470 (31.9%) | 3,298 (4.9%) |
| 3-Person Households | 10,179 (15.1%) | 516 (0.8%) |
| 4-Person Households | 9,224 (13.7%) | 166 (0.3%) |
| 5-Person Households | 4,192 (6.2%) | 51 (0.1%) |
| 6-Person Households | 1,503 (2.2%) | 0 (0.0%) |
| 7+ Person Households | 767 (1.1%) | 0 (0.0%) |
| Total | 47,335 (70.4%) | 19,904 (29.6%) |
Female Fertility in Licking County
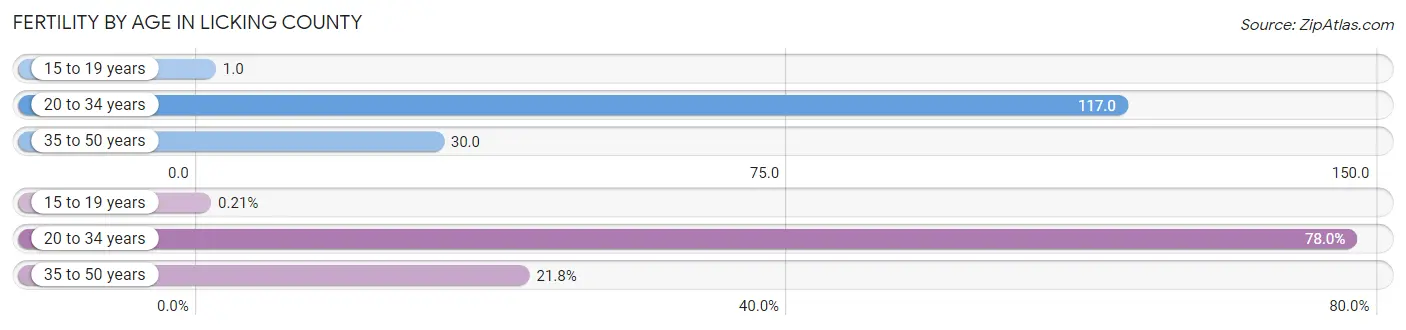
Fertility by Age in Licking County
Average fertility rate in Licking County is 61.0 births per 1,000 women. Women in the age bracket of 20 to 34 years have the highest fertility rate with 117.0 births per 1,000 women. Women in the age bracket of 20 to 34 years acount for 78.0% of all women with births.
| Age Bracket | Women with Births | Births / 1,000 Women |
| 15 to 19 years | 5 (0.2%) | 1.0 |
| 20 to 34 years | 1,898 (78.0%) | 117.0 |
| 35 to 50 years | 531 (21.8%) | 30.0 |
| Total | 2,434 (100.0%) | 61.0 |
Fertility by Age by Marriage Status in Licking County
65.9% of women with births (2,434) in Licking County are married. The highest percentage of unmarried women with births falls into 15 to 19 years age bracket with 100.0% of them unmarried at the time of birth, while the lowest percentage of unmarried women with births belong to 35 to 50 years age bracket with 7.5% of them unmarried.
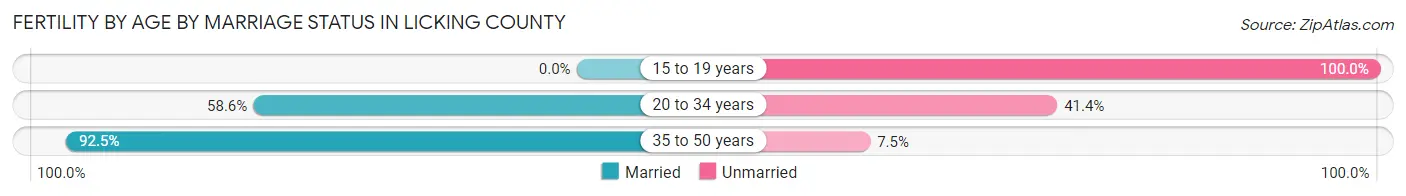
| Age Bracket | Married | Unmarried |
| 15 to 19 years | 0 (0.0%) | 5 (100.0%) |
| 20 to 34 years | 1,112 (58.6%) | 786 (41.4%) |
| 35 to 50 years | 491 (92.5%) | 40 (7.5%) |
| Total | 1,604 (65.9%) | 830 (34.1%) |
Fertility by Education in Licking County
Average fertility rate in Licking County is 61.0 births per 1,000 women. Women with the education attainment of college or associate's degree have the highest fertility rate of 87.0 births per 1,000 women, while women with the education attainment of less than high school have the lowest fertility at 26.0 births per 1,000 women. Women with the education attainment of college or associate's degree represent 45.9% of all women with births.
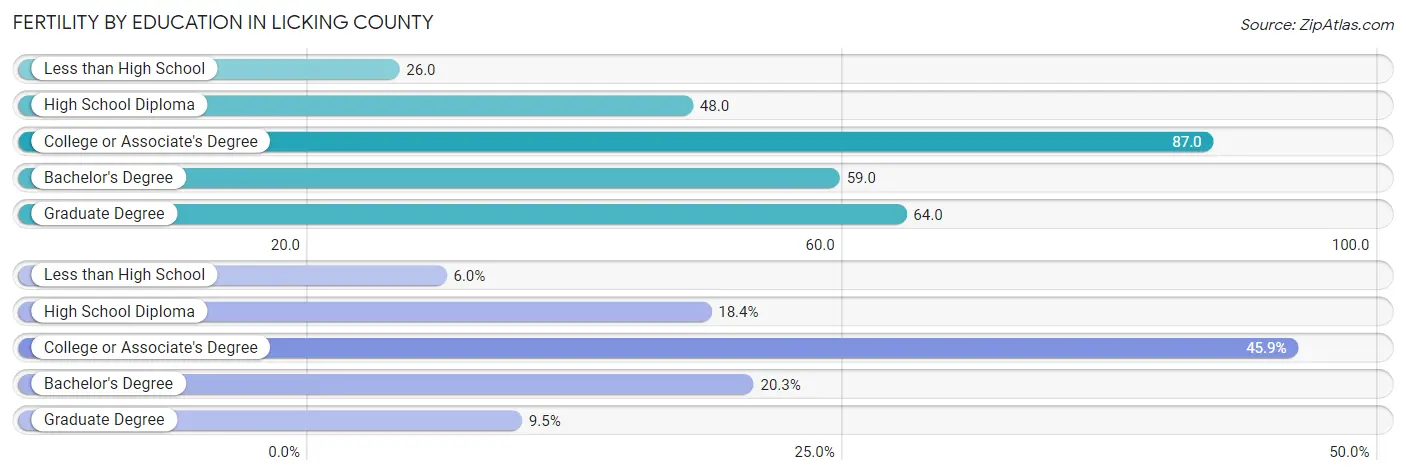
| Educational Attainment | Women with Births | Births / 1,000 Women |
| Less than High School | 145 (6.0%) | 26.0 |
| High School Diploma | 447 (18.4%) | 48.0 |
| College or Associate's Degree | 1,116 (45.9%) | 87.0 |
| Bachelor's Degree | 495 (20.3%) | 59.0 |
| Graduate Degree | 231 (9.5%) | 64.0 |
| Total | 2,434 (100.0%) | 61.0 |
Fertility by Education by Marriage Status in Licking County
34.1% of women with births in Licking County are unmarried. Women with the educational attainment of bachelor's degree are most likely to be married with 95.0% of them married at childbirth, while women with the educational attainment of high school diploma are least likely to be married with 53.7% of them unmarried at childbirth.
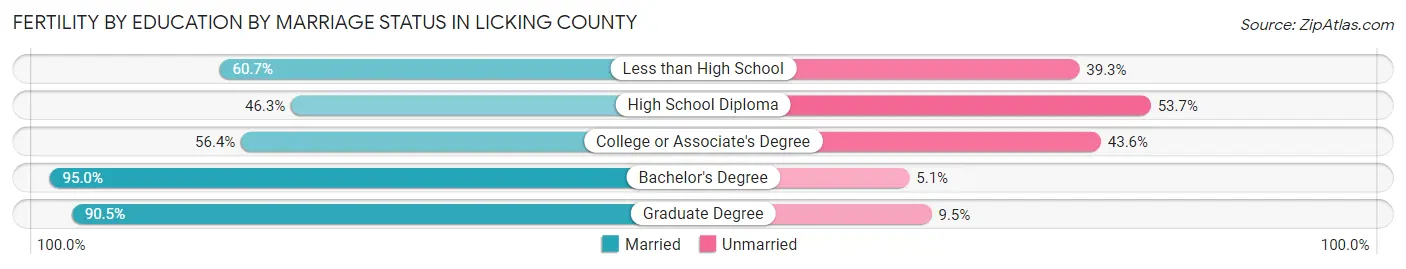
| Educational Attainment | Married | Unmarried |
| Less than High School | 88 (60.7%) | 57 (39.3%) |
| High School Diploma | 207 (46.3%) | 240 (53.7%) |
| College or Associate's Degree | 629 (56.4%) | 487 (43.6%) |
| Bachelor's Degree | 470 (95.0%) | 25 (5.1%) |
| Graduate Degree | 209 (90.5%) | 22 (9.5%) |
| Total | 1,604 (65.9%) | 830 (34.1%) |
Income in Licking County
Income Overview in Licking County
Per Capita Income in Licking County is $39,760, while median incomes of families and households are $96,410 and $78,505 respectively.
| Characteristic | Number | Measure |
| Per Capita Income | 178,844 | $39,760 |
| Median Family Income | 47,335 | $96,410 |
| Mean Family Income | 47,335 | $117,391 |
| Median Household Income | 67,239 | $78,505 |
| Mean Household Income | 67,239 | $102,910 |
| Income Deficit | 47,335 | $10,630 |
| Wage / Income Gap (%) | 178,844 | 29.69% |
| Wage / Income Gap ($) | 178,844 | 70.31¢ per $1 |
| Gini / Inequality Index | 178,844 | 0.45 |
Earnings by Sex in Licking County
Average Earnings in Licking County are $45,052, $52,708 for men and $37,057 for women, a difference of 29.7%.
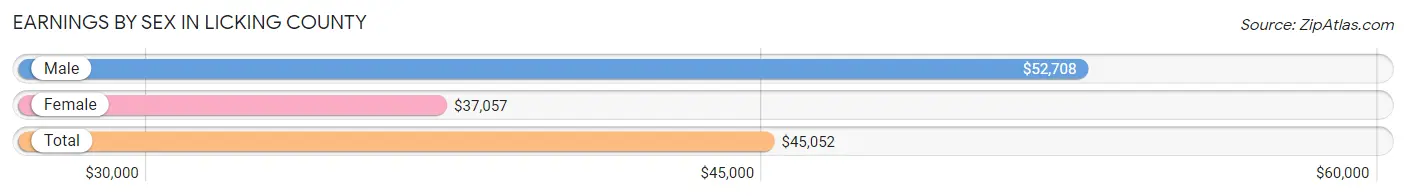
| Sex | Number | Average Earnings |
| Male | 49,563 (52.3%) | $52,708 |
| Female | 45,105 (47.6%) | $37,057 |
| Total | 94,668 (100.0%) | $45,052 |
Earnings by Sex by Income Bracket in Licking County
The most common earnings brackets in Licking County are $100,000+ for men (9,001 | 18.2%) and $75,000 to $99,999 for women (4,529 | 10.0%).
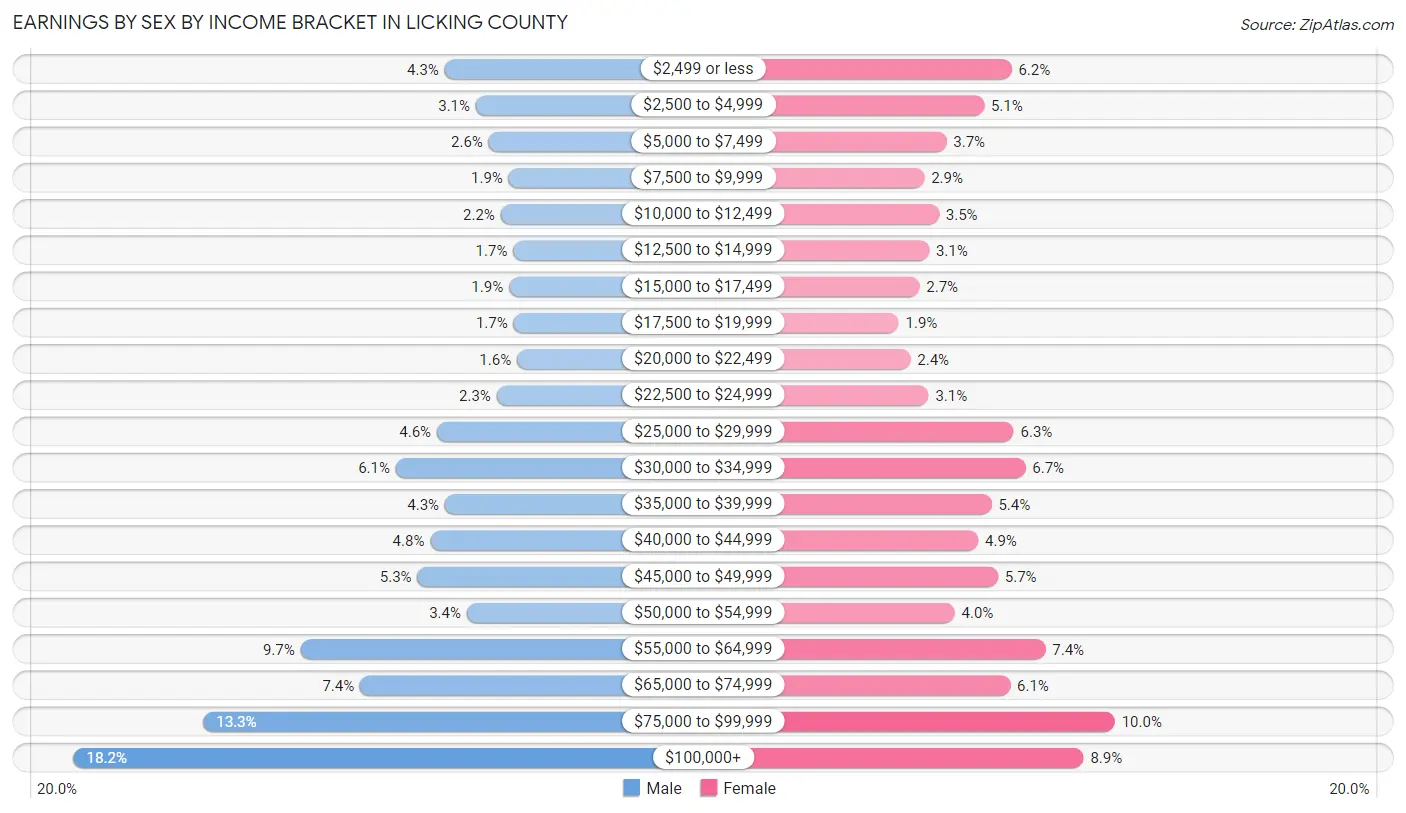
| Income | Male | Female |
| $2,499 or less | 2,109 (4.3%) | 2,781 (6.2%) |
| $2,500 to $4,999 | 1,533 (3.1%) | 2,317 (5.1%) |
| $5,000 to $7,499 | 1,293 (2.6%) | 1,681 (3.7%) |
| $7,500 to $9,999 | 924 (1.9%) | 1,307 (2.9%) |
| $10,000 to $12,499 | 1,069 (2.2%) | 1,557 (3.5%) |
| $12,500 to $14,999 | 836 (1.7%) | 1,388 (3.1%) |
| $15,000 to $17,499 | 916 (1.8%) | 1,228 (2.7%) |
| $17,500 to $19,999 | 832 (1.7%) | 876 (1.9%) |
| $20,000 to $22,499 | 770 (1.5%) | 1,073 (2.4%) |
| $22,500 to $24,999 | 1,147 (2.3%) | 1,379 (3.1%) |
| $25,000 to $29,999 | 2,254 (4.5%) | 2,818 (6.2%) |
| $30,000 to $34,999 | 3,019 (6.1%) | 3,017 (6.7%) |
| $35,000 to $39,999 | 2,105 (4.3%) | 2,443 (5.4%) |
| $40,000 to $44,999 | 2,378 (4.8%) | 2,219 (4.9%) |
| $45,000 to $49,999 | 2,619 (5.3%) | 2,555 (5.7%) |
| $50,000 to $54,999 | 1,699 (3.4%) | 1,821 (4.0%) |
| $55,000 to $64,999 | 4,787 (9.7%) | 3,357 (7.4%) |
| $65,000 to $74,999 | 3,681 (7.4%) | 2,760 (6.1%) |
| $75,000 to $99,999 | 6,591 (13.3%) | 4,529 (10.0%) |
| $100,000+ | 9,001 (18.2%) | 3,999 (8.9%) |
| Total | 49,563 (100.0%) | 45,105 (100.0%) |
Earnings by Sex by Educational Attainment in Licking County
Average earnings in Licking County are $59,528 for men and $44,914 for women, a difference of 24.5%. Men with an educational attainment of graduate degree enjoy the highest average annual earnings of $92,306, while those with less than high school education earn the least with $39,063. Women with an educational attainment of graduate degree earn the most with the average annual earnings of $70,723, while those with less than high school education have the smallest earnings of $27,914.
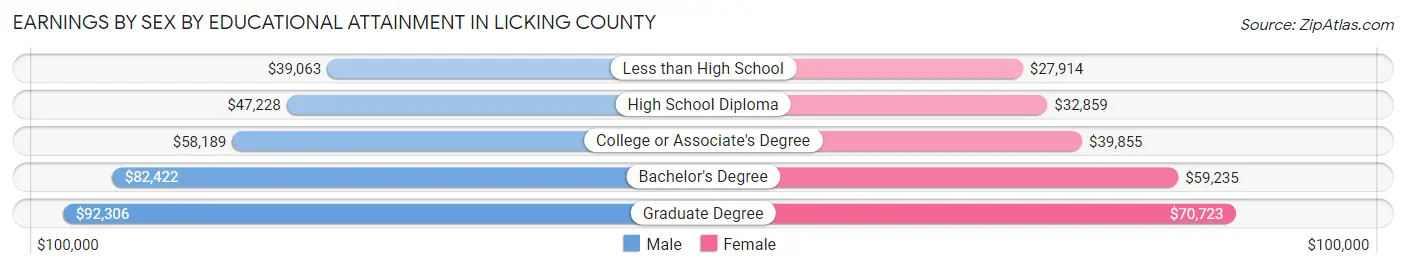
| Educational Attainment | Male Income | Female Income |
| Less than High School | $39,063 | $27,914 |
| High School Diploma | $47,228 | $32,859 |
| College or Associate's Degree | $58,189 | $39,855 |
| Bachelor's Degree | $82,422 | $59,235 |
| Graduate Degree | $92,306 | $70,723 |
| Total | $59,528 | $44,914 |
Family Income in Licking County
Family Income Brackets in Licking County
According to the Licking County family income data, there are 11,739 families falling into the $100,000 to $149,999 income range, which is the most common income bracket and makes up 24.8% of all families. Conversely, the $10,000 to $14,999 income bracket is the least frequent group with only 805 families (1.7%) belonging to this category.
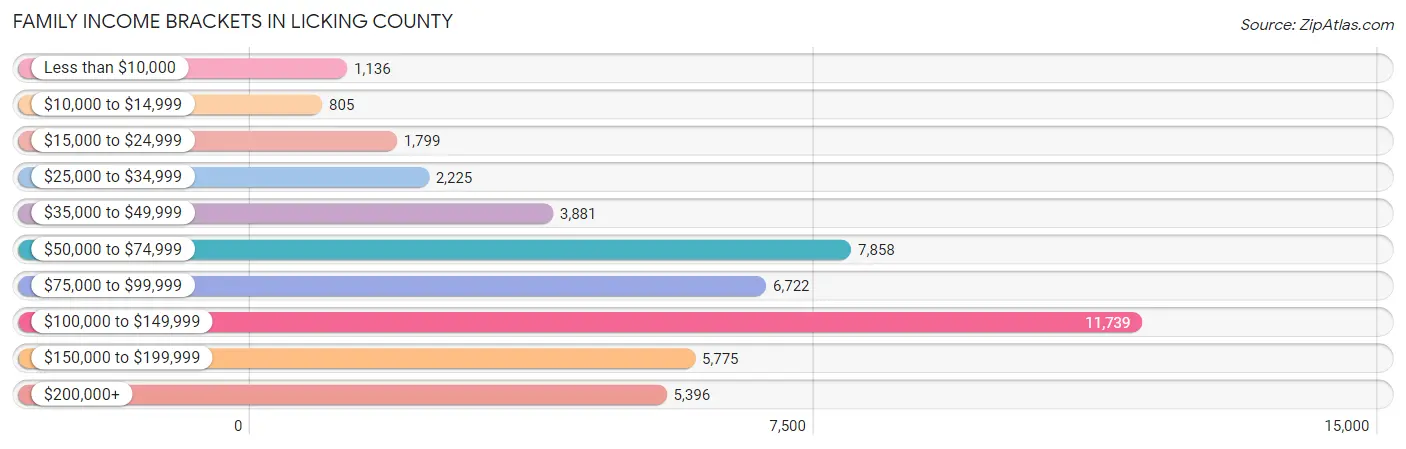
| Income Bracket | # Families | % Families |
| Less than $10,000 | 1,136 | 2.4% |
| $10,000 to $14,999 | 805 | 1.7% |
| $15,000 to $24,999 | 1,799 | 3.8% |
| $25,000 to $34,999 | 2,225 | 4.7% |
| $35,000 to $49,999 | 3,881 | 8.2% |
| $50,000 to $74,999 | 7,858 | 16.6% |
| $75,000 to $99,999 | 6,722 | 14.2% |
| $100,000 to $149,999 | 11,739 | 24.8% |
| $150,000 to $199,999 | 5,775 | 12.2% |
| $200,000+ | 5,396 | 11.4% |
Family Income by Famaliy Size in Licking County
7+ person families (727 | 1.5%) account for the highest median family income in Licking County with $141,464 per family, while 2-person families (22,759 | 48.1%) have the highest median income of $40,326 per family member.
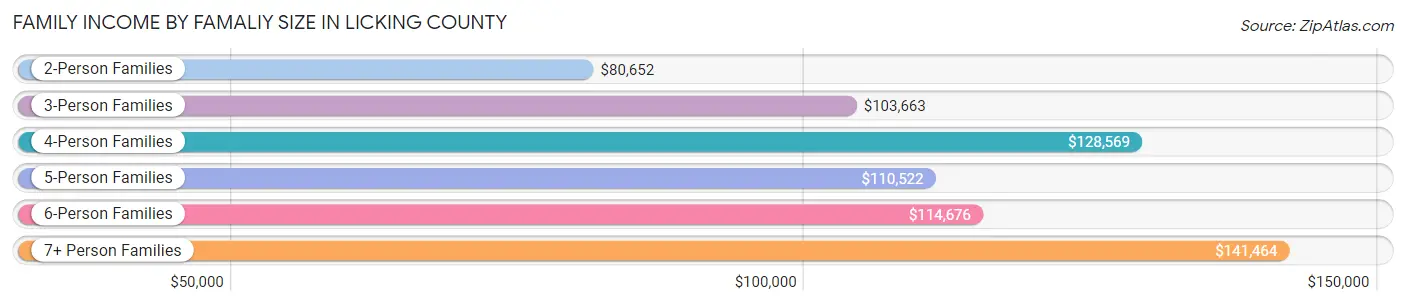
| Income Bracket | # Families | Median Income |
| 2-Person Families | 22,759 (48.1%) | $80,652 |
| 3-Person Families | 9,922 (21.0%) | $103,663 |
| 4-Person Families | 8,810 (18.6%) | $128,569 |
| 5-Person Families | 3,858 (8.2%) | $110,522 |
| 6-Person Families | 1,259 (2.7%) | $114,676 |
| 7+ Person Families | 727 (1.5%) | $141,464 |
| Total | 47,335 (100.0%) | $96,410 |
Family Income by Number of Earners in Licking County
The median family income in Licking County is $96,410, with families comprising 3+ earners (5,441) having the highest median family income of $156,812, while families with no earners (7,001) have the lowest median family income of $51,982, accounting for 11.5% and 14.8% of families, respectively.
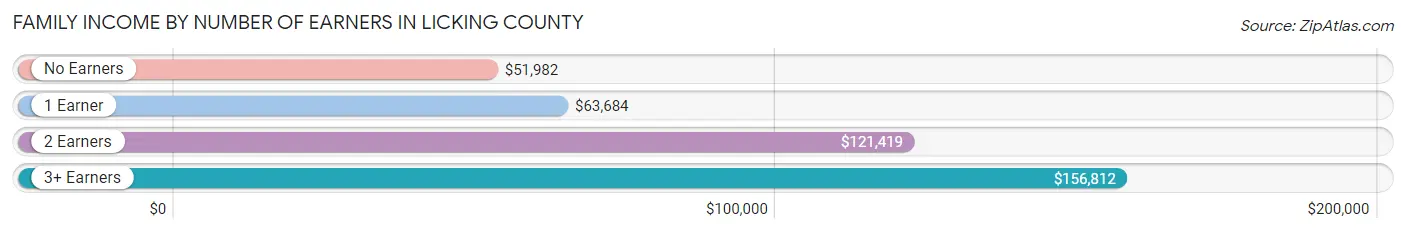
| Number of Earners | # Families | Median Income |
| No Earners | 7,001 (14.8%) | $51,982 |
| 1 Earner | 14,208 (30.0%) | $63,684 |
| 2 Earners | 20,685 (43.7%) | $121,419 |
| 3+ Earners | 5,441 (11.5%) | $156,812 |
| Total | 47,335 (100.0%) | $96,410 |
Household Income in Licking County
Household Income Brackets in Licking County
With 13,650 households falling in the category, the $100,000 to $149,999 income range is the most frequent in Licking County, accounting for 20.3% of all households. In contrast, only 2,488 households (3.7%) fall into the less than $10,000 income bracket, making it the least populous group.
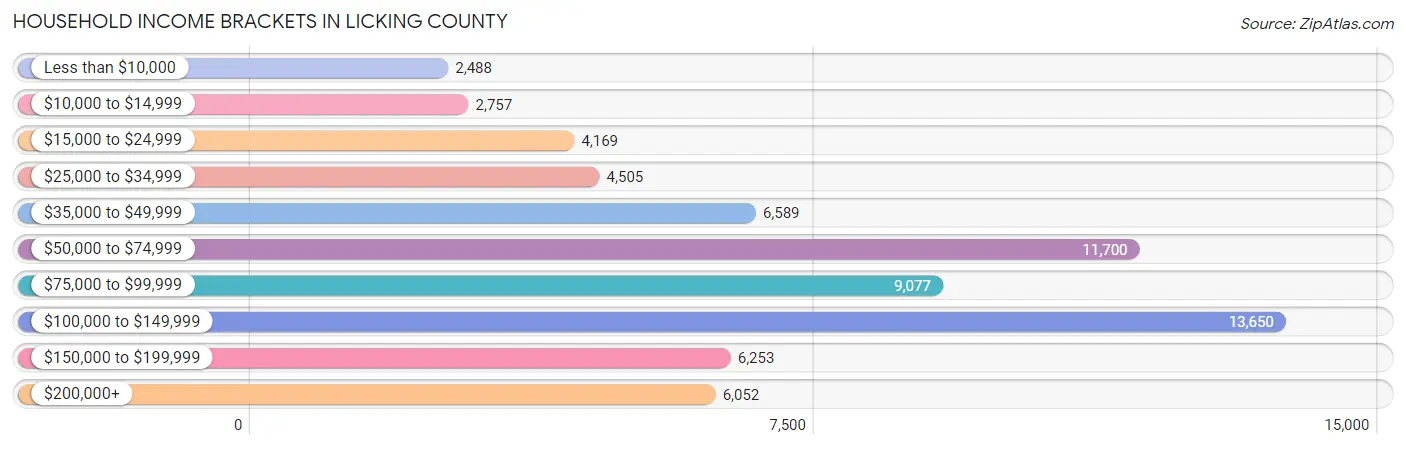
| Income Bracket | # Households | % Households |
| Less than $10,000 | 2,488 | 3.7% |
| $10,000 to $14,999 | 2,757 | 4.1% |
| $15,000 to $24,999 | 4,169 | 6.2% |
| $25,000 to $34,999 | 4,505 | 6.7% |
| $35,000 to $49,999 | 6,589 | 9.8% |
| $50,000 to $74,999 | 11,700 | 17.4% |
| $75,000 to $99,999 | 9,077 | 13.5% |
| $100,000 to $149,999 | 13,650 | 20.3% |
| $150,000 to $199,999 | 6,253 | 9.3% |
| $200,000+ | 6,052 | 9.0% |
Household Income by Householder Age in Licking County
The median household income in Licking County is $78,505, with the highest median household income of $99,522 found in the 45 to 64 years age bracket for the primary householder. A total of 26,925 households (40.0%) fall into this category. Meanwhile, the 15 to 24 years age bracket for the primary householder has the lowest median household income of $47,125, with 1,975 households (2.9%) in this group.
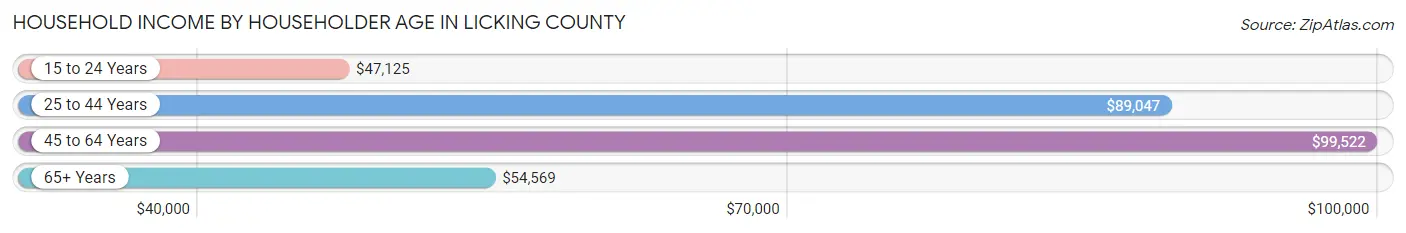
| Income Bracket | # Households | Median Income |
| 15 to 24 Years | 1,975 (2.9%) | $47,125 |
| 25 to 44 Years | 20,040 (29.8%) | $89,047 |
| 45 to 64 Years | 26,925 (40.0%) | $99,522 |
| 65+ Years | 18,299 (27.2%) | $54,569 |
| Total | 67,239 (100.0%) | $78,505 |
Poverty in Licking County
Income Below Poverty by Sex and Age in Licking County
With 8.5% poverty level for males and 11.1% for females among the residents of Licking County, 15 year old males and 18 to 24 year old females are the most vulnerable to poverty, with 204 males (16.9%) and 1,357 females (19.9%) in their respective age groups living below the poverty level.
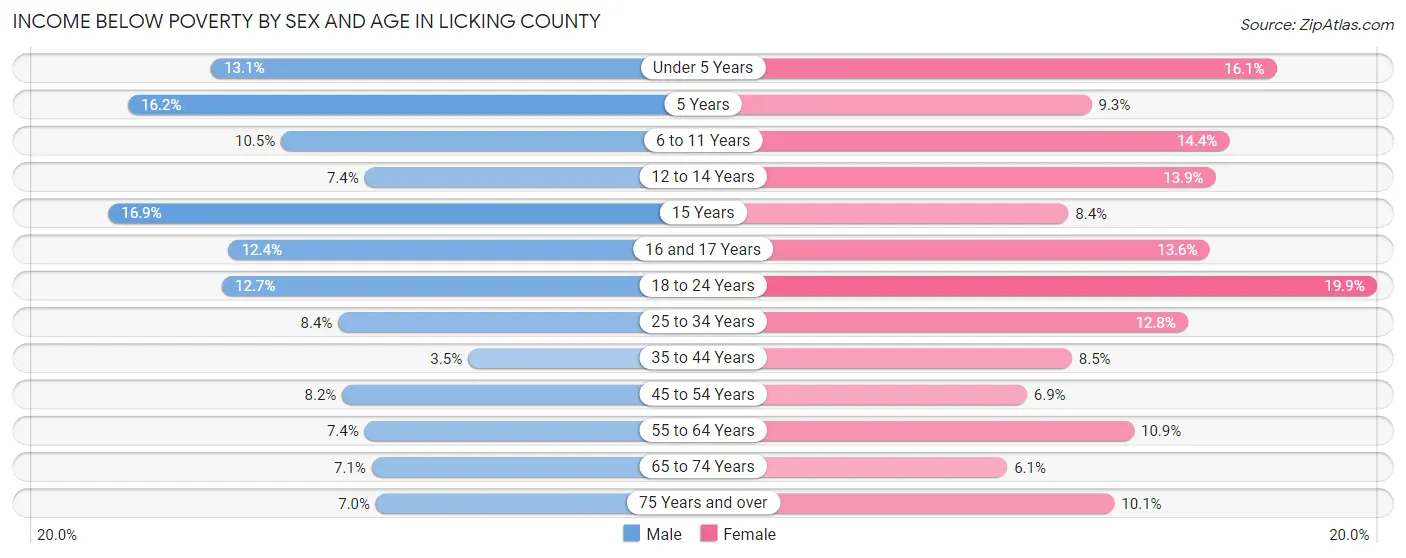
| Age Bracket | Male | Female |
| Under 5 Years | 682 (13.1%) | 804 (16.1%) |
| 5 Years | 181 (16.2%) | 99 (9.3%) |
| 6 to 11 Years | 720 (10.5%) | 922 (14.4%) |
| 12 to 14 Years | 279 (7.4%) | 508 (13.9%) |
| 15 Years | 204 (16.9%) | 119 (8.4%) |
| 16 and 17 Years | 309 (12.4%) | 288 (13.6%) |
| 18 to 24 Years | 929 (12.7%) | 1,357 (19.9%) |
| 25 to 34 Years | 858 (8.4%) | 1,342 (12.8%) |
| 35 to 44 Years | 386 (3.5%) | 974 (8.5%) |
| 45 to 54 Years | 970 (8.2%) | 784 (6.9%) |
| 55 to 64 Years | 900 (7.4%) | 1,341 (10.8%) |
| 65 to 74 Years | 607 (7.1%) | 579 (6.1%) |
| 75 Years and over | 346 (7.0%) | 664 (10.1%) |
| Total | 7,371 (8.5%) | 9,781 (11.1%) |
Income Above Poverty by Sex and Age in Licking County
According to the poverty statistics in Licking County, males aged 35 to 44 years and females aged 65 to 74 years are the age groups that are most secure financially, with 96.5% of males and 93.9% of females in these age groups living above the poverty line.
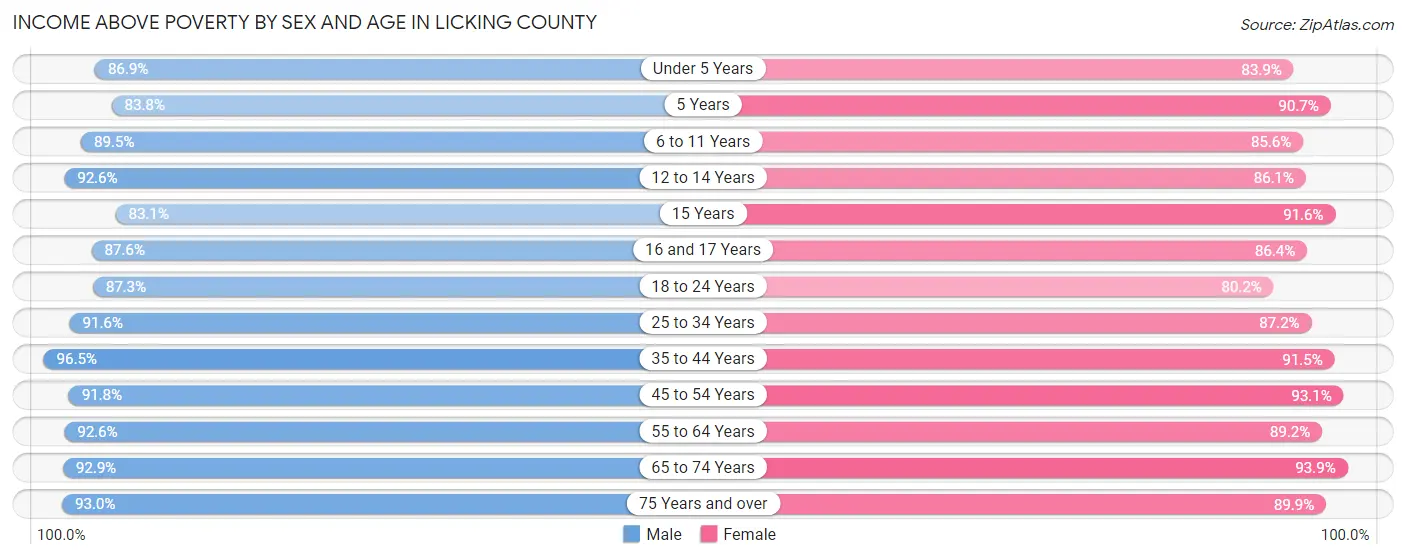
| Age Bracket | Male | Female |
| Under 5 Years | 4,535 (86.9%) | 4,179 (83.9%) |
| 5 Years | 939 (83.8%) | 969 (90.7%) |
| 6 to 11 Years | 6,149 (89.5%) | 5,488 (85.6%) |
| 12 to 14 Years | 3,501 (92.6%) | 3,154 (86.1%) |
| 15 Years | 1,004 (83.1%) | 1,296 (91.6%) |
| 16 and 17 Years | 2,179 (87.6%) | 1,824 (86.4%) |
| 18 to 24 Years | 6,401 (87.3%) | 5,480 (80.1%) |
| 25 to 34 Years | 9,407 (91.6%) | 9,109 (87.2%) |
| 35 to 44 Years | 10,505 (96.5%) | 10,428 (91.5%) |
| 45 to 54 Years | 10,842 (91.8%) | 10,623 (93.1%) |
| 55 to 64 Years | 11,296 (92.6%) | 11,023 (89.1%) |
| 65 to 74 Years | 7,920 (92.9%) | 8,845 (93.9%) |
| 75 Years and over | 4,624 (93.0%) | 5,897 (89.9%) |
| Total | 79,302 (91.5%) | 78,315 (88.9%) |
Income Below Poverty Among Married-Couple Families in Licking County
The poverty statistics for married-couple families in Licking County show that 3.2% or 1,193 of the total 37,462 families live below the poverty line. Families with 5 or more children have the highest poverty rate of 7.0%, comprising of 23 families. On the other hand, families with no children have the lowest poverty rate of 2.8%, which includes 619 families.
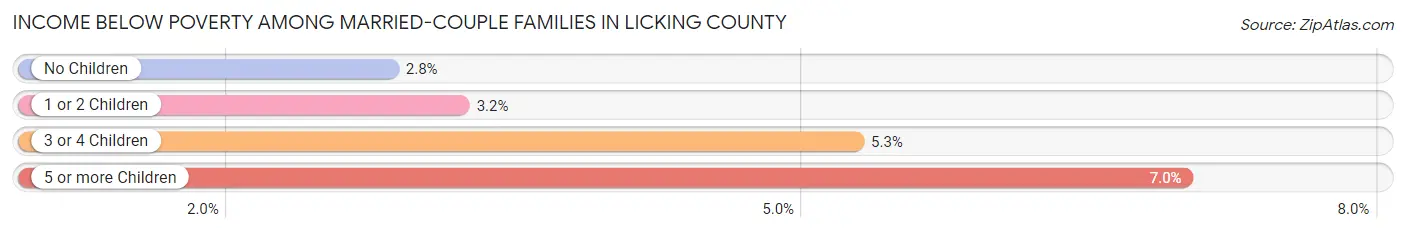
| Children | Above Poverty | Below Poverty |
| No Children | 21,166 (97.2%) | 619 (2.8%) |
| 1 or 2 Children | 12,101 (96.8%) | 401 (3.2%) |
| 3 or 4 Children | 2,696 (94.7%) | 150 (5.3%) |
| 5 or more Children | 306 (93.0%) | 23 (7.0%) |
| Total | 36,269 (96.8%) | 1,193 (3.2%) |
Income Below Poverty Among Single-Parent Households in Licking County
According to the poverty data in Licking County, 13.6% or 367 single-father households and 24.8% or 1,779 single-mother households are living below the poverty line. Among single-father households, those with 1 or 2 children have the highest poverty rate, with 212 households (13.9%) experiencing poverty. Likewise, among single-mother households, those with 3 or 4 children have the highest poverty rate, with 575 households (57.9%) falling below the poverty line.
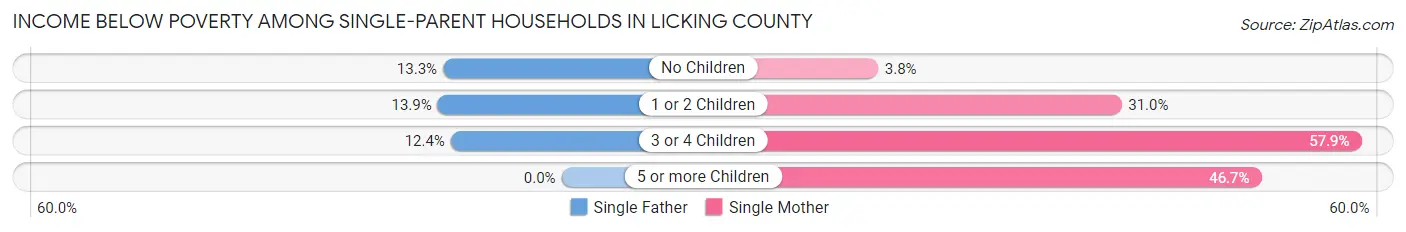
| Children | Single Father | Single Mother |
| No Children | 142 (13.3%) | 100 (3.8%) |
| 1 or 2 Children | 212 (13.9%) | 1,097 (31.0%) |
| 3 or 4 Children | 13 (12.4%) | 575 (57.9%) |
| 5 or more Children | 0 (0.0%) | 7 (46.7%) |
| Total | 367 (13.6%) | 1,779 (24.8%) |
Income Below Poverty Among Married-Couple vs Single-Parent Households in Licking County
The poverty data for Licking County shows that 1,193 of the married-couple family households (3.2%) and 2,146 of the single-parent households (21.7%) are living below the poverty level. Within the married-couple family households, those with 5 or more children have the highest poverty rate, with 23 households (7.0%) falling below the poverty line. Among the single-parent households, those with 3 or 4 children have the highest poverty rate, with 588 household (53.5%) living below poverty.
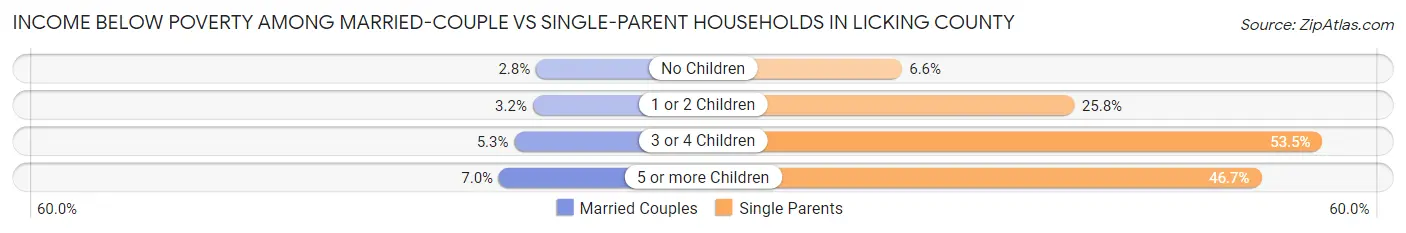
| Children | Married-Couple Families | Single-Parent Households |
| No Children | 619 (2.8%) | 242 (6.6%) |
| 1 or 2 Children | 401 (3.2%) | 1,309 (25.8%) |
| 3 or 4 Children | 150 (5.3%) | 588 (53.5%) |
| 5 or more Children | 23 (7.0%) | 7 (46.7%) |
| Total | 1,193 (3.2%) | 2,146 (21.7%) |
Employment Characteristics in Licking County
Employment by Class of Employer in Licking County
Among the 85,420 employed individuals in Licking County, private company employees (56,402 | 66.0%), not-for-profit organizations (9,125 | 10.7%), and local government employees (7,696 | 9.0%) make up the most common classes of employment.
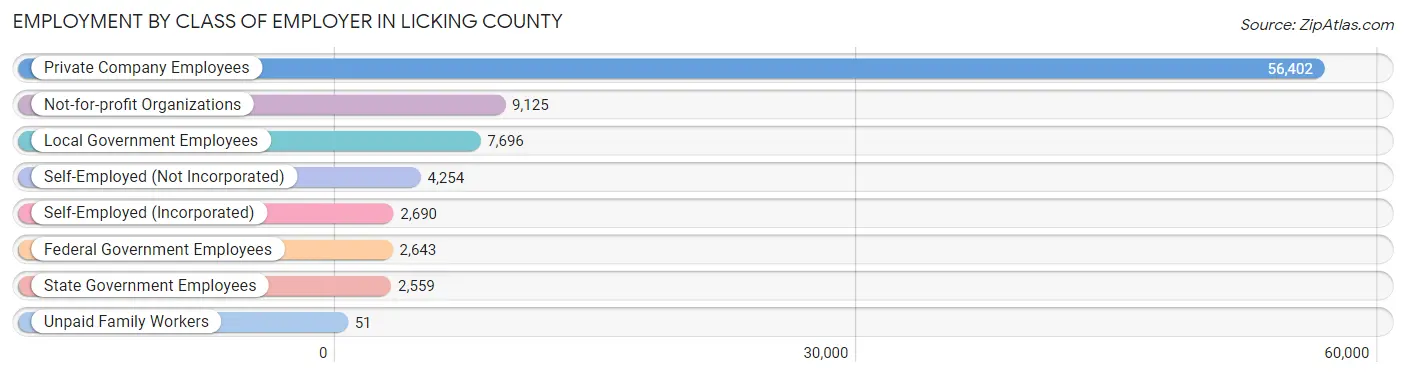
| Employer Class | # Employees | % Employees |
| Private Company Employees | 56,402 | 66.0% |
| Self-Employed (Incorporated) | 2,690 | 3.2% |
| Self-Employed (Not Incorporated) | 4,254 | 5.0% |
| Not-for-profit Organizations | 9,125 | 10.7% |
| Local Government Employees | 7,696 | 9.0% |
| State Government Employees | 2,559 | 3.0% |
| Federal Government Employees | 2,643 | 3.1% |
| Unpaid Family Workers | 51 | 0.1% |
| Total | 85,420 | 100.0% |
Employment Status by Age in Licking County
According to the labor force statistics for Licking County, out of the total population over 16 years of age (142,458), 63.2% or 90,033 individuals are in the labor force, with 3.3% or 2,971 of them unemployed. The age group with the highest labor force participation rate is 30 to 34 years, with 85.9% or 9,470 individuals in the labor force. Within the labor force, the 20 to 24 years age range has the highest percentage of unemployed individuals, with 6.5% or 576 of them being unemployed.
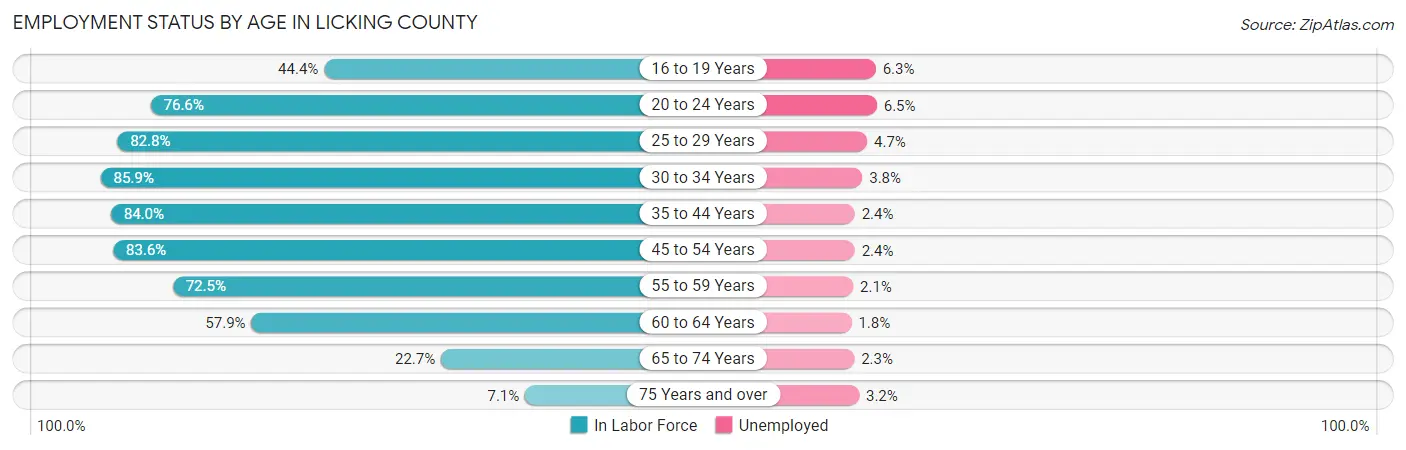
| Age Bracket | In Labor Force | Unemployed |
| 16 to 19 Years | 4,217 (44.4%) | 266 (6.3%) |
| 20 to 24 Years | 8,856 (76.6%) | 576 (6.5%) |
| 25 to 29 Years | 8,124 (82.8%) | 382 (4.7%) |
| 30 to 34 Years | 9,470 (85.9%) | 360 (3.8%) |
| 35 to 44 Years | 18,800 (84.0%) | 451 (2.4%) |
| 45 to 54 Years | 19,450 (83.6%) | 467 (2.4%) |
| 55 to 59 Years | 8,782 (72.5%) | 184 (2.1%) |
| 60 to 64 Years | 7,330 (57.9%) | 132 (1.8%) |
| 65 to 74 Years | 4,128 (22.7%) | 95 (2.3%) |
| 75 Years and over | 849 (7.1%) | 27 (3.2%) |
| Total | 90,033 (63.2%) | 2,971 (3.3%) |
Employment Status by Educational Attainment in Licking County
According to labor force statistics for Licking County, 78.8% of individuals (71,911) out of the total population between 25 and 64 years of age (91,257) are in the labor force, with 2.8% or 2,014 of them being unemployed. The group with the highest labor force participation rate are those with the educational attainment of bachelor's degree or higher, with 88.8% or 26,010 individuals in the labor force. Within the labor force, individuals with less than high school education have the highest percentage of unemployment, with 9.6% or 285 of them being unemployed.
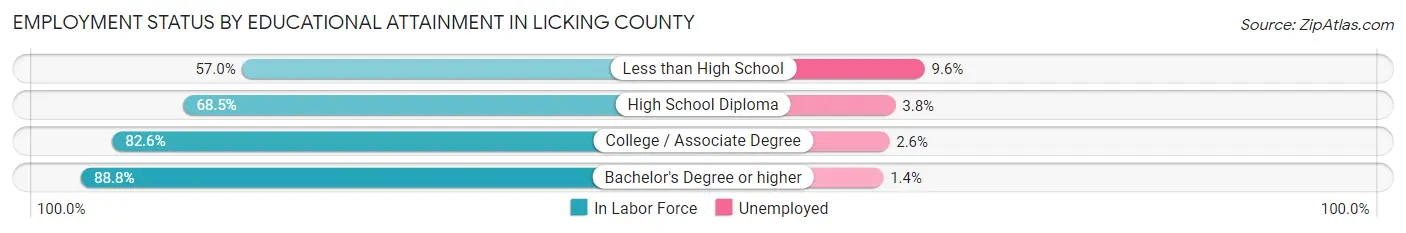
| Educational Attainment | In Labor Force | Unemployed |
| Less than High School | 2,972 (57.0%) | 501 (9.6%) |
| High School Diploma | 18,996 (68.5%) | 1,054 (3.8%) |
| College / Associate Degree | 23,971 (82.6%) | 755 (2.6%) |
| Bachelor's Degree or higher | 26,010 (88.8%) | 410 (1.4%) |
| Total | 71,911 (78.8%) | 2,555 (2.8%) |
Employment Occupations by Sex in Licking County
Management, Business, Science and Arts Occupations
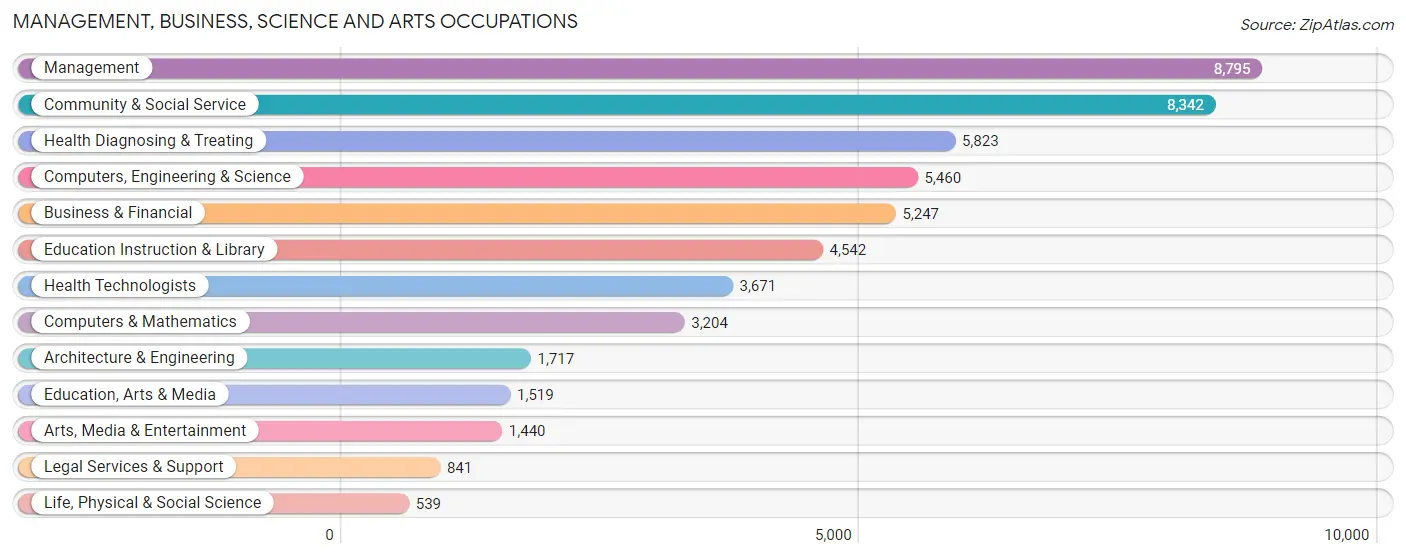
The most common Management, Business, Science and Arts occupations in Licking County are Management (8,795 | 10.1%), Community & Social Service (8,342 | 9.6%), Health Diagnosing & Treating (5,823 | 6.7%), Computers, Engineering & Science (5,460 | 6.3%), and Business & Financial (5,247 | 6.0%).
Management, Business, Science and Arts Occupations by Sex
Within the Management, Business, Science and Arts occupations in Licking County, the most male-oriented occupations are Architecture & Engineering (86.6%), Computers, Engineering & Science (74.3%), and Computers & Mathematics (71.1%), while the most female-oriented occupations are Health Technologists (83.8%), Health Diagnosing & Treating (80.6%), and Education Instruction & Library (78.6%).
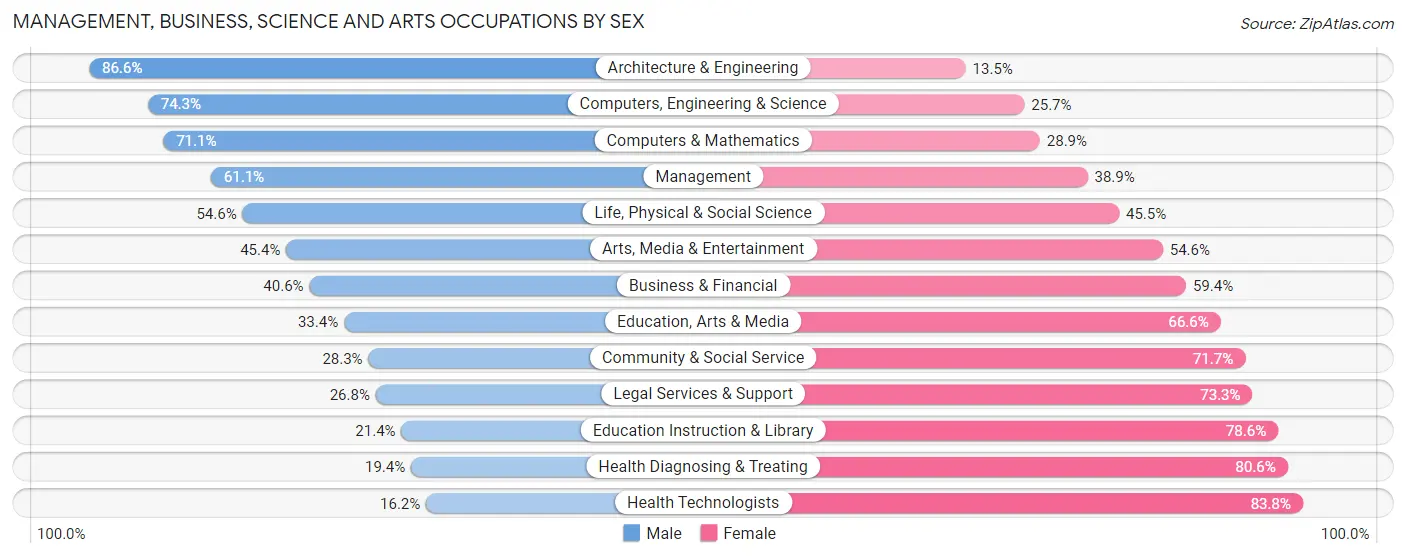
| Occupation | Male | Female |
| Management | 5,376 (61.1%) | 3,419 (38.9%) |
| Business & Financial | 2,130 (40.6%) | 3,117 (59.4%) |
| Computers, Engineering & Science | 4,057 (74.3%) | 1,403 (25.7%) |
| Computers & Mathematics | 2,277 (71.1%) | 927 (28.9%) |
| Architecture & Engineering | 1,486 (86.6%) | 231 (13.5%) |
| Life, Physical & Social Science | 294 (54.5%) | 245 (45.5%) |
| Community & Social Service | 2,358 (28.3%) | 5,984 (71.7%) |
| Education, Arts & Media | 507 (33.4%) | 1,012 (66.6%) |
| Legal Services & Support | 225 (26.8%) | 616 (73.3%) |
| Education Instruction & Library | 972 (21.4%) | 3,570 (78.6%) |
| Arts, Media & Entertainment | 654 (45.4%) | 786 (54.6%) |
| Health Diagnosing & Treating | 1,129 (19.4%) | 4,694 (80.6%) |
| Health Technologists | 596 (16.2%) | 3,075 (83.8%) |
| Total (Category) | 15,050 (44.7%) | 18,617 (55.3%) |
| Total (Overall) | 45,524 (52.4%) | 41,354 (47.6%) |
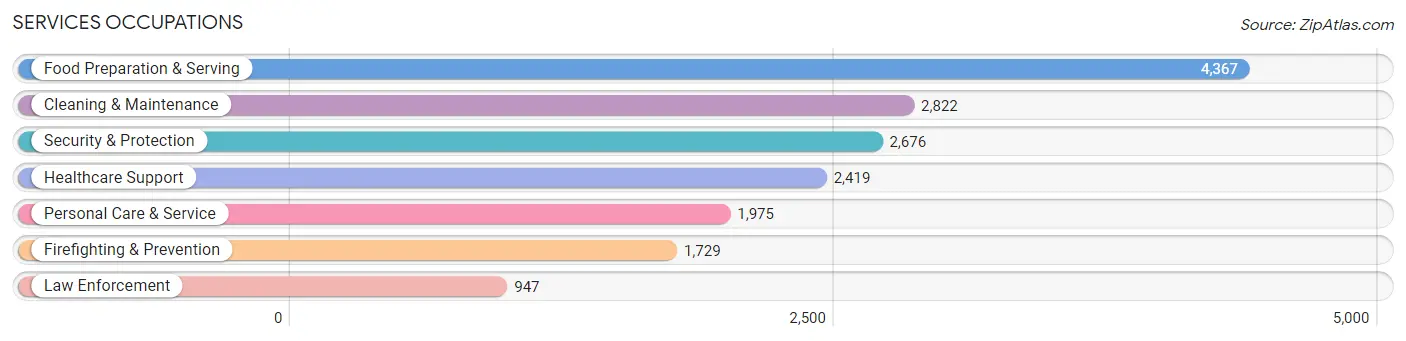
Services Occupations
The most common Services occupations in Licking County are Food Preparation & Serving (4,367 | 5.0%), Cleaning & Maintenance (2,822 | 3.3%), Security & Protection (2,676 | 3.1%), Healthcare Support (2,419 | 2.8%), and Personal Care & Service (1,975 | 2.3%).
Services Occupations by Sex
Within the Services occupations in Licking County, the most male-oriented occupations are Firefighting & Prevention (87.4%), Security & Protection (87.2%), and Law Enforcement (86.8%), while the most female-oriented occupations are Healthcare Support (84.7%), Personal Care & Service (77.8%), and Food Preparation & Serving (63.9%).
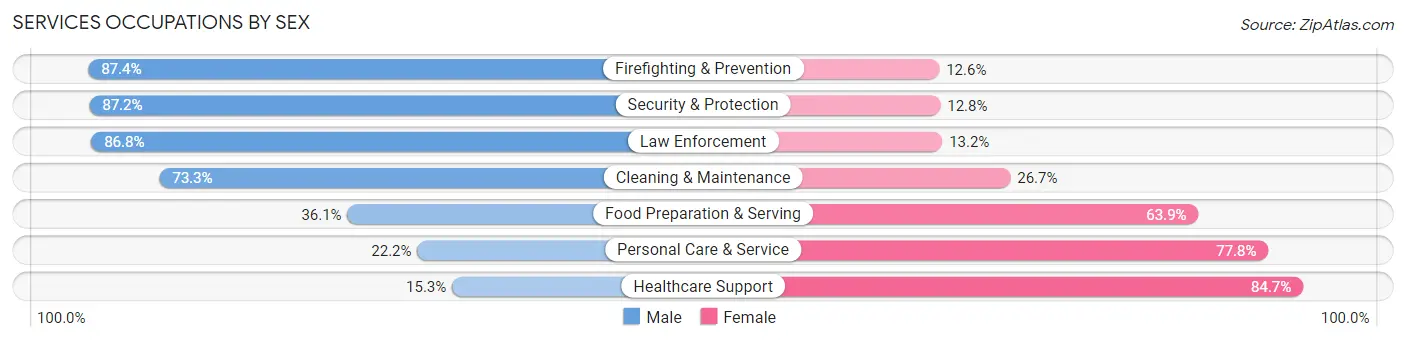
| Occupation | Male | Female |
| Healthcare Support | 371 (15.3%) | 2,048 (84.7%) |
| Security & Protection | 2,333 (87.2%) | 343 (12.8%) |
| Firefighting & Prevention | 1,511 (87.4%) | 218 (12.6%) |
| Law Enforcement | 822 (86.8%) | 125 (13.2%) |
| Food Preparation & Serving | 1,575 (36.1%) | 2,792 (63.9%) |
| Cleaning & Maintenance | 2,069 (73.3%) | 753 (26.7%) |
| Personal Care & Service | 439 (22.2%) | 1,536 (77.8%) |
| Total (Category) | 6,787 (47.6%) | 7,472 (52.4%) |
| Total (Overall) | 45,524 (52.4%) | 41,354 (47.6%) |
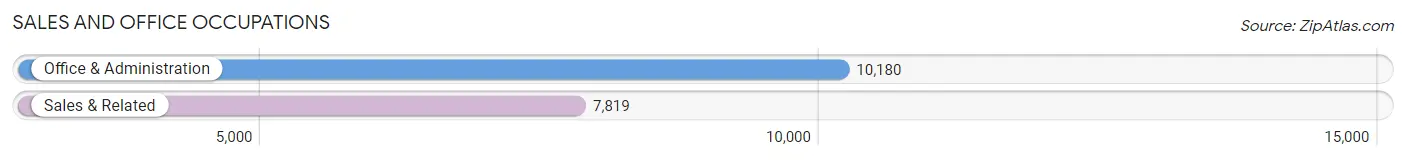
Sales and Office Occupations
The most common Sales and Office occupations in Licking County are Office & Administration (10,180 | 11.7%), and Sales & Related (7,819 | 9.0%).
Sales and Office Occupations by Sex
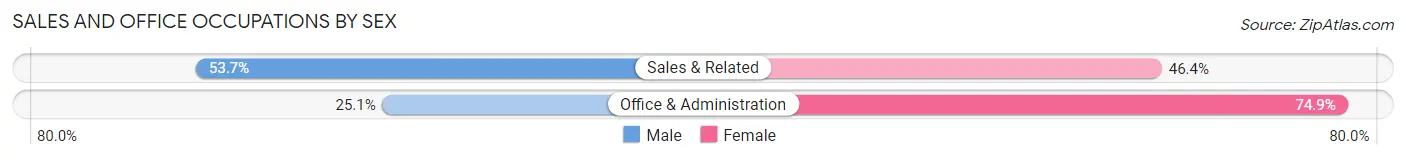
| Occupation | Male | Female |
| Sales & Related | 4,195 (53.6%) | 3,624 (46.4%) |
| Office & Administration | 2,553 (25.1%) | 7,627 (74.9%) |
| Total (Category) | 6,748 (37.5%) | 11,251 (62.5%) |
| Total (Overall) | 45,524 (52.4%) | 41,354 (47.6%) |
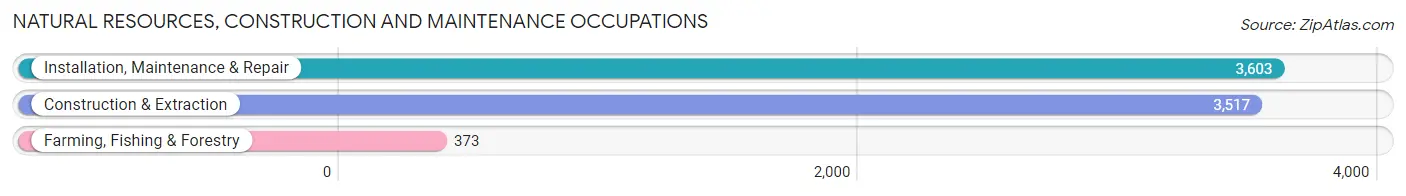
Natural Resources, Construction and Maintenance Occupations
The most common Natural Resources, Construction and Maintenance occupations in Licking County are Installation, Maintenance & Repair (3,603 | 4.2%), Construction & Extraction (3,517 | 4.1%), and Farming, Fishing & Forestry (373 | 0.4%).
Natural Resources, Construction and Maintenance Occupations by Sex
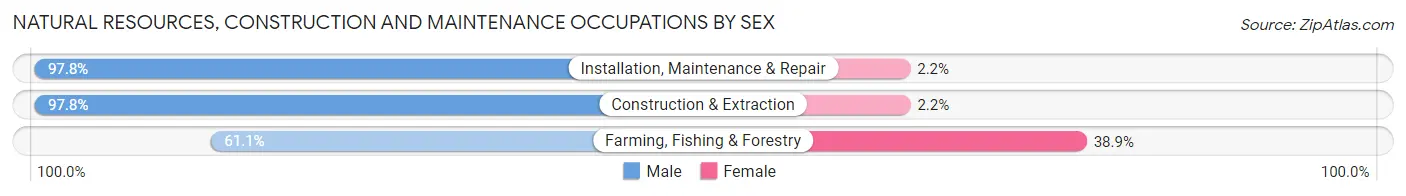
| Occupation | Male | Female |
| Farming, Fishing & Forestry | 228 (61.1%) | 145 (38.9%) |
| Construction & Extraction | 3,440 (97.8%) | 77 (2.2%) |
| Installation, Maintenance & Repair | 3,525 (97.8%) | 78 (2.2%) |
| Total (Category) | 7,193 (96.0%) | 300 (4.0%) |
| Total (Overall) | 45,524 (52.4%) | 41,354 (47.6%) |
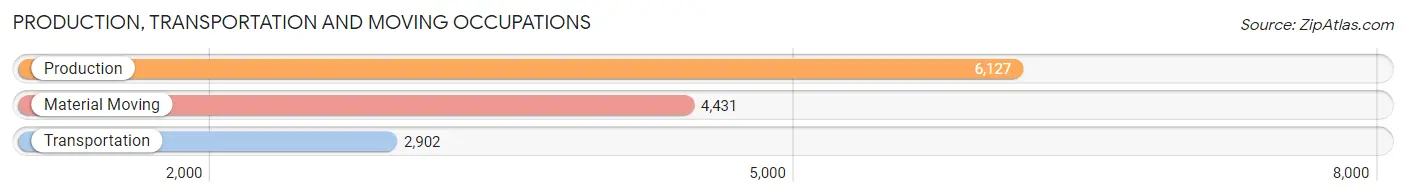
Production, Transportation and Moving Occupations
The most common Production, Transportation and Moving occupations in Licking County are Production (6,127 | 7.0%), Material Moving (4,431 | 5.1%), and Transportation (2,902 | 3.3%).
Production, Transportation and Moving Occupations by Sex
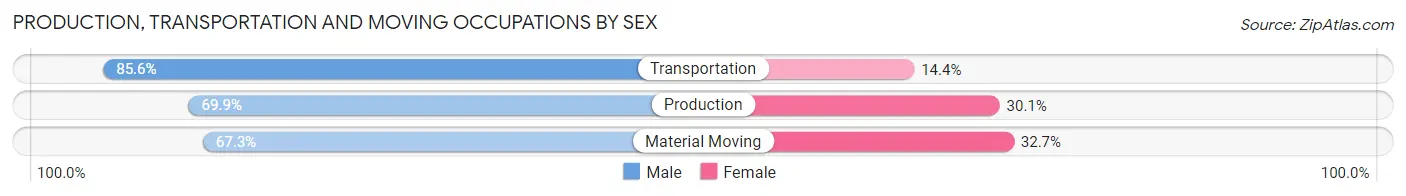
| Occupation | Male | Female |
| Production | 4,282 (69.9%) | 1,845 (30.1%) |
| Transportation | 2,483 (85.6%) | 419 (14.4%) |
| Material Moving | 2,981 (67.3%) | 1,450 (32.7%) |
| Total (Category) | 9,746 (72.4%) | 3,714 (27.6%) |
| Total (Overall) | 45,524 (52.4%) | 41,354 (47.6%) |
Employment Industries by Sex in Licking County
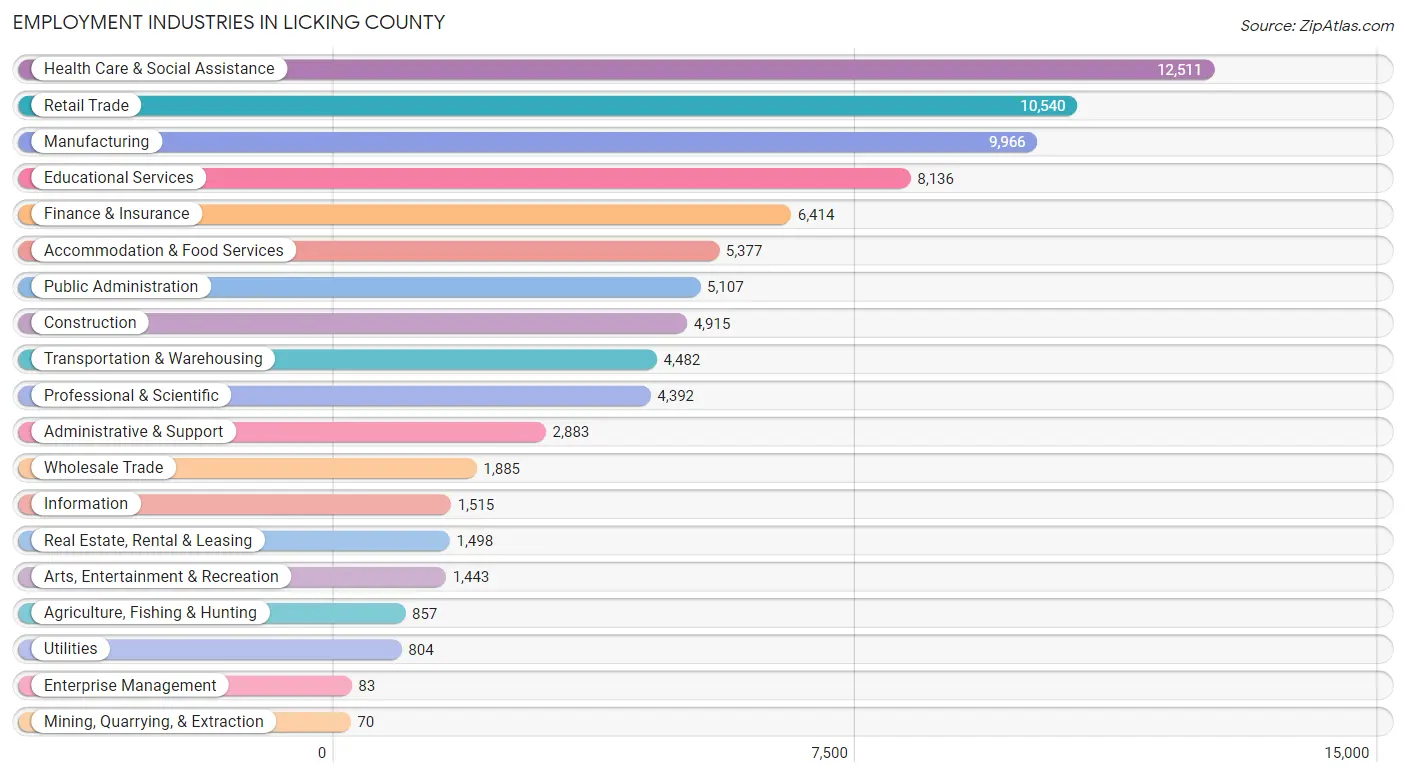
Employment Industries in Licking County
The major employment industries in Licking County include Health Care & Social Assistance (12,511 | 14.4%), Retail Trade (10,540 | 12.1%), Manufacturing (9,966 | 11.5%), Educational Services (8,136 | 9.4%), and Finance & Insurance (6,414 | 7.4%).
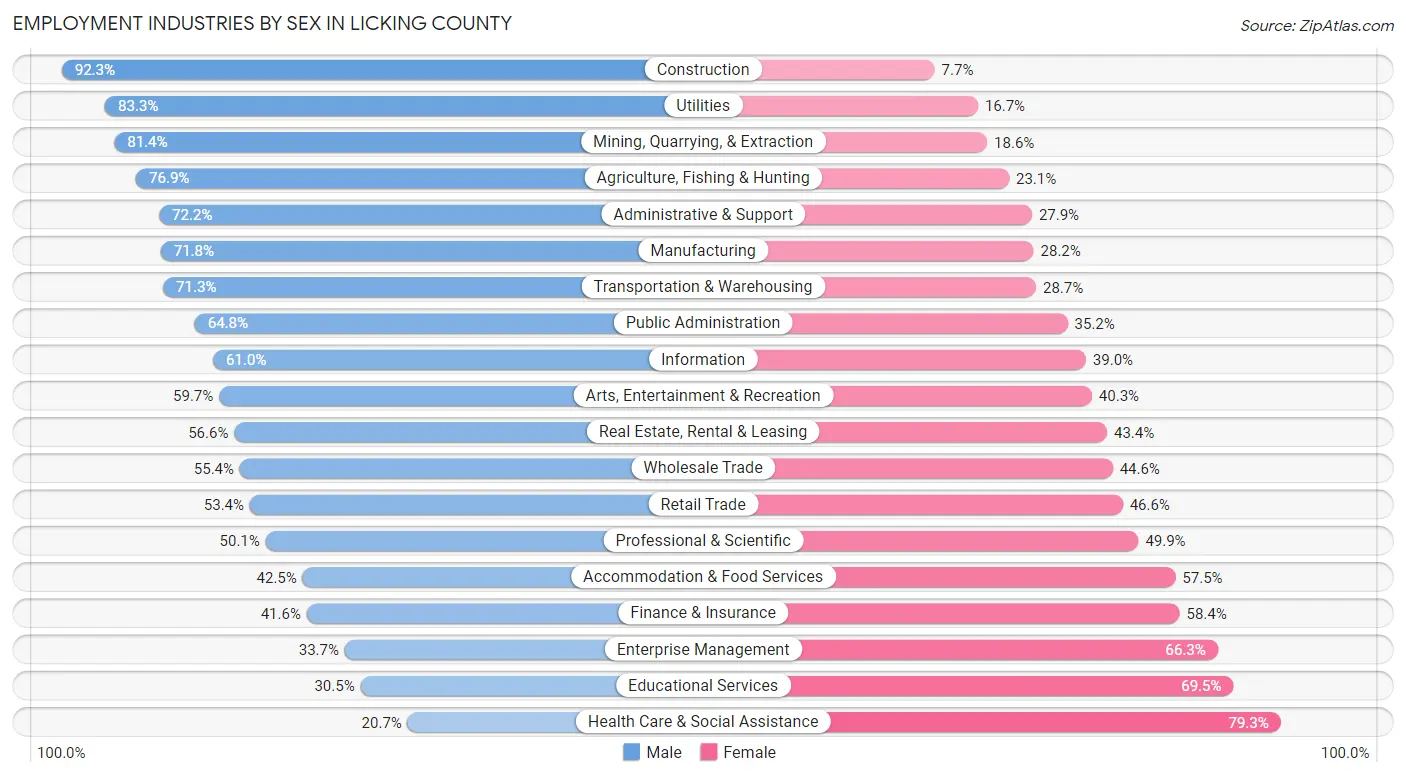
Employment Industries by Sex in Licking County
The Licking County industries that see more men than women are Construction (92.3%), Utilities (83.3%), and Mining, Quarrying, & Extraction (81.4%), whereas the industries that tend to have a higher number of women are Health Care & Social Assistance (79.3%), Educational Services (69.5%), and Enterprise Management (66.3%).
| Industry | Male | Female |
| Agriculture, Fishing & Hunting | 659 (76.9%) | 198 (23.1%) |
| Mining, Quarrying, & Extraction | 57 (81.4%) | 13 (18.6%) |
| Construction | 4,536 (92.3%) | 379 (7.7%) |
| Manufacturing | 7,157 (71.8%) | 2,809 (28.2%) |
| Wholesale Trade | 1,045 (55.4%) | 840 (44.6%) |
| Retail Trade | 5,625 (53.4%) | 4,915 (46.6%) |
| Transportation & Warehousing | 3,196 (71.3%) | 1,286 (28.7%) |
| Utilities | 670 (83.3%) | 134 (16.7%) |
| Information | 924 (61.0%) | 591 (39.0%) |
| Finance & Insurance | 2,668 (41.6%) | 3,746 (58.4%) |
| Real Estate, Rental & Leasing | 848 (56.6%) | 650 (43.4%) |
| Professional & Scientific | 2,201 (50.1%) | 2,191 (49.9%) |
| Enterprise Management | 28 (33.7%) | 55 (66.3%) |
| Administrative & Support | 2,080 (72.2%) | 803 (27.9%) |
| Educational Services | 2,480 (30.5%) | 5,656 (69.5%) |
| Health Care & Social Assistance | 2,591 (20.7%) | 9,920 (79.3%) |
| Arts, Entertainment & Recreation | 862 (59.7%) | 581 (40.3%) |
| Accommodation & Food Services | 2,283 (42.5%) | 3,094 (57.5%) |
| Public Administration | 3,308 (64.8%) | 1,799 (35.2%) |
| Total | 45,524 (52.4%) | 41,354 (47.6%) |
Education in Licking County
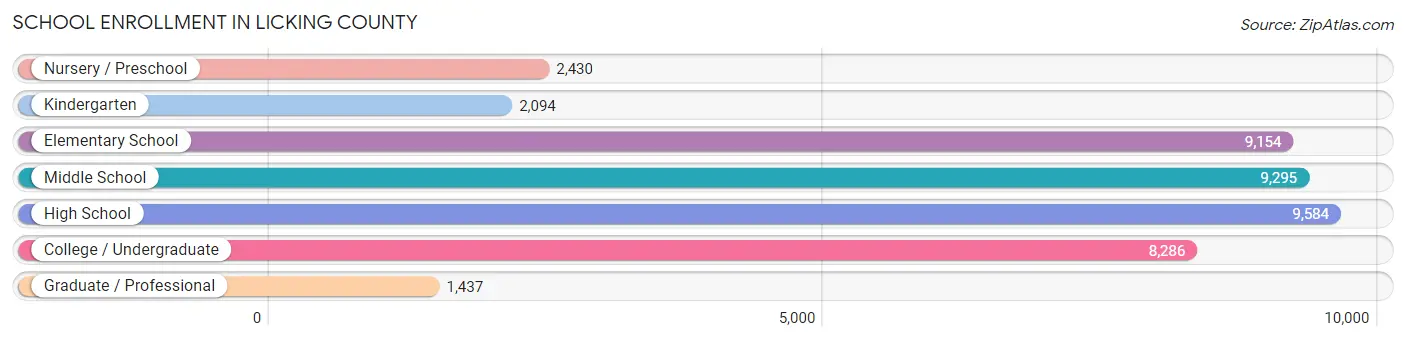
School Enrollment in Licking County
The most common levels of schooling among the 42,280 students in Licking County are high school (9,584 | 22.7%), middle school (9,295 | 22.0%), and elementary school (9,154 | 21.6%).
| School Level | # Students | % Students |
| Nursery / Preschool | 2,430 | 5.8% |
| Kindergarten | 2,094 | 5.0% |
| Elementary School | 9,154 | 21.6% |
| Middle School | 9,295 | 22.0% |
| High School | 9,584 | 22.7% |
| College / Undergraduate | 8,286 | 19.6% |
| Graduate / Professional | 1,437 | 3.4% |
| Total | 42,280 | 100.0% |
School Enrollment by Age by Funding Source in Licking County
Out of a total of 42,280 students who are enrolled in schools in Licking County, 7,737 (18.3%) attend a private institution, while the remaining 34,543 (81.7%) are enrolled in public schools. The age group of 3 to 4 year olds has the highest likelihood of being enrolled in private schools, with 747 (40.5% in the age bracket) enrolled. Conversely, the age group of 10 to 14 year olds has the lowest likelihood of being enrolled in a private school, with 10,832 (90.3% in the age bracket) attending a public institution.
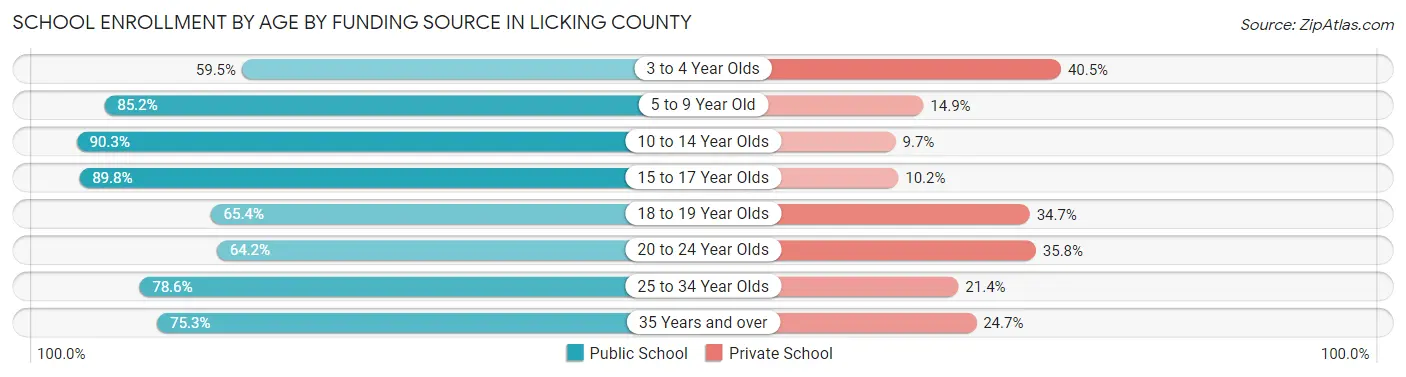
| Age Bracket | Public School | Private School |
| 3 to 4 Year Olds | 1,099 (59.5%) | 747 (40.5%) |
| 5 to 9 Year Old | 8,640 (85.2%) | 1,507 (14.8%) |
| 10 to 14 Year Olds | 10,832 (90.3%) | 1,159 (9.7%) |
| 15 to 17 Year Olds | 6,385 (89.8%) | 724 (10.2%) |
| 18 to 19 Year Olds | 2,378 (65.3%) | 1,261 (34.6%) |
| 20 to 24 Year Olds | 2,973 (64.2%) | 1,658 (35.8%) |
| 25 to 34 Year Olds | 1,214 (78.6%) | 330 (21.4%) |
| 35 Years and over | 1,034 (75.3%) | 339 (24.7%) |
| Total | 34,543 (81.7%) | 7,737 (18.3%) |
Educational Attainment by Field of Study in Licking County
Business (8,321 | 21.5%), education (5,689 | 14.7%), science & technology (4,923 | 12.7%), engineering (2,421 | 6.3%), and bio, nature & agricultural (2,256 | 5.8%) are the most common fields of study among 38,650 individuals in Licking County who have obtained a bachelor's degree or higher.
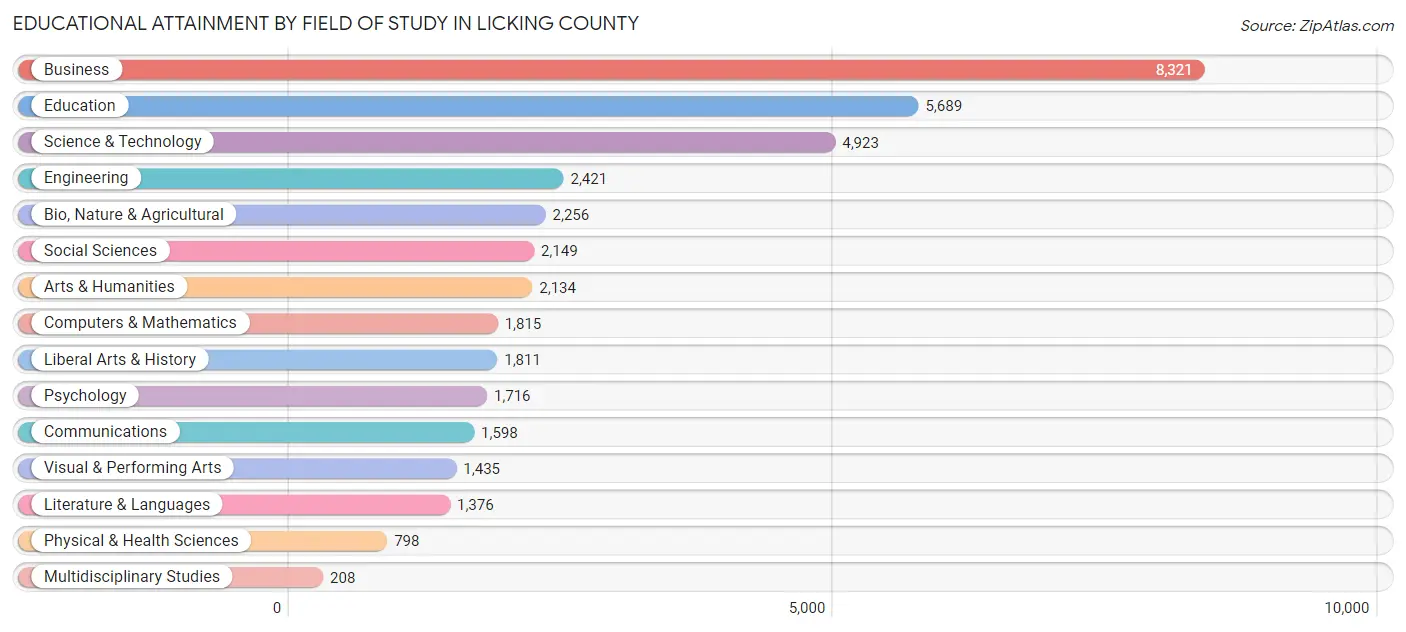
| Field of Study | # Graduates | % Graduates |
| Computers & Mathematics | 1,815 | 4.7% |
| Bio, Nature & Agricultural | 2,256 | 5.8% |
| Physical & Health Sciences | 798 | 2.1% |
| Psychology | 1,716 | 4.4% |
| Social Sciences | 2,149 | 5.6% |
| Engineering | 2,421 | 6.3% |
| Multidisciplinary Studies | 208 | 0.5% |
| Science & Technology | 4,923 | 12.7% |
| Business | 8,321 | 21.5% |
| Education | 5,689 | 14.7% |
| Literature & Languages | 1,376 | 3.6% |
| Liberal Arts & History | 1,811 | 4.7% |
| Visual & Performing Arts | 1,435 | 3.7% |
| Communications | 1,598 | 4.1% |
| Arts & Humanities | 2,134 | 5.5% |
| Total | 38,650 | 100.0% |
Transportation & Commute in Licking County
Vehicle Availability by Sex in Licking County
The most prevalent vehicle ownership categories in Licking County are males with 2 vehicles (19,044, accounting for 42.8%) and females with 2 vehicles (16,731, making up 47.5%).
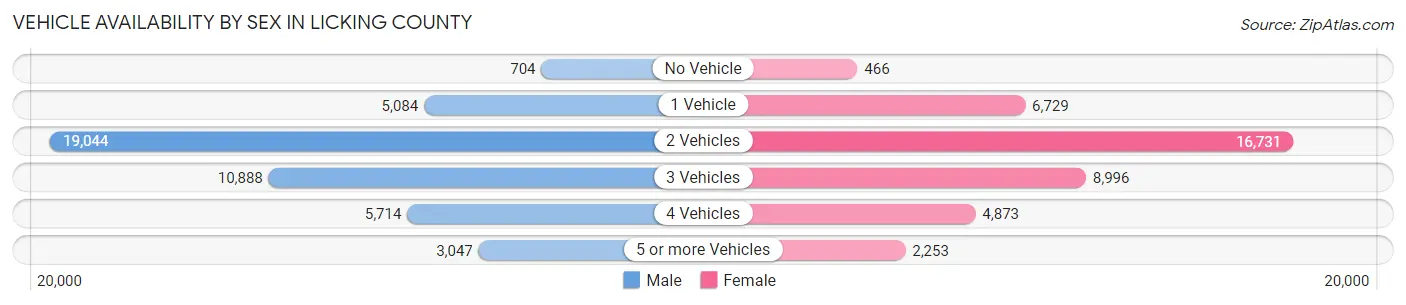
| Vehicles Available | Male | Female |
| No Vehicle | 704 (1.6%) | 466 (1.2%) |
| 1 Vehicle | 5,084 (11.4%) | 6,729 (16.8%) |
| 2 Vehicles | 19,044 (42.8%) | 16,731 (41.8%) |
| 3 Vehicles | 10,888 (24.5%) | 8,996 (22.5%) |
| 4 Vehicles | 5,714 (12.9%) | 4,873 (12.2%) |
| 5 or more Vehicles | 3,047 (6.9%) | 2,253 (5.6%) |
| Total | 44,481 (100.0%) | 40,048 (100.0%) |
Commute Time in Licking County
The most frequently occuring commute durations in Licking County are 10 to 14 minutes (10,622 commuters, 14.1%), 15 to 19 minutes (9,643 commuters, 12.8%), and 20 to 24 minutes (9,566 commuters, 12.7%).
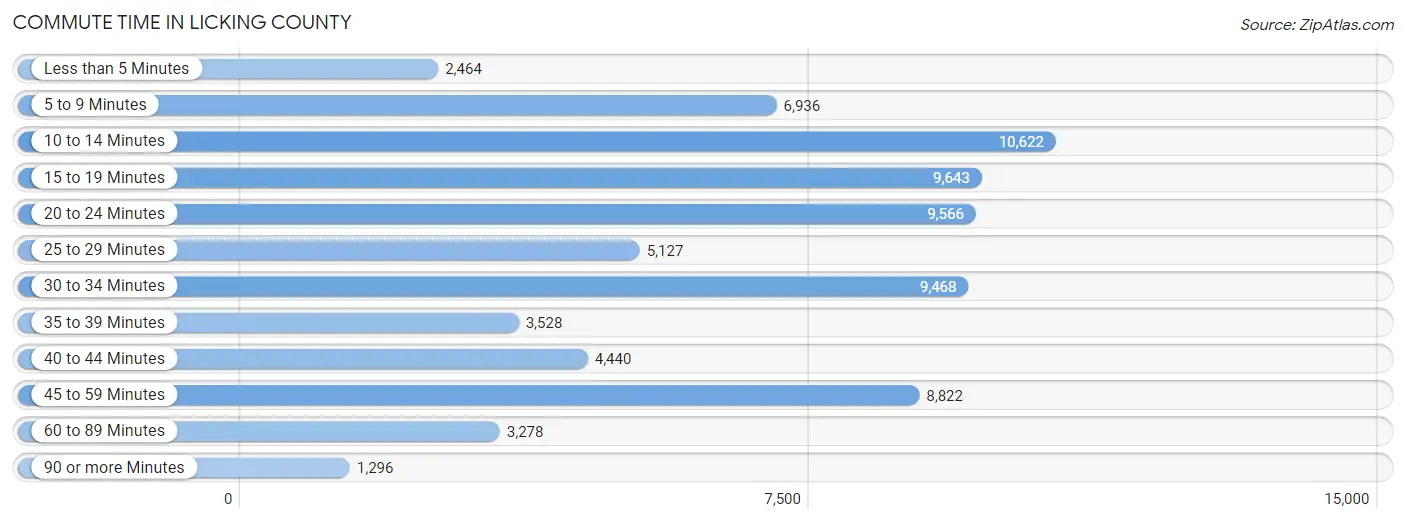
| Commute Time | # Commuters | % Commuters |
| Less than 5 Minutes | 2,464 | 3.3% |
| 5 to 9 Minutes | 6,936 | 9.2% |
| 10 to 14 Minutes | 10,622 | 14.1% |
| 15 to 19 Minutes | 9,643 | 12.8% |
| 20 to 24 Minutes | 9,566 | 12.7% |
| 25 to 29 Minutes | 5,127 | 6.8% |
| 30 to 34 Minutes | 9,468 | 12.6% |
| 35 to 39 Minutes | 3,528 | 4.7% |
| 40 to 44 Minutes | 4,440 | 5.9% |
| 45 to 59 Minutes | 8,822 | 11.7% |
| 60 to 89 Minutes | 3,278 | 4.4% |
| 90 or more Minutes | 1,296 | 1.7% |
Commute Time by Sex in Licking County
The most common commute times in Licking County are 30 to 34 minutes (6,028 commuters, 14.8%) for males and 10 to 14 minutes (5,827 commuters, 16.9%) for females.
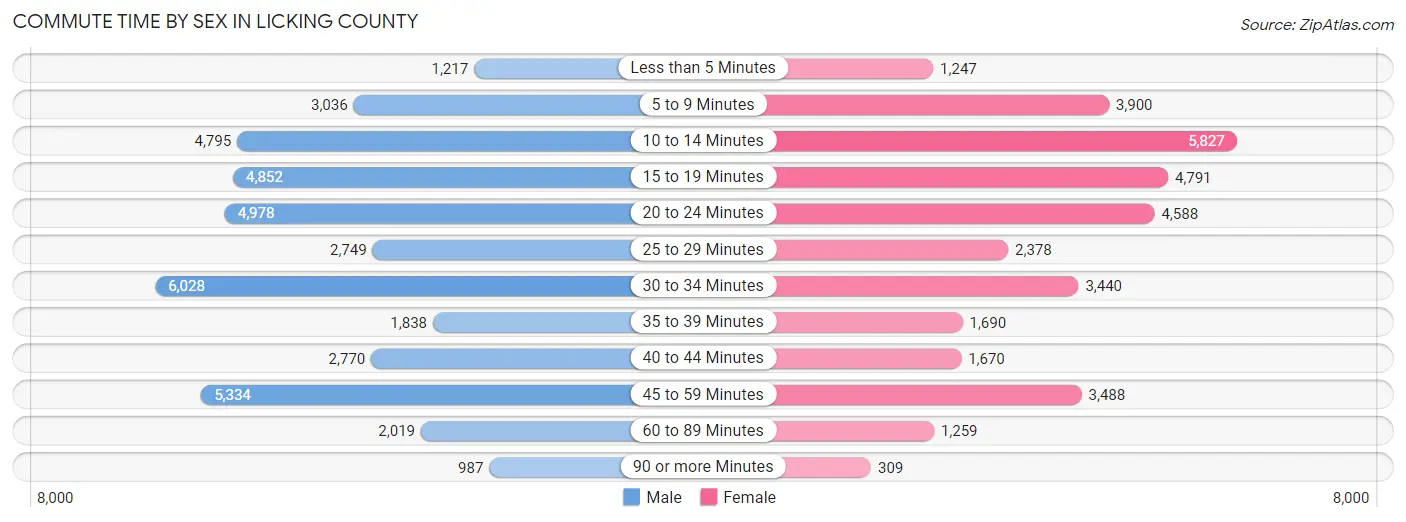
| Commute Time | Male | Female |
| Less than 5 Minutes | 1,217 (3.0%) | 1,247 (3.6%) |
| 5 to 9 Minutes | 3,036 (7.5%) | 3,900 (11.3%) |
| 10 to 14 Minutes | 4,795 (11.8%) | 5,827 (16.9%) |
| 15 to 19 Minutes | 4,852 (11.9%) | 4,791 (13.9%) |
| 20 to 24 Minutes | 4,978 (12.3%) | 4,588 (13.3%) |
| 25 to 29 Minutes | 2,749 (6.8%) | 2,378 (6.9%) |
| 30 to 34 Minutes | 6,028 (14.8%) | 3,440 (10.0%) |
| 35 to 39 Minutes | 1,838 (4.5%) | 1,690 (4.9%) |
| 40 to 44 Minutes | 2,770 (6.8%) | 1,670 (4.8%) |
| 45 to 59 Minutes | 5,334 (13.1%) | 3,488 (10.1%) |
| 60 to 89 Minutes | 2,019 (5.0%) | 1,259 (3.6%) |
| 90 or more Minutes | 987 (2.4%) | 309 (0.9%) |
Time of Departure to Work by Sex in Licking County
The most frequent times of departure to work in Licking County are 7:00 AM to 7:29 AM (4,909, 12.1%) for males and 7:00 AM to 7:29 AM (5,493, 15.9%) for females.
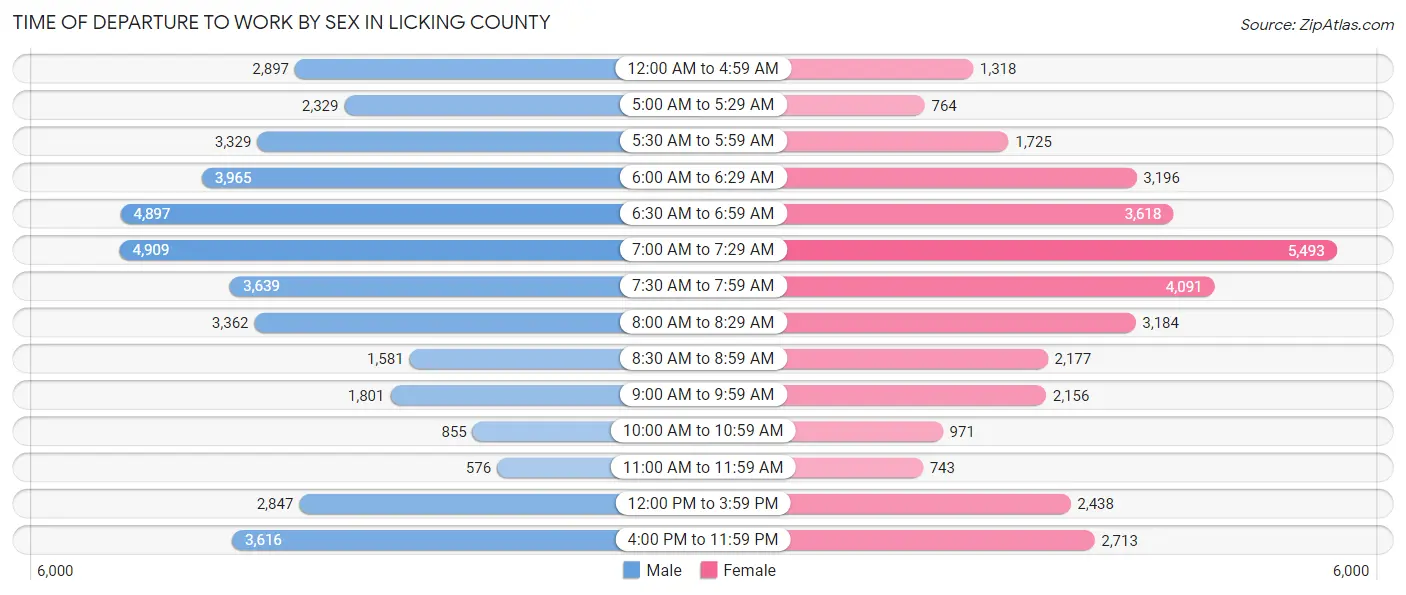
| Time of Departure | Male | Female |
| 12:00 AM to 4:59 AM | 2,897 (7.1%) | 1,318 (3.8%) |
| 5:00 AM to 5:29 AM | 2,329 (5.7%) | 764 (2.2%) |
| 5:30 AM to 5:59 AM | 3,329 (8.2%) | 1,725 (5.0%) |
| 6:00 AM to 6:29 AM | 3,965 (9.8%) | 3,196 (9.2%) |
| 6:30 AM to 6:59 AM | 4,897 (12.1%) | 3,618 (10.5%) |
| 7:00 AM to 7:29 AM | 4,909 (12.1%) | 5,493 (15.9%) |
| 7:30 AM to 7:59 AM | 3,639 (9.0%) | 4,091 (11.8%) |
| 8:00 AM to 8:29 AM | 3,362 (8.3%) | 3,184 (9.2%) |
| 8:30 AM to 8:59 AM | 1,581 (3.9%) | 2,177 (6.3%) |
| 9:00 AM to 9:59 AM | 1,801 (4.4%) | 2,156 (6.2%) |
| 10:00 AM to 10:59 AM | 855 (2.1%) | 971 (2.8%) |
| 11:00 AM to 11:59 AM | 576 (1.4%) | 743 (2.1%) |
| 12:00 PM to 3:59 PM | 2,847 (7.0%) | 2,438 (7.0%) |
| 4:00 PM to 11:59 PM | 3,616 (8.9%) | 2,713 (7.8%) |
| Total | 40,603 (100.0%) | 34,587 (100.0%) |
Housing Occupancy in Licking County
Occupancy by Ownership in Licking County
Of the total 67,239 dwellings in Licking County, owner-occupied units account for 49,402 (73.5%), while renter-occupied units make up 17,837 (26.5%).
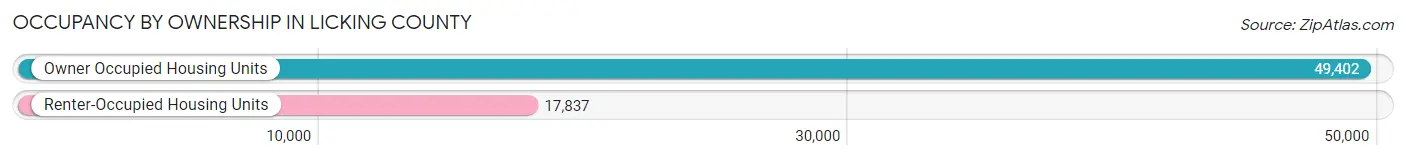
| Occupancy | # Housing Units | % Housing Units |
| Owner Occupied Housing Units | 49,402 | 73.5% |
| Renter-Occupied Housing Units | 17,837 | 26.5% |
| Total Occupied Housing Units | 67,239 | 100.0% |
Occupancy by Household Size in Licking County
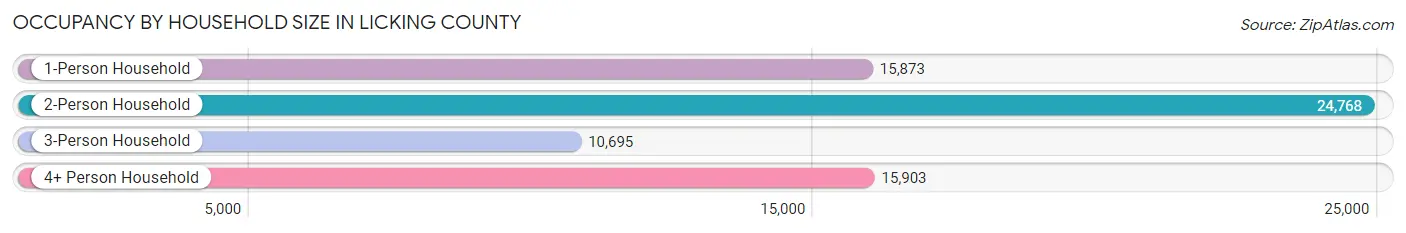
| Household Size | # Housing Units | % Housing Units |
| 1-Person Household | 15,873 | 23.6% |
| 2-Person Household | 24,768 | 36.8% |
| 3-Person Household | 10,695 | 15.9% |
| 4+ Person Household | 15,903 | 23.6% |
| Total Housing Units | 67,239 | 100.0% |
Occupancy by Ownership by Household Size in Licking County
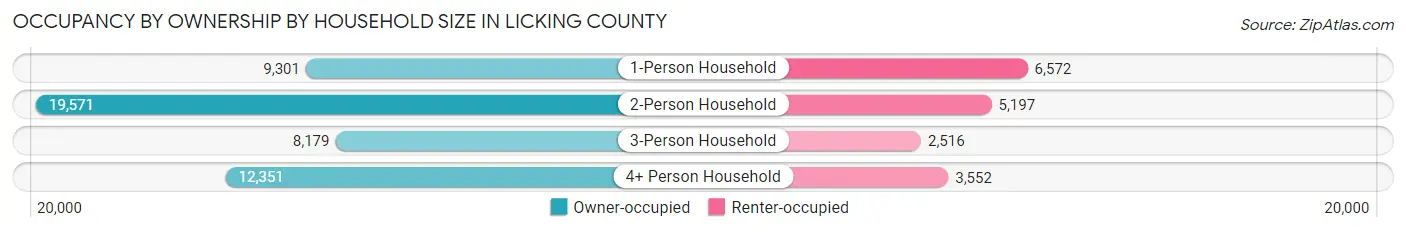
| Household Size | Owner-occupied | Renter-occupied |
| 1-Person Household | 9,301 (58.6%) | 6,572 (41.4%) |
| 2-Person Household | 19,571 (79.0%) | 5,197 (21.0%) |
| 3-Person Household | 8,179 (76.5%) | 2,516 (23.5%) |
| 4+ Person Household | 12,351 (77.7%) | 3,552 (22.3%) |
| Total Housing Units | 49,402 (73.5%) | 17,837 (26.5%) |
Occupancy by Educational Attainment in Licking County
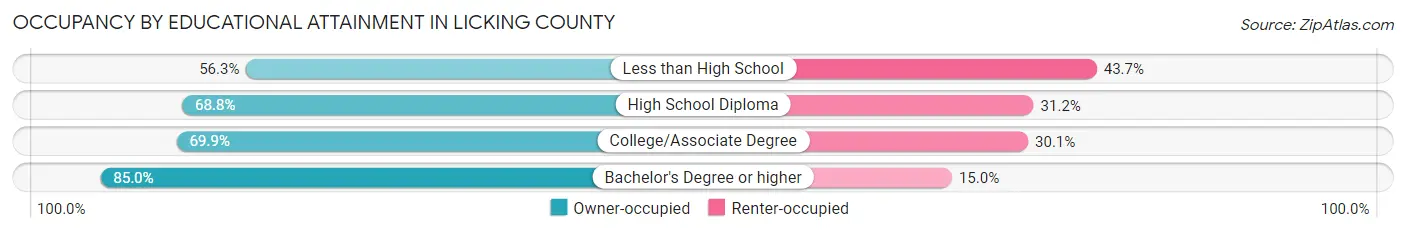
| Household Size | Owner-occupied | Renter-occupied |
| Less than High School | 2,367 (56.3%) | 1,840 (43.7%) |
| High School Diploma | 13,982 (68.8%) | 6,347 (31.2%) |
| College/Associate Degree | 14,958 (69.9%) | 6,448 (30.1%) |
| Bachelor's Degree or higher | 18,095 (85.0%) | 3,202 (15.0%) |
Occupancy by Age of Householder in Licking County
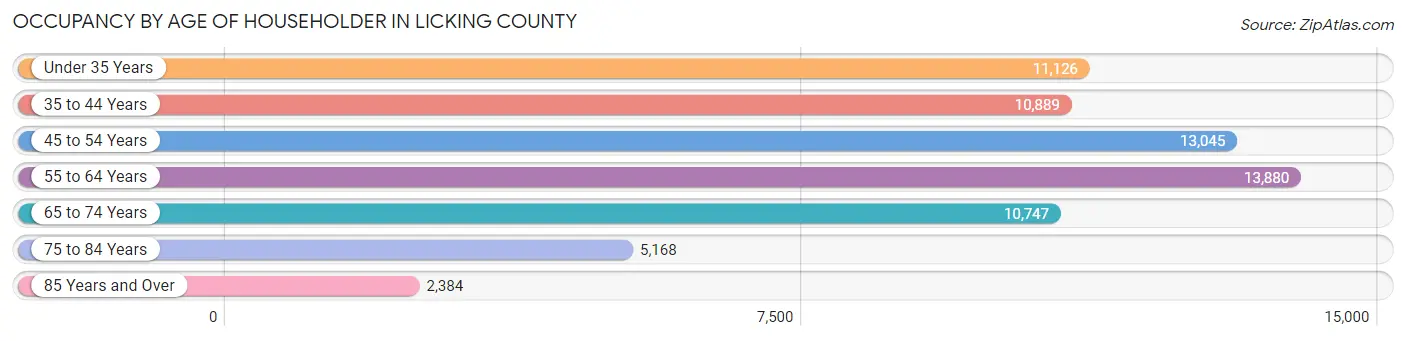
| Age Bracket | # Households | % Households |
| Under 35 Years | 11,126 | 16.6% |
| 35 to 44 Years | 10,889 | 16.2% |
| 45 to 54 Years | 13,045 | 19.4% |
| 55 to 64 Years | 13,880 | 20.6% |
| 65 to 74 Years | 10,747 | 16.0% |
| 75 to 84 Years | 5,168 | 7.7% |
| 85 Years and Over | 2,384 | 3.5% |
| Total | 67,239 | 100.0% |
Housing Finances in Licking County
Median Income by Occupancy in Licking County
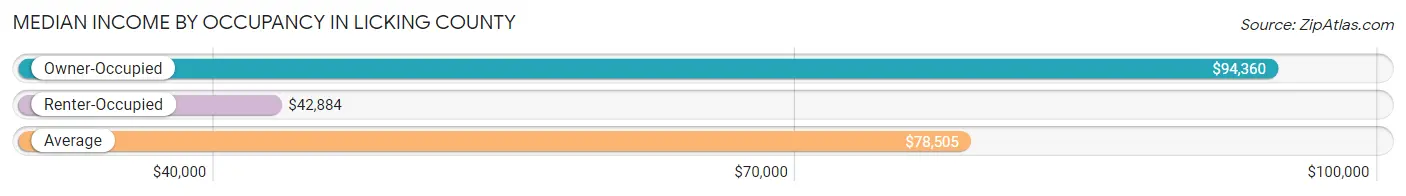
| Occupancy Type | # Households | Median Income |
| Owner-Occupied | 49,402 (73.5%) | $94,360 |
| Renter-Occupied | 17,837 (26.5%) | $42,884 |
| Average | 67,239 (100.0%) | $78,505 |
Occupancy by Householder Income Bracket in Licking County
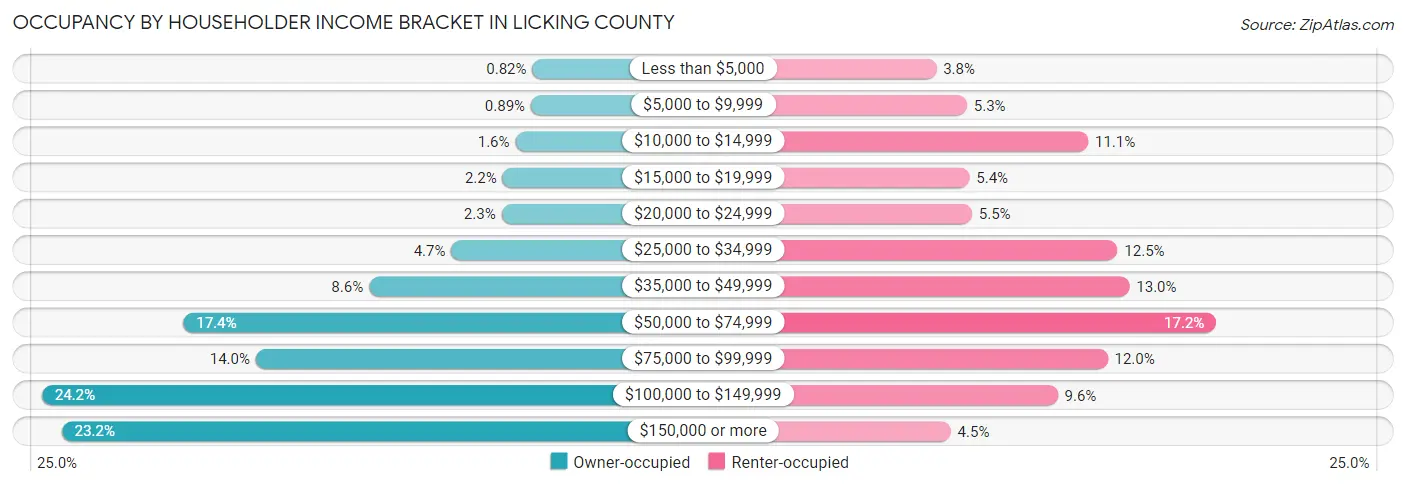
| Income Bracket | Owner-occupied | Renter-occupied |
| Less than $5,000 | 405 (0.8%) | 685 (3.8%) |
| $5,000 to $9,999 | 440 (0.9%) | 946 (5.3%) |
| $10,000 to $14,999 | 807 (1.6%) | 1,975 (11.1%) |
| $15,000 to $19,999 | 1,108 (2.2%) | 967 (5.4%) |
| $20,000 to $24,999 | 1,130 (2.3%) | 988 (5.5%) |
| $25,000 to $34,999 | 2,312 (4.7%) | 2,224 (12.5%) |
| $35,000 to $49,999 | 4,249 (8.6%) | 2,326 (13.0%) |
| $50,000 to $74,999 | 8,618 (17.4%) | 3,062 (17.2%) |
| $75,000 to $99,999 | 6,909 (14.0%) | 2,140 (12.0%) |
| $100,000 to $149,999 | 11,944 (24.2%) | 1,716 (9.6%) |
| $150,000 or more | 11,480 (23.2%) | 808 (4.5%) |
| Total | 49,402 (100.0%) | 17,837 (100.0%) |
Monthly Housing Cost Tiers in Licking County
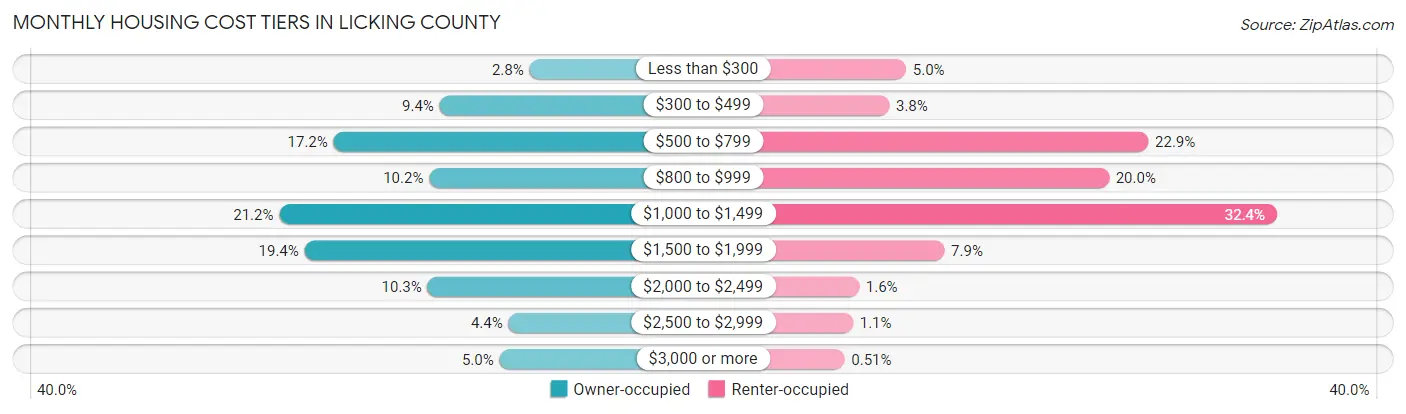
| Monthly Cost | Owner-occupied | Renter-occupied |
| Less than $300 | 1,386 (2.8%) | 899 (5.0%) |
| $300 to $499 | 4,661 (9.4%) | 677 (3.8%) |
| $500 to $799 | 8,519 (17.2%) | 4,081 (22.9%) |
| $800 to $999 | 5,041 (10.2%) | 3,564 (20.0%) |
| $1,000 to $1,499 | 10,492 (21.2%) | 5,772 (32.4%) |
| $1,500 to $1,999 | 9,572 (19.4%) | 1,402 (7.9%) |
| $2,000 to $2,499 | 5,099 (10.3%) | 282 (1.6%) |
| $2,500 to $2,999 | 2,152 (4.4%) | 201 (1.1%) |
| $3,000 or more | 2,480 (5.0%) | 91 (0.5%) |
| Total | 49,402 (100.0%) | 17,837 (100.0%) |
Physical Housing Characteristics in Licking County
Housing Structures in Licking County
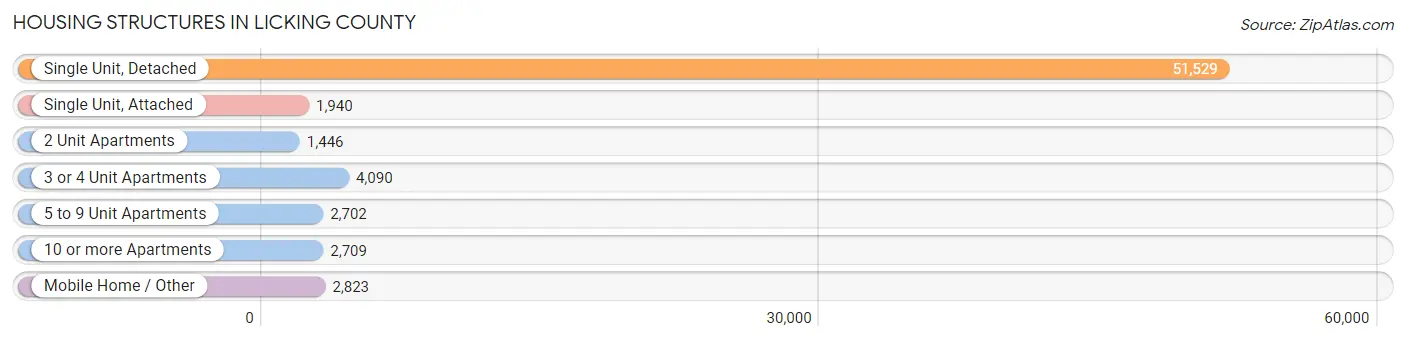
| Structure Type | # Housing Units | % Housing Units |
| Single Unit, Detached | 51,529 | 76.6% |
| Single Unit, Attached | 1,940 | 2.9% |
| 2 Unit Apartments | 1,446 | 2.1% |
| 3 or 4 Unit Apartments | 4,090 | 6.1% |
| 5 to 9 Unit Apartments | 2,702 | 4.0% |
| 10 or more Apartments | 2,709 | 4.0% |
| Mobile Home / Other | 2,823 | 4.2% |
| Total | 67,239 | 100.0% |
Housing Structures by Occupancy in Licking County
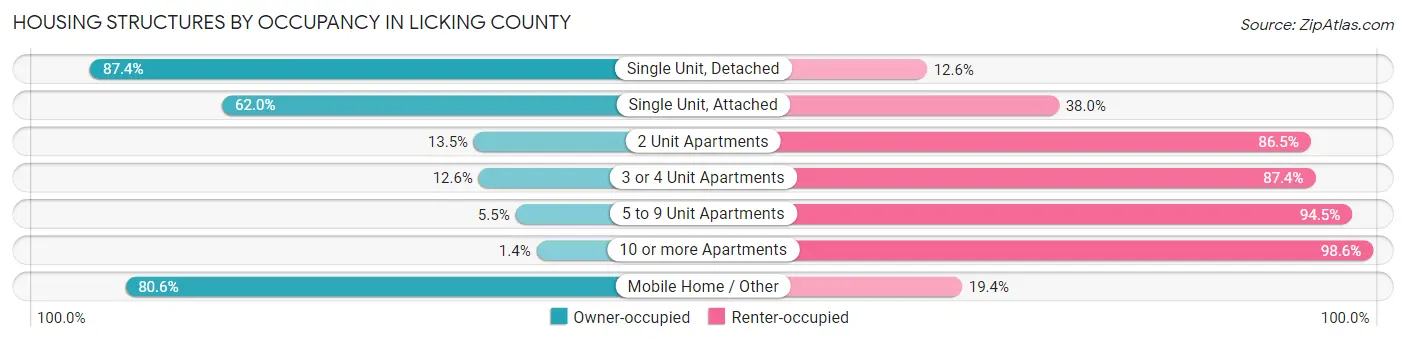
| Structure Type | Owner-occupied | Renter-occupied |
| Single Unit, Detached | 45,028 (87.4%) | 6,501 (12.6%) |
| Single Unit, Attached | 1,202 (62.0%) | 738 (38.0%) |
| 2 Unit Apartments | 195 (13.5%) | 1,251 (86.5%) |
| 3 or 4 Unit Apartments | 514 (12.6%) | 3,576 (87.4%) |
| 5 to 9 Unit Apartments | 148 (5.5%) | 2,554 (94.5%) |
| 10 or more Apartments | 39 (1.4%) | 2,670 (98.6%) |
| Mobile Home / Other | 2,276 (80.6%) | 547 (19.4%) |
| Total | 49,402 (73.5%) | 17,837 (26.5%) |
Housing Structures by Number of Rooms in Licking County
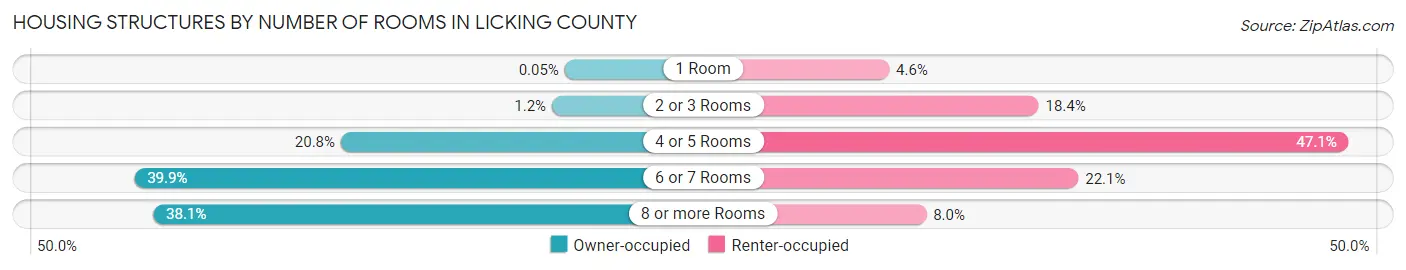
| Number of Rooms | Owner-occupied | Renter-occupied |
| 1 Room | 25 (0.1%) | 811 (4.5%) |
| 2 or 3 Rooms | 606 (1.2%) | 3,277 (18.4%) |
| 4 or 5 Rooms | 10,253 (20.7%) | 8,392 (47.0%) |
| 6 or 7 Rooms | 19,690 (39.9%) | 3,933 (22.1%) |
| 8 or more Rooms | 18,828 (38.1%) | 1,424 (8.0%) |
| Total | 49,402 (100.0%) | 17,837 (100.0%) |
Housing Structure by Heating Type in Licking County
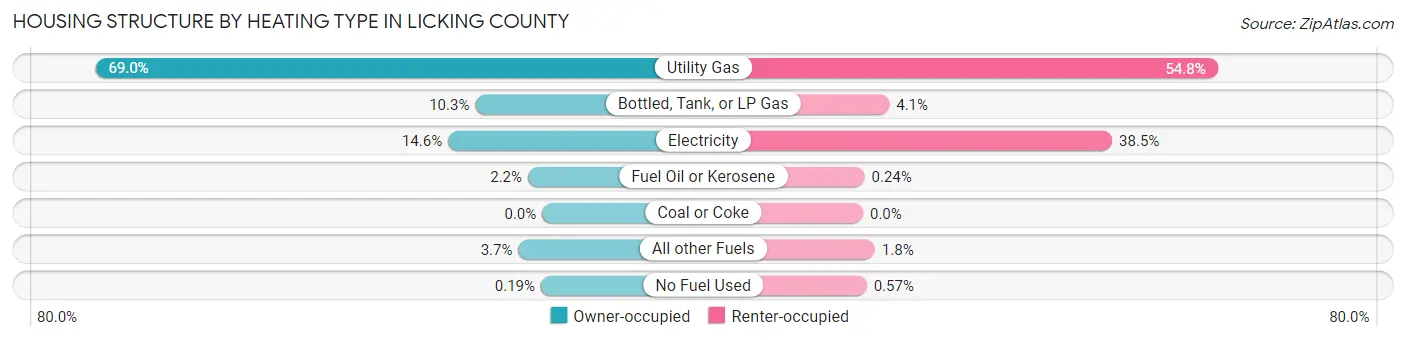
| Heating Type | Owner-occupied | Renter-occupied |
| Utility Gas | 34,107 (69.0%) | 9,773 (54.8%) |
| Bottled, Tank, or LP Gas | 5,107 (10.3%) | 724 (4.1%) |
| Electricity | 7,187 (14.5%) | 6,869 (38.5%) |
| Fuel Oil or Kerosene | 1,089 (2.2%) | 42 (0.2%) |
| Coal or Coke | 0 (0.0%) | 0 (0.0%) |
| All other Fuels | 1,819 (3.7%) | 327 (1.8%) |
| No Fuel Used | 93 (0.2%) | 102 (0.6%) |
| Total | 49,402 (100.0%) | 17,837 (100.0%) |
Household Vehicle Usage in Licking County
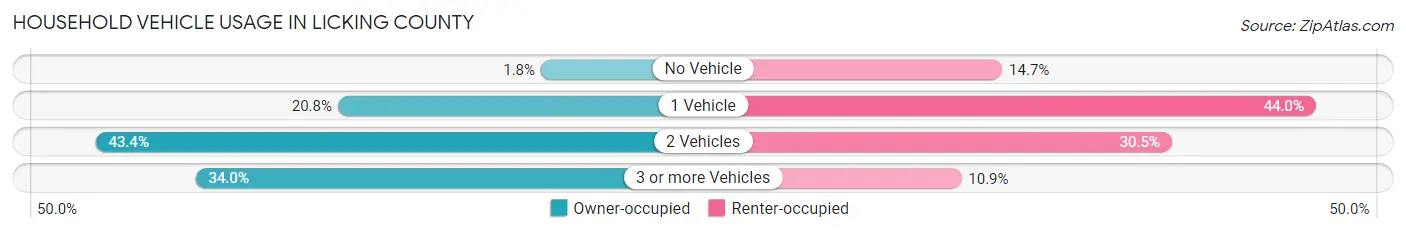
| Vehicles per Household | Owner-occupied | Renter-occupied |
| No Vehicle | 896 (1.8%) | 2,618 (14.7%) |
| 1 Vehicle | 10,257 (20.8%) | 7,840 (44.0%) |
| 2 Vehicles | 21,433 (43.4%) | 5,441 (30.5%) |
| 3 or more Vehicles | 16,816 (34.0%) | 1,938 (10.9%) |
| Total | 49,402 (100.0%) | 17,837 (100.0%) |
Real Estate & Mortgages in Licking County
Real Estate and Mortgage Overview in Licking County
| Characteristic | Without Mortgage | With Mortgage |
| Housing Units | 16,331 | 33,071 |
| Median Property Value | $203,900 | $243,700 |
| Median Household Income | $65,537 | $8,935 |
| Monthly Housing Costs | $577 | $2,443 |
| Real Estate Taxes | $2,669 | $556 |
Property Value by Mortgage Status in Licking County
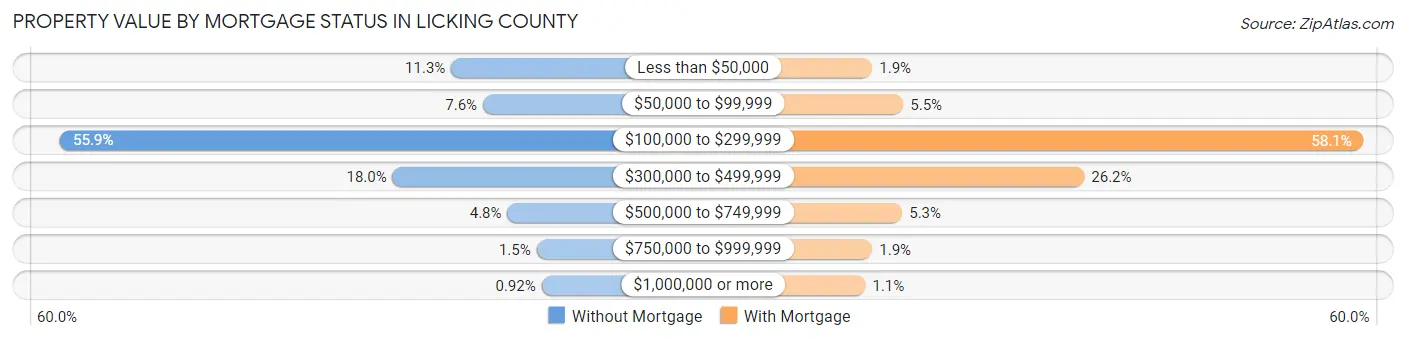
| Property Value | Without Mortgage | With Mortgage |
| Less than $50,000 | 1,838 (11.3%) | 636 (1.9%) |
| $50,000 to $99,999 | 1,244 (7.6%) | 1,806 (5.5%) |
| $100,000 to $299,999 | 9,136 (55.9%) | 19,201 (58.1%) |
| $300,000 to $499,999 | 2,931 (17.9%) | 8,649 (26.2%) |
| $500,000 to $749,999 | 789 (4.8%) | 1,767 (5.3%) |
| $750,000 to $999,999 | 243 (1.5%) | 634 (1.9%) |
| $1,000,000 or more | 150 (0.9%) | 378 (1.1%) |
| Total | 16,331 (100.0%) | 33,071 (100.0%) |
Household Income by Mortgage Status in Licking County
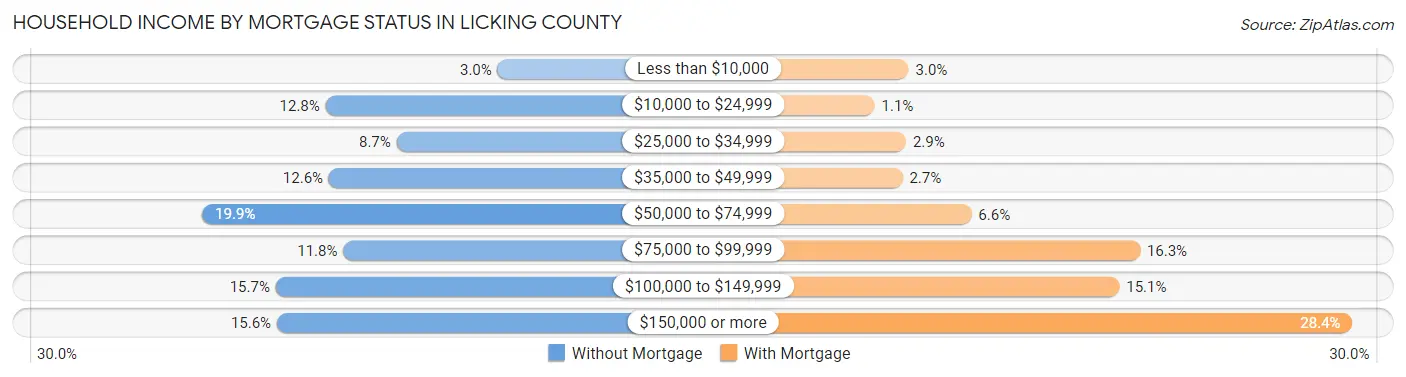
| Household Income | Without Mortgage | With Mortgage |
| Less than $10,000 | 485 (3.0%) | 1,003 (3.0%) |
| $10,000 to $24,999 | 2,091 (12.8%) | 360 (1.1%) |
| $25,000 to $34,999 | 1,427 (8.7%) | 954 (2.9%) |
| $35,000 to $49,999 | 2,059 (12.6%) | 885 (2.7%) |
| $50,000 to $74,999 | 3,243 (19.9%) | 2,190 (6.6%) |
| $75,000 to $99,999 | 1,925 (11.8%) | 5,375 (16.3%) |
| $100,000 to $149,999 | 2,556 (15.7%) | 4,984 (15.1%) |
| $150,000 or more | 2,545 (15.6%) | 9,388 (28.4%) |
| Total | 16,331 (100.0%) | 33,071 (100.0%) |
Property Value to Household Income Ratio in Licking County
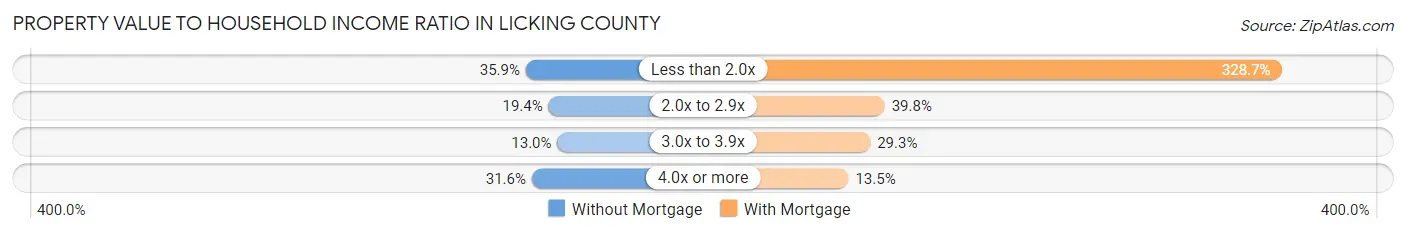
| Value-to-Income Ratio | Without Mortgage | With Mortgage |
| Less than 2.0x | 5,861 (35.9%) | 108,696 (328.7%) |
| 2.0x to 2.9x | 3,164 (19.4%) | 13,162 (39.8%) |
| 3.0x to 3.9x | 2,118 (13.0%) | 9,685 (29.3%) |
| 4.0x or more | 5,158 (31.6%) | 4,457 (13.5%) |
| Total | 16,331 (100.0%) | 33,071 (100.0%) |
Real Estate Taxes by Mortgage Status in Licking County
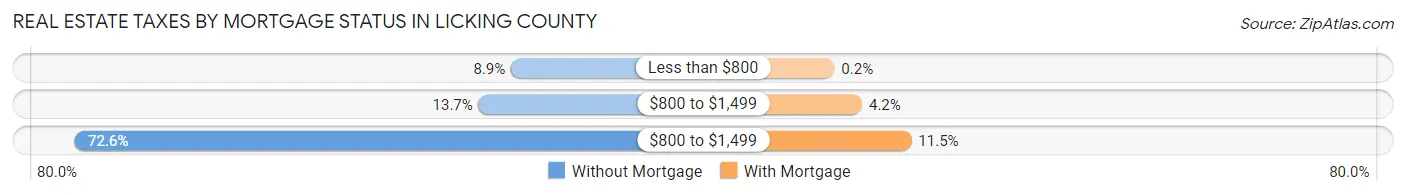
| Property Taxes | Without Mortgage | With Mortgage |
| Less than $800 | 1,457 (8.9%) | 65 (0.2%) |
| $800 to $1,499 | 2,230 (13.7%) | 1,401 (4.2%) |
| $800 to $1,499 | 11,860 (72.6%) | 3,786 (11.5%) |
| Total | 16,331 (100.0%) | 33,071 (100.0%) |
Health & Disability in Licking County
Health Insurance Coverage by Age in Licking County
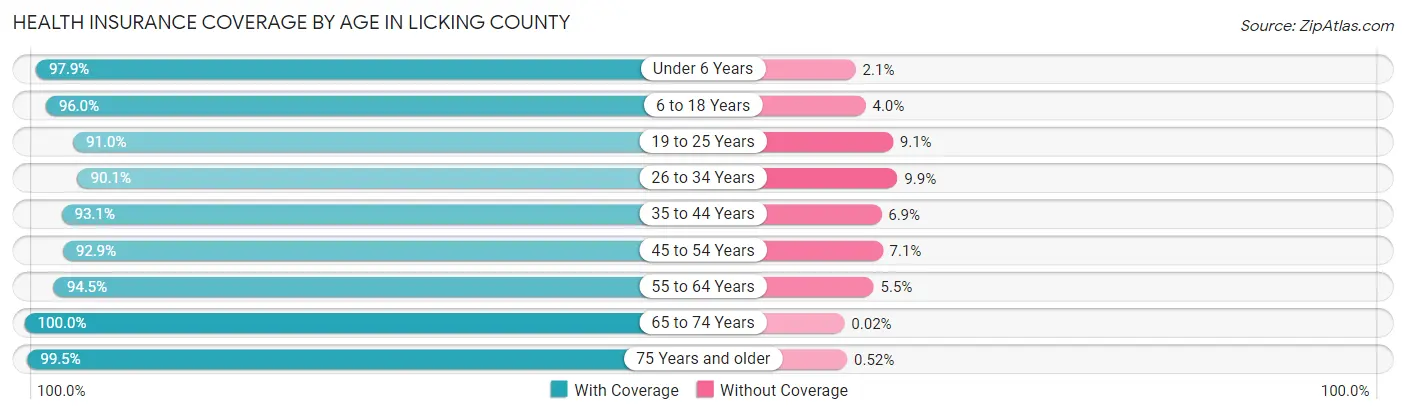
| Age Bracket | With Coverage | Without Coverage |
| Under 6 Years | 12,344 (97.9%) | 267 (2.1%) |
| 6 to 18 Years | 29,627 (96.0%) | 1,220 (4.0%) |
| 19 to 25 Years | 14,449 (90.9%) | 1,438 (9.0%) |
| 26 to 34 Years | 16,825 (90.1%) | 1,849 (9.9%) |
| 35 to 44 Years | 20,684 (93.1%) | 1,532 (6.9%) |
| 45 to 54 Years | 21,562 (92.9%) | 1,657 (7.1%) |
| 55 to 64 Years | 23,204 (94.5%) | 1,339 (5.5%) |
| 65 to 74 Years | 17,947 (100.0%) | 4 (0.0%) |
| 75 Years and older | 11,471 (99.5%) | 60 (0.5%) |
| Total | 168,113 (94.7%) | 9,366 (5.3%) |
Health Insurance Coverage by Citizenship Status in Licking County
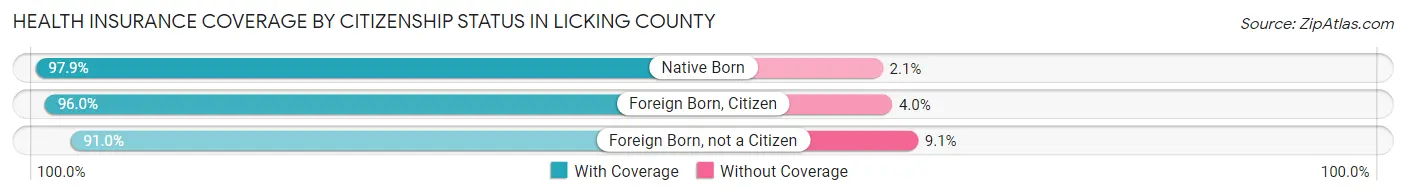
| Citizenship Status | With Coverage | Without Coverage |
| Native Born | 12,344 (97.9%) | 267 (2.1%) |
| Foreign Born, Citizen | 29,627 (96.0%) | 1,220 (4.0%) |
| Foreign Born, not a Citizen | 14,449 (90.9%) | 1,438 (9.0%) |
Health Insurance Coverage by Household Income in Licking County
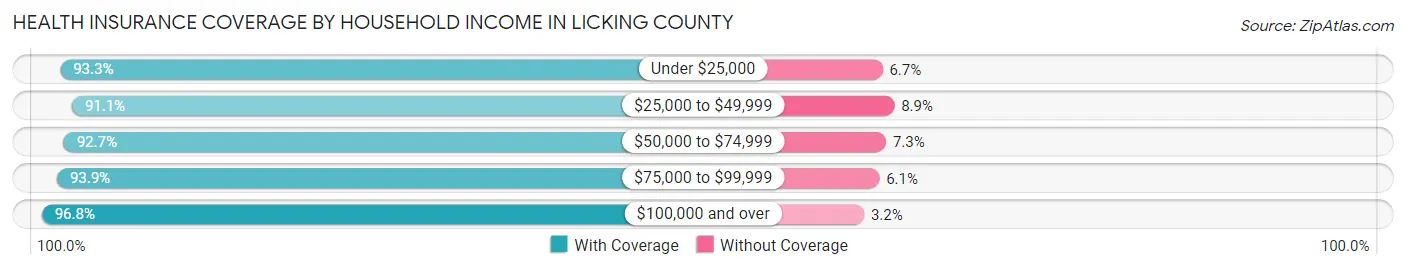
| Household Income | With Coverage | Without Coverage |
| Under $25,000 | 14,831 (93.3%) | 1,061 (6.7%) |
| $25,000 to $49,999 | 20,644 (91.1%) | 2,011 (8.9%) |
| $50,000 to $74,999 | 26,046 (92.7%) | 2,062 (7.3%) |
| $75,000 to $99,999 | 22,616 (93.9%) | 1,461 (6.1%) |
| $100,000 and over | 81,616 (96.8%) | 2,705 (3.2%) |
Public vs Private Health Insurance Coverage by Age in Licking County
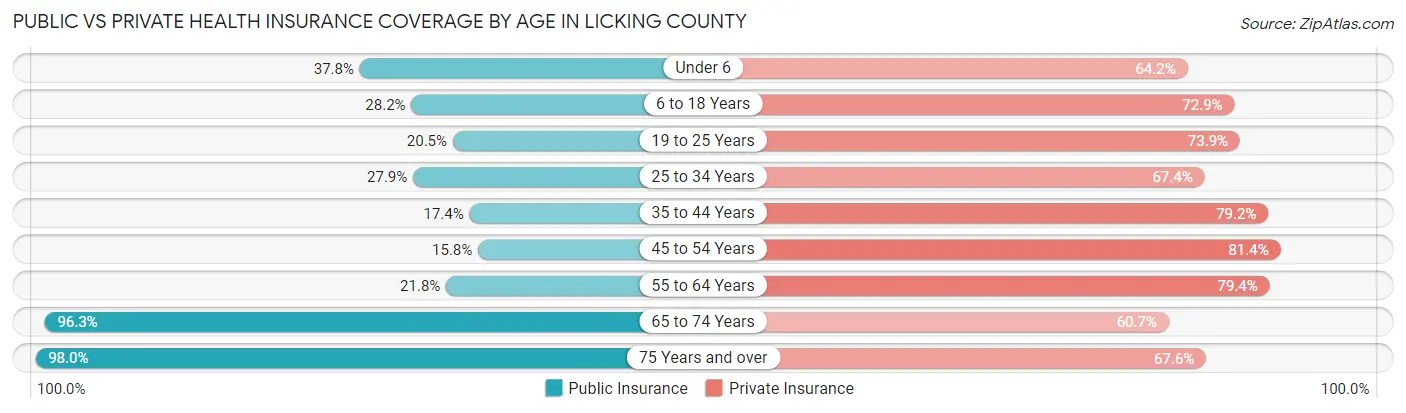
| Age Bracket | Public Insurance | Private Insurance |
| Under 6 | 4,766 (37.8%) | 8,092 (64.2%) |
| 6 to 18 Years | 8,699 (28.2%) | 22,478 (72.9%) |
| 19 to 25 Years | 3,259 (20.5%) | 11,739 (73.9%) |
| 25 to 34 Years | 5,208 (27.9%) | 12,577 (67.3%) |
| 35 to 44 Years | 3,867 (17.4%) | 17,583 (79.1%) |
| 45 to 54 Years | 3,673 (15.8%) | 18,905 (81.4%) |
| 55 to 64 Years | 5,337 (21.7%) | 19,486 (79.4%) |
| 65 to 74 Years | 17,288 (96.3%) | 10,893 (60.7%) |
| 75 Years and over | 11,303 (98.0%) | 7,797 (67.6%) |
| Total | 63,400 (35.7%) | 129,550 (73.0%) |
Disability Status by Sex by Age in Licking County
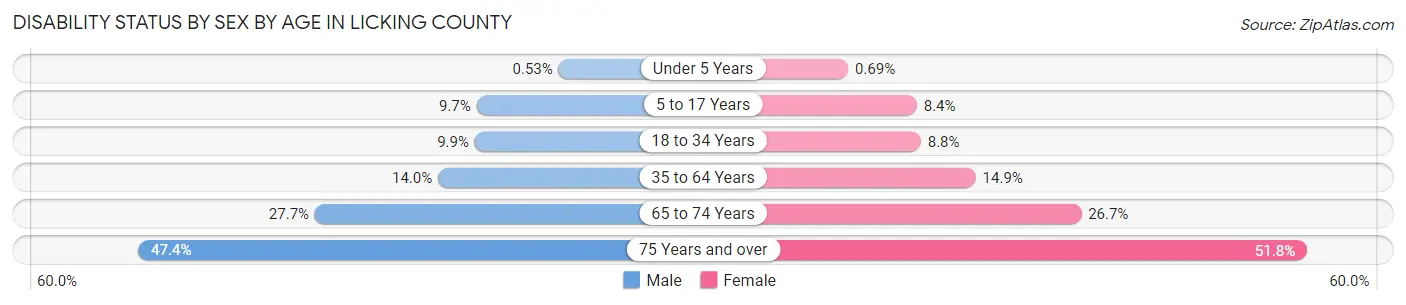
| Age Bracket | Male | Female |
| Under 5 Years | 28 (0.5%) | 35 (0.7%) |
| 5 to 17 Years | 1,521 (9.7%) | 1,240 (8.4%) |
| 18 to 34 Years | 1,833 (9.9%) | 1,622 (8.8%) |
| 35 to 64 Years | 4,860 (14.0%) | 5,244 (14.9%) |
| 65 to 74 Years | 2,359 (27.7%) | 2,512 (26.7%) |
| 75 Years and over | 2,354 (47.4%) | 3,400 (51.8%) |
Disability Class by Sex by Age in Licking County
Disability Class: Hearing Difficulty
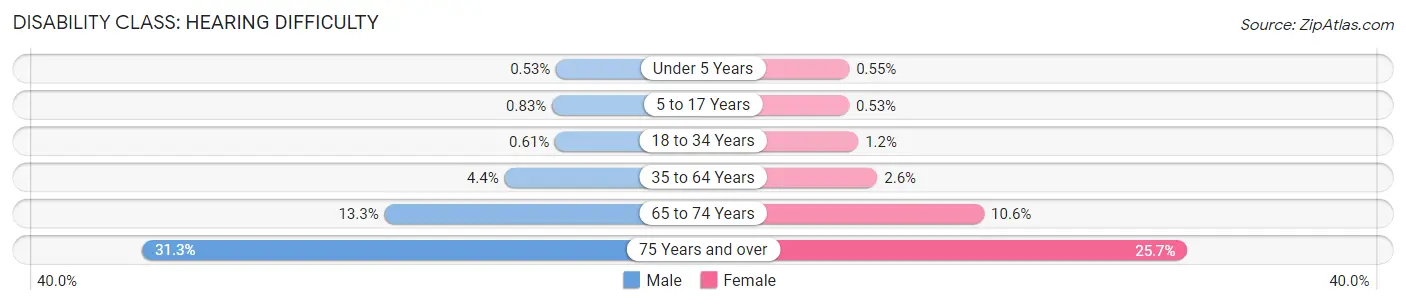
| Age Bracket | Male | Female |
| Under 5 Years | 28 (0.5%) | 28 (0.5%) |
| 5 to 17 Years | 131 (0.8%) | 79 (0.5%) |
| 18 to 34 Years | 113 (0.6%) | 225 (1.2%) |
| 35 to 64 Years | 1,521 (4.4%) | 930 (2.6%) |
| 65 to 74 Years | 1,132 (13.3%) | 996 (10.6%) |
| 75 Years and over | 1,554 (31.3%) | 1,683 (25.7%) |
Disability Class: Vision Difficulty
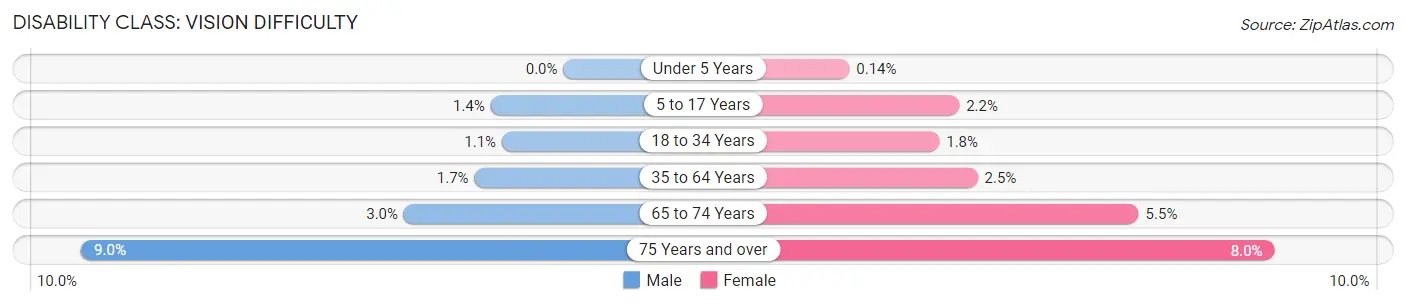
| Age Bracket | Male | Female |
| Under 5 Years | 0 (0.0%) | 7 (0.1%) |
| 5 to 17 Years | 212 (1.3%) | 324 (2.2%) |
| 18 to 34 Years | 212 (1.1%) | 333 (1.8%) |
| 35 to 64 Years | 573 (1.7%) | 887 (2.5%) |
| 65 to 74 Years | 252 (3.0%) | 519 (5.5%) |
| 75 Years and over | 445 (8.9%) | 527 (8.0%) |
Disability Class: Cognitive Difficulty
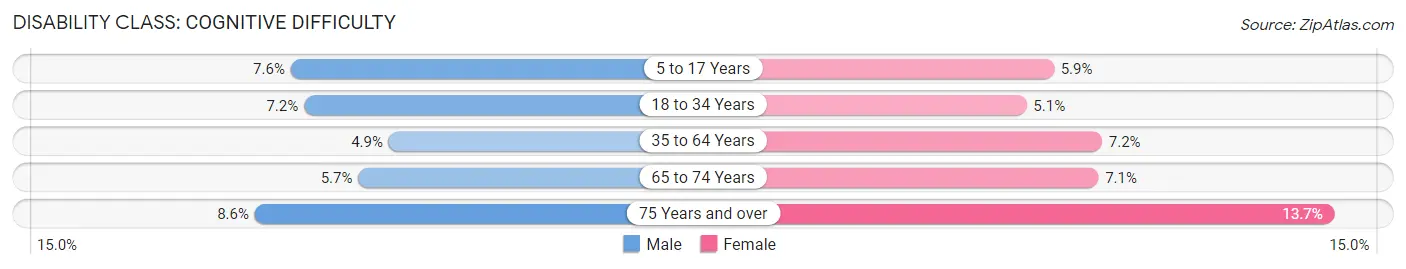
| Age Bracket | Male | Female |
| 5 to 17 Years | 1,196 (7.6%) | 877 (5.9%) |
| 18 to 34 Years | 1,342 (7.2%) | 947 (5.1%) |
| 35 to 64 Years | 1,691 (4.9%) | 2,545 (7.2%) |
| 65 to 74 Years | 487 (5.7%) | 673 (7.1%) |
| 75 Years and over | 427 (8.6%) | 900 (13.7%) |
Disability Class: Ambulatory Difficulty
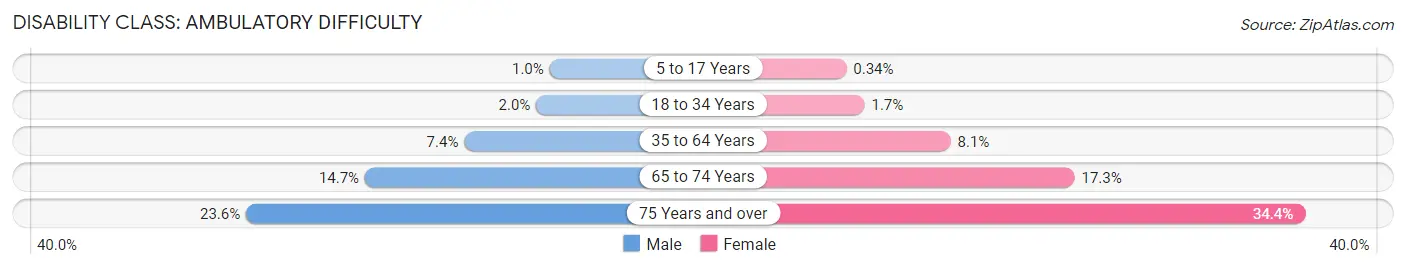
| Age Bracket | Male | Female |
| 5 to 17 Years | 160 (1.0%) | 50 (0.3%) |
| 18 to 34 Years | 376 (2.0%) | 311 (1.7%) |
| 35 to 64 Years | 2,563 (7.4%) | 2,842 (8.1%) |
| 65 to 74 Years | 1,256 (14.7%) | 1,628 (17.3%) |
| 75 Years and over | 1,171 (23.6%) | 2,256 (34.4%) |
Disability Class: Self-Care Difficulty
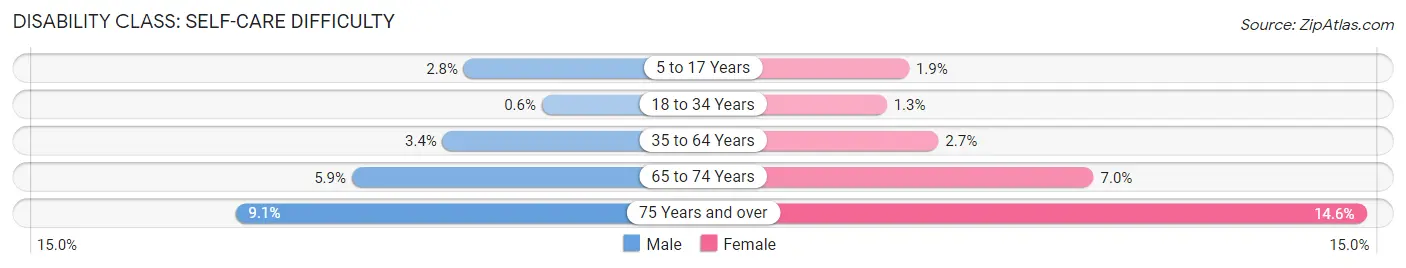
| Age Bracket | Male | Female |
| 5 to 17 Years | 437 (2.8%) | 278 (1.9%) |
| 18 to 34 Years | 111 (0.6%) | 231 (1.3%) |
| 35 to 64 Years | 1,170 (3.4%) | 945 (2.7%) |
| 65 to 74 Years | 502 (5.9%) | 661 (7.0%) |
| 75 Years and over | 454 (9.1%) | 958 (14.6%) |
Technology Access in Licking County
Computing Device Access in Licking County
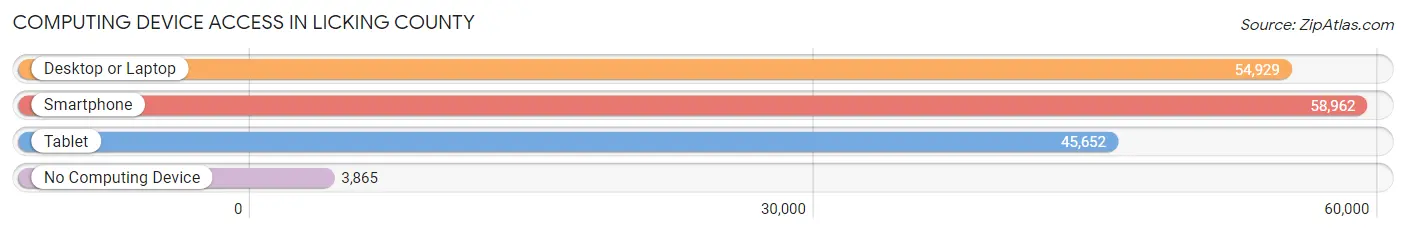
| Device Type | # Households | % Households |
| Desktop or Laptop | 54,929 | 81.7% |
| Smartphone | 58,962 | 87.7% |
| Tablet | 45,652 | 67.9% |
| No Computing Device | 3,865 | 5.8% |
| Total | 67,239 | 100.0% |
Internet Access in Licking County
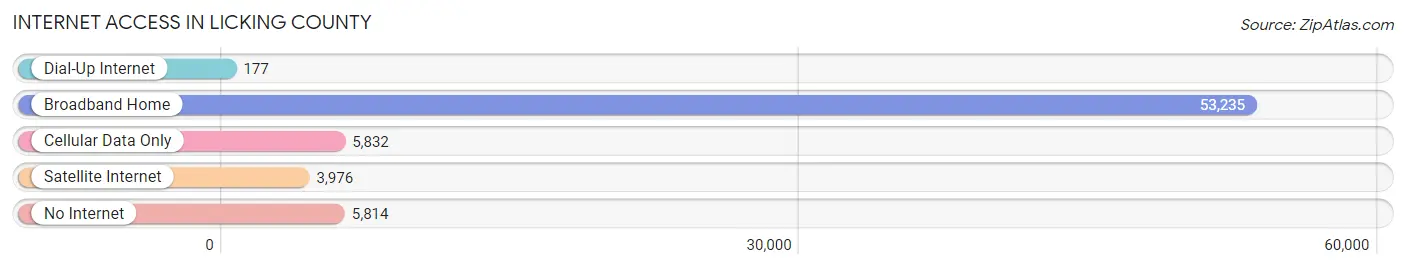
| Internet Type | # Households | % Households |
| Dial-Up Internet | 177 | 0.3% |
| Broadband Home | 53,235 | 79.2% |
| Cellular Data Only | 5,832 | 8.7% |
| Satellite Internet | 3,976 | 5.9% |
| No Internet | 5,814 | 8.6% |
| Total | 67,239 | 100.0% |
Licking County Summary
Licking County is located in the central part of the state of Ohio, in the United States. It is bordered by Muskingum County to the north, Perry County to the east, Fairfield County to the south, and Knox County to the west. The county seat is Newark, and the largest city is Heath. The county was established in 1808 and named for the salt licks that were found in the area.
Geography
Licking County covers an area of 576 square miles, making it the 33rd largest county in Ohio. The county is located in the Appalachian Plateau region of the state, and is characterized by rolling hills and valleys. The highest point in the county is located at the intersection of Licking and Muskingum counties, at an elevation of 1,092 feet. The county is drained by the Licking River, which flows through the county from north to south.
The county is home to several state parks, including Blackhand Gorge State Nature Preserve, Buckeye Lake State Park, and Dawes Arboretum. The county also contains several wildlife areas, including the Licking County Wildlife Area and the Licking River Wildlife Area.
Demographics
As of the 2010 census, the population of Licking County was 166,492, making it the 15th most populous county in Ohio. The population density was 288.3 people per square mile. The racial makeup of the county was 94.2% White, 2.7% African American, 0.4% Native American, 0.9% Asian, 0.2% Pacific Islander, 0.7% from other races, and 1.1% from two or more races. Hispanic or Latino of any race were 2.2% of the population.
The median household income in the county was $50,867, and the median family income was $60,936. The per capita income was $24,845. About 8.2% of the population was below the poverty line.
Economy
Licking County is home to several major employers, including Owens Corning, Denison University, and the Licking County government. The county is also home to several manufacturing companies, including the Newark Air Force Base, which is the largest employer in the county.
Agriculture is also an important part of the county's economy. The county is home to several farms, and the county's agricultural products include corn, soybeans, hay, and livestock.
The county is also home to several tourist attractions, including the Dawes Arboretum, the Licking County Historical Society, and the Licking County Museum.
Conclusion
Licking County is a diverse and vibrant county located in the central part of Ohio. The county is home to several major employers, and its economy is supported by agriculture, manufacturing, and tourism. The county is also home to several state parks and wildlife areas, making it a popular destination for outdoor recreation.
Common Questions
What is the Total Population of Licking County?
Total Population of Licking County is 178,844.
What is the Total Male Population of Licking County?
Total Male Population of Licking County is 88,628.
What is the Total Female Population of Licking County?
Total Female Population of Licking County is 90,216.
What is the Ratio of Males per 100 Females in Licking County?
There are 98.24 Males per 100 Females in Licking County.
What is the Ratio of Females per 100 Males in Licking County?
There are 101.79 Females per 100 Males in Licking County.
What is the Median Population Age in Licking County?
Median Population Age in Licking County is 40.2 Years.
What is the Average Family Size in Licking County
Average Family Size in Licking County is 3.1 People.
What is the Average Household Size in Licking County
Average Household Size in Licking County is 2.6 People.
What is Per Capita Income in Licking County?
Per Capita income in Licking County is $39,760.
What is the Median Family Income in Licking County?
Median Family Income in Licking County is $96,410.
What is the Median Household income in Licking County?
Median Household Income in Licking County is $78,505.
What is Income or Wage Gap in Licking County?
Income or Wage Gap in Licking County is 29.7%.
Women in Licking County earn 70.3 cents for every dollar earned by a man.
What is Family Income Deficit in Licking County?
Family Income Deficit in Licking County is $10,630.
Families that are below poverty line in Licking County earn $10,630 less on average than the poverty threshold level.
What is Inequality or Gini Index in Licking County?
Inequality or Gini Index in Licking County is 0.45.
How Large is the Labor Force in Licking County?
There are 90,033 People in the Labor Forcein in Licking County.
What is the Percentage of People in the Labor Force in Licking County?
63.2% of People are in the Labor Force in Licking County.
What is the Unemployment Rate in Licking County?
Unemployment Rate in Licking County is 3.3%.