Lake County, OH
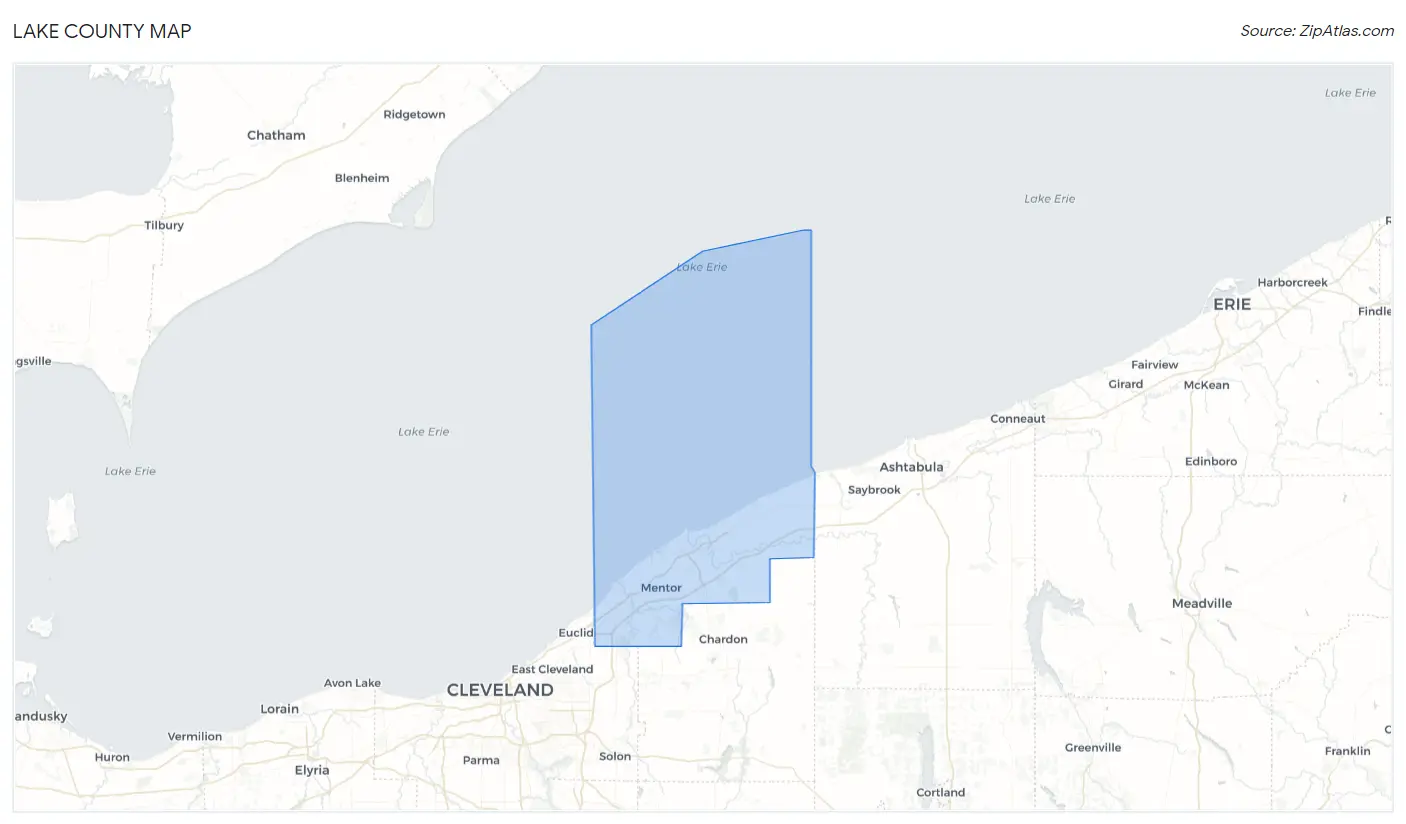
Lake County Map
Lake County Overview
232,236
TOTAL POPULATION
114,317
MALE POPULATION
117,919
FEMALE POPULATION
96.95
MALES / 100 FEMALES
103.15
FEMALES / 100 MALES
43.9
MEDIAN AGE
2.9
AVG FAMILY SIZE
2.3
AVG HOUSEHOLD SIZE
$41,195
PER CAPITA INCOME
$98,576
AVG FAMILY INCOME
$76,835
AVG HOUSEHOLD INCOME
27.3%
WAGE / INCOME GAP [ % ]
72.7¢/ $1
WAGE / INCOME GAP [ $ ]
$8,517
FAMILY INCOME DEFICIT
0.42
INEQUALITY / GINI INDEX
126,064
LABOR FORCE [ PEOPLE ]
65.4%
PERCENT IN LABOR FORCE
4.4%
UNEMPLOYMENT RATE
Lake County Area Codes
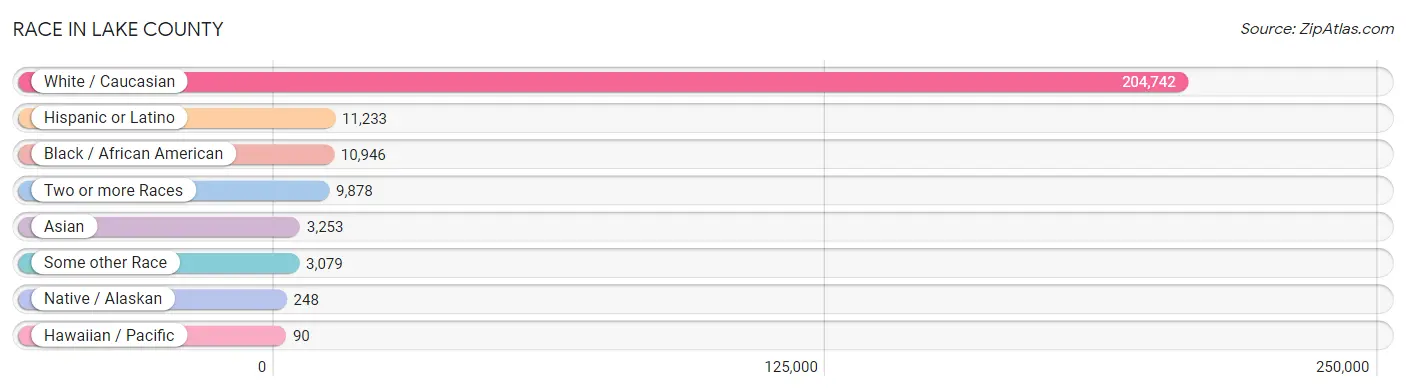
Race in Lake County
The most populous races in Lake County are White / Caucasian (204,742 | 88.2%), Hispanic or Latino (11,233 | 4.8%), and Black / African American (10,946 | 4.7%).
| Race | # Population | % Population |
| Asian | 3,253 | 1.4% |
| Black / African American | 10,946 | 4.7% |
| Hawaiian / Pacific | 90 | 0.0% |
| Hispanic or Latino | 11,233 | 4.8% |
| Native / Alaskan | 248 | 0.1% |
| White / Caucasian | 204,742 | 88.2% |
| Two or more Races | 9,878 | 4.3% |
| Some other Race | 3,079 | 1.3% |
| Total | 232,236 | 100.0% |
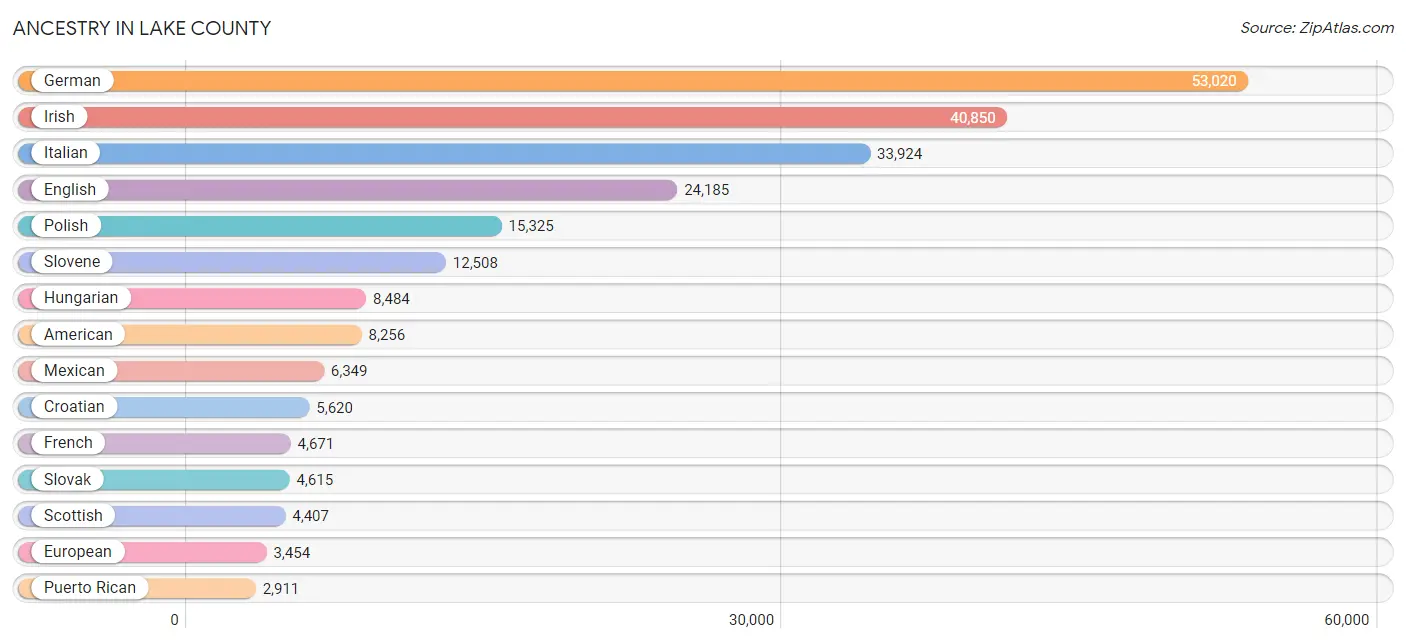
Ancestry in Lake County
The most populous ancestries reported in Lake County are German (53,020 | 22.8%), Irish (40,850 | 17.6%), Italian (33,924 | 14.6%), English (24,185 | 10.4%), and Polish (15,325 | 6.6%), together accounting for 72.0% of all Lake County residents.
| Ancestry | # Population | % Population |
| African | 687 | 0.3% |
| Alaska Native | 31 | 0.0% |
| Albanian | 356 | 0.2% |
| American | 8,256 | 3.6% |
| Apache | 44 | 0.0% |
| Arab | 937 | 0.4% |
| Argentinean | 151 | 0.1% |
| Armenian | 399 | 0.2% |
| Assyrian / Chaldean / Syriac | 26 | 0.0% |
| Australian | 30 | 0.0% |
| Austrian | 801 | 0.3% |
| Bangladeshi | 40 | 0.0% |
| Belgian | 150 | 0.1% |
| Bhutanese | 296 | 0.1% |
| Blackfeet | 197 | 0.1% |
| Bolivian | 7 | 0.0% |
| Brazilian | 99 | 0.0% |
| British | 1,457 | 0.6% |
| Bulgarian | 67 | 0.0% |
| Burmese | 421 | 0.2% |
| Cambodian | 22 | 0.0% |
| Canadian | 386 | 0.2% |
| Carpatho Rusyn | 17 | 0.0% |
| Celtic | 61 | 0.0% |
| Central American | 313 | 0.1% |
| Central American Indian | 89 | 0.0% |
| Cherokee | 309 | 0.1% |
| Chickasaw | 20 | 0.0% |
| Chilean | 94 | 0.0% |
| Chippewa | 10 | 0.0% |
| Choctaw | 4 | 0.0% |
| Colombian | 176 | 0.1% |
| Creek | 44 | 0.0% |
| Croatian | 5,620 | 2.4% |
| Crow | 5 | 0.0% |
| Cuban | 58 | 0.0% |
| Czech | 2,213 | 0.9% |
| Czechoslovakian | 421 | 0.2% |
| Danish | 459 | 0.2% |
| Dominican | 94 | 0.0% |
| Dutch | 2,207 | 0.9% |
| Eastern European | 1,539 | 0.7% |
| Egyptian | 18 | 0.0% |
| English | 24,185 | 10.4% |
| Estonian | 31 | 0.0% |
| European | 3,454 | 1.5% |
| Fijian | 22 | 0.0% |
| Filipino | 8 | 0.0% |
| Finnish | 1,967 | 0.9% |
| French | 4,671 | 2.0% |
| French Canadian | 420 | 0.2% |
| German | 53,020 | 22.8% |
| Greek | 896 | 0.4% |
| Guamanian / Chamorro | 31 | 0.0% |
| Guatemalan | 86 | 0.0% |
| Guyanese | 60 | 0.0% |
| Honduran | 155 | 0.1% |
| Hungarian | 8,484 | 3.6% |
| Icelander | 19 | 0.0% |
| Indian (Asian) | 748 | 0.3% |
| Inupiat | 6 | 0.0% |
| Iranian | 126 | 0.1% |
| Irish | 40,850 | 17.6% |
| Iroquois | 97 | 0.0% |
| Israeli | 17 | 0.0% |
| Italian | 33,924 | 14.6% |
| Jamaican | 73 | 0.0% |
| Japanese | 46 | 0.0% |
| Jordanian | 6 | 0.0% |
| Kenyan | 93 | 0.0% |
| Korean | 621 | 0.3% |
| Latvian | 89 | 0.0% |
| Lebanese | 664 | 0.3% |
| Lithuanian | 1,911 | 0.8% |
| Luxembourger | 6 | 0.0% |
| Macedonian | 136 | 0.1% |
| Malaysian | 10 | 0.0% |
| Mexican | 6,349 | 2.7% |
| Mexican American Indian | 81 | 0.0% |
| Native Hawaiian | 10 | 0.0% |
| Navajo | 11 | 0.0% |
| New Zealander | 12 | 0.0% |
| Nicaraguan | 39 | 0.0% |
| Nigerian | 151 | 0.1% |
| Northern European | 110 | 0.1% |
| Norwegian | 808 | 0.4% |
| Ottawa | 98 | 0.0% |
| Pakistani | 21 | 0.0% |
| Palestinian | 6 | 0.0% |
| Paraguayan | 12 | 0.0% |
| Pennsylvania German | 132 | 0.1% |
| Peruvian | 116 | 0.1% |
| Polish | 15,325 | 6.6% |
| Portuguese | 301 | 0.1% |
| Pueblo | 11 | 0.0% |
| Puerto Rican | 2,911 | 1.3% |
| Romanian | 546 | 0.2% |
| Russian | 2,158 | 0.9% |
| Salvadoran | 33 | 0.0% |
| Samoan | 8 | 0.0% |
| Scandinavian | 591 | 0.3% |
| Scotch-Irish | 1,948 | 0.8% |
| Scottish | 4,407 | 1.9% |
| Serbian | 307 | 0.1% |
| Sioux | 15 | 0.0% |
| Slavic | 484 | 0.2% |
| Slovak | 4,615 | 2.0% |
| Slovene | 12,508 | 5.4% |
| Somali | 30 | 0.0% |
| South African | 7 | 0.0% |
| South American | 966 | 0.4% |
| Spaniard | 224 | 0.1% |
| Spanish | 88 | 0.0% |
| Sri Lankan | 493 | 0.2% |
| Subsaharan African | 1,126 | 0.5% |
| Swedish | 2,249 | 1.0% |
| Swiss | 761 | 0.3% |
| Syrian | 59 | 0.0% |
| Thai | 1,679 | 0.7% |
| Turkish | 9 | 0.0% |
| Ukrainian | 1,373 | 0.6% |
| Venezuelan | 410 | 0.2% |
| Welsh | 2,683 | 1.2% |
| West Indian | 5 | 0.0% |
| Yugoslavian | 666 | 0.3% | View All 125 Rows |
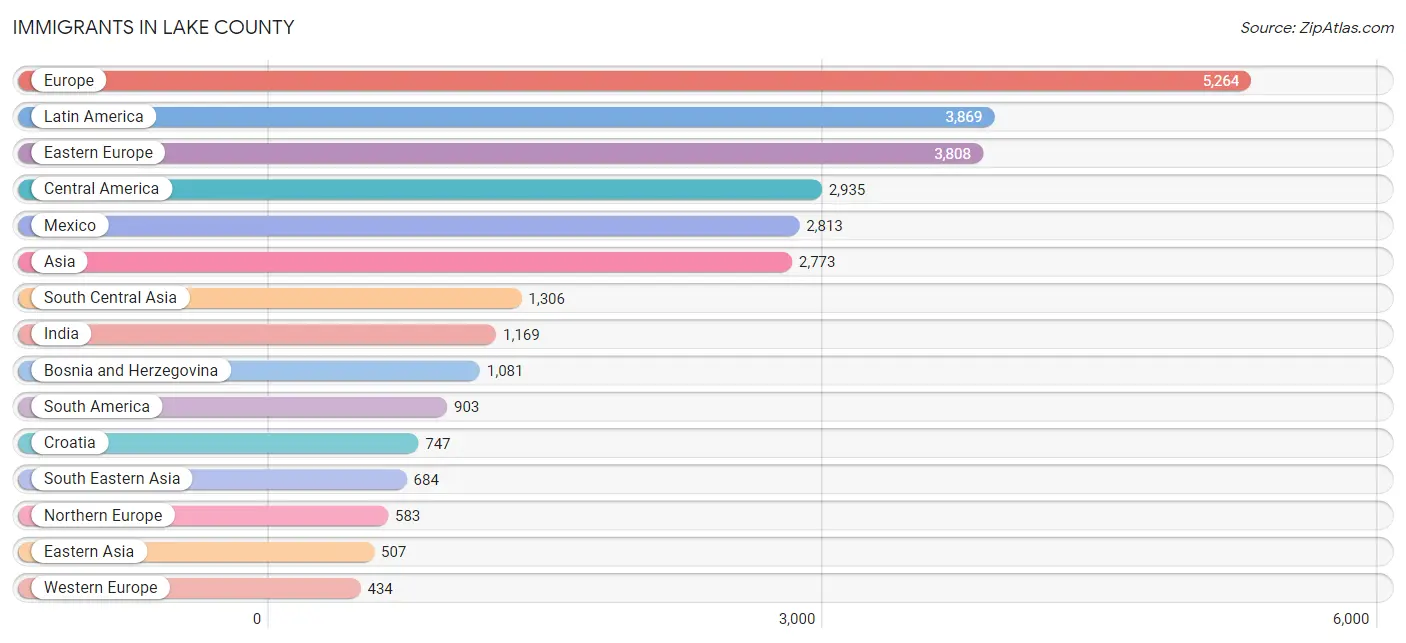
Immigrants in Lake County
The most numerous immigrant groups reported in Lake County came from Europe (5,264 | 2.3%), Latin America (3,869 | 1.7%), Eastern Europe (3,808 | 1.6%), Central America (2,935 | 1.3%), and Mexico (2,813 | 1.2%), together accounting for 8.1% of all Lake County residents.
| Immigration Origin | # Population | % Population |
| Africa | 409 | 0.2% |
| Albania | 209 | 0.1% |
| Argentina | 91 | 0.0% |
| Armenia | 99 | 0.0% |
| Asia | 2,773 | 1.2% |
| Australia | 9 | 0.0% |
| Austria | 67 | 0.0% |
| Bolivia | 7 | 0.0% |
| Bosnia and Herzegovina | 1,081 | 0.5% |
| Brazil | 319 | 0.1% |
| Cambodia | 37 | 0.0% |
| Cameroon | 162 | 0.1% |
| Canada | 291 | 0.1% |
| Caribbean | 31 | 0.0% |
| Central America | 2,935 | 1.3% |
| China | 386 | 0.2% |
| Colombia | 133 | 0.1% |
| Croatia | 747 | 0.3% |
| Cuba | 6 | 0.0% |
| Czechoslovakia | 28 | 0.0% |
| Denmark | 9 | 0.0% |
| Eastern Africa | 132 | 0.1% |
| Eastern Asia | 507 | 0.2% |
| Eastern Europe | 3,808 | 1.6% |
| Ecuador | 14 | 0.0% |
| El Salvador | 27 | 0.0% |
| England | 212 | 0.1% |
| Europe | 5,264 | 2.3% |
| France | 65 | 0.0% |
| Germany | 254 | 0.1% |
| Ghana | 9 | 0.0% |
| Greece | 46 | 0.0% |
| Guatemala | 47 | 0.0% |
| Guyana | 25 | 0.0% |
| Honduras | 48 | 0.0% |
| Hong Kong | 75 | 0.0% |
| Hungary | 103 | 0.0% |
| India | 1,169 | 0.5% |
| Iran | 92 | 0.0% |
| Ireland | 85 | 0.0% |
| Italy | 353 | 0.2% |
| Jamaica | 25 | 0.0% |
| Kenya | 118 | 0.1% |
| Korea | 121 | 0.1% |
| Kuwait | 6 | 0.0% |
| Laos | 10 | 0.0% |
| Latin America | 3,869 | 1.7% |
| Latvia | 20 | 0.0% |
| Lebanon | 50 | 0.0% |
| Lithuania | 84 | 0.0% |
| Mexico | 2,813 | 1.2% |
| Middle Africa | 162 | 0.1% |
| Moldova | 117 | 0.1% |
| Nepal | 40 | 0.0% |
| Netherlands | 48 | 0.0% |
| Nigeria | 4 | 0.0% |
| North Macedonia | 72 | 0.0% |
| Northern Europe | 583 | 0.3% |
| Norway | 24 | 0.0% |
| Oceania | 37 | 0.0% |
| Pakistan | 2 | 0.0% |
| Peru | 116 | 0.1% |
| Philippines | 293 | 0.1% |
| Poland | 164 | 0.1% |
| Romania | 128 | 0.1% |
| Russia | 215 | 0.1% |
| Saudi Arabia | 26 | 0.0% |
| Scotland | 23 | 0.0% |
| Serbia | 13 | 0.0% |
| Sierra Leone | 32 | 0.0% |
| South Africa | 18 | 0.0% |
| South America | 903 | 0.4% |
| South Central Asia | 1,306 | 0.6% |
| South Eastern Asia | 684 | 0.3% |
| Southern Europe | 408 | 0.2% |
| Spain | 9 | 0.0% |
| Sweden | 10 | 0.0% |
| Syria | 17 | 0.0% |
| Taiwan | 54 | 0.0% |
| Thailand | 26 | 0.0% |
| Turkey | 9 | 0.0% |
| Ukraine | 317 | 0.1% |
| Uzbekistan | 3 | 0.0% |
| Venezuela | 198 | 0.1% |
| Vietnam | 311 | 0.1% |
| Western Africa | 71 | 0.0% |
| Western Asia | 219 | 0.1% |
| Western Europe | 434 | 0.2% | View All 88 Rows |
Sex and Age in Lake County
Sex and Age in Lake County
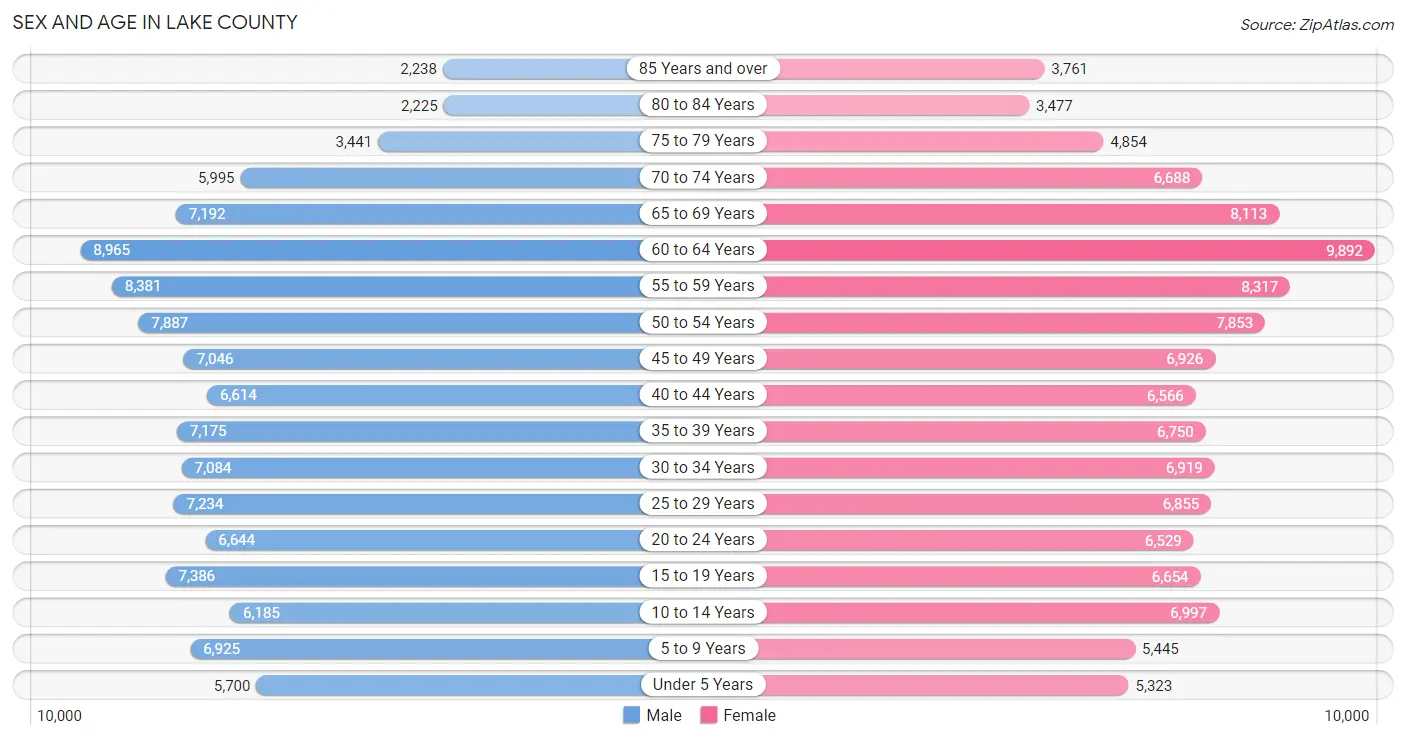
The most populous age groups in Lake County are 60 to 64 Years (8,965 | 7.8%) for men and 60 to 64 Years (9,892 | 8.4%) for women.
| Age Bracket | Male | Female |
| Under 5 Years | 5,700 (5.0%) | 5,323 (4.5%) |
| 5 to 9 Years | 6,925 (6.1%) | 5,445 (4.6%) |
| 10 to 14 Years | 6,185 (5.4%) | 6,997 (5.9%) |
| 15 to 19 Years | 7,386 (6.5%) | 6,654 (5.6%) |
| 20 to 24 Years | 6,644 (5.8%) | 6,529 (5.5%) |
| 25 to 29 Years | 7,234 (6.3%) | 6,855 (5.8%) |
| 30 to 34 Years | 7,084 (6.2%) | 6,919 (5.9%) |
| 35 to 39 Years | 7,175 (6.3%) | 6,750 (5.7%) |
| 40 to 44 Years | 6,614 (5.8%) | 6,566 (5.6%) |
| 45 to 49 Years | 7,046 (6.2%) | 6,926 (5.9%) |
| 50 to 54 Years | 7,887 (6.9%) | 7,853 (6.7%) |
| 55 to 59 Years | 8,381 (7.3%) | 8,317 (7.0%) |
| 60 to 64 Years | 8,965 (7.8%) | 9,892 (8.4%) |
| 65 to 69 Years | 7,192 (6.3%) | 8,113 (6.9%) |
| 70 to 74 Years | 5,995 (5.2%) | 6,688 (5.7%) |
| 75 to 79 Years | 3,441 (3.0%) | 4,854 (4.1%) |
| 80 to 84 Years | 2,225 (1.9%) | 3,477 (2.9%) |
| 85 Years and over | 2,238 (2.0%) | 3,761 (3.2%) |
| Total | 114,317 (100.0%) | 117,919 (100.0%) |
Families and Households in Lake County
Median Family Size in Lake County
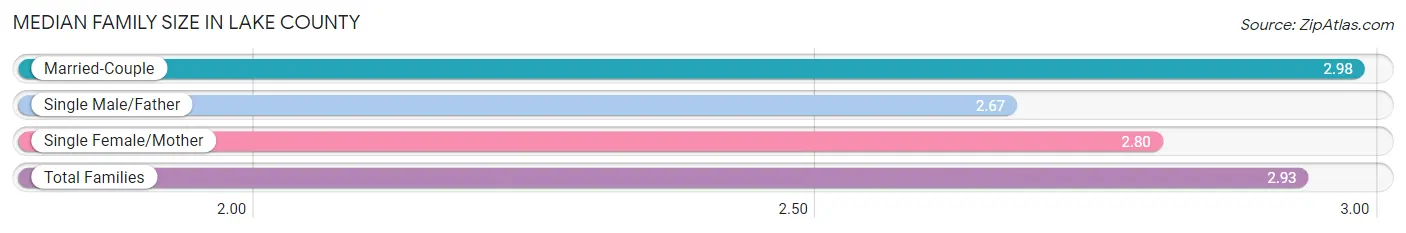
The median family size in Lake County is 2.93 persons per family, with married-couple families (46,064 | 75.7%) accounting for the largest median family size of 2.98 persons per family. On the other hand, single male/father families (4,172 | 6.9%) represent the smallest median family size with 2.67 persons per family.
| Family Type | # Families | Family Size |
| Married-Couple | 46,064 (75.7%) | 2.98 |
| Single Male/Father | 4,172 (6.9%) | 2.67 |
| Single Female/Mother | 10,606 (17.4%) | 2.80 |
| Total Families | 60,842 (100.0%) | 2.93 |
Median Household Size in Lake County
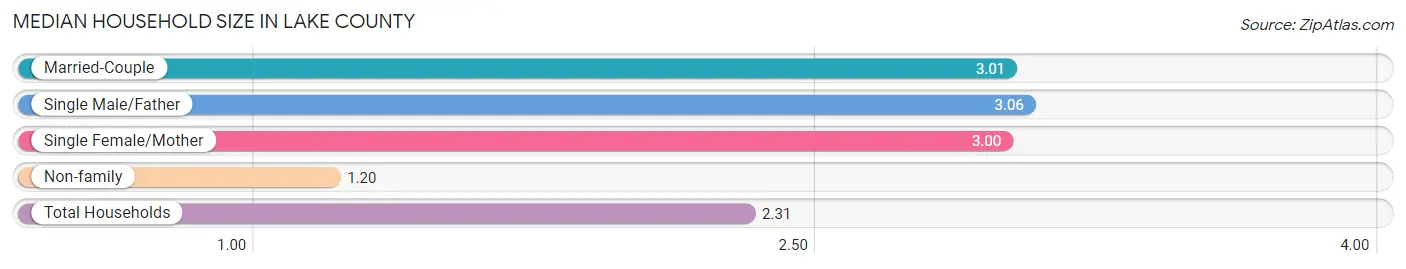
The median household size in Lake County is 2.31 persons per household, with single male/father households (4,172 | 4.2%) accounting for the largest median household size of 3.06 persons per household. non-family households (38,482 | 38.7%) represent the smallest median household size with 1.20 persons per household.
| Household Type | # Households | Household Size |
| Married-Couple | 46,064 (46.4%) | 3.01 |
| Single Male/Father | 4,172 (4.2%) | 3.06 |
| Single Female/Mother | 10,606 (10.7%) | 3.00 |
| Non-family | 38,482 (38.7%) | 1.20 |
| Total Households | 99,324 (100.0%) | 2.31 |
Household Size by Marriage Status in Lake County
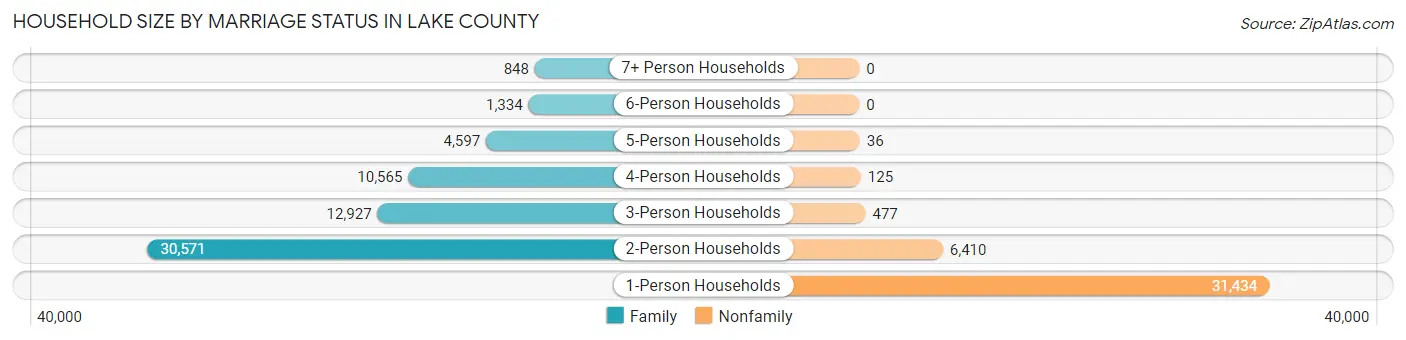
Out of a total of 99,324 households in Lake County, 60,842 (61.3%) are family households, while 38,482 (38.7%) are nonfamily households. The most numerous type of family households are 2-person households, comprising 30,571, and the most common type of nonfamily households are 1-person households, comprising 31,434.
| Household Size | Family Households | Nonfamily Households |
| 1-Person Households | - | 31,434 (31.7%) |
| 2-Person Households | 30,571 (30.8%) | 6,410 (6.5%) |
| 3-Person Households | 12,927 (13.0%) | 477 (0.5%) |
| 4-Person Households | 10,565 (10.6%) | 125 (0.1%) |
| 5-Person Households | 4,597 (4.6%) | 36 (0.0%) |
| 6-Person Households | 1,334 (1.3%) | 0 (0.0%) |
| 7+ Person Households | 848 (0.9%) | 0 (0.0%) |
| Total | 60,842 (61.3%) | 38,482 (38.7%) |
Female Fertility in Lake County
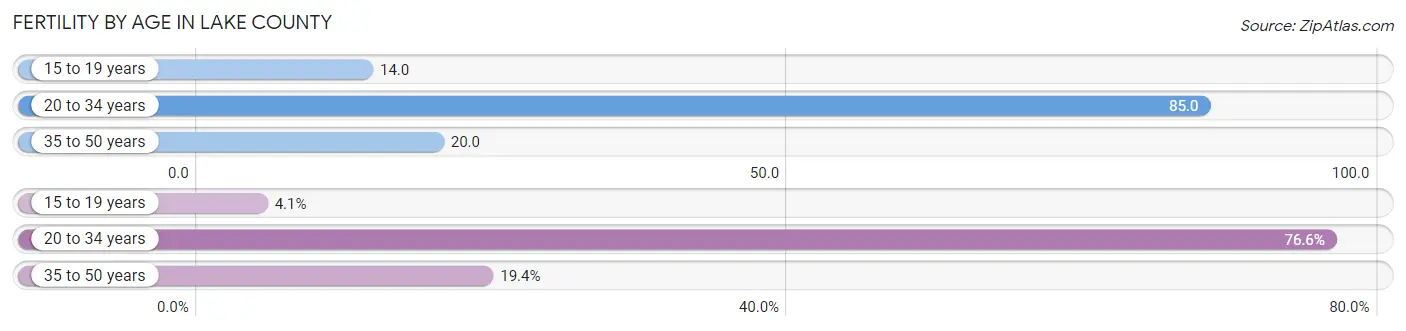
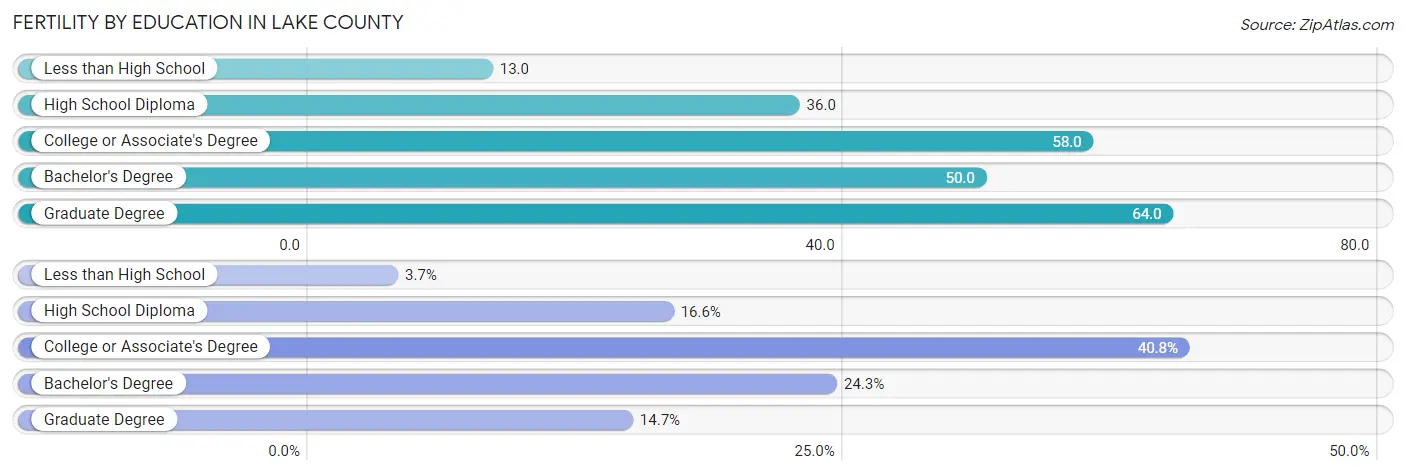
Fertility by Age in Lake County
Average fertility rate in Lake County is 46.0 births per 1,000 women. Women in the age bracket of 20 to 34 years have the highest fertility rate with 85.0 births per 1,000 women. Women in the age bracket of 20 to 34 years acount for 76.6% of all women with births.
| Age Bracket | Women with Births | Births / 1,000 Women |
| 15 to 19 years | 91 (4.1%) | 14.0 |
| 20 to 34 years | 1,721 (76.6%) | 85.0 |
| 35 to 50 years | 435 (19.4%) | 20.0 |
| Total | 2,247 (100.0%) | 46.0 |
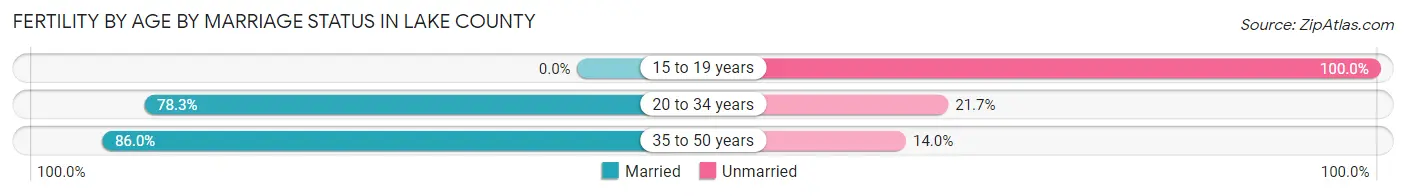
Fertility by Age by Marriage Status in Lake County
76.6% of women with births (2,247) in Lake County are married. The highest percentage of unmarried women with births falls into 15 to 19 years age bracket with 100.0% of them unmarried at the time of birth, while the lowest percentage of unmarried women with births belong to 35 to 50 years age bracket with 14.0% of them unmarried.
| Age Bracket | Married | Unmarried |
| 15 to 19 years | 0 (0.0%) | 91 (100.0%) |
| 20 to 34 years | 1,348 (78.3%) | 373 (21.7%) |
| 35 to 50 years | 374 (86.0%) | 61 (14.0%) |
| Total | 1,721 (76.6%) | 526 (23.4%) |
Fertility by Education in Lake County
Average fertility rate in Lake County is 46.0 births per 1,000 women. Women with the education attainment of graduate degree have the highest fertility rate of 64.0 births per 1,000 women, while women with the education attainment of less than high school have the lowest fertility at 13.0 births per 1,000 women. Women with the education attainment of college or associate's degree represent 40.8% of all women with births.
| Educational Attainment | Women with Births | Births / 1,000 Women |
| Less than High School | 83 (3.7%) | 13.0 |
| High School Diploma | 373 (16.6%) | 36.0 |
| College or Associate's Degree | 916 (40.8%) | 58.0 |
| Bachelor's Degree | 545 (24.2%) | 50.0 |
| Graduate Degree | 330 (14.7%) | 64.0 |
| Total | 2,247 (100.0%) | 46.0 |
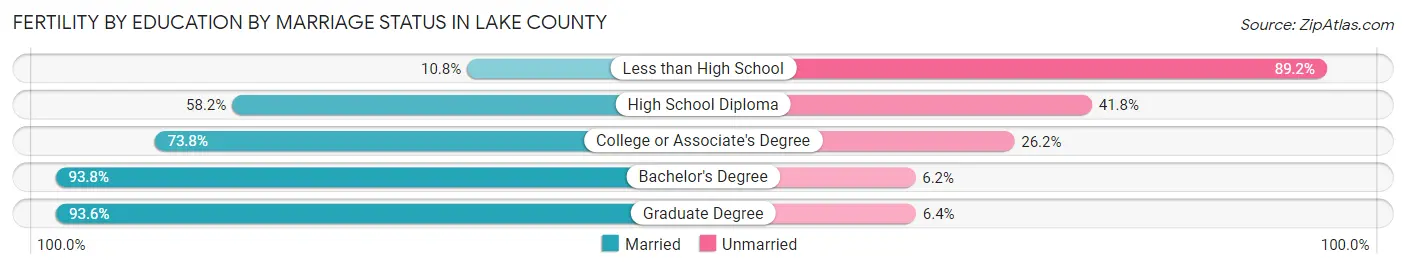
Fertility by Education by Marriage Status in Lake County
23.4% of women with births in Lake County are unmarried. Women with the educational attainment of bachelor's degree are most likely to be married with 93.8% of them married at childbirth, while women with the educational attainment of less than high school are least likely to be married with 89.2% of them unmarried at childbirth.
| Educational Attainment | Married | Unmarried |
| Less than High School | 9 (10.8%) | 74 (89.2%) |
| High School Diploma | 217 (58.2%) | 156 (41.8%) |
| College or Associate's Degree | 676 (73.8%) | 240 (26.2%) |
| Bachelor's Degree | 511 (93.8%) | 34 (6.2%) |
| Graduate Degree | 309 (93.6%) | 21 (6.4%) |
| Total | 1,721 (76.6%) | 526 (23.4%) |
Income in Lake County
Income Overview in Lake County
Per Capita Income in Lake County is $41,195, while median incomes of families and households are $98,576 and $76,835 respectively.
| Characteristic | Number | Measure |
| Per Capita Income | 232,236 | $41,195 |
| Median Family Income | 60,842 | $98,576 |
| Mean Family Income | 60,842 | $116,693 |
| Median Household Income | 99,324 | $76,835 |
| Mean Household Income | 99,324 | $95,217 |
| Income Deficit | 60,842 | $8,517 |
| Wage / Income Gap (%) | 232,236 | 27.35% |
| Wage / Income Gap ($) | 232,236 | 72.65¢ per $1 |
| Gini / Inequality Index | 232,236 | 0.42 |
Earnings by Sex in Lake County
Average Earnings in Lake County are $44,979, $51,875 for men and $37,688 for women, a difference of 27.4%.
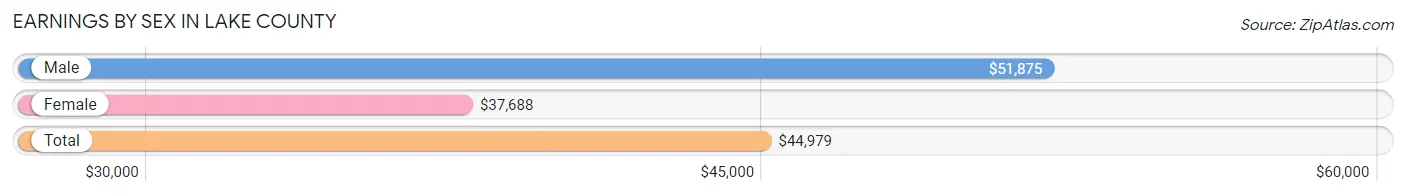
| Sex | Number | Average Earnings |
| Male | 68,583 (52.2%) | $51,875 |
| Female | 62,689 (47.8%) | $37,688 |
| Total | 131,272 (100.0%) | $44,979 |
Earnings by Sex by Income Bracket in Lake County
The most common earnings brackets in Lake County are $100,000+ for men (10,607 | 15.5%) and $75,000 to $99,999 for women (6,223 | 9.9%).
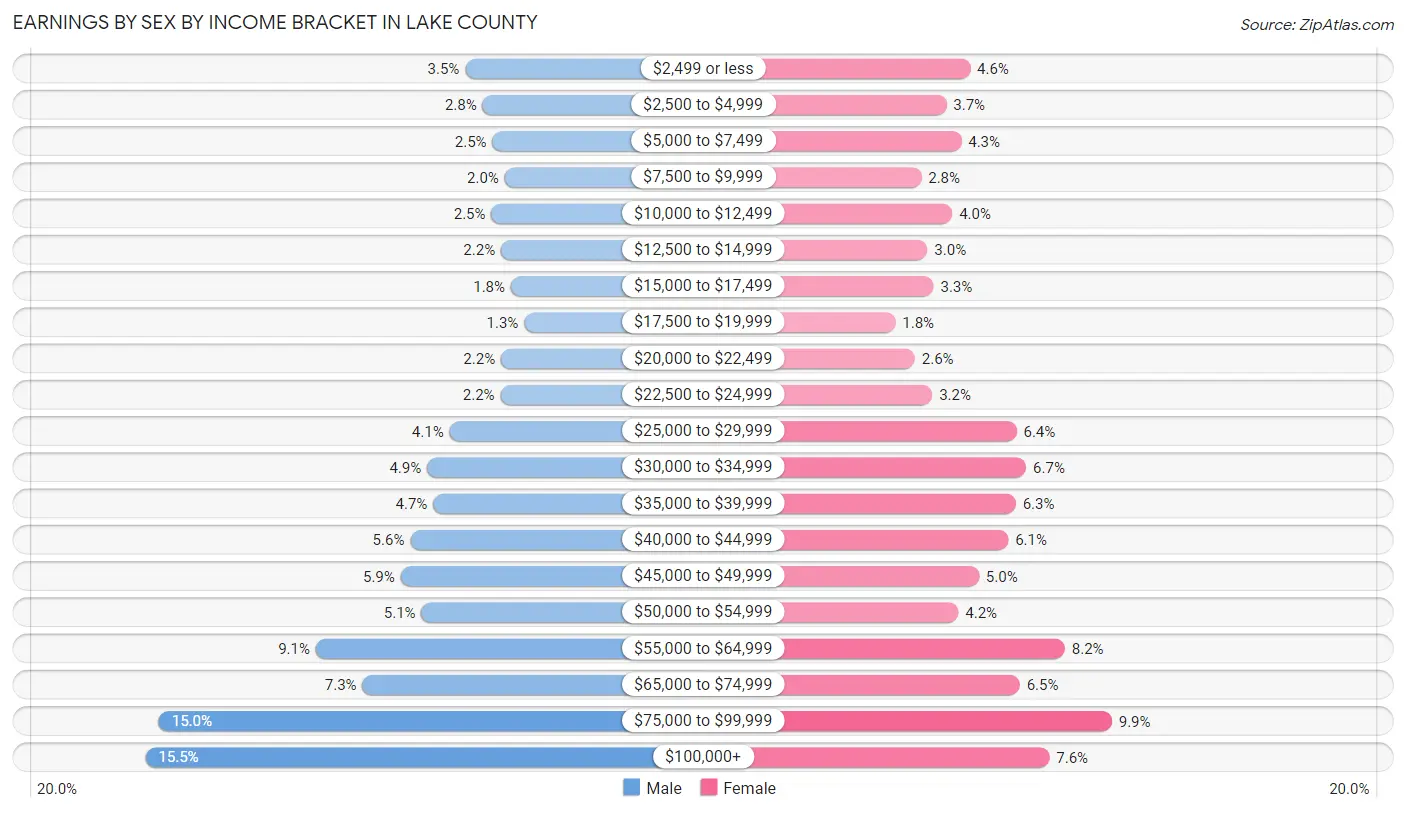
| Income | Male | Female |
| $2,499 or less | 2,393 (3.5%) | 2,899 (4.6%) |
| $2,500 to $4,999 | 1,951 (2.8%) | 2,337 (3.7%) |
| $5,000 to $7,499 | 1,695 (2.5%) | 2,692 (4.3%) |
| $7,500 to $9,999 | 1,377 (2.0%) | 1,752 (2.8%) |
| $10,000 to $12,499 | 1,720 (2.5%) | 2,474 (4.0%) |
| $12,500 to $14,999 | 1,477 (2.1%) | 1,896 (3.0%) |
| $15,000 to $17,499 | 1,218 (1.8%) | 2,040 (3.3%) |
| $17,500 to $19,999 | 876 (1.3%) | 1,140 (1.8%) |
| $20,000 to $22,499 | 1,476 (2.1%) | 1,599 (2.5%) |
| $22,500 to $24,999 | 1,491 (2.2%) | 2,009 (3.2%) |
| $25,000 to $29,999 | 2,798 (4.1%) | 3,984 (6.4%) |
| $30,000 to $34,999 | 3,372 (4.9%) | 4,214 (6.7%) |
| $35,000 to $39,999 | 3,216 (4.7%) | 3,971 (6.3%) |
| $40,000 to $44,999 | 3,808 (5.6%) | 3,791 (6.0%) |
| $45,000 to $49,999 | 4,050 (5.9%) | 3,104 (5.0%) |
| $50,000 to $54,999 | 3,519 (5.1%) | 2,620 (4.2%) |
| $55,000 to $64,999 | 6,235 (9.1%) | 5,124 (8.2%) |
| $65,000 to $74,999 | 5,037 (7.3%) | 4,064 (6.5%) |
| $75,000 to $99,999 | 10,267 (15.0%) | 6,223 (9.9%) |
| $100,000+ | 10,607 (15.5%) | 4,756 (7.6%) |
| Total | 68,583 (100.0%) | 62,689 (100.0%) |
Earnings by Sex by Educational Attainment in Lake County
Average earnings in Lake County are $58,116 for men and $42,304 for women, a difference of 27.2%. Men with an educational attainment of graduate degree enjoy the highest average annual earnings of $94,650, while those with less than high school education earn the least with $34,317. Women with an educational attainment of graduate degree earn the most with the average annual earnings of $76,740, while those with less than high school education have the smallest earnings of $24,275.
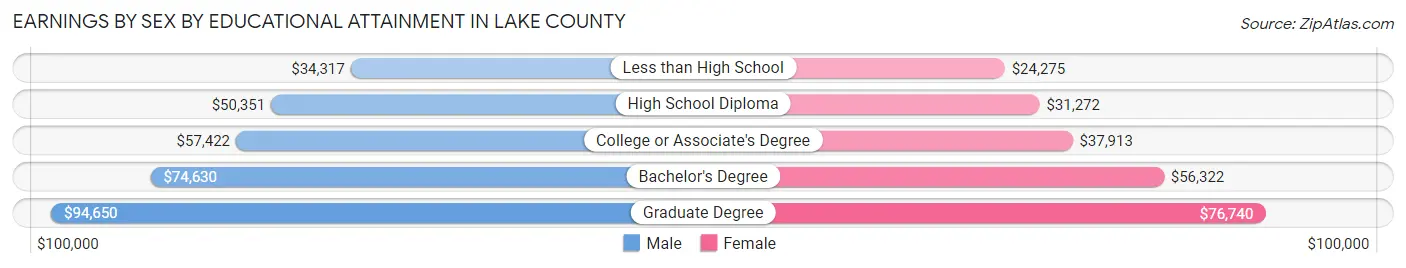
| Educational Attainment | Male Income | Female Income |
| Less than High School | $34,317 | $24,275 |
| High School Diploma | $50,351 | $31,272 |
| College or Associate's Degree | $57,422 | $37,913 |
| Bachelor's Degree | $74,630 | $56,322 |
| Graduate Degree | $94,650 | $76,740 |
| Total | $58,116 | $42,304 |
Family Income in Lake County
Family Income Brackets in Lake County
According to the Lake County family income data, there are 16,062 families falling into the $100,000 to $149,999 income range, which is the most common income bracket and makes up 26.4% of all families. Conversely, the $10,000 to $14,999 income bracket is the least frequent group with only 548 families (0.9%) belonging to this category.
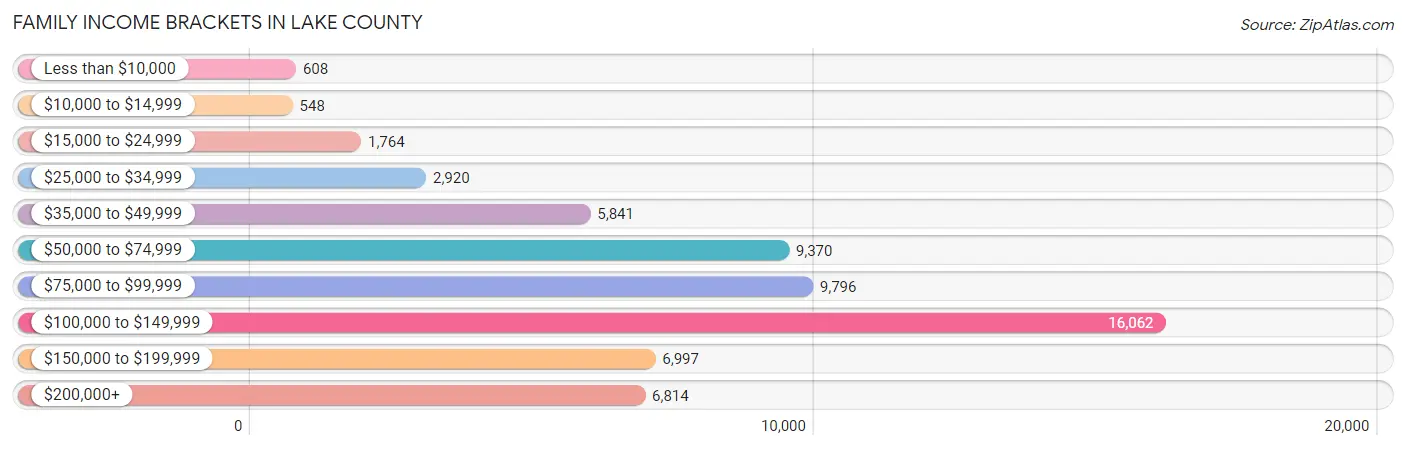
| Income Bracket | # Families | % Families |
| Less than $10,000 | 608 | 1.0% |
| $10,000 to $14,999 | 548 | 0.9% |
| $15,000 to $24,999 | 1,764 | 2.9% |
| $25,000 to $34,999 | 2,920 | 4.8% |
| $35,000 to $49,999 | 5,841 | 9.6% |
| $50,000 to $74,999 | 9,370 | 15.4% |
| $75,000 to $99,999 | 9,796 | 16.1% |
| $100,000 to $149,999 | 16,062 | 26.4% |
| $150,000 to $199,999 | 6,997 | 11.5% |
| $200,000+ | 6,814 | 11.2% |
Family Income by Famaliy Size in Lake County
7+ person families (518 | 0.9%) account for the highest median family income in Lake County with $130,921 per family, while 2-person families (32,142 | 52.8%) have the highest median income of $42,306 per family member.
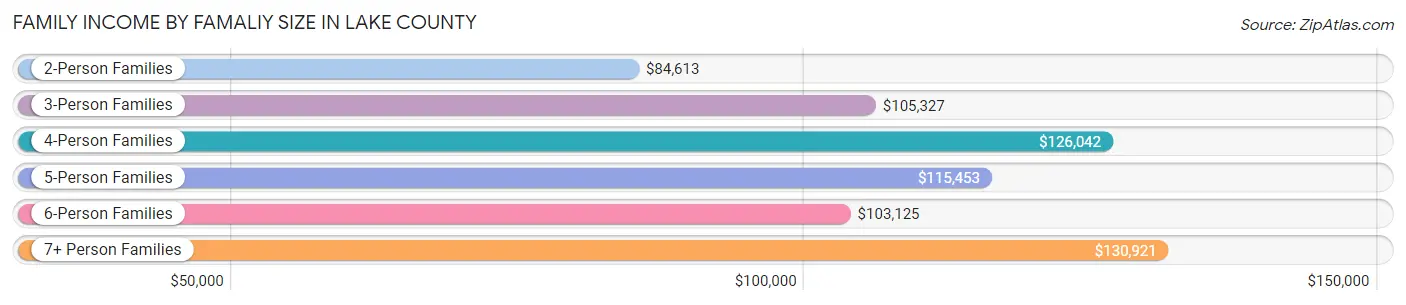
| Income Bracket | # Families | Median Income |
| 2-Person Families | 32,142 (52.8%) | $84,613 |
| 3-Person Families | 12,746 (20.9%) | $105,327 |
| 4-Person Families | 10,146 (16.7%) | $126,042 |
| 5-Person Families | 4,147 (6.8%) | $115,453 |
| 6-Person Families | 1,143 (1.9%) | $103,125 |
| 7+ Person Families | 518 (0.9%) | $130,921 |
| Total | 60,842 (100.0%) | $98,576 |
Family Income by Number of Earners in Lake County
The median family income in Lake County is $98,576, with families comprising 3+ earners (7,836) having the highest median family income of $142,597, while families with no earners (9,607) have the lowest median family income of $57,857, accounting for 12.9% and 15.8% of families, respectively.
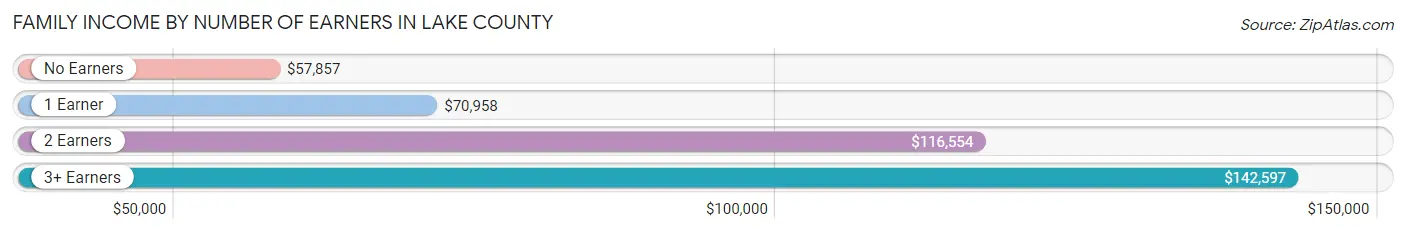
| Number of Earners | # Families | Median Income |
| No Earners | 9,607 (15.8%) | $57,857 |
| 1 Earner | 17,364 (28.5%) | $70,958 |
| 2 Earners | 26,035 (42.8%) | $116,554 |
| 3+ Earners | 7,836 (12.9%) | $142,597 |
| Total | 60,842 (100.0%) | $98,576 |
Household Income in Lake County
Household Income Brackets in Lake County
With 20,063 households falling in the category, the $100,000 to $149,999 income range is the most frequent in Lake County, accounting for 20.2% of all households. In contrast, only 2,781 households (2.8%) fall into the less than $10,000 income bracket, making it the least populous group.
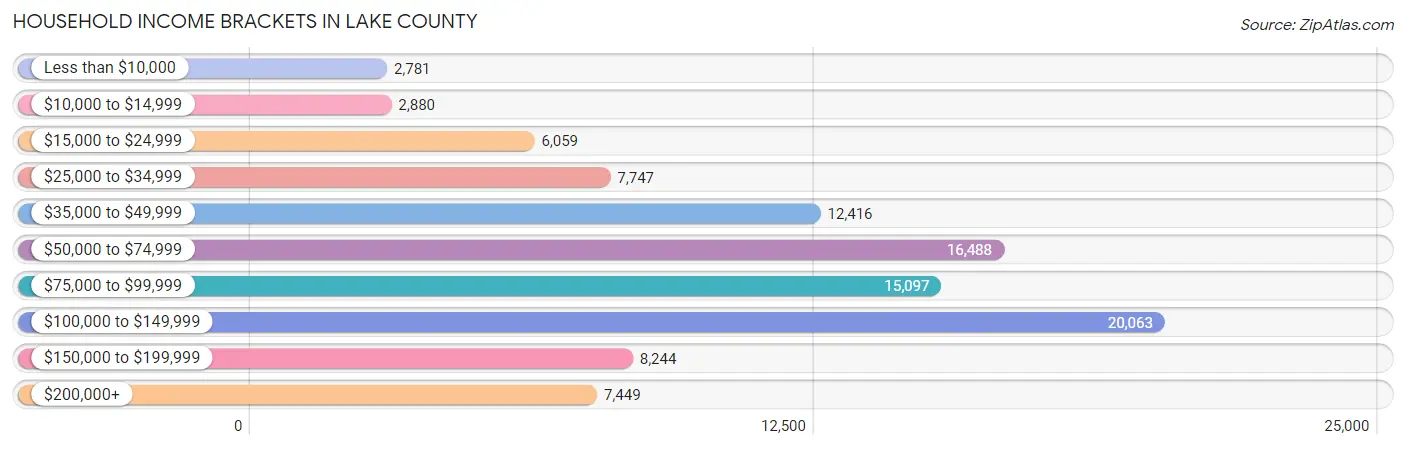
| Income Bracket | # Households | % Households |
| Less than $10,000 | 2,781 | 2.8% |
| $10,000 to $14,999 | 2,880 | 2.9% |
| $15,000 to $24,999 | 6,059 | 6.1% |
| $25,000 to $34,999 | 7,747 | 7.8% |
| $35,000 to $49,999 | 12,416 | 12.5% |
| $50,000 to $74,999 | 16,488 | 16.6% |
| $75,000 to $99,999 | 15,097 | 15.2% |
| $100,000 to $149,999 | 20,063 | 20.2% |
| $150,000 to $199,999 | 8,244 | 8.3% |
| $200,000+ | 7,449 | 7.5% |
Household Income by Householder Age in Lake County
The median household income in Lake County is $76,835, with the highest median household income of $95,086 found in the 45 to 64 years age bracket for the primary householder. A total of 37,534 households (37.8%) fall into this category. Meanwhile, the 15 to 24 years age bracket for the primary householder has the lowest median household income of $50,982, with 2,597 households (2.6%) in this group.
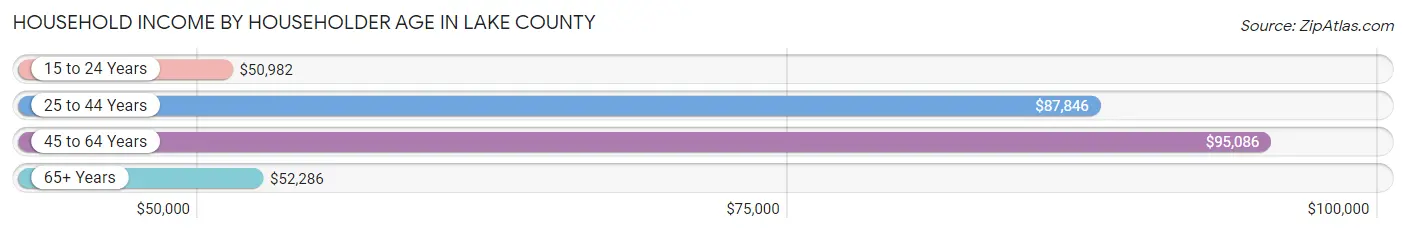
| Income Bracket | # Households | Median Income |
| 15 to 24 Years | 2,597 (2.6%) | $50,982 |
| 25 to 44 Years | 27,633 (27.8%) | $87,846 |
| 45 to 64 Years | 37,534 (37.8%) | $95,086 |
| 65+ Years | 31,560 (31.8%) | $52,286 |
| Total | 99,324 (100.0%) | $76,835 |
Poverty in Lake County
Income Below Poverty by Sex and Age in Lake County
With 6.4% poverty level for males and 8.8% for females among the residents of Lake County, 12 to 14 year old males and 15 year old females are the most vulnerable to poverty, with 456 males (12.0%) and 207 females (15.2%) in their respective age groups living below the poverty level.
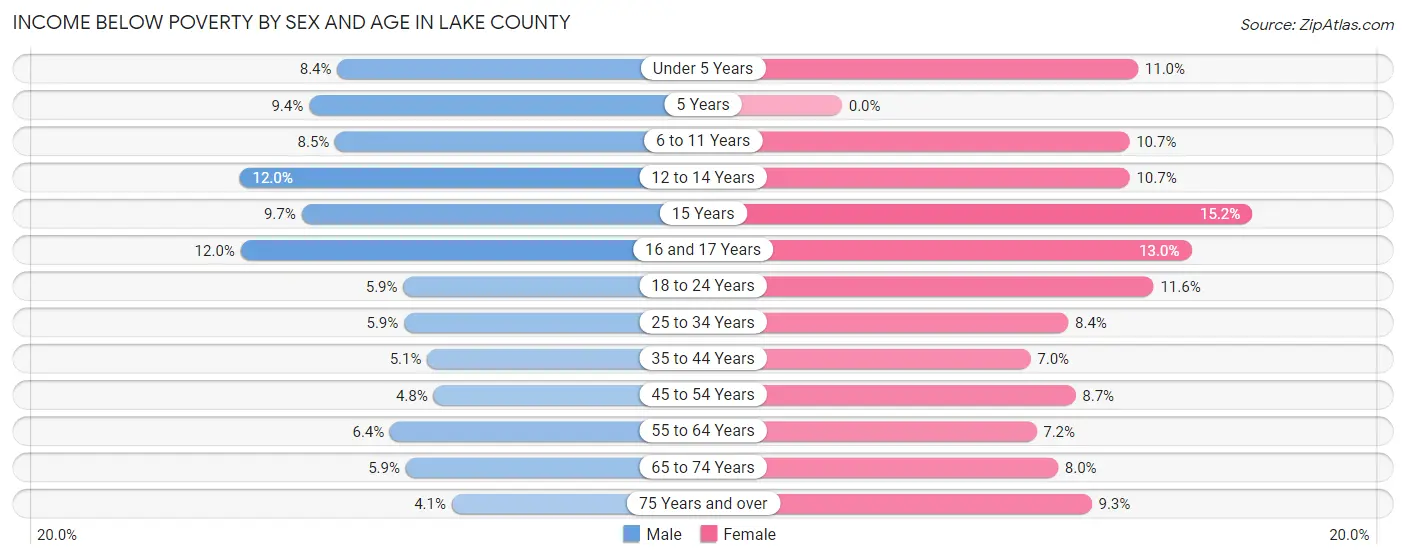
| Age Bracket | Male | Female |
| Under 5 Years | 470 (8.4%) | 584 (11.0%) |
| 5 Years | 122 (9.4%) | 0 (0.0%) |
| 6 to 11 Years | 646 (8.5%) | 740 (10.7%) |
| 12 to 14 Years | 456 (12.0%) | 471 (10.7%) |
| 15 Years | 150 (9.7%) | 207 (15.2%) |
| 16 and 17 Years | 369 (12.0%) | 379 (13.0%) |
| 18 to 24 Years | 540 (5.9%) | 1,004 (11.6%) |
| 25 to 34 Years | 841 (5.9%) | 1,154 (8.4%) |
| 35 to 44 Years | 692 (5.1%) | 931 (7.0%) |
| 45 to 54 Years | 717 (4.8%) | 1,276 (8.7%) |
| 55 to 64 Years | 1,110 (6.4%) | 1,306 (7.2%) |
| 65 to 74 Years | 763 (5.9%) | 1,159 (8.0%) |
| 75 Years and over | 323 (4.1%) | 1,066 (9.3%) |
| Total | 7,199 (6.4%) | 10,277 (8.8%) |
Income Above Poverty by Sex and Age in Lake County
According to the poverty statistics in Lake County, males aged 75 years and over and females aged 5 years are the age groups that are most secure financially, with 95.9% of males and 100.0% of females in these age groups living above the poverty line.
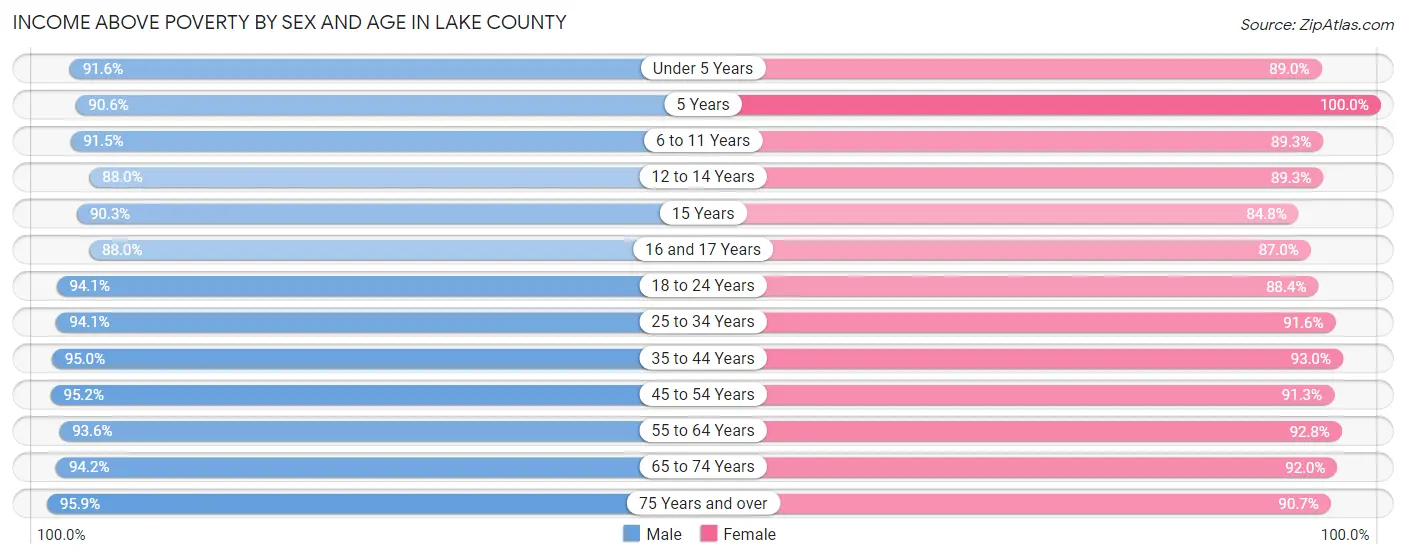
| Age Bracket | Male | Female |
| Under 5 Years | 5,134 (91.6%) | 4,731 (89.0%) |
| 5 Years | 1,171 (90.6%) | 837 (100.0%) |
| 6 to 11 Years | 6,983 (91.5%) | 6,198 (89.3%) |
| 12 to 14 Years | 3,338 (88.0%) | 3,940 (89.3%) |
| 15 Years | 1,393 (90.3%) | 1,152 (84.8%) |
| 16 and 17 Years | 2,712 (88.0%) | 2,543 (87.0%) |
| 18 to 24 Years | 8,554 (94.1%) | 7,674 (88.4%) |
| 25 to 34 Years | 13,381 (94.1%) | 12,584 (91.6%) |
| 35 to 44 Years | 13,008 (95.0%) | 12,374 (93.0%) |
| 45 to 54 Years | 14,146 (95.2%) | 13,440 (91.3%) |
| 55 to 64 Years | 16,140 (93.6%) | 16,771 (92.8%) |
| 65 to 74 Years | 12,284 (94.2%) | 13,295 (92.0%) |
| 75 Years and over | 7,487 (95.9%) | 10,438 (90.7%) |
| Total | 105,731 (93.6%) | 105,977 (91.2%) |
Income Below Poverty Among Married-Couple Families in Lake County
The poverty statistics for married-couple families in Lake County show that 2.2% or 1,022 of the total 46,064 families live below the poverty line. Families with 5 or more children have the highest poverty rate of 13.9%, comprising of 20 families. On the other hand, families with 1 or 2 children have the lowest poverty rate of 1.6%, which includes 203 families.
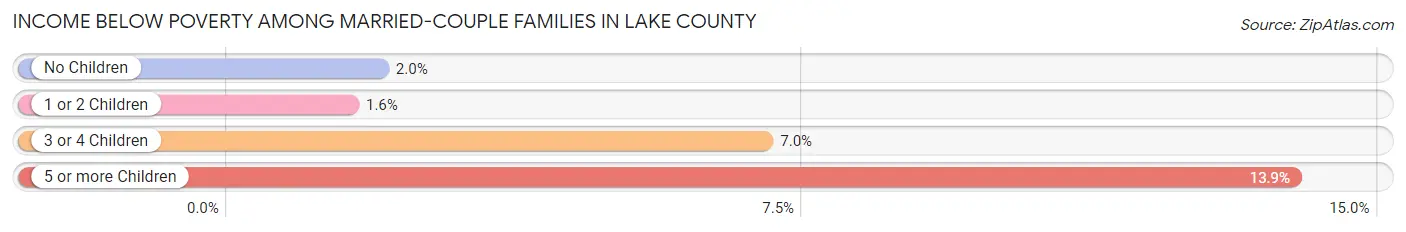
| Children | Above Poverty | Below Poverty |
| No Children | 29,532 (98.0%) | 593 (2.0%) |
| 1 or 2 Children | 12,647 (98.4%) | 203 (1.6%) |
| 3 or 4 Children | 2,739 (93.0%) | 206 (7.0%) |
| 5 or more Children | 124 (86.1%) | 20 (13.9%) |
| Total | 45,042 (97.8%) | 1,022 (2.2%) |
Income Below Poverty Among Single-Parent Households in Lake County
According to the poverty data in Lake County, 5.2% or 218 single-father households and 13.7% or 1,452 single-mother households are living below the poverty line. Among single-father households, those with 3 or 4 children have the highest poverty rate, with 76 households (29.0%) experiencing poverty. Likewise, among single-mother households, those with 3 or 4 children have the highest poverty rate, with 450 households (45.6%) falling below the poverty line.
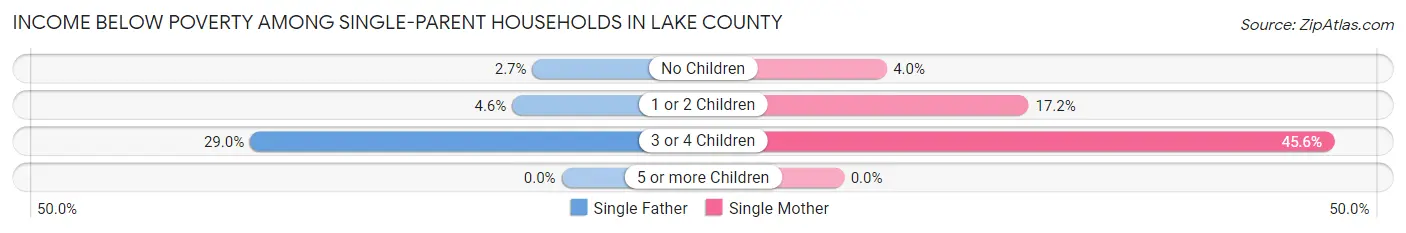
| Children | Single Father | Single Mother |
| No Children | 49 (2.7%) | 195 (4.0%) |
| 1 or 2 Children | 93 (4.6%) | 807 (17.2%) |
| 3 or 4 Children | 76 (29.0%) | 450 (45.6%) |
| 5 or more Children | 0 (0.0%) | 0 (0.0%) |
| Total | 218 (5.2%) | 1,452 (13.7%) |
Income Below Poverty Among Married-Couple vs Single-Parent Households in Lake County
The poverty data for Lake County shows that 1,022 of the married-couple family households (2.2%) and 1,670 of the single-parent households (11.3%) are living below the poverty level. Within the married-couple family households, those with 5 or more children have the highest poverty rate, with 20 households (13.9%) falling below the poverty line. Among the single-parent households, those with 3 or 4 children have the highest poverty rate, with 526 household (42.1%) living below poverty.
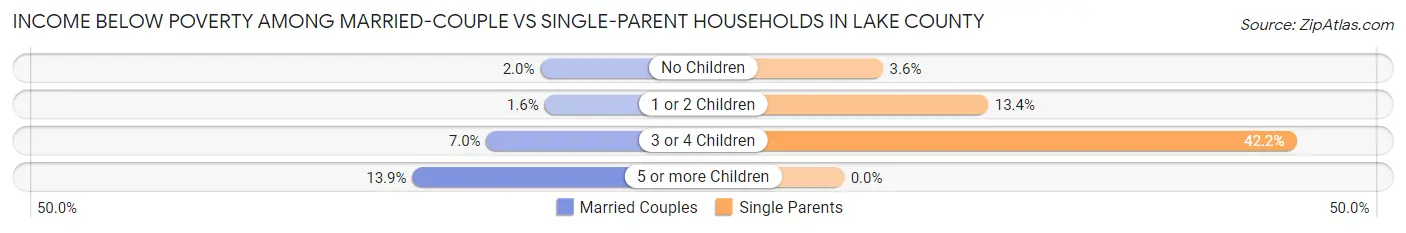
| Children | Married-Couple Families | Single-Parent Households |
| No Children | 593 (2.0%) | 244 (3.6%) |
| 1 or 2 Children | 203 (1.6%) | 900 (13.4%) |
| 3 or 4 Children | 206 (7.0%) | 526 (42.1%) |
| 5 or more Children | 20 (13.9%) | 0 (0.0%) |
| Total | 1,022 (2.2%) | 1,670 (11.3%) |
Employment Characteristics in Lake County
Employment by Class of Employer in Lake County
Among the 118,513 employed individuals in Lake County, private company employees (87,108 | 73.5%), not-for-profit organizations (10,025 | 8.5%), and local government employees (8,951 | 7.5%) make up the most common classes of employment.
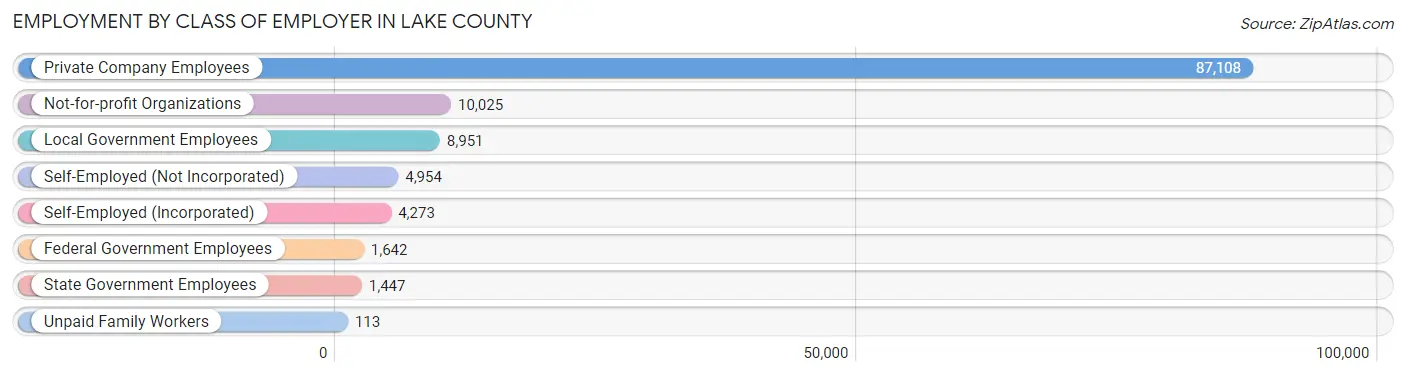
| Employer Class | # Employees | % Employees |
| Private Company Employees | 87,108 | 73.5% |
| Self-Employed (Incorporated) | 4,273 | 3.6% |
| Self-Employed (Not Incorporated) | 4,954 | 4.2% |
| Not-for-profit Organizations | 10,025 | 8.5% |
| Local Government Employees | 8,951 | 7.5% |
| State Government Employees | 1,447 | 1.2% |
| Federal Government Employees | 1,642 | 1.4% |
| Unpaid Family Workers | 113 | 0.1% |
| Total | 118,513 | 100.0% |
Employment Status by Age in Lake County
According to the labor force statistics for Lake County, out of the total population over 16 years of age (192,759), 65.4% or 126,064 individuals are in the labor force, with 4.4% or 5,547 of them unemployed. The age group with the highest labor force participation rate is 25 to 29 years, with 91.8% or 12,934 individuals in the labor force. Within the labor force, the 16 to 19 years age range has the highest percentage of unemployed individuals, with 14.2% or 826 of them being unemployed.
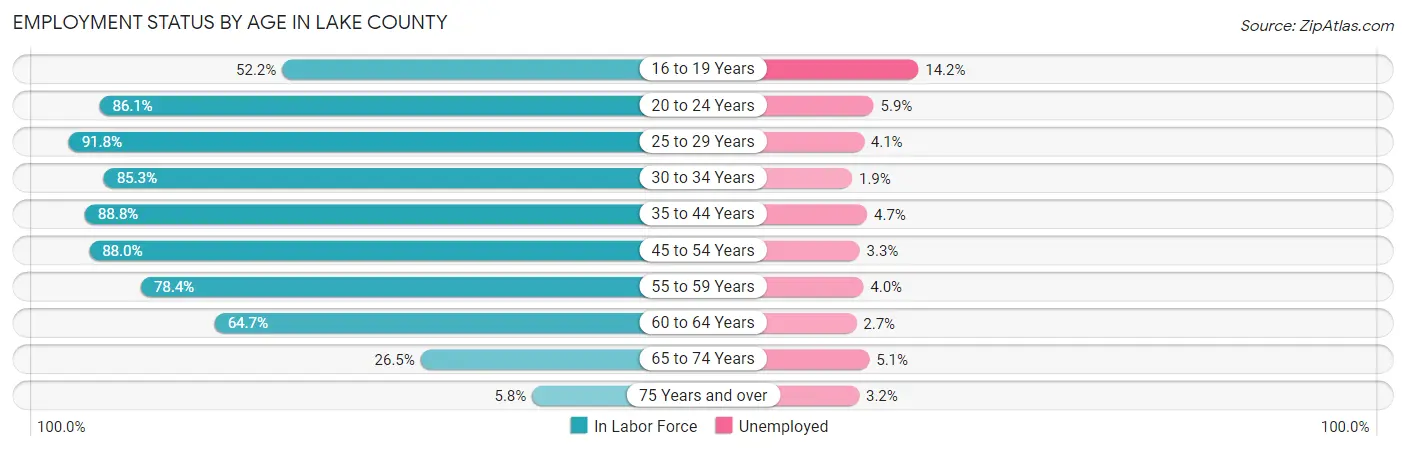
| Age Bracket | In Labor Force | Unemployed |
| 16 to 19 Years | 5,814 (52.2%) | 826 (14.2%) |
| 20 to 24 Years | 11,342 (86.1%) | 669 (5.9%) |
| 25 to 29 Years | 12,934 (91.8%) | 530 (4.1%) |
| 30 to 34 Years | 11,945 (85.3%) | 227 (1.9%) |
| 35 to 44 Years | 24,069 (88.8%) | 1,131 (4.7%) |
| 45 to 54 Years | 26,147 (88.0%) | 863 (3.3%) |
| 55 to 59 Years | 13,091 (78.4%) | 524 (4.0%) |
| 60 to 64 Years | 12,200 (64.7%) | 329 (2.7%) |
| 65 to 74 Years | 7,417 (26.5%) | 378 (5.1%) |
| 75 Years and over | 1,160 (5.8%) | 37 (3.2%) |
| Total | 126,064 (65.4%) | 5,547 (4.4%) |
Employment Status by Educational Attainment in Lake County
According to labor force statistics for Lake County, 83.3% of individuals (100,347) out of the total population between 25 and 64 years of age (120,464) are in the labor force, with 3.6% or 3,612 of them being unemployed. The group with the highest labor force participation rate are those with the educational attainment of bachelor's degree or higher, with 89.8% or 35,393 individuals in the labor force. Within the labor force, individuals with less than high school education have the highest percentage of unemployment, with 8.1% or 357 of them being unemployed.
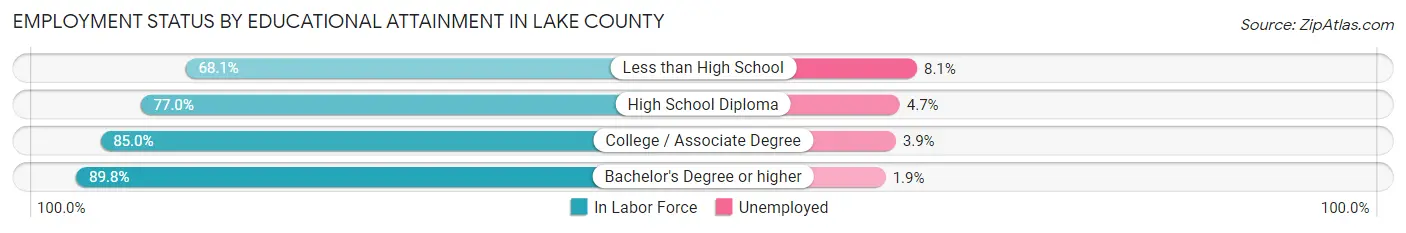
| Educational Attainment | In Labor Force | Unemployed |
| Less than High School | 4,407 (68.1%) | 524 (8.1%) |
| High School Diploma | 27,156 (77.0%) | 1,658 (4.7%) |
| College / Associate Degree | 33,414 (85.0%) | 1,533 (3.9%) |
| Bachelor's Degree or higher | 35,393 (89.8%) | 749 (1.9%) |
| Total | 100,347 (83.3%) | 4,337 (3.6%) |
Employment Occupations by Sex in Lake County
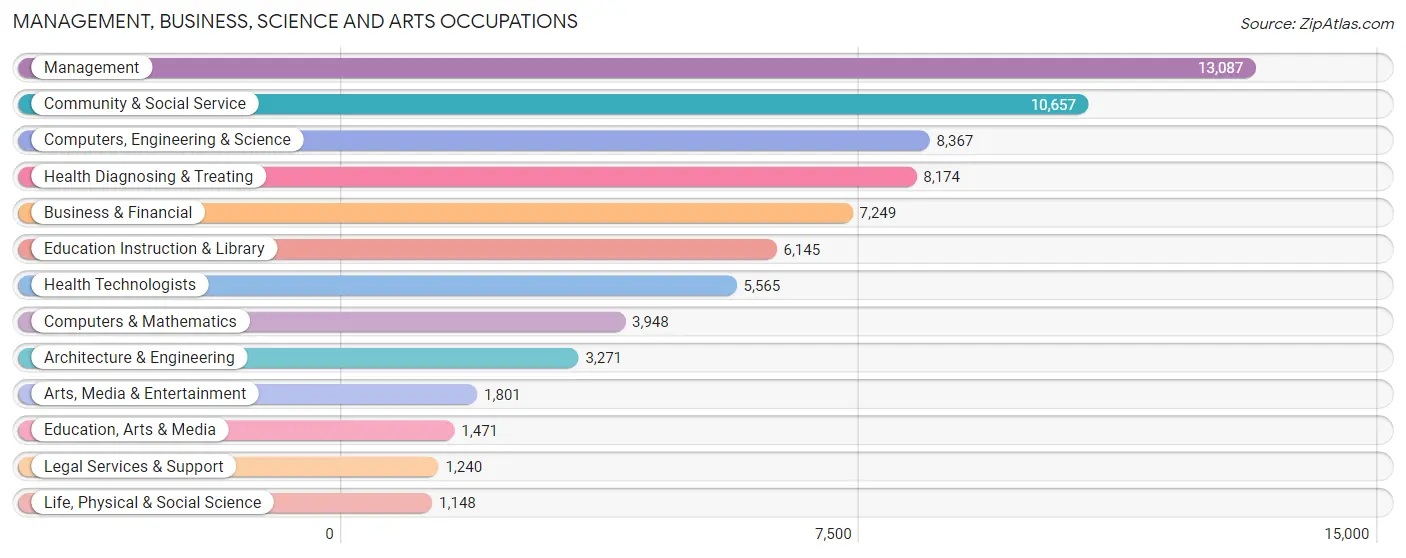
Management, Business, Science and Arts Occupations
The most common Management, Business, Science and Arts occupations in Lake County are Management (13,087 | 10.9%), Community & Social Service (10,657 | 8.8%), Computers, Engineering & Science (8,367 | 6.9%), Health Diagnosing & Treating (8,174 | 6.8%), and Business & Financial (7,249 | 6.0%).
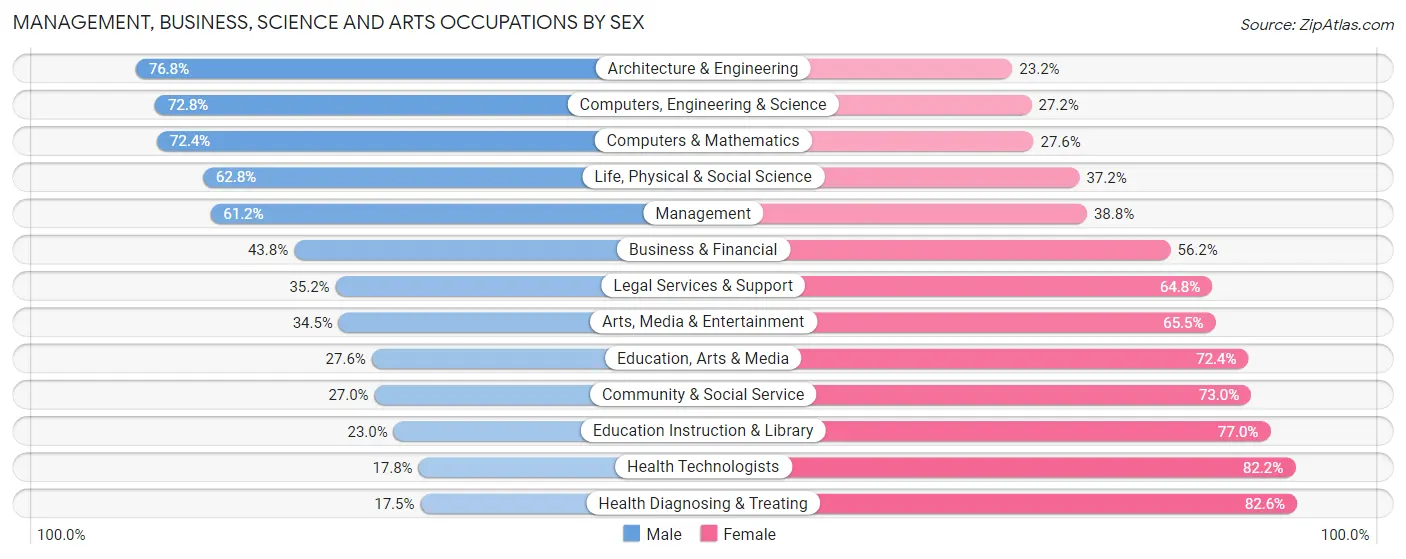
Management, Business, Science and Arts Occupations by Sex
Within the Management, Business, Science and Arts occupations in Lake County, the most male-oriented occupations are Architecture & Engineering (76.8%), Computers, Engineering & Science (72.8%), and Computers & Mathematics (72.4%), while the most female-oriented occupations are Health Diagnosing & Treating (82.6%), Health Technologists (82.2%), and Education Instruction & Library (77.0%).
| Occupation | Male | Female |
| Management | 8,014 (61.2%) | 5,073 (38.8%) |
| Business & Financial | 3,175 (43.8%) | 4,074 (56.2%) |
| Computers, Engineering & Science | 6,091 (72.8%) | 2,276 (27.2%) |
| Computers & Mathematics | 2,858 (72.4%) | 1,090 (27.6%) |
| Architecture & Engineering | 2,512 (76.8%) | 759 (23.2%) |
| Life, Physical & Social Science | 721 (62.8%) | 427 (37.2%) |
| Community & Social Service | 2,879 (27.0%) | 7,778 (73.0%) |
| Education, Arts & Media | 406 (27.6%) | 1,065 (72.4%) |
| Legal Services & Support | 436 (35.2%) | 804 (64.8%) |
| Education Instruction & Library | 1,416 (23.0%) | 4,729 (77.0%) |
| Arts, Media & Entertainment | 621 (34.5%) | 1,180 (65.5%) |
| Health Diagnosing & Treating | 1,426 (17.4%) | 6,748 (82.6%) |
| Health Technologists | 993 (17.8%) | 4,572 (82.2%) |
| Total (Category) | 21,585 (45.4%) | 25,949 (54.6%) |
| Total (Overall) | 62,454 (51.8%) | 58,083 (48.2%) |
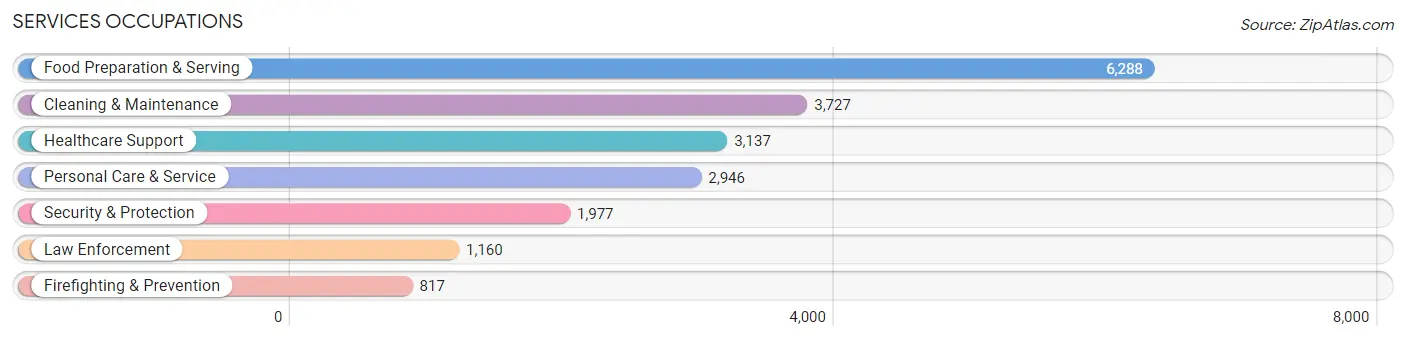
Services Occupations
The most common Services occupations in Lake County are Food Preparation & Serving (6,288 | 5.2%), Cleaning & Maintenance (3,727 | 3.1%), Healthcare Support (3,137 | 2.6%), Personal Care & Service (2,946 | 2.4%), and Security & Protection (1,977 | 1.6%).
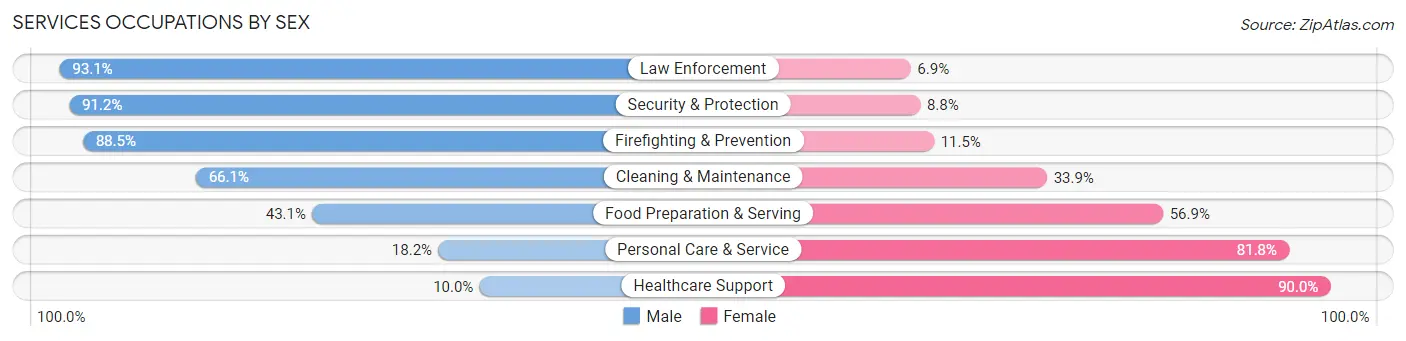
Services Occupations by Sex
Within the Services occupations in Lake County, the most male-oriented occupations are Law Enforcement (93.1%), Security & Protection (91.2%), and Firefighting & Prevention (88.5%), while the most female-oriented occupations are Healthcare Support (90.0%), Personal Care & Service (81.8%), and Food Preparation & Serving (56.9%).
| Occupation | Male | Female |
| Healthcare Support | 313 (10.0%) | 2,824 (90.0%) |
| Security & Protection | 1,803 (91.2%) | 174 (8.8%) |
| Firefighting & Prevention | 723 (88.5%) | 94 (11.5%) |
| Law Enforcement | 1,080 (93.1%) | 80 (6.9%) |
| Food Preparation & Serving | 2,712 (43.1%) | 3,576 (56.9%) |
| Cleaning & Maintenance | 2,464 (66.1%) | 1,263 (33.9%) |
| Personal Care & Service | 535 (18.2%) | 2,411 (81.8%) |
| Total (Category) | 7,827 (43.3%) | 10,248 (56.7%) |
| Total (Overall) | 62,454 (51.8%) | 58,083 (48.2%) |
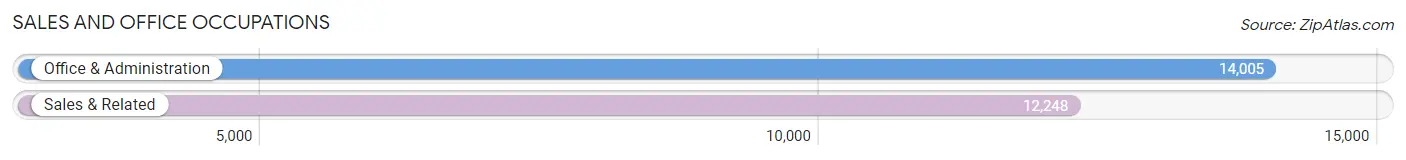
Sales and Office Occupations
The most common Sales and Office occupations in Lake County are Office & Administration (14,005 | 11.6%), and Sales & Related (12,248 | 10.2%).
Sales and Office Occupations by Sex
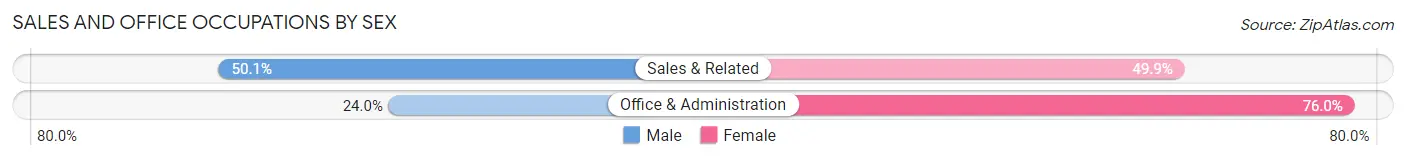
| Occupation | Male | Female |
| Sales & Related | 6,141 (50.1%) | 6,107 (49.9%) |
| Office & Administration | 3,359 (24.0%) | 10,646 (76.0%) |
| Total (Category) | 9,500 (36.2%) | 16,753 (63.8%) |
| Total (Overall) | 62,454 (51.8%) | 58,083 (48.2%) |
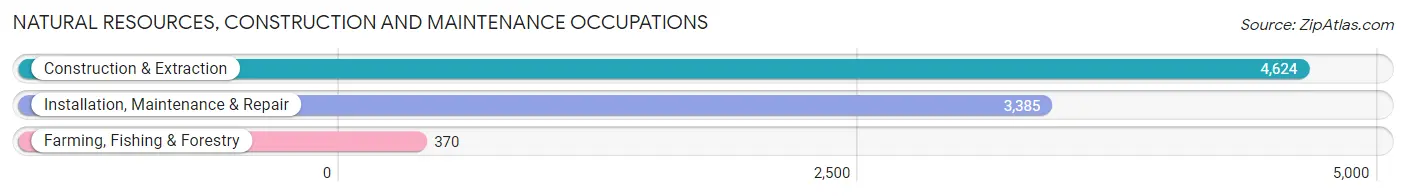
Natural Resources, Construction and Maintenance Occupations
The most common Natural Resources, Construction and Maintenance occupations in Lake County are Construction & Extraction (4,624 | 3.8%), Installation, Maintenance & Repair (3,385 | 2.8%), and Farming, Fishing & Forestry (370 | 0.3%).
Natural Resources, Construction and Maintenance Occupations by Sex
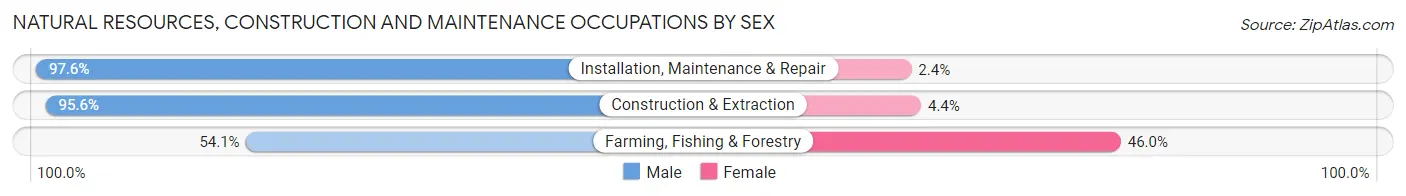
| Occupation | Male | Female |
| Farming, Fishing & Forestry | 200 (54.0%) | 170 (46.0%) |
| Construction & Extraction | 4,421 (95.6%) | 203 (4.4%) |
| Installation, Maintenance & Repair | 3,304 (97.6%) | 81 (2.4%) |
| Total (Category) | 7,925 (94.6%) | 454 (5.4%) |
| Total (Overall) | 62,454 (51.8%) | 58,083 (48.2%) |
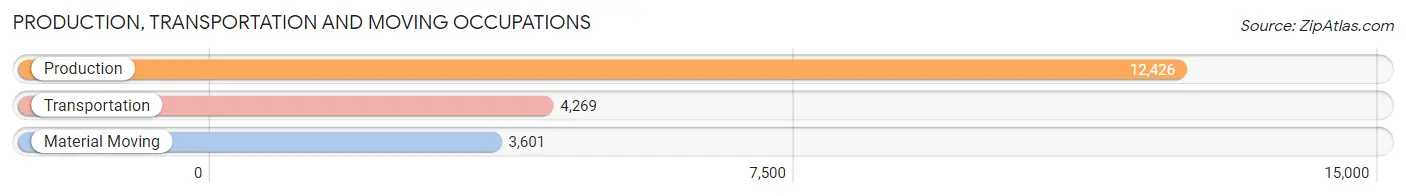
Production, Transportation and Moving Occupations
The most common Production, Transportation and Moving occupations in Lake County are Production (12,426 | 10.3%), Transportation (4,269 | 3.5%), and Material Moving (3,601 | 3.0%).
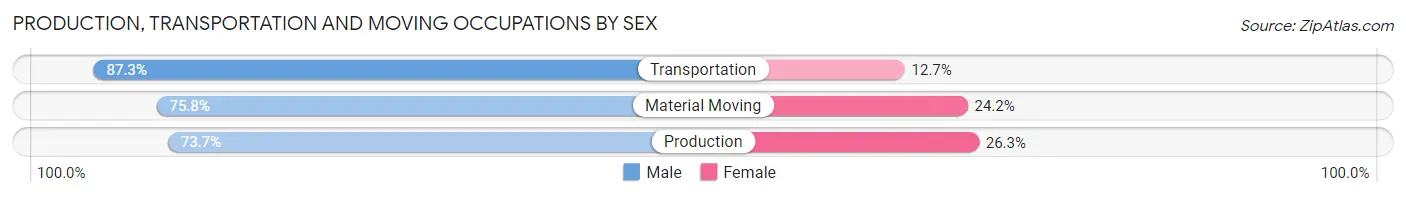
Production, Transportation and Moving Occupations by Sex
| Occupation | Male | Female |
| Production | 9,160 (73.7%) | 3,266 (26.3%) |
| Transportation | 3,728 (87.3%) | 541 (12.7%) |
| Material Moving | 2,729 (75.8%) | 872 (24.2%) |
| Total (Category) | 15,617 (76.9%) | 4,679 (23.1%) |
| Total (Overall) | 62,454 (51.8%) | 58,083 (48.2%) |
Employment Industries by Sex in Lake County
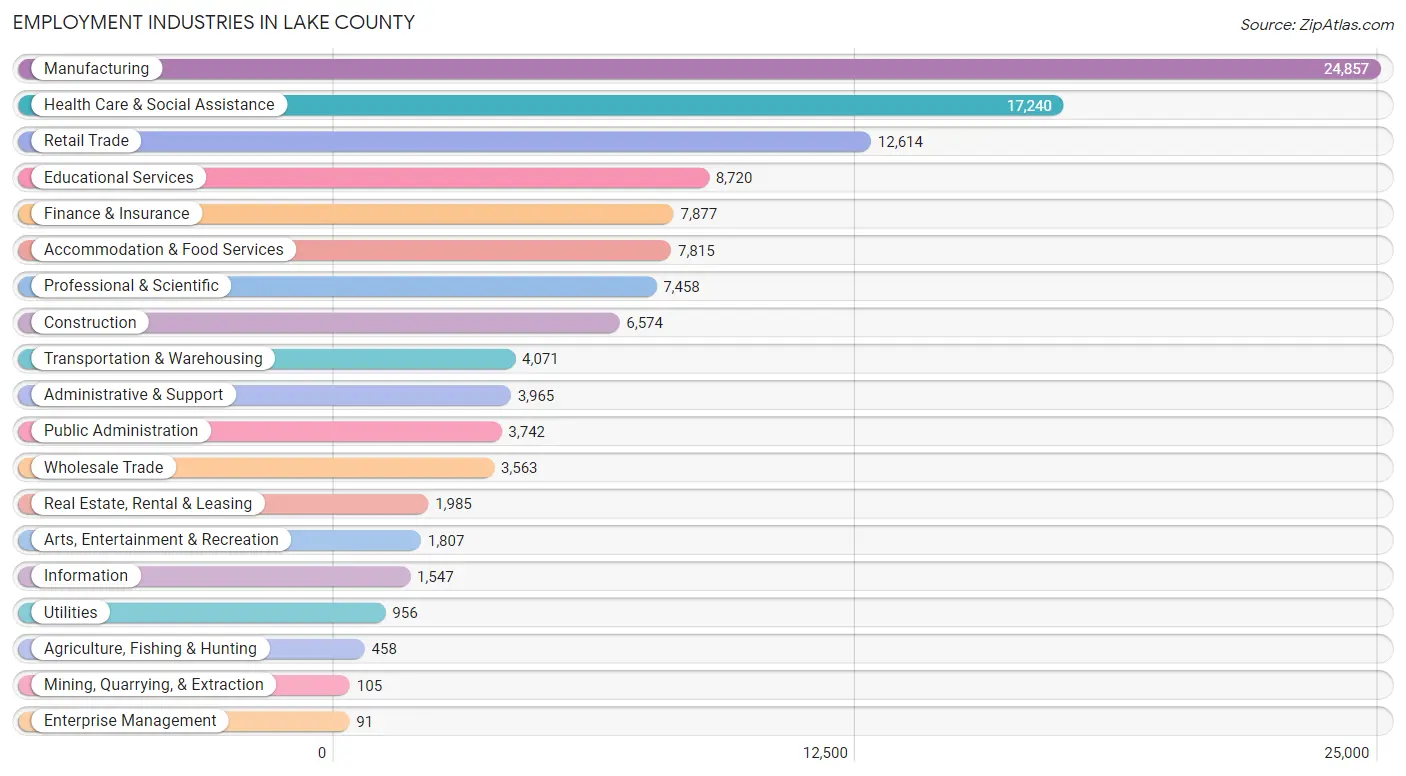
Employment Industries in Lake County
The major employment industries in Lake County include Manufacturing (24,857 | 20.6%), Health Care & Social Assistance (17,240 | 14.3%), Retail Trade (12,614 | 10.5%), Educational Services (8,720 | 7.2%), and Finance & Insurance (7,877 | 6.5%).
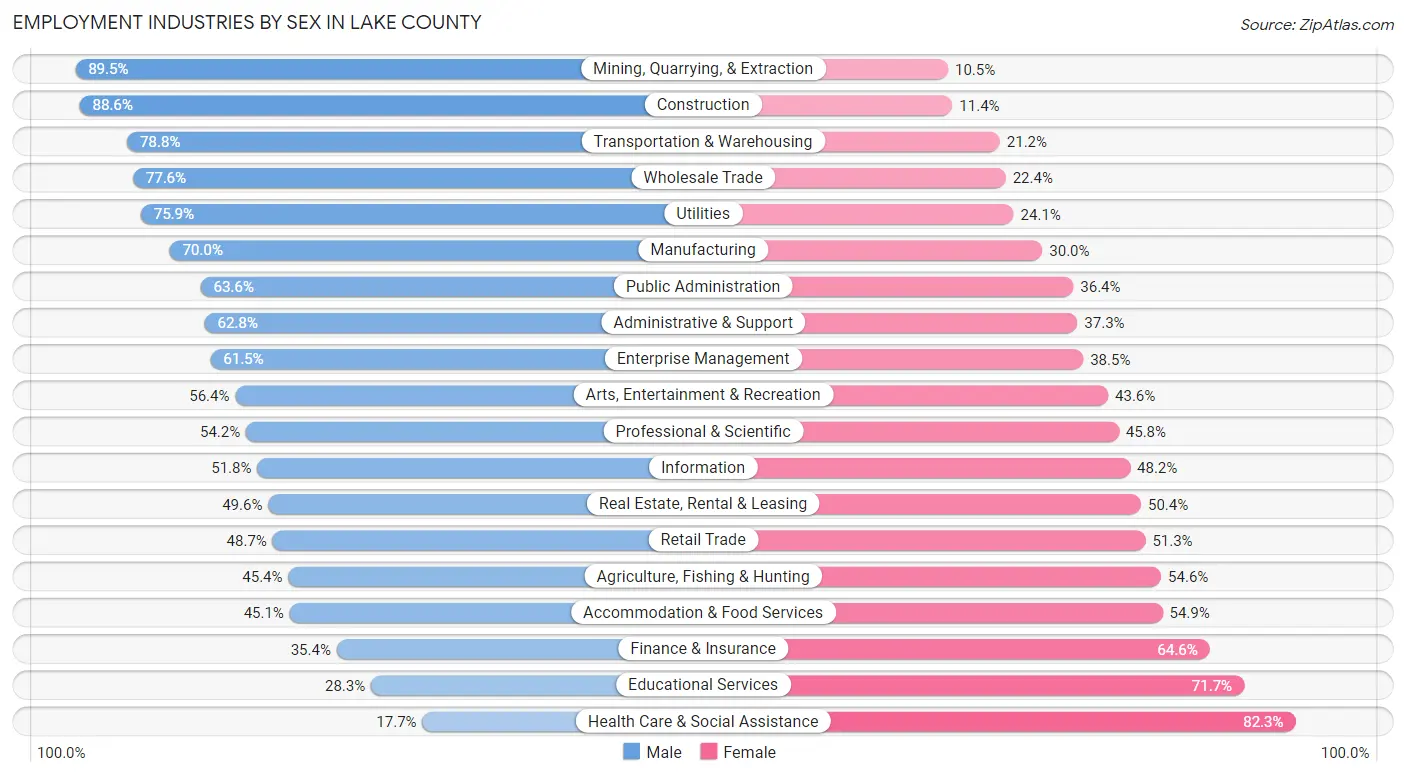
Employment Industries by Sex in Lake County
The Lake County industries that see more men than women are Mining, Quarrying, & Extraction (89.5%), Construction (88.6%), and Transportation & Warehousing (78.8%), whereas the industries that tend to have a higher number of women are Health Care & Social Assistance (82.3%), Educational Services (71.7%), and Finance & Insurance (64.6%).
| Industry | Male | Female |
| Agriculture, Fishing & Hunting | 208 (45.4%) | 250 (54.6%) |
| Mining, Quarrying, & Extraction | 94 (89.5%) | 11 (10.5%) |
| Construction | 5,826 (88.6%) | 748 (11.4%) |
| Manufacturing | 17,400 (70.0%) | 7,457 (30.0%) |
| Wholesale Trade | 2,764 (77.6%) | 799 (22.4%) |
| Retail Trade | 6,138 (48.7%) | 6,476 (51.3%) |
| Transportation & Warehousing | 3,208 (78.8%) | 863 (21.2%) |
| Utilities | 726 (75.9%) | 230 (24.1%) |
| Information | 802 (51.8%) | 745 (48.2%) |
| Finance & Insurance | 2,788 (35.4%) | 5,089 (64.6%) |
| Real Estate, Rental & Leasing | 984 (49.6%) | 1,001 (50.4%) |
| Professional & Scientific | 4,040 (54.2%) | 3,418 (45.8%) |
| Enterprise Management | 56 (61.5%) | 35 (38.5%) |
| Administrative & Support | 2,488 (62.7%) | 1,477 (37.2%) |
| Educational Services | 2,467 (28.3%) | 6,253 (71.7%) |
| Health Care & Social Assistance | 3,044 (17.7%) | 14,196 (82.3%) |
| Arts, Entertainment & Recreation | 1,019 (56.4%) | 788 (43.6%) |
| Accommodation & Food Services | 3,527 (45.1%) | 4,288 (54.9%) |
| Public Administration | 2,379 (63.6%) | 1,363 (36.4%) |
| Total | 62,454 (51.8%) | 58,083 (48.2%) |
Education in Lake County
School Enrollment in Lake County
The most common levels of schooling among the 47,976 students in Lake County are high school (11,428 | 23.8%), middle school (10,464 | 21.8%), and elementary school (9,951 | 20.7%).
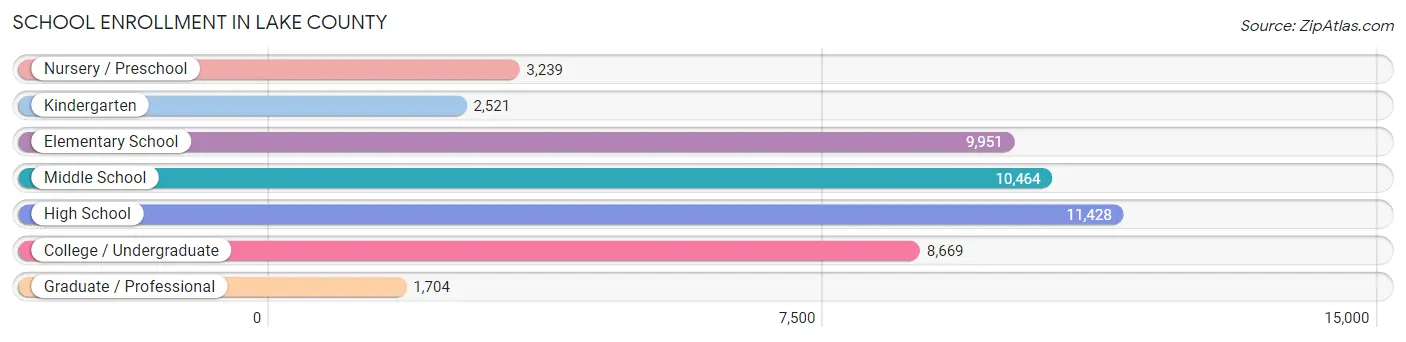
| School Level | # Students | % Students |
| Nursery / Preschool | 3,239 | 6.8% |
| Kindergarten | 2,521 | 5.2% |
| Elementary School | 9,951 | 20.7% |
| Middle School | 10,464 | 21.8% |
| High School | 11,428 | 23.8% |
| College / Undergraduate | 8,669 | 18.1% |
| Graduate / Professional | 1,704 | 3.5% |
| Total | 47,976 | 100.0% |
School Enrollment by Age by Funding Source in Lake County
Out of a total of 47,976 students who are enrolled in schools in Lake County, 9,355 (19.5%) attend a private institution, while the remaining 38,621 (80.5%) are enrolled in public schools. The age group of 3 to 4 year olds has the highest likelihood of being enrolled in private schools, with 1,112 (44.1% in the age bracket) enrolled. Conversely, the age group of 15 to 17 year olds has the lowest likelihood of being enrolled in a private school, with 7,399 (85.5% in the age bracket) attending a public institution.
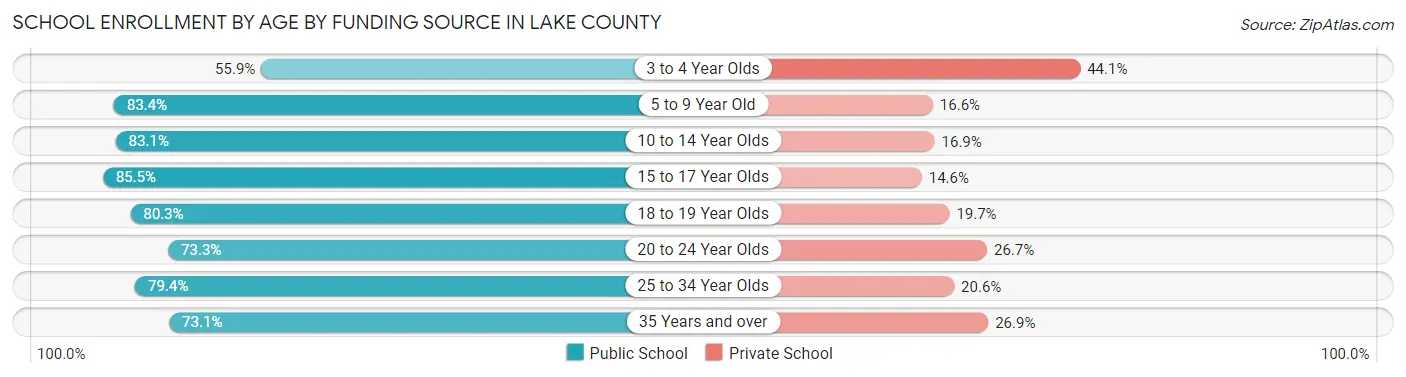
| Age Bracket | Public School | Private School |
| 3 to 4 Year Olds | 1,412 (55.9%) | 1,112 (44.1%) |
| 5 to 9 Year Old | 9,917 (83.4%) | 1,977 (16.6%) |
| 10 to 14 Year Olds | 10,784 (83.1%) | 2,199 (16.9%) |
| 15 to 17 Year Olds | 7,399 (85.5%) | 1,260 (14.5%) |
| 18 to 19 Year Olds | 2,833 (80.3%) | 695 (19.7%) |
| 20 to 24 Year Olds | 2,695 (73.3%) | 982 (26.7%) |
| 25 to 34 Year Olds | 1,721 (79.4%) | 446 (20.6%) |
| 35 Years and over | 1,859 (73.1%) | 685 (26.9%) |
| Total | 38,621 (80.5%) | 9,355 (19.5%) |
Educational Attainment by Field of Study in Lake County
Business (12,111 | 22.5%), education (8,471 | 15.7%), science & technology (6,523 | 12.1%), engineering (4,975 | 9.2%), and social sciences (3,003 | 5.6%) are the most common fields of study among 53,821 individuals in Lake County who have obtained a bachelor's degree or higher.
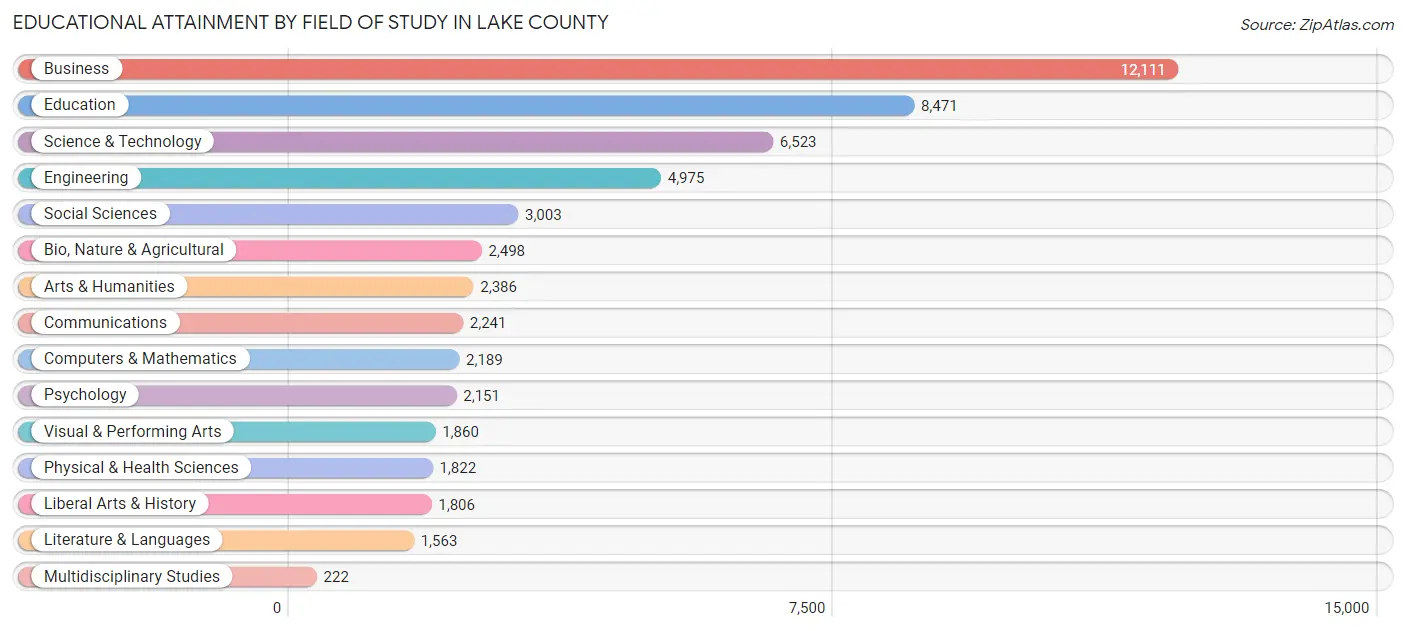
| Field of Study | # Graduates | % Graduates |
| Computers & Mathematics | 2,189 | 4.1% |
| Bio, Nature & Agricultural | 2,498 | 4.6% |
| Physical & Health Sciences | 1,822 | 3.4% |
| Psychology | 2,151 | 4.0% |
| Social Sciences | 3,003 | 5.6% |
| Engineering | 4,975 | 9.2% |
| Multidisciplinary Studies | 222 | 0.4% |
| Science & Technology | 6,523 | 12.1% |
| Business | 12,111 | 22.5% |
| Education | 8,471 | 15.7% |
| Literature & Languages | 1,563 | 2.9% |
| Liberal Arts & History | 1,806 | 3.4% |
| Visual & Performing Arts | 1,860 | 3.5% |
| Communications | 2,241 | 4.2% |
| Arts & Humanities | 2,386 | 4.4% |
| Total | 53,821 | 100.0% |
Transportation & Commute in Lake County
Vehicle Availability by Sex in Lake County
The most prevalent vehicle ownership categories in Lake County are males with 2 vehicles (28,242, accounting for 46.0%) and females with 2 vehicles (25,993, making up 49.7%).
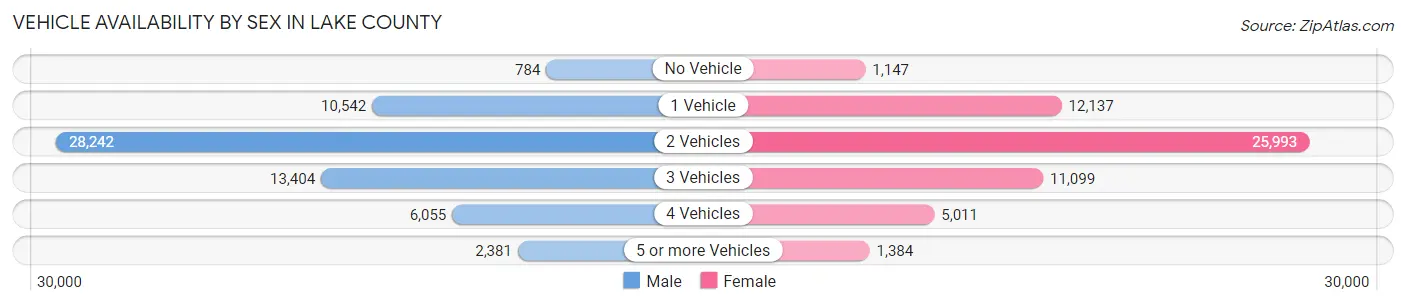
| Vehicles Available | Male | Female |
| No Vehicle | 784 (1.3%) | 1,147 (2.0%) |
| 1 Vehicle | 10,542 (17.2%) | 12,137 (21.4%) |
| 2 Vehicles | 28,242 (46.0%) | 25,993 (45.8%) |
| 3 Vehicles | 13,404 (21.8%) | 11,099 (19.6%) |
| 4 Vehicles | 6,055 (9.9%) | 5,011 (8.8%) |
| 5 or more Vehicles | 2,381 (3.9%) | 1,384 (2.4%) |
| Total | 61,408 (100.0%) | 56,771 (100.0%) |
Commute Time in Lake County
The most frequently occuring commute durations in Lake County are 15 to 19 minutes (18,613 commuters, 17.5%), 20 to 24 minutes (17,979 commuters, 17.0%), and 10 to 14 minutes (15,317 commuters, 14.4%).
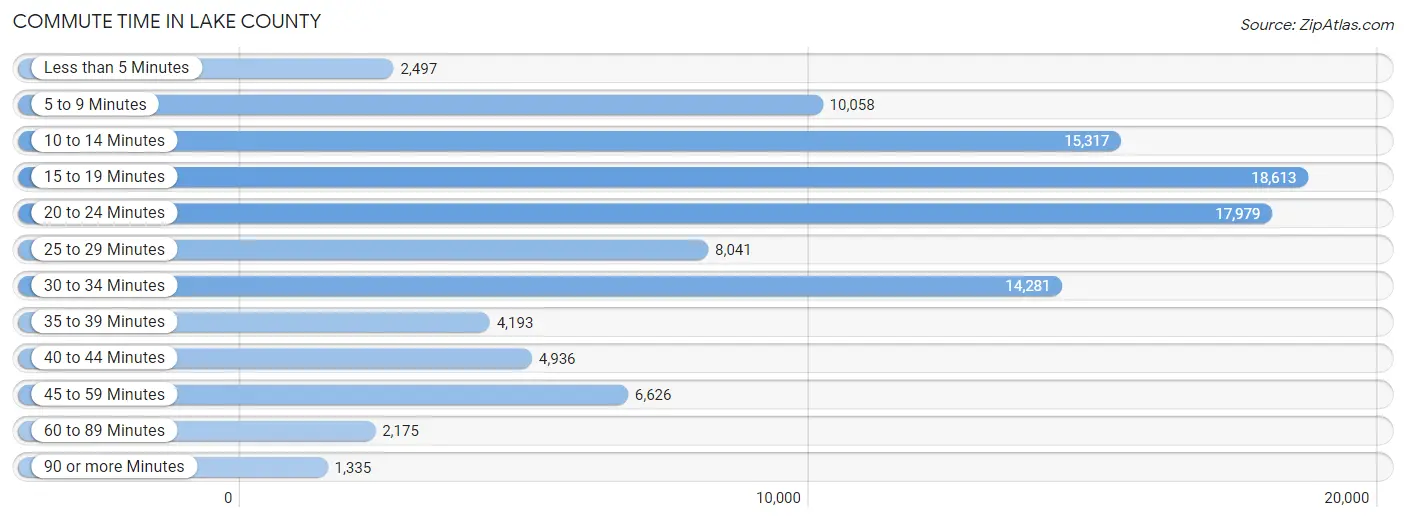
| Commute Time | # Commuters | % Commuters |
| Less than 5 Minutes | 2,497 | 2.4% |
| 5 to 9 Minutes | 10,058 | 9.5% |
| 10 to 14 Minutes | 15,317 | 14.4% |
| 15 to 19 Minutes | 18,613 | 17.5% |
| 20 to 24 Minutes | 17,979 | 17.0% |
| 25 to 29 Minutes | 8,041 | 7.6% |
| 30 to 34 Minutes | 14,281 | 13.5% |
| 35 to 39 Minutes | 4,193 | 4.0% |
| 40 to 44 Minutes | 4,936 | 4.6% |
| 45 to 59 Minutes | 6,626 | 6.2% |
| 60 to 89 Minutes | 2,175 | 2.1% |
| 90 or more Minutes | 1,335 | 1.3% |
Commute Time by Sex in Lake County
The most common commute times in Lake County are 15 to 19 minutes (9,710 commuters, 17.2%) for males and 20 to 24 minutes (8,928 commuters, 17.9%) for females.
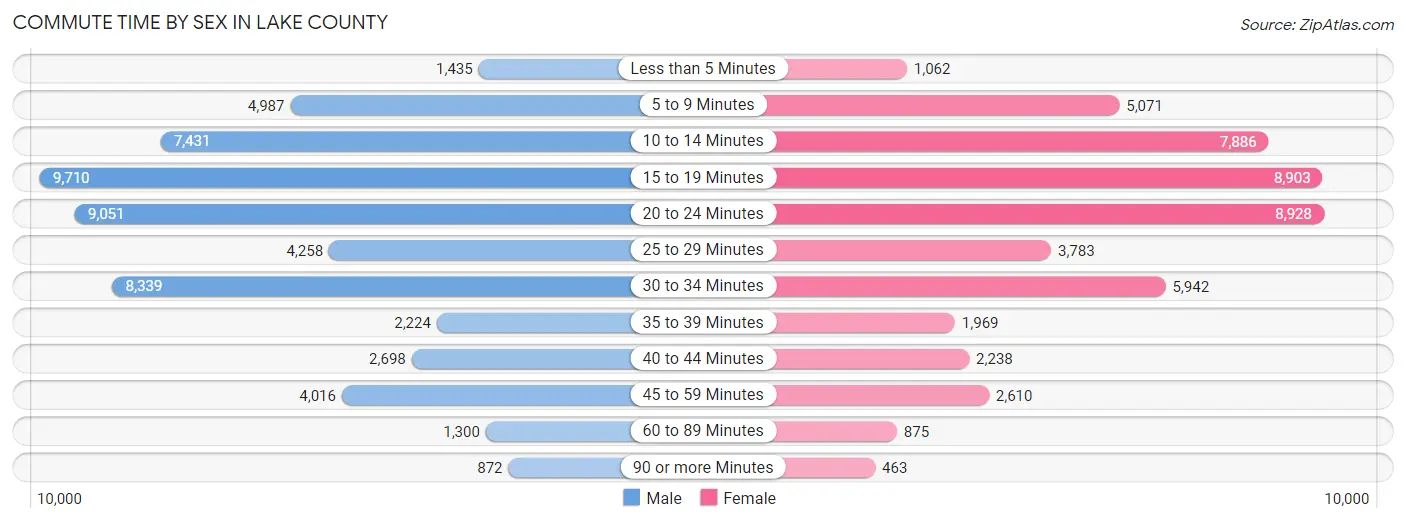
| Commute Time | Male | Female |
| Less than 5 Minutes | 1,435 (2.5%) | 1,062 (2.1%) |
| 5 to 9 Minutes | 4,987 (8.8%) | 5,071 (10.2%) |
| 10 to 14 Minutes | 7,431 (13.2%) | 7,886 (15.9%) |
| 15 to 19 Minutes | 9,710 (17.2%) | 8,903 (17.9%) |
| 20 to 24 Minutes | 9,051 (16.1%) | 8,928 (17.9%) |
| 25 to 29 Minutes | 4,258 (7.6%) | 3,783 (7.6%) |
| 30 to 34 Minutes | 8,339 (14.8%) | 5,942 (11.9%) |
| 35 to 39 Minutes | 2,224 (4.0%) | 1,969 (4.0%) |
| 40 to 44 Minutes | 2,698 (4.8%) | 2,238 (4.5%) |
| 45 to 59 Minutes | 4,016 (7.1%) | 2,610 (5.2%) |
| 60 to 89 Minutes | 1,300 (2.3%) | 875 (1.8%) |
| 90 or more Minutes | 872 (1.5%) | 463 (0.9%) |
Time of Departure to Work by Sex in Lake County
The most frequent times of departure to work in Lake County are 7:00 AM to 7:29 AM (7,873, 14.0%) for males and 7:00 AM to 7:29 AM (7,552, 15.2%) for females.
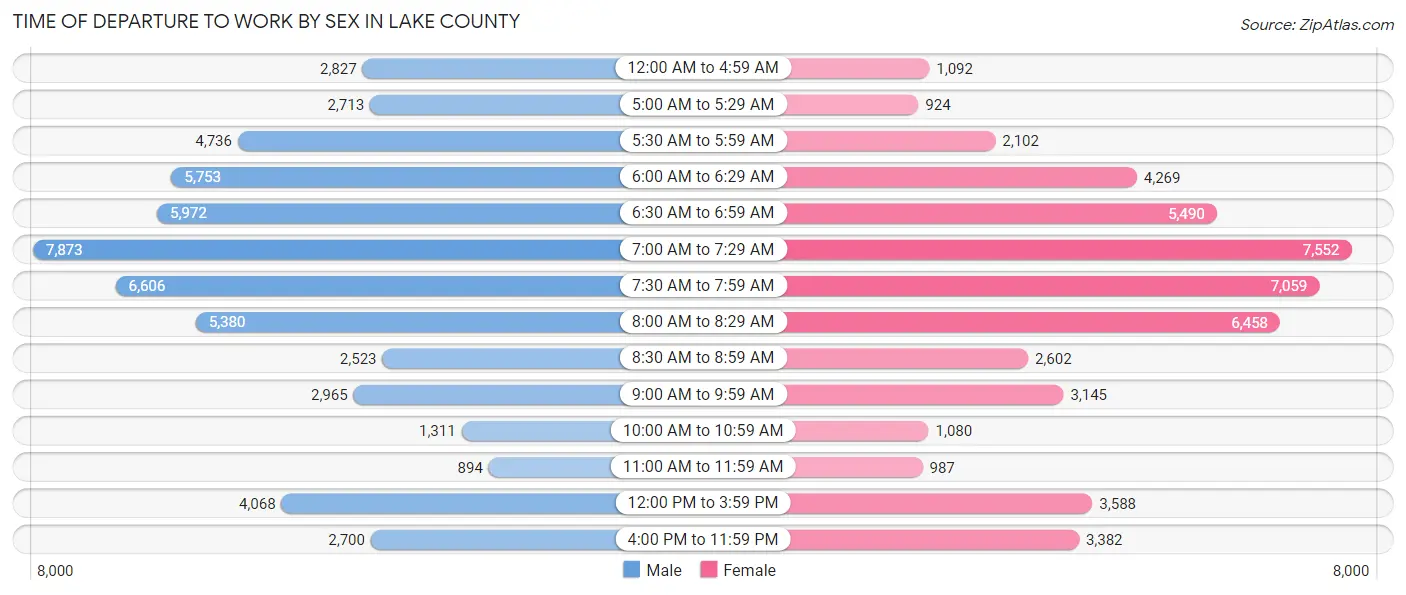
| Time of Departure | Male | Female |
| 12:00 AM to 4:59 AM | 2,827 (5.0%) | 1,092 (2.2%) |
| 5:00 AM to 5:29 AM | 2,713 (4.8%) | 924 (1.9%) |
| 5:30 AM to 5:59 AM | 4,736 (8.4%) | 2,102 (4.2%) |
| 6:00 AM to 6:29 AM | 5,753 (10.2%) | 4,269 (8.6%) |
| 6:30 AM to 6:59 AM | 5,972 (10.6%) | 5,490 (11.0%) |
| 7:00 AM to 7:29 AM | 7,873 (14.0%) | 7,552 (15.2%) |
| 7:30 AM to 7:59 AM | 6,606 (11.7%) | 7,059 (14.2%) |
| 8:00 AM to 8:29 AM | 5,380 (9.6%) | 6,458 (13.0%) |
| 8:30 AM to 8:59 AM | 2,523 (4.5%) | 2,602 (5.2%) |
| 9:00 AM to 9:59 AM | 2,965 (5.3%) | 3,145 (6.3%) |
| 10:00 AM to 10:59 AM | 1,311 (2.3%) | 1,080 (2.2%) |
| 11:00 AM to 11:59 AM | 894 (1.6%) | 987 (2.0%) |
| 12:00 PM to 3:59 PM | 4,068 (7.2%) | 3,588 (7.2%) |
| 4:00 PM to 11:59 PM | 2,700 (4.8%) | 3,382 (6.8%) |
| Total | 56,321 (100.0%) | 49,730 (100.0%) |
Housing Occupancy in Lake County
Occupancy by Ownership in Lake County
Of the total 99,324 dwellings in Lake County, owner-occupied units account for 74,229 (74.7%), while renter-occupied units make up 25,095 (25.3%).
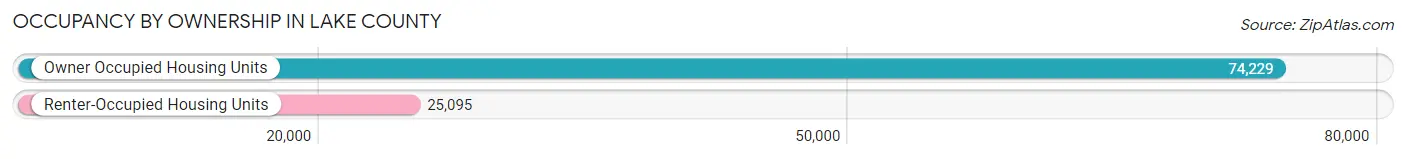
| Occupancy | # Housing Units | % Housing Units |
| Owner Occupied Housing Units | 74,229 | 74.7% |
| Renter-Occupied Housing Units | 25,095 | 25.3% |
| Total Occupied Housing Units | 99,324 | 100.0% |
Occupancy by Household Size in Lake County
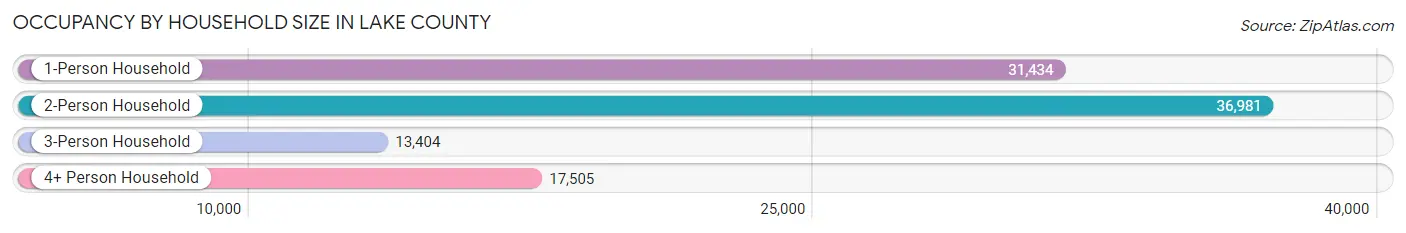
| Household Size | # Housing Units | % Housing Units |
| 1-Person Household | 31,434 | 31.7% |
| 2-Person Household | 36,981 | 37.2% |
| 3-Person Household | 13,404 | 13.5% |
| 4+ Person Household | 17,505 | 17.6% |
| Total Housing Units | 99,324 | 100.0% |
Occupancy by Ownership by Household Size in Lake County
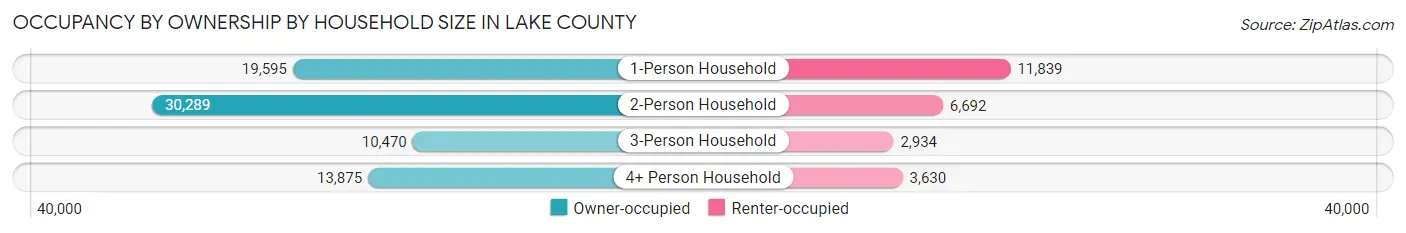
| Household Size | Owner-occupied | Renter-occupied |
| 1-Person Household | 19,595 (62.3%) | 11,839 (37.7%) |
| 2-Person Household | 30,289 (81.9%) | 6,692 (18.1%) |
| 3-Person Household | 10,470 (78.1%) | 2,934 (21.9%) |
| 4+ Person Household | 13,875 (79.3%) | 3,630 (20.7%) |
| Total Housing Units | 74,229 (74.7%) | 25,095 (25.3%) |
Occupancy by Educational Attainment in Lake County
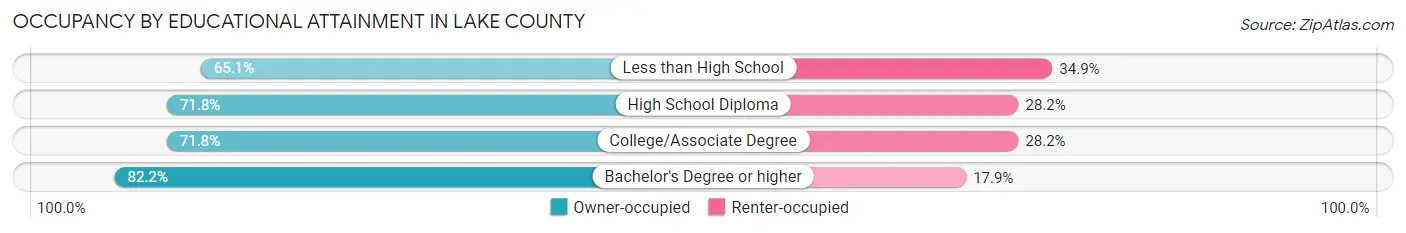
| Household Size | Owner-occupied | Renter-occupied |
| Less than High School | 3,603 (65.1%) | 1,935 (34.9%) |
| High School Diploma | 20,437 (71.8%) | 8,040 (28.2%) |
| College/Associate Degree | 23,990 (71.8%) | 9,428 (28.2%) |
| Bachelor's Degree or higher | 26,199 (82.2%) | 5,692 (17.8%) |
Occupancy by Age of Householder in Lake County
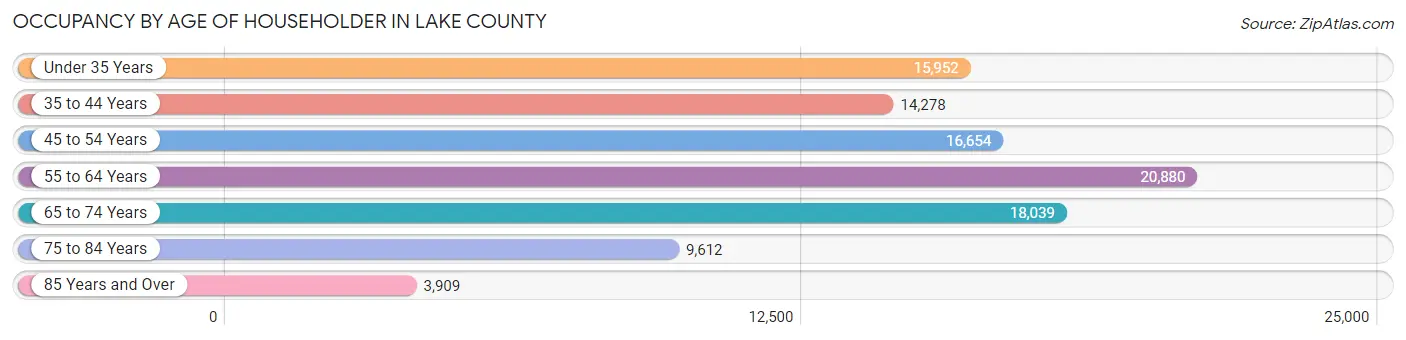
| Age Bracket | # Households | % Households |
| Under 35 Years | 15,952 | 16.1% |
| 35 to 44 Years | 14,278 | 14.4% |
| 45 to 54 Years | 16,654 | 16.8% |
| 55 to 64 Years | 20,880 | 21.0% |
| 65 to 74 Years | 18,039 | 18.2% |
| 75 to 84 Years | 9,612 | 9.7% |
| 85 Years and Over | 3,909 | 3.9% |
| Total | 99,324 | 100.0% |
Housing Finances in Lake County
Median Income by Occupancy in Lake County
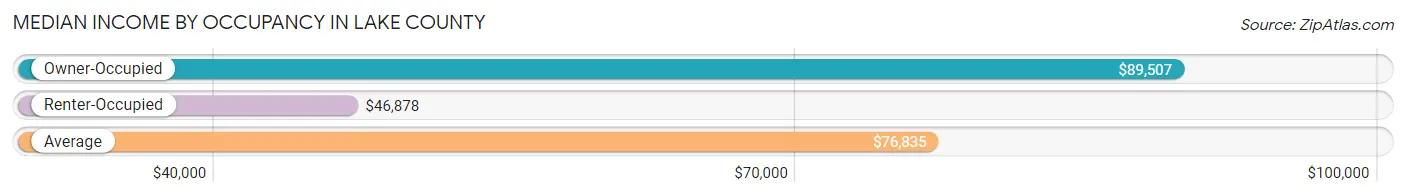
| Occupancy Type | # Households | Median Income |
| Owner-Occupied | 74,229 (74.7%) | $89,507 |
| Renter-Occupied | 25,095 (25.3%) | $46,878 |
| Average | 99,324 (100.0%) | $76,835 |
Occupancy by Householder Income Bracket in Lake County
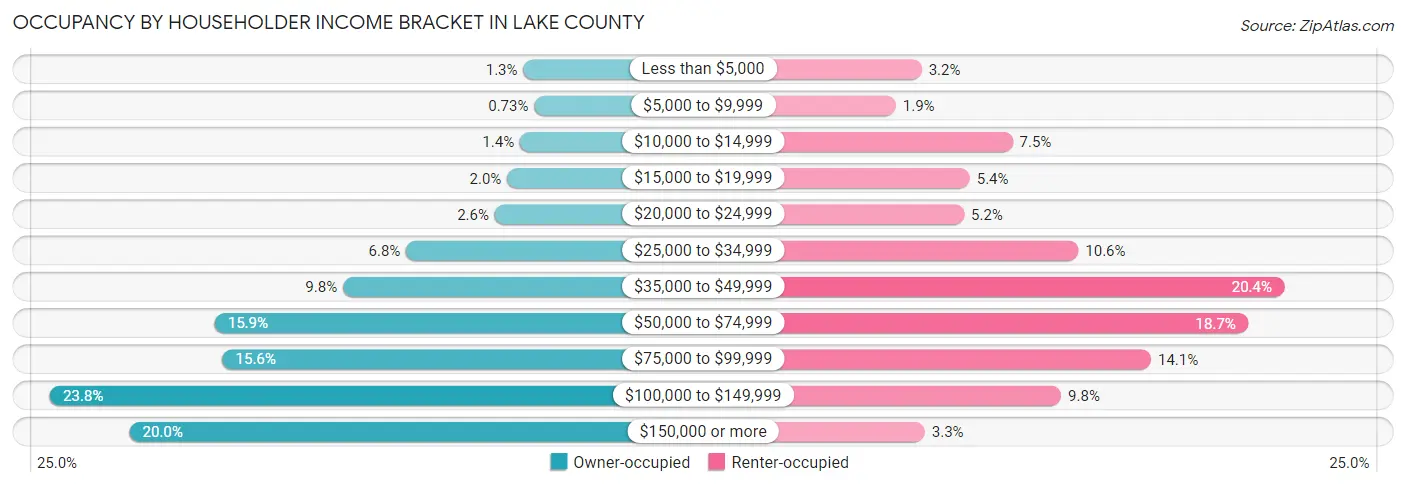
| Income Bracket | Owner-occupied | Renter-occupied |
| Less than $5,000 | 931 (1.3%) | 790 (3.2%) |
| $5,000 to $9,999 | 542 (0.7%) | 483 (1.9%) |
| $10,000 to $14,999 | 1,048 (1.4%) | 1,878 (7.5%) |
| $15,000 to $19,999 | 1,503 (2.0%) | 1,366 (5.4%) |
| $20,000 to $24,999 | 1,940 (2.6%) | 1,297 (5.2%) |
| $25,000 to $34,999 | 5,070 (6.8%) | 2,663 (10.6%) |
| $35,000 to $49,999 | 7,302 (9.8%) | 5,117 (20.4%) |
| $50,000 to $74,999 | 11,834 (15.9%) | 4,685 (18.7%) |
| $75,000 to $99,999 | 11,559 (15.6%) | 3,531 (14.1%) |
| $100,000 to $149,999 | 17,656 (23.8%) | 2,457 (9.8%) |
| $150,000 or more | 14,844 (20.0%) | 828 (3.3%) |
| Total | 74,229 (100.0%) | 25,095 (100.0%) |
Monthly Housing Cost Tiers in Lake County
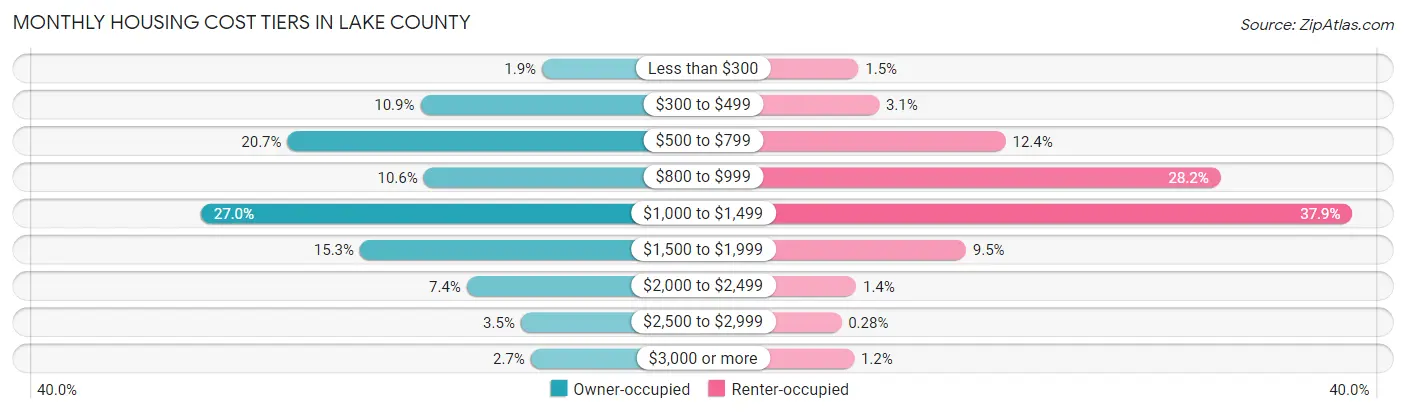
| Monthly Cost | Owner-occupied | Renter-occupied |
| Less than $300 | 1,414 (1.9%) | 387 (1.5%) |
| $300 to $499 | 8,064 (10.9%) | 767 (3.1%) |
| $500 to $799 | 15,328 (20.6%) | 3,108 (12.4%) |
| $800 to $999 | 7,882 (10.6%) | 7,081 (28.2%) |
| $1,000 to $1,499 | 20,055 (27.0%) | 9,517 (37.9%) |
| $1,500 to $1,999 | 11,366 (15.3%) | 2,373 (9.5%) |
| $2,000 to $2,499 | 5,520 (7.4%) | 344 (1.4%) |
| $2,500 to $2,999 | 2,571 (3.5%) | 70 (0.3%) |
| $3,000 or more | 2,029 (2.7%) | 307 (1.2%) |
| Total | 74,229 (100.0%) | 25,095 (100.0%) |
Physical Housing Characteristics in Lake County
Housing Structures in Lake County
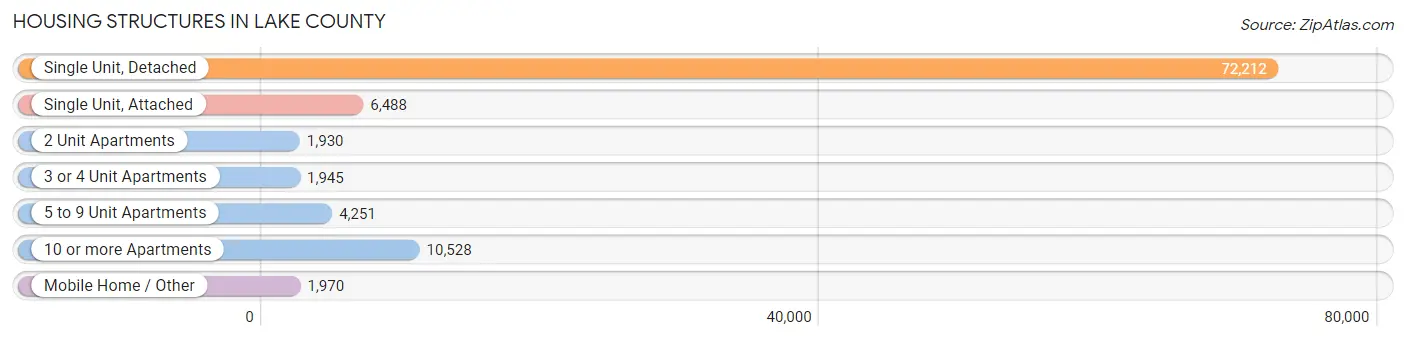
| Structure Type | # Housing Units | % Housing Units |
| Single Unit, Detached | 72,212 | 72.7% |
| Single Unit, Attached | 6,488 | 6.5% |
| 2 Unit Apartments | 1,930 | 1.9% |
| 3 or 4 Unit Apartments | 1,945 | 2.0% |
| 5 to 9 Unit Apartments | 4,251 | 4.3% |
| 10 or more Apartments | 10,528 | 10.6% |
| Mobile Home / Other | 1,970 | 2.0% |
| Total | 99,324 | 100.0% |
Housing Structures by Occupancy in Lake County
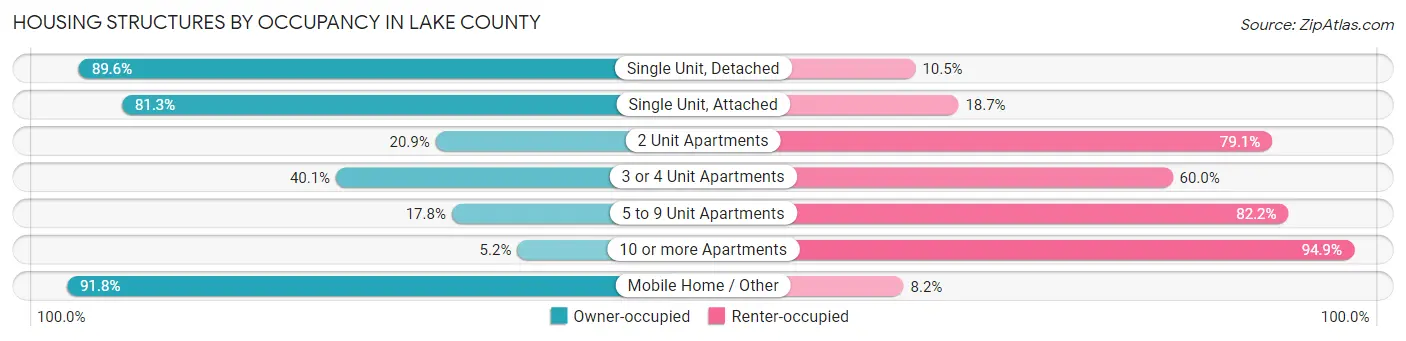
| Structure Type | Owner-occupied | Renter-occupied |
| Single Unit, Detached | 64,668 (89.5%) | 7,544 (10.4%) |
| Single Unit, Attached | 5,273 (81.3%) | 1,215 (18.7%) |
| 2 Unit Apartments | 403 (20.9%) | 1,527 (79.1%) |
| 3 or 4 Unit Apartments | 779 (40.1%) | 1,166 (60.0%) |
| 5 to 9 Unit Apartments | 755 (17.8%) | 3,496 (82.2%) |
| 10 or more Apartments | 542 (5.1%) | 9,986 (94.9%) |
| Mobile Home / Other | 1,809 (91.8%) | 161 (8.2%) |
| Total | 74,229 (74.7%) | 25,095 (25.3%) |
Housing Structures by Number of Rooms in Lake County
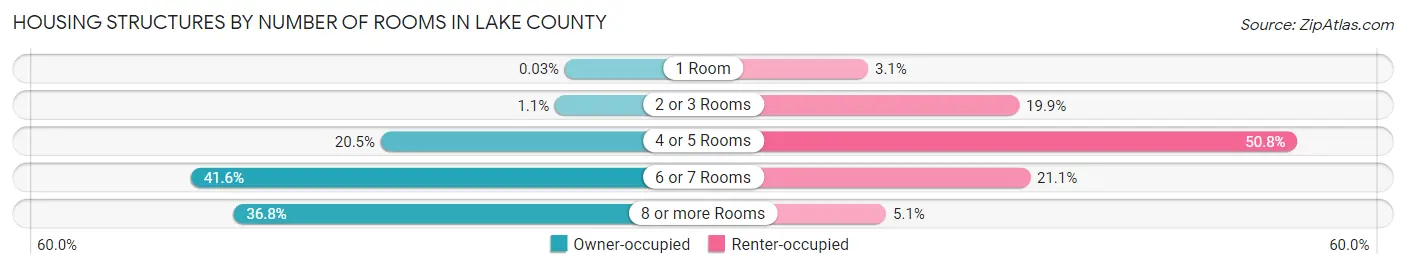
| Number of Rooms | Owner-occupied | Renter-occupied |
| 1 Room | 22 (0.0%) | 784 (3.1%) |
| 2 or 3 Rooms | 836 (1.1%) | 4,991 (19.9%) |
| 4 or 5 Rooms | 15,190 (20.5%) | 12,740 (50.8%) |
| 6 or 7 Rooms | 30,848 (41.6%) | 5,296 (21.1%) |
| 8 or more Rooms | 27,333 (36.8%) | 1,284 (5.1%) |
| Total | 74,229 (100.0%) | 25,095 (100.0%) |
Housing Structure by Heating Type in Lake County
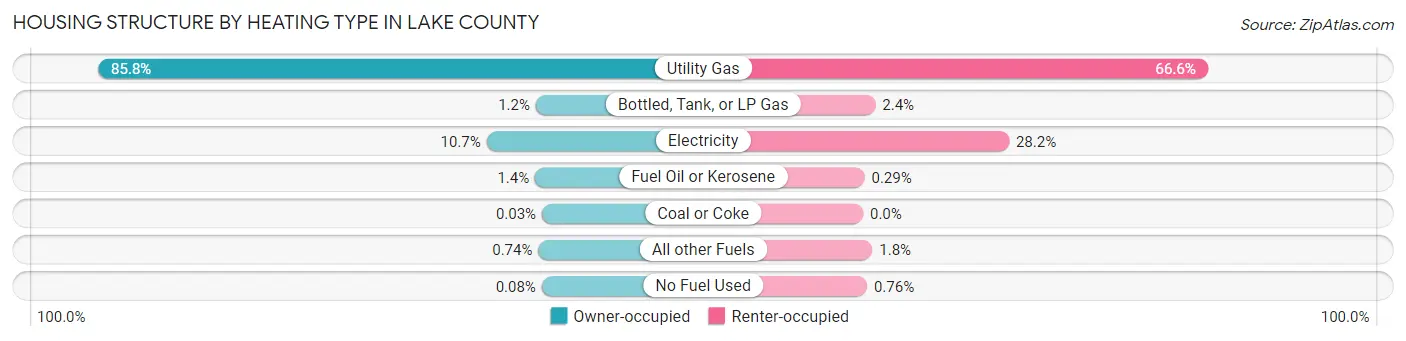
| Heating Type | Owner-occupied | Renter-occupied |
| Utility Gas | 63,709 (85.8%) | 16,708 (66.6%) |
| Bottled, Tank, or LP Gas | 906 (1.2%) | 598 (2.4%) |
| Electricity | 7,963 (10.7%) | 7,077 (28.2%) |
| Fuel Oil or Kerosene | 1,019 (1.4%) | 73 (0.3%) |
| Coal or Coke | 20 (0.0%) | 0 (0.0%) |
| All other Fuels | 549 (0.7%) | 448 (1.8%) |
| No Fuel Used | 63 (0.1%) | 191 (0.8%) |
| Total | 74,229 (100.0%) | 25,095 (100.0%) |
Household Vehicle Usage in Lake County
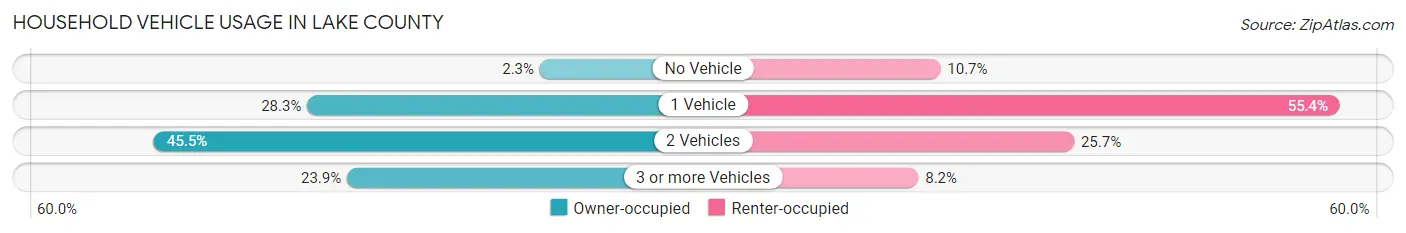
| Vehicles per Household | Owner-occupied | Renter-occupied |
| No Vehicle | 1,689 (2.3%) | 2,682 (10.7%) |
| 1 Vehicle | 21,035 (28.3%) | 13,911 (55.4%) |
| 2 Vehicles | 33,778 (45.5%) | 6,440 (25.7%) |
| 3 or more Vehicles | 17,727 (23.9%) | 2,062 (8.2%) |
| Total | 74,229 (100.0%) | 25,095 (100.0%) |
Real Estate & Mortgages in Lake County
Real Estate and Mortgage Overview in Lake County
| Characteristic | Without Mortgage | With Mortgage |
| Housing Units | 28,107 | 46,122 |
| Median Property Value | $179,700 | $195,400 |
| Median Household Income | $66,187 | $10,572 |
| Monthly Housing Costs | $602 | $1,897 |
| Real Estate Taxes | $3,147 | $660 |
Property Value by Mortgage Status in Lake County
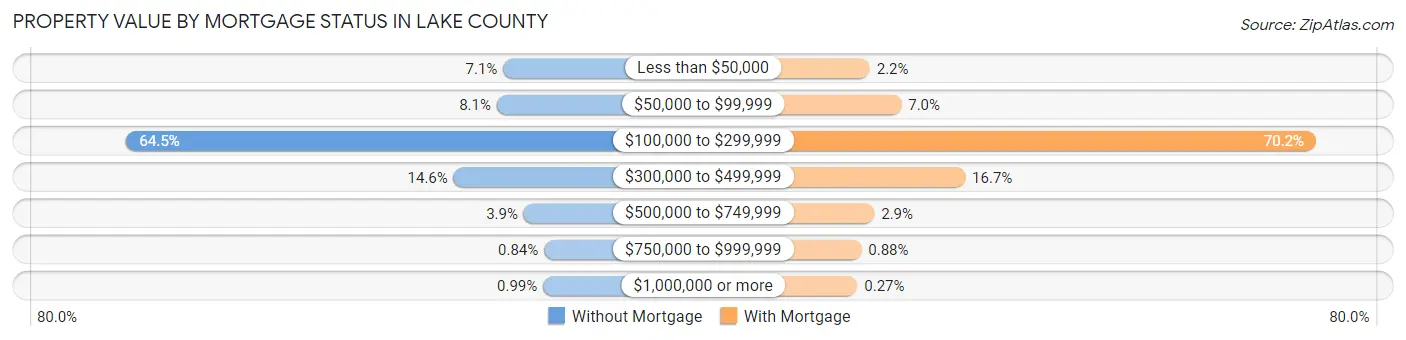
| Property Value | Without Mortgage | With Mortgage |
| Less than $50,000 | 1,989 (7.1%) | 1,000 (2.2%) |
| $50,000 to $99,999 | 2,264 (8.1%) | 3,214 (7.0%) |
| $100,000 to $299,999 | 18,124 (64.5%) | 32,354 (70.2%) |
| $300,000 to $499,999 | 4,111 (14.6%) | 7,704 (16.7%) |
| $500,000 to $749,999 | 1,104 (3.9%) | 1,318 (2.9%) |
| $750,000 to $999,999 | 236 (0.8%) | 408 (0.9%) |
| $1,000,000 or more | 279 (1.0%) | 124 (0.3%) |
| Total | 28,107 (100.0%) | 46,122 (100.0%) |
Household Income by Mortgage Status in Lake County
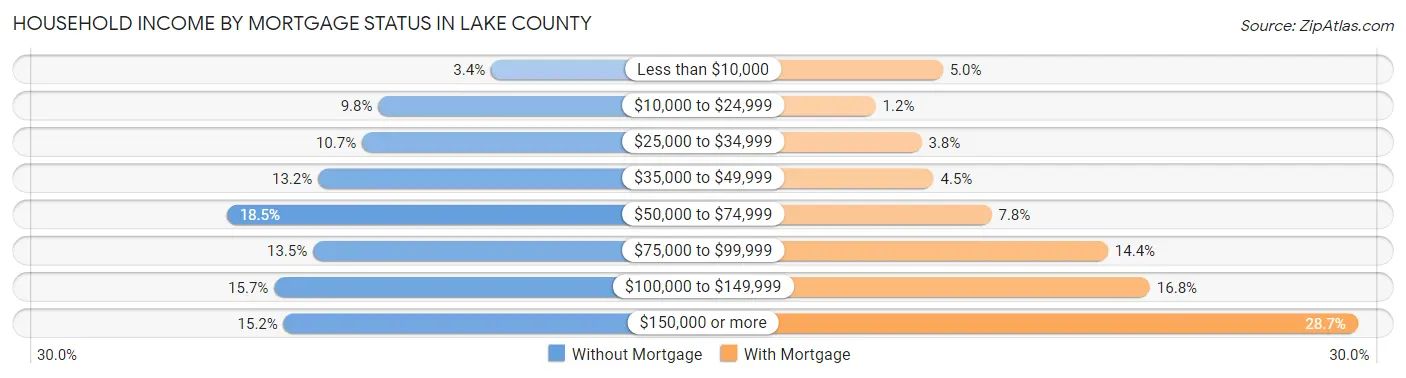
| Household Income | Without Mortgage | With Mortgage |
| Less than $10,000 | 942 (3.4%) | 2,298 (5.0%) |
| $10,000 to $24,999 | 2,753 (9.8%) | 531 (1.1%) |
| $25,000 to $34,999 | 3,014 (10.7%) | 1,738 (3.8%) |
| $35,000 to $49,999 | 3,719 (13.2%) | 2,056 (4.5%) |
| $50,000 to $74,999 | 5,185 (18.4%) | 3,583 (7.8%) |
| $75,000 to $99,999 | 3,799 (13.5%) | 6,649 (14.4%) |
| $100,000 to $149,999 | 4,423 (15.7%) | 7,760 (16.8%) |
| $150,000 or more | 4,272 (15.2%) | 13,233 (28.7%) |
| Total | 28,107 (100.0%) | 46,122 (100.0%) |
Property Value to Household Income Ratio in Lake County
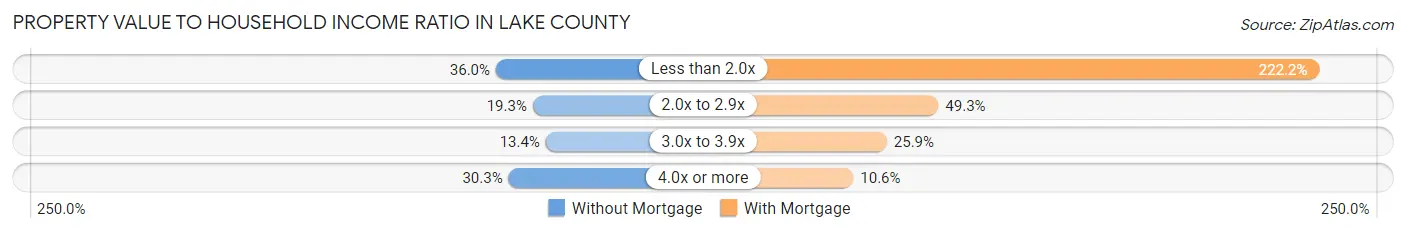
| Value-to-Income Ratio | Without Mortgage | With Mortgage |
| Less than 2.0x | 10,129 (36.0%) | 102,467 (222.2%) |
| 2.0x to 2.9x | 5,421 (19.3%) | 22,718 (49.3%) |
| 3.0x to 3.9x | 3,769 (13.4%) | 11,925 (25.9%) |
| 4.0x or more | 8,517 (30.3%) | 4,907 (10.6%) |
| Total | 28,107 (100.0%) | 46,122 (100.0%) |
Real Estate Taxes by Mortgage Status in Lake County
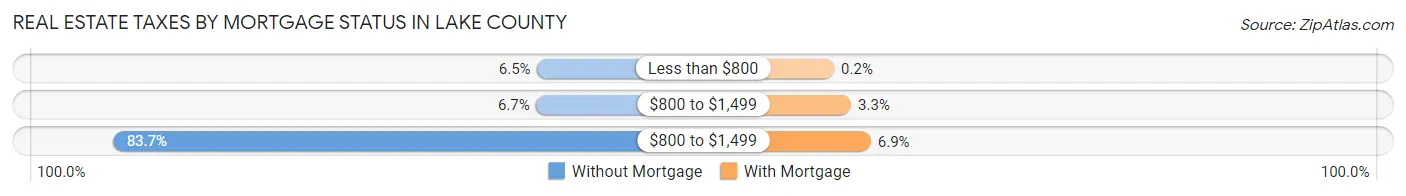
| Property Taxes | Without Mortgage | With Mortgage |
| Less than $800 | 1,831 (6.5%) | 92 (0.2%) |
| $800 to $1,499 | 1,874 (6.7%) | 1,526 (3.3%) |
| $800 to $1,499 | 23,530 (83.7%) | 3,184 (6.9%) |
| Total | 28,107 (100.0%) | 46,122 (100.0%) |
Health & Disability in Lake County
Health Insurance Coverage by Age in Lake County
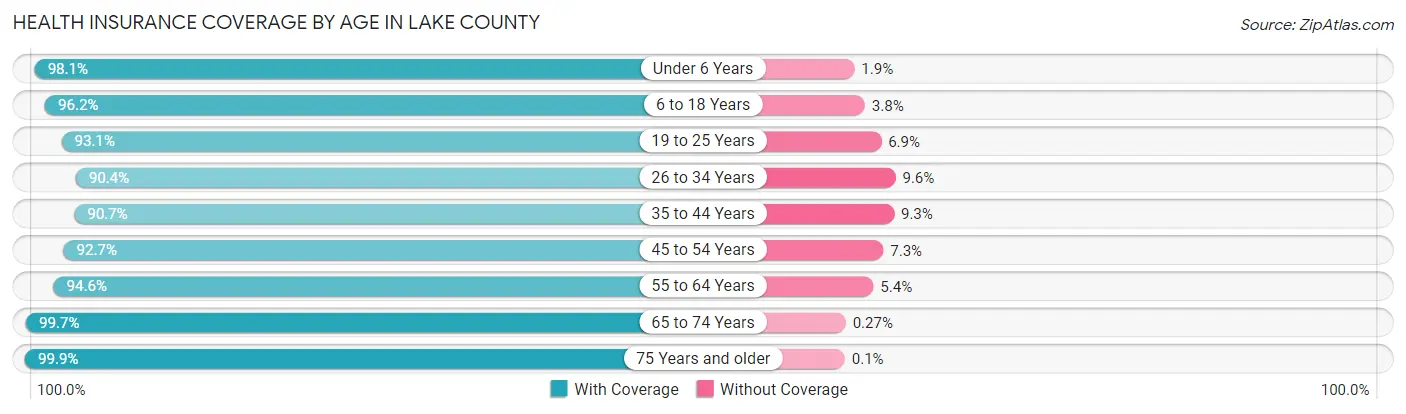
| Age Bracket | With Coverage | Without Coverage |
| Under 6 Years | 12,918 (98.1%) | 249 (1.9%) |
| 6 to 18 Years | 33,490 (96.2%) | 1,337 (3.8%) |
| 19 to 25 Years | 17,547 (93.1%) | 1,298 (6.9%) |
| 26 to 34 Years | 22,404 (90.4%) | 2,369 (9.6%) |
| 35 to 44 Years | 24,478 (90.7%) | 2,502 (9.3%) |
| 45 to 54 Years | 27,425 (92.7%) | 2,154 (7.3%) |
| 55 to 64 Years | 33,408 (94.6%) | 1,919 (5.4%) |
| 65 to 74 Years | 27,428 (99.7%) | 73 (0.3%) |
| 75 Years and older | 19,295 (99.9%) | 19 (0.1%) |
| Total | 218,393 (94.8%) | 11,920 (5.2%) |
Health Insurance Coverage by Citizenship Status in Lake County
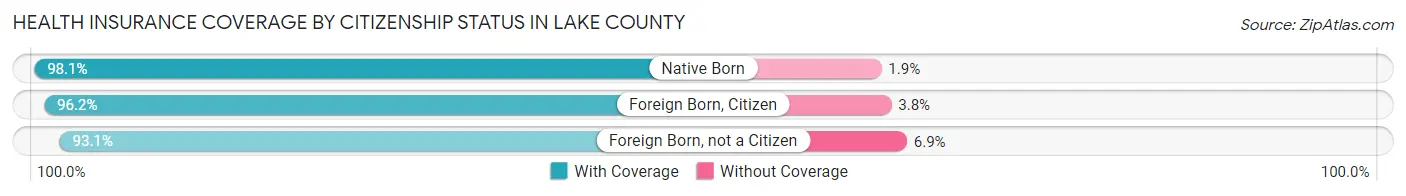
| Citizenship Status | With Coverage | Without Coverage |
| Native Born | 12,918 (98.1%) | 249 (1.9%) |
| Foreign Born, Citizen | 33,490 (96.2%) | 1,337 (3.8%) |
| Foreign Born, not a Citizen | 17,547 (93.1%) | 1,298 (6.9%) |
Health Insurance Coverage by Household Income in Lake County
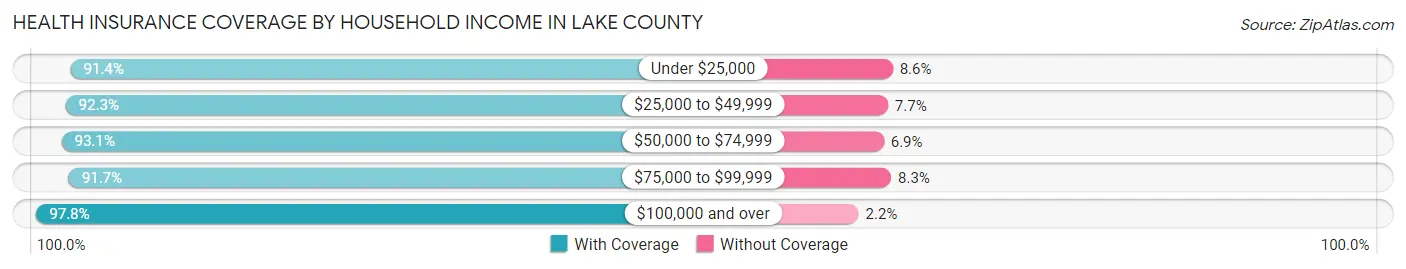
| Household Income | With Coverage | Without Coverage |
| Under $25,000 | 15,149 (91.4%) | 1,428 (8.6%) |
| $25,000 to $49,999 | 33,067 (92.3%) | 2,759 (7.7%) |
| $50,000 to $74,999 | 31,329 (93.1%) | 2,334 (6.9%) |
| $75,000 to $99,999 | 32,935 (91.7%) | 2,982 (8.3%) |
| $100,000 and over | 105,022 (97.8%) | 2,372 (2.2%) |
Public vs Private Health Insurance Coverage by Age in Lake County
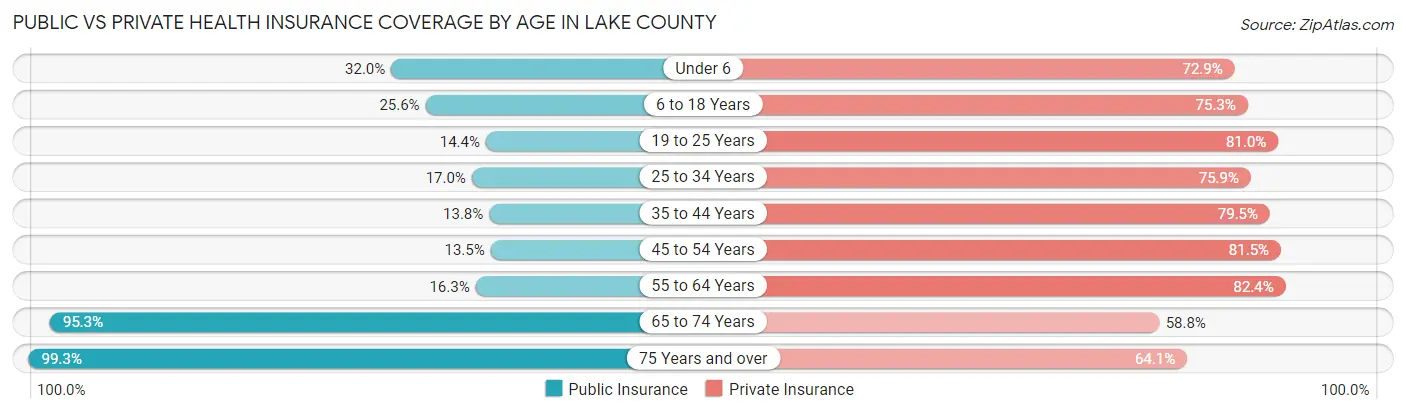
| Age Bracket | Public Insurance | Private Insurance |
| Under 6 | 4,210 (32.0%) | 9,599 (72.9%) |
| 6 to 18 Years | 8,915 (25.6%) | 26,230 (75.3%) |
| 19 to 25 Years | 2,714 (14.4%) | 15,262 (81.0%) |
| 25 to 34 Years | 4,215 (17.0%) | 18,806 (75.9%) |
| 35 to 44 Years | 3,719 (13.8%) | 21,436 (79.4%) |
| 45 to 54 Years | 3,997 (13.5%) | 24,108 (81.5%) |
| 55 to 64 Years | 5,761 (16.3%) | 29,100 (82.4%) |
| 65 to 74 Years | 26,214 (95.3%) | 16,177 (58.8%) |
| 75 Years and over | 19,172 (99.3%) | 12,376 (64.1%) |
| Total | 78,917 (34.3%) | 173,094 (75.2%) |
Disability Status by Sex by Age in Lake County
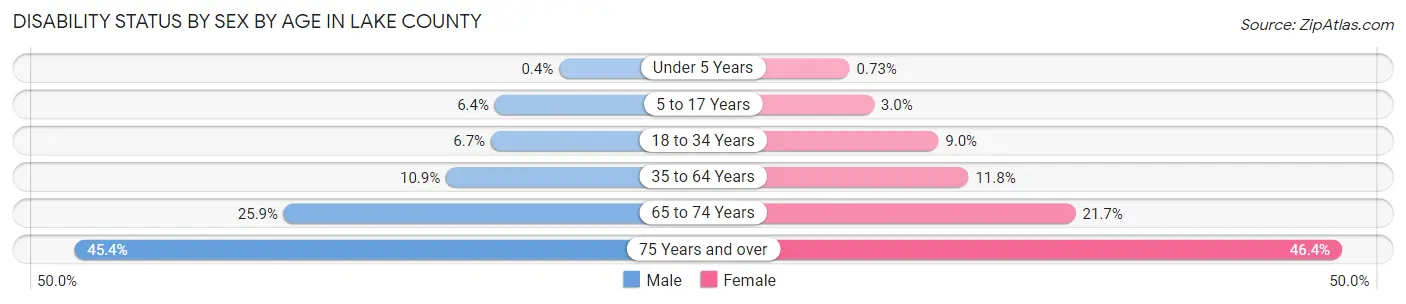
| Age Bracket | Male | Female |
| Under 5 Years | 23 (0.4%) | 39 (0.7%) |
| 5 to 17 Years | 1,127 (6.4%) | 499 (3.0%) |
| 18 to 34 Years | 1,581 (6.7%) | 2,024 (9.0%) |
| 35 to 64 Years | 4,988 (10.9%) | 5,420 (11.8%) |
| 65 to 74 Years | 3,385 (25.9%) | 3,137 (21.7%) |
| 75 Years and over | 3,544 (45.4%) | 5,339 (46.4%) |
Disability Class by Sex by Age in Lake County
Disability Class: Hearing Difficulty
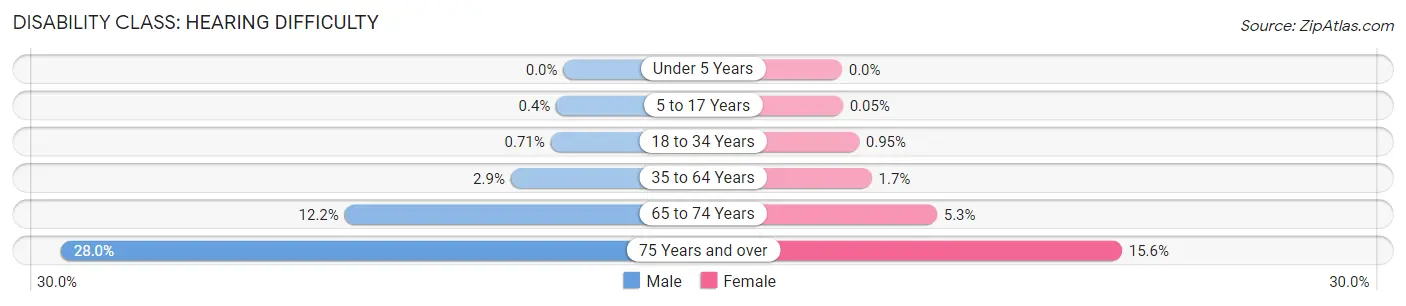
| Age Bracket | Male | Female |
| Under 5 Years | 0 (0.0%) | 0 (0.0%) |
| 5 to 17 Years | 71 (0.4%) | 8 (0.1%) |
| 18 to 34 Years | 167 (0.7%) | 215 (0.9%) |
| 35 to 64 Years | 1,341 (2.9%) | 764 (1.7%) |
| 65 to 74 Years | 1,589 (12.2%) | 764 (5.3%) |
| 75 Years and over | 2,185 (28.0%) | 1,794 (15.6%) |
Disability Class: Vision Difficulty
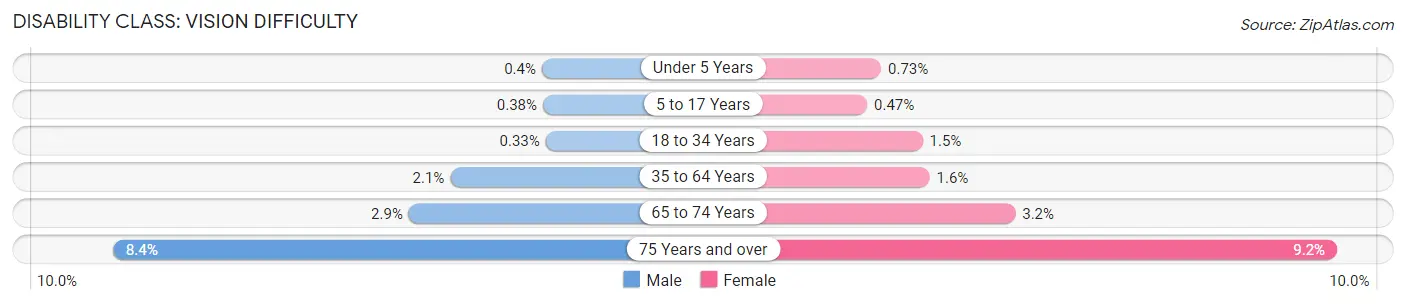
| Age Bracket | Male | Female |
| Under 5 Years | 23 (0.4%) | 39 (0.7%) |
| 5 to 17 Years | 68 (0.4%) | 79 (0.5%) |
| 18 to 34 Years | 78 (0.3%) | 340 (1.5%) |
| 35 to 64 Years | 960 (2.1%) | 750 (1.6%) |
| 65 to 74 Years | 375 (2.9%) | 465 (3.2%) |
| 75 Years and over | 653 (8.4%) | 1,057 (9.2%) |
Disability Class: Cognitive Difficulty
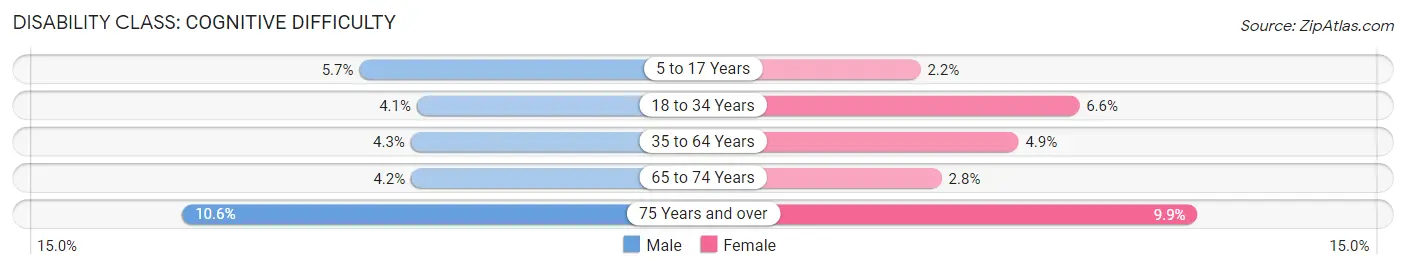
| Age Bracket | Male | Female |
| 5 to 17 Years | 1,008 (5.7%) | 367 (2.2%) |
| 18 to 34 Years | 960 (4.1%) | 1,493 (6.6%) |
| 35 to 64 Years | 1,947 (4.3%) | 2,267 (4.9%) |
| 65 to 74 Years | 553 (4.2%) | 402 (2.8%) |
| 75 Years and over | 829 (10.6%) | 1,139 (9.9%) |
Disability Class: Ambulatory Difficulty
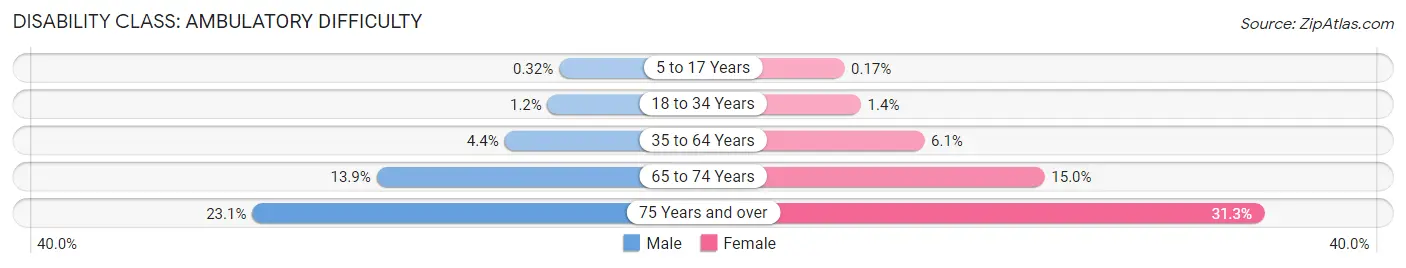
| Age Bracket | Male | Female |
| 5 to 17 Years | 56 (0.3%) | 28 (0.2%) |
| 18 to 34 Years | 276 (1.2%) | 317 (1.4%) |
| 35 to 64 Years | 2,000 (4.4%) | 2,817 (6.1%) |
| 65 to 74 Years | 1,809 (13.9%) | 2,174 (15.0%) |
| 75 Years and over | 1,804 (23.1%) | 3,604 (31.3%) |
Disability Class: Self-Care Difficulty
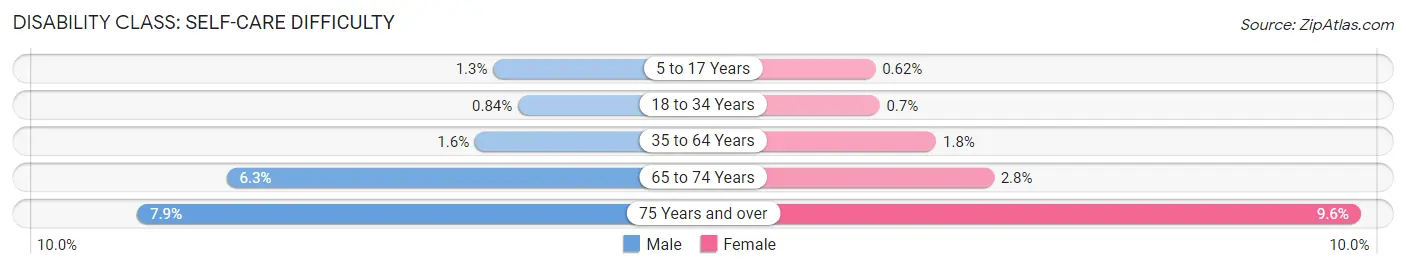
| Age Bracket | Male | Female |
| 5 to 17 Years | 230 (1.3%) | 103 (0.6%) |
| 18 to 34 Years | 197 (0.8%) | 158 (0.7%) |
| 35 to 64 Years | 753 (1.6%) | 807 (1.8%) |
| 65 to 74 Years | 816 (6.2%) | 407 (2.8%) |
| 75 Years and over | 618 (7.9%) | 1,108 (9.6%) |
Technology Access in Lake County
Computing Device Access in Lake County
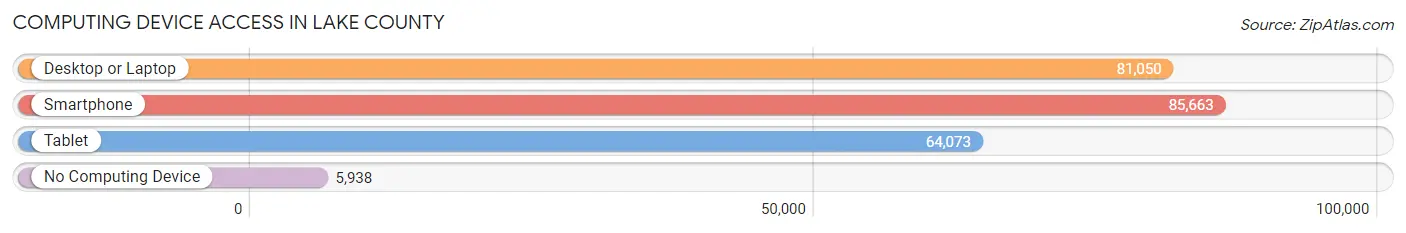
| Device Type | # Households | % Households |
| Desktop or Laptop | 81,050 | 81.6% |
| Smartphone | 85,663 | 86.3% |
| Tablet | 64,073 | 64.5% |
| No Computing Device | 5,938 | 6.0% |
| Total | 99,324 | 100.0% |
Internet Access in Lake County
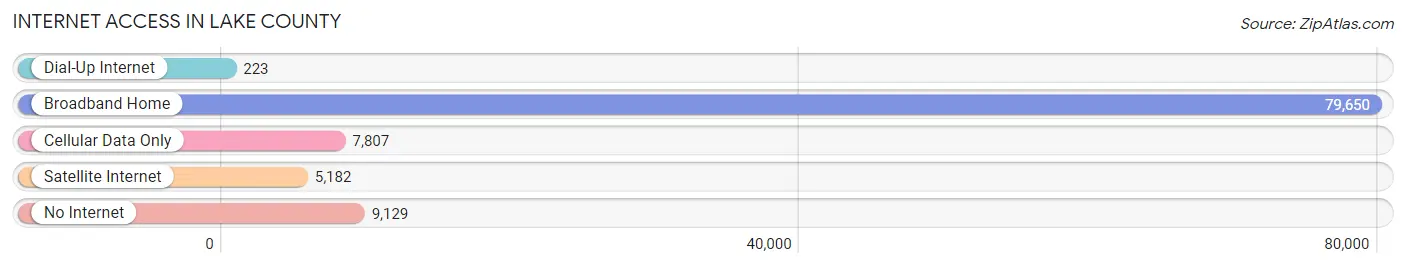
| Internet Type | # Households | % Households |
| Dial-Up Internet | 223 | 0.2% |
| Broadband Home | 79,650 | 80.2% |
| Cellular Data Only | 7,807 | 7.9% |
| Satellite Internet | 5,182 | 5.2% |
| No Internet | 9,129 | 9.2% |
| Total | 99,324 | 100.0% |
Lake County Summary
Lake County, Ohio is located in the northeastern corner of the state, and is part of the Cleveland-Akron-Canton metropolitan area. It is bordered by Cuyahoga County to the north, Geauga County to the east, Ashtabula County to the northeast, Trumbull County to the south, and Mahoning County to the west. The county seat is Painesville.
History
The area that is now Lake County was originally inhabited by the Erie, Iroquois, and Wyandot Native American tribes. The first European settlers arrived in the area in the late 1700s, and the county was officially established in 1840. The county was named for its many lakes, which were formed by glaciers during the last Ice Age.
The county was largely agricultural in the 19th century, with the main crops being wheat, corn, and oats. The county also had a thriving lumber industry, and the city of Painesville was a major port on Lake Erie.
In the 20th century, the county's economy shifted to manufacturing, with steel and automotive plants being the main employers. The county also became a popular tourist destination, with many people visiting the area for its lakes, beaches, and parks.
Geography
Lake County covers an area of 545 square miles, and is located in the northeastern corner of Ohio. It is bordered by Cuyahoga County to the north, Geauga County to the east, Ashtabula County to the northeast, Trumbull County to the south, and Mahoning County to the west.
The county is mostly flat, with some rolling hills in the northern and eastern parts. The highest point in the county is 1,092 feet above sea level, located in the eastern part of the county. The county is drained by the Grand River, which flows through the county from north to south.
The county is home to many lakes, including Lake Erie, Lake Chardon, Lake Lucerne, and Lake Milton. The county also has several parks, including Mentor Marsh State Nature Preserve, Headlands Beach State Park, and Lake Metroparks.
Economy
The economy of Lake County is largely based on manufacturing, with steel and automotive plants being the main employers. Other major industries in the county include healthcare, retail, and tourism.
The county is home to several large companies, including the Cleveland Clinic, the Cleveland Clinic Foundation, and the Cleveland Clinic Health System. The county is also home to several universities, including Lake Erie College, Lakeland Community College, and the University of Akron.
Demographics
As of the 2010 census, the population of Lake County was 230,041. The population is largely white (87.3%), with smaller percentages of African Americans (7.2%), Asians (2.2%), and Hispanics (2.1%). The median household income in the county is $50,945, and the median home value is $133,400.
The county is home to several large cities, including Painesville (population 19,563), Mentor (population 47,159), Willoughby (population 22,268), and Eastlake (population 18,577). The county also has several smaller towns, including Madison (population 3,845), Perry (population 2,945), and Concord (population 2,845).
Conclusion
Lake County, Ohio is a diverse and vibrant county located in the northeastern corner of the state. It is home to many lakes, parks, and other attractions, and has a strong economy based on manufacturing, healthcare, retail, and tourism. The county is home to several large cities and towns, and has a population that is largely white, with smaller percentages of African Americans, Asians, and Hispanics.
Common Questions
What is the Total Population of Lake County?
Total Population of Lake County is 232,236.
What is the Total Male Population of Lake County?
Total Male Population of Lake County is 114,317.
What is the Total Female Population of Lake County?
Total Female Population of Lake County is 117,919.
What is the Ratio of Males per 100 Females in Lake County?
There are 96.95 Males per 100 Females in Lake County.
What is the Ratio of Females per 100 Males in Lake County?
There are 103.15 Females per 100 Males in Lake County.
What is the Median Population Age in Lake County?
Median Population Age in Lake County is 43.9 Years.
What is the Average Family Size in Lake County
Average Family Size in Lake County is 2.9 People.
What is the Average Household Size in Lake County
Average Household Size in Lake County is 2.3 People.
What is Per Capita Income in Lake County?
Per Capita income in Lake County is $41,195.
What is the Median Family Income in Lake County?
Median Family Income in Lake County is $98,576.
What is the Median Household income in Lake County?
Median Household Income in Lake County is $76,835.
What is Income or Wage Gap in Lake County?
Income or Wage Gap in Lake County is 27.3%.
Women in Lake County earn 72.7 cents for every dollar earned by a man.
What is Family Income Deficit in Lake County?
Family Income Deficit in Lake County is $8,517.
Families that are below poverty line in Lake County earn $8,517 less on average than the poverty threshold level.
What is Inequality or Gini Index in Lake County?
Inequality or Gini Index in Lake County is 0.42.
How Large is the Labor Force in Lake County?
There are 126,064 People in the Labor Forcein in Lake County.
What is the Percentage of People in the Labor Force in Lake County?
65.4% of People are in the Labor Force in Lake County.
What is the Unemployment Rate in Lake County?
Unemployment Rate in Lake County is 4.4%.