Knox County, OH
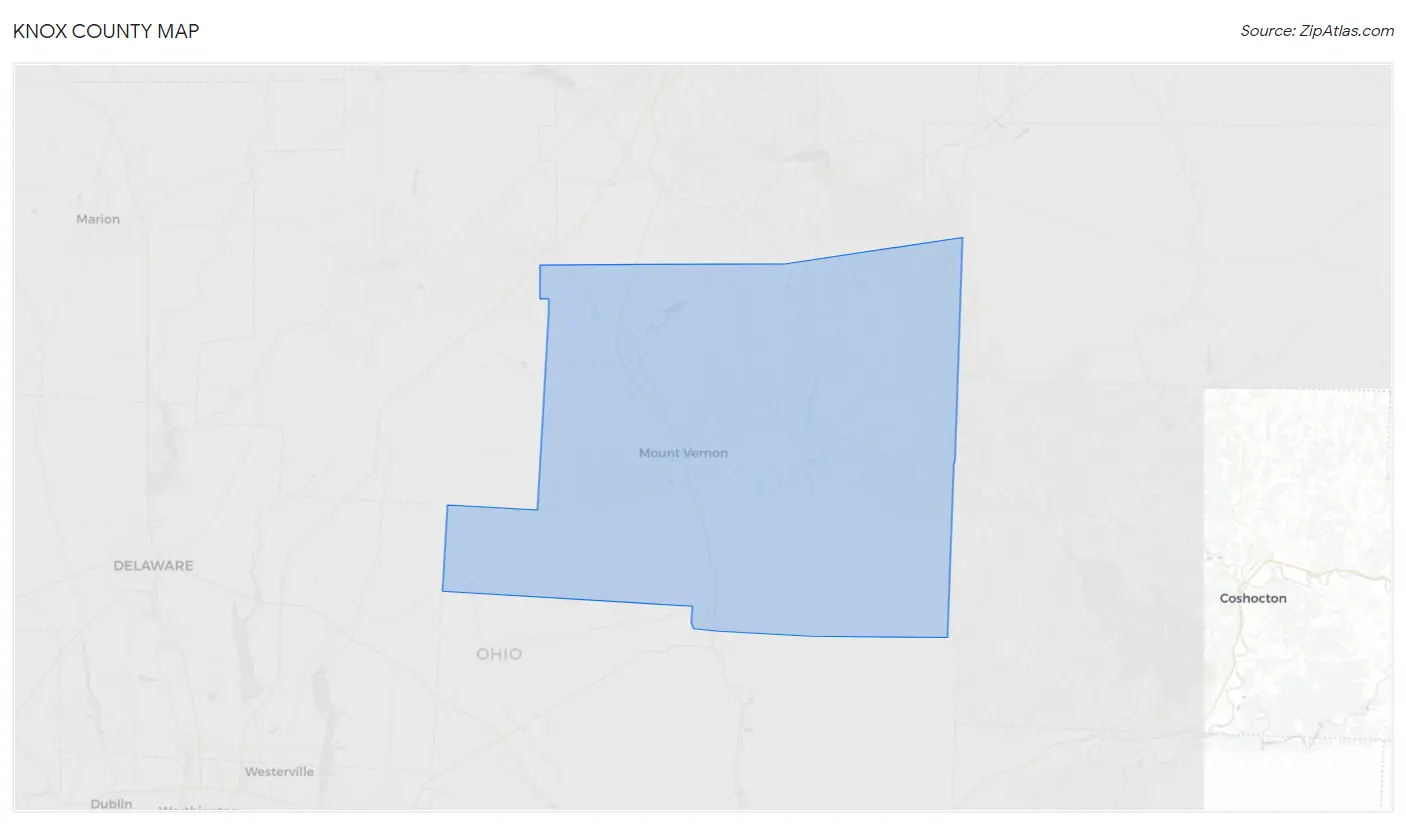
Knox County Map
Knox County Overview
62,657
TOTAL POPULATION
30,874
MALE POPULATION
31,783
FEMALE POPULATION
97.14
MALES / 100 FEMALES
102.94
FEMALES / 100 MALES
39.4
MEDIAN AGE
3.1
AVG FAMILY SIZE
2.6
AVG HOUSEHOLD SIZE
$32,543
PER CAPITA INCOME
$82,526
AVG FAMILY INCOME
$71,246
AVG HOUSEHOLD INCOME
41.7%
WAGE / INCOME GAP [ % ]
58.3¢/ $1
WAGE / INCOME GAP [ $ ]
$10,222
FAMILY INCOME DEFICIT
0.41
INEQUALITY / GINI INDEX
29,986
LABOR FORCE [ PEOPLE ]
60.0%
PERCENT IN LABOR FORCE
3.3%
UNEMPLOYMENT RATE
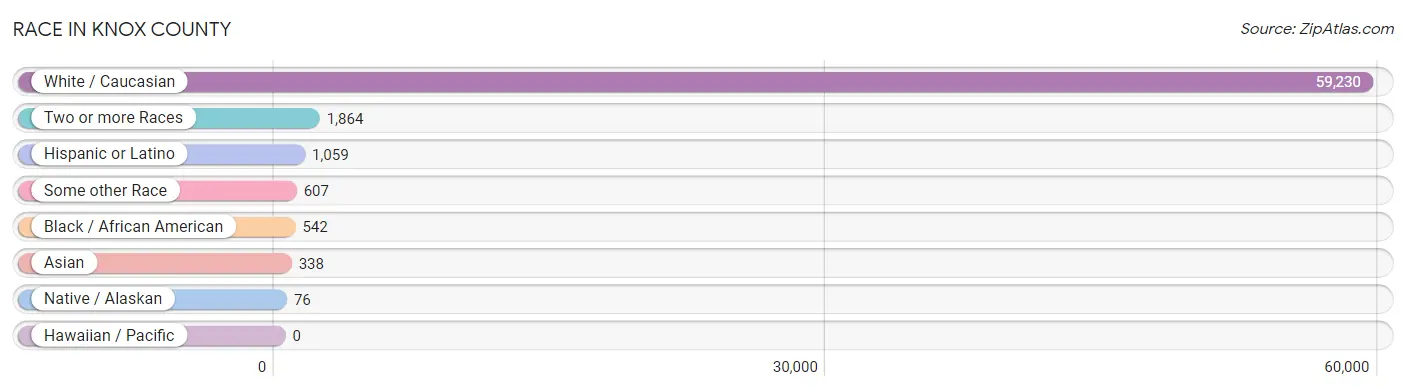
Race in Knox County
The most populous races in Knox County are White / Caucasian (59,230 | 94.5%), Two or more Races (1,864 | 3.0%), and Hispanic or Latino (1,059 | 1.7%).
| Race | # Population | % Population |
| Asian | 338 | 0.5% |
| Black / African American | 542 | 0.9% |
| Hawaiian / Pacific | 0 | 0.0% |
| Hispanic or Latino | 1,059 | 1.7% |
| Native / Alaskan | 76 | 0.1% |
| White / Caucasian | 59,230 | 94.5% |
| Two or more Races | 1,864 | 3.0% |
| Some other Race | 607 | 1.0% |
| Total | 62,657 | 100.0% |
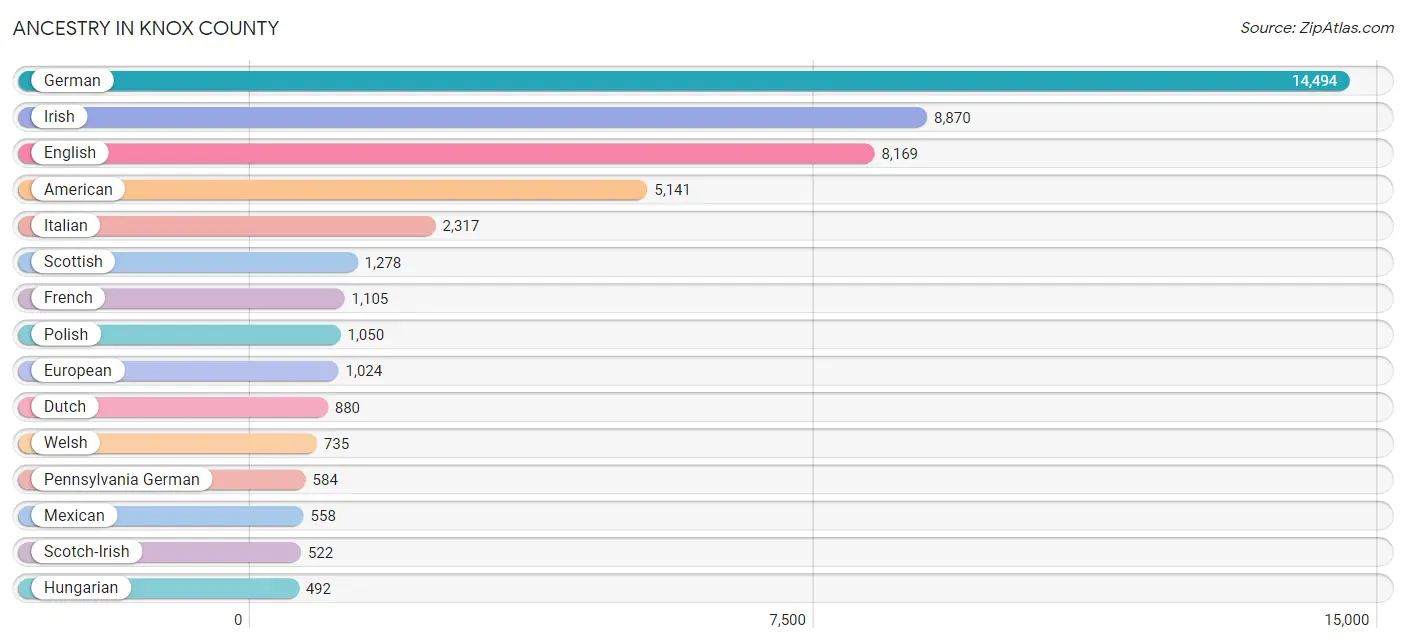
Ancestry in Knox County
The most populous ancestries reported in Knox County are German (14,494 | 23.1%), Irish (8,870 | 14.2%), English (8,169 | 13.0%), American (5,141 | 8.2%), and Italian (2,317 | 3.7%), together accounting for 62.2% of all Knox County residents.
| Ancestry | # Population | % Population |
| African | 127 | 0.2% |
| American | 5,141 | 8.2% |
| Apache | 20 | 0.0% |
| Arab | 51 | 0.1% |
| Armenian | 4 | 0.0% |
| Austrian | 284 | 0.4% |
| Basque | 11 | 0.0% |
| Belgian | 126 | 0.2% |
| Bhutanese | 91 | 0.2% |
| Blackfeet | 88 | 0.1% |
| Bolivian | 31 | 0.1% |
| British | 303 | 0.5% |
| Burmese | 16 | 0.0% |
| Canadian | 20 | 0.0% |
| Central American | 11 | 0.0% |
| Cherokee | 284 | 0.4% |
| Chilean | 20 | 0.0% |
| Chippewa | 2 | 0.0% |
| Colombian | 17 | 0.0% |
| Creek | 12 | 0.0% |
| Croatian | 27 | 0.0% |
| Cuban | 22 | 0.0% |
| Czech | 101 | 0.2% |
| Czechoslovakian | 12 | 0.0% |
| Danish | 330 | 0.5% |
| Delaware | 7 | 0.0% |
| Dutch | 880 | 1.4% |
| Eastern European | 135 | 0.2% |
| Ecuadorian | 11 | 0.0% |
| English | 8,169 | 13.0% |
| European | 1,024 | 1.6% |
| Finnish | 57 | 0.1% |
| French | 1,105 | 1.8% |
| French Canadian | 102 | 0.2% |
| German | 14,494 | 23.1% |
| Greek | 71 | 0.1% |
| Honduran | 11 | 0.0% |
| Hungarian | 492 | 0.8% |
| Indian (Asian) | 107 | 0.2% |
| Iranian | 7 | 0.0% |
| Iraqi | 4 | 0.0% |
| Irish | 8,870 | 14.2% |
| Italian | 2,317 | 3.7% |
| Korean | 213 | 0.3% |
| Latvian | 10 | 0.0% |
| Lebanese | 37 | 0.1% |
| Lumbee | 5 | 0.0% |
| Mexican | 558 | 0.9% |
| Mongolian | 4 | 0.0% |
| Native Hawaiian | 25 | 0.0% |
| Navajo | 5 | 0.0% |
| Northern European | 47 | 0.1% |
| Norwegian | 467 | 0.7% |
| Okinawan | 4 | 0.0% |
| Pakistani | 110 | 0.2% |
| Pennsylvania German | 584 | 0.9% |
| Polish | 1,050 | 1.7% |
| Portuguese | 50 | 0.1% |
| Puerto Rican | 157 | 0.3% |
| Romanian | 15 | 0.0% |
| Russian | 64 | 0.1% |
| Scandinavian | 155 | 0.3% |
| Scotch-Irish | 522 | 0.8% |
| Scottish | 1,278 | 2.0% |
| Sioux | 70 | 0.1% |
| Slovak | 191 | 0.3% |
| Slovene | 91 | 0.2% |
| South American | 79 | 0.1% |
| Spaniard | 37 | 0.1% |
| Spanish | 67 | 0.1% |
| Subsaharan African | 127 | 0.2% |
| Swedish | 181 | 0.3% |
| Swiss | 405 | 0.6% |
| Thai | 77 | 0.1% |
| Turkish | 21 | 0.0% |
| Ukrainian | 122 | 0.2% |
| Ute | 15 | 0.0% |
| Welsh | 735 | 1.2% |
| Yaqui | 1 | 0.0% |
| Yugoslavian | 61 | 0.1% | View All 80 Rows |
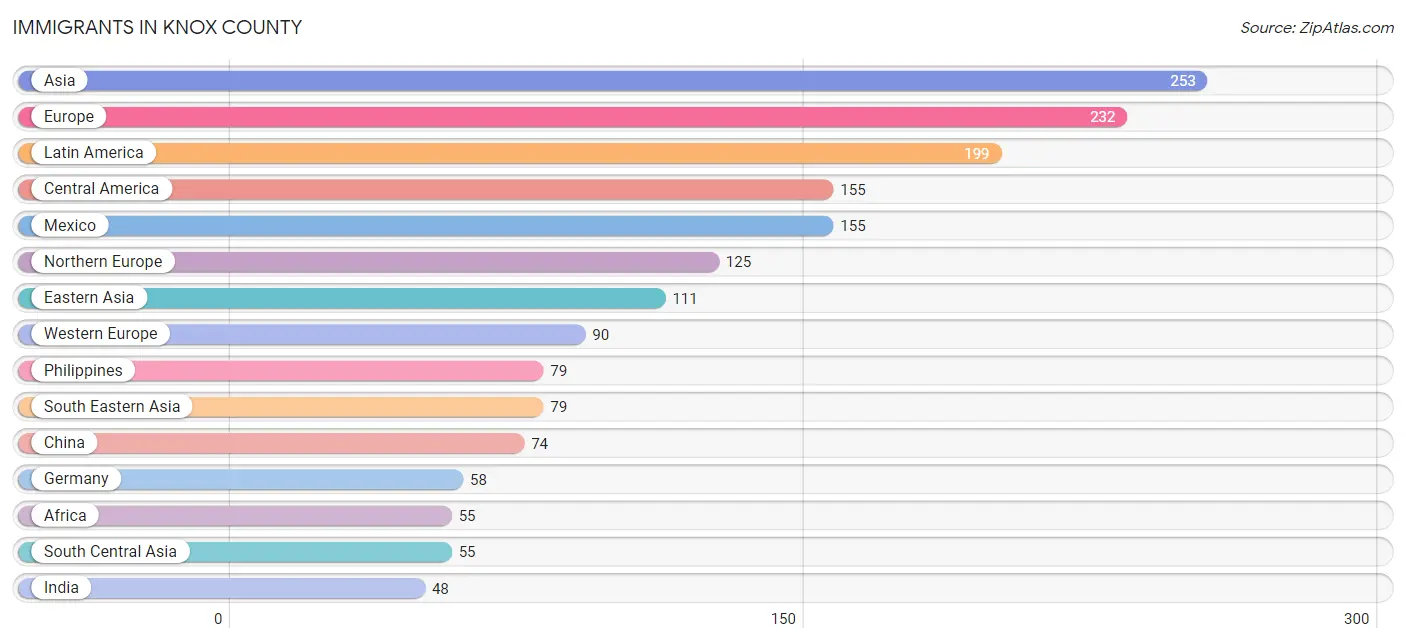
Immigrants in Knox County
The most numerous immigrant groups reported in Knox County came from Asia (253 | 0.4%), Europe (232 | 0.4%), Latin America (199 | 0.3%), Central America (155 | 0.3%), and Mexico (155 | 0.3%), together accounting for 1.6% of all Knox County residents.
| Immigration Origin | # Population | % Population |
| Africa | 55 | 0.1% |
| Asia | 253 | 0.4% |
| Australia | 9 | 0.0% |
| Bolivia | 11 | 0.0% |
| Canada | 36 | 0.1% |
| Central America | 155 | 0.3% |
| Chile | 7 | 0.0% |
| China | 74 | 0.1% |
| Colombia | 17 | 0.0% |
| Eastern Africa | 39 | 0.1% |
| Eastern Asia | 111 | 0.2% |
| England | 47 | 0.1% |
| Europe | 232 | 0.4% |
| Germany | 58 | 0.1% |
| India | 48 | 0.1% |
| Iran | 7 | 0.0% |
| Japan | 21 | 0.0% |
| Korea | 16 | 0.0% |
| Latin America | 199 | 0.3% |
| Mexico | 155 | 0.3% |
| Netherlands | 32 | 0.1% |
| Northern Europe | 125 | 0.2% |
| Norway | 10 | 0.0% |
| Oceania | 9 | 0.0% |
| Peru | 6 | 0.0% |
| Philippines | 79 | 0.1% |
| South Africa | 16 | 0.0% |
| South America | 44 | 0.1% |
| South Central Asia | 55 | 0.1% |
| South Eastern Asia | 79 | 0.1% |
| Southern Europe | 17 | 0.0% |
| Spain | 17 | 0.0% |
| Sweden | 18 | 0.0% |
| Turkey | 8 | 0.0% |
| Venezuela | 3 | 0.0% |
| Western Asia | 8 | 0.0% |
| Western Europe | 90 | 0.1% | View All 37 Rows |
Sex and Age in Knox County
Sex and Age in Knox County
The most populous age groups in Knox County are 15 to 19 Years (2,407 | 7.8%) for men and 60 to 64 Years (2,705 | 8.5%) for women.

| Age Bracket | Male | Female |
| Under 5 Years | 1,982 (6.4%) | 1,756 (5.5%) |
| 5 to 9 Years | 2,002 (6.5%) | 1,637 (5.1%) |
| 10 to 14 Years | 2,113 (6.8%) | 2,310 (7.3%) |
| 15 to 19 Years | 2,407 (7.8%) | 2,543 (8.0%) |
| 20 to 24 Years | 2,335 (7.6%) | 2,400 (7.5%) |
| 25 to 29 Years | 1,637 (5.3%) | 1,669 (5.2%) |
| 30 to 34 Years | 1,772 (5.7%) | 1,807 (5.7%) |
| 35 to 39 Years | 1,611 (5.2%) | 1,694 (5.3%) |
| 40 to 44 Years | 1,975 (6.4%) | 1,727 (5.4%) |
| 45 to 49 Years | 1,724 (5.6%) | 1,711 (5.4%) |
| 50 to 54 Years | 1,881 (6.1%) | 1,840 (5.8%) |
| 55 to 59 Years | 1,868 (6.0%) | 1,632 (5.1%) |
| 60 to 64 Years | 2,304 (7.5%) | 2,705 (8.5%) |
| 65 to 69 Years | 2,006 (6.5%) | 2,161 (6.8%) |
| 70 to 74 Years | 1,272 (4.1%) | 1,428 (4.5%) |
| 75 to 79 Years | 960 (3.1%) | 1,080 (3.4%) |
| 80 to 84 Years | 562 (1.8%) | 703 (2.2%) |
| 85 Years and over | 463 (1.5%) | 980 (3.1%) |
| Total | 30,874 (100.0%) | 31,783 (100.0%) |
Families and Households in Knox County
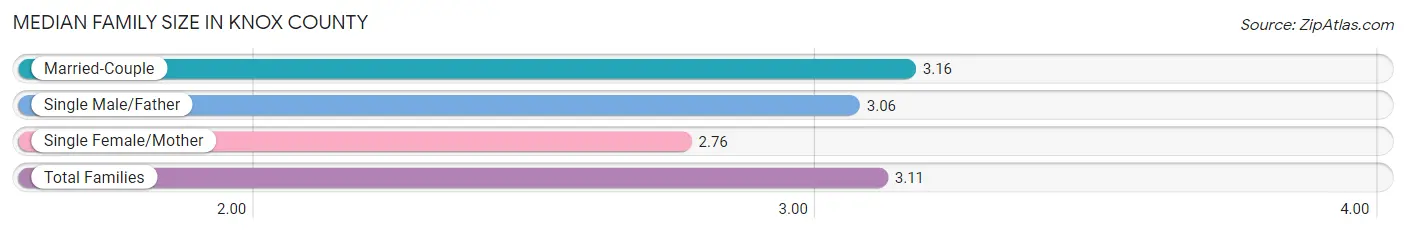
Median Family Size in Knox County
The median family size in Knox County is 3.11 persons per family, with married-couple families (13,066 | 82.7%) accounting for the largest median family size of 3.16 persons per family. On the other hand, single female/mother families (1,943 | 12.3%) represent the smallest median family size with 2.76 persons per family.
| Family Type | # Families | Family Size |
| Married-Couple | 13,066 (82.7%) | 3.16 |
| Single Male/Father | 797 (5.0%) | 3.06 |
| Single Female/Mother | 1,943 (12.3%) | 2.76 |
| Total Families | 15,806 (100.0%) | 3.11 |
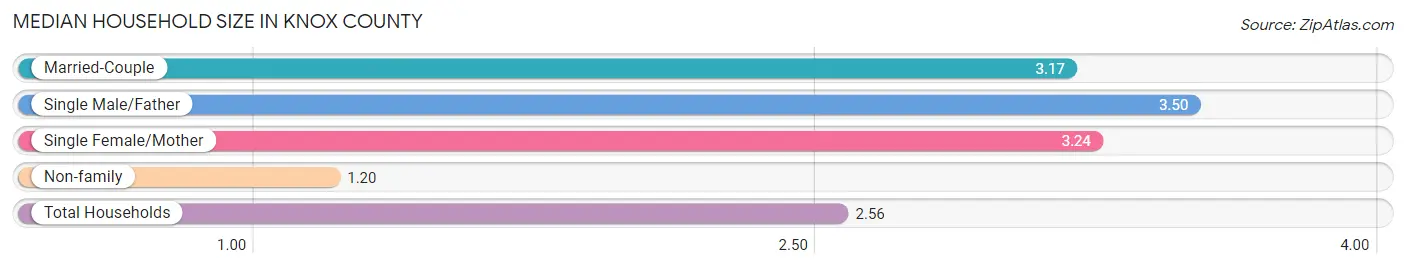
Median Household Size in Knox County
The median household size in Knox County is 2.56 persons per household, with single male/father households (797 | 3.5%) accounting for the largest median household size of 3.5 persons per household. non-family households (7,311 | 31.6%) represent the smallest median household size with 1.20 persons per household.
| Household Type | # Households | Household Size |
| Married-Couple | 13,066 (56.5%) | 3.17 |
| Single Male/Father | 797 (3.5%) | 3.50 |
| Single Female/Mother | 1,943 (8.4%) | 3.24 |
| Non-family | 7,311 (31.6%) | 1.20 |
| Total Households | 23,117 (100.0%) | 2.56 |
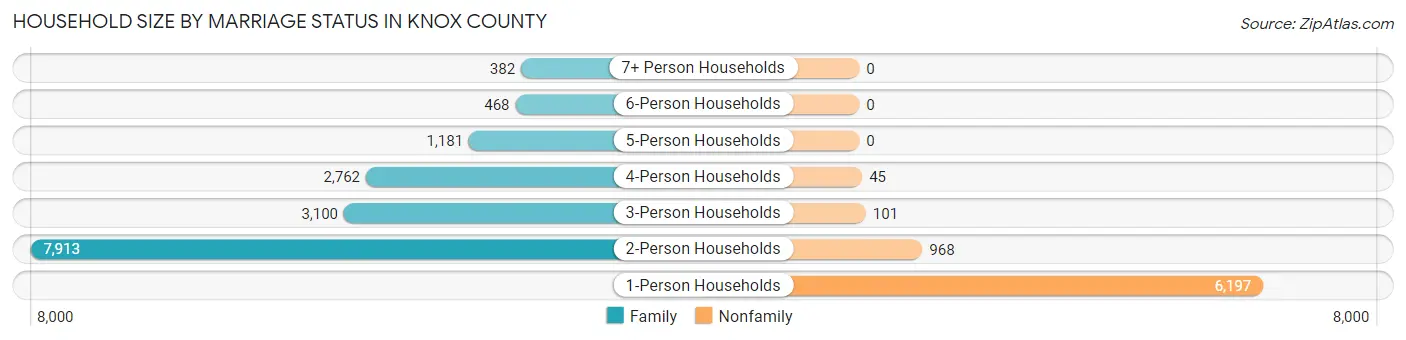
Household Size by Marriage Status in Knox County
Out of a total of 23,117 households in Knox County, 15,806 (68.4%) are family households, while 7,311 (31.6%) are nonfamily households. The most numerous type of family households are 2-person households, comprising 7,913, and the most common type of nonfamily households are 1-person households, comprising 6,197.
| Household Size | Family Households | Nonfamily Households |
| 1-Person Households | - | 6,197 (26.8%) |
| 2-Person Households | 7,913 (34.2%) | 968 (4.2%) |
| 3-Person Households | 3,100 (13.4%) | 101 (0.4%) |
| 4-Person Households | 2,762 (11.9%) | 45 (0.2%) |
| 5-Person Households | 1,181 (5.1%) | 0 (0.0%) |
| 6-Person Households | 468 (2.0%) | 0 (0.0%) |
| 7+ Person Households | 382 (1.7%) | 0 (0.0%) |
| Total | 15,806 (68.4%) | 7,311 (31.6%) |
Female Fertility in Knox County
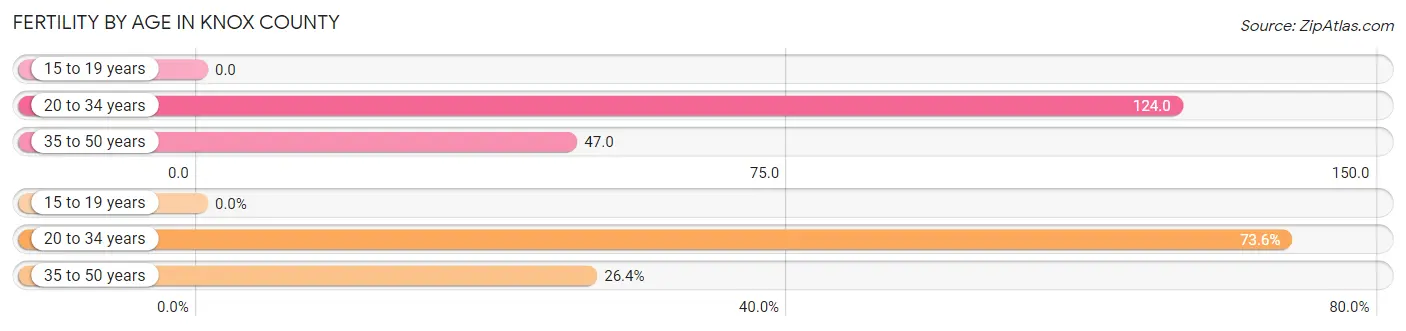
Fertility by Age in Knox County
Average fertility rate in Knox County is 71.0 births per 1,000 women. Women in the age bracket of 20 to 34 years have the highest fertility rate with 124.0 births per 1,000 women. Women in the age bracket of 20 to 34 years acount for 73.6% of all women with births.
| Age Bracket | Women with Births | Births / 1,000 Women |
| 15 to 19 years | 0 (0.0%) | 0.0 |
| 20 to 34 years | 727 (73.6%) | 124.0 |
| 35 to 50 years | 261 (26.4%) | 47.0 |
| Total | 988 (100.0%) | 71.0 |
Fertility by Age by Marriage Status in Knox County
74.0% of women with births (988) in Knox County are married. The highest percentage of unmarried women with births falls into 35 to 50 years age bracket with 56.7% of them unmarried at the time of birth, while the lowest percentage of unmarried women with births belong to 20 to 34 years age bracket with 15.0% of them unmarried.

| Age Bracket | Married | Unmarried |
| 15 to 19 years | 0 (0.0%) | 0 (0.0%) |
| 20 to 34 years | 618 (85.0%) | 109 (15.0%) |
| 35 to 50 years | 113 (43.3%) | 148 (56.7%) |
| Total | 731 (74.0%) | 257 (26.0%) |
Fertility by Education in Knox County
Average fertility rate in Knox County is 71.0 births per 1,000 women. Women with the education attainment of high school diploma have the highest fertility rate of 115.0 births per 1,000 women, while women with the education attainment of graduate degree have the lowest fertility at 11.0 births per 1,000 women. Women with the education attainment of high school diploma represent 42.6% of all women with births.
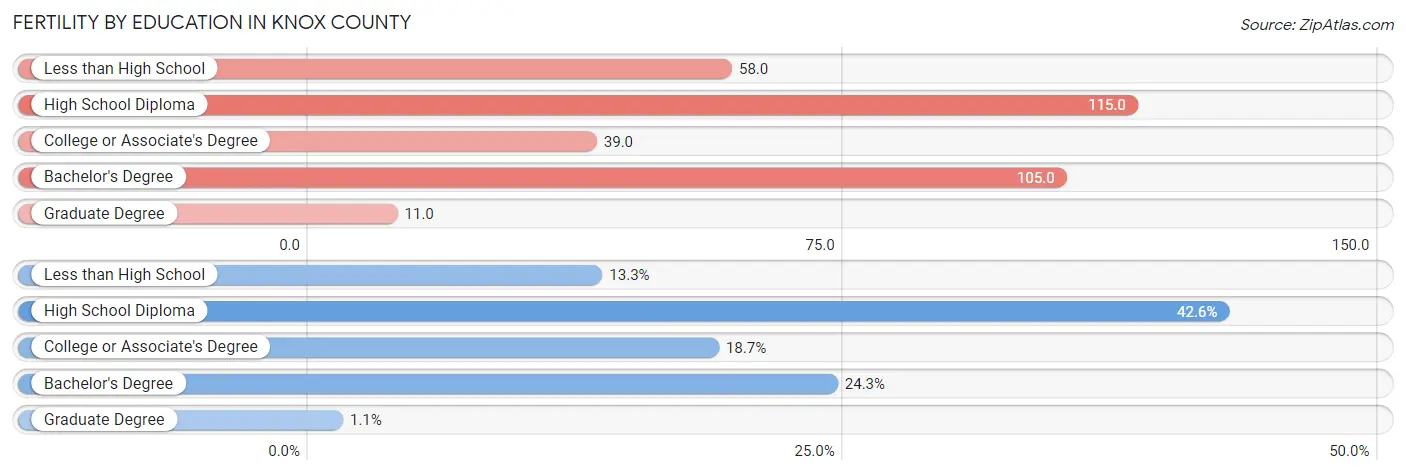
| Educational Attainment | Women with Births | Births / 1,000 Women |
| Less than High School | 131 (13.3%) | 58.0 |
| High School Diploma | 421 (42.6%) | 115.0 |
| College or Associate's Degree | 185 (18.7%) | 39.0 |
| Bachelor's Degree | 240 (24.3%) | 105.0 |
| Graduate Degree | 11 (1.1%) | 11.0 |
| Total | 988 (100.0%) | 71.0 |
Fertility by Education by Marriage Status in Knox County
26.0% of women with births in Knox County are unmarried. Women with the educational attainment of bachelor's degree are most likely to be married with 100.0% of them married at childbirth, while women with the educational attainment of high school diploma are least likely to be married with 54.9% of them unmarried at childbirth.
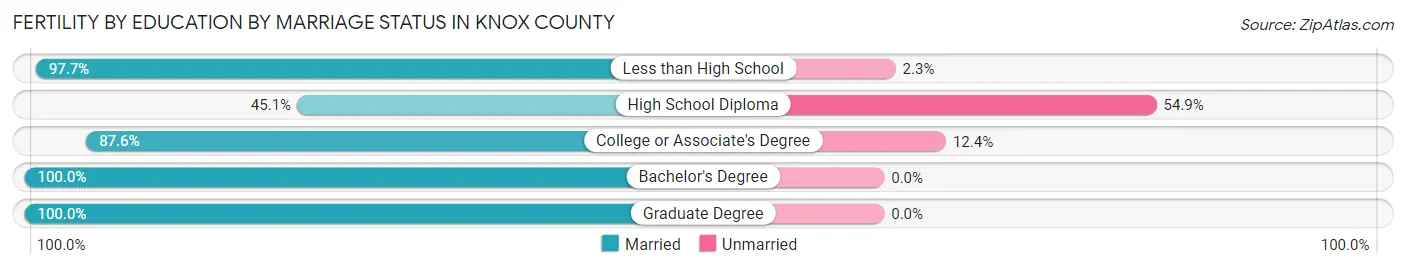
| Educational Attainment | Married | Unmarried |
| Less than High School | 128 (97.7%) | 3 (2.3%) |
| High School Diploma | 190 (45.1%) | 231 (54.9%) |
| College or Associate's Degree | 162 (87.6%) | 23 (12.4%) |
| Bachelor's Degree | 240 (100.0%) | 0 (0.0%) |
| Graduate Degree | 11 (100.0%) | 0 (0.0%) |
| Total | 731 (74.0%) | 257 (26.0%) |
Income in Knox County
Income Overview in Knox County
Per Capita Income in Knox County is $32,543, while median incomes of families and households are $82,526 and $71,246 respectively.
| Characteristic | Number | Measure |
| Per Capita Income | 62,657 | $32,543 |
| Median Family Income | 15,806 | $82,526 |
| Mean Family Income | 15,806 | $95,541 |
| Median Household Income | 23,117 | $71,246 |
| Mean Household Income | 23,117 | $85,072 |
| Income Deficit | 15,806 | $10,222 |
| Wage / Income Gap (%) | 62,657 | 41.68% |
| Wage / Income Gap ($) | 62,657 | 58.32¢ per $1 |
| Gini / Inequality Index | 62,657 | 0.41 |
Earnings by Sex in Knox County
Average Earnings in Knox County are $36,433, $47,090 for men and $27,463 for women, a difference of 41.7%.
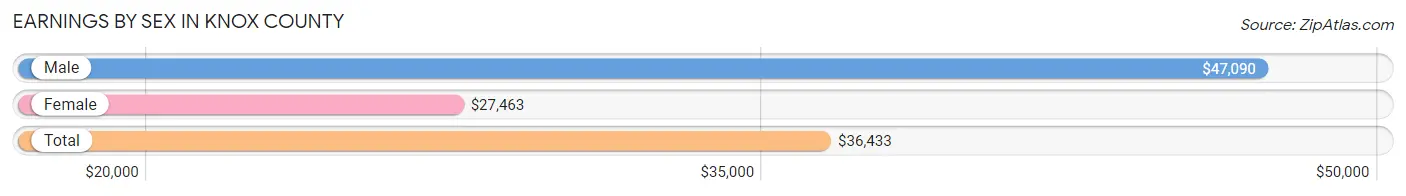
| Sex | Number | Average Earnings |
| Male | 17,511 (53.1%) | $47,090 |
| Female | 15,493 (46.9%) | $27,463 |
| Total | 33,004 (100.0%) | $36,433 |
Earnings by Sex by Income Bracket in Knox County
The most common earnings brackets in Knox County are $100,000+ for men (2,178 | 12.4%) and $2,499 or less for women (1,348 | 8.7%).
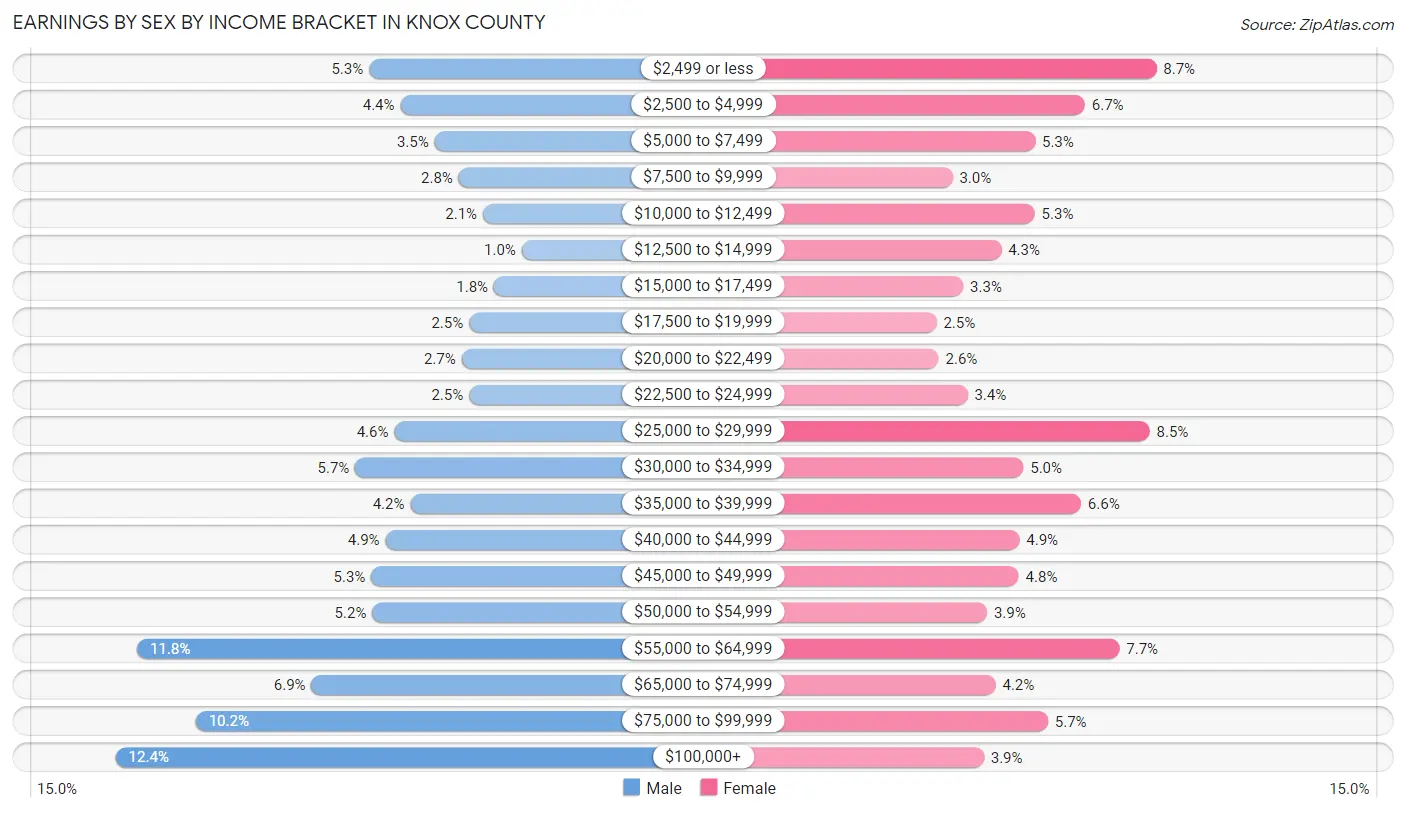
| Income | Male | Female |
| $2,499 or less | 932 (5.3%) | 1,348 (8.7%) |
| $2,500 to $4,999 | 778 (4.4%) | 1,037 (6.7%) |
| $5,000 to $7,499 | 609 (3.5%) | 819 (5.3%) |
| $7,500 to $9,999 | 491 (2.8%) | 460 (3.0%) |
| $10,000 to $12,499 | 371 (2.1%) | 818 (5.3%) |
| $12,500 to $14,999 | 180 (1.0%) | 672 (4.3%) |
| $15,000 to $17,499 | 317 (1.8%) | 506 (3.3%) |
| $17,500 to $19,999 | 440 (2.5%) | 390 (2.5%) |
| $20,000 to $22,499 | 477 (2.7%) | 399 (2.6%) |
| $22,500 to $24,999 | 440 (2.5%) | 525 (3.4%) |
| $25,000 to $29,999 | 807 (4.6%) | 1,318 (8.5%) |
| $30,000 to $34,999 | 1,000 (5.7%) | 768 (5.0%) |
| $35,000 to $39,999 | 729 (4.2%) | 1,020 (6.6%) |
| $40,000 to $44,999 | 851 (4.9%) | 751 (4.9%) |
| $45,000 to $49,999 | 921 (5.3%) | 748 (4.8%) |
| $50,000 to $54,999 | 916 (5.2%) | 610 (3.9%) |
| $55,000 to $64,999 | 2,074 (11.8%) | 1,186 (7.7%) |
| $65,000 to $74,999 | 1,215 (6.9%) | 647 (4.2%) |
| $75,000 to $99,999 | 1,785 (10.2%) | 875 (5.7%) |
| $100,000+ | 2,178 (12.4%) | 596 (3.8%) |
| Total | 17,511 (100.0%) | 15,493 (100.0%) |
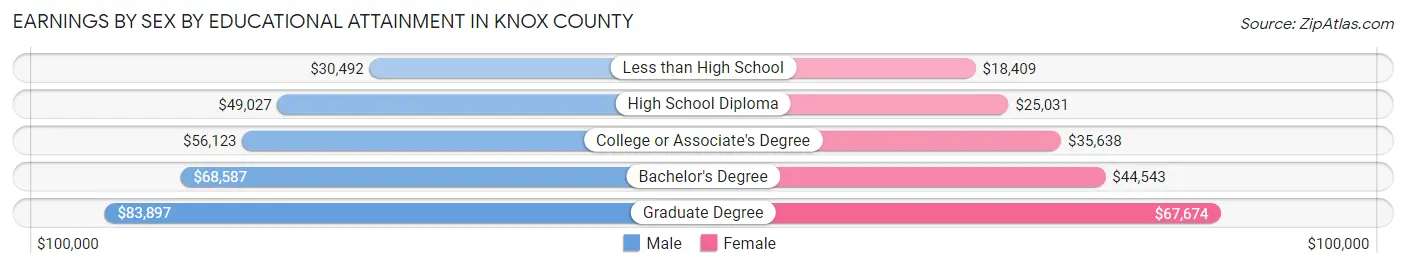
Earnings by Sex by Educational Attainment in Knox County
Average earnings in Knox County are $55,129 for men and $34,914 for women, a difference of 36.7%. Men with an educational attainment of graduate degree enjoy the highest average annual earnings of $83,897, while those with less than high school education earn the least with $30,492. Women with an educational attainment of graduate degree earn the most with the average annual earnings of $67,674, while those with less than high school education have the smallest earnings of $18,409.
| Educational Attainment | Male Income | Female Income |
| Less than High School | $30,492 | $18,409 |
| High School Diploma | $49,027 | $25,031 |
| College or Associate's Degree | $56,123 | $35,638 |
| Bachelor's Degree | $68,587 | $44,543 |
| Graduate Degree | $83,897 | $67,674 |
| Total | $55,129 | $34,914 |
Family Income in Knox County
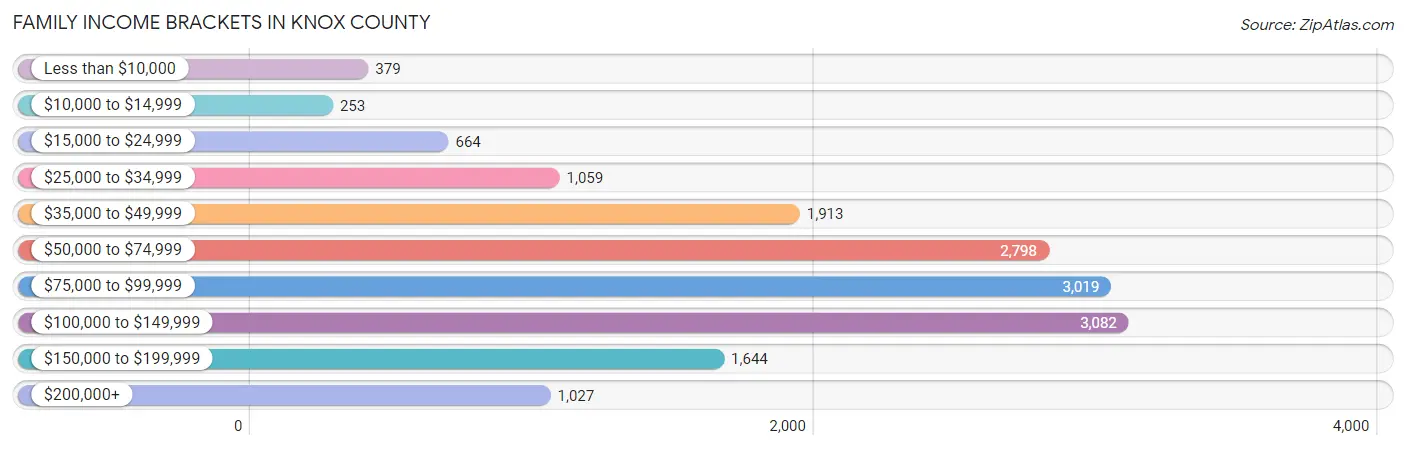
Family Income Brackets in Knox County
According to the Knox County family income data, there are 3,082 families falling into the $100,000 to $149,999 income range, which is the most common income bracket and makes up 19.5% of all families. Conversely, the $10,000 to $14,999 income bracket is the least frequent group with only 253 families (1.6%) belonging to this category.
| Income Bracket | # Families | % Families |
| Less than $10,000 | 379 | 2.4% |
| $10,000 to $14,999 | 253 | 1.6% |
| $15,000 to $24,999 | 664 | 4.2% |
| $25,000 to $34,999 | 1,059 | 6.7% |
| $35,000 to $49,999 | 1,913 | 12.1% |
| $50,000 to $74,999 | 2,798 | 17.7% |
| $75,000 to $99,999 | 3,019 | 19.1% |
| $100,000 to $149,999 | 3,082 | 19.5% |
| $150,000 to $199,999 | 1,644 | 10.4% |
| $200,000+ | 1,027 | 6.5% |
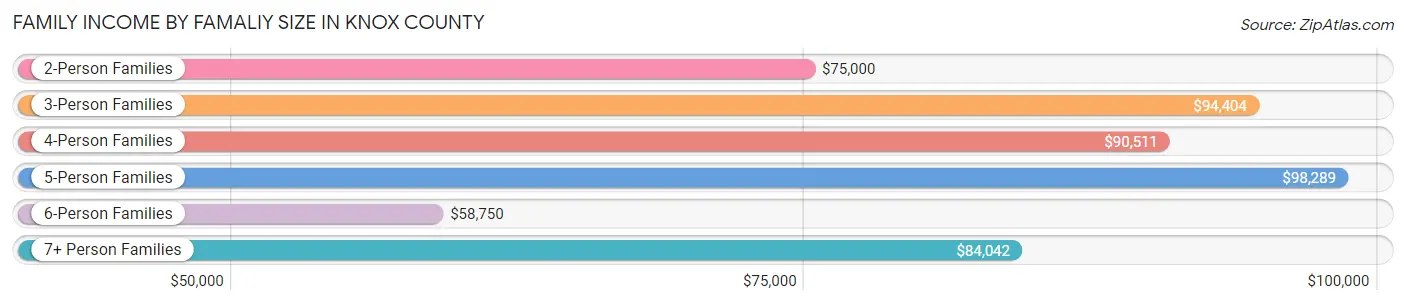
Family Income by Famaliy Size in Knox County
5-person families (920 | 5.8%) account for the highest median family income in Knox County with $98,289 per family, while 2-person families (8,234 | 52.1%) have the highest median income of $37,500 per family member.
| Income Bracket | # Families | Median Income |
| 2-Person Families | 8,234 (52.1%) | $75,000 |
| 3-Person Families | 3,209 (20.3%) | $94,404 |
| 4-Person Families | 2,634 (16.7%) | $90,511 |
| 5-Person Families | 920 (5.8%) | $98,289 |
| 6-Person Families | 427 (2.7%) | $58,750 |
| 7+ Person Families | 382 (2.4%) | $84,042 |
| Total | 15,806 (100.0%) | $82,526 |
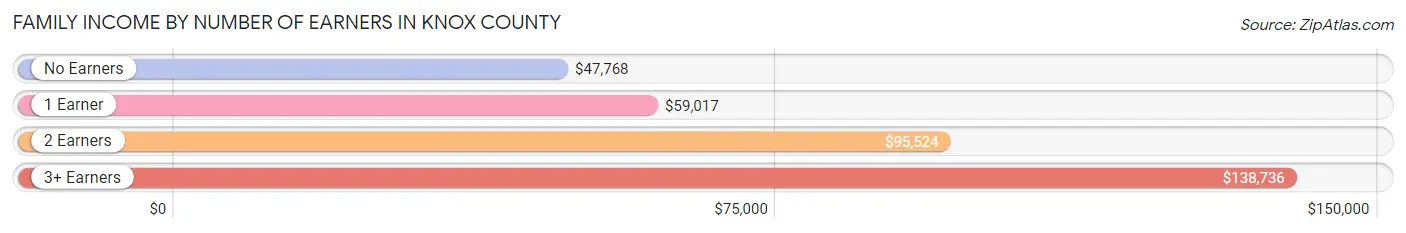
Family Income by Number of Earners in Knox County
The median family income in Knox County is $82,526, with families comprising 3+ earners (1,488) having the highest median family income of $138,736, while families with no earners (2,618) have the lowest median family income of $47,768, accounting for 9.4% and 16.6% of families, respectively.
| Number of Earners | # Families | Median Income |
| No Earners | 2,618 (16.6%) | $47,768 |
| 1 Earner | 4,689 (29.7%) | $59,017 |
| 2 Earners | 7,011 (44.4%) | $95,524 |
| 3+ Earners | 1,488 (9.4%) | $138,736 |
| Total | 15,806 (100.0%) | $82,526 |
Household Income in Knox County
Household Income Brackets in Knox County
With 4,230 households falling in the category, the $50,000 to $74,999 income range is the most frequent in Knox County, accounting for 18.3% of all households. In contrast, only 786 households (3.4%) fall into the less than $10,000 income bracket, making it the least populous group.
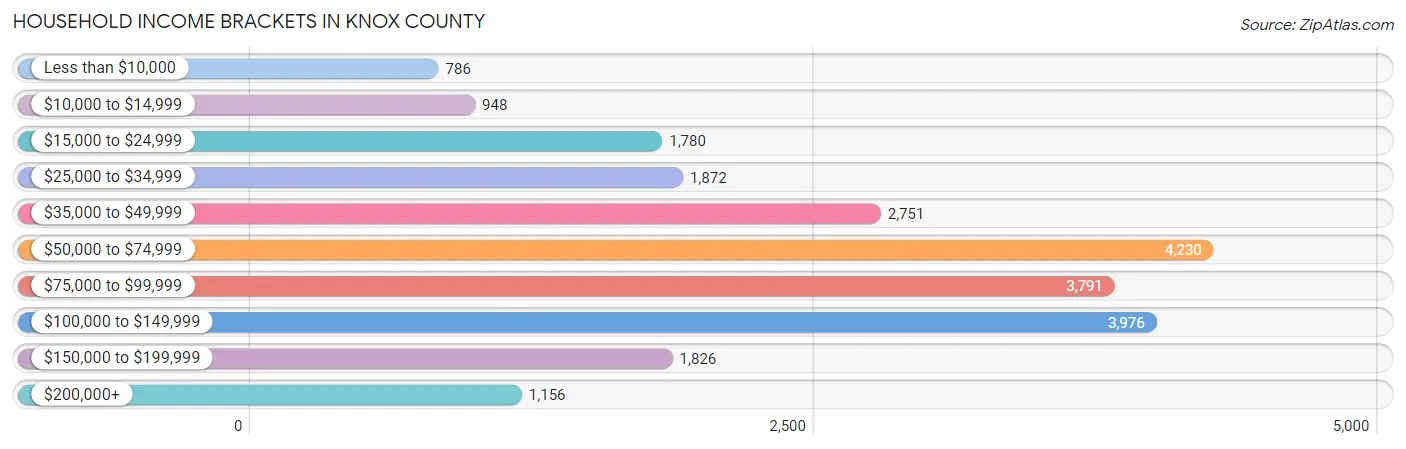
| Income Bracket | # Households | % Households |
| Less than $10,000 | 786 | 3.4% |
| $10,000 to $14,999 | 948 | 4.1% |
| $15,000 to $24,999 | 1,780 | 7.7% |
| $25,000 to $34,999 | 1,872 | 8.1% |
| $35,000 to $49,999 | 2,751 | 11.9% |
| $50,000 to $74,999 | 4,230 | 18.3% |
| $75,000 to $99,999 | 3,791 | 16.4% |
| $100,000 to $149,999 | 3,976 | 17.2% |
| $150,000 to $199,999 | 1,826 | 7.9% |
| $200,000+ | 1,156 | 5.0% |
Household Income by Householder Age in Knox County
The median household income in Knox County is $71,246, with the highest median household income of $86,915 found in the 45 to 64 years age bracket for the primary householder. A total of 8,837 households (38.2%) fall into this category. Meanwhile, the 15 to 24 years age bracket for the primary householder has the lowest median household income of $0, with 929 households (4.0%) in this group.
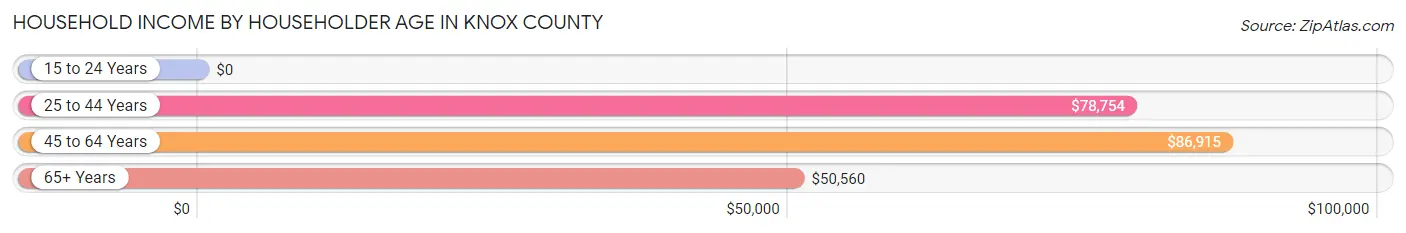
| Income Bracket | # Households | Median Income |
| 15 to 24 Years | 929 (4.0%) | $0 |
| 25 to 44 Years | 6,420 (27.8%) | $78,754 |
| 45 to 64 Years | 8,837 (38.2%) | $86,915 |
| 65+ Years | 6,931 (30.0%) | $50,560 |
| Total | 23,117 (100.0%) | $71,246 |
Poverty in Knox County
Income Below Poverty by Sex and Age in Knox County
With 11.4% poverty level for males and 14.4% for females among the residents of Knox County, 5 year old males and 15 year old females are the most vulnerable to poverty, with 179 males (32.3%) and 121 females (29.4%) in their respective age groups living below the poverty level.
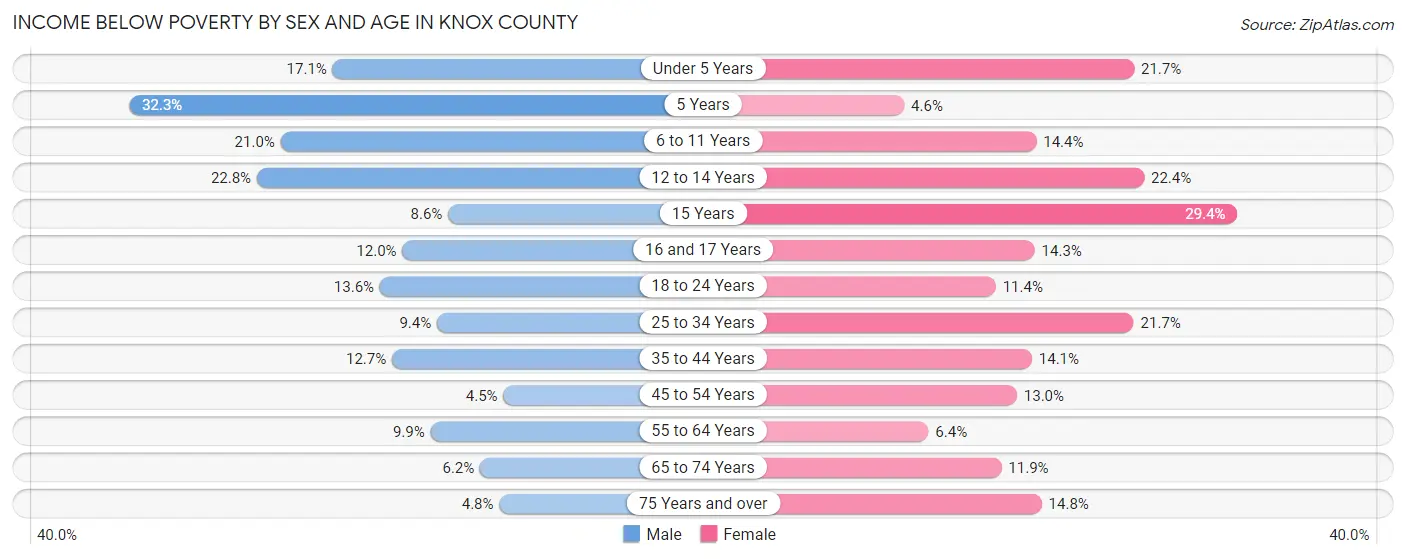
| Age Bracket | Male | Female |
| Under 5 Years | 311 (17.1%) | 381 (21.7%) |
| 5 Years | 179 (32.3%) | 12 (4.6%) |
| 6 to 11 Years | 505 (21.0%) | 312 (14.4%) |
| 12 to 14 Years | 258 (22.8%) | 331 (22.4%) |
| 15 Years | 40 (8.6%) | 121 (29.4%) |
| 16 and 17 Years | 92 (11.9%) | 115 (14.3%) |
| 18 to 24 Years | 336 (13.6%) | 259 (11.4%) |
| 25 to 34 Years | 317 (9.4%) | 750 (21.7%) |
| 35 to 44 Years | 452 (12.7%) | 481 (14.1%) |
| 45 to 54 Years | 160 (4.4%) | 461 (13.0%) |
| 55 to 64 Years | 403 (9.9%) | 277 (6.4%) |
| 65 to 74 Years | 201 (6.2%) | 414 (11.8%) |
| 75 Years and over | 88 (4.8%) | 389 (14.8%) |
| Total | 3,342 (11.4%) | 4,303 (14.4%) |
Income Above Poverty by Sex and Age in Knox County
According to the poverty statistics in Knox County, males aged 45 to 54 years and females aged 5 years are the age groups that are most secure financially, with 95.6% of males and 95.4% of females in these age groups living above the poverty line.
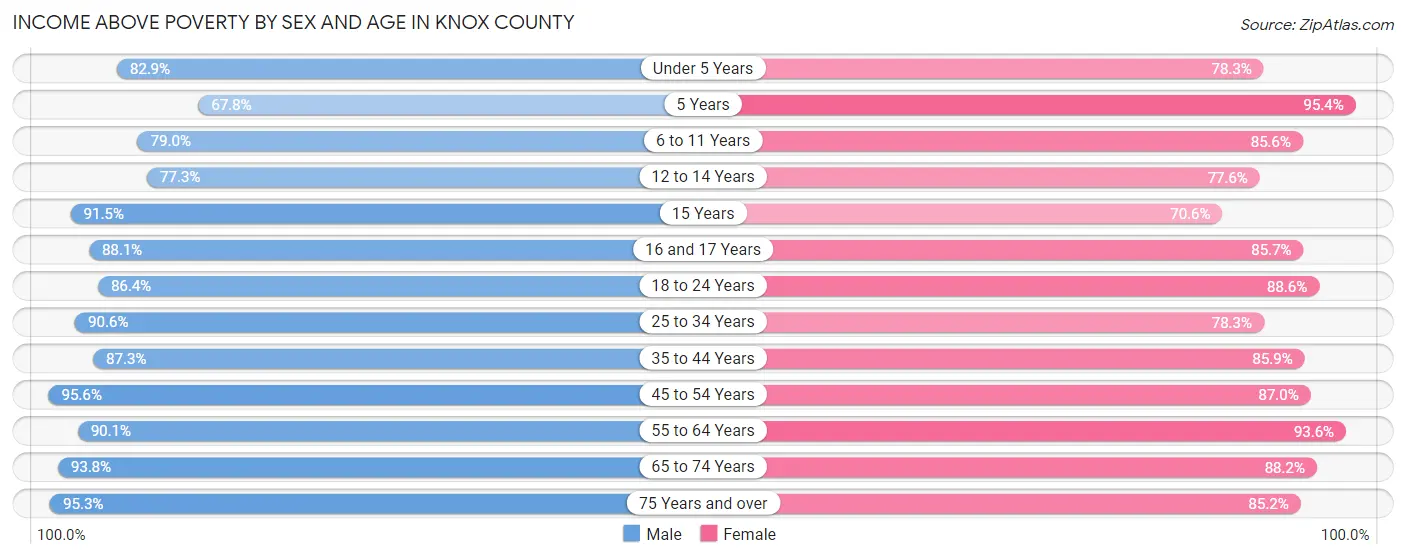
| Age Bracket | Male | Female |
| Under 5 Years | 1,505 (82.9%) | 1,375 (78.3%) |
| 5 Years | 376 (67.7%) | 247 (95.4%) |
| 6 to 11 Years | 1,901 (79.0%) | 1,848 (85.6%) |
| 12 to 14 Years | 876 (77.2%) | 1,144 (77.6%) |
| 15 Years | 428 (91.4%) | 291 (70.6%) |
| 16 and 17 Years | 678 (88.0%) | 688 (85.7%) |
| 18 to 24 Years | 2,131 (86.4%) | 2,007 (88.6%) |
| 25 to 34 Years | 3,062 (90.6%) | 2,711 (78.3%) |
| 35 to 44 Years | 3,101 (87.3%) | 2,927 (85.9%) |
| 45 to 54 Years | 3,434 (95.6%) | 3,085 (87.0%) |
| 55 to 64 Years | 3,684 (90.1%) | 4,029 (93.6%) |
| 65 to 74 Years | 3,052 (93.8%) | 3,079 (88.1%) |
| 75 Years and over | 1,766 (95.3%) | 2,232 (85.2%) |
| Total | 25,994 (88.6%) | 25,663 (85.6%) |
Income Below Poverty Among Married-Couple Families in Knox County
The poverty statistics for married-couple families in Knox County show that 4.8% or 623 of the total 13,066 families live below the poverty line. Families with 5 or more children have the highest poverty rate of 44.0%, comprising of 99 families. On the other hand, families with no children have the lowest poverty rate of 2.8%, which includes 218 families.
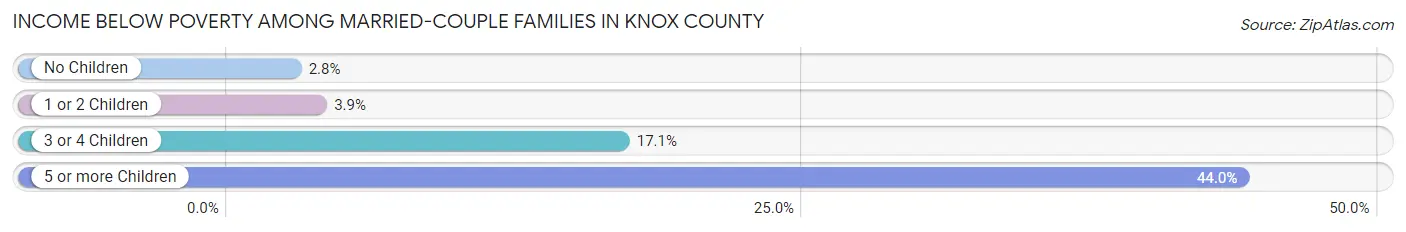
| Children | Above Poverty | Below Poverty |
| No Children | 7,664 (97.2%) | 218 (2.8%) |
| 1 or 2 Children | 3,938 (96.1%) | 159 (3.9%) |
| 3 or 4 Children | 715 (83.0%) | 147 (17.1%) |
| 5 or more Children | 126 (56.0%) | 99 (44.0%) |
| Total | 12,443 (95.2%) | 623 (4.8%) |
Income Below Poverty Among Single-Parent Households in Knox County
According to the poverty data in Knox County, 6.0% or 48 single-father households and 34.2% or 665 single-mother households are living below the poverty line. Among single-father households, those with 3 or 4 children have the highest poverty rate, with 21 households (25.6%) experiencing poverty. Likewise, among single-mother households, those with 3 or 4 children have the highest poverty rate, with 187 households (66.8%) falling below the poverty line.

| Children | Single Father | Single Mother |
| No Children | 11 (3.3%) | 86 (18.3%) |
| 1 or 2 Children | 16 (4.2%) | 392 (32.9%) |
| 3 or 4 Children | 21 (25.6%) | 187 (66.8%) |
| 5 or more Children | 0 (0.0%) | 0 (0.0%) |
| Total | 48 (6.0%) | 665 (34.2%) |
Income Below Poverty Among Married-Couple vs Single-Parent Households in Knox County
The poverty data for Knox County shows that 623 of the married-couple family households (4.8%) and 713 of the single-parent households (26.0%) are living below the poverty level. Within the married-couple family households, those with 5 or more children have the highest poverty rate, with 99 households (44.0%) falling below the poverty line. Among the single-parent households, those with 3 or 4 children have the highest poverty rate, with 208 household (57.5%) living below poverty.

| Children | Married-Couple Families | Single-Parent Households |
| No Children | 218 (2.8%) | 97 (12.0%) |
| 1 or 2 Children | 159 (3.9%) | 408 (26.0%) |
| 3 or 4 Children | 147 (17.1%) | 208 (57.5%) |
| 5 or more Children | 99 (44.0%) | 0 (0.0%) |
| Total | 623 (4.8%) | 713 (26.0%) |
Employment Characteristics in Knox County
Employment by Class of Employer in Knox County
Among the 28,192 employed individuals in Knox County, private company employees (18,701 | 66.3%), not-for-profit organizations (3,139 | 11.1%), and local government employees (2,108 | 7.5%) make up the most common classes of employment.

| Employer Class | # Employees | % Employees |
| Private Company Employees | 18,701 | 66.3% |
| Self-Employed (Incorporated) | 904 | 3.2% |
| Self-Employed (Not Incorporated) | 1,937 | 6.9% |
| Not-for-profit Organizations | 3,139 | 11.1% |
| Local Government Employees | 2,108 | 7.5% |
| State Government Employees | 777 | 2.8% |
| Federal Government Employees | 443 | 1.6% |
| Unpaid Family Workers | 183 | 0.6% |
| Total | 28,192 | 100.0% |
Employment Status by Age in Knox County
According to the labor force statistics for Knox County, out of the total population over 16 years of age (49,977), 60.0% or 29,986 individuals are in the labor force, with 3.3% or 990 of them unemployed. The age group with the highest labor force participation rate is 25 to 29 years, with 87.1% or 2,880 individuals in the labor force. Within the labor force, the 16 to 19 years age range has the highest percentage of unemployed individuals, with 8.1% or 139 of them being unemployed.
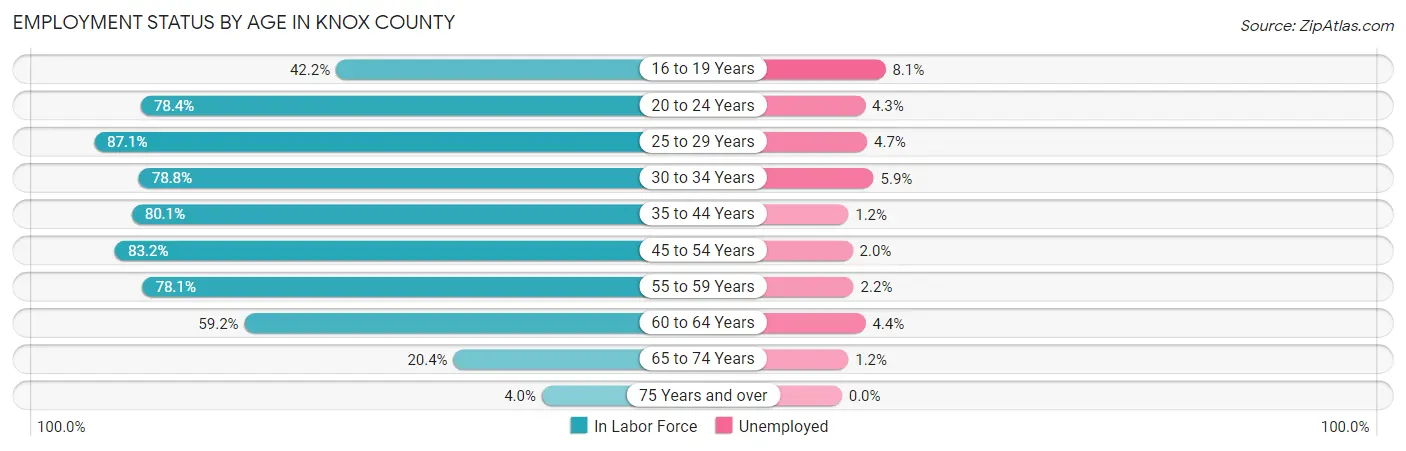
| Age Bracket | In Labor Force | Unemployed |
| 16 to 19 Years | 1,718 (42.2%) | 139 (8.1%) |
| 20 to 24 Years | 3,712 (78.4%) | 160 (4.3%) |
| 25 to 29 Years | 2,880 (87.1%) | 135 (4.7%) |
| 30 to 34 Years | 2,820 (78.8%) | 166 (5.9%) |
| 35 to 44 Years | 5,613 (80.1%) | 67 (1.2%) |
| 45 to 54 Years | 5,954 (83.2%) | 119 (2.0%) |
| 55 to 59 Years | 2,734 (78.1%) | 60 (2.2%) |
| 60 to 64 Years | 2,965 (59.2%) | 130 (4.4%) |
| 65 to 74 Years | 1,401 (20.4%) | 17 (1.2%) |
| 75 Years and over | 190 (4.0%) | 0 (0.0%) |
| Total | 29,986 (60.0%) | 990 (3.3%) |
Employment Status by Educational Attainment in Knox County
According to labor force statistics for Knox County, 77.7% of individuals (22,966) out of the total population between 25 and 64 years of age (29,557) are in the labor force, with 3.0% or 689 of them being unemployed. The group with the highest labor force participation rate are those with the educational attainment of bachelor's degree or higher, with 88.7% or 6,401 individuals in the labor force. Within the labor force, individuals with less than high school education have the highest percentage of unemployment, with 5.6% or 71 of them being unemployed.
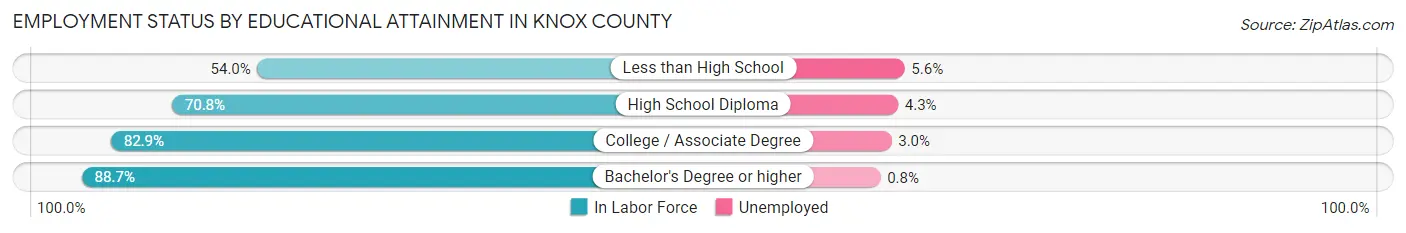
| Educational Attainment | In Labor Force | Unemployed |
| Less than High School | 1,272 (54.0%) | 132 (5.6%) |
| High School Diploma | 7,463 (70.8%) | 453 (4.3%) |
| College / Associate Degree | 7,830 (82.9%) | 283 (3.0%) |
| Bachelor's Degree or higher | 6,401 (88.7%) | 58 (0.8%) |
| Total | 22,966 (77.7%) | 887 (3.0%) |
Employment Occupations by Sex in Knox County
Management, Business, Science and Arts Occupations
The most common Management, Business, Science and Arts occupations in Knox County are Community & Social Service (2,884 | 10.0%), Management (2,501 | 8.6%), Health Diagnosing & Treating (2,123 | 7.3%), Education Instruction & Library (1,740 | 6.0%), and Health Technologists (1,414 | 4.9%).

Management, Business, Science and Arts Occupations by Sex
Within the Management, Business, Science and Arts occupations in Knox County, the most male-oriented occupations are Architecture & Engineering (92.1%), Computers, Engineering & Science (81.1%), and Computers & Mathematics (79.1%), while the most female-oriented occupations are Legal Services & Support (93.3%), Health Technologists (79.5%), and Health Diagnosing & Treating (77.7%).

| Occupation | Male | Female |
| Management | 1,549 (61.9%) | 952 (38.1%) |
| Business & Financial | 509 (46.3%) | 590 (53.7%) |
| Computers, Engineering & Science | 749 (81.1%) | 175 (18.9%) |
| Computers & Mathematics | 204 (79.1%) | 54 (20.9%) |
| Architecture & Engineering | 406 (92.1%) | 35 (7.9%) |
| Life, Physical & Social Science | 139 (61.8%) | 86 (38.2%) |
| Community & Social Service | 987 (34.2%) | 1,897 (65.8%) |
| Education, Arts & Media | 199 (32.4%) | 416 (67.6%) |
| Legal Services & Support | 7 (6.7%) | 97 (93.3%) |
| Education Instruction & Library | 508 (29.2%) | 1,232 (70.8%) |
| Arts, Media & Entertainment | 273 (64.2%) | 152 (35.8%) |
| Health Diagnosing & Treating | 474 (22.3%) | 1,649 (77.7%) |
| Health Technologists | 290 (20.5%) | 1,124 (79.5%) |
| Total (Category) | 4,268 (44.8%) | 5,263 (55.2%) |
| Total (Overall) | 15,371 (53.1%) | 13,564 (46.9%) |
Services Occupations
The most common Services occupations in Knox County are Food Preparation & Serving (1,762 | 6.1%), Healthcare Support (1,069 | 3.7%), Cleaning & Maintenance (1,019 | 3.5%), Personal Care & Service (854 | 2.9%), and Security & Protection (686 | 2.4%).

Services Occupations by Sex
Within the Services occupations in Knox County, the most male-oriented occupations are Cleaning & Maintenance (74.5%), Law Enforcement (70.1%), and Security & Protection (57.7%), while the most female-oriented occupations are Personal Care & Service (85.5%), Healthcare Support (73.1%), and Firefighting & Prevention (64.5%).
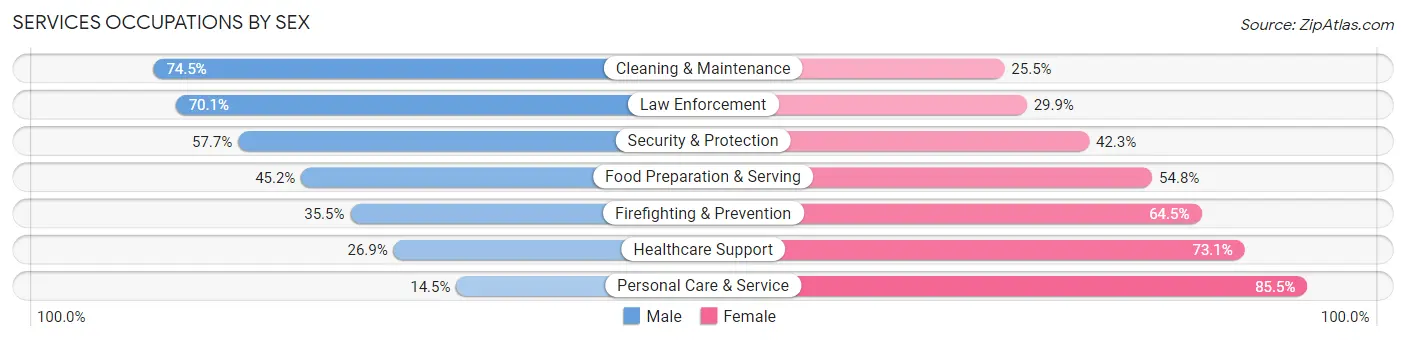
| Occupation | Male | Female |
| Healthcare Support | 288 (26.9%) | 781 (73.1%) |
| Security & Protection | 396 (57.7%) | 290 (42.3%) |
| Firefighting & Prevention | 87 (35.5%) | 158 (64.5%) |
| Law Enforcement | 309 (70.1%) | 132 (29.9%) |
| Food Preparation & Serving | 797 (45.2%) | 965 (54.8%) |
| Cleaning & Maintenance | 759 (74.5%) | 260 (25.5%) |
| Personal Care & Service | 124 (14.5%) | 730 (85.5%) |
| Total (Category) | 2,364 (43.9%) | 3,026 (56.1%) |
| Total (Overall) | 15,371 (53.1%) | 13,564 (46.9%) |
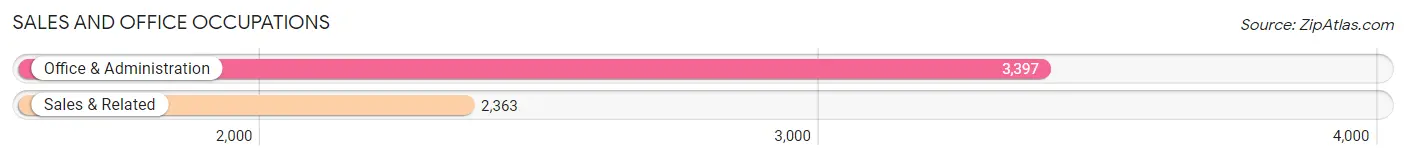
Sales and Office Occupations
The most common Sales and Office occupations in Knox County are Office & Administration (3,397 | 11.7%), and Sales & Related (2,363 | 8.2%).
Sales and Office Occupations by Sex
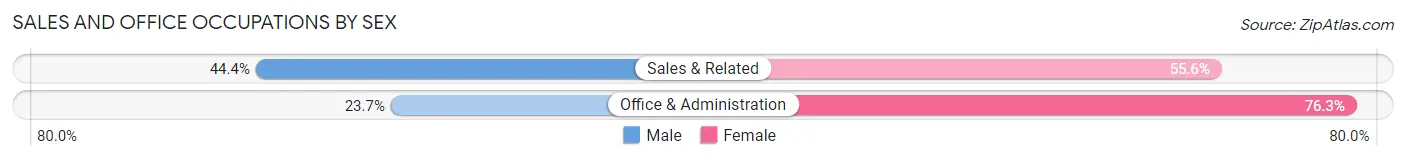
| Occupation | Male | Female |
| Sales & Related | 1,050 (44.4%) | 1,313 (55.6%) |
| Office & Administration | 804 (23.7%) | 2,593 (76.3%) |
| Total (Category) | 1,854 (32.2%) | 3,906 (67.8%) |
| Total (Overall) | 15,371 (53.1%) | 13,564 (46.9%) |
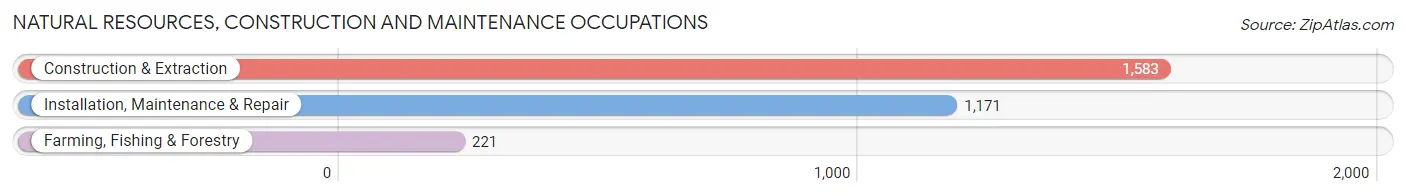
Natural Resources, Construction and Maintenance Occupations
The most common Natural Resources, Construction and Maintenance occupations in Knox County are Construction & Extraction (1,583 | 5.5%), Installation, Maintenance & Repair (1,171 | 4.1%), and Farming, Fishing & Forestry (221 | 0.8%).
Natural Resources, Construction and Maintenance Occupations by Sex
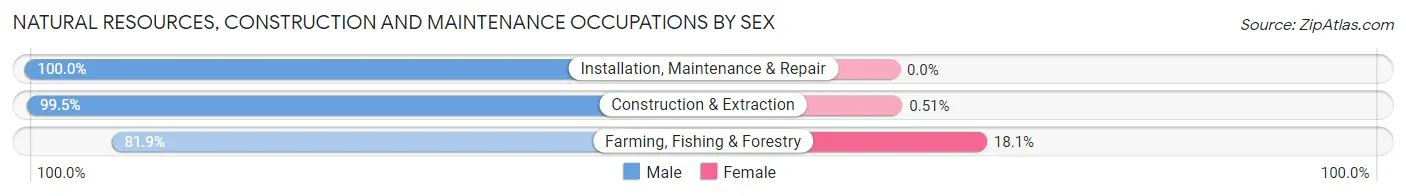
| Occupation | Male | Female |
| Farming, Fishing & Forestry | 181 (81.9%) | 40 (18.1%) |
| Construction & Extraction | 1,575 (99.5%) | 8 (0.5%) |
| Installation, Maintenance & Repair | 1,171 (100.0%) | 0 (0.0%) |
| Total (Category) | 2,927 (98.4%) | 48 (1.6%) |
| Total (Overall) | 15,371 (53.1%) | 13,564 (46.9%) |
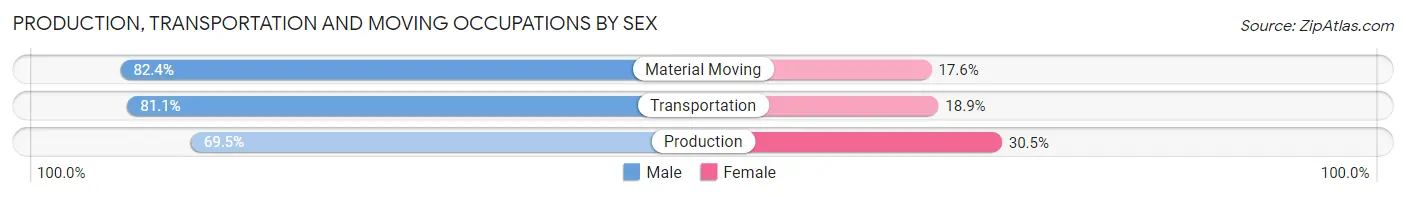
Production, Transportation and Moving Occupations
The most common Production, Transportation and Moving occupations in Knox County are Production (2,943 | 10.2%), Material Moving (1,398 | 4.8%), and Transportation (938 | 3.2%).

Production, Transportation and Moving Occupations by Sex
| Occupation | Male | Female |
| Production | 2,045 (69.5%) | 898 (30.5%) |
| Transportation | 761 (81.1%) | 177 (18.9%) |
| Material Moving | 1,152 (82.4%) | 246 (17.6%) |
| Total (Category) | 3,958 (75.0%) | 1,321 (25.0%) |
| Total (Overall) | 15,371 (53.1%) | 13,564 (46.9%) |
Employment Industries by Sex in Knox County
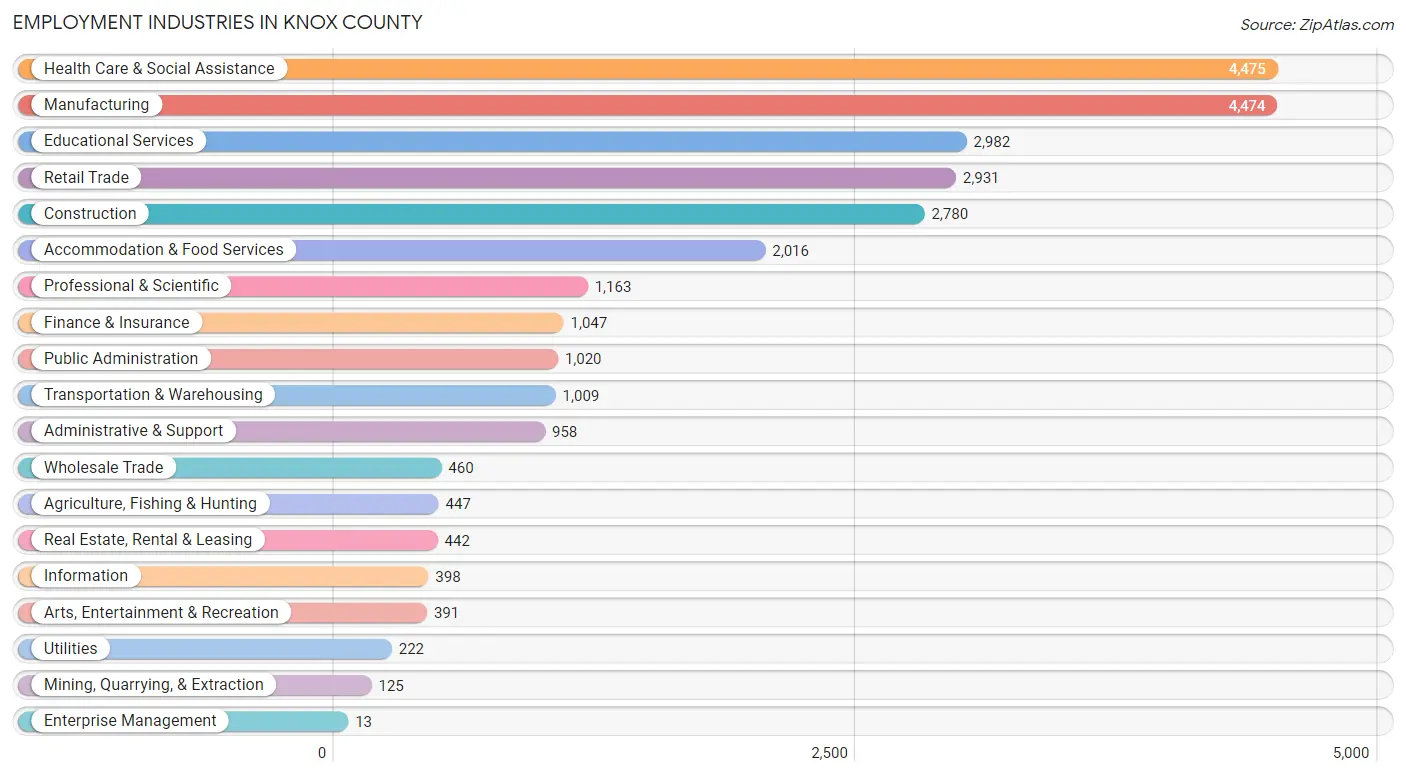
Employment Industries in Knox County
The major employment industries in Knox County include Health Care & Social Assistance (4,475 | 15.5%), Manufacturing (4,474 | 15.5%), Educational Services (2,982 | 10.3%), Retail Trade (2,931 | 10.1%), and Construction (2,780 | 9.6%).
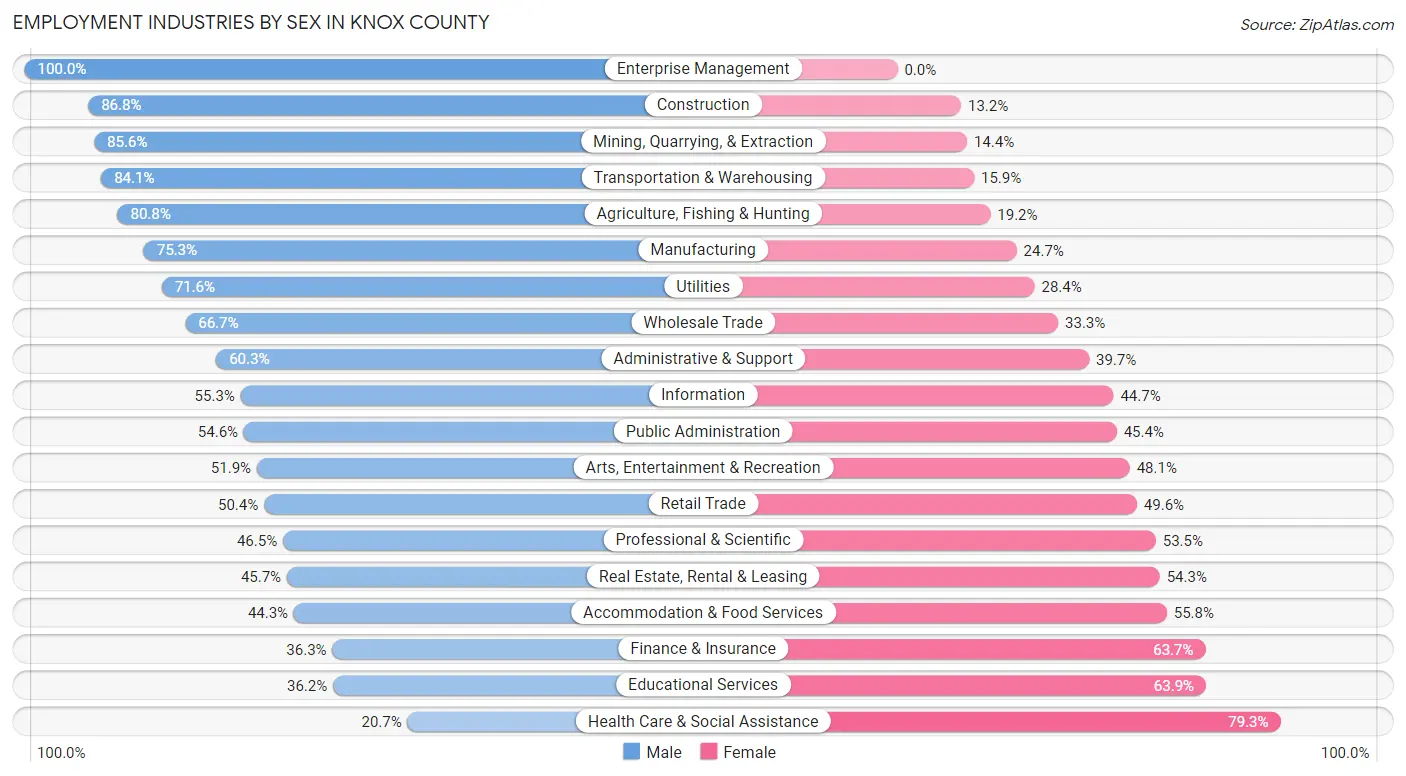
Employment Industries by Sex in Knox County
The Knox County industries that see more men than women are Enterprise Management (100.0%), Construction (86.8%), and Mining, Quarrying, & Extraction (85.6%), whereas the industries that tend to have a higher number of women are Health Care & Social Assistance (79.3%), Educational Services (63.8%), and Finance & Insurance (63.7%).
| Industry | Male | Female |
| Agriculture, Fishing & Hunting | 361 (80.8%) | 86 (19.2%) |
| Mining, Quarrying, & Extraction | 107 (85.6%) | 18 (14.4%) |
| Construction | 2,414 (86.8%) | 366 (13.2%) |
| Manufacturing | 3,370 (75.3%) | 1,104 (24.7%) |
| Wholesale Trade | 307 (66.7%) | 153 (33.3%) |
| Retail Trade | 1,478 (50.4%) | 1,453 (49.6%) |
| Transportation & Warehousing | 849 (84.1%) | 160 (15.9%) |
| Utilities | 159 (71.6%) | 63 (28.4%) |
| Information | 220 (55.3%) | 178 (44.7%) |
| Finance & Insurance | 380 (36.3%) | 667 (63.7%) |
| Real Estate, Rental & Leasing | 202 (45.7%) | 240 (54.3%) |
| Professional & Scientific | 541 (46.5%) | 622 (53.5%) |
| Enterprise Management | 13 (100.0%) | 0 (0.0%) |
| Administrative & Support | 578 (60.3%) | 380 (39.7%) |
| Educational Services | 1,078 (36.1%) | 1,904 (63.8%) |
| Health Care & Social Assistance | 928 (20.7%) | 3,547 (79.3%) |
| Arts, Entertainment & Recreation | 203 (51.9%) | 188 (48.1%) |
| Accommodation & Food Services | 892 (44.3%) | 1,124 (55.7%) |
| Public Administration | 557 (54.6%) | 463 (45.4%) |
| Total | 15,371 (53.1%) | 13,564 (46.9%) |
Education in Knox County
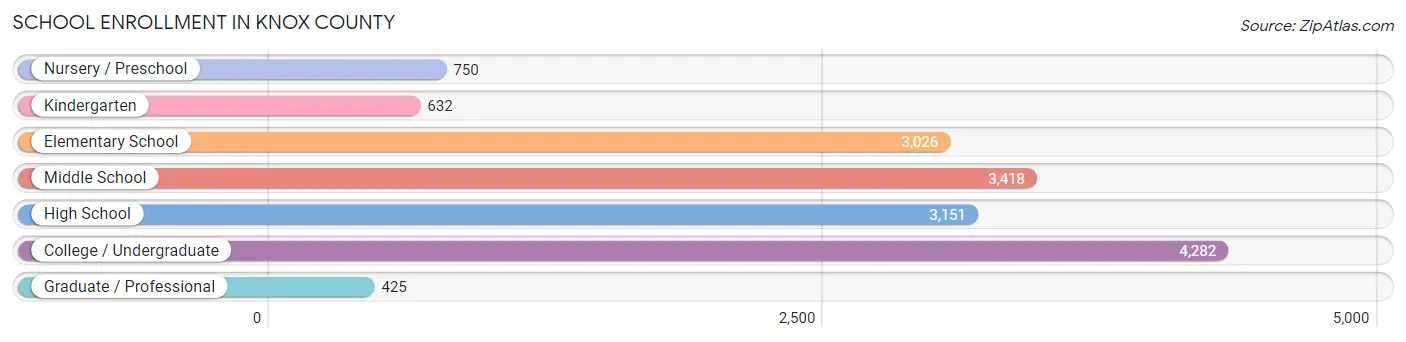
School Enrollment in Knox County
The most common levels of schooling among the 15,684 students in Knox County are college / undergraduate (4,282 | 27.3%), middle school (3,418 | 21.8%), and high school (3,151 | 20.1%).
| School Level | # Students | % Students |
| Nursery / Preschool | 750 | 4.8% |
| Kindergarten | 632 | 4.0% |
| Elementary School | 3,026 | 19.3% |
| Middle School | 3,418 | 21.8% |
| High School | 3,151 | 20.1% |
| College / Undergraduate | 4,282 | 27.3% |
| Graduate / Professional | 425 | 2.7% |
| Total | 15,684 | 100.0% |
School Enrollment by Age by Funding Source in Knox County
Out of a total of 15,684 students who are enrolled in schools in Knox County, 4,893 (31.2%) attend a private institution, while the remaining 10,791 (68.8%) are enrolled in public schools. The age group of 20 to 24 year olds has the highest likelihood of being enrolled in private schools, with 1,451 (66.6% in the age bracket) enrolled. Conversely, the age group of 15 to 17 year olds has the lowest likelihood of being enrolled in a private school, with 2,160 (92.7% in the age bracket) attending a public institution.

| Age Bracket | Public School | Private School |
| 3 to 4 Year Olds | 337 (67.3%) | 164 (32.7%) |
| 5 to 9 Year Old | 2,630 (79.6%) | 672 (20.3%) |
| 10 to 14 Year Olds | 3,487 (80.3%) | 857 (19.7%) |
| 15 to 17 Year Olds | 2,160 (92.7%) | 171 (7.3%) |
| 18 to 19 Year Olds | 705 (34.6%) | 1,332 (65.4%) |
| 20 to 24 Year Olds | 726 (33.4%) | 1,451 (66.6%) |
| 25 to 34 Year Olds | 371 (86.1%) | 60 (13.9%) |
| 35 Years and over | 378 (67.4%) | 183 (32.6%) |
| Total | 10,791 (68.8%) | 4,893 (31.2%) |
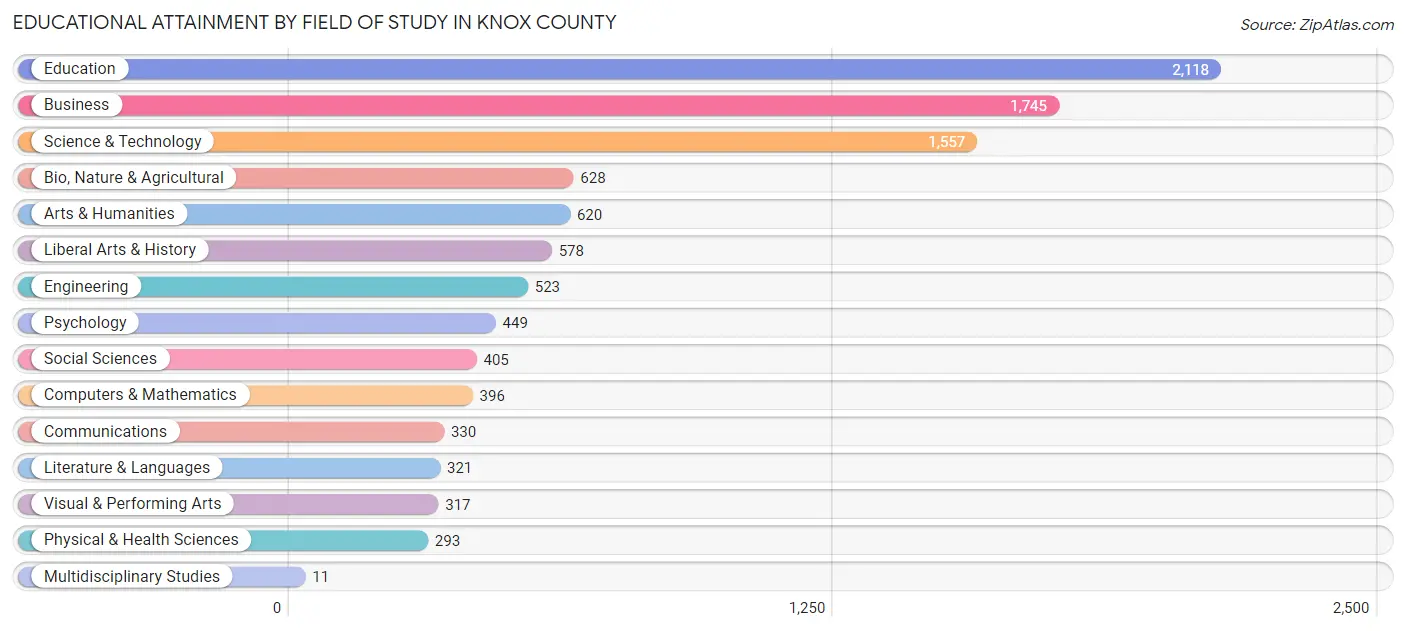
Educational Attainment by Field of Study in Knox County
Education (2,118 | 20.6%), business (1,745 | 17.0%), science & technology (1,557 | 15.1%), bio, nature & agricultural (628 | 6.1%), and arts & humanities (620 | 6.0%) are the most common fields of study among 10,291 individuals in Knox County who have obtained a bachelor's degree or higher.
| Field of Study | # Graduates | % Graduates |
| Computers & Mathematics | 396 | 3.8% |
| Bio, Nature & Agricultural | 628 | 6.1% |
| Physical & Health Sciences | 293 | 2.9% |
| Psychology | 449 | 4.4% |
| Social Sciences | 405 | 3.9% |
| Engineering | 523 | 5.1% |
| Multidisciplinary Studies | 11 | 0.1% |
| Science & Technology | 1,557 | 15.1% |
| Business | 1,745 | 17.0% |
| Education | 2,118 | 20.6% |
| Literature & Languages | 321 | 3.1% |
| Liberal Arts & History | 578 | 5.6% |
| Visual & Performing Arts | 317 | 3.1% |
| Communications | 330 | 3.2% |
| Arts & Humanities | 620 | 6.0% |
| Total | 10,291 | 100.0% |
Transportation & Commute in Knox County
Vehicle Availability by Sex in Knox County
The most prevalent vehicle ownership categories in Knox County are males with 2 vehicles (5,384, accounting for 37.0%) and females with 2 vehicles (5,159, making up 42.7%).

| Vehicles Available | Male | Female |
| No Vehicle | 824 (5.7%) | 304 (2.4%) |
| 1 Vehicle | 1,201 (8.3%) | 1,922 (15.2%) |
| 2 Vehicles | 5,384 (37.0%) | 5,159 (40.9%) |
| 3 Vehicles | 4,199 (28.9%) | 2,979 (23.6%) |
| 4 Vehicles | 2,128 (14.6%) | 1,622 (12.9%) |
| 5 or more Vehicles | 794 (5.5%) | 624 (5.0%) |
| Total | 14,530 (100.0%) | 12,610 (100.0%) |
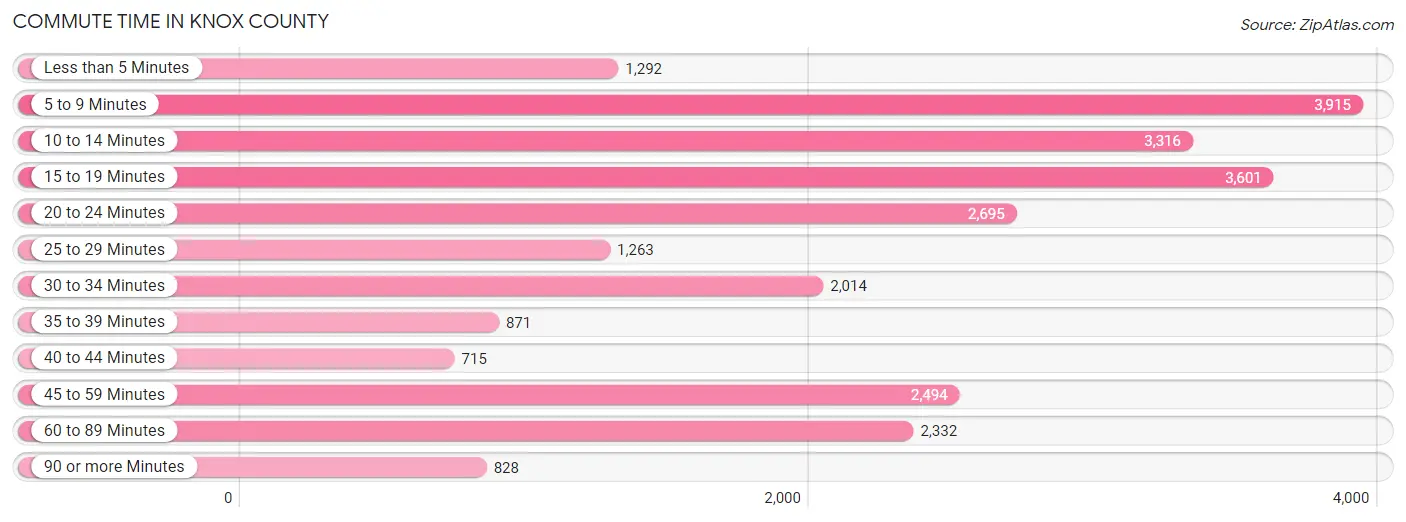
Commute Time in Knox County
The most frequently occuring commute durations in Knox County are 5 to 9 minutes (3,915 commuters, 15.4%), 15 to 19 minutes (3,601 commuters, 14.2%), and 10 to 14 minutes (3,316 commuters, 13.1%).
| Commute Time | # Commuters | % Commuters |
| Less than 5 Minutes | 1,292 | 5.1% |
| 5 to 9 Minutes | 3,915 | 15.4% |
| 10 to 14 Minutes | 3,316 | 13.1% |
| 15 to 19 Minutes | 3,601 | 14.2% |
| 20 to 24 Minutes | 2,695 | 10.6% |
| 25 to 29 Minutes | 1,263 | 5.0% |
| 30 to 34 Minutes | 2,014 | 8.0% |
| 35 to 39 Minutes | 871 | 3.4% |
| 40 to 44 Minutes | 715 | 2.8% |
| 45 to 59 Minutes | 2,494 | 9.8% |
| 60 to 89 Minutes | 2,332 | 9.2% |
| 90 or more Minutes | 828 | 3.3% |
Commute Time by Sex in Knox County
The most common commute times in Knox County are 15 to 19 minutes (2,173 commuters, 15.9%) for males and 5 to 9 minutes (2,250 commuters, 19.2%) for females.

| Commute Time | Male | Female |
| Less than 5 Minutes | 679 (5.0%) | 613 (5.2%) |
| 5 to 9 Minutes | 1,665 (12.2%) | 2,250 (19.2%) |
| 10 to 14 Minutes | 1,604 (11.8%) | 1,712 (14.6%) |
| 15 to 19 Minutes | 2,173 (15.9%) | 1,428 (12.2%) |
| 20 to 24 Minutes | 1,423 (10.4%) | 1,272 (10.9%) |
| 25 to 29 Minutes | 522 (3.8%) | 741 (6.3%) |
| 30 to 34 Minutes | 1,153 (8.5%) | 861 (7.4%) |
| 35 to 39 Minutes | 667 (4.9%) | 204 (1.7%) |
| 40 to 44 Minutes | 461 (3.4%) | 254 (2.2%) |
| 45 to 59 Minutes | 1,205 (8.8%) | 1,289 (11.0%) |
| 60 to 89 Minutes | 1,550 (11.4%) | 782 (6.7%) |
| 90 or more Minutes | 541 (4.0%) | 287 (2.5%) |
Time of Departure to Work by Sex in Knox County
The most frequent times of departure to work in Knox County are 6:00 AM to 6:29 AM (1,819, 13.3%) for males and 7:30 AM to 7:59 AM (1,777, 15.2%) for females.

| Time of Departure | Male | Female |
| 12:00 AM to 4:59 AM | 1,374 (10.1%) | 308 (2.6%) |
| 5:00 AM to 5:29 AM | 847 (6.2%) | 411 (3.5%) |
| 5:30 AM to 5:59 AM | 809 (5.9%) | 560 (4.8%) |
| 6:00 AM to 6:29 AM | 1,819 (13.3%) | 843 (7.2%) |
| 6:30 AM to 6:59 AM | 1,626 (11.9%) | 1,131 (9.7%) |
| 7:00 AM to 7:29 AM | 1,744 (12.8%) | 1,649 (14.1%) |
| 7:30 AM to 7:59 AM | 1,233 (9.0%) | 1,777 (15.2%) |
| 8:00 AM to 8:29 AM | 1,149 (8.4%) | 1,251 (10.7%) |
| 8:30 AM to 8:59 AM | 374 (2.7%) | 717 (6.1%) |
| 9:00 AM to 9:59 AM | 416 (3.0%) | 523 (4.5%) |
| 10:00 AM to 10:59 AM | 162 (1.2%) | 265 (2.3%) |
| 11:00 AM to 11:59 AM | 238 (1.7%) | 186 (1.6%) |
| 12:00 PM to 3:59 PM | 1,029 (7.5%) | 969 (8.3%) |
| 4:00 PM to 11:59 PM | 823 (6.0%) | 1,103 (9.4%) |
| Total | 13,643 (100.0%) | 11,693 (100.0%) |
Housing Occupancy in Knox County
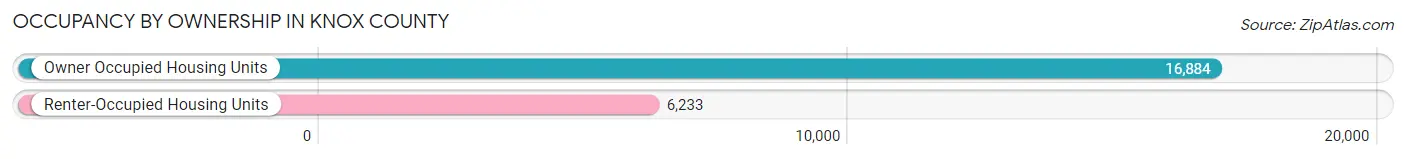
Occupancy by Ownership in Knox County
Of the total 23,117 dwellings in Knox County, owner-occupied units account for 16,884 (73.0%), while renter-occupied units make up 6,233 (27.0%).
| Occupancy | # Housing Units | % Housing Units |
| Owner Occupied Housing Units | 16,884 | 73.0% |
| Renter-Occupied Housing Units | 6,233 | 27.0% |
| Total Occupied Housing Units | 23,117 | 100.0% |
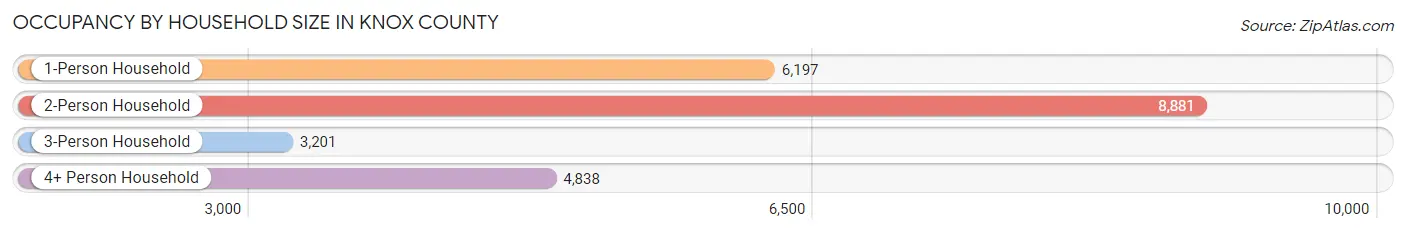
Occupancy by Household Size in Knox County
| Household Size | # Housing Units | % Housing Units |
| 1-Person Household | 6,197 | 26.8% |
| 2-Person Household | 8,881 | 38.4% |
| 3-Person Household | 3,201 | 13.9% |
| 4+ Person Household | 4,838 | 20.9% |
| Total Housing Units | 23,117 | 100.0% |
Occupancy by Ownership by Household Size in Knox County
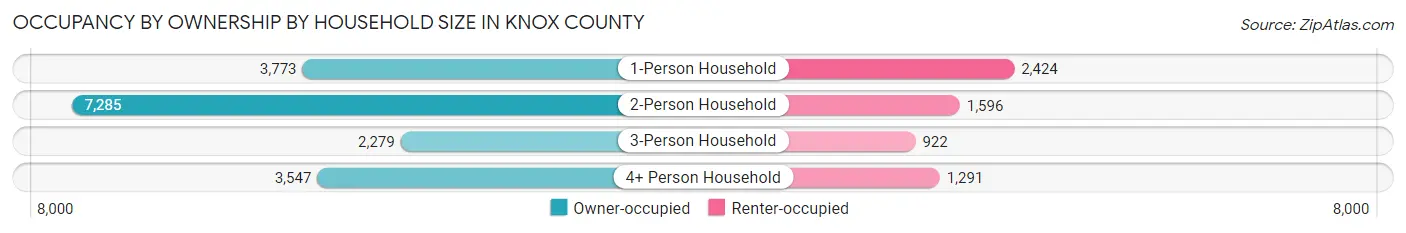
| Household Size | Owner-occupied | Renter-occupied |
| 1-Person Household | 3,773 (60.9%) | 2,424 (39.1%) |
| 2-Person Household | 7,285 (82.0%) | 1,596 (18.0%) |
| 3-Person Household | 2,279 (71.2%) | 922 (28.8%) |
| 4+ Person Household | 3,547 (73.3%) | 1,291 (26.7%) |
| Total Housing Units | 16,884 (73.0%) | 6,233 (27.0%) |
Occupancy by Educational Attainment in Knox County

| Household Size | Owner-occupied | Renter-occupied |
| Less than High School | 1,152 (63.8%) | 653 (36.2%) |
| High School Diploma | 5,937 (68.8%) | 2,694 (31.2%) |
| College/Associate Degree | 5,151 (74.3%) | 1,779 (25.7%) |
| Bachelor's Degree or higher | 4,644 (80.7%) | 1,107 (19.3%) |
Occupancy by Age of Householder in Knox County

| Age Bracket | # Households | % Households |
| Under 35 Years | 3,897 | 16.9% |
| 35 to 44 Years | 3,452 | 14.9% |
| 45 to 54 Years | 3,854 | 16.7% |
| 55 to 64 Years | 4,983 | 21.6% |
| 65 to 74 Years | 4,100 | 17.7% |
| 75 to 84 Years | 1,981 | 8.6% |
| 85 Years and Over | 850 | 3.7% |
| Total | 23,117 | 100.0% |
Housing Finances in Knox County
Median Income by Occupancy in Knox County
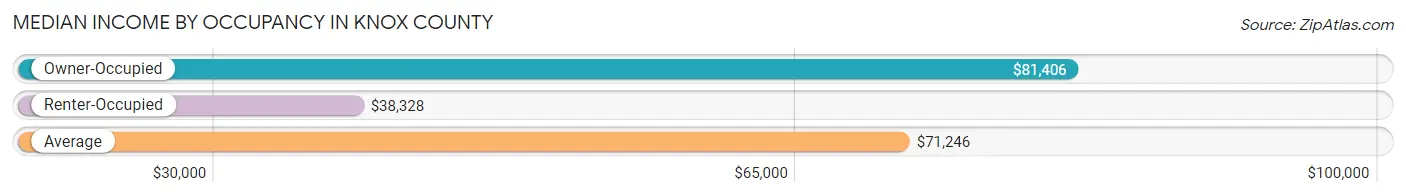
| Occupancy Type | # Households | Median Income |
| Owner-Occupied | 16,884 (73.0%) | $81,406 |
| Renter-Occupied | 6,233 (27.0%) | $38,328 |
| Average | 23,117 (100.0%) | $71,246 |
Occupancy by Householder Income Bracket in Knox County
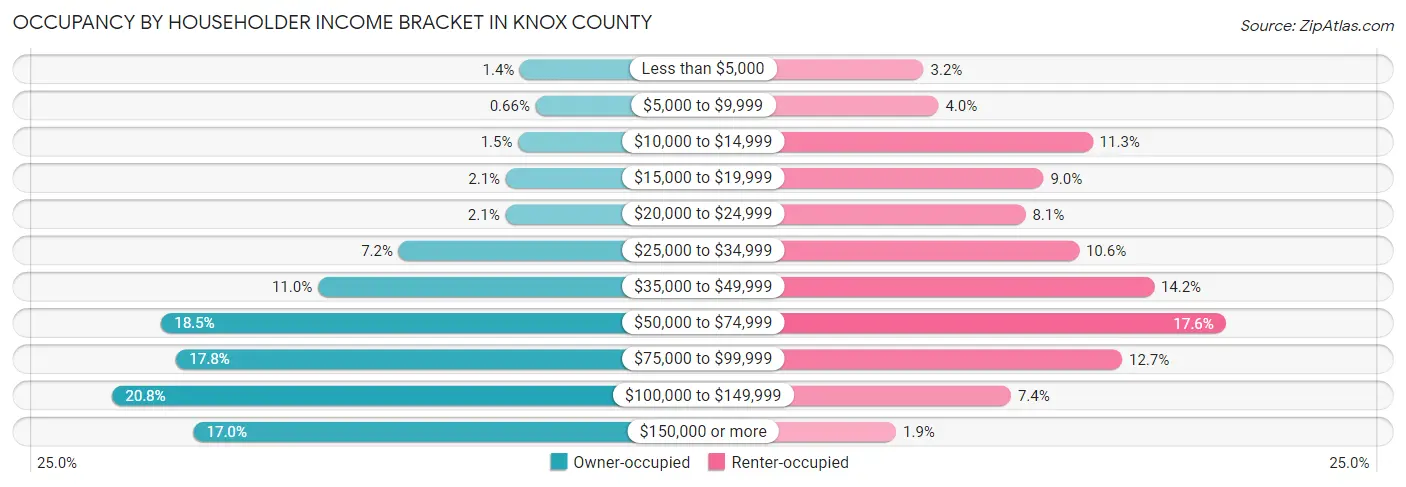
| Income Bracket | Owner-occupied | Renter-occupied |
| Less than $5,000 | 237 (1.4%) | 202 (3.2%) |
| $5,000 to $9,999 | 112 (0.7%) | 246 (4.0%) |
| $10,000 to $14,999 | 252 (1.5%) | 704 (11.3%) |
| $15,000 to $19,999 | 352 (2.1%) | 558 (8.9%) |
| $20,000 to $24,999 | 355 (2.1%) | 504 (8.1%) |
| $25,000 to $34,999 | 1,213 (7.2%) | 663 (10.6%) |
| $35,000 to $49,999 | 1,863 (11.0%) | 886 (14.2%) |
| $50,000 to $74,999 | 3,122 (18.5%) | 1,098 (17.6%) |
| $75,000 to $99,999 | 3,001 (17.8%) | 791 (12.7%) |
| $100,000 to $149,999 | 3,516 (20.8%) | 461 (7.4%) |
| $150,000 or more | 2,861 (17.0%) | 120 (1.9%) |
| Total | 16,884 (100.0%) | 6,233 (100.0%) |
Monthly Housing Cost Tiers in Knox County
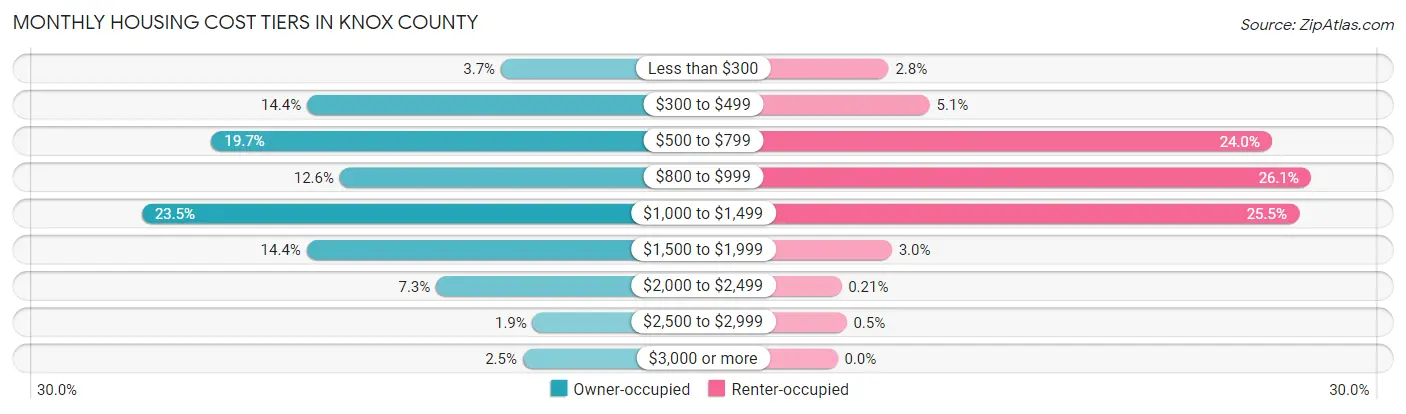
| Monthly Cost | Owner-occupied | Renter-occupied |
| Less than $300 | 623 (3.7%) | 176 (2.8%) |
| $300 to $499 | 2,431 (14.4%) | 317 (5.1%) |
| $500 to $799 | 3,323 (19.7%) | 1,495 (24.0%) |
| $800 to $999 | 2,126 (12.6%) | 1,629 (26.1%) |
| $1,000 to $1,499 | 3,973 (23.5%) | 1,588 (25.5%) |
| $1,500 to $1,999 | 2,435 (14.4%) | 187 (3.0%) |
| $2,000 to $2,499 | 1,227 (7.3%) | 13 (0.2%) |
| $2,500 to $2,999 | 327 (1.9%) | 31 (0.5%) |
| $3,000 or more | 419 (2.5%) | 0 (0.0%) |
| Total | 16,884 (100.0%) | 6,233 (100.0%) |
Physical Housing Characteristics in Knox County
Housing Structures in Knox County
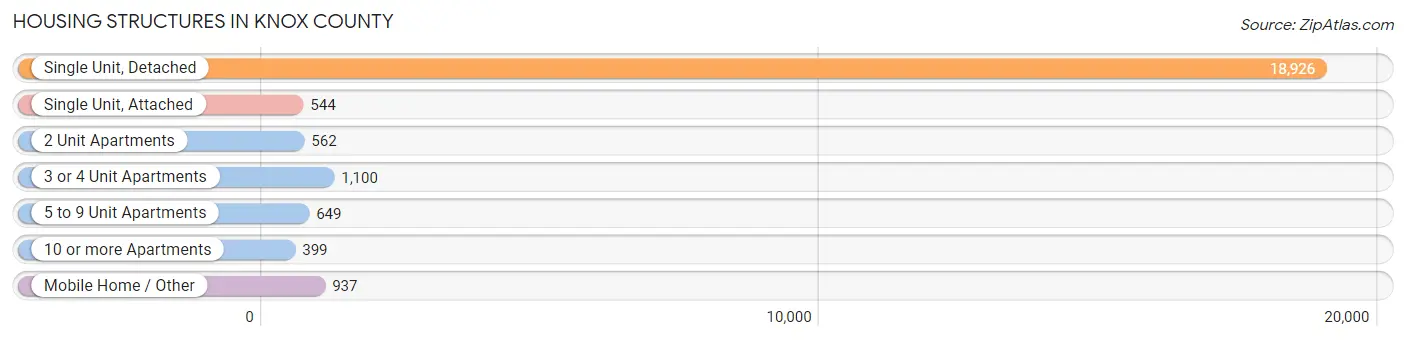
| Structure Type | # Housing Units | % Housing Units |
| Single Unit, Detached | 18,926 | 81.9% |
| Single Unit, Attached | 544 | 2.4% |
| 2 Unit Apartments | 562 | 2.4% |
| 3 or 4 Unit Apartments | 1,100 | 4.8% |
| 5 to 9 Unit Apartments | 649 | 2.8% |
| 10 or more Apartments | 399 | 1.7% |
| Mobile Home / Other | 937 | 4.1% |
| Total | 23,117 | 100.0% |
Housing Structures by Occupancy in Knox County
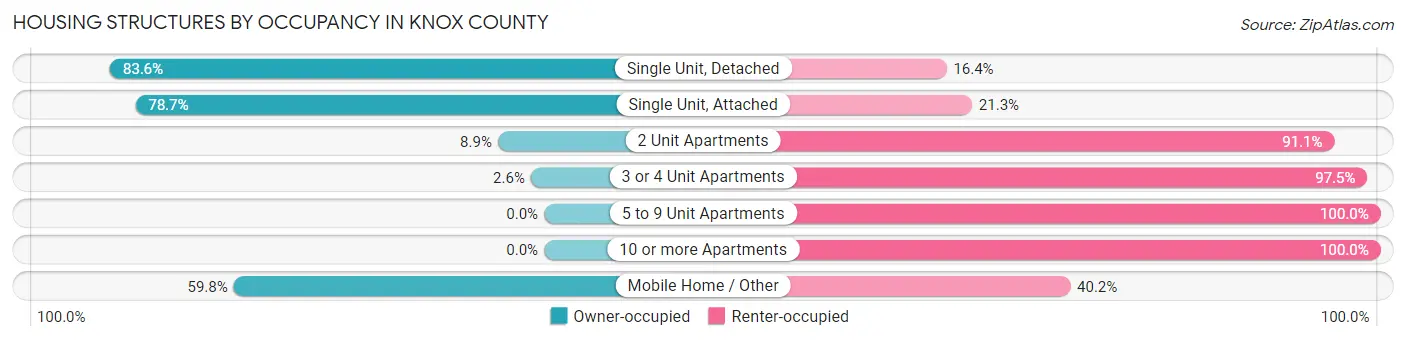
| Structure Type | Owner-occupied | Renter-occupied |
| Single Unit, Detached | 15,818 (83.6%) | 3,108 (16.4%) |
| Single Unit, Attached | 428 (78.7%) | 116 (21.3%) |
| 2 Unit Apartments | 50 (8.9%) | 512 (91.1%) |
| 3 or 4 Unit Apartments | 28 (2.5%) | 1,072 (97.5%) |
| 5 to 9 Unit Apartments | 0 (0.0%) | 649 (100.0%) |
| 10 or more Apartments | 0 (0.0%) | 399 (100.0%) |
| Mobile Home / Other | 560 (59.8%) | 377 (40.2%) |
| Total | 16,884 (73.0%) | 6,233 (27.0%) |
Housing Structures by Number of Rooms in Knox County
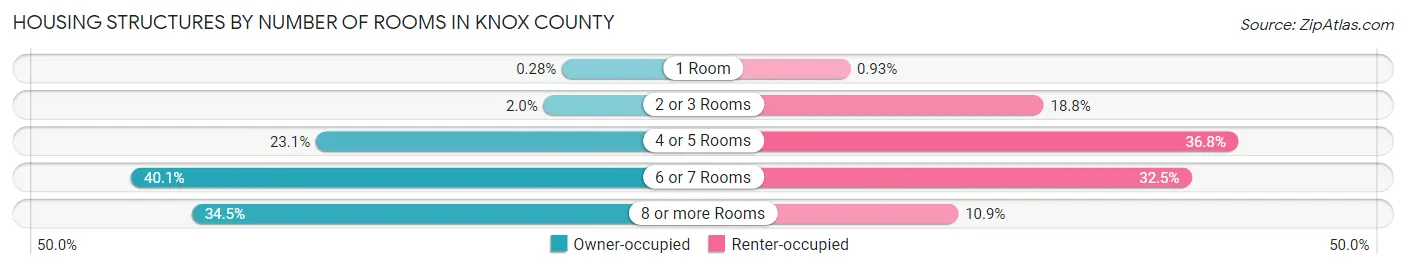
| Number of Rooms | Owner-occupied | Renter-occupied |
| 1 Room | 47 (0.3%) | 58 (0.9%) |
| 2 or 3 Rooms | 337 (2.0%) | 1,174 (18.8%) |
| 4 or 5 Rooms | 3,891 (23.1%) | 2,293 (36.8%) |
| 6 or 7 Rooms | 6,777 (40.1%) | 2,026 (32.5%) |
| 8 or more Rooms | 5,832 (34.5%) | 682 (10.9%) |
| Total | 16,884 (100.0%) | 6,233 (100.0%) |
Housing Structure by Heating Type in Knox County
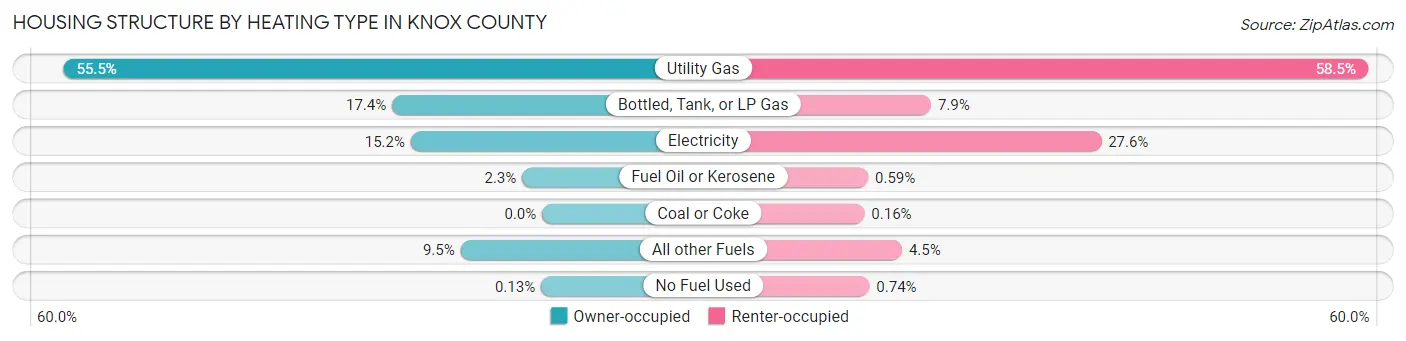
| Heating Type | Owner-occupied | Renter-occupied |
| Utility Gas | 9,369 (55.5%) | 3,647 (58.5%) |
| Bottled, Tank, or LP Gas | 2,937 (17.4%) | 491 (7.9%) |
| Electricity | 2,569 (15.2%) | 1,721 (27.6%) |
| Fuel Oil or Kerosene | 392 (2.3%) | 37 (0.6%) |
| Coal or Coke | 0 (0.0%) | 10 (0.2%) |
| All other Fuels | 1,595 (9.5%) | 281 (4.5%) |
| No Fuel Used | 22 (0.1%) | 46 (0.7%) |
| Total | 16,884 (100.0%) | 6,233 (100.0%) |
Household Vehicle Usage in Knox County

| Vehicles per Household | Owner-occupied | Renter-occupied |
| No Vehicle | 698 (4.1%) | 700 (11.2%) |
| 1 Vehicle | 3,234 (19.2%) | 2,654 (42.6%) |
| 2 Vehicles | 7,316 (43.3%) | 1,844 (29.6%) |
| 3 or more Vehicles | 5,636 (33.4%) | 1,035 (16.6%) |
| Total | 16,884 (100.0%) | 6,233 (100.0%) |
Real Estate & Mortgages in Knox County
Real Estate and Mortgage Overview in Knox County
| Characteristic | Without Mortgage | With Mortgage |
| Housing Units | 6,492 | 10,392 |
| Median Property Value | $182,800 | $207,700 |
| Median Household Income | $62,500 | $1,931 |
| Monthly Housing Costs | $522 | $370 |
| Real Estate Taxes | $1,994 | $189 |
Property Value by Mortgage Status in Knox County
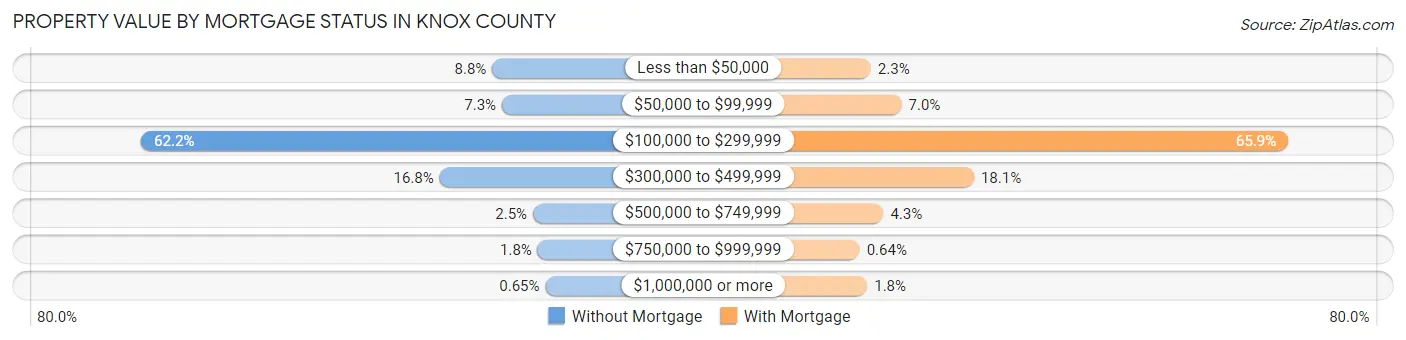
| Property Value | Without Mortgage | With Mortgage |
| Less than $50,000 | 568 (8.7%) | 243 (2.3%) |
| $50,000 to $99,999 | 471 (7.3%) | 730 (7.0%) |
| $100,000 to $299,999 | 4,040 (62.2%) | 6,849 (65.9%) |
| $300,000 to $499,999 | 1,088 (16.8%) | 1,876 (18.0%) |
| $500,000 to $749,999 | 165 (2.5%) | 442 (4.3%) |
| $750,000 to $999,999 | 118 (1.8%) | 66 (0.6%) |
| $1,000,000 or more | 42 (0.6%) | 186 (1.8%) |
| Total | 6,492 (100.0%) | 10,392 (100.0%) |
Household Income by Mortgage Status in Knox County
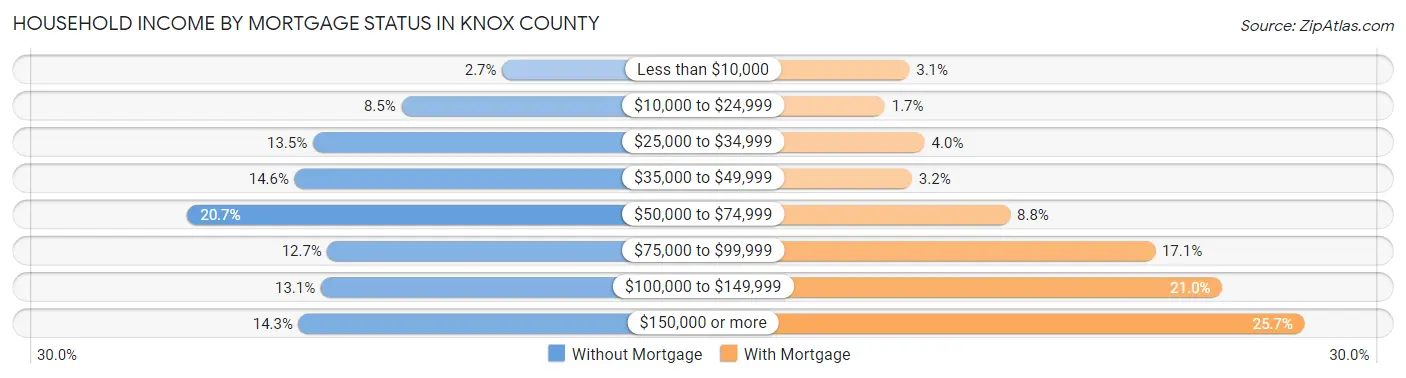
| Household Income | Without Mortgage | With Mortgage |
| Less than $10,000 | 175 (2.7%) | 319 (3.1%) |
| $10,000 to $24,999 | 549 (8.5%) | 174 (1.7%) |
| $25,000 to $34,999 | 878 (13.5%) | 410 (4.0%) |
| $35,000 to $49,999 | 945 (14.6%) | 335 (3.2%) |
| $50,000 to $74,999 | 1,344 (20.7%) | 918 (8.8%) |
| $75,000 to $99,999 | 823 (12.7%) | 1,778 (17.1%) |
| $100,000 to $149,999 | 848 (13.1%) | 2,178 (21.0%) |
| $150,000 or more | 930 (14.3%) | 2,668 (25.7%) |
| Total | 6,492 (100.0%) | 10,392 (100.0%) |
Property Value to Household Income Ratio in Knox County
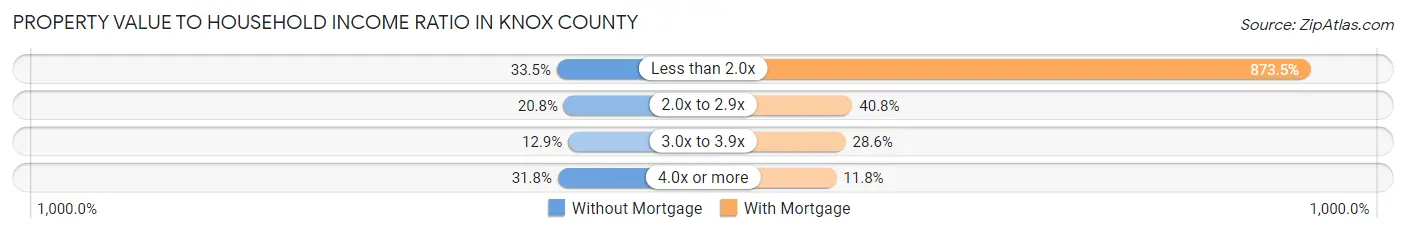
| Value-to-Income Ratio | Without Mortgage | With Mortgage |
| Less than 2.0x | 2,177 (33.5%) | 90,777 (873.5%) |
| 2.0x to 2.9x | 1,350 (20.8%) | 4,237 (40.8%) |
| 3.0x to 3.9x | 837 (12.9%) | 2,971 (28.6%) |
| 4.0x or more | 2,061 (31.8%) | 1,227 (11.8%) |
| Total | 6,492 (100.0%) | 10,392 (100.0%) |
Real Estate Taxes by Mortgage Status in Knox County
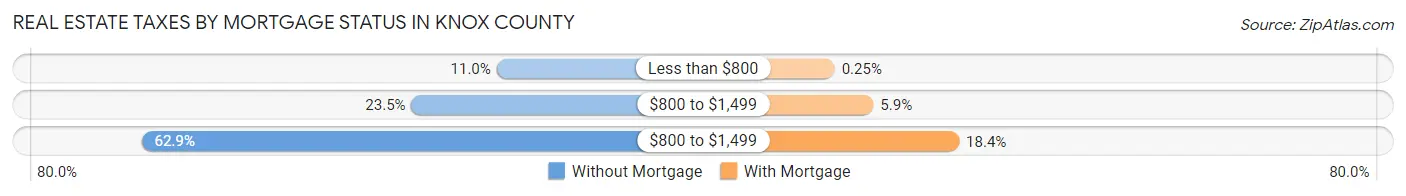
| Property Taxes | Without Mortgage | With Mortgage |
| Less than $800 | 716 (11.0%) | 26 (0.3%) |
| $800 to $1,499 | 1,524 (23.5%) | 613 (5.9%) |
| $800 to $1,499 | 4,084 (62.9%) | 1,915 (18.4%) |
| Total | 6,492 (100.0%) | 10,392 (100.0%) |
Health & Disability in Knox County
Health Insurance Coverage by Age in Knox County

| Age Bracket | With Coverage | Without Coverage |
| Under 6 Years | 3,553 (78.0%) | 999 (22.0%) |
| 6 to 18 Years | 9,531 (87.4%) | 1,377 (12.6%) |
| 19 to 25 Years | 5,766 (88.1%) | 781 (11.9%) |
| 26 to 34 Years | 5,236 (83.5%) | 1,035 (16.5%) |
| 35 to 44 Years | 6,124 (88.5%) | 796 (11.5%) |
| 45 to 54 Years | 6,545 (91.7%) | 595 (8.3%) |
| 55 to 64 Years | 7,684 (91.5%) | 709 (8.5%) |
| 65 to 74 Years | 6,655 (98.7%) | 91 (1.3%) |
| 75 Years and older | 4,398 (98.3%) | 77 (1.7%) |
| Total | 55,492 (89.6%) | 6,460 (10.4%) |
Health Insurance Coverage by Citizenship Status in Knox County

| Citizenship Status | With Coverage | Without Coverage |
| Native Born | 3,553 (78.0%) | 999 (22.0%) |
| Foreign Born, Citizen | 9,531 (87.4%) | 1,377 (12.6%) |
| Foreign Born, not a Citizen | 5,766 (88.1%) | 781 (11.9%) |
Health Insurance Coverage by Household Income in Knox County
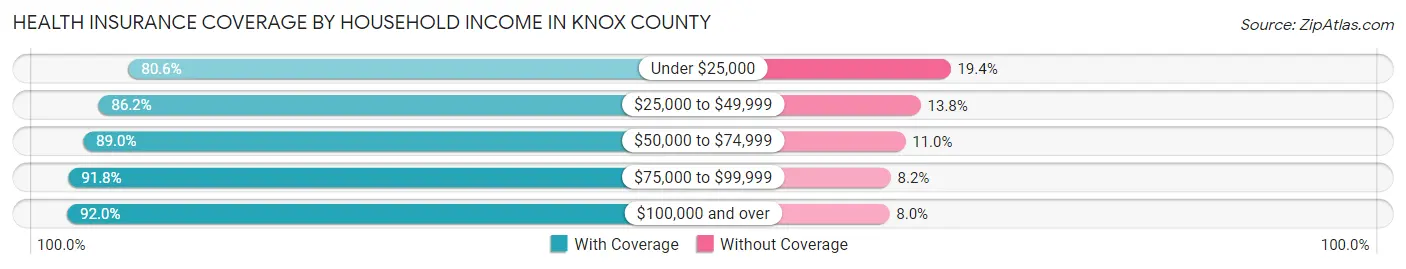
| Household Income | With Coverage | Without Coverage |
| Under $25,000 | 5,068 (80.6%) | 1,222 (19.4%) |
| $25,000 to $49,999 | 9,458 (86.2%) | 1,518 (13.8%) |
| $50,000 to $74,999 | 8,999 (89.0%) | 1,108 (11.0%) |
| $75,000 to $99,999 | 9,645 (91.8%) | 863 (8.2%) |
| $100,000 and over | 19,640 (92.0%) | 1,702 (8.0%) |
Public vs Private Health Insurance Coverage by Age in Knox County
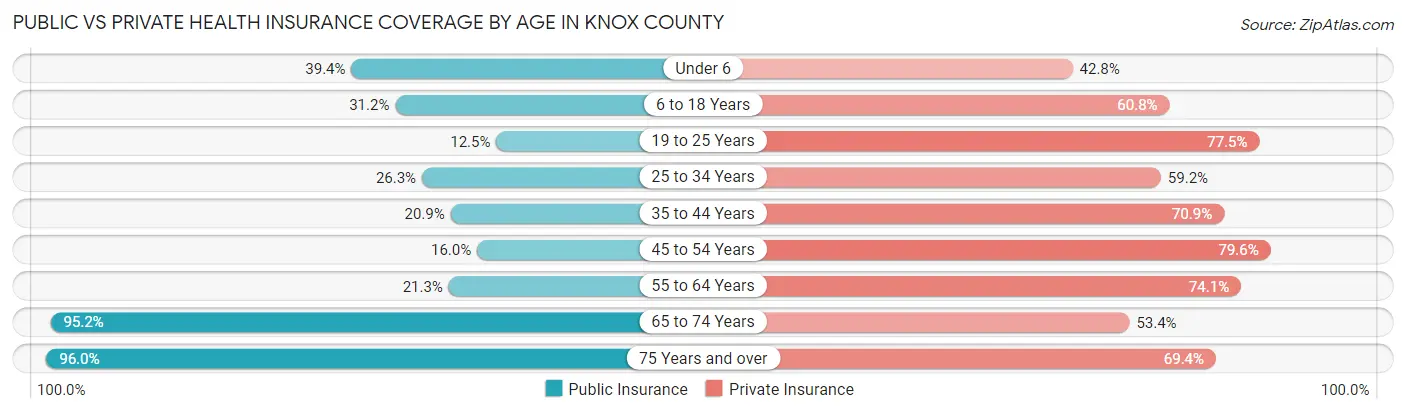
| Age Bracket | Public Insurance | Private Insurance |
| Under 6 | 1,791 (39.4%) | 1,950 (42.8%) |
| 6 to 18 Years | 3,404 (31.2%) | 6,632 (60.8%) |
| 19 to 25 Years | 815 (12.4%) | 5,074 (77.5%) |
| 25 to 34 Years | 1,646 (26.3%) | 3,714 (59.2%) |
| 35 to 44 Years | 1,449 (20.9%) | 4,909 (70.9%) |
| 45 to 54 Years | 1,144 (16.0%) | 5,681 (79.6%) |
| 55 to 64 Years | 1,786 (21.3%) | 6,218 (74.1%) |
| 65 to 74 Years | 6,422 (95.2%) | 3,602 (53.4%) |
| 75 Years and over | 4,294 (96.0%) | 3,107 (69.4%) |
| Total | 22,751 (36.7%) | 40,887 (66.0%) |
Disability Status by Sex by Age in Knox County
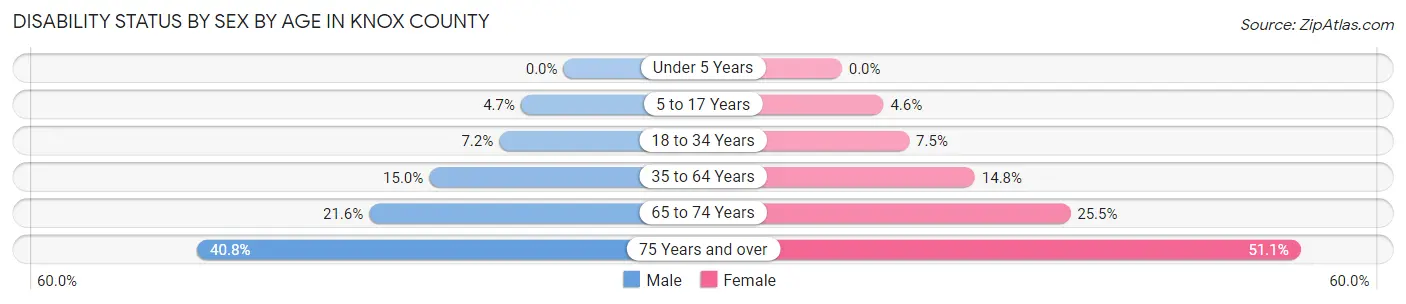
| Age Bracket | Male | Female |
| Under 5 Years | 0 (0.0%) | 0 (0.0%) |
| 5 to 17 Years | 253 (4.7%) | 241 (4.6%) |
| 18 to 34 Years | 491 (7.2%) | 536 (7.5%) |
| 35 to 64 Years | 1,679 (14.9%) | 1,663 (14.8%) |
| 65 to 74 Years | 704 (21.6%) | 889 (25.5%) |
| 75 Years and over | 756 (40.8%) | 1,339 (51.1%) |
Disability Class by Sex by Age in Knox County
Disability Class: Hearing Difficulty
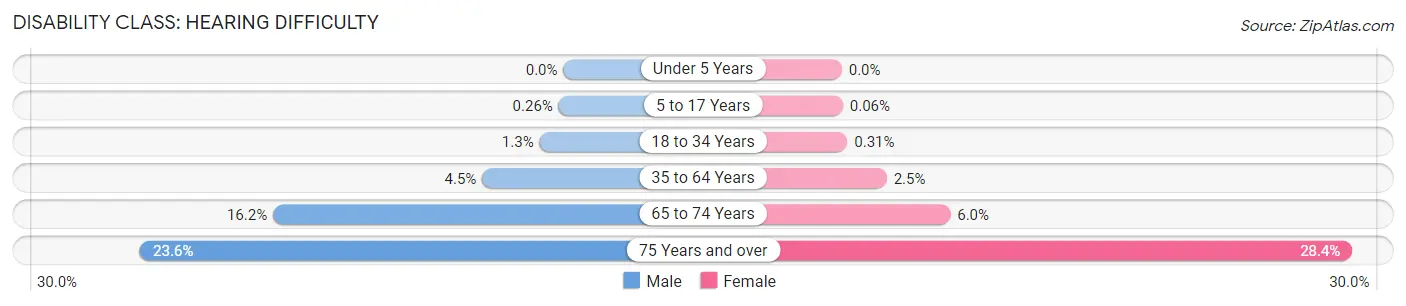
| Age Bracket | Male | Female |
| Under 5 Years | 0 (0.0%) | 0 (0.0%) |
| 5 to 17 Years | 14 (0.3%) | 3 (0.1%) |
| 18 to 34 Years | 91 (1.3%) | 22 (0.3%) |
| 35 to 64 Years | 508 (4.5%) | 281 (2.5%) |
| 65 to 74 Years | 526 (16.2%) | 211 (6.0%) |
| 75 Years and over | 437 (23.6%) | 745 (28.4%) |
Disability Class: Vision Difficulty

| Age Bracket | Male | Female |
| Under 5 Years | 0 (0.0%) | 0 (0.0%) |
| 5 to 17 Years | 54 (1.0%) | 63 (1.2%) |
| 18 to 34 Years | 76 (1.1%) | 127 (1.8%) |
| 35 to 64 Years | 475 (4.2%) | 378 (3.4%) |
| 65 to 74 Years | 86 (2.6%) | 131 (3.7%) |
| 75 Years and over | 253 (13.7%) | 319 (12.2%) |
Disability Class: Cognitive Difficulty
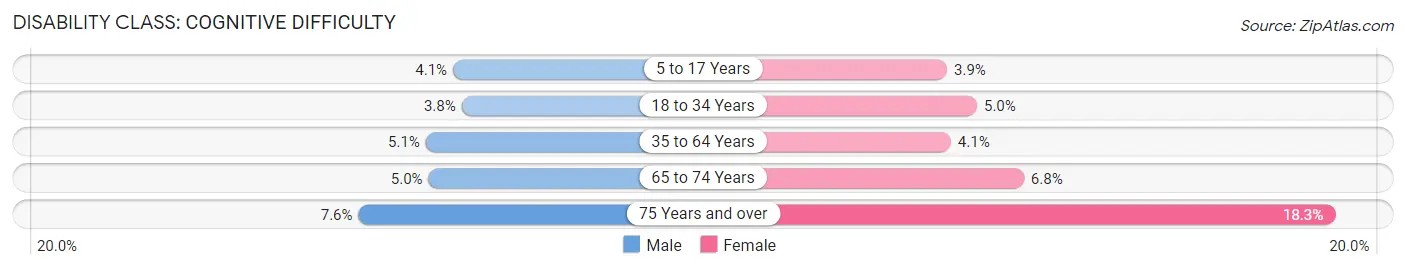
| Age Bracket | Male | Female |
| 5 to 17 Years | 219 (4.1%) | 203 (3.9%) |
| 18 to 34 Years | 259 (3.8%) | 359 (5.0%) |
| 35 to 64 Years | 574 (5.1%) | 455 (4.1%) |
| 65 to 74 Years | 163 (5.0%) | 236 (6.8%) |
| 75 Years and over | 141 (7.6%) | 480 (18.3%) |
Disability Class: Ambulatory Difficulty

| Age Bracket | Male | Female |
| 5 to 17 Years | 23 (0.4%) | 25 (0.5%) |
| 18 to 34 Years | 19 (0.3%) | 62 (0.9%) |
| 35 to 64 Years | 893 (8.0%) | 821 (7.3%) |
| 65 to 74 Years | 276 (8.5%) | 516 (14.8%) |
| 75 Years and over | 408 (22.0%) | 1,040 (39.7%) |
Disability Class: Self-Care Difficulty
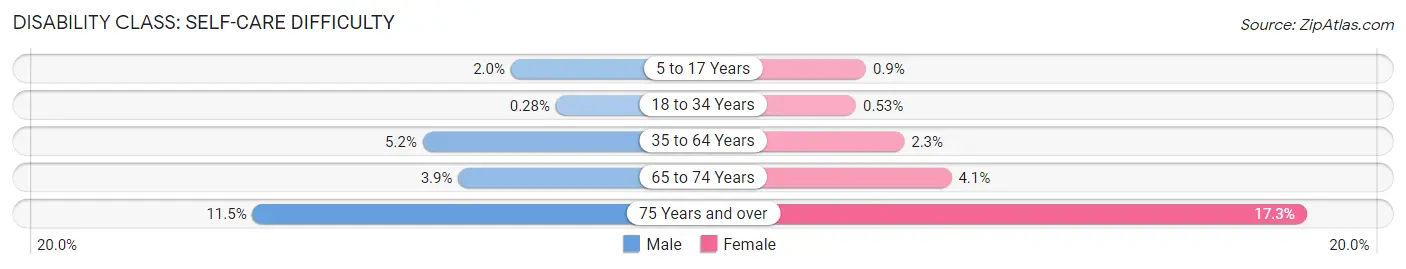
| Age Bracket | Male | Female |
| 5 to 17 Years | 104 (1.9%) | 47 (0.9%) |
| 18 to 34 Years | 19 (0.3%) | 38 (0.5%) |
| 35 to 64 Years | 586 (5.2%) | 260 (2.3%) |
| 65 to 74 Years | 127 (3.9%) | 142 (4.1%) |
| 75 Years and over | 214 (11.5%) | 452 (17.2%) |
Technology Access in Knox County
Computing Device Access in Knox County

| Device Type | # Households | % Households |
| Desktop or Laptop | 17,476 | 75.6% |
| Smartphone | 19,452 | 84.2% |
| Tablet | 14,751 | 63.8% |
| No Computing Device | 1,897 | 8.2% |
| Total | 23,117 | 100.0% |
Internet Access in Knox County
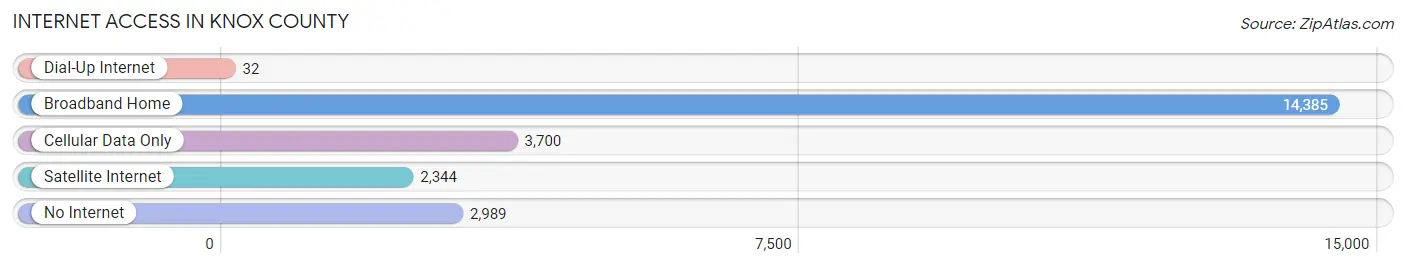
| Internet Type | # Households | % Households |
| Dial-Up Internet | 32 | 0.1% |
| Broadband Home | 14,385 | 62.2% |
| Cellular Data Only | 3,700 | 16.0% |
| Satellite Internet | 2,344 | 10.1% |
| No Internet | 2,989 | 12.9% |
| Total | 23,117 | 100.0% |
Knox County Summary
Knox County, Ohio is located in the Appalachian region of the state and is part of the Appalachian Plateau. It is bordered by Coshocton County to the north, Licking County to the east, Muskingum County to the south, and Holmes County to the west. The county seat is Mount Vernon, and the county is named after Henry Knox, the first Secretary of War under President George Washington.
Geography
Knox County is located in the Appalachian region of Ohio and is part of the Appalachian Plateau. The county is mostly rural, with rolling hills and valleys. The terrain is mostly flat, with some areas of higher elevation in the northern and western parts of the county. The highest point in the county is located in the western part of the county, at an elevation of 1,092 feet. The county is drained by the Kokosing River, which flows through the county from north to south.
The county is home to several state parks, including Mohican State Park, which is located in the northern part of the county. The park is home to a variety of wildlife, including deer, wild turkey, and a variety of birds. The park also features a variety of recreational activities, including camping, fishing, and hiking.
Climate
Knox County has a humid continental climate, with hot summers and cold winters. The average annual temperature is around 50 degrees Fahrenheit, with average highs in the summer reaching around 80 degrees and average lows in the winter reaching around 20 degrees. The average annual precipitation is around 40 inches, with most of the precipitation falling in the spring and summer months.
Demographics
As of the 2010 census, the population of Knox County was 60,921, an increase of 4.3% since 2000. The population is spread out, with the largest city being Mount Vernon, which has a population of 16,990. The racial makeup of the county is 94.3% White, 2.7% African American, 0.3% Native American, 0.5% Asian, 0.1% Pacific Islander, 0.7% from other races, and 1.4% from two or more races. Hispanic or Latino of any race were 2.2% of the population.
Economy
Knox County is home to a variety of industries, including manufacturing, agriculture, and tourism. The county is home to several large manufacturing companies, including the Mount Vernon-based company, The Timken Company, which produces bearings and other industrial products. The county is also home to several agricultural operations, including dairy farms, beef farms, and poultry farms.
Tourism is also an important part of the economy in Knox County. The county is home to several state parks, including Mohican State Park, which is a popular destination for camping, fishing, and hiking. The county is also home to several historic sites, including the Knox County Historical Society Museum, which is located in Mount Vernon.
Conclusion
Knox County, Ohio is a rural county located in the Appalachian region of the state. The county is home to a variety of industries, including manufacturing, agriculture, and tourism. The county is also home to several state parks and historic sites, making it a popular destination for outdoor recreation and history buffs alike. The population of the county is around 60,921, and the racial makeup is mostly White. The economy of the county is largely driven by manufacturing, agriculture, and tourism.
Common Questions
What is the Total Population of Knox County?
Total Population of Knox County is 62,657.
What is the Total Male Population of Knox County?
Total Male Population of Knox County is 30,874.
What is the Total Female Population of Knox County?
Total Female Population of Knox County is 31,783.
What is the Ratio of Males per 100 Females in Knox County?
There are 97.14 Males per 100 Females in Knox County.
What is the Ratio of Females per 100 Males in Knox County?
There are 102.94 Females per 100 Males in Knox County.
What is the Median Population Age in Knox County?
Median Population Age in Knox County is 39.4 Years.
What is the Average Family Size in Knox County
Average Family Size in Knox County is 3.1 People.
What is the Average Household Size in Knox County
Average Household Size in Knox County is 2.6 People.
What is Per Capita Income in Knox County?
Per Capita income in Knox County is $32,543.
What is the Median Family Income in Knox County?
Median Family Income in Knox County is $82,526.
What is the Median Household income in Knox County?
Median Household Income in Knox County is $71,246.
What is Income or Wage Gap in Knox County?
Income or Wage Gap in Knox County is 41.7%.
Women in Knox County earn 58.3 cents for every dollar earned by a man.
What is Family Income Deficit in Knox County?
Family Income Deficit in Knox County is $10,222.
Families that are below poverty line in Knox County earn $10,222 less on average than the poverty threshold level.
What is Inequality or Gini Index in Knox County?
Inequality or Gini Index in Knox County is 0.41.
How Large is the Labor Force in Knox County?
There are 29,986 People in the Labor Forcein in Knox County.
What is the Percentage of People in the Labor Force in Knox County?
60.0% of People are in the Labor Force in Knox County.
What is the Unemployment Rate in Knox County?
Unemployment Rate in Knox County is 3.3%.