Hocking County, OH
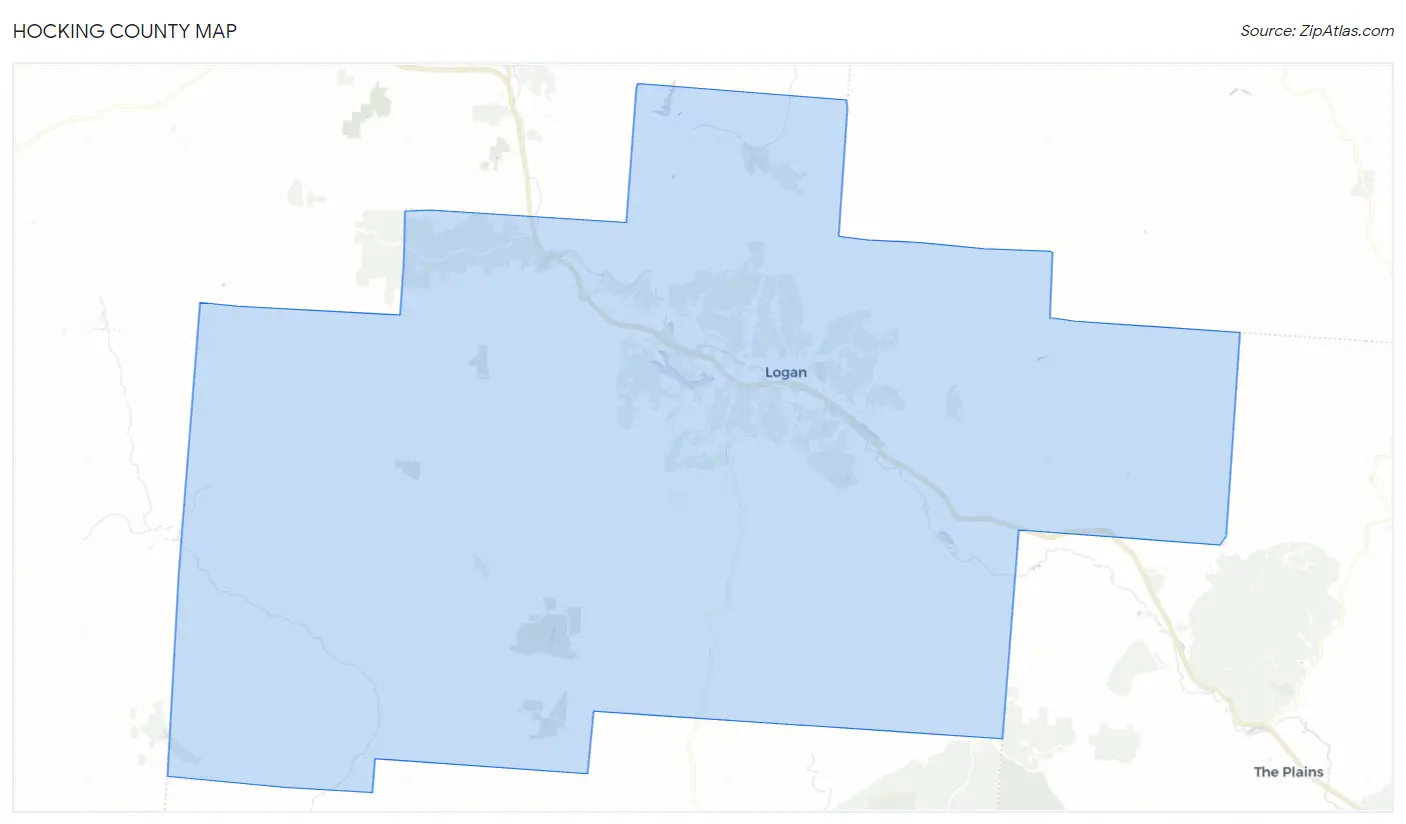
Hocking County Map
Hocking County Overview
28,104
TOTAL POPULATION
14,191
MALE POPULATION
13,913
FEMALE POPULATION
102.00
MALES / 100 FEMALES
98.04
FEMALES / 100 MALES
42.6
MEDIAN AGE
2.8
AVG FAMILY SIZE
2.5
AVG HOUSEHOLD SIZE
$29,490
PER CAPITA INCOME
$72,950
AVG FAMILY INCOME
$59,007
AVG HOUSEHOLD INCOME
31.7%
WAGE / INCOME GAP [ % ]
68.3¢/ $1
WAGE / INCOME GAP [ $ ]
$12,347
FAMILY INCOME DEFICIT
0.41
INEQUALITY / GINI INDEX
13,331
LABOR FORCE [ PEOPLE ]
58.7%
PERCENT IN LABOR FORCE
4.7%
UNEMPLOYMENT RATE
Hocking County Area Codes
Race in Hocking County
The most populous races in Hocking County are White / Caucasian (26,672 | 94.9%), Two or more Races (781 | 2.8%), and Some other Race (403 | 1.4%).
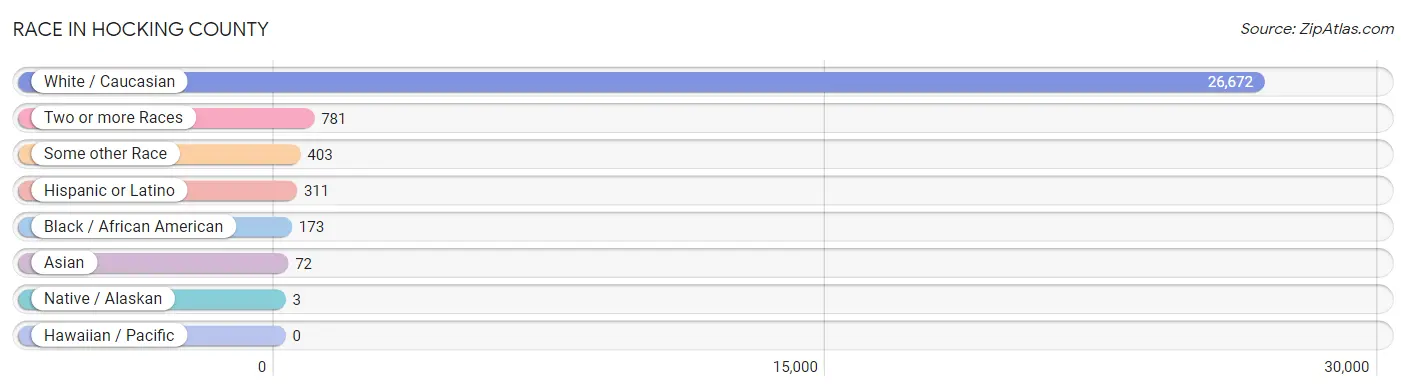
| Race | # Population | % Population |
| Asian | 72 | 0.3% |
| Black / African American | 173 | 0.6% |
| Hawaiian / Pacific | 0 | 0.0% |
| Hispanic or Latino | 311 | 1.1% |
| Native / Alaskan | 3 | 0.0% |
| White / Caucasian | 26,672 | 94.9% |
| Two or more Races | 781 | 2.8% |
| Some other Race | 403 | 1.4% |
| Total | 28,104 | 100.0% |
Ancestry in Hocking County
The most populous ancestries reported in Hocking County are German (5,974 | 21.3%), Irish (3,600 | 12.8%), American (2,925 | 10.4%), English (2,878 | 10.2%), and Italian (737 | 2.6%), together accounting for 57.3% of all Hocking County residents.

| Ancestry | # Population | % Population |
| African | 19 | 0.1% |
| American | 2,925 | 10.4% |
| Apache | 7 | 0.0% |
| Arab | 21 | 0.1% |
| Austrian | 15 | 0.1% |
| Bhutanese | 31 | 0.1% |
| Blackfeet | 38 | 0.1% |
| British | 131 | 0.5% |
| Burmese | 42 | 0.2% |
| Cambodian | 35 | 0.1% |
| Canadian | 5 | 0.0% |
| Central American | 24 | 0.1% |
| Cherokee | 55 | 0.2% |
| Czech | 23 | 0.1% |
| Czechoslovakian | 6 | 0.0% |
| Danish | 7 | 0.0% |
| Dutch | 400 | 1.4% |
| Eastern European | 49 | 0.2% |
| English | 2,878 | 10.2% |
| European | 472 | 1.7% |
| Finnish | 24 | 0.1% |
| French | 318 | 1.1% |
| French Canadian | 10 | 0.0% |
| German | 5,974 | 21.3% |
| German Russian | 11 | 0.0% |
| Greek | 54 | 0.2% |
| Guatemalan | 24 | 0.1% |
| Haitian | 17 | 0.1% |
| Hungarian | 95 | 0.3% |
| Irish | 3,600 | 12.8% |
| Italian | 737 | 2.6% |
| Laotian | 46 | 0.2% |
| Lebanese | 21 | 0.1% |
| Lithuanian | 10 | 0.0% |
| Mexican | 161 | 0.6% |
| Mexican American Indian | 8 | 0.0% |
| Northern European | 14 | 0.1% |
| Norwegian | 104 | 0.4% |
| Pennsylvania German | 25 | 0.1% |
| Polish | 320 | 1.1% |
| Romanian | 38 | 0.1% |
| Russian | 53 | 0.2% |
| Scandinavian | 59 | 0.2% |
| Scotch-Irish | 147 | 0.5% |
| Scottish | 619 | 2.2% |
| Sioux | 2 | 0.0% |
| Slovak | 10 | 0.0% |
| Subsaharan African | 19 | 0.1% |
| Swedish | 22 | 0.1% |
| Swiss | 78 | 0.3% |
| Thai | 8 | 0.0% |
| Ukrainian | 6 | 0.0% |
| Welsh | 246 | 0.9% | View All 53 Rows |
Immigrants in Hocking County
The most numerous immigrant groups reported in Hocking County came from Europe (92 | 0.3%), Asia (76 | 0.3%), Eastern Asia (59 | 0.2%), England (41 | 0.2%), and Northern Europe (41 | 0.2%), together accounting for 1.1% of all Hocking County residents.

| Immigration Origin | # Population | % Population |
| Asia | 76 | 0.3% |
| Central America | 24 | 0.1% |
| Eastern Asia | 59 | 0.2% |
| Eastern Europe | 22 | 0.1% |
| England | 41 | 0.2% |
| Europe | 92 | 0.3% |
| France | 11 | 0.0% |
| Guatemala | 24 | 0.1% |
| India | 17 | 0.1% |
| Italy | 8 | 0.0% |
| Korea | 37 | 0.1% |
| Latin America | 24 | 0.1% |
| Netherlands | 10 | 0.0% |
| Northern Europe | 41 | 0.2% |
| Romania | 22 | 0.1% |
| South Central Asia | 17 | 0.1% |
| Southern Europe | 8 | 0.0% |
| Western Europe | 21 | 0.1% | View All 18 Rows |
Sex and Age in Hocking County
Sex and Age in Hocking County
The most populous age groups in Hocking County are 10 to 14 Years (1,158 | 8.2%) for men and 55 to 59 Years (1,185 | 8.5%) for women.
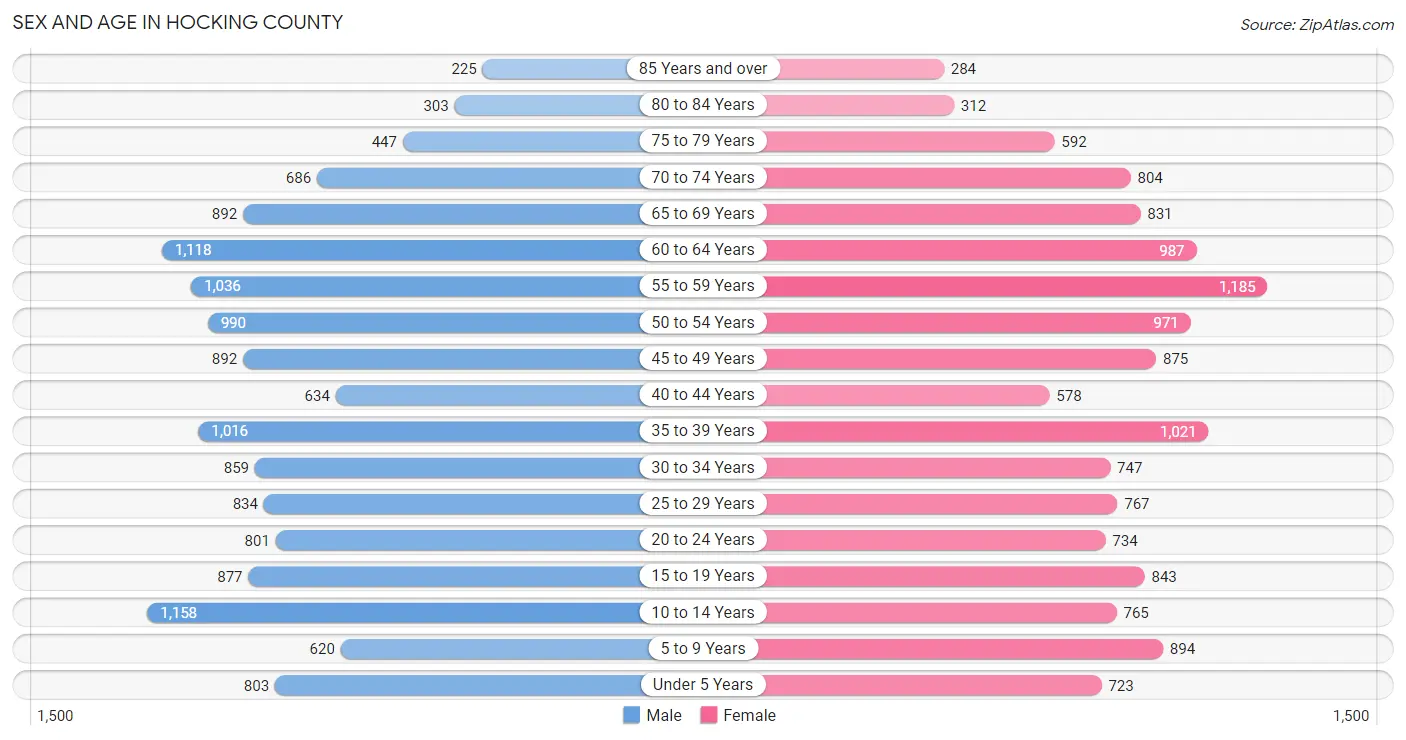
| Age Bracket | Male | Female |
| Under 5 Years | 803 (5.7%) | 723 (5.2%) |
| 5 to 9 Years | 620 (4.4%) | 894 (6.4%) |
| 10 to 14 Years | 1,158 (8.2%) | 765 (5.5%) |
| 15 to 19 Years | 877 (6.2%) | 843 (6.1%) |
| 20 to 24 Years | 801 (5.6%) | 734 (5.3%) |
| 25 to 29 Years | 834 (5.9%) | 767 (5.5%) |
| 30 to 34 Years | 859 (6.0%) | 747 (5.4%) |
| 35 to 39 Years | 1,016 (7.2%) | 1,021 (7.3%) |
| 40 to 44 Years | 634 (4.5%) | 578 (4.2%) |
| 45 to 49 Years | 892 (6.3%) | 875 (6.3%) |
| 50 to 54 Years | 990 (7.0%) | 971 (7.0%) |
| 55 to 59 Years | 1,036 (7.3%) | 1,185 (8.5%) |
| 60 to 64 Years | 1,118 (7.9%) | 987 (7.1%) |
| 65 to 69 Years | 892 (6.3%) | 831 (6.0%) |
| 70 to 74 Years | 686 (4.8%) | 804 (5.8%) |
| 75 to 79 Years | 447 (3.2%) | 592 (4.3%) |
| 80 to 84 Years | 303 (2.1%) | 312 (2.2%) |
| 85 Years and over | 225 (1.6%) | 284 (2.0%) |
| Total | 14,191 (100.0%) | 13,913 (100.0%) |
Families and Households in Hocking County
Median Family Size in Hocking County
The median family size in Hocking County is 2.79 persons per family, with single female/mother families (1,326 | 16.2%) accounting for the largest median family size of 2.83 persons per family. On the other hand, single male/father families (983 | 12.0%) represent the smallest median family size with 2.59 persons per family.

| Family Type | # Families | Family Size |
| Married-Couple | 5,885 (71.8%) | 2.81 |
| Single Male/Father | 983 (12.0%) | 2.59 |
| Single Female/Mother | 1,326 (16.2%) | 2.83 |
| Total Families | 8,194 (100.0%) | 2.79 |
Median Household Size in Hocking County
The median household size in Hocking County is 2.46 persons per household, with single female/mother households (1,326 | 11.8%) accounting for the largest median household size of 3.17 persons per household. non-family households (3,085 | 27.4%) represent the smallest median household size with 1.25 persons per household.
| Household Type | # Households | Household Size |
| Married-Couple | 5,885 (52.2%) | 2.84 |
| Single Male/Father | 983 (8.7%) | 3.08 |
| Single Female/Mother | 1,326 (11.8%) | 3.17 |
| Non-family | 3,085 (27.4%) | 1.25 |
| Total Households | 11,279 (100.0%) | 2.46 |
Household Size by Marriage Status in Hocking County
Out of a total of 11,279 households in Hocking County, 8,194 (72.7%) are family households, while 3,085 (27.4%) are nonfamily households. The most numerous type of family households are 2-person households, comprising 4,069, and the most common type of nonfamily households are 1-person households, comprising 2,503.
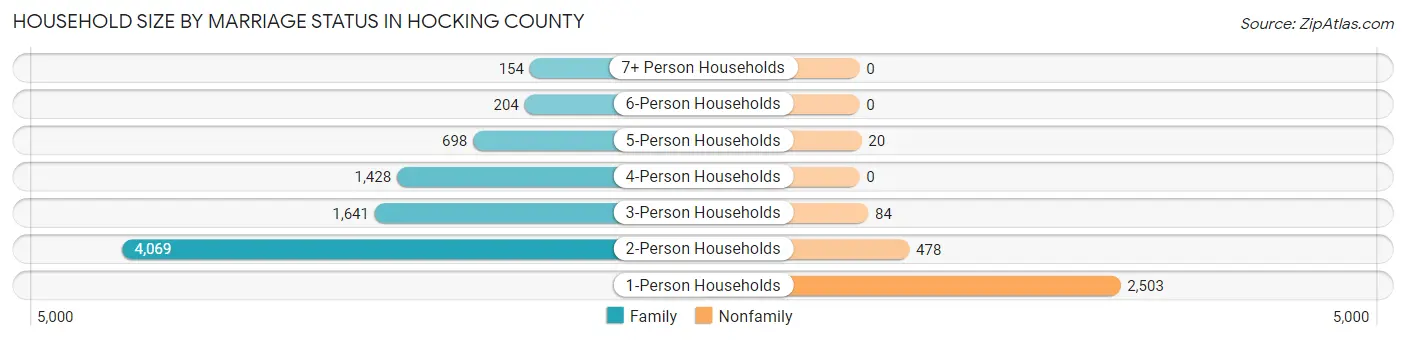
| Household Size | Family Households | Nonfamily Households |
| 1-Person Households | - | 2,503 (22.2%) |
| 2-Person Households | 4,069 (36.1%) | 478 (4.2%) |
| 3-Person Households | 1,641 (14.5%) | 84 (0.7%) |
| 4-Person Households | 1,428 (12.7%) | 0 (0.0%) |
| 5-Person Households | 698 (6.2%) | 20 (0.2%) |
| 6-Person Households | 204 (1.8%) | 0 (0.0%) |
| 7+ Person Households | 154 (1.4%) | 0 (0.0%) |
| Total | 8,194 (72.7%) | 3,085 (27.4%) |
Female Fertility in Hocking County
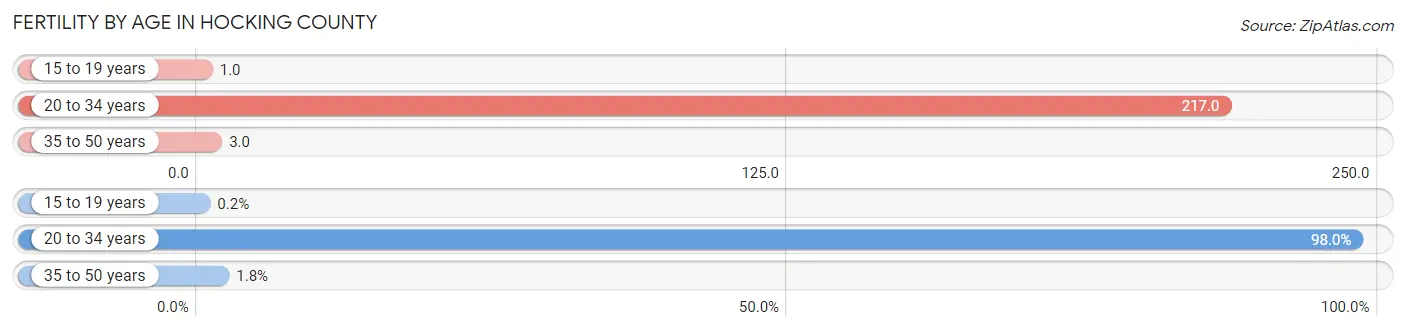
Fertility by Age in Hocking County
Average fertility rate in Hocking County is 87.0 births per 1,000 women. Women in the age bracket of 20 to 34 years have the highest fertility rate with 217.0 births per 1,000 women. Women in the age bracket of 20 to 34 years acount for 98.0% of all women with births.
| Age Bracket | Women with Births | Births / 1,000 Women |
| 15 to 19 years | 1 (0.2%) | 1.0 |
| 20 to 34 years | 487 (98.0%) | 217.0 |
| 35 to 50 years | 9 (1.8%) | 3.0 |
| Total | 497 (100.0%) | 87.0 |
Fertility by Age by Marriage Status in Hocking County
61.2% of women with births (497) in Hocking County are married. The highest percentage of unmarried women with births falls into 15 to 19 years age bracket with 100.0% of them unmarried at the time of birth, while the lowest percentage of unmarried women with births belong to 20 to 34 years age bracket with 37.6% of them unmarried.

| Age Bracket | Married | Unmarried |
| 15 to 19 years | 0 (0.0%) | 1 (100.0%) |
| 20 to 34 years | 304 (62.4%) | 183 (37.6%) |
| 35 to 50 years | 0 (0.0%) | 9 (100.0%) |
| Total | 304 (61.2%) | 193 (38.8%) |
Fertility by Education in Hocking County
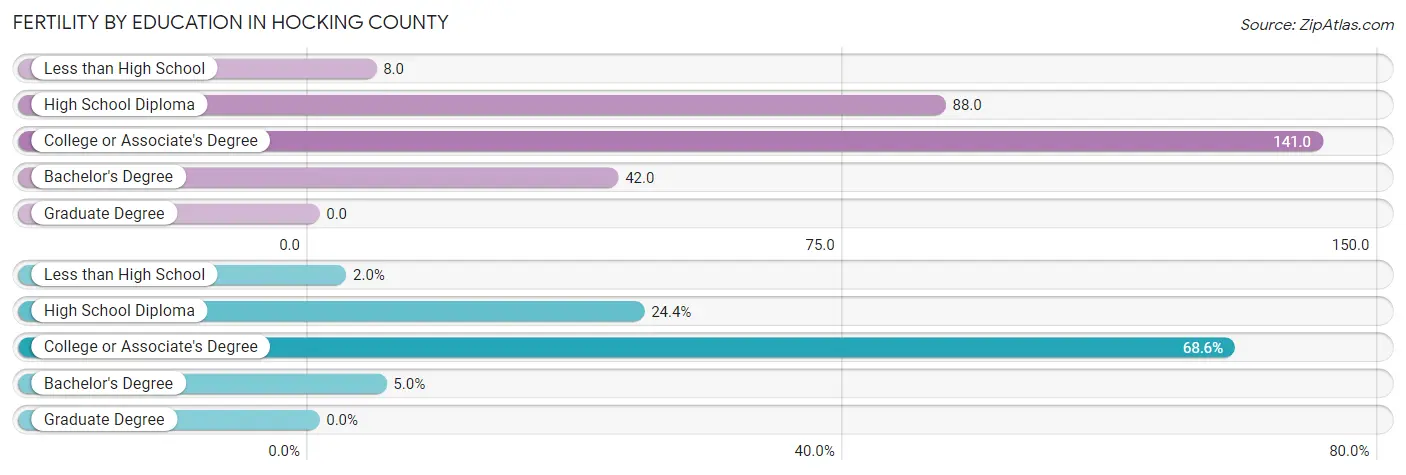
| Educational Attainment | Women with Births | Births / 1,000 Women |
| Less than High School | 10 (2.0%) | 8.0 |
| High School Diploma | 121 (24.3%) | 88.0 |
| College or Associate's Degree | 341 (68.6%) | 141.0 |
| Bachelor's Degree | 25 (5.0%) | 42.0 |
| Graduate Degree | 0 (0.0%) | 0.0 |
| Total | 497 (100.0%) | 87.0 |
Fertility by Education by Marriage Status in Hocking County
38.8% of women with births in Hocking County are unmarried. Women with the educational attainment of less than high school are most likely to be married with 100.0% of them married at childbirth, while women with the educational attainment of high school diploma are least likely to be married with 71.9% of them unmarried at childbirth.

| Educational Attainment | Married | Unmarried |
| Less than High School | 10 (100.0%) | 0 (0.0%) |
| High School Diploma | 34 (28.1%) | 87 (71.9%) |
| College or Associate's Degree | 252 (73.9%) | 89 (26.1%) |
| Bachelor's Degree | 8 (32.0%) | 17 (68.0%) |
| Graduate Degree | 0 (0.0%) | 0 (0.0%) |
| Total | 304 (61.2%) | 193 (38.8%) |
Income in Hocking County
Income Overview in Hocking County
Per Capita Income in Hocking County is $29,490, while median incomes of families and households are $72,950 and $59,007 respectively.
| Characteristic | Number | Measure |
| Per Capita Income | 28,104 | $29,490 |
| Median Family Income | 8,194 | $72,950 |
| Mean Family Income | 8,194 | $80,633 |
| Median Household Income | 11,279 | $59,007 |
| Mean Household Income | 11,279 | $72,764 |
| Income Deficit | 8,194 | $12,347 |
| Wage / Income Gap (%) | 28,104 | 31.67% |
| Wage / Income Gap ($) | 28,104 | 68.33¢ per $1 |
| Gini / Inequality Index | 28,104 | 0.41 |
Earnings by Sex in Hocking County
Average Earnings in Hocking County are $34,947, $43,825 for men and $29,944 for women, a difference of 31.7%.
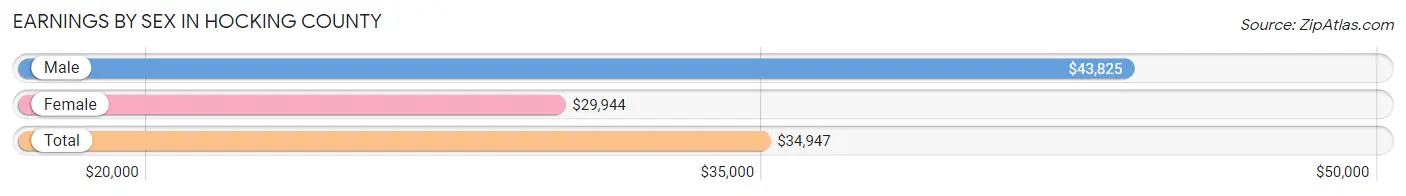
| Sex | Number | Average Earnings |
| Male | 7,429 (54.2%) | $43,825 |
| Female | 6,266 (45.8%) | $29,944 |
| Total | 13,695 (100.0%) | $34,947 |
Earnings by Sex by Income Bracket in Hocking County
The most common earnings brackets in Hocking County are $75,000 to $99,999 for men (995 | 13.4%) and $30,000 to $34,999 for women (713 | 11.4%).
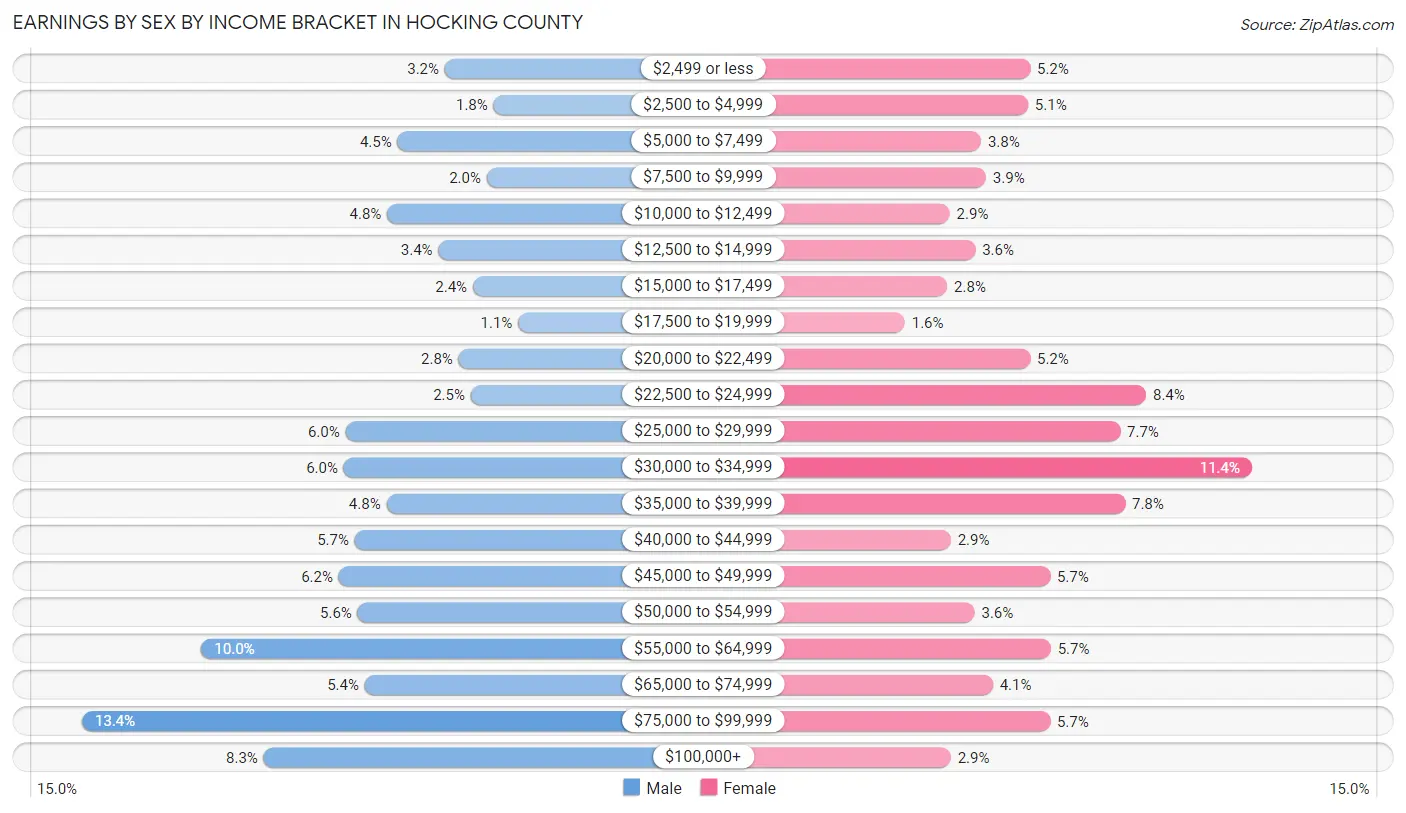
| Income | Male | Female |
| $2,499 or less | 237 (3.2%) | 323 (5.1%) |
| $2,500 to $4,999 | 135 (1.8%) | 319 (5.1%) |
| $5,000 to $7,499 | 336 (4.5%) | 236 (3.8%) |
| $7,500 to $9,999 | 149 (2.0%) | 245 (3.9%) |
| $10,000 to $12,499 | 357 (4.8%) | 181 (2.9%) |
| $12,500 to $14,999 | 250 (3.4%) | 226 (3.6%) |
| $15,000 to $17,499 | 178 (2.4%) | 177 (2.8%) |
| $17,500 to $19,999 | 84 (1.1%) | 102 (1.6%) |
| $20,000 to $22,499 | 208 (2.8%) | 323 (5.1%) |
| $22,500 to $24,999 | 183 (2.5%) | 527 (8.4%) |
| $25,000 to $29,999 | 444 (6.0%) | 481 (7.7%) |
| $30,000 to $34,999 | 448 (6.0%) | 713 (11.4%) |
| $35,000 to $39,999 | 359 (4.8%) | 490 (7.8%) |
| $40,000 to $44,999 | 425 (5.7%) | 183 (2.9%) |
| $45,000 to $49,999 | 458 (6.2%) | 358 (5.7%) |
| $50,000 to $54,999 | 419 (5.6%) | 225 (3.6%) |
| $55,000 to $64,999 | 745 (10.0%) | 359 (5.7%) |
| $65,000 to $74,999 | 404 (5.4%) | 257 (4.1%) |
| $75,000 to $99,999 | 995 (13.4%) | 358 (5.7%) |
| $100,000+ | 615 (8.3%) | 183 (2.9%) |
| Total | 7,429 (100.0%) | 6,266 (100.0%) |
Earnings by Sex by Educational Attainment in Hocking County
Average earnings in Hocking County are $49,741 for men and $32,861 for women, a difference of 33.9%. Men with an educational attainment of graduate degree enjoy the highest average annual earnings of $128,958, while those with less than high school education earn the least with $38,929. Women with an educational attainment of graduate degree earn the most with the average annual earnings of $63,350, while those with less than high school education have the smallest earnings of $25,556.
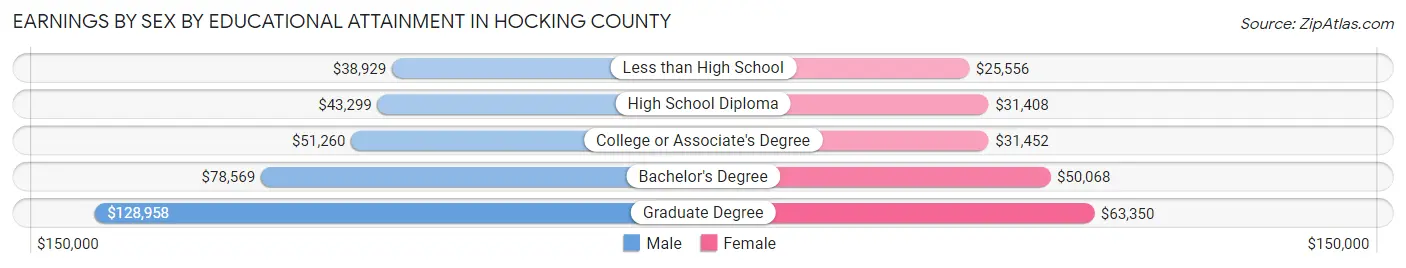
| Educational Attainment | Male Income | Female Income |
| Less than High School | $38,929 | $25,556 |
| High School Diploma | $43,299 | $31,408 |
| College or Associate's Degree | $51,260 | $31,452 |
| Bachelor's Degree | $78,569 | $50,068 |
| Graduate Degree | $128,958 | $63,350 |
| Total | $49,741 | $32,861 |
Family Income in Hocking County
Family Income Brackets in Hocking County
According to the Hocking County family income data, there are 1,819 families falling into the $100,000 to $149,999 income range, which is the most common income bracket and makes up 22.2% of all families. Conversely, the $10,000 to $14,999 income bracket is the least frequent group with only 147 families (1.8%) belonging to this category.
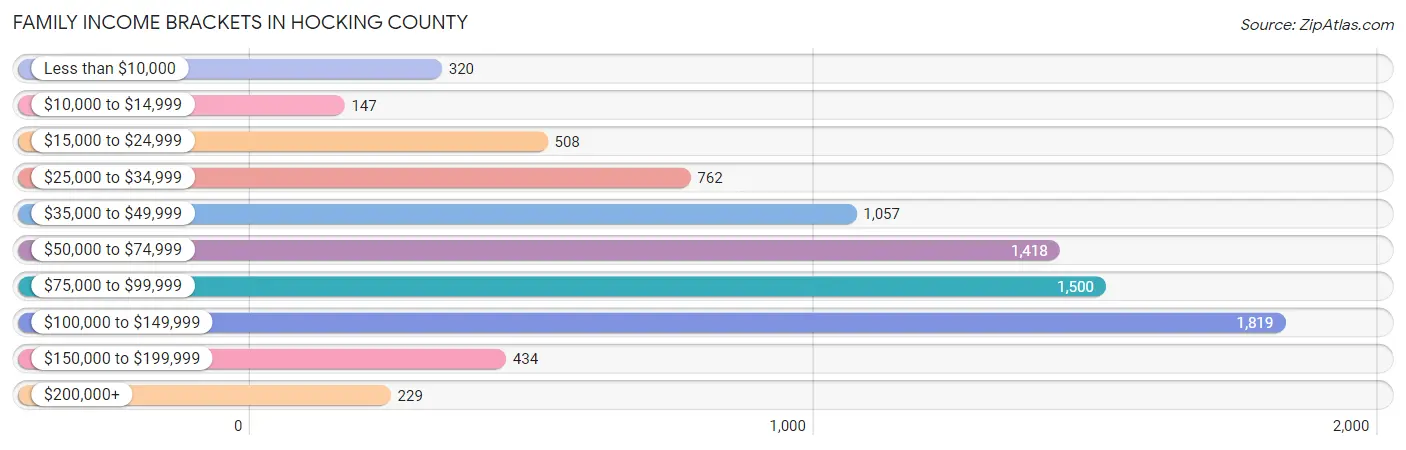
| Income Bracket | # Families | % Families |
| Less than $10,000 | 320 | 3.9% |
| $10,000 to $14,999 | 147 | 1.8% |
| $15,000 to $24,999 | 508 | 6.2% |
| $25,000 to $34,999 | 762 | 9.3% |
| $35,000 to $49,999 | 1,057 | 12.9% |
| $50,000 to $74,999 | 1,418 | 17.3% |
| $75,000 to $99,999 | 1,500 | 18.3% |
| $100,000 to $149,999 | 1,819 | 22.2% |
| $150,000 to $199,999 | 434 | 5.3% |
| $200,000+ | 229 | 2.8% |
Family Income by Famaliy Size in Hocking County
5-person families (642 | 7.8%) account for the highest median family income in Hocking County with $99,091 per family, while 2-person families (4,426 | 54.0%) have the highest median income of $30,826 per family member.

| Income Bracket | # Families | Median Income |
| 2-Person Families | 4,426 (54.0%) | $61,652 |
| 3-Person Families | 1,551 (18.9%) | $75,923 |
| 4-Person Families | 1,315 (16.1%) | $77,606 |
| 5-Person Families | 642 (7.8%) | $99,091 |
| 6-Person Families | 203 (2.5%) | $0 |
| 7+ Person Families | 57 (0.7%) | $0 |
| Total | 8,194 (100.0%) | $72,950 |
Family Income by Number of Earners in Hocking County
The median family income in Hocking County is $72,950, with families comprising 3+ earners (794) having the highest median family income of $120,038, while families with no earners (1,718) have the lowest median family income of $36,662, accounting for 9.7% and 21.0% of families, respectively.
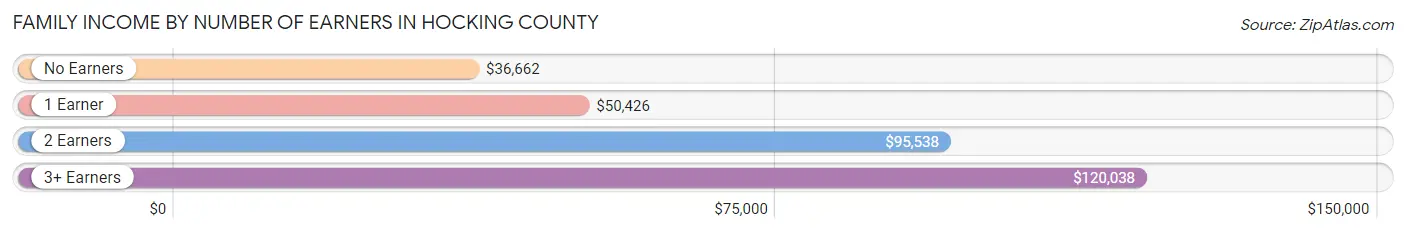
| Number of Earners | # Families | Median Income |
| No Earners | 1,718 (21.0%) | $36,662 |
| 1 Earner | 2,486 (30.3%) | $50,426 |
| 2 Earners | 3,196 (39.0%) | $95,538 |
| 3+ Earners | 794 (9.7%) | $120,038 |
| Total | 8,194 (100.0%) | $72,950 |
Household Income in Hocking County
Household Income Brackets in Hocking County
With 2,143 households falling in the category, the $100,000 to $149,999 income range is the most frequent in Hocking County, accounting for 19.0% of all households. In contrast, only 327 households (2.9%) fall into the $200,000+ income bracket, making it the least populous group.
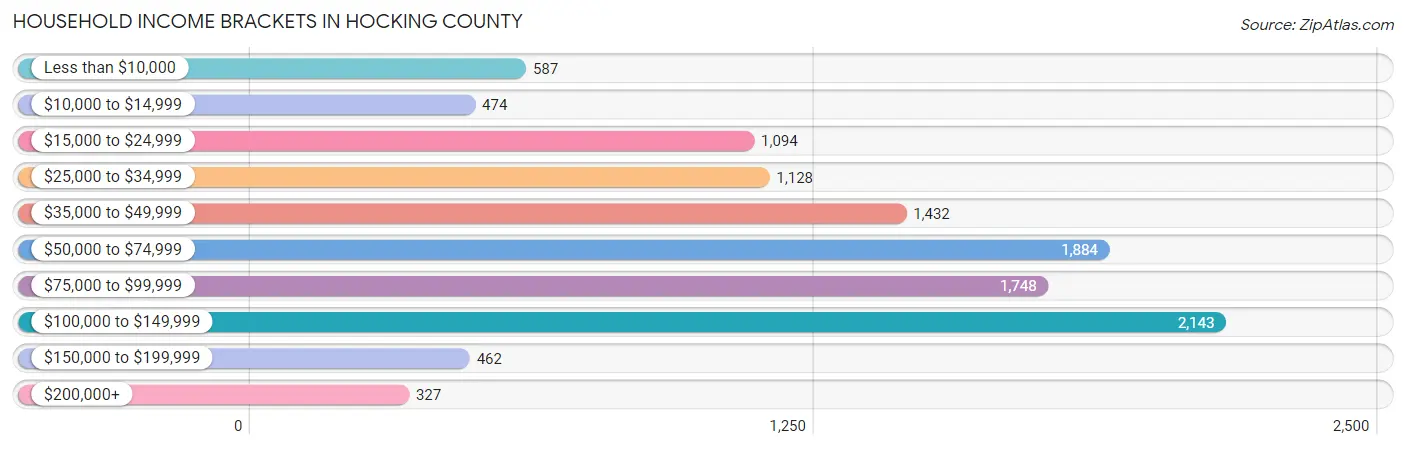
| Income Bracket | # Households | % Households |
| Less than $10,000 | 587 | 5.2% |
| $10,000 to $14,999 | 474 | 4.2% |
| $15,000 to $24,999 | 1,094 | 9.7% |
| $25,000 to $34,999 | 1,128 | 10.0% |
| $35,000 to $49,999 | 1,432 | 12.7% |
| $50,000 to $74,999 | 1,884 | 16.7% |
| $75,000 to $99,999 | 1,748 | 15.5% |
| $100,000 to $149,999 | 2,143 | 19.0% |
| $150,000 to $199,999 | 462 | 4.1% |
| $200,000+ | 327 | 2.9% |
Household Income by Householder Age in Hocking County
The median household income in Hocking County is $59,007, with the highest median household income of $76,348 found in the 45 to 64 years age bracket for the primary householder. A total of 4,345 households (38.5%) fall into this category. Meanwhile, the 15 to 24 years age bracket for the primary householder has the lowest median household income of $42,773, with 435 households (3.9%) in this group.
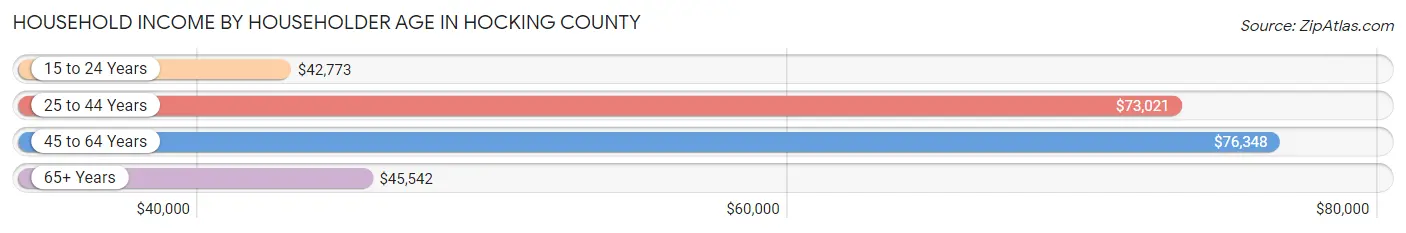
| Income Bracket | # Households | Median Income |
| 15 to 24 Years | 435 (3.9%) | $42,773 |
| 25 to 44 Years | 3,030 (26.9%) | $73,021 |
| 45 to 64 Years | 4,345 (38.5%) | $76,348 |
| 65+ Years | 3,469 (30.8%) | $45,542 |
| Total | 11,279 (100.0%) | $59,007 |
Poverty in Hocking County
Income Below Poverty by Sex and Age in Hocking County
With 16.0% poverty level for males and 17.2% for females among the residents of Hocking County, 6 to 11 year old males and 6 to 11 year old females are the most vulnerable to poverty, with 292 males (30.3%) and 341 females (39.0%) in their respective age groups living below the poverty level.
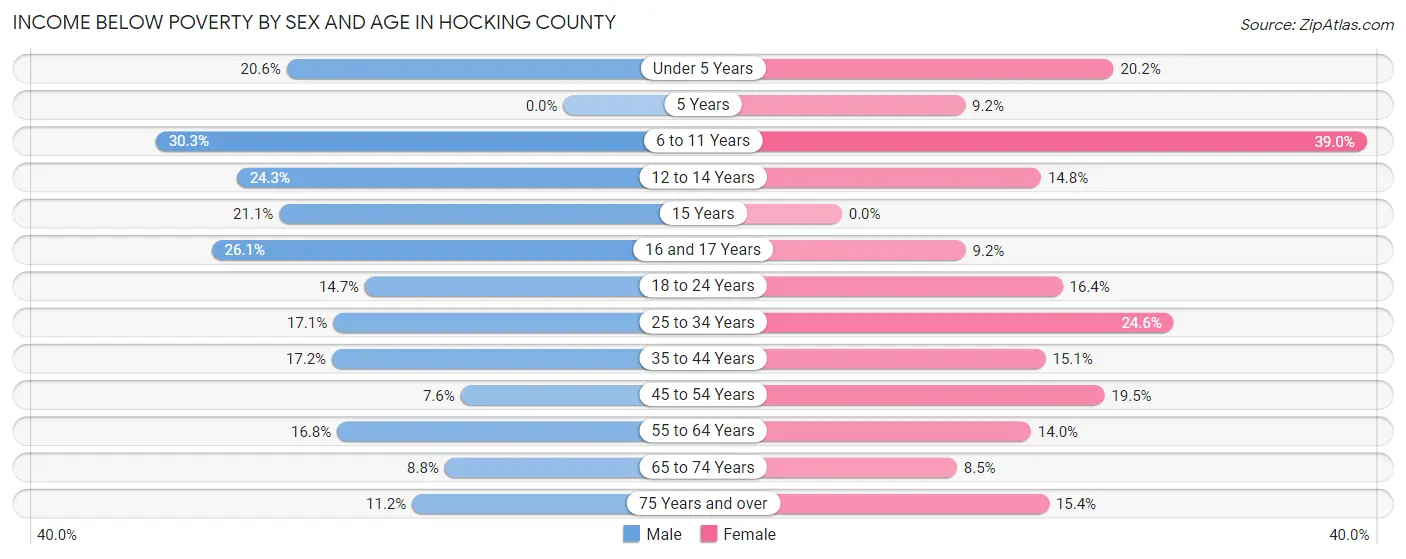
| Age Bracket | Male | Female |
| Under 5 Years | 165 (20.5%) | 141 (20.2%) |
| 5 Years | 0 (0.0%) | 24 (9.2%) |
| 6 to 11 Years | 292 (30.3%) | 341 (39.0%) |
| 12 to 14 Years | 179 (24.2%) | 67 (14.8%) |
| 15 Years | 50 (21.1%) | 0 (0.0%) |
| 16 and 17 Years | 82 (26.1%) | 34 (9.2%) |
| 18 to 24 Years | 166 (14.7%) | 166 (16.4%) |
| 25 to 34 Years | 278 (17.1%) | 373 (24.6%) |
| 35 to 44 Years | 279 (17.2%) | 242 (15.1%) |
| 45 to 54 Years | 143 (7.6%) | 360 (19.5%) |
| 55 to 64 Years | 358 (16.8%) | 305 (14.0%) |
| 65 to 74 Years | 137 (8.8%) | 139 (8.5%) |
| 75 Years and over | 105 (11.2%) | 172 (15.4%) |
| Total | 2,234 (16.0%) | 2,364 (17.2%) |
Income Above Poverty by Sex and Age in Hocking County
According to the poverty statistics in Hocking County, males aged 5 years and females aged 15 years are the age groups that are most secure financially, with 100.0% of males and 100.0% of females in these age groups living above the poverty line.
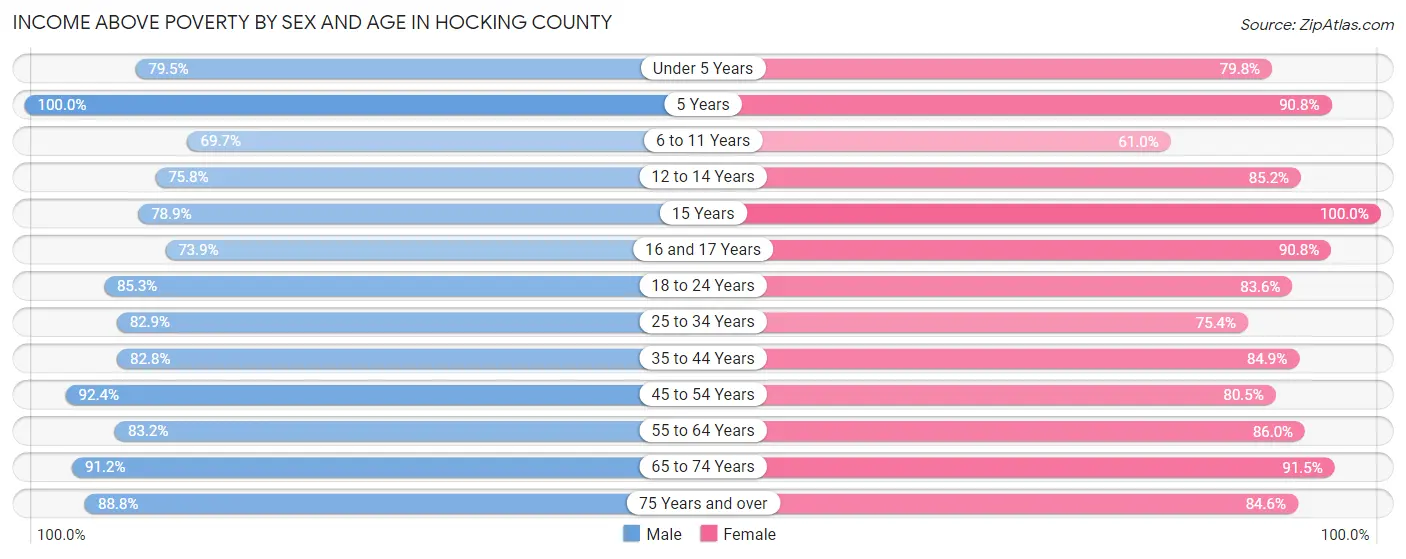
| Age Bracket | Male | Female |
| Under 5 Years | 638 (79.4%) | 558 (79.8%) |
| 5 Years | 27 (100.0%) | 238 (90.8%) |
| 6 to 11 Years | 673 (69.7%) | 534 (61.0%) |
| 12 to 14 Years | 559 (75.7%) | 386 (85.2%) |
| 15 Years | 187 (78.9%) | 194 (100.0%) |
| 16 and 17 Years | 232 (73.9%) | 336 (90.8%) |
| 18 to 24 Years | 961 (85.3%) | 847 (83.6%) |
| 25 to 34 Years | 1,348 (82.9%) | 1,141 (75.4%) |
| 35 to 44 Years | 1,345 (82.8%) | 1,357 (84.9%) |
| 45 to 54 Years | 1,731 (92.4%) | 1,486 (80.5%) |
| 55 to 64 Years | 1,773 (83.2%) | 1,867 (86.0%) |
| 65 to 74 Years | 1,418 (91.2%) | 1,489 (91.5%) |
| 75 Years and over | 830 (88.8%) | 946 (84.6%) |
| Total | 11,722 (84.0%) | 11,379 (82.8%) |
Income Below Poverty Among Married-Couple Families in Hocking County
The poverty statistics for married-couple families in Hocking County show that 5.7% or 336 of the total 5,885 families live below the poverty line. Families with 3 or 4 children have the highest poverty rate of 19.1%, comprising of 98 families. On the other hand, families with 5 or more children have the lowest poverty rate of 0.0%, which includes 0 families.
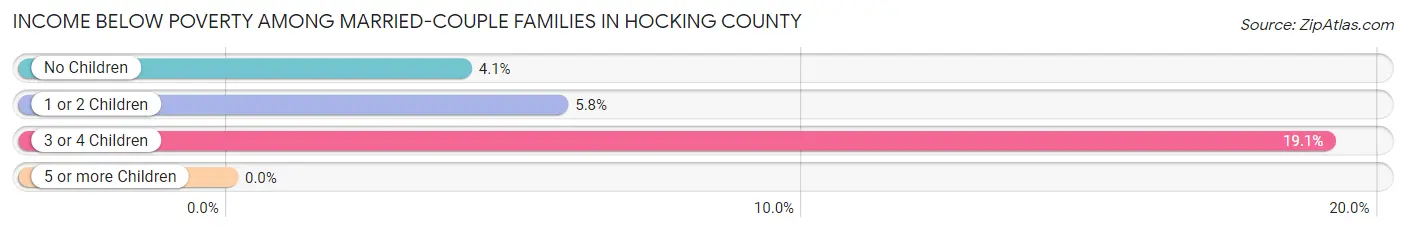
| Children | Above Poverty | Below Poverty |
| No Children | 3,863 (95.9%) | 164 (4.1%) |
| 1 or 2 Children | 1,214 (94.3%) | 74 (5.8%) |
| 3 or 4 Children | 415 (80.9%) | 98 (19.1%) |
| 5 or more Children | 57 (100.0%) | 0 (0.0%) |
| Total | 5,549 (94.3%) | 336 (5.7%) |
Income Below Poverty Among Single-Parent Households in Hocking County
According to the poverty data in Hocking County, 11.0% or 108 single-father households and 29.3% or 388 single-mother households are living below the poverty line. Among single-father households, those with 5 or more children have the highest poverty rate, with 15 households (100.0%) experiencing poverty. Likewise, among single-mother households, those with 3 or 4 children have the highest poverty rate, with 177 households (65.1%) falling below the poverty line.
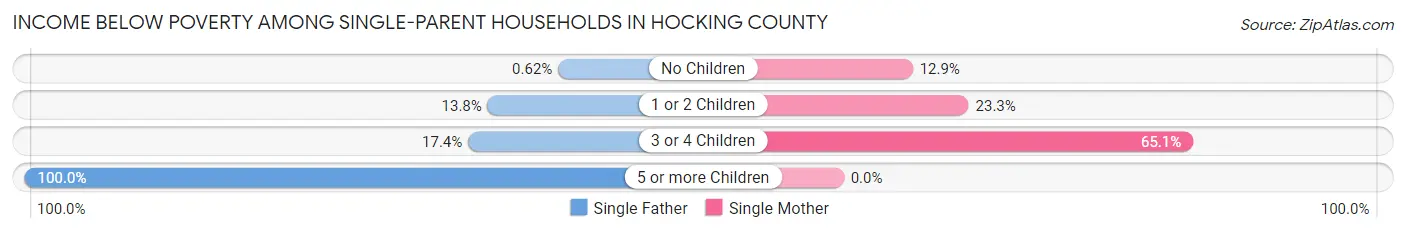
| Children | Single Father | Single Mother |
| No Children | 2 (0.6%) | 40 (12.9%) |
| 1 or 2 Children | 79 (13.8%) | 171 (23.3%) |
| 3 or 4 Children | 12 (17.4%) | 177 (65.1%) |
| 5 or more Children | 15 (100.0%) | 0 (0.0%) |
| Total | 108 (11.0%) | 388 (29.3%) |
Income Below Poverty Among Married-Couple vs Single-Parent Households in Hocking County
The poverty data for Hocking County shows that 336 of the married-couple family households (5.7%) and 496 of the single-parent households (21.5%) are living below the poverty level. Within the married-couple family households, those with 3 or 4 children have the highest poverty rate, with 98 households (19.1%) falling below the poverty line. Among the single-parent households, those with 5 or more children have the highest poverty rate, with 15 household (65.2%) living below poverty.
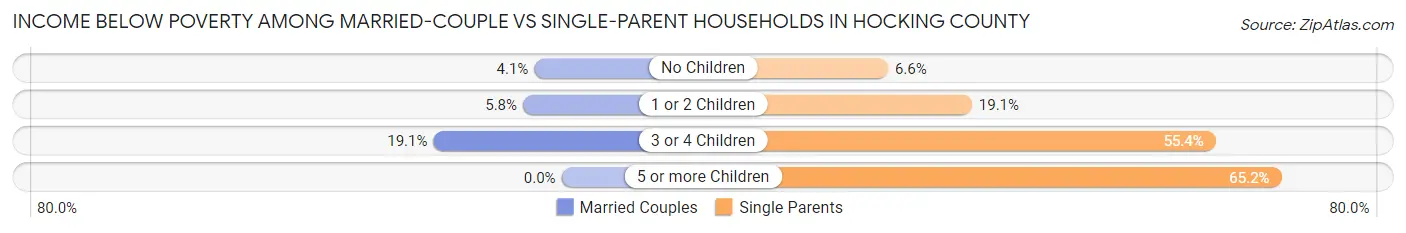
| Children | Married-Couple Families | Single-Parent Households |
| No Children | 164 (4.1%) | 42 (6.6%) |
| 1 or 2 Children | 74 (5.8%) | 250 (19.1%) |
| 3 or 4 Children | 98 (19.1%) | 189 (55.4%) |
| 5 or more Children | 0 (0.0%) | 15 (65.2%) |
| Total | 336 (5.7%) | 496 (21.5%) |
Employment Characteristics in Hocking County
Employment by Class of Employer in Hocking County
Among the 12,424 employed individuals in Hocking County, private company employees (8,731 | 70.3%), local government employees (1,227 | 9.9%), and not-for-profit organizations (778 | 6.3%) make up the most common classes of employment.
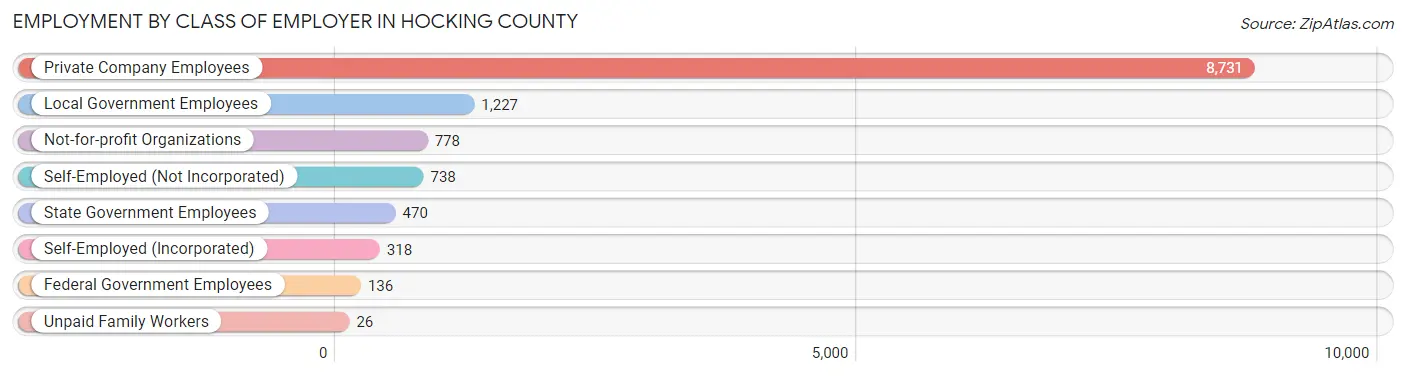
| Employer Class | # Employees | % Employees |
| Private Company Employees | 8,731 | 70.3% |
| Self-Employed (Incorporated) | 318 | 2.6% |
| Self-Employed (Not Incorporated) | 738 | 5.9% |
| Not-for-profit Organizations | 778 | 6.3% |
| Local Government Employees | 1,227 | 9.9% |
| State Government Employees | 470 | 3.8% |
| Federal Government Employees | 136 | 1.1% |
| Unpaid Family Workers | 26 | 0.2% |
| Total | 12,424 | 100.0% |
Employment Status by Age in Hocking County
According to the labor force statistics for Hocking County, out of the total population over 16 years of age (22,710), 58.7% or 13,331 individuals are in the labor force, with 4.7% or 627 of them unemployed. The age group with the highest labor force participation rate is 20 to 24 years, with 84.1% or 1,291 individuals in the labor force. Within the labor force, the 65 to 74 years age range has the highest percentage of unemployed individuals, with 11.2% or 70 of them being unemployed.

| Age Bracket | In Labor Force | Unemployed |
| 16 to 19 Years | 775 (60.1%) | 33 (4.3%) |
| 20 to 24 Years | 1,291 (84.1%) | 46 (3.6%) |
| 25 to 29 Years | 1,321 (82.5%) | 120 (9.1%) |
| 30 to 34 Years | 1,331 (82.9%) | 41 (3.1%) |
| 35 to 44 Years | 2,534 (78.0%) | 129 (5.1%) |
| 45 to 54 Years | 2,967 (79.6%) | 139 (4.7%) |
| 55 to 59 Years | 1,448 (65.2%) | 38 (2.6%) |
| 60 to 64 Years | 901 (42.8%) | 11 (1.2%) |
| 65 to 74 Years | 627 (19.5%) | 70 (11.2%) |
| 75 Years and over | 143 (6.6%) | 0 (0.0%) |
| Total | 13,331 (58.7%) | 627 (4.7%) |
Employment Status by Educational Attainment in Hocking County
According to labor force statistics for Hocking County, 72.4% of individuals (10,505) out of the total population between 25 and 64 years of age (14,510) are in the labor force, with 4.6% or 483 of them being unemployed. The group with the highest labor force participation rate are those with the educational attainment of college / associate degree, with 79.4% or 4,129 individuals in the labor force. Within the labor force, individuals with less than high school education have the highest percentage of unemployment, with 6.9% or 41 of them being unemployed.
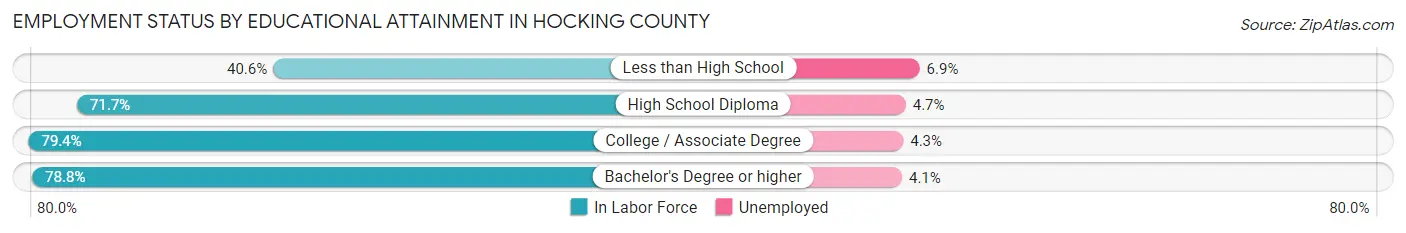
| Educational Attainment | In Labor Force | Unemployed |
| Less than High School | 598 (40.6%) | 102 (6.9%) |
| High School Diploma | 4,078 (71.7%) | 267 (4.7%) |
| College / Associate Degree | 4,129 (79.4%) | 224 (4.3%) |
| Bachelor's Degree or higher | 1,694 (78.8%) | 88 (4.1%) |
| Total | 10,505 (72.4%) | 667 (4.6%) |
Employment Occupations by Sex in Hocking County
Management, Business, Science and Arts Occupations
The most common Management, Business, Science and Arts occupations in Hocking County are Management (1,221 | 9.6%), Health Diagnosing & Treating (972 | 7.6%), Community & Social Service (830 | 6.5%), Health Technologists (574 | 4.5%), and Education Instruction & Library (485 | 3.8%).

Management, Business, Science and Arts Occupations by Sex
Within the Management, Business, Science and Arts occupations in Hocking County, the most male-oriented occupations are Architecture & Engineering (93.1%), Computers, Engineering & Science (80.0%), and Arts, Media & Entertainment (74.7%), while the most female-oriented occupations are Health Technologists (81.4%), Education, Arts & Media (77.1%), and Education Instruction & Library (77.1%).

| Occupation | Male | Female |
| Management | 640 (52.4%) | 581 (47.6%) |
| Business & Financial | 92 (43.4%) | 120 (56.6%) |
| Computers, Engineering & Science | 383 (80.0%) | 96 (20.0%) |
| Computers & Mathematics | 141 (70.9%) | 58 (29.1%) |
| Architecture & Engineering | 175 (93.1%) | 13 (6.9%) |
| Life, Physical & Social Science | 67 (72.8%) | 25 (27.2%) |
| Community & Social Service | 291 (35.1%) | 539 (64.9%) |
| Education, Arts & Media | 24 (22.9%) | 81 (77.1%) |
| Legal Services & Support | 41 (47.7%) | 45 (52.3%) |
| Education Instruction & Library | 111 (22.9%) | 374 (77.1%) |
| Arts, Media & Entertainment | 115 (74.7%) | 39 (25.3%) |
| Health Diagnosing & Treating | 242 (24.9%) | 730 (75.1%) |
| Health Technologists | 107 (18.6%) | 467 (81.4%) |
| Total (Category) | 1,648 (44.4%) | 2,066 (55.6%) |
| Total (Overall) | 6,945 (54.7%) | 5,753 (45.3%) |
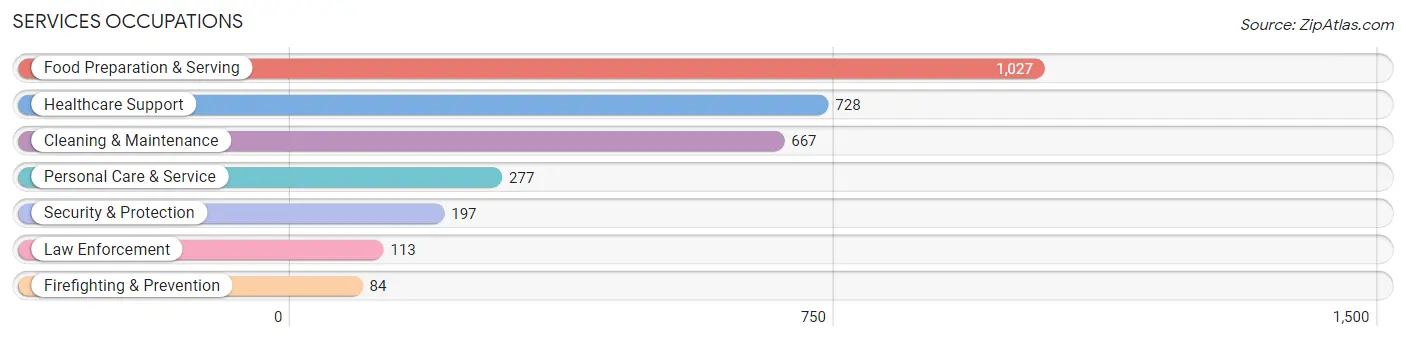
Services Occupations
The most common Services occupations in Hocking County are Food Preparation & Serving (1,027 | 8.1%), Healthcare Support (728 | 5.7%), Cleaning & Maintenance (667 | 5.2%), Personal Care & Service (277 | 2.2%), and Security & Protection (197 | 1.5%).
Services Occupations by Sex
Within the Services occupations in Hocking County, the most male-oriented occupations are Law Enforcement (100.0%), Security & Protection (84.3%), and Firefighting & Prevention (63.1%), while the most female-oriented occupations are Personal Care & Service (71.1%), Food Preparation & Serving (59.1%), and Healthcare Support (51.0%).
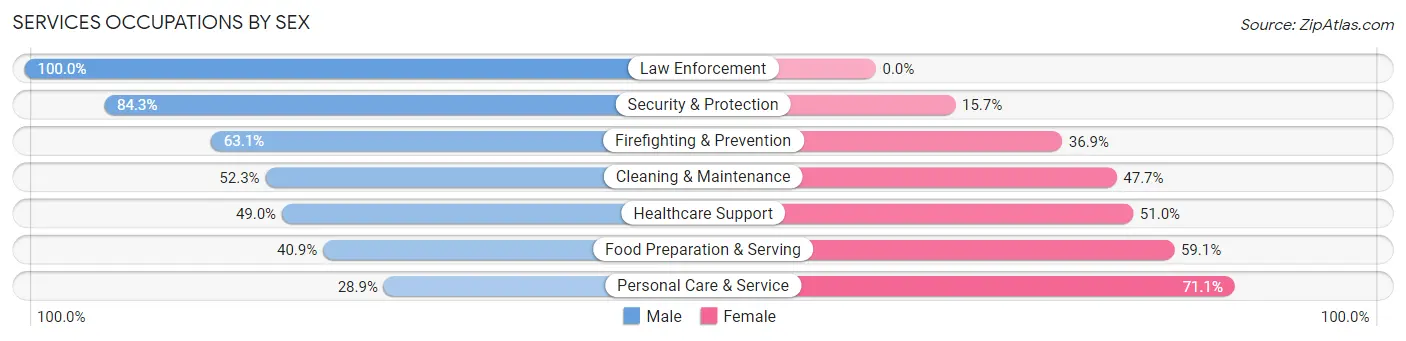
| Occupation | Male | Female |
| Healthcare Support | 357 (49.0%) | 371 (51.0%) |
| Security & Protection | 166 (84.3%) | 31 (15.7%) |
| Firefighting & Prevention | 53 (63.1%) | 31 (36.9%) |
| Law Enforcement | 113 (100.0%) | 0 (0.0%) |
| Food Preparation & Serving | 420 (40.9%) | 607 (59.1%) |
| Cleaning & Maintenance | 349 (52.3%) | 318 (47.7%) |
| Personal Care & Service | 80 (28.9%) | 197 (71.1%) |
| Total (Category) | 1,372 (47.4%) | 1,524 (52.6%) |
| Total (Overall) | 6,945 (54.7%) | 5,753 (45.3%) |
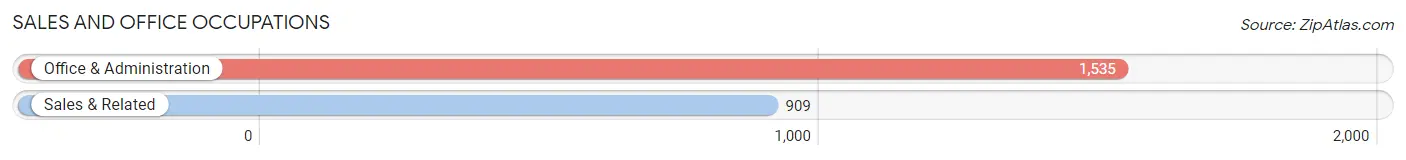
Sales and Office Occupations
The most common Sales and Office occupations in Hocking County are Office & Administration (1,535 | 12.1%), and Sales & Related (909 | 7.2%).
Sales and Office Occupations by Sex
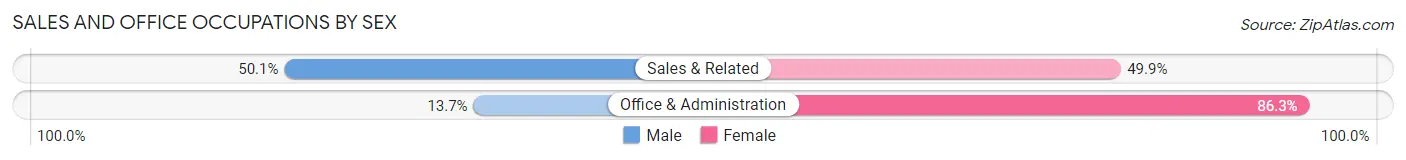
| Occupation | Male | Female |
| Sales & Related | 455 (50.1%) | 454 (49.9%) |
| Office & Administration | 210 (13.7%) | 1,325 (86.3%) |
| Total (Category) | 665 (27.2%) | 1,779 (72.8%) |
| Total (Overall) | 6,945 (54.7%) | 5,753 (45.3%) |
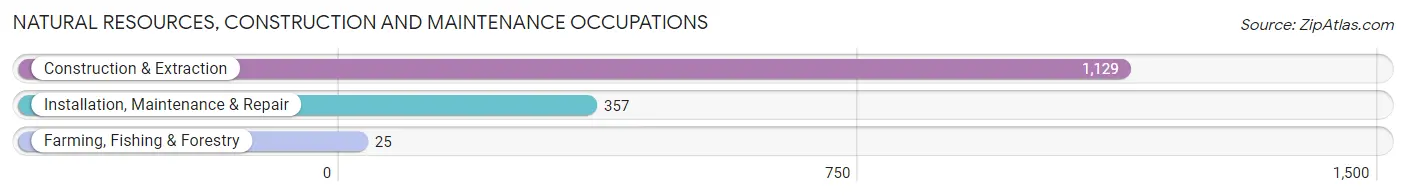
Natural Resources, Construction and Maintenance Occupations
The most common Natural Resources, Construction and Maintenance occupations in Hocking County are Construction & Extraction (1,129 | 8.9%), Installation, Maintenance & Repair (357 | 2.8%), and Farming, Fishing & Forestry (25 | 0.2%).
Natural Resources, Construction and Maintenance Occupations by Sex
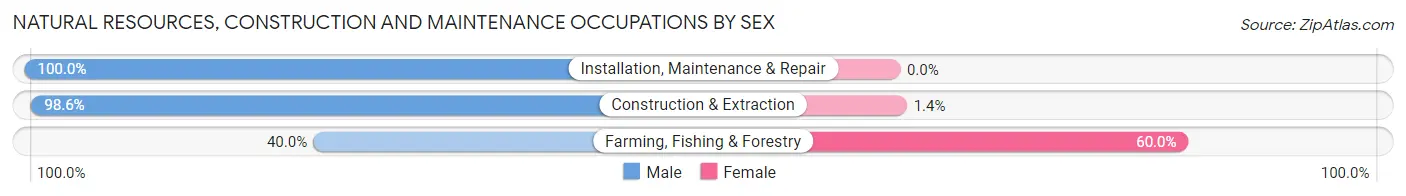
| Occupation | Male | Female |
| Farming, Fishing & Forestry | 10 (40.0%) | 15 (60.0%) |
| Construction & Extraction | 1,113 (98.6%) | 16 (1.4%) |
| Installation, Maintenance & Repair | 357 (100.0%) | 0 (0.0%) |
| Total (Category) | 1,480 (98.0%) | 31 (2.1%) |
| Total (Overall) | 6,945 (54.7%) | 5,753 (45.3%) |
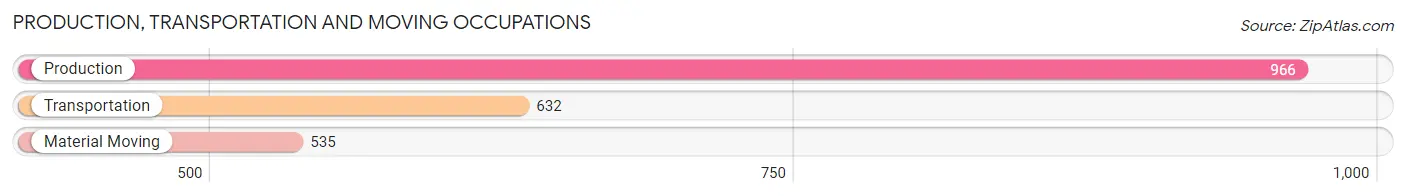
Production, Transportation and Moving Occupations
The most common Production, Transportation and Moving occupations in Hocking County are Production (966 | 7.6%), Transportation (632 | 5.0%), and Material Moving (535 | 4.2%).
Production, Transportation and Moving Occupations by Sex
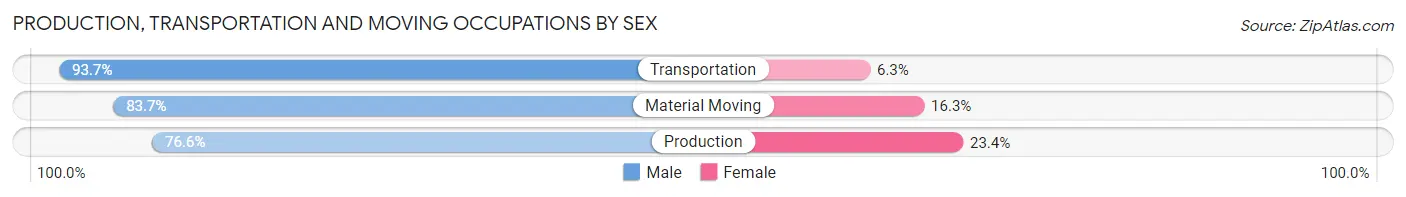
| Occupation | Male | Female |
| Production | 740 (76.6%) | 226 (23.4%) |
| Transportation | 592 (93.7%) | 40 (6.3%) |
| Material Moving | 448 (83.7%) | 87 (16.3%) |
| Total (Category) | 1,780 (83.5%) | 353 (16.6%) |
| Total (Overall) | 6,945 (54.7%) | 5,753 (45.3%) |
Employment Industries by Sex in Hocking County
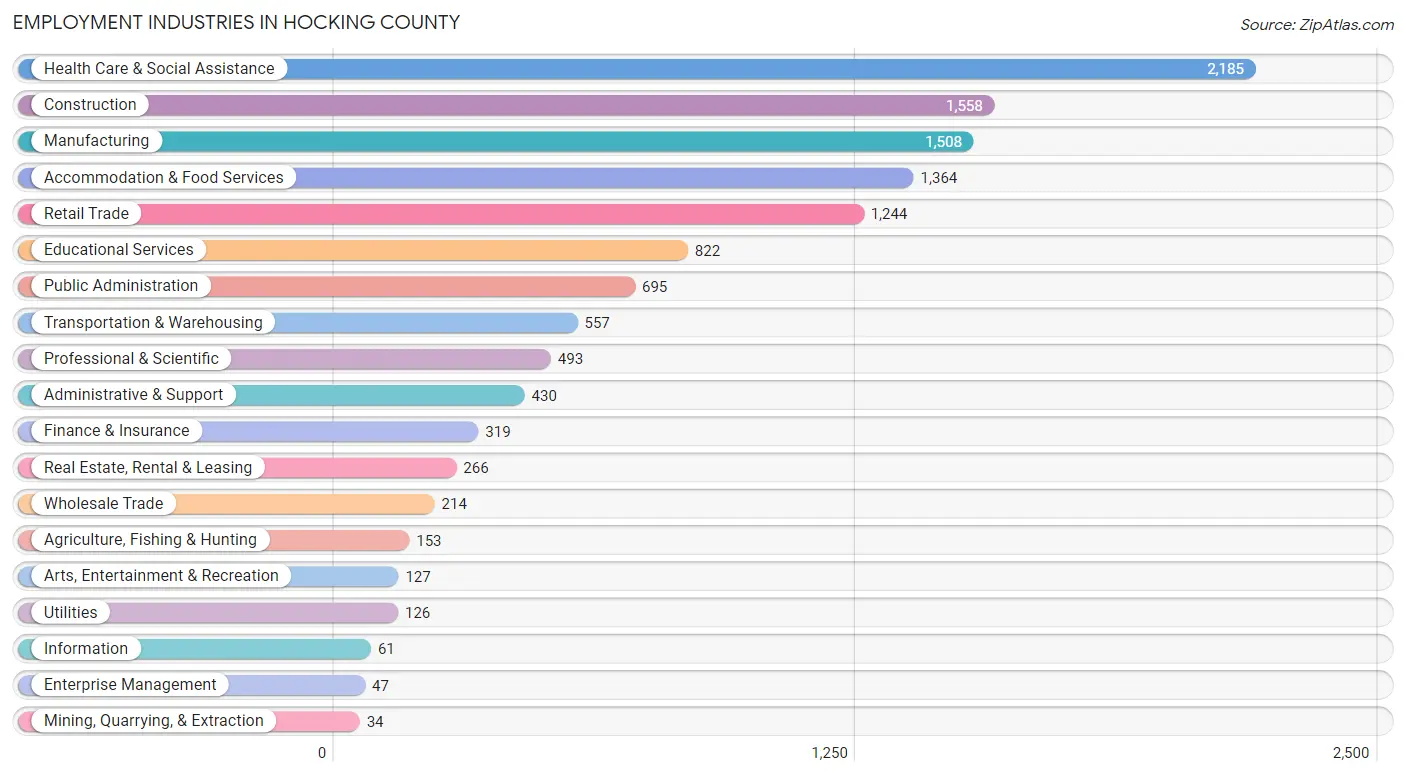
Employment Industries in Hocking County
The major employment industries in Hocking County include Health Care & Social Assistance (2,185 | 17.2%), Construction (1,558 | 12.3%), Manufacturing (1,508 | 11.9%), Accommodation & Food Services (1,364 | 10.7%), and Retail Trade (1,244 | 9.8%).
Employment Industries by Sex in Hocking County
The Hocking County industries that see more men than women are Enterprise Management (100.0%), Construction (97.6%), and Utilities (82.5%), whereas the industries that tend to have a higher number of women are Finance & Insurance (86.2%), Arts, Entertainment & Recreation (76.4%), and Health Care & Social Assistance (70.7%).

| Industry | Male | Female |
| Agriculture, Fishing & Hunting | 92 (60.1%) | 61 (39.9%) |
| Mining, Quarrying, & Extraction | 23 (67.6%) | 11 (32.4%) |
| Construction | 1,520 (97.6%) | 38 (2.4%) |
| Manufacturing | 1,201 (79.6%) | 307 (20.4%) |
| Wholesale Trade | 164 (76.6%) | 50 (23.4%) |
| Retail Trade | 694 (55.8%) | 550 (44.2%) |
| Transportation & Warehousing | 410 (73.6%) | 147 (26.4%) |
| Utilities | 104 (82.5%) | 22 (17.5%) |
| Information | 32 (52.5%) | 29 (47.5%) |
| Finance & Insurance | 44 (13.8%) | 275 (86.2%) |
| Real Estate, Rental & Leasing | 169 (63.5%) | 97 (36.5%) |
| Professional & Scientific | 173 (35.1%) | 320 (64.9%) |
| Enterprise Management | 47 (100.0%) | 0 (0.0%) |
| Administrative & Support | 265 (61.6%) | 165 (38.4%) |
| Educational Services | 266 (32.4%) | 556 (67.6%) |
| Health Care & Social Assistance | 640 (29.3%) | 1,545 (70.7%) |
| Arts, Entertainment & Recreation | 30 (23.6%) | 97 (76.4%) |
| Accommodation & Food Services | 486 (35.6%) | 878 (64.4%) |
| Public Administration | 328 (47.2%) | 367 (52.8%) |
| Total | 6,945 (54.7%) | 5,753 (45.3%) |
Education in Hocking County
School Enrollment in Hocking County
The most common levels of schooling among the 5,615 students in Hocking County are middle school (1,571 | 28.0%), high school (1,444 | 25.7%), and elementary school (1,210 | 21.5%).
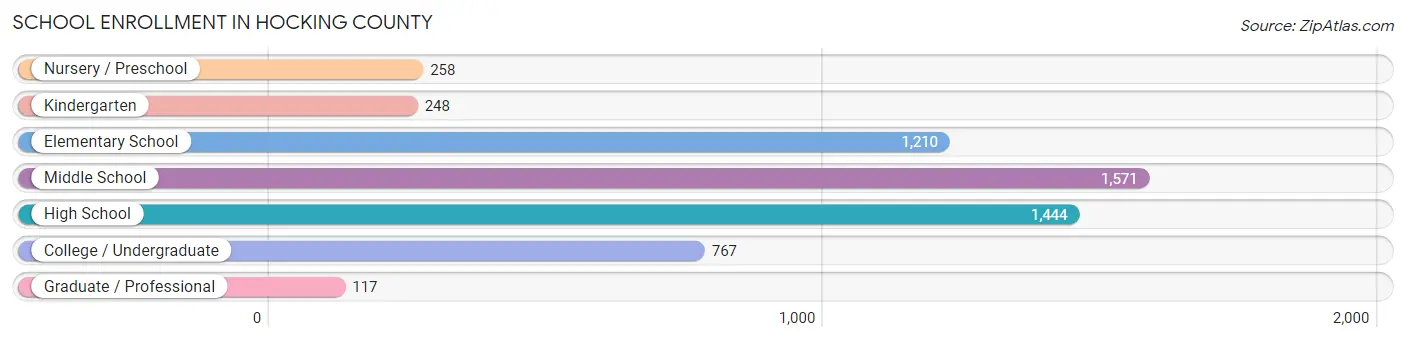
| School Level | # Students | % Students |
| Nursery / Preschool | 258 | 4.6% |
| Kindergarten | 248 | 4.4% |
| Elementary School | 1,210 | 21.5% |
| Middle School | 1,571 | 28.0% |
| High School | 1,444 | 25.7% |
| College / Undergraduate | 767 | 13.7% |
| Graduate / Professional | 117 | 2.1% |
| Total | 5,615 | 100.0% |
School Enrollment by Age by Funding Source in Hocking County
Out of a total of 5,615 students who are enrolled in schools in Hocking County, 567 (10.1%) attend a private institution, while the remaining 5,048 (89.9%) are enrolled in public schools. The age group of 35 years and over has the highest likelihood of being enrolled in private schools, with 84 (27.8% in the age bracket) enrolled. Conversely, the age group of 25 to 34 year olds has the lowest likelihood of being enrolled in a private school, with 165 (100.0% in the age bracket) attending a public institution.

| Age Bracket | Public School | Private School |
| 3 to 4 Year Olds | 169 (78.2%) | 47 (21.8%) |
| 5 to 9 Year Old | 1,185 (91.3%) | 113 (8.7%) |
| 10 to 14 Year Olds | 1,698 (88.7%) | 216 (11.3%) |
| 15 to 17 Year Olds | 1,076 (96.5%) | 39 (3.5%) |
| 18 to 19 Year Olds | 247 (97.6%) | 6 (2.4%) |
| 20 to 24 Year Olds | 292 (83.0%) | 60 (17.1%) |
| 25 to 34 Year Olds | 165 (100.0%) | 0 (0.0%) |
| 35 Years and over | 218 (72.2%) | 84 (27.8%) |
| Total | 5,048 (89.9%) | 567 (10.1%) |
Educational Attainment by Field of Study in Hocking County
Business (555 | 17.1%), education (540 | 16.6%), science & technology (532 | 16.4%), bio, nature & agricultural (260 | 8.0%), and communications (239 | 7.4%) are the most common fields of study among 3,248 individuals in Hocking County who have obtained a bachelor's degree or higher.
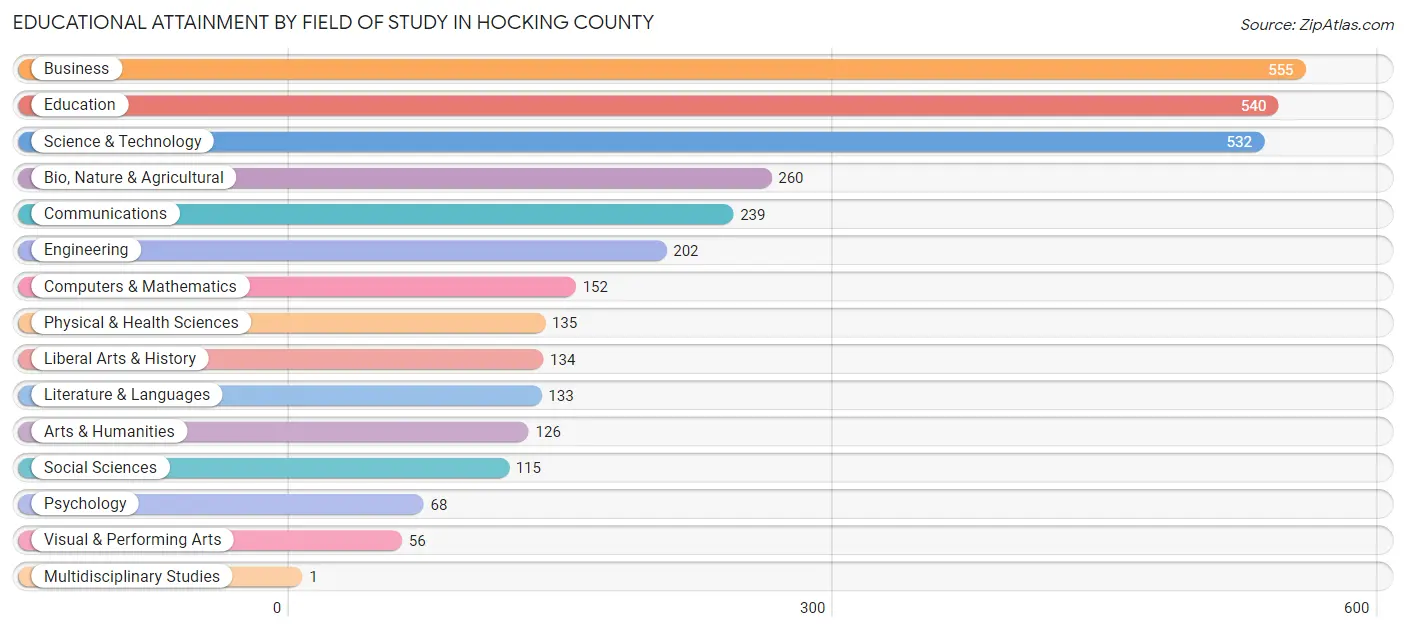
| Field of Study | # Graduates | % Graduates |
| Computers & Mathematics | 152 | 4.7% |
| Bio, Nature & Agricultural | 260 | 8.0% |
| Physical & Health Sciences | 135 | 4.2% |
| Psychology | 68 | 2.1% |
| Social Sciences | 115 | 3.5% |
| Engineering | 202 | 6.2% |
| Multidisciplinary Studies | 1 | 0.0% |
| Science & Technology | 532 | 16.4% |
| Business | 555 | 17.1% |
| Education | 540 | 16.6% |
| Literature & Languages | 133 | 4.1% |
| Liberal Arts & History | 134 | 4.1% |
| Visual & Performing Arts | 56 | 1.7% |
| Communications | 239 | 7.4% |
| Arts & Humanities | 126 | 3.9% |
| Total | 3,248 | 100.0% |
Transportation & Commute in Hocking County
Vehicle Availability by Sex in Hocking County
The most prevalent vehicle ownership categories in Hocking County are males with 2 vehicles (2,631, accounting for 38.5%) and females with 2 vehicles (2,103, making up 47.1%).
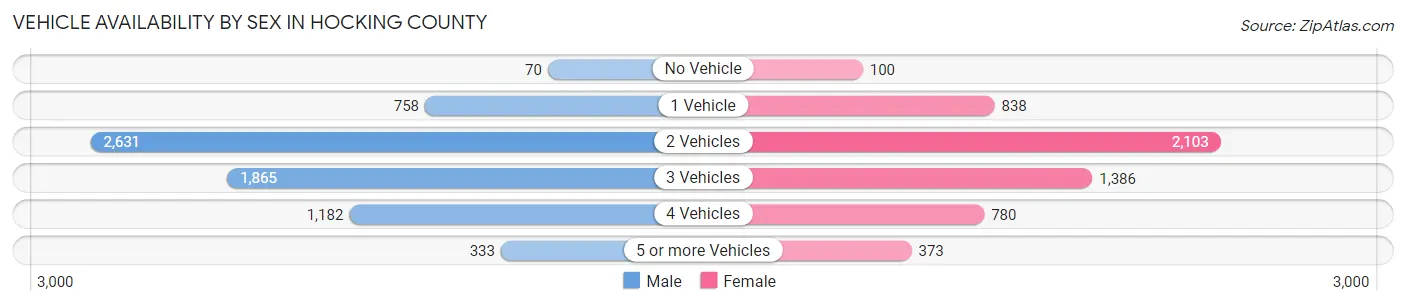
| Vehicles Available | Male | Female |
| No Vehicle | 70 (1.0%) | 100 (1.8%) |
| 1 Vehicle | 758 (11.1%) | 838 (15.0%) |
| 2 Vehicles | 2,631 (38.5%) | 2,103 (37.7%) |
| 3 Vehicles | 1,865 (27.3%) | 1,386 (24.8%) |
| 4 Vehicles | 1,182 (17.3%) | 780 (14.0%) |
| 5 or more Vehicles | 333 (4.9%) | 373 (6.7%) |
| Total | 6,839 (100.0%) | 5,580 (100.0%) |
Commute Time in Hocking County
The most frequently occuring commute durations in Hocking County are 60 to 89 minutes (1,700 commuters, 14.5%), 10 to 14 minutes (1,555 commuters, 13.3%), and 15 to 19 minutes (1,474 commuters, 12.6%).

| Commute Time | # Commuters | % Commuters |
| Less than 5 Minutes | 394 | 3.4% |
| 5 to 9 Minutes | 1,283 | 11.0% |
| 10 to 14 Minutes | 1,555 | 13.3% |
| 15 to 19 Minutes | 1,474 | 12.6% |
| 20 to 24 Minutes | 1,192 | 10.2% |
| 25 to 29 Minutes | 624 | 5.3% |
| 30 to 34 Minutes | 1,280 | 10.9% |
| 35 to 39 Minutes | 501 | 4.3% |
| 40 to 44 Minutes | 366 | 3.1% |
| 45 to 59 Minutes | 934 | 8.0% |
| 60 to 89 Minutes | 1,700 | 14.5% |
| 90 or more Minutes | 395 | 3.4% |
Commute Time by Sex in Hocking County
The most common commute times in Hocking County are 60 to 89 minutes (1,054 commuters, 16.6%) for males and 15 to 19 minutes (831 commuters, 15.5%) for females.

| Commute Time | Male | Female |
| Less than 5 Minutes | 169 (2.7%) | 225 (4.2%) |
| 5 to 9 Minutes | 578 (9.1%) | 705 (13.2%) |
| 10 to 14 Minutes | 850 (13.4%) | 705 (13.2%) |
| 15 to 19 Minutes | 643 (10.2%) | 831 (15.5%) |
| 20 to 24 Minutes | 569 (9.0%) | 623 (11.6%) |
| 25 to 29 Minutes | 302 (4.8%) | 322 (6.0%) |
| 30 to 34 Minutes | 731 (11.5%) | 549 (10.2%) |
| 35 to 39 Minutes | 243 (3.8%) | 258 (4.8%) |
| 40 to 44 Minutes | 180 (2.8%) | 186 (3.5%) |
| 45 to 59 Minutes | 670 (10.6%) | 264 (4.9%) |
| 60 to 89 Minutes | 1,054 (16.6%) | 646 (12.0%) |
| 90 or more Minutes | 348 (5.5%) | 47 (0.9%) |
Time of Departure to Work by Sex in Hocking County
The most frequent times of departure to work in Hocking County are 7:00 AM to 7:29 AM (930, 14.7%) for males and 7:00 AM to 7:29 AM (836, 15.6%) for females.
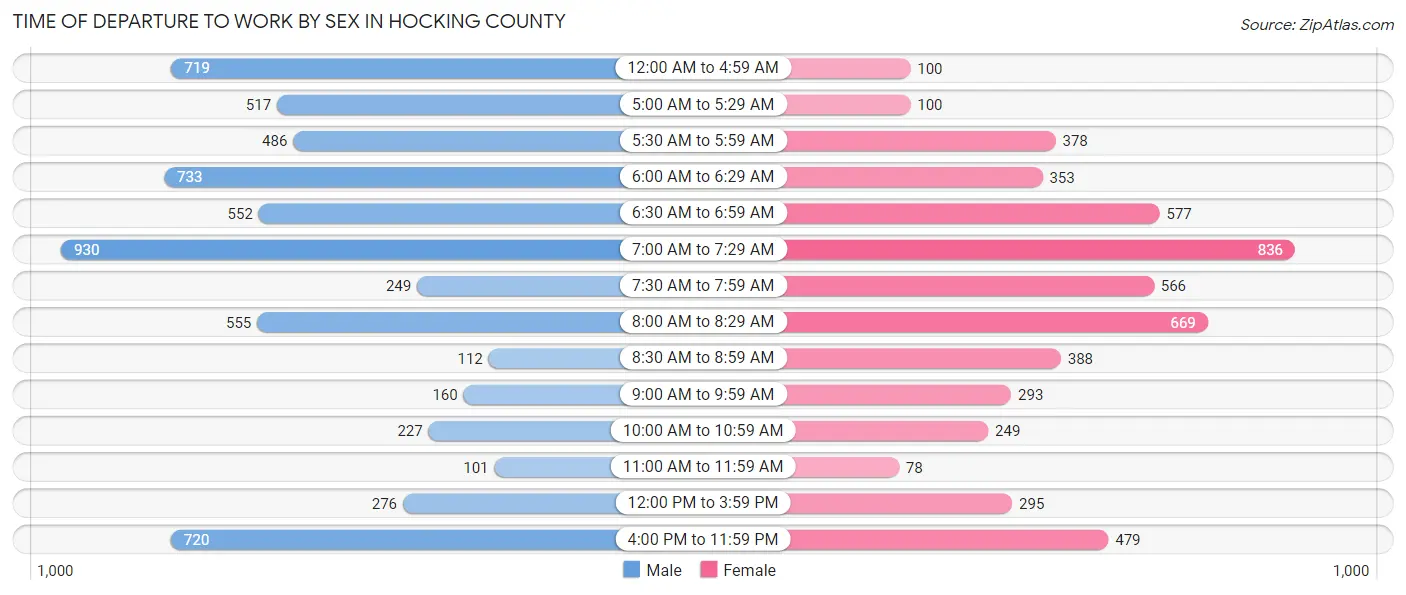
| Time of Departure | Male | Female |
| 12:00 AM to 4:59 AM | 719 (11.4%) | 100 (1.9%) |
| 5:00 AM to 5:29 AM | 517 (8.2%) | 100 (1.9%) |
| 5:30 AM to 5:59 AM | 486 (7.7%) | 378 (7.0%) |
| 6:00 AM to 6:29 AM | 733 (11.6%) | 353 (6.6%) |
| 6:30 AM to 6:59 AM | 552 (8.7%) | 577 (10.8%) |
| 7:00 AM to 7:29 AM | 930 (14.7%) | 836 (15.6%) |
| 7:30 AM to 7:59 AM | 249 (3.9%) | 566 (10.6%) |
| 8:00 AM to 8:29 AM | 555 (8.8%) | 669 (12.5%) |
| 8:30 AM to 8:59 AM | 112 (1.8%) | 388 (7.2%) |
| 9:00 AM to 9:59 AM | 160 (2.5%) | 293 (5.5%) |
| 10:00 AM to 10:59 AM | 227 (3.6%) | 249 (4.6%) |
| 11:00 AM to 11:59 AM | 101 (1.6%) | 78 (1.5%) |
| 12:00 PM to 3:59 PM | 276 (4.4%) | 295 (5.5%) |
| 4:00 PM to 11:59 PM | 720 (11.4%) | 479 (8.9%) |
| Total | 6,337 (100.0%) | 5,361 (100.0%) |
Housing Occupancy in Hocking County
Occupancy by Ownership in Hocking County
Of the total 11,279 dwellings in Hocking County, owner-occupied units account for 8,899 (78.9%), while renter-occupied units make up 2,380 (21.1%).
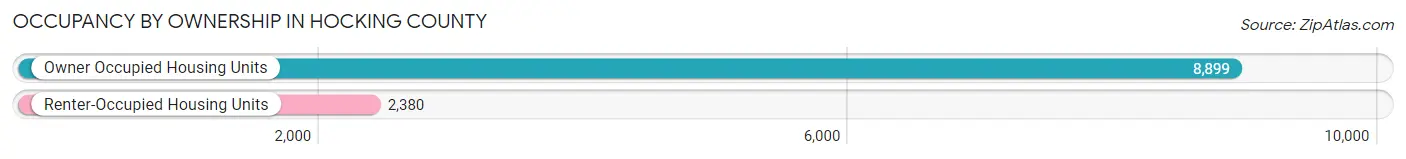
| Occupancy | # Housing Units | % Housing Units |
| Owner Occupied Housing Units | 8,899 | 78.9% |
| Renter-Occupied Housing Units | 2,380 | 21.1% |
| Total Occupied Housing Units | 11,279 | 100.0% |
Occupancy by Household Size in Hocking County
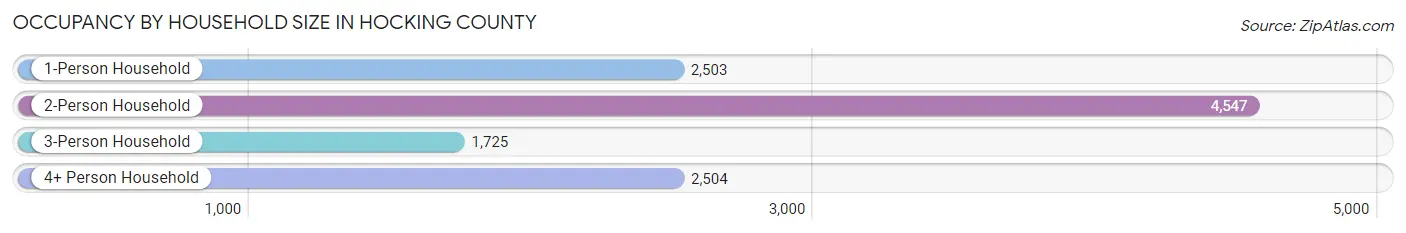
| Household Size | # Housing Units | % Housing Units |
| 1-Person Household | 2,503 | 22.2% |
| 2-Person Household | 4,547 | 40.3% |
| 3-Person Household | 1,725 | 15.3% |
| 4+ Person Household | 2,504 | 22.2% |
| Total Housing Units | 11,279 | 100.0% |
Occupancy by Ownership by Household Size in Hocking County
| Household Size | Owner-occupied | Renter-occupied |
| 1-Person Household | 1,629 (65.1%) | 874 (34.9%) |
| 2-Person Household | 4,122 (90.6%) | 425 (9.3%) |
| 3-Person Household | 1,382 (80.1%) | 343 (19.9%) |
| 4+ Person Household | 1,766 (70.5%) | 738 (29.5%) |
| Total Housing Units | 8,899 (78.9%) | 2,380 (21.1%) |
Occupancy by Educational Attainment in Hocking County
| Household Size | Owner-occupied | Renter-occupied |
| Less than High School | 773 (67.2%) | 378 (32.8%) |
| High School Diploma | 3,405 (75.1%) | 1,126 (24.8%) |
| College/Associate Degree | 2,989 (80.6%) | 718 (19.4%) |
| Bachelor's Degree or higher | 1,732 (91.6%) | 158 (8.4%) |
Occupancy by Age of Householder in Hocking County
| Age Bracket | # Households | % Households |
| Under 35 Years | 1,742 | 15.4% |
| 35 to 44 Years | 1,723 | 15.3% |
| 45 to 54 Years | 1,958 | 17.4% |
| 55 to 64 Years | 2,387 | 21.2% |
| 65 to 74 Years | 2,066 | 18.3% |
| 75 to 84 Years | 1,093 | 9.7% |
| 85 Years and Over | 310 | 2.8% |
| Total | 11,279 | 100.0% |
Housing Finances in Hocking County
Median Income by Occupancy in Hocking County
| Occupancy Type | # Households | Median Income |
| Owner-Occupied | 8,899 (78.9%) | $74,146 |
| Renter-Occupied | 2,380 (21.1%) | $28,565 |
| Average | 11,279 (100.0%) | $59,007 |
Occupancy by Householder Income Bracket in Hocking County
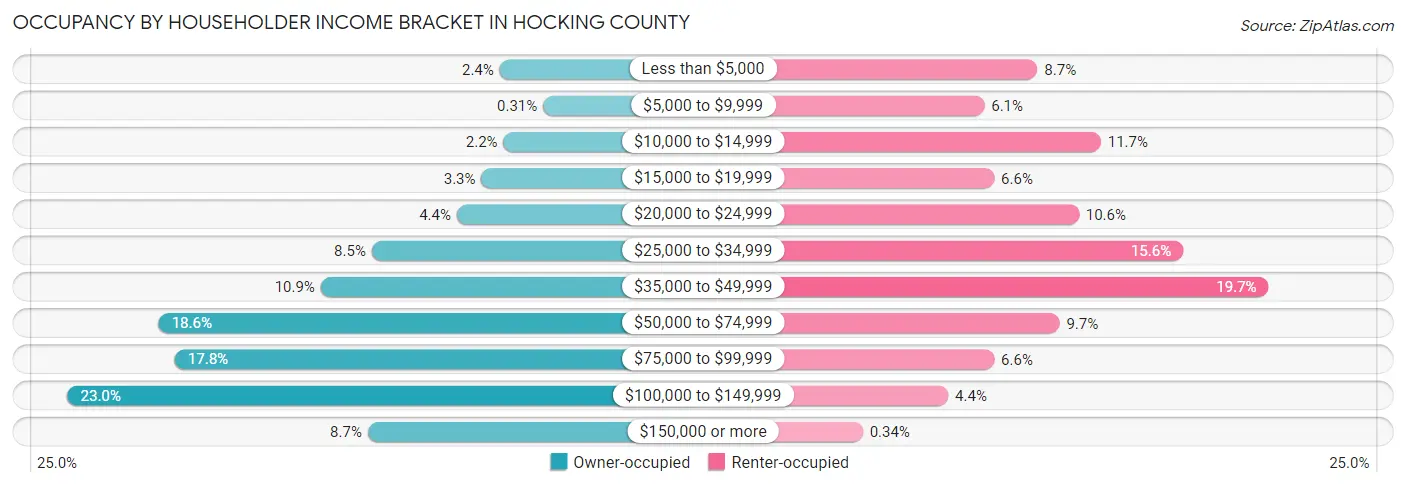
| Income Bracket | Owner-occupied | Renter-occupied |
| Less than $5,000 | 212 (2.4%) | 206 (8.7%) |
| $5,000 to $9,999 | 28 (0.3%) | 146 (6.1%) |
| $10,000 to $14,999 | 196 (2.2%) | 278 (11.7%) |
| $15,000 to $19,999 | 289 (3.3%) | 157 (6.6%) |
| $20,000 to $24,999 | 393 (4.4%) | 253 (10.6%) |
| $25,000 to $34,999 | 754 (8.5%) | 371 (15.6%) |
| $35,000 to $49,999 | 970 (10.9%) | 468 (19.7%) |
| $50,000 to $74,999 | 1,656 (18.6%) | 231 (9.7%) |
| $75,000 to $99,999 | 1,588 (17.8%) | 157 (6.6%) |
| $100,000 to $149,999 | 2,042 (23.0%) | 105 (4.4%) |
| $150,000 or more | 771 (8.7%) | 8 (0.3%) |
| Total | 8,899 (100.0%) | 2,380 (100.0%) |
Monthly Housing Cost Tiers in Hocking County
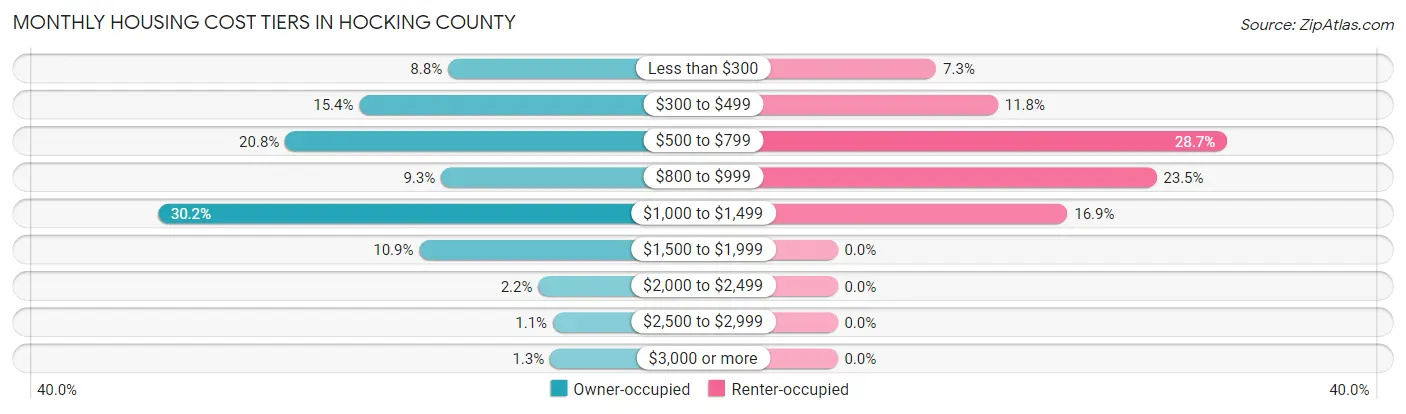
| Monthly Cost | Owner-occupied | Renter-occupied |
| Less than $300 | 785 (8.8%) | 173 (7.3%) |
| $300 to $499 | 1,366 (15.3%) | 281 (11.8%) |
| $500 to $799 | 1,852 (20.8%) | 683 (28.7%) |
| $800 to $999 | 830 (9.3%) | 559 (23.5%) |
| $1,000 to $1,499 | 2,687 (30.2%) | 403 (16.9%) |
| $1,500 to $1,999 | 973 (10.9%) | 0 (0.0%) |
| $2,000 to $2,499 | 193 (2.2%) | 0 (0.0%) |
| $2,500 to $2,999 | 97 (1.1%) | 0 (0.0%) |
| $3,000 or more | 116 (1.3%) | 0 (0.0%) |
| Total | 8,899 (100.0%) | 2,380 (100.0%) |
Physical Housing Characteristics in Hocking County
Housing Structures in Hocking County
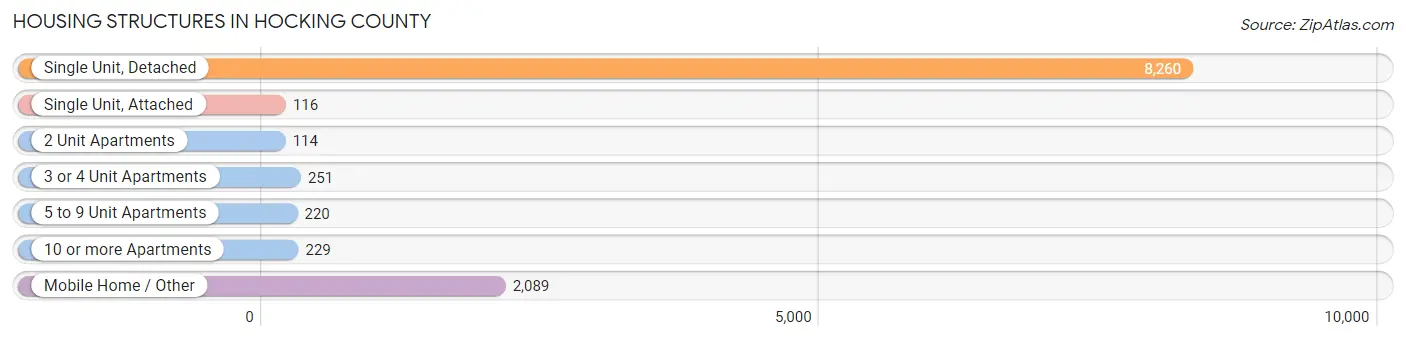
| Structure Type | # Housing Units | % Housing Units |
| Single Unit, Detached | 8,260 | 73.2% |
| Single Unit, Attached | 116 | 1.0% |
| 2 Unit Apartments | 114 | 1.0% |
| 3 or 4 Unit Apartments | 251 | 2.2% |
| 5 to 9 Unit Apartments | 220 | 1.9% |
| 10 or more Apartments | 229 | 2.0% |
| Mobile Home / Other | 2,089 | 18.5% |
| Total | 11,279 | 100.0% |
Housing Structures by Occupancy in Hocking County
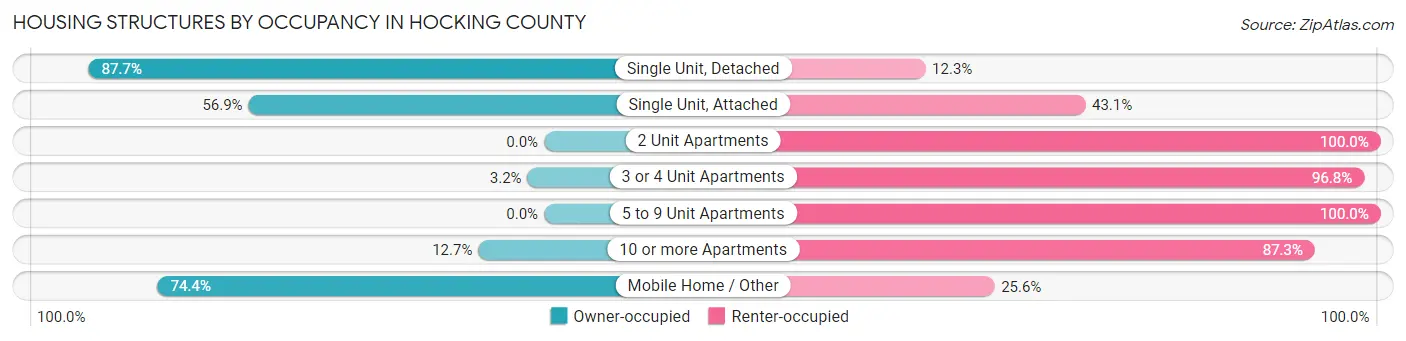
| Structure Type | Owner-occupied | Renter-occupied |
| Single Unit, Detached | 7,242 (87.7%) | 1,018 (12.3%) |
| Single Unit, Attached | 66 (56.9%) | 50 (43.1%) |
| 2 Unit Apartments | 0 (0.0%) | 114 (100.0%) |
| 3 or 4 Unit Apartments | 8 (3.2%) | 243 (96.8%) |
| 5 to 9 Unit Apartments | 0 (0.0%) | 220 (100.0%) |
| 10 or more Apartments | 29 (12.7%) | 200 (87.3%) |
| Mobile Home / Other | 1,554 (74.4%) | 535 (25.6%) |
| Total | 8,899 (78.9%) | 2,380 (21.1%) |
Housing Structures by Number of Rooms in Hocking County
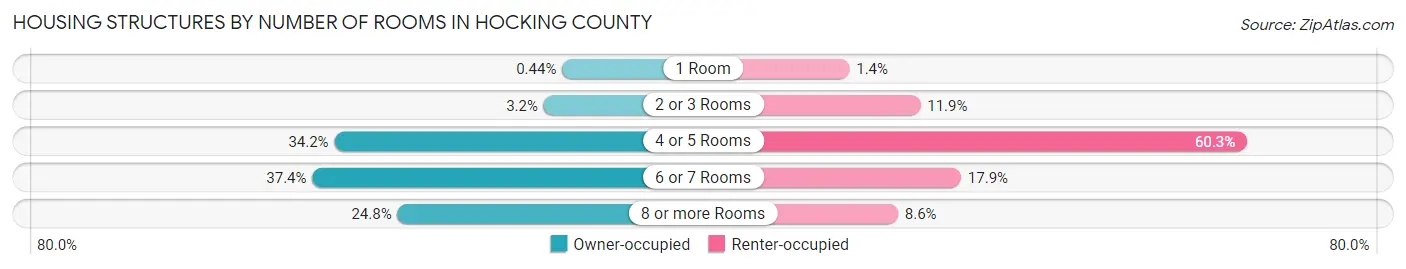
| Number of Rooms | Owner-occupied | Renter-occupied |
| 1 Room | 39 (0.4%) | 33 (1.4%) |
| 2 or 3 Rooms | 282 (3.2%) | 283 (11.9%) |
| 4 or 5 Rooms | 3,039 (34.2%) | 1,434 (60.3%) |
| 6 or 7 Rooms | 3,330 (37.4%) | 426 (17.9%) |
| 8 or more Rooms | 2,209 (24.8%) | 204 (8.6%) |
| Total | 8,899 (100.0%) | 2,380 (100.0%) |
Housing Structure by Heating Type in Hocking County
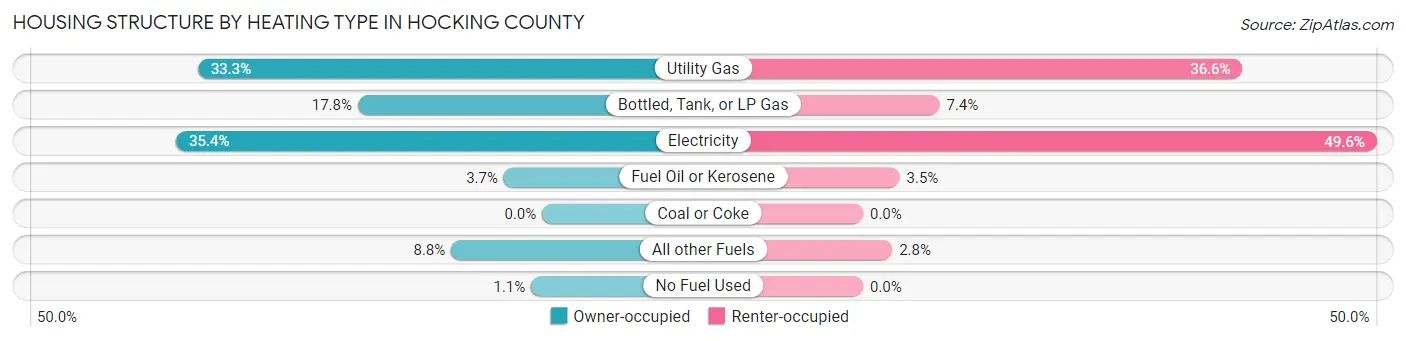
| Heating Type | Owner-occupied | Renter-occupied |
| Utility Gas | 2,961 (33.3%) | 872 (36.6%) |
| Bottled, Tank, or LP Gas | 1,585 (17.8%) | 176 (7.4%) |
| Electricity | 3,148 (35.4%) | 1,181 (49.6%) |
| Fuel Oil or Kerosene | 329 (3.7%) | 84 (3.5%) |
| Coal or Coke | 0 (0.0%) | 0 (0.0%) |
| All other Fuels | 782 (8.8%) | 67 (2.8%) |
| No Fuel Used | 94 (1.1%) | 0 (0.0%) |
| Total | 8,899 (100.0%) | 2,380 (100.0%) |
Household Vehicle Usage in Hocking County
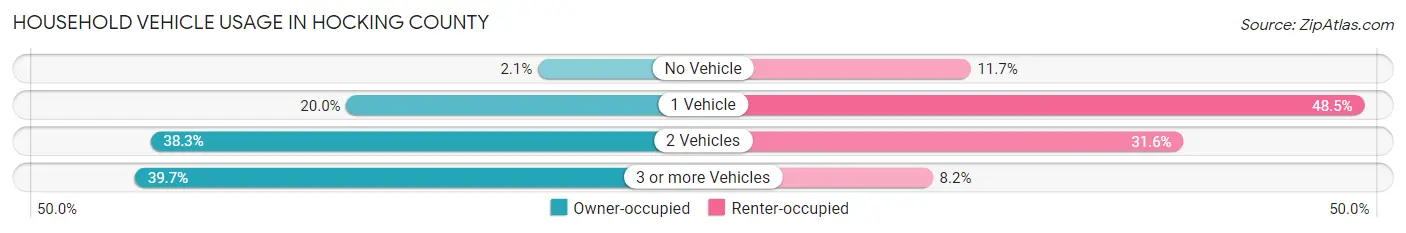
| Vehicles per Household | Owner-occupied | Renter-occupied |
| No Vehicle | 184 (2.1%) | 279 (11.7%) |
| 1 Vehicle | 1,776 (20.0%) | 1,154 (48.5%) |
| 2 Vehicles | 3,405 (38.3%) | 752 (31.6%) |
| 3 or more Vehicles | 3,534 (39.7%) | 195 (8.2%) |
| Total | 8,899 (100.0%) | 2,380 (100.0%) |
Real Estate & Mortgages in Hocking County
Real Estate and Mortgage Overview in Hocking County
| Characteristic | Without Mortgage | With Mortgage |
| Housing Units | 3,851 | 5,048 |
| Median Property Value | $136,000 | $175,600 |
| Median Household Income | $51,167 | $512 |
| Monthly Housing Costs | $483 | $116 |
| Real Estate Taxes | $1,446 | $165 |
Property Value by Mortgage Status in Hocking County
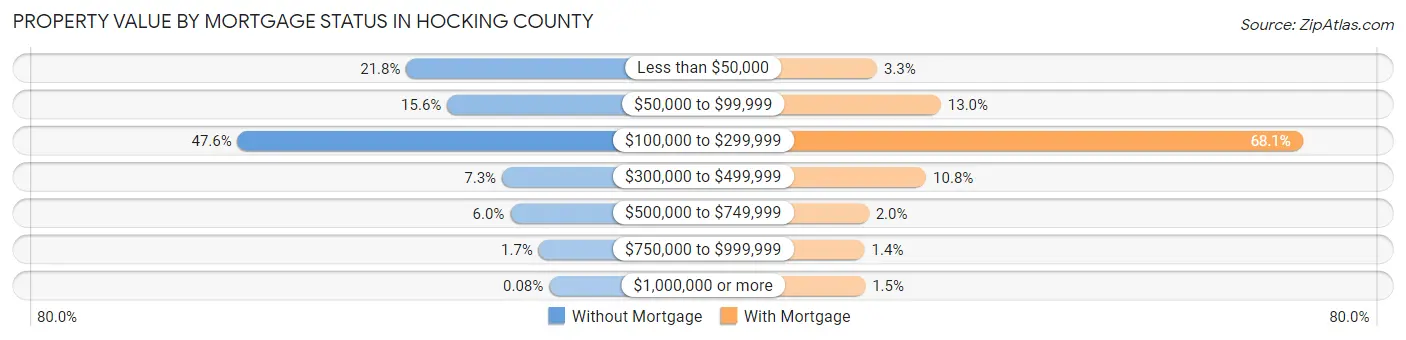
| Property Value | Without Mortgage | With Mortgage |
| Less than $50,000 | 841 (21.8%) | 165 (3.3%) |
| $50,000 to $99,999 | 601 (15.6%) | 656 (13.0%) |
| $100,000 to $299,999 | 1,831 (47.5%) | 3,439 (68.1%) |
| $300,000 to $499,999 | 280 (7.3%) | 543 (10.8%) |
| $500,000 to $749,999 | 231 (6.0%) | 101 (2.0%) |
| $750,000 to $999,999 | 64 (1.7%) | 70 (1.4%) |
| $1,000,000 or more | 3 (0.1%) | 74 (1.5%) |
| Total | 3,851 (100.0%) | 5,048 (100.0%) |
Household Income by Mortgage Status in Hocking County
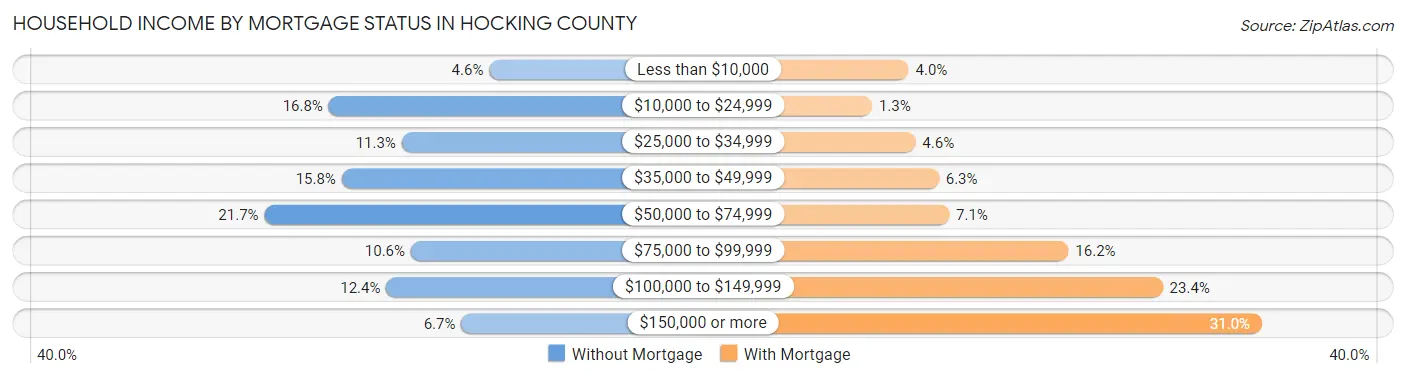
| Household Income | Without Mortgage | With Mortgage |
| Less than $10,000 | 177 (4.6%) | 204 (4.0%) |
| $10,000 to $24,999 | 648 (16.8%) | 63 (1.3%) |
| $25,000 to $34,999 | 434 (11.3%) | 230 (4.6%) |
| $35,000 to $49,999 | 610 (15.8%) | 320 (6.3%) |
| $50,000 to $74,999 | 837 (21.7%) | 360 (7.1%) |
| $75,000 to $99,999 | 407 (10.6%) | 819 (16.2%) |
| $100,000 to $149,999 | 479 (12.4%) | 1,181 (23.4%) |
| $150,000 or more | 259 (6.7%) | 1,563 (31.0%) |
| Total | 3,851 (100.0%) | 5,048 (100.0%) |
Property Value to Household Income Ratio in Hocking County
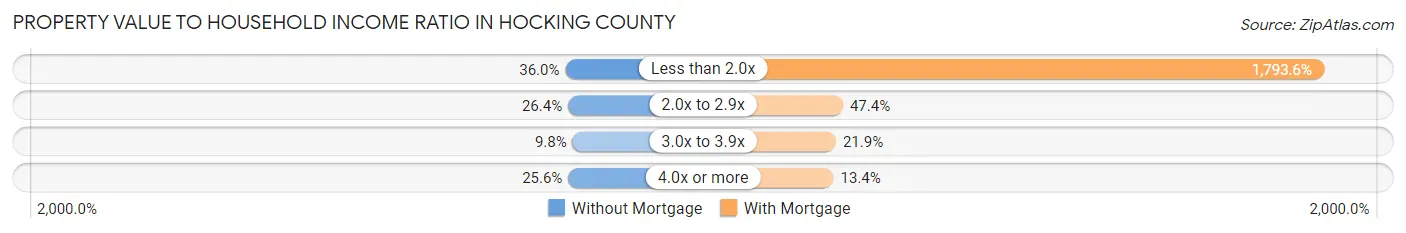
| Value-to-Income Ratio | Without Mortgage | With Mortgage |
| Less than 2.0x | 1,388 (36.0%) | 90,539 (1,793.6%) |
| 2.0x to 2.9x | 1,016 (26.4%) | 2,393 (47.4%) |
| 3.0x to 3.9x | 379 (9.8%) | 1,107 (21.9%) |
| 4.0x or more | 986 (25.6%) | 675 (13.4%) |
| Total | 3,851 (100.0%) | 5,048 (100.0%) |
Real Estate Taxes by Mortgage Status in Hocking County

| Property Taxes | Without Mortgage | With Mortgage |
| Less than $800 | 982 (25.5%) | 26 (0.5%) |
| $800 to $1,499 | 872 (22.6%) | 571 (11.3%) |
| $800 to $1,499 | 1,704 (44.3%) | 1,126 (22.3%) |
| Total | 3,851 (100.0%) | 5,048 (100.0%) |
Health & Disability in Hocking County
Health Insurance Coverage by Age in Hocking County
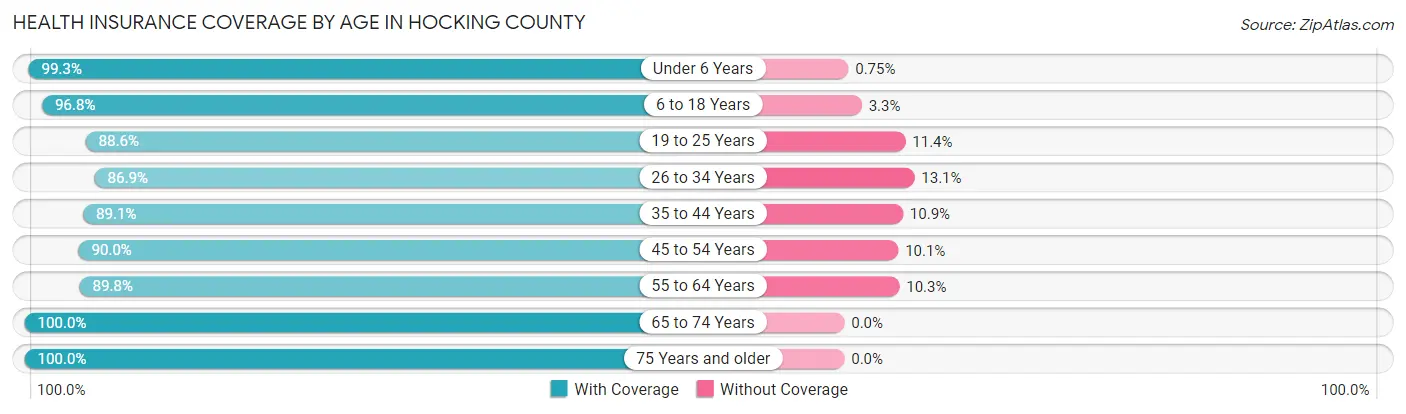
| Age Bracket | With Coverage | Without Coverage |
| Under 6 Years | 1,849 (99.3%) | 14 (0.7%) |
| 6 to 18 Years | 4,316 (96.8%) | 145 (3.3%) |
| 19 to 25 Years | 1,790 (88.6%) | 230 (11.4%) |
| 26 to 34 Years | 2,620 (86.9%) | 394 (13.1%) |
| 35 to 44 Years | 2,859 (89.1%) | 351 (10.9%) |
| 45 to 54 Years | 3,346 (89.9%) | 374 (10.1%) |
| 55 to 64 Years | 3,862 (89.7%) | 441 (10.2%) |
| 65 to 74 Years | 3,183 (100.0%) | 0 (0.0%) |
| 75 Years and older | 2,053 (100.0%) | 0 (0.0%) |
| Total | 25,878 (93.0%) | 1,949 (7.0%) |
Health Insurance Coverage by Citizenship Status in Hocking County
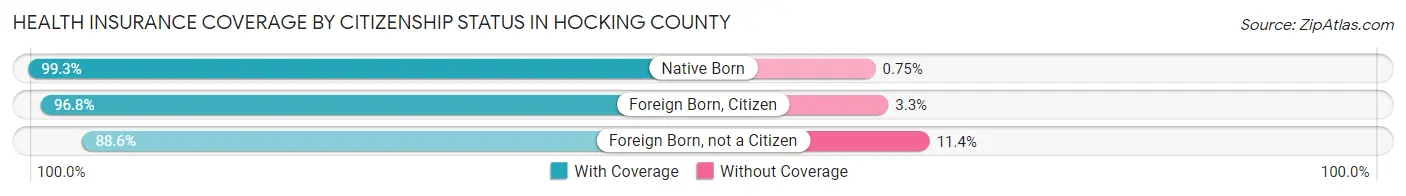
| Citizenship Status | With Coverage | Without Coverage |
| Native Born | 1,849 (99.3%) | 14 (0.7%) |
| Foreign Born, Citizen | 4,316 (96.8%) | 145 (3.3%) |
| Foreign Born, not a Citizen | 1,790 (88.6%) | 230 (11.4%) |
Health Insurance Coverage by Household Income in Hocking County

| Household Income | With Coverage | Without Coverage |
| Under $25,000 | 3,655 (88.2%) | 490 (11.8%) |
| $25,000 to $49,999 | 5,052 (90.3%) | 543 (9.7%) |
| $50,000 to $74,999 | 4,353 (94.9%) | 233 (5.1%) |
| $75,000 to $99,999 | 4,790 (96.1%) | 197 (4.0%) |
| $100,000 and over | 8,009 (94.7%) | 453 (5.3%) |
Public vs Private Health Insurance Coverage by Age in Hocking County

| Age Bracket | Public Insurance | Private Insurance |
| Under 6 | 876 (47.0%) | 1,040 (55.8%) |
| 6 to 18 Years | 2,397 (53.7%) | 2,349 (52.7%) |
| 19 to 25 Years | 697 (34.5%) | 1,215 (60.2%) |
| 25 to 34 Years | 906 (30.1%) | 1,864 (61.8%) |
| 35 to 44 Years | 922 (28.7%) | 1,996 (62.2%) |
| 45 to 54 Years | 950 (25.5%) | 2,526 (67.9%) |
| 55 to 64 Years | 1,443 (33.5%) | 2,748 (63.9%) |
| 65 to 74 Years | 3,146 (98.8%) | 1,565 (49.2%) |
| 75 Years and over | 2,025 (98.6%) | 1,268 (61.8%) |
| Total | 13,362 (48.0%) | 16,571 (59.6%) |
Disability Status by Sex by Age in Hocking County
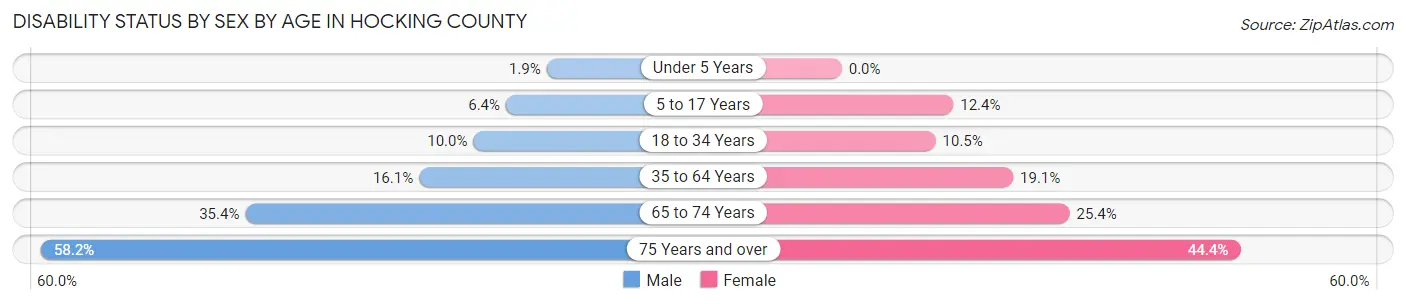
| Age Bracket | Male | Female |
| Under 5 Years | 15 (1.9%) | 0 (0.0%) |
| 5 to 17 Years | 149 (6.4%) | 276 (12.4%) |
| 18 to 34 Years | 276 (10.0%) | 264 (10.4%) |
| 35 to 64 Years | 903 (16.1%) | 1,072 (19.1%) |
| 65 to 74 Years | 551 (35.4%) | 413 (25.4%) |
| 75 Years and over | 544 (58.2%) | 496 (44.4%) |
Disability Class by Sex by Age in Hocking County
Disability Class: Hearing Difficulty
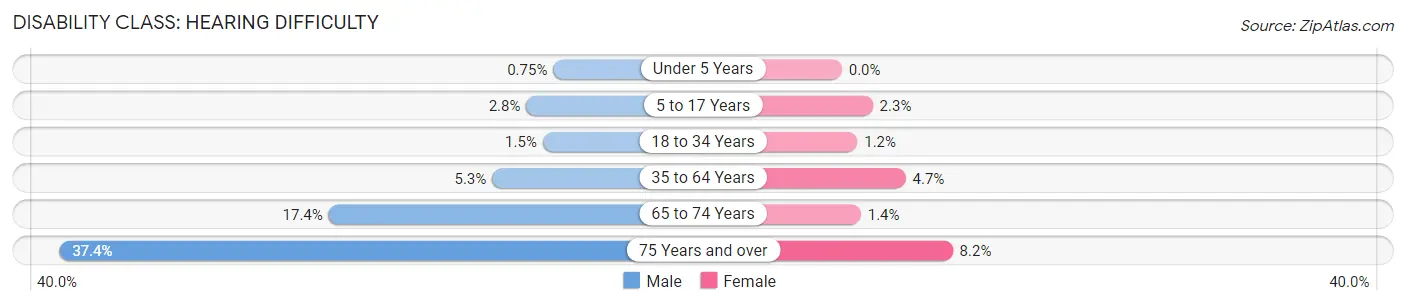
| Age Bracket | Male | Female |
| Under 5 Years | 6 (0.7%) | 0 (0.0%) |
| 5 to 17 Years | 64 (2.8%) | 51 (2.3%) |
| 18 to 34 Years | 42 (1.5%) | 29 (1.1%) |
| 35 to 64 Years | 297 (5.3%) | 266 (4.7%) |
| 65 to 74 Years | 271 (17.4%) | 23 (1.4%) |
| 75 Years and over | 350 (37.4%) | 92 (8.2%) |
Disability Class: Vision Difficulty
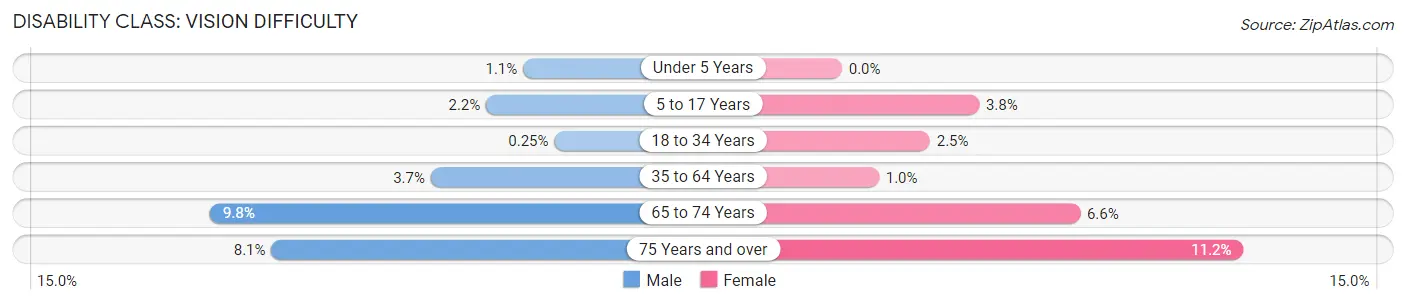
| Age Bracket | Male | Female |
| Under 5 Years | 9 (1.1%) | 0 (0.0%) |
| 5 to 17 Years | 50 (2.1%) | 85 (3.8%) |
| 18 to 34 Years | 7 (0.3%) | 62 (2.5%) |
| 35 to 64 Years | 207 (3.7%) | 58 (1.0%) |
| 65 to 74 Years | 153 (9.8%) | 108 (6.6%) |
| 75 Years and over | 76 (8.1%) | 125 (11.2%) |
Disability Class: Cognitive Difficulty

| Age Bracket | Male | Female |
| 5 to 17 Years | 149 (6.4%) | 178 (8.0%) |
| 18 to 34 Years | 214 (7.8%) | 179 (7.1%) |
| 35 to 64 Years | 463 (8.2%) | 490 (8.7%) |
| 65 to 74 Years | 206 (13.3%) | 30 (1.8%) |
| 75 Years and over | 208 (22.3%) | 203 (18.2%) |
Disability Class: Ambulatory Difficulty
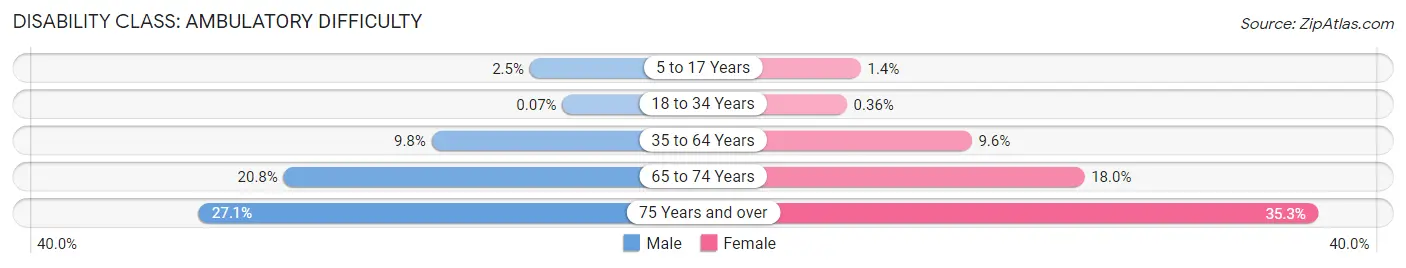
| Age Bracket | Male | Female |
| 5 to 17 Years | 58 (2.5%) | 31 (1.4%) |
| 18 to 34 Years | 2 (0.1%) | 9 (0.4%) |
| 35 to 64 Years | 549 (9.8%) | 541 (9.6%) |
| 65 to 74 Years | 323 (20.8%) | 293 (18.0%) |
| 75 Years and over | 253 (27.1%) | 395 (35.3%) |
Disability Class: Self-Care Difficulty

| Age Bracket | Male | Female |
| 5 to 17 Years | 28 (1.2%) | 31 (1.4%) |
| 18 to 34 Years | 9 (0.3%) | 7 (0.3%) |
| 35 to 64 Years | 74 (1.3%) | 104 (1.8%) |
| 65 to 74 Years | 175 (11.3%) | 79 (4.9%) |
| 75 Years and over | 120 (12.8%) | 136 (12.2%) |
Technology Access in Hocking County
Computing Device Access in Hocking County
| Device Type | # Households | % Households |
| Desktop or Laptop | 8,244 | 73.1% |
| Smartphone | 8,993 | 79.7% |
| Tablet | 6,233 | 55.3% |
| No Computing Device | 1,055 | 9.3% |
| Total | 11,279 | 100.0% |
Internet Access in Hocking County
| Internet Type | # Households | % Households |
| Dial-Up Internet | 49 | 0.4% |
| Broadband Home | 7,076 | 62.7% |
| Cellular Data Only | 1,308 | 11.6% |
| Satellite Internet | 1,112 | 9.9% |
| No Internet | 1,703 | 15.1% |
| Total | 11,279 | 100.0% |
Hocking County Summary
Hocking County is located in the southeastern part of the state of Ohio, and is part of the Appalachian region. It is bordered by Athens, Fairfield, Perry, and Vinton counties. The county seat is Logan, and the largest city is Nelsonville. The county was established in 1818 and named after the Hocking River, which runs through the county.
Geography
Hocking County covers an area of 545 square miles and is located in the Appalachian Plateau region of Ohio. The terrain is mostly hilly and forested, with some agricultural land in the valleys. The highest point in the county is at 1,717 feet above sea level, and the lowest point is at 860 feet. The Hocking River runs through the county, and there are several other smaller rivers and streams. The county is home to several state parks, including Hocking Hills State Park, Lake Logan State Park, and Tar Hollow State Park.
Demographics
As of the 2010 census, the population of Hocking County was 29,380. The population density was 54 people per square mile. The racial makeup of the county was 95.3% White, 1.7% African American, 0.3% Native American, 0.4% Asian, 0.1% Pacific Islander, 0.7% from other races, and 1.5% from two or more races. Hispanic or Latino of any race were 1.9% of the population.
The median income for a household in the county was $37,845, and the median income for a family was $45,945. The per capita income for the county was $18,845. About 15.2% of the population was below the poverty line.
Economy
Hocking County’s economy is largely based on agriculture and tourism. The county is home to several large farms, and the main crops grown are corn, soybeans, and hay. The county is also home to several wineries and breweries, as well as a number of small businesses. Tourism is a major industry in the county, with visitors coming to enjoy the natural beauty of the area, as well as the many outdoor activities available.
History
Hocking County was formed in 1818 from parts of Fairfield and Athens counties. The county was named after the Hocking River, which runs through the county. The first settlers arrived in the area in the late 1700s, and the county was officially organized in 1819. The county seat was established in Logan in 1820.
In the early 1800s, the county was largely agricultural, with the main crops being corn, wheat, and hay. The county also had several sawmills and gristmills. In the late 1800s, the county began to develop its coal mining industry, and by the early 1900s, coal mining was the main industry in the county. The coal industry declined in the mid-1900s, and the county’s economy shifted to tourism and agriculture.
Today, Hocking County is a popular tourist destination, with visitors coming to enjoy the natural beauty of the area, as well as the many outdoor activities available. The county is also home to several wineries and breweries, as well as a number of small businesses. Agriculture is still an important part of the county’s economy, with the main crops being corn, soybeans, and hay.
Common Questions
What is the Total Population of Hocking County?
Total Population of Hocking County is 28,104.
What is the Total Male Population of Hocking County?
Total Male Population of Hocking County is 14,191.
What is the Total Female Population of Hocking County?
Total Female Population of Hocking County is 13,913.
What is the Ratio of Males per 100 Females in Hocking County?
There are 102.00 Males per 100 Females in Hocking County.
What is the Ratio of Females per 100 Males in Hocking County?
There are 98.04 Females per 100 Males in Hocking County.
What is the Median Population Age in Hocking County?
Median Population Age in Hocking County is 42.6 Years.
What is the Average Family Size in Hocking County
Average Family Size in Hocking County is 2.8 People.
What is the Average Household Size in Hocking County
Average Household Size in Hocking County is 2.5 People.
What is Per Capita Income in Hocking County?
Per Capita income in Hocking County is $29,490.
What is the Median Family Income in Hocking County?
Median Family Income in Hocking County is $72,950.
What is the Median Household income in Hocking County?
Median Household Income in Hocking County is $59,007.
What is Income or Wage Gap in Hocking County?
Income or Wage Gap in Hocking County is 31.7%.
Women in Hocking County earn 68.3 cents for every dollar earned by a man.
What is Family Income Deficit in Hocking County?
Family Income Deficit in Hocking County is $12,347.
Families that are below poverty line in Hocking County earn $12,347 less on average than the poverty threshold level.
What is Inequality or Gini Index in Hocking County?
Inequality or Gini Index in Hocking County is 0.41.
How Large is the Labor Force in Hocking County?
There are 13,331 People in the Labor Forcein in Hocking County.
What is the Percentage of People in the Labor Force in Hocking County?
58.7% of People are in the Labor Force in Hocking County.
What is the Unemployment Rate in Hocking County?
Unemployment Rate in Hocking County is 4.7%.